Embed Size (px)
Citation preview

The effect of an upper-extremity activity on maximum acceptable weight of lift in a combined manualmaterials handling taskby Bheem Prakash Kattel
A thesis submitted in partial fulfillment of the requirements for the degree of Master of Science inIndustrial and Management EngineeringMontana State University© Copyright by Bheem Prakash Kattel (1994)
Abstract:Despite various efforts through research and studies to make manual materials handling tasks safer andless stressful, statistical data, on the cases of back injury and the amount of compensation paid, indicatethat manual materials handling is the leading cause of back injuries.
Biomechanical, physiological and psychophysical approaches have been used for the determination ofsafe loads for static and dynamic or repetitive tasks. The psychophysical approach requires individualsto adjust either the frequency of handling or the weight of load being handled according to theirperception of physical strain. In the actual industrial setup various combinations of manual materialshandling activities involving upper-extremity are encountered.
This study aimed at determining the effect of an upper-extremity. activity on Maximum AcceptableWeight of Lift (MAWOL) in a combined manual materials handling task by using psychophysicalapproach. ' A combined manual materials handling / task (lifting, carrying and shearing) often found inlabor intensive steel furniture manufacturing industries was chosen for the study. The task wassimulated using LIDO Workset under laboratory conditions. Eight college students served as humansubjects for the study. A metabolic measurement cart, a heart rate monitor, a frequency counter and ananthropometric measuring kit were other pieces of equipment used in the study to record variousphysiological and anthropometric data.
MAWOL was determined for each task using psychophysical approach and energy expenditure rateduring each experiment was estimated by using the increase in heart rate above resting heart rate value.
The results of the analysis of the data recorded during the study showed that MAWOL values fordifferent tasks were higher at . low frequency of handling than those at high frequency (14% lower for4/min than for 2/min for lifting, carrying and combined lifting and carrying;. 24% lower for combinedlifting, carrying and shearing). Mean heart rate was higher for higher frequency of handling than thatfor lower frequency.
The major conclusion reached from the result of analysis is that the upper-extremity activity understudy had no significant effect and hence, is not a limiting factor on maximum acceptable weight of lift.At this time there is no need to adjust MAWOL values for combined manual materials handling tasksinvolving upper-extremity.

I I I
THE EFFECT OF AN UPPER-EXTREMITY ACTIVITY ON MAXIMUM-
ACCEPTABLE WEIGHT OF LIFT IN A COMBINED
MANUAL MATERIALS HANDLING TASK
ByBheem Prakash Kattel
A thesis submitted in partial fulfillment of the requirements for the degree
Master of Science
in ' I
Industrial and Management Engineering
MONTANA STATE UNIVERSITY Bozeman, Montana
April 1994

K I?''* ii
APPROVAL
of a thesis submitted by
Bheem Prakash Kattel
This thesis has been read by each member of the thesis committee and has been found to be satisfactory regarding content, English usage, format, citations, bibliographic style, and consistency, and is ready for submission to theCollege of Graduate Studies.
Approved for the Major D;
Head, Major Departmen
Approved for the College of Graduate Studies
Date Graduate Dean

iii
STATEMENT OF PERMISSION TO USE
In presenting this thesis in partial fulfillment of the
requirements for a master's degree at Montana State
University, I agree that the Library shall make it available
to borrowers under rules of the Library.
If I have indicated my intention to copyright this thesis
by including a copyright notice page, copying is allowable
only for scholarly purposes, consistent with•"fair use" as
prescribed in the U.S. Copyright Law. Requests for permission
for extended quotation from or reproduction of this thesis in
whole or in parts may be granted only by the copyright holder.
Date
Signature

CHAPTER
iv
TABLE OF CONTENTS
Page1. INTRODUCTION............................................ ' I
2. LITERATURE REVIEW ............... 4
Overexertion Injury ................... 4Design Approaches to Solving MMH Problems . . . . 5
Epidemiological Approach: .................... 5Biomechanical Approach ...................... 5Physiological Approach ...................... -7Psychophysical Approach ...................... 8
Effectiveness of Various Approaches ............ 10Models Used for Different Approaches . . . . . . . 12
Biomechanical................................. 12Physiological.......... 14Psychophysical............. •.......... .. . . 15
Studies on M A W O L ..................... 18Studies on Combined Manual Materials Handling . . 24Heart Rate During Physical Activity ............ 29Factors Affecting Maximum Acceptable Weight of
L i f t ............. i....................... . 32Individual Factors: .......................... 32
A g e : ..................................... 32Gender . . ................................ 33Physique/anthropometric strength . . . . 33Training................................. 33
Task Factors ................................. 34F r e q u e n c y ........................ 34Container size and t y p e ............... 34Height and range of l i f t ............. . 35Handles ................... . . . . . . 36Location of Center of Gravity ......... 37Density of M a t e r i a l .................... 37S u b j e c t ................................. 37
Environmental Factors ......................... 37
3. RATIONALE AND OBJECTIVES............................ 40
4. METHODS AND P R O C E D U R E .............................. 43
Subjects . Equipment
4343

V
TABLE OF CONTENTS-Continued
Sensormedics Metabolic Cart ................. 43LIDO W o r k s e t ................................. 45Polar Vantage XL Heart Rate Monitor . . . . . . 47Anthropometric Measurement Kit 48Frequency Counter . . ......................... 48Familiarization P e r i o d ................. ■ i . 49Procedure . ................................. 49Psychophysical Measurement ................. 49
L i f t i n g .......................... . . . 50Carrying . .'............................ . 51
■ Combined Lifting and Carrying........... 51Simulated combined activities ......... 52
Physiological measurements ................. 54Experimental D e s i g n .............................. . 54
■ Hypotheses. Testing................... . 57
5. RESULTS AND DISCUSSION........ ".................... 59
Population Sample . . . . . . . . . . . . 59Diagnostics and Residual Analysis................. 62Analysis of Variance (ANOVA) ...................... 68Post Hoc Tests (Tukey's Test) ........ . . . . . 70
Post Hoc Test of Task on M A W O L ............. 7 0Post Hoc Test of Task on Steady-state HR. . . 72Post Hoc Test of Task on Estimated
Energy Expenditure . . . . . . . . . . . . . 73
Pearson Correlation (Pairwise) ................... 74Comparison of Results ............. 74
6. CONCLUSIONS AND RECOMMENDATIONS. . . . '.............. 7 6
Conclusions..................... •.............. 76Recommendations for Future Research........... 77
R E F E R E N C E S ..................................... . . . . 79
APPENDICES ........ ' ...................... 85
APPENDIX A PRELIMINARY FORMS . . . . . . . . . . 86
Subject Consent F o r m ........................ 87Instruction for Subjects...................... 89
APPENDIX B DATA COLLECTION FORMS. '. . '........... 90
Physiological Data of S u b j e c t s ............. 91MAWOL for Lifting Task........................ 92MAWOL for Carrying T a s k ............... 92

TABLE OF CONTENTS - Continued
MAWOL for Combined Lifting and Carrying . . . 93MAWOL for Combined Lifting,
Carrying and Shearing................. 93Heart Rate Measurement........................ 94Estimated Energy Expenditure for Tasks. . . . 95Primary Data Collection Form........... . . . 96
APPENDIX C RAW DATA .............’...............98
APPENDIX D GRAPHS . . . . . . . . . .......... 103'
vi

■ vii
LIST OF TABLES ..
Table Page
1 . Relationship between VariousMetabolic Measurements........................... 31
2. Protocol of Experiments................... 53
3. Randomization Table........ '................'. . . 54
4. Independent, Dependent, and Controlled Variables . 55.
5. Experimental Design Layout for MAWOL, MHR andEstimated Energy Expenditure . . . . . . ........... 56
6. Descriptive Statistics for Subject Population . . 60
7. Statistical Values of Anthropometric Values . . 61
8. Values of MAWOL for Subject Sample, Average U.S.
Industrial Workers and t-statistic . . . . . . . . 61
■ 9. Results of Diagnostics Test... 63
10. Descriptive Statistics of MAWOL (Kg) for DifferentTasks ............................................. 64
11. Descriptive Statistics for Steady-state Heart. Rate(Beats/min.) ................... ■..........64
12. Descriptive Statistics of Estimated MetabolicEnergy Expenditure -(Kcal/min. ) ............ 65
13. ANOVA Summary for M A W O L ..................... 68
14. ANOVA Summary for Steady-state HR (B/min.) . . . 69
15. ANOVA Summary for Estimated Energy Expenditure(Kcal/min.) ................... .. . ...............69
16. POST HOC Test of Task (Tukey's Test) on MAWOL . . 71
viii
LIST OF TABLES Continued
17. Tukey's Test of Task on Steady-state Heart Rate . 7218. Power Output Values (Kg-m/sec.) from LIDO ....... 7419. MAWOL Values from Previous Studies
and Present S t u d y ........ •............. 75
20. Raw Data- . . <................ .. 99
21. Resting Heart Rate Values (Beats/min) forDifferent Tasks at Two Frequencies ........... 101
22 . Random Number Table for L o a d ...................... 102

LIST OF FIGURESFigure Page
1. Relationship between Pulse Rate andEnergy Expenditure .............................. 31
2. Metabolic Measurement Cart........ .............44
3 . LIDO Workset S y s t e m............... ■ ............45
4. Polar Heart Rate Monitor Components ........... 47
5. MAWOL for Different T a s k s .....................66
6. Work-pulse' for Different Tasks................ 67
7. Plot of Residual vs Estimate for MAWOL ... . . 104
8. Plot of Residual vs Estimate for Mean HR -. . . 105
9. Plot of Residual vs Estimate for EstimatedEnergy Expenditure .............................. 106
ix
I

X
ABSTRACT
Despite various efforts through research and studies to make manual materials handling tasks safer and less stressful, statistical data, on the cases of back injury and the amount of compensation paid, indicate that manual materials handling is the leading cause of back injuries.
Biomechanical, physiological and psychophysical approaches have been used for the determination of safe loads for static and dynamic or . repetitive tasks. Thepsychophysical approach requires individuals to adjust either the frequency of handling or the weight of load being handled according to their perception of physical strain. In the actual industrial setup various combinations of manual materials handling activities involving upper-extremity are encountered.
This study aimed at determining the effect of an upper- extremity activity on Maximum Acceptable Weight of Lift (MAWOL) in a combined manual materials handling task by using psychophysical approach. ' A combined manual materials handling / task (lifting, carrying and shearing) often found in labor intensive steel furniture manufacturing industries was chosen for the study. The task was simulated using LIDO Worksetunder laboratory conditions. Eight college students served as human subjects for the study. A metabolic measurement cart, a heart ■rate monitor, a frequency counter and ■ an anthropometric■measuring kit were other pieces of equipment used in the study to record various physiological and anthropometric data.
MAWOL was determined for each task using psychophysical approach and energy expenditure rate during each experiment was estimated by using the increase in heart rate above resting heart rate value.
The results of the analysis of the data recorded during the study showed that MAWOL values for different tasks were higher at . low frequency of handling than those at high frequency (14% lower for 4/min than for 2/min for lifting, carrying and combined lifting and carrying;. 24% lower for combined lifting, carrying and shearing). ■ Mean heart rate was higher for higher frequency of handling than that for lower frequency.
The major conclusion reached from the result of analysis is. that the upper-extremity activity under . study had no significant effect and hence, is not a limiting, factor on maximum acceptable weight of lift. At this time there is no need to adjust MAWOL values for combined manual materials handling tasks involving upper-extremity.'

I
CHAPTER I
INTRODUCTION
Despite various technological innovations and efforts to
automate the materials handling tasks, involvement of humans
for the materials handling tasks has been on the rise over the
years. The situation in the third-world countries has been
still more serious due to economic conditions and the surplus
manpower available to be employed. Thus, manual materials
handling tasks are the forces to reckon ■ with, in any
industrial scenario, throughout the world. The back injuries,
associated with manual materials handling activities, have
necessitated research works to be conducted for the
determination of the maximum acceptable weight of lift
(MAWOL). Even after numerous research works leading to the
significant reduction in the back injury problems, the
compensation costs associated with it are still severe (NIOSH 1981) .
Caillet (1981) • estimated that 70-million Americans have
been inflicted by back injuries and that the number will
increase by 7-million annually. The cost associated with this
problem is extremely high. Klein, Jensen, and Sanderson
(1984) estimated that between 19% and 25.5% of all workers'

V
• 2
compensation claims are due to back pain. The summary from
the National Safety Council's Work Injury and Cost Statistics
(1972-1984) show that while injury frequency declined slightly
between 1981 to 1984, the cost remained about the same.
Many research studies have been carried out, utilizing
various methodologies, for the determination of maximum
acceptable weights for manual materials handling activities in the past years (Stevenson, et al., 1989; Dutta, et al., 1989;
Gallagher, 1991; Ayoub, et al., 1980; Ayoub, et al., 1980;
Mital, et al., 1980; Garg, 1980; Mital, et al. 1983; Chaffin,
et al., 1983; Drury, et al., 1989; Nicholson, 1989; Mital,
1984; Garg, et al., 1980; Ciriello, et al., 1983; Kroemer,
1983). ' ' •
Psychophysical method of determining the maximum
acceptable weights for manual materials handling tasks has
been used by many researchers in the past many years.
However, most of these research studies relate only .to
individual tasks such as lifting, carrying, lowering
(Ciriello, et al., 1993; Fernandez, et al., 1988; Ciriello, et
al., 1990; Ciriello, et al., 1983; Mital, 1983; Garg, et al.,
1980; Ciriello, et al., 1991; Jiang, et al., 1986; Ciriello,
et al.,1993; Ayoub, et al., 1980).
Very little research work has been done to determine the
maximum acceptable weights for combined manual materials
handling activities. In the actual industrial set-up, various
combined manual materials handling activities are carried out

3and it has been necessary to determine if the combination of
activities produce any significant effect on the maximum acceptable weight in relation to the individual activities making the combination. ■ Designing the manual materials
handling tasks based on this, would certainly be beneficial' in
reducing the back injury cases and hence, the ever increasing
compensation costs for such injuries. The research works
carried out on the maximum acceptable weights for the combined
tasks involved only the combination of different manual
materials handling tasks (Jiang, et al., 1986; Gallagher,
1991; and Ciriello, et al., 1993). However, in the real case
industrial scenario, workers may have to perform a sequence of
operations involving manual materials handling tasks as well
as some other tasks of different nature such as the
involvement of upper extremities or lower extremities.
The present . study is intended to determine if a
combination of upper extremity activities, in a sequence of
manual materials handling activities, produces any significant
effect on the maximum acceptable weight of lift, using
Psychophysical methodology.■

4
CHAPTER 2
LITERATURE REVIEW
Overexertion Injury
Compensation costs of over I billion per year and the 12-
million lost workdays due to overexertion on account of manual
materials handling activities, speak for themselves on the
seriousness of the situation. The seriousness is more
reflected by the report that injuries of overexertion due to
manual materials handling activities account for 25% of all
the overexertion injuries (NIOSH, 1981).
Low back pain continues to account for approximately one
third of all workers compensation costs. Manual materials
handling tasks are associated with 63% of low back disorders
(Ciriello, et al., 1993).
Overexertion, musculoskeletal, and back injuries occur
due to a mismatch between the strength abilities of the
workers and strength demands of their jobs. Strength
capabilities of the working population and the methods for
matching individual worker to the job's physical requirements
are needed to reduce such injuries. Making such a match
provides a permanent engineering solution (Garg, et al.,1980).

5Design Approaches to Solving MMH Problems
The following approaches have been used over the years to determine the maximum acceptable weight of lift:
1 . Epidemiological2. Biomechanical
3. Physiological
4. Psychophysical
(Mital, et al., 1993; NIOSH, 1981; Garg, et al., 1980) .
Epidemiological Approach:
"Epidemiology is the study of disease occurrence in human populations" . In general, it is concerned with
discerning the injury patterns present, if any, and using
these patterns to predict the occurrence of injury. The basic
measurements in epidemiology are: counts (number of people in
group suffering from back injuries, a particular back
disorder, low back pain, etc.), prevalence rate (number of
people in a group inflicted with some back disorder/total
number of people in the group), and incidence rate (number of
people developing a disorder/total number at risk/unit
time)(Mital, et al., 1993). This methodology is not
applicable for the determination of maximum acceptable weight
of lift.
Biomechanical Approach:
The biomechanical approach to estimate the mechanical
stresses on the body (primarily, forces acting on the lower

I
back) relies on two measures: the compression and shear forces
generated at the L5/S1 disc of .the spinal column and,
pressures generated at the abdominal cavity (IAP) (Mital, et
al. , 1993) .
The general concern in occupational biomechanics is to determine with given precision what a person can physically
(mechanically) do. In an industrial setting, this means that
the person's physical capabilities must be assessed along with
the physical demands of a prospective job. In addition to the
simple ability to perform, biomechanics is concerned with
those physical attributes of the individual and job that have
been found to produce potential harm to the musculoskeletal
system (NIOSH, 1981). This approach is suitable for analyzing
infrequent tasks only,- since the models developed to date do
not account for the fatigue that results when physical tasks
are performed repeatedly (Mital, 1983).\The primary concern of this approach has been with - the
muscular strength and musculoskeletal loading; and, the
experimental design has been such that the possibility of
cardiovascular and muscular fatigue has been eliminated
(Nicholson, 1989). . -
Studies, on forces developed by load lifting' on
musculoskeletal system, specifically on the low back, by
various researchers, have.shown that lifting of small loads
(less than 20 kg) away from the body will produce large
compressive and shearing forces on the low back;
/ \
. • . 7 . ■
Intervertebral discs may be destroyed by spinal forces as low as 1568 N (160 Kg) (Garg, et al. , 1980).
Various biomechanical models have been developed to facilitate this approach. The. models developed by Chaffin
(1967, 1969), Fisher (1967), and Chaffin (1971) are static in
nature.' Chaffin's model (1967) can compute the static forces and torques at the major articulations of the body for a static midsagittal plane lifting task. Given the dimensions'
and the position of the body segments, the program computes
the forces, and torques at the wrist, elbow, shoulder, hip,
knee, arid ankle joints using the free body diagram (Ayoub, et
al., 1980) .
Physiological Approach:
Unlike the biomechanical approach, the physiological
approach is applicable to repetitive lifting where the load is
within the physical strength of the worker. While performing
manual materials handling tasks, several physiological
responses, such as, metabolic energy cost, heart rate, blood
pressure, blood lactate are affected. Of all these responses,
'metabolic energy expenditure has been the widely accepted
physiological response to repetitive handling as it is
directly proportional to the workload at steady-state
conditions (Mital, et al. -, 1993).
Since in industrial settings manual materials handling
activities are made up of both dynamic and static efforts, the
physiological responses to each ought to be properly

8understood to obtain fairly accurate results (NIOSH, 1981).
The physiological approach has been used for the studies on simultaneous activities. Wiley and Lind (1975) and Kibom
and Brundin (1976) examined the respiratory and circulatory
responses to simultaneous static (hand-grip) and rhythmic
(bicycle ergometer) exercises. Sanchez, . et al., (1979)
studied the effects of dynamic work (walking), static work
(pushing, pulling or holding) and combined static and dynamic
work on heart rate and oxygen consumption (Jiang, et al.,
1986).
Psychophysical Approach:Psychophysics is a very old branch of psychology that is
concerned with the relationship between human sensations and
their physical stimuli; very rarely is this a one-to-one
relationship. Strength, in psychophysical context, is defined
as the maximum voluntary force a person is willing to exert in
a single attempti Similarly, endurance (capacity) is the
force a person is willing to repeatedly exert for an extended
period of time without "feeling fatigued" (NIOSH, 1981).
Modern psychophysical theory, i;e., Stevens theory,
states that the strength of a sensation (S) is directly
related to the intensity of its physical stimulus (I) by means
of a power function:
S = kln
where,

I
9S = strength of a sensation
I = intensity of physical stimulus 1
k = a constant which is a function of the particular units of measurement that are used
n = the slope of the line that represents the power
function when plotted in log-log coordinates.
Experiments have determined the exponents for many types
of stimuli, some of which are:
electric shock = 3.5, for taste (salt) = 1.3, for
loudness (binaural) = 0.6, and for lifting weights =
1.45.
The psychophysical approach to manual materials handling '
job design requires individuals to adjust either the handling
frequency, the weight of load or the force exerted on the
object being handled according to their perception of physical
strain. One variable is adjusted while all other variables ,
are controlled.- The individuals, are told to adjust the
workload to the maximum amount they can handle for a specified
period of time, without .undue strain or discomfort, and
without becoming unusually tired, weakened or overheated, or
out of breath. The final workload, thus selected, is the
maximum acceptable frequency of handling or the maximum
acceptable weight/force of handling (Mital, et al.,-1993).
In the Psychophysical approach, a person adjusts the load(such that repetitive lifting does not result in overexertion
or.excessive fatigue. The weight selected by the operator is

10referred to as the maximum acceptable weight of lift (Ayoub, et al., 1980).
Psychophysical approach is simple to use and understand and it is effective in the sense that, it is only the
individual worker who can integrate the various sensory inputs
into • one meaningful response (Garg, et al., 1980). The
following indices can be used in the psychophysical approach:
Rated perceived exertion (RPE)
Body part discomfort frequency (BPDF)
Body part discomfort severity (BPDS)
(Drury, et al., 1989).
Effectiveness of Various Approaches
Of the various approaches available for the ergonomic
design of manual materials handling activities,
epidemiological approach is never used whereas the ' other
approaches are used frequently depending upon the type of
workload, frequency, etc.
Biomechanical approach has been used by many researchers
in the analysis of manual materials handling activities.
This approach is suitable for analyzing infrequent tasks
only, ■ since the models developed to date do not account for
the fatigue that results when physical tasks are performed
repeatedly (Mital, 1983).
For infrequent lifting, the acceptable weight of load
determined by biomechanical approach was higher than that

11determined by'psychophysical approach (Nicholson, 1989).
Acceptable weight limits based on muscle strength testing and biomechanical modeling (Poulsen and Jorgensen, 1971; Poulsen, 197 0; Martin and Chaffin, 1972; Chaffin, et al. ,
1977), in general, are higher than those based on
psychophysical methodology (Snook, 1978; Ayoub, et al., 1978; ILO, 1965; Snook and Ervine, 1967).
Physiological approach is used in case of repetitive
lifting also. The lifting capacity based on physiological
approach overestimated the lifting capacity based on
psychophysical approach at 2 lifts per minute by 25.36%.
However, at 8 lifts per minute, the lifting capacity based on
physiological approach underestimated the lifting capacity
based on the psychophysical approach by 28.83% (Fernandez, et al., 1988).
At low frequencies the biomechanical approach is more
appropriate, while at high frequencies the physiological
approach is more appropriate. Utilizing the psychophysical
approach to estimate lifting capacity is appropriate over the
entire frequency range when compared to utilizing • the
physiological or the biomechanical approaches (Fernandez, et al., 1988).
The psychophysical approach seems to be a valid measure,
of lifting capacity across the lower and moderate lifting
frequency range. Lifting capacity estimated by the
psychophysical approach is relatively consistent (Fernandez,

12et al., 1988).
Psychophysical techniques utilize a trained worker to adjust the load lifted until the maximum load which can be
lifted repeatedly over a long work bout is reached (Ayoub, 1977) .
According to Snook, the major advantages of
psychophysical approach are the following:
1. It permits the realistic simulation of industrial work. For example, lifting can be a dynamic task through a given vertical distance, and not just isometric pull. Task frequency can- be varied from very fast rates to very slow rates.
2. It can be used to study the very intermittent tasks that are commonly found in industry.
3.. Its results are consistent with the industrial engineering concept of .a "fair day's work for a fair day's pay" .
4. Its results are very reproducible.
However, the following are the disadvantages of this approach:
I. It is a subjective method that relies upon self- report from the subjects.
2 . Its results from very fast frequency tasks are higher than recommended metabolic criteria. Permissible loads for very fast tasks should probably be based upon metabolic criteria.
3. it does not appear1 sensitive to the bending and twisting motions that are often associated with the onset of low-back pain. For example, psychophysical results are higher for the floor to knuckle height lift. than for the knuckle height to shoulder height lift (Marley, 1990).
Models Used for Different Approaches
Biomechanical:
Various biomechanical models have been developed in the

I
13past many years. All the models are not concerned with
lifting activities alone. All of these models estimate the
reactive forces and torques on the various joints, with a few
also estimating the compressive and shear forces in L4/L5 and L5/S1 discs (Ayoub, eb al., 1980)'.
Chaffin's model (1967) can compute the static forces and torques at the major articulations of the body for a static
mid-sagittal plane lifting tasks.
Fisher's model (1967), which was an expanded version of
Chaffin's (1967) model, could compute the compressive, shear,
and torque forces on the lumbar spine. This model corrects
for the effect- of abdominal pressure.
Chaffin's computer ■ model (1969) estimates forces and
torques at the fourth lumbar through the first sacral spinal
vertebrae of a person performing a weight handling task. This
is in addition to the estimation of forces and torques at six
major articulations of the body (wrist, elbow, shoulder, hip,
knee, and ankle) . His 1971 model, which was an improvement on ithe 1969 model, considered even mass distribution of equipment
)gravity, All these models considered only the static forces,
i .e . , the forces generated due to movement acceleration was
assumed to be negligible. , ■■ iEl-Bassoussi's model (1974) and Ayoub and El-Bassoussi's |
model (197 6) took into consideration even the subject's
movement and the forces generated by the movements. ' This Imodel also considers the reactive forces and torques on ;

14various body joints, as well as the compressive and shear
forces at the L4/L5 and L5/S1 joints.
Physiological:
■Frederick's model (1959) gives the interaction of all the
independent variables (frequency, height of lift, load, etc.) but does not include any main effect. One of the serious
drawbacks of this model is that, energy consumption is based
on lifting as a single performance. Thus, this drawback makes
this model not suitable to repetitive industrial tasks.
Despite the fact that squat method of lifting requires higher
rate of energy expenditure (Brown, 1971), this model does not
take into account lifting postures, i .e ., squat, stoop, etc.
The Aberg, et al., (1968) model requires the center of
gravity to be determined. Its indifference to the gender for
horizontal arm work and/or for pushing and pulling, difficulty
in the determination of center of gravity, and non
consideration of the effect of posture and technique make this
model to be used only in a limited sense.
Gang's model (1976), though the most flexible of all the
metabolic rate prediction models, takes into account the
activities in the sagittal plane alone. The assumption of
this model, that an activity can be broken down into tasks and
that- the metabolic rate for the activity is the" sum of the
metabolic rates for all the tasks, has not been verified so
far.

15Psychophysical:
Various researchers have developed models to study the manual materials handling activities in a psychophysical approach. McConville and Hertzberg (1966) developed a model to examine the interaction of two variables: the weight and
the width of one-handed, symmetrical boxes. The predictive
lift equation developed with maximum weight of lift as
dependent variable and for floor to knuckle height of lift is
as follows:Predictive lift = 60 - (width of box in inches)
Poulsen (1970) developed prediction equations for
investigating the maximum weight a person could lift for two
different heights. Both males and females were used as
subjects in his study. The'predictive lift equation developed
with maximum 'weight of lift as dependent variable, and for
both male and female are. as follows:
For Floor to table height-
Predicted lift = 1.40(max. isometric back st.)- 0.5(body-
weight) .
For Table to head-height-
Predicted lift = 0.5 (sum of right and left max. isometricarm push).
McDaniel (1972), and Ayoub (1976) developed regression
equations to estimate the predicted lift. The equations
developed for male, female and both are as follows:
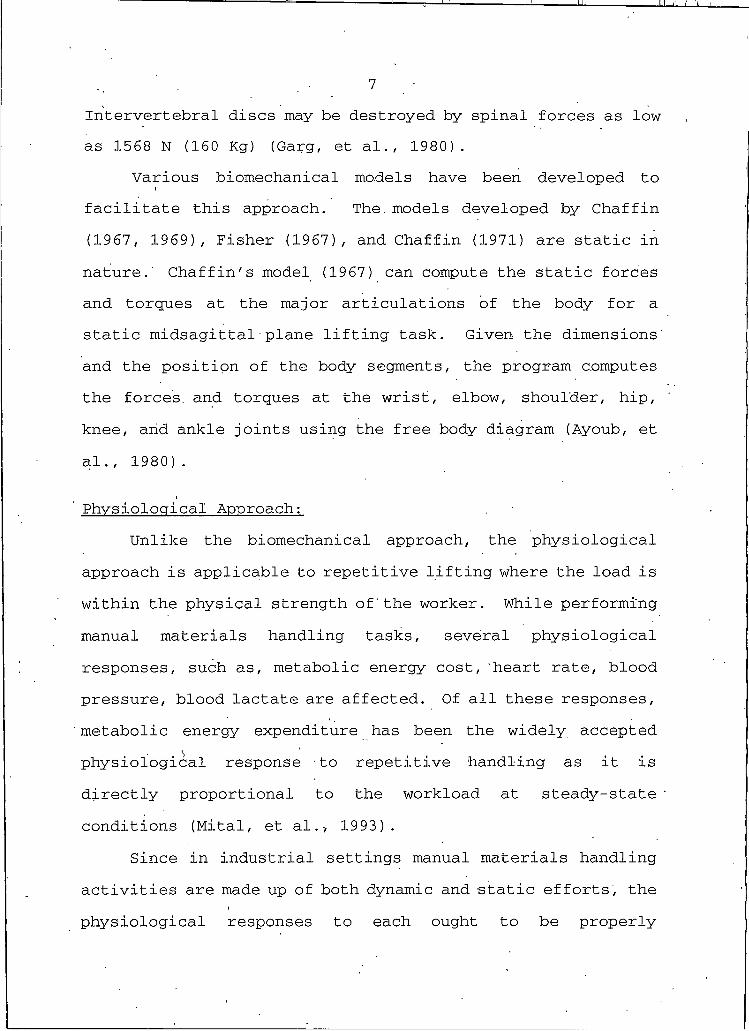
Floor to knuckle height of Iift-
Predicted lift = -176.36 + 0.02(ht)2 - 2.73(static end.)2
+ 0.02 (RPI) * (arm st.) + 0.05 (RPI) * (back st.) - 2.51(Fl/dynamic end.) for male.
Predicted lift = -24.03 + 0.19(RPI)2 +
0.006(arm st.)(leg st.) for female.
Predicted lift = 11.93- 1.12 (back st.) + 0 -.16 (RPI)2
+ 0.005(back st.)2 - 8.81(static end.)2 - 0.I (sex)(Fl)
+ 0.06(ht) (RPI) ■+ 0.03(RPI)(leg st.) -
0.002(back st.)(leg st.) - 0.03(leg st.Mstat'. end.) +
0.11 (static end.) (FI) for both male and' female'.
The models developed by various researchers from three lifting ranges are as follows:
Floor to Knuckle Height (McDaniel, 1972):
Predicted Lift for male = -172.3599 + 0.0220607 * Ht. -
2.72867 * Stat .Ef. + 0.0209696 * RPI * Arm St. +
0.0534346 * RPI * Back St. - 2.51346 * RPI/Dynam.Ef.
Predicted Lift for female = -24.02682 + 0.19362 * RPI +
0.00607224 *. Arm St. * Leg St.
Predicted Lift for both male and female = 11.93388 -
1.1024 * Back St. + 0.15811 * RPI + 0.00458322 * Back
St.- 8.80718 * Stat. Ef. - 0.09552 * Sex * ,FI + 0.06007
* Ht. * RPI + 0.0231265 * RPI * Leg St.- 0.00021627 *
Back St. * Leg St. - 0.027092 * Leg St. * Stat. E f . +
16
0.11092 * Stat. Ef. * FI

17Knuckle to Shoulder Height (Dryden, 1973):
Predicted Lift for male = 0.82766 * Chest Cir. + 0.55885* Dyn.Ef.
Predicted Lift for female = 3.809 * RPI - 1.47347 * Ht.
* FI/1000 - 0.31199 * RPI ■* Stat .Ef. + 1.22804 * Percent ' Fat * FI/1000
Predicted Lift for both male and female = 24.1212 0 + 0.37912 * Sex * Dynam. Ef.
Shoulder to extended Reach Height (Knipfer, 1974):
Predicted Lift for male = 4.91337 + 0.19746 * Back St. - 0.01733 * Shoulder St. + 0.42917 * Age
Predicted Lift for female = 15.07131 + 0.34346 * Wt. +
0.83999 * Dynam. Ef. + 0.33545 * Forearm Circ.
Predicted Lift for both male and female =
5.225 * Sex + 0.00494 * Shoulder St. + 0.1944 * Horiz. Push St.
Where,
Dynam. = Dynamic
End. = Endurance
RPI = Reciprocal Pendoral IndexStat. = Static
Ef. = Effort
Ht. = Height
St. = Strength
W t . = Weight
I
1 1 'I L
18Studies on MAWOL
As described above, various researchers have used different models to determine the Maximum Acceptable Weight of Lift.
Stevenson, et al., (1989) used an incremental liftingmachine (ILM) to determine the maximum lifting performance by
isoinertial tests and concluded that prediction of maximum
lifting ability or endurance ability using ILM might be
enhanced by closer approximation of specific task variables,
or by inclusion of dynamic parameters to measure technique.
Dutta, et al., (1989) used efficiency of mechanical work
as the response variable for optimization purposes in
determining the optimum activity levels when carrying
symmetrical loads in the sagittal plane. They concluded that
to improve the efficiency of workers performing carrying task,
loads should be very close to 18 kg and handling frequency
should be near 3 times/min. The metabolic energy expenditure
values indicated that carrying heavy loads for longer
distances increases the mechanical work, metabolic costs, and
heart rate. As a result, under this condition and with more
frequent handling, intermittent carrying tasks closely
approximate continuous carrying tasks. Therefore, carrying
tasks involving handling light loads for shorter distances are
more economical from the metabolic and mechanical work point of view.

19Ciriello, et al., (1990) used psychophysical approach to
investigate maximum acceptable weights and forces when
performing manual handling tasks continuously for four hours
at frequencies of 4.3 /min or slower. They concluded that the
weights selected after 40 min were not significantly different
from the weights selected after four hours. It was also
concluded from this study that psychophysical methodology was appropriate for determining maximum acceptable weights for
task frequencies of 4.3/min or slower.
Ciriello, et al., (1983) used psychophysical methodology
to study the effect of size, distance, height, and frequency
on manual handling tasks with 10 male and 12 female industrial
workers as subjects. The results of this study indicated that
acceptable weights for lower frequency tasks are lower
compared to higher frequency tasks and that maximum acceptable
weights and forces for female workers were significantly
lower, but proportionately similar, to the maximum acceptable
weights and forces for male workers.Mital, (1983) conducted an experiment to verify the
psychophysical methodology used for determining lifting
capabilities of workers. The result indicated that male and
female workers could lift only 65% and 84% respectively of the
estimated value for 25 min, in 8-hour work duration. When the
duration of the task increased from 8 hour to 12 hours, the
amount of load lifted was only 7 0% and 77% respectively. The
metabolic energy expenditure rate of the subjects decreased

11 11
20significantly with time as the loads were reduced, and heart
rate remained relatively constant at about 100 beats/min.
Kroemer, (1983) conducted experiments to determine the best technique for selecting persons suitable for materials
handling. He concluded from the results of the experiment
that isoinertial technique- was better than static strength tests.
Ayoub, et al., (1983) used psychophysical approach to determine the maximum acceptable weight of lift which was used
in the determination of Job Severity Index (JSI). JSI which
is defined as the time-and-frequency-weighted average of the maximum weight required by each task divided by the selected
lifting capacity given the lifting task conditions. The
researchers proposed the use of JSI as a tool for job design
and employee placement.
Gallagher, (1991) conducted experiments to study the
psychophysicaIIy acceptable weights and physiological costs of
performing combined lifting and lowering tasks in restricted
postures. - The results of the experiments indicated the following:
- p sy chophy s i c a I Iy determined MAWOL averaged 11.3% lower
when kneeling•as compared to stooping, is slightly greater
(3.5%) when handling loads asymmetrically, and is decreased
(5.00%) with increasing lifting height when performing lifting
and lowering tasks in restricted postures.
.

21- energy expenditure was greater in the stooped posture,
when lifting and lowering asymmetrically, and when lifting and
lowering to a higher shelf height in restricted positions.
- the psychophysical approach of determining acceptable weights of lift was sensitive to differences in- lifting
capacity even for a relatively brief MtaH periods.
Jiang, et al., (1986) studied psychophysically the effect
of combined manual materials-handling activities on maximum
acceptable weight of lift. The increase in the heart rate
verified the subjects' comments that combined activity was
more stressful than the individual component activities of the
combination.
Ciriello, et al., (1993) conducted further studies of
psychophysically determined maximum acceptable weights and
forces. The results of their studies indicated that lifting
boxes without handles produced consistent decreases (median,
16%) in maximum acceptable weights when compared with lifting
boxes with handles. Lifting with extended horizontal reach
(approximately 48 cm) produced consistent decreases (median,
48%) in maximum acceptable weights when compared with lifting
close to the body (approximately 17 cm) . No significant heart
rate or oxygen consumption differences occurred in either of
these variables. The maximum acceptable force of pulling was
lower for longer (15.2 m) pulling tasks. The maximum
acceptable weight for combination tasks was similar to that of the limiting components.

Jl
Snook, et al., (1991) reviewed some of the experiments
already carried out to study lifting, lowering, pushing,
pulling, and carrying tasks. . Psychophysical approach was used
in each case with the measurements of oxygen consumption,
heart rate, and anthropometric characteristics. The results of the experiments showed lower means for the criterion tasks
( i .e ., low lift, center lift, low lower, center lower,
initial push, sustained push, initial pull, sustained pull,
and carry) were lower than the original values for female
subjects, whereas opposite trend occurred for the male subjects.
Nicholson, (1989) did a comparative study of methods for
establishing load handling capabilities and concluded from the
results of the experiments that care must be exercised when
using or recommending psychophysicalIy determined weights with
an origin of lift below knee level. The comparisons were
limited to bimanual; sagittal plane lifting. The study
supports the conclusions of Garg and Ayoub (1980) that the
acceptable weights according to psychophysical studies are
lower than those according to biomechanical criteria.
Mital, (1984) conducted an experiment on comprehensive
maximum acceptable weight of lift database for regular 8-hour
work shifts. The experimental data collected in this study,
for 8 hours, were compared with previous studies of Snook,
(1978) and Ayoub, et al., (1978) and was found that all three
studies compared favorably.
22

11 >
23Garg, (1980) did a literature survey on recommendations
for the maximum weight of the load and work loads. The three different criteria (biomechanical, physiological, and
psychophysical) were reviewed in the literature and ■ the
comparison showed that (I) the recommendations based on a
given criterion are not in agreement, (2) the maximum
permissible weights of the load based on psychophysical studies were lower than those based on biomechanical criteria,
and (3) the psychophysical fatigue criteria, as compared to
physiological fatigue .criteria, resulted in greater work loads
at higher frequencies of lifting.
Smith, et al., (1984) did a study on manual bag lifting.
The results of the study indicated that for short work bout
(approximately 30 minutes), average percent of PWC for the
psychophysical approach was 55.3%Gallagher, et al., (1990) conducted experiments to study
psychophysical, physiological and biomechanical effects of
lifting in stooped and kneeling postures. Results of this
study indicated that lifting capacity was greater when the
subjects could assume a stooped posture than when kneeling.
The metabolic cost was greater in kneeling posture for heart
rate, oxygen consumption, minute ventilation, and respiratory
exchange ratio..Karwowski, et al., (1986), in their investigation on the
reliability of the psychophysical approach to manual lifting
of liquids by females, observed that the use of the

24psychophysical method, in the present form, as applied to manual materials handling, should be limited to the low and moderate frequencies only, as originally intended by Snook and Irvine in 1986 (Karwowski, et al., 1986).
Snook, et al., (1970) conducted an ergonomic study to
determine a man's physical capacities while performing manual
materials handling tasks-. Lifting, lowering, pushing,
pulling, carrying, and walking tasks were studied in a
controlled environment of 68° to 72° F and 40% to 55% relative
humidity. The results of the study indicated that there were
no significant differences between maximum acceptable weights
of lift and maximum acceptable weights of lower. However, for
different heights, maximum acceptable "weights were
significantly greater for lowering than for lifting. The
initial force for pushing was significantly greater than
initial force for pulling. There were no significant rate
differences among three replications of the walking task.
Studies.on Combined Manual Materials Handling .
Very few research works have been carried out on combined-
manual materials handling activities. All the studies
reported in this field relate to various activities only in
the field of materials handling activities. No research work
has been reported to determine the effect of upper dr lower
extremities activities which might come in the sequence of ̂ manual materials handling activities.

Il ILL
Taboun, et al., (1989) conducted research to determine
the energy cost models, for combined lifting and carrying tasks. .In their experiment, oxygen uptake (VO2 1/min.) and heart rate (beats/min) were the response variables, whilst a
number of task related parameters: load handled, height of
lift, frequency of handling, carrying distance and load width,
were manipulated using rotatable central composite design.
From the results of their experiment, the researchers
concluded that the values obtained for metabolic energy
.expenditure should be related to the aerobic work capacity of
workers involved in the task. They also concluded that the
energy cost equation developed from the experiment could be
used with a high degree of accuracy to set job standards in industry. ,
The energy cost models developed were:
Model I: Applicable to individual carrying tasks and/or
combined carrying and lifting from 75 cm (table height) to a height of 150 cm or less.
VO2 =0.1809 + [(BW+L) * (2.6112 * (BW+L) * 92.594 * D * H) +
F * (318.16 * L + 7.9815 * BW * D + 49.1565 * L * D)] * IO"5
+ 2.2956 * WID/L (R2 =0.824) ' .
Model II: Applicable to combined lifting and carrying
tasks, where lifting starts from the floor to 150 cm height or
less.
VO2 = 0.0738 + [ (BW+L)*(3.9918*(BW+L)+61.226*D*H) + L * F *
(424.131+81.926*D) ] * IO"5 + 3.851 * WID/L (r2 = 0.863)
■ 25

11 I I
\
Where,
VO2 = oxygen consumption (1/min), BW = body weight (kg),L = load handled . (kg) , F = frequency (handling/min) , D =
carrying distance (m), H = height range of lift (m), and WID = box width (in) along the sagittal plane.
The above models give the best results when used withinthe following range limits;
'1. Load: between 8 and 28 kg.2. Frequency: between I and 5 handling/min.3. Carrying distance:' between 0 and 12 m.4. Height range of lift: from floor to 1.5 m.5. Box width: between 0.15 and 0.55 m.(Taboun, et al., 1989)
■ Gallagher, (1991) studied the acceptable weights and
physiological costs of performing combined manual handling
tasks in restricted headroom conditions. The independent
variables included posture (stooping or kneeling on two
knees), task symmetry (symmetric or asymmetric), and vertical
lift distance (35cm or 60cm). He concluded from the results
of the experiment that:
1. Effect of lifting height is similar whether one is lifting or performing a combined lifting and lowering task and that the MAWOL of the combined tasks was limited by the capacity to lift, rather than the capacity to lower.
2. PsychophysicaIIy determined MAWOL averages 11.3% lower when kneeling as compared to stooping, is slightly greater (3.5%) when handling loads asymmetrically, and is decreased (5.0%) with increasing lifting height when performing lifting and lowering tasks in restricted postures.
3. Energy expenditure was greater in the stooped posture, when lifting and lowering asymmetrically, and when - lifting and lowering to a higher shelf height in these , restricted positions.
26

. 274. The psychophysical approach of determining acceptable
weights of lift was sensitive to differences in lifting capacity even for relatively brief MMH periods. Only 3% of tests had to be repeated due to violation of the 15% criterion.
5. IAP studies suggest lower limits in the stooped posture, while psychophysical studies indicate a more limited lifting capacity in the kneeling posture. -(Gallagher, 1991)
Jiang, et al., (1986) studied the effect of combined
manual materials handling activities on the capacity of the
workers. They conducted experiments with combined MMH
activities: lifting from floor to knuckle height and carrying
(LFK+C); lifting from floor to knuckle height, carrying and
lifting from knuckle to shoulder height (LFK+C+LKS); and
lifting from floor to knuckle height, carrying and.lowering to
the floor (LFK+C+LOW). They concluded from the experimental
results that at higher frequencies (>6 lifts/min) the combined
activities allowed for little resting time. Consequently,
there was very little time for physiological recovery from
muscle fatigue.
The lifting capacity of the combined M M H .activities is
determined by the limiting capacity of the individual
component activity. The limiting capacity usually occurs at
the most stressful individual activity or at the weakest limb
of the human" body used in handling the task, i . e ., in the
combined LFK, carrying 3.4m and LKS task at a pace of six
handlings per minute, the LKS task becomes the limiting
capacity because of the weakest strength for LKS height.
(Jiang, et al., 1986)

28Ciriello, et al., (1993) carried out further studies of
psychophysically determined maximum acceptable weights and forces and came to .the conclusion that the maximum acceptable
weight for combination tasks was similar to that of the
■ limiting, component. (Ciriello, et al., 1993)
Snook, et al., (1991) from their investigation of the
combination task, consisting of. a lift, carry, and lower
concluded that the maximum.acceptable weights for the
combination task were significantly lower than that of
individual carrying task performed separately. But, they were
not significantly different from the values for,individual
lifting and lowering tasks performed separately. The heart
rates for the combination task were significantly higher than
those for the individual lifting, carrying, and lowering tasks
(Snook, et al., 1991).
Taboun, et al., (1989) conducted experiments to determine
the metabolic responses to combined manual materials handling
tasks, viz., lifting and carrying and developed energy cost
models for these tasks. The developed models were compared
with responses for individual handling tasks and validated
using the "Prediction Error Sum of Squares". They concluded
from the results of the experiments that the most stressful
task appeared to be the one in which a load (even as low as 13
kg) was lifted from the floor to the shoulder height and then
carried over distances exceeding 3 m at relatively low
frequencies. It was also established that the net metabolic
29energy expenditure for the combined tasks cannot be estimated by summing the net steady-state metabolic costs for individual task components (Taboun, et al. , 1989).
Heart Rate During Physical Activity
The heart rate during any physical activity can be. thought of as comprised of Resting Pulse, Working Pulse, Work
Pulse, Total Recovery Pulse (recovery cost), and Total Work
Pulse (cardiac cost), defined as follows:
1. - Resting Pulse: average heart rate before the work begins.2. Working Pulse: average heart rate during the work.3. Work Pulse: difference between the resting and working
pulses.4. Total Recovery Pulse (recovery cost): sum of heart beats
from the cessation of work until the pulse returns to its resting level..
5. Total Work Pulse (cardiac cost): sum1 of heart beats from the start of the work until resting level is restored.
Karrasch, and Muller made use of their studies to
determine an acceptable upper limit of work load as being that
within which the working pulse did not continue to rise
indefinitely, and when the work stopped, returned to the
resting level after about 15 minutes. ■ The maximum output
under these conditions is the limit of continuous performance
throughout an eight-hour working day.
According to E . A. Muller, . the limit of continuous
performance for men is reached when the average working pulse
is 30 beats/min. above the resting pulse (i.e., work pulse
= 3 0 b/min) , both of these being measured in the same
posture. Rohmer't and Hettinger have made a systematic study

30of the limits- of work load, during which the heart rate
remained steady, using a cycle-ergometer, and a hand crank for eight hours at - a time. They came to the conclusion that this limit was still valid up to a work pulse of 40 b/min.,
provided that the resting pulse was measured when the operator
was lying down. The authors show that for dynamic work
involving a moderate number of muscles, I work calorie/min. = 10 work pulse.
Several studies undertaken in factories have shown that
it is easier to measure the resting pulse when the subject is
sitting than when lying down, so it is suggested that, for
men, resting pulse should be taken when seated and 35 work
pulses be fixed as the limit for continuous performance.
Christensen has suggested that within certain limits,
ventilation of lungs, heart rate, and body temperature show a
linear relationship with the rate of energy consumption, or
the work performed. Table I shows reactions measured at various work loads (Grandjean, 1986).
Since the energy. produced by muscle contraction is
directly related to the oxygen used (the exact relationship
depending on the proportion of carbohydrate, protein, and fat
in the diet) , energy expended may be measured by ascertaining
the oxygen consumed and the carbon dioxide produced.
Equipment for this purpose will therefore be required to
measure the ventilation rate in m3, and to take a sample of
the expired air for subsequent analysis. However, due to the

31bulkiness of the equipment, and the requirement for the
subject to wear mask over face during the experiment, it is not always feasible to follow this procedure.
Table I. Relationship between Various Metabolic MeasurementsAssessment of Oxygen
Consum.LungVentilation
RectalTemp.
HeartRate
Work load Liters/min. Liters/min. Degree C Beats/min
Very Low (Resting)
0.25 - 0.3 6-7 37.5 60-70
Low 0.50 - 1.0 11 - 20 37.5 75 - 100
Moderate 1.0 - 1.50 20 - 31 37.5 - 38.0
100 - 125
High 1.5 - 2.0 31 - 43 38.0 - 38.5
125 - 150
Very High 2.0 - 2.5 43 - 56 38.5 - 39.0
150 - 175
Extremely High (e.g. sport)
2.40 - 4.0 60 - 100 Over 39 over 175
The second and more practically viable method of
measurement utilizes the relationship between pulse rate and
energy expenditure (Figure I) (Applied Ergonomics Handbook).
Figure I. Relationship between Pulse Rate and EnergyExpenditure.

32Factors Affecting Maximum Acceptable Weight of Lift
Individual Factors:
The following are the individual factors which have been
found to affect the maximum load handling capacity of an individual:
Age: it is a well known fact that people experience
decreased capability with .the increase in age. The studies
conducted by Aberg (1961) indicated that the capacity
decreases after 20 years of age. However, studies conducted
by Mital, (1984) on comprehensive maximum acceptable weight of
lift for regular 8-hour work shifts, did /not show any
significant age effects either on the maximum acceptable
weight of lift, heart rate, or oxygen uptake for either males
or females.
That ageing leads to reduction in physical work
capacity, range of lumbar spinal motion, muscle strength,
muscle contraction speed, shock absorbing characteristics of
the lumbar disc, intra-abdominal pressure, load supporting
capacity of the spine, and aerobic capacity has been well
established. However, the effect of ageing on manual
materials handling capabilities does not appear to be
significant (Ayoub, et'al., 1989; 1993).
Mital, et al., (1983) concluded from their experiments
that age appeared to be important predictor of MAWOL.

33Gender: Gender differences are also reflected in the
manual materials handling capabilities of men and women. Primarily due to the difference in the muscle strengths, the
MMH capability of women is substantially lower than that of
•men (Ayoub, et al., 1993). This has been verified from
many experiments conducted by a number‘of researchers:
Phvsiaue/anthropometric strength: Several studies have
shown that, compared to shorter individuals, tall people are
relatively weaker in lifting strength and more susceptible to
back pain as they have to lean and reach further to pick up or
set down a load. "The review of scientific literature
indicates that taller, muscularly weak, or obese individuals
are disadvantaged when performing materials handling jobs,
particularly repetitive MMH jobs. Muscularly built persons,
on the other hand, have greater MMH capacity and are less
prone to low-back pain (Ayoub, et al., 1993)".
Mital, et al., (1983) concluded from their experiment
that body weight of the subject appeared to be an important
predictor of MAWOL.
Training: It is a generally accepted fact that training
the workers on the safety in materials handling plays a great
part - in reducing the hazardous effect of manual materials
handling activities. Various European countries have been
providing training to the workers on the concept of "human
kinetics" with the aim of avoiding the unnecessary stress due

A
34to materials handling (NIOSH, 1981).
"Since training has an educational value and enhances cardiovascular and muscular capabilities, MMH activities are perceived to become easier (reduced physical stress) and
require less effort with' training. Physical training,
therefore, is highly desirable. The training program should include not only physical training but training in safe
handling techniques and use of materials handling aids as well
and should be extended not only to new employees but also to
existing workers. Classroom instruction on the hazards of MMH
activities should be an integral part of a training program"
(Mital, et al., 1993).
Task Factors:
The following are the task factors that affect the
maximum weight handling capacity of any individual:
Frequency: Garg, et al., (1979) concluded, from their
experiment on effect of lifting frequency and technique on
physical fatigue with special reference to psychophysical
methodology and metabolic rate that maximum acceptable weight
of lift increased with the increase in the frequency of lift.
Frequency of lifting is a task variable which affects the
lifting capacity. Several investigations indicate that
lifting capacity decreases when the frequency of lift
increases (Ayoub, 1977).
Container size and type: The study conducted by Garg, et

35al., (1980) showed that container size and type had
significant effects on the maximum acceptable weight. From the same experiment they concluded that a person could lift
heavier weight with a box type of container for container volumes approximately less than or equal to 0.11m3. For large
container volumes (>0. Ilrn3), a bag type of container is more
suitable.
The studies conducted by Tichauer, (1971); Aghazadeh,
(1974), El Bassoussi, (1974) and Ayoub, et al., (1978) point
out that as the size of the load increases in the sagittal plane, the mean weight lifted decreases (Ayoub, 1977).
The container size has a significant bearing on the .
maximum acceptable.weight of lift. The maximum acceptable weight lifted was significantly higher when performing a bag
lifting task either with handles or when the bag was 95% full.
The maximum acceptable weight of lift for bag lifting tasks
was higher (2.21 kg) than for box lifting tasks under the .
conditions of the experiment conducted by James L . Smith and
Bernard C . Jiang (Smith, et al., 1984).
Height and range of lift: Mechanical work done in
performing a repetitive lifting work can be expressed by the expression-
Mechanical work = Load * Frequency * Height of Lift
The expression shows that mechanical work required is
directly proportional to the height of lift. Thus, metabolic
energy expenditure should increase with an increase in the

36vertical height of lift (NIOSH, 1981).
Similarly, the lifting capacity is different for
different ranges of lift in the vertical direction, i . e .,lifting capacity for the lifting range of floor to knuckle
/
will be different from that of shoulder height to reach
height. This is because of involvement of different muscle groups in the process of lifting (Fernandez, 1986).
Handles: Garg, et al., (1980), from their experiment on
the study of container characteristics and maximum acceptable
weight of lift, concluded that handles on the containers had
a significant effect on the MAWOL. The maximum weight
acceptable to a person was significantly lower when lifting a
box without handles, as compared to lifting ' a box with
handles.
Handle shape and size are relatively easy to define, but
placement of handles on containers represents a more difficult
problem. Laboratory and field studies of hand and handle
placement were reviewed by Drury, et al., (1983) with the
conclusion that handles should be placed so as to give both
horizontal and vertical stability, except for hAavy lifting,
in which a symmetrical handle placement may be preferred, as
it minimizes arm forces (Drury, et al., 1983).
Drury, et . al., (1989) in a study of symmetric and
asymmetric manual materials handling concluded that all handle
positions ,were better than no handles, but the best handle

Il ■! V '
37
position changed from asymmetric for 9-kg boxes to symmetric
for 13-kg boxes. The effect of handles was equivalent to a
weight change of 1-2 kg for Heart Rate and Rated Perceived
Exertion, but much higher (2-14 kg) for Body Part Discomfort measures.
Location of Center of Gravity; The location of center of
gravity has a significant effect on the weight of lift (Mital,
et al., 1983). Their results indicated that the maximum
acceptable weight of lift decreased by 3.1% when the CG was
offset by" 12.7cm and by 7.6% when the CG was offset by 25.4cm.
Asymmetrical lifting tasks are less stressful when the CG is
located closer to the preferred hand. On the average 3% more
weight was lifted when the CG was located closer to the
preferred hand.
Density of Material: Mital, et al., (1983) concluded
that the density of the material handled had a significant
effect on the maximum acceptable weight of lift.
Subiect: Mital, et al., (1983) concluded from their
study that under identical conditions, there was a significant
differences in the effect of frequency on the maximum
acceptable weight of lift 'between - the student and the
industrial subject populations.
Environmental Factors:
The most common environmental variables which affect the

Jl I
3 8
physiological behavior of workers are, ambient temperature, humidity, air movement, and atmospheric constituents (Fernandez, 1986).
Kamon and Belding (1971) reported that heart rate
increased approximately 7 to 10 beats per minute for 10 degree
centigrade rise in ambient temperature (Fernandez,J.E ., 1986) .
Snook and Iryine (1974) reported that the hot environment
significantly increased heart rate and rectal temperature and
significantly reduced the workload (Fernandez, 1986) .
Hafez (1980) reported that the weight selected by
subjects at 27-degrees Wet Bulb Globe Temperature (WBGT) were'
significantly different than the weight selected at 22-degrees
WBGT. On the other hand, the weights selected at 32-degrees
WBGT as well as the physiological responses (oxygen
consumption, resting body temperature, resting heart rate,
working body temperature, working heart rate) at 32-degrees
WBGT were significantly different from those at 22-degrees WBGT (Fernandez, 1986).
The effects of all the above factors on the lifting
capacity could be summarized by the following relation (Ayoub,
et al., 1979): '
Lifting capacity = W (h,p,s,f,b)
where,
h = Lifting height which has three levels: floor to
knuckle height; knuckle height to shoulder height; shoulder
height to reach height.

39p - Percentile of the population assuming a normal
distribution of lifting capacity. Five percentiles are considered using the mean and standard deviation of the
lifting capacity at each lifting height; these percentiles are the 10th, 25th, 50th, 75th and 90th percentiles.
s = Sex of the worker. Two levels, males- and females, are considered.
f = Frequency of lift. Six levels of frequency of lift
were considered: I, 2, 3, 4, 5 and 6 lifts per minute,
b = Box length, which is the box dimension in the
sagittal plane of the body. Lengths of 10, 18, 24 inches were considered.
The value of W corresponding to given h, p, s, f, and b has to be read from a table.

40
CHAPTER 3
RATIONALE AND OBJECTIVES
The first study on combined manual materials handling
activities was conducted in 1986. Though various researchers
and organizations were involved in the study of manual
materials handling activities, the studies were limited to
individual activities alone. However, in industry, workers
often perform various types of tasks consisting of a
combination of materials handling activities.. Though the
mechanization of materials handling activities have helped in
reducing the number of cases of occurrences of injuries in
recent years, the compensation amount paid for these injuries indicates that it is still the leading injury class.
The situation in the developing economies around the
world, where an ample labor force is available at a reasonably
low cost, is completely different. The standards fixed for
the maximum weight of lift, in most of the cases, are not
updated according to the results of studies in this field.
Thus, the workers are exposed to the risk of back injury
which, mostly, are unnoticed for compensation purposes.

41In addition to combined MMH activities involving only
lifting, carrying, lowering, pushing, pulling etc., realistic industrial ' scenarios include specific upper-extremity
activities to be performed by workers simultaneously or in
sequence to the MMH activities. For instance, rice milling
plants in the third-world countries require such activities as
carrying the paddy in sacks to a platform for drying, lifting
the sacks, carrying them to the parboiling tanks, dumping into
the tanks, and opening the steam valves. This whole process
involves upper extremities work in addition to material
handling activities. This additional work may have a bearing
on the amount of weight the worker could tolerate lifting
safely. Similarly, steel furniture manufacturing industries
require that cold rolled sheets be lifted, carried to the
worksite, and lowered, and shearing, bending or forming
operations be performed on these sheets. These tasks would
add stress to various parts of the body of workers.
Therefore, it is postulated that stress to upper-extremities may affect MAWOL.
The major objectives of this study are:
1. To establish using the psychophysical methodology,
whether or not, combined manual materials handling task
involving upper-extremity activity is a limiting factor on
maximum acceptable weight of lift.
2. To determine values of maximum acceptable weight of lift for simulated lifting, carrying, combination of lifting

and ( carrying, and combined manual materials handling
activities involving the upper extremity and compare to see if any relation existed between them.
3. To estimate the energy consumption during simulated lifting, carrying, and shearing activities and compare the
results with that of combined manual materials handling task involving upper extremity.
. 42
i,

43
CHAPTER 4
METHODS AND PROCEDURE
Subjects
Eight male students of Montana State University were
randomly selected as subjects for this study. The sample size
was determined on the basis of previous studies using similar
criteria and protocol for the experiment. The subjects were
so chosen that they were free from back pain and any type of
musculoskeletal abnormalities. Each subject was thoroughly
familiarized with the experimental procedure, before
commencing on the data collection. Consent was duly obtained
from each subject, through signing of the consent form.
Equipment
Sensormedics Metabolic Cart
This equipment (Fig. 2), manufactured by Sensormedics
Corporation, analyzes oxygen consumption by a Zirconium oxygen
analyzer. The 2900c Sensormedics Metabolic Measurement Cart,
available for experiment provides the following testing options:

44Breath-By-Breath, Non-invasive Computer Assisted
Anaerobic Threshold (AT) Detection, Automatic Maximum Oxygen
Uptake (VO2 Max) Analysis, Indirect Calorimetry, and Automated
interpretation of test data. Testing mode technology can be
selected from these as required by the experiment. The
Metabolic Measurement Cart provides analysis of inhaled and
exhaled respiratory gases. This analysis can be used to
measure the energy expenditure of the body.
I . Com puter Disk Drive "A"Z Com puter Pow er Switch I Patient Valve Assembly 4. Sample Flow m eter, C 0 2
Scrubber. Inspiratory sample line BxB Cal port and Sample line Barb.
Figure 2. Metabolic Measurement Cart

45Indirect calorimetry option of the Cart gives the
measurement of respiratory gas exchange to assess the body's energy expenditure.
The subjects were hooked up to this equipment during lifting task only and energy expended by the body during the task was monitored.
LIDO Workset
This equipment (Fig. 3), manufactured by Loredan
Biomedical, Inc., is designed to provide functional testing
and rehabilitation in a single device. This equipment utilizes
variety of attachments for simulating multiple exercise modes,
high static and dynamic torque, and sensitive minimal torque.
It can simulate diverse job tasks and daily activities.
Figure 3. LIDO Workset System

46• This workset offers simulation, isokinetic, and isometric
exercise types with concentric, eccentric, and continuous passive motion modes. These modes, plus the simulation functions of ramp up, ramp down, ramp up/down, and breakaway,
provide various biomechanical models for real-world
situations. There are high torque and low torque tool attachments.
Dynamic torque can be set as high as 120 ft-lb (162Nm)
and static torque can be set to 150 ft-lb (202.5Nm) to allow
practical testing of maximum strength of strong subjects.
Similarly, weak subjects can also be tested and rehabilitated
because the workset allows measurements as small as 4 in-oz with 2 in-oz resolution.
The workset has the capability of generating full
documentation of subject performance including average and
peak power or torque, average work, total work, and average
range of motion. It also calculates the coefficient of
variation and fatigue index that can help assess the subject's
effort. Bilateral summary reports and progress reports
provide side-to-side and test-to-test comparison information.
This equipment was used in this study to simulate the
sheet metal shearing operations. The subjects, after
performing lifting and carrying operations, performed
simulated sheet metal shearing operations at a representative
torque value of 4.16 Kg-m (30 ft-lb) for 4 or 2 cycles
corresponding to the frequency of handling of 2 or 4 per

47minute and went back to repeat the cycle. The energy consumed
and power required to perform the operation are given by the output from the system computer.
Polar Vantage XL Heart Rate Monitor
The monitor (Fig. 4), manufactured by Polar USA, Inc., consists of a chest band, in combination with a
sensor/transmitter, which, when strapped around the subject's
chest, transmits the heart rate of the subject during workouts
to the wrist monitor. The wrist monitor displays the heart
rate at any particular moment and also has the capability of
storing the heart rate data at predetermined intervals. The
three intervals provided in the monitor are 5 seconds, 15
seconds and 60 seconds. If the heart rate is required at any
desired time it can be instantly read from the monitor screen.
Chest BandLock system for adjusting the belt length
O
Wrist Monitor
Three line display
Conductive electrodes inside the Chest Band
Sensor/Transmitter Casing tor transmitterelectronics and battery
O
• Select *
'Signal *
Selection status line
Chest strap connectors Z
Figure 4. Polar Heart Rate Monitor Components

48The heart rate monitor was used to measure the heart
rate of the subjects during each of the experiments. The increase in heart rate during an experiment over resting heart
rate value was used to estimate the energy expended
(I work kcal/minute = 10 work pulse) during the experiment.
Anthropometric, Measurement Kit
"TTM" Martin's Human Body Measuring Kit is a set of
measurement instruments designed for making objective and quantitative measurements on the sizes and forms of various
parts of the human body.
The kit essentially consists of instruments for
measurement on distances in straight lines, on curves and
circumferences, on thickness,, on weight, angle, volume and
center of gravity. The kit was used in the study for
measuring the body height, knuckle height, and shoulder
height of the subjects.
Frequency Counter
This is a device which, when set to a required frequency,
will signal the subject, through an electronically produced
auditory signal, to start the experiment. This eliminates the
possible human error in reading the clock and signalling the
subject to start the experiment. This device was used in the
study to control the frequencies of handling of various tasks.

Ii IL
•49Familiarization Period
The subjects were familiarized with the experimental
conditions and procedures. The objective of the
familiarization period was to: (I) allow the subjects tobecome familiar with the use of equipment; (2) train the
subjects in the method of psychophysical adjustment; (3) tone the forearm and shoulder muscle groups by performing the
simulated sheet metal shearing tasks; and (4) increase
cooperation and understanding between subject and the
experimenter. The familiarization period lasted for one hour
and included screening and introduction session and one training session.
Procedure
Required anthropometric measurements; stature, knuckle
height and shoulder height and physiological data for each
subject were collected. The MAWOL for each of the subjects
was determined using psychophysical methodology. In order to
make sure that each subject received the same instructions for
the experiment, written as well as oral instructions were provided. ' .!
Psychophysical Measurement
The following experiments were conducted to collect
various psychophysical data required for the determination ofMAWOL:

50
Lifting: A vertical distance of lift of 76 cm from the
floor (floor to knuckle) was used as height of. lift for frequencies of 2 and 4 lifts per minute for the simulated
lifting activity. Frequency for the experiment was controlled
by a frequency counter device. For each frequency, one experiment, starting with heavy or light load depending upon
a randomization procedure was conducted. The experiment
consisted of two bouts. The first was an adjustment bout
lasting 2 0 minutes and the next was a steady-state bout
lasting 5 minutes. During the course of the adjustment bout,
the subjects were told to lift a tote box (54 cm long, i .e .,
distance between two hands; 39 cm wide, i .e ., distance along
the sagittal plane) with handles, at predetermined frequency
and adjust the load in the box "(increase or decrease from the
initial load depending on whether the initial load was light
or heavy), until they felt confident of handling the load for
a period of 8 hrs, with the provision of normal breaks during
the shift work, without feeling unduly strained or overexerted
or overexhausted. With the load adjusted in 20 minutes, the
subjects were told to continue lifting for 5 more minutes.
The oxygen consumption and heart rate measurements were taken
during the experiment. The order of performing the operation
was randomized. The final adjusted values of the load for
each of the two experiments were then recorded as the maximum
acceptable weight of handling for the experiment for the
frequency at which the experiment was conducted.

51Carrying: Two frequencies of carrying 2 and 4 per minute
to a distance of 210 cm were utilized. The subjects picked up
tote box (the same box used in the lifting experiment)
containing lead shots from a height of 76 cm, carried it to a
distance of 210 cm, and placed it on a table 76 cm in height.
The next cycle consisted .of carrying the tote box back to its original place. There was no lifting involved in this experiment'. The order of operation was randomized. Heavy or
light loads were used at random as in lifting experiment, and
the subjects were told to adjust load (increase or decrease
according to whether the initial load was light or heavy) for
a period of 20 minutes, to the value, which they felt confident
of handling for a period of 8 hrs without feeling unduly tired
or exhausted. The subjects continued carrying the adjusted
load for 5 more minutes. Thus each experiment consisted of 25
minutes (20 minutes of adjustment bout and 5 minutes of
steady-state bout) for each frequency. The final adjusted
load at the end of each experiment was recorded as the maximum
acceptable weight of handling for the frequency of handling.
Combined Lifting and Carrying: Combined lifting and
carrying tasks were simulated by combining the individual
lifting and carrying experiments as previously performed at
two predetermined frequencies of 2 and 4 handlings per minute.
The subjects lifted a tote box (same box used in the previous
experiments) from floor to a height of 76 cm, carried it to a
distance of 210 cm, and placed on a table 76 cm high. The
52experiment was performed for 25 minutes; 20 minutes of
adjustment bout and 5 minutes of steady-state bout. The final
adjusted value of the load was recorded as MAWOL. Heart rate
measurements were taken during the experiment.
Simulated combined activities: , The simulated combined
activity consisted of lifting through a vertical distance of
76 cm (floor to knuckle) , carrying at knuckle height to. a
distance of 210 cm, and performing shearing operation. The
sequence of operations (lifting, carrying, and shearing) was
performed at frequencies, of 2 and 4 per minute. The shearing
operation was simulated on LIDO Workset ̂ for 20 sec and 10 sec
for the two frequencies of handling of 2 and 4 per minute
respectively with a force of 6.82 Kg (15 lb), velocity .limit
of 45 degree/sec. Range of motion of 75 degrees, moment arm of
61 cm (24 in), and the axis of rotation being 137 cm (54 in)
from the floor. The subjects lifted a tote box (the same box
used in the previous experiments) from floor to a height of 76,
cm, carried the box at that height to a distance of 210 cm,
placed - it on a table of 7 6 cm height, and performed a
simulated shearing task with the set parameters on LIDO
Workset and returned to the original place without the load.
This cycle was repeated at predetermined frequency for 20
minutes during which they adjusted the load to MAWOL and
continued to perform for 5 more minutes as in the previous
experiments. Heart rate measurements were taken during this
experiment.

53The combined manual materials handling task simulated in
the experiment is the task of shearing sheet metal sheets to
different sizes required to manufacture various types of steel furniture.
The protocol for the experiment has been given in Table2 .
Table 2. Protocol of Experiments.Task Height of lift Distance Freqcm cm. 1/minLifting(L) Floor-Knuckle 76 2Lifting(L) Floor-Knuckle 76 4Carrying(C) Knuckle Height 210 2Carrying(C) Knuckle Height 210 4L + C Lift to knuckle 76 2
ht. and carry 210L + C Lift to knuckle 76 4
ht. and carry 210L + C + S Lift, Carry and 76 2
sheet metal 210shearing 4.16 Kg-m (30 ft-lb)
L + C + S Lift, Carry and 76 . 4sheet metal 210shearing ' 4.16 Kg-m (30 ft-lb)•I
Note:L : Lifting C : CarryingL+C: Lifting + CarryingL+C+S: Lifting + Carrying + sheet metal ShearingS : 20 & 10 sec for 2 & 4 lifts/min. at a Torque of 4.16 Kg-m.
(4 cycles corresponding to 2/min and 2 cycles corresponding to 4/min.)

54Physiological measurements:
During the performance of the individual lifting task, oxygen consumption and the heart rate were monitored by using
a Metabolic Measurement Cart and a Heart rate monitor. These values were used for the evaluation and comparison of the energy required to perform the individual tasks as well as the
combined task.
Experimental Design
A randomized block design with factorial treatment
combinations with subjects as blocks and experiments as
treatments was used for analyzing the data.
Randomization of the sequence of experiments for the
subjects was done on the basis of the randomization table
developed for the purpose (Table 3).
Table 3. Randomization Table.Random Sequence of Experiment for Subjects
SUBJECT #Task No. I II III IV V VI VII VIIIL2 I 4 6 8 7 2 3 5 SL4 2 3 4 2 3 5 4 6 2C2 3 8 8 4 I 6 7 3 7C4 4 7 2 5 4 4 5 I 3LC2 5 2 I I 5 I 8 2 8LC 4 6 5 3 3 2 8 6 7 ILCS2 7 I 5 7 8 7 2 4 6LCS4 8 6 7 6 6 3 I 8 4
Note:L2: Lifting task at 2 handlings/minuteL4: Lifting task at 4 handlings/minuteC2: Carrying task at 2 handlings/minute

5 5
C4: Carrying task at 4 handlings/minuteLC2: Lifting + Carrying task at 2 handlings/minuteLC4: Lifting + Carrying task at 4 handlings/minuteLCS2: Combination of Lifting, Carrying, and Shearing tasks at 2
handlings/minuteLCS4: Combination of Lifting, Carrying, and Shearing tasks at 4
handlings/minute
Tasks were assigned numbers from I to 8, as in the second column of Table 3. Random numbers were generated in sequence
for each subject and task corresponding to the random number
assigned for the subject, thus generating the sequence of
tasks for each subject.
Three independent and two dependent variables were
considered for the experiment. Table 4 provides information
on independent, dependent, and controlled variables used in
the study.
Table 4. Independent, Dependent, and Controlled Variables.Class Variable
Independent * Subject (block)* Type of task (4 levels)(factor)* Frequency of handling I factor) (2 and 4 handling/min)
Dependent * MAWOL* Steady-state heart rate (SSHR) (B/min)* Estimated energy expenditure(Kcal/min)- calculated as a function of SSHR
Controlled * Population (college students)* Sex (male)* Age (college going age)* Handles (with handles)* Box size (fixed)* Lifting technique (free style)* Carrying distance (210 cm)* Height of lift (76 cm)* Environment(Temp. 20-24°C and R.H. 45-55%)
Sharp and Legg (1988) and Legg and Myles (1985) showed
that alternating starting load of lift between heavy and light
had no significant effect on MAWOL values determined with

56psychophysical method of adjustment. Hence, the starting load was not considered as a factor in this study.
A two-way analysis of variance (ANOVA) method was used
for the analysis of the data collected from the experiments.
Table 5. Experimental Design Layout for MAWOL, MHR and Estimated Energy Expenditure.
Subject (S)
Task(T)I 2 '3 4
Freouencv(F) Freouencv(F) Freouencv(F) Freouencv(F)1 2 1 2 1 2 1 2
I2345678
The models for the analysis of the experimental data were:
MAWOLijk = (0. + Ti + Fj + TFij + Sk + Eklijl
SSHRijk = |i + Ti + Fj + TFij + Sk,n + W1 + Eklij,, here, weight
is a random factor nested in subject. But subject, not being
the main effect, Sklll and W1 will be combined into a composite
blocking effect Sk reducing the model to,
SSHRijk = |J. + Ti + Fj + TFij + Sk + Eklijl
for i = 4 (no. of tasks), j = 2 (no. of frequency
levels), and k = 8 (no. of subjects).
|l = grand mean,
Ti = effect of the ith task,
Fj = effect of the jth frequency.

57Sk = effect of the kth block, and
Ek(ij) = values of independent, normally distributed random variables having zero means and common variance O2.
Energy expenditure.values corresponding to each task were •estimated on the basis of work-pulse (MHR - Resting heart
rate), I Kcal'/min being equivalent ‘ to 10 work-pulses. Therefore, no model was necessary for estimated energy expenditure.
Hypotheses Testing;
The following hypotheses were tested for determining
whether task, frequency of handling, interaction between task
and frequency and blocking effect had any effect on MAWOL and MHR:
Main Effects:
H0: Ti = 0 for all i,
H1: Ti # 0 for at least some i,
Critical region: reject H0 at level a = 0.05
if F > Fa(V1, V2) where, V1 and V2 are degrees of freedom.H0: Jtj Ii 0 for all j.H1: Fj * 0 for at least some j
Critical region: reject H0 at level a = 0.05
if F > F0Jv1, V2) where V1 and V2 are degrees of freedom.
Interaction Effect:
H0: TFij = 0 for all i and j,
H1: TFij ^ 0 for at least. some i ,j

58
Critical region: reject H0 at level a = 0.05
if F > Fa(Vl7V2) where V1 and V2 are degrees of freedom.Blocking Effect:
H0: Sk = 0 for all k,
H1: Sk ^ 0 for at least some k,
Critical region: reject H0 at level a = 0.05
if F > Fa(Vl7V2) where V1 and V2 are degrees of freedom.

I
CHAPTER 5
RESULTS AND DISCUSSION
Results of various experiments conducted during the study have been presented in this chapter. Data collected from the
experiments were analyzed using a statistical software
package, SYSTAT, on a PC at Montana State University. Table
5 provides descriptive statistics for the subject population
used in the study. The following discussion is based on ther
objectives of the study as stated in chapter 3 of this report.
Population Sample
Table 6 gives the descriptive statistics of the subject
sample involved in the experiments related to the study. Mean
values of body height, body weight, knuckle height and
shoulder height measurements of the subjects were calculated.
Corresponding values of anthropometric estimates for U.S.
adult males (Pheasant, S., 1986 and .Woodson, et al., 1992)
were obtained (Table 7). Hypotheses testing concerning one
mean for sample size less than 30 was performed to determine
if the population mean assumed for subject sample used for the
study was identical to that of the U.S. male population at
large.
59

60The following statistic was used for hypothesis testing:
t X - V 0s/sfn
where,
X = mean of the anthropometric measures of subject sample,
M-o = corresponding average value for U.S. adult males, s = standard deviation of measures of subject sample,
and n = sample size.
H0: M = M-O and
Hi: M * MoCritical region: Reject H0 for level a = 0.05
if t > t0.05,(7)
Table 6. Descriptive Statistics for Subject Sample.AGE HEIGHT WEIGHT KNUHT SHOUHT
No. of Cases 8 8 8 8 8Minimum 19 172 65.91 72 146Maximum 27 185.42 96.36 82.5 154Range 8 13.42 30.45 10.5 8Mean 22 179.92 78.95 76.19 150.63Std. Dev. 2.73 4.12 10.5 3.40 3.07
Note:Height was measured in cmWeight was measured in KgKNUHT : Knuckle Height measured in cmSHOUHT : Shoulder Height measured in cm
The results of the test of hypotheses indicate that the
body height of the subject population was significantly
greater (179.9 cm vs 175.5) than the average estimated value
for U.S. adult male population. Similarly, shoulder height of

61the subject population was significantly higher (150.6 cm vs
144 cm) than the corresponding average, estimated value for
the U.S.- adult male population. This was to be expected,
since shoulder height is proportionately related to the body height.
However, body weight and knuckle height of the subject
population was not significantly different (78.95 kg vs 76.36
kg and 76.19 cm vs 76.5 cm) from those of U.S. adult males.
Knuckle height and body weight are the two main variables in
determining the lifting capacity of a person. All the tasks
were performed at knuckle height, and mean knuckle height was
not significantly different from that of the U.S. population.
Therefore, the subject population can be assumed to be a
representative of the population at large.
Table 7, Statistical Values of Anthropometric Measures.Measure Sample SD(S) Pop(H) t Df ProbMean Body Height (cm)
179.9 4.12 175.5 3.055 7 .018
Mean Body Weight (Kg)
78.95 10.5 76.36 .764 7 .470
Mean Knuckle Ht. (cm)
76.19 3.40 76.50 -.26 7 .802
Mean Shoulder Ht. (cm)
150.6 3.07 144.0 6.108 7 0.00
Table 8. Values of MAWOL for Subject Sample, Average U.S. Industrial Workers and t-statistic.Measure Sub. Pop. STD t Df Prob.MAWOL (Kg) for Lifting at 4/min. 17.6 22 5.9 -2.11 7 .0386
MAWOL (Kg) for Carrying at 4/min.
20 27 20 -2.54 7 .0209

62
Table 8 shows the values of MAWOL for the subject
population and average U. S . industrial worker population (Mital, et al. , 1993) and the result of t-statistic calculated
to test whether there was a significant difference between the
subject population and the U.S. industrial worker population
at large. The average values for lifting at knuckle height and
carrying at a frequency of 4/minute for U.S. industrial
workers were taken for the'purpose of analysis. The result of
the test and quantitative values of MAWOL for the two groups
show that the values for industrial workers were significantly
higher than those for the subject (student) population (22 andt
27 vs 17.6 and 20 for lifting and carrying respectively) . The
purpose of testing significance for the subject population
with the population means was to check for potential bias in
ergonomic results which are correlated with anthropometry.
Moreover, the major objective of the research was to determine
if an upper-extremity activity had any effect on MAWOL in
combined manual materials handling task and not to prepare
guideline or design workload. Based on all the anthropometric
measures and MAWOL values for the subject population there was
no reason to suspect any real bias.
Diagnostics and Residual Analysis
Before proceeding on with analysis of the collected data,
residual analysis was done to see if there was any outlier in
the collected data which could possibly affect the results of

63analysis. Table 9 provides the summary of diagnostics test:
Table 9. Results of Diagnostics TestVariable OutliertCase No.) Measured Value Studentized
ResidualMAWOL (Kg) 12 37 2.922
31 35 2.987Steady-stsate HR (B/min.)
4 136.2 2.730
36 87.6 -3.18243 136.2 4.600
Est. Energy Expenditure IKcal/m)
43 6.12 3.329
55 7.36 2.935
The plot of studentized residuals against estimates
(Appendix D : Fig.7-9) showed that steady-state heart rate
values for case 36 and 43 were outside the horizontal band
within 3 units around zero. The cause of the values outside
the control limits might have been recording error from the
heart rate monitor or consumption, by the subject, of certain
cold drinks which would elevate heart rate within certain time
duration. The estimated energy value for task being dependent
upon the heart rate, case 43 value for estimated energy
expenditure was expected. The final analysis of the collected
data was performed with the outlier values for the mean heart
rate (values for case no. 3 6 and 43) and estimated energy
expenditure (value for case no. 43) removed. Removal of
outliers will not require modification to the model or
additional analysis due to the lack of an interaction effect
and recommendations of Milliken and Johnson (1984).

64Table 10 provides the descriptive statistics of MAWOL
values for the subjects as determined from the four different
types of tasks performed at the two different frequencies.
Table 10. Descriptive Statistics of MAWOL (Kg) for Different Tasks
TasksL2 L4 C2 C4 LC2 LC4 LCS2 LCS4
No. of Cases 8 8 8 8 8 8 8 8Minimum 12 11 14.5 13 9 9.5 10 8.5Maximum 30 28.5 38.5 37 26 24 35 24Range 18 17.5 24 24 17 14.5 25 15.5Mean 20.4 17.6 23.2 20 18.5 15.9 18.9 14.4Std. Dev. 6.4 5.9 8.6 7.8 5.8 5.1 8.9 5.1
Cursory glance at the table indicates that the mean
values of MAWOL is higher for lower frequencies and lower for
higher frequencies.
The mean MAWOL values for combined lifting and carrying
(LCi) and combined lifting, carrying and shearing (LCSi) tasks
appear to be nearer to the value for individual lifting task
(Li) .
Table 11. Descriptive Statistics for Steady-state Heart Rate (Beats/min.)
TasksL2 L4 C2 C4 LC2 LC 4 LCS2 LCS4
No.of Cases
8 8 8 8 8 8 8 8
Min. 87.8 94 78.6 87.6 77.6 77.6 79.6 91.4Max. 125.6 136.2 136.2 136.2 116.8 144.8 137.8 144.4Range 37.8 42.2 57.6 48.6 39.2 67.2 58.2 53Mean 98.9 113.9 92.7 96.2 91.4 108.8 107.5 112.1STD. 11.8 16.4 13.9 5.9 11.5 20.9 18.1 16.7

65
Table 12. Descriptive Statistics of Estimated Metabolic Energy Expenditure (Kcal/min.)
TasksL2 L4 C2 C4 LC2 LC4 LCS2 LCS4
No. of Cases * . 8 8 8 8. 8 8Minimum ■ 0.66 1.26 0.36 0.96 0.94 1.14Maximum 55. ■ 6.12 5.42 4.88 6.88 7.36 7.34Range S Si 5.46 4.16 4.52 5.92 6.42 6.2Mean 2.27 2.67 1.55 3.25 3.57 3.48Std. Dev. 2.1 1.44 1.46 1.92 2.41 1.87
The bold figures in the shaded cells are based on the energy values obtained from metabolic cart and the rest were estimated using work-pulse values.Note (for Tables 9,10 and 11):L2 : Lifting at 2/min.L4 : Lifting at 4/min.C2 : Carrying at 2/min.C4 : Carrying at 4/min.LC2 : Combined Lifting and Carrying at 2/min.LC4 : Combined Lifting and Carrying at 4/min.LCS2: Combined Lifting, Carrying and Shearing at 2/min.LCS4: Combined Lifting, Carrying and Shearing at 4/min.
Tables 11 and 12 provide descriptive statistics of
steady-state heart rate (b/min.) and the estimated energy
expenditure (Kcal/min.) during the performance of the tasks at
two different frequencies of 2 and 4/min.
Figures 5 and 6 represent graphically the values of MAWOL
(Kg) and work-pulse (elevation of heart rate above resting
level) for different tasks at two different frequencies.

MA
WO
L (
Kg)
6 6
FIGURE 5
25
20
15
10
5
0
MAWOL for Different TasksAt Frequencies of 2 and 4/min.
Note:L : Lifting Task C : Carrying TaskLC : Combined Lifting and Carrying TaskLCS : Combined Lifting, Carrying and Shearing Task
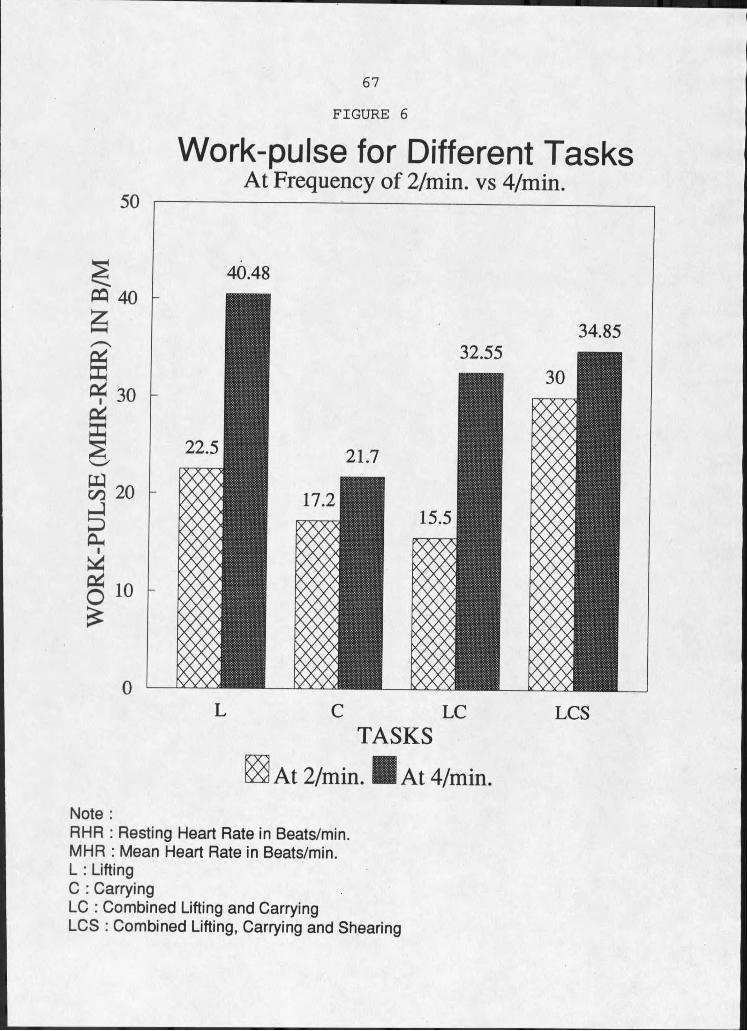
WO
RK
-PU
LSE
(MH
R-R
HR
) IN
B/M
67FIGURE 6
50
40
30
20
10
0
Work-pulse for Different TasksAt Frequency of 2/min. vs 4/min.
L C LC LCSTASKS
t 2/min. At 4/min.Note :RHR : Resting Heart Rate in Beats/min.MHR : Mean Heart Rate in Beats/min.L : Lifting C : CarryingLC : Combined Lifting and CarryingLCS : Combined Lifting, Carrying and Shearing

68Analysis of Variance (ANOVA)
Table 13 provides ANOVA summary for MAWOL. According to
the summary, BLOCK, Task and frequency of handling have
significant effect on the value of MAWOL. Since randomvariability among the subjects is expected, a completely
randomized block design with subjects as blocks was used to
analyze the main effects.
Table 13. ANOVA Summary for MAWOLModel Variables S = Subject T = Task F = FrequencyMAWOL = Maximum Acceptable Weight of Lift Categorical Variables STFModel MAWOL = CONSTANT + Ti + Fj + TFij + Sk + Eklijl Levels EncounteredS = 8 T = 4 F = 2
Analysis of VarianceSource SS DF MS F-Ratio PBLOCK 2047.75 7 292.536 25.12 0.00'Task 234.969 3 78.323 6.726 0.001'Frequency 169 I 169 14.512 g
Task'Frequency 9.156 3 3.052 0.262 0.852Error 570.625 49 11.645
* Statistically significant at a = 0.05.Task had significant effect on the value of MAWOL.
Frequency, also had significant effect on the value of
MAWOL for different Task. This verifies the cursory glance
inference on Table 8 and also corresponds to the results of
previous researchers that MAWOL values are inversely
proportional to the frequency of handling (Ayoub, 1977; Garg,
et al., 1979) . The interaction between task and frequency did

69not have a significant effect on MAWOL.
Table 14 provides the summary of ANOVA for Steady State
Heart Rate. The probability figures in the summary report
indicate that Block, Task and Frequency had significant effect
on Mean Heart Rate whereas Task and interaction between Task
and Frequency did not have significant effect on Mean Heart Rate.
Table 14. ANOVA Summary for Steady State HR (B/min.)Model VariablesS = Subject T = Task F = FrequencySSHR = Steady State Heart Rate Categorical Variables STFModel SSHR = CONSTANT + T1 + F, + TF11 + Slt + EklljlLevels EncounteredS = 8 T = 4 F = 2 Analysis of VarianceSource SS DF MS F-Ratio PBLOCK 8224.018 7 1174.860 10.171 0.000*Task 1276.093 3 425.364 3.682 0.018*Frequency 2747.760 I 2747.760 23.788 0.000*Task * Frequency 416.722 3 138.907 1.203 0.319Error 5429.076 47 115.512
* Statistically significant at a = 0.05.
Table 15. ANOVA Summary for Estimated Energy Expenditure (Kcal/min.)Source SS DF MS F-Ratio PBLOCK 53.381 7 7.626 3.426 0.005*Task 26.880 3 8.960 4.026 0.012*Frequency 17.381 I 17.381 7.809 0.007*Task * Frequency 7.652 3 2.551 1.146 0.340Error 106.833 48 2.226
* Statistically significant at a = 0.05.

70Table 15 provides the summary of ANOVA for estimated
Energy consumption in Kcal/minute during the performance of
various Tasks. Probability figures in the summary report show
that Block, Task and Frequency had significant effect on
estimated energy consumption, while Task and interaction
between Task and Frequency did not have significant effect. The result corresponded with the results of the effect of
independent variables upon steady-state heart rate due to the
fact that energy expenditure was estimated on the basis of
steady-state heart rate.
Post Hoc Tests (Tukev's Test)
Post Hoc Test of Tasks on MAWOL
Since ANOVA summary on MAWOL (Table 13) showed that task
and frequency had significant effect on MAWOL, steady state
heart rate and estimated energy expenditure it was necessary
to determine the nature of these relationships. Tukey's test,
which gives the matrix of pairwise comparison probabilities,
was used to determine these relationships.: Table 16 gives the
result of post hoc test of task on MAWOL. Matrix of pairwise
comparison probabilities and Table 9 show that values of
MAWOL for combined lifting and carrying and combined lifting,
carrying and shearing tasks were significantly lower than
those from carrying task alone (Mean values of 18.5, 15.9 and
18.9, 14.4 vs 23.2, 20 for Frequencies of 2 and 4/min.,
respectively). All other Tasks were not significantly
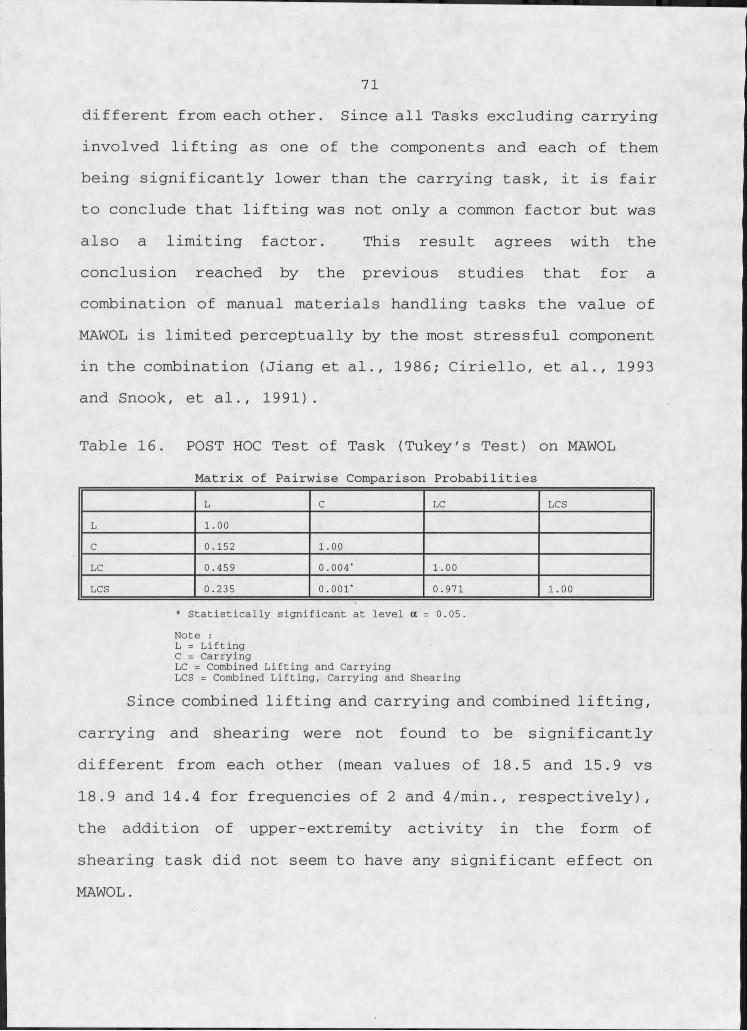
71different from each other. Since all Tasks excluding carrying
involved lifting as one of the components and each of them
being significantly lower than the carrying task, it is fair
to conclude that lifting was not only a common factor but was
also a limiting factor. This result agrees with the
conclusion reached by the previous studies that for a combination of manual materials handling tasks the value of
MAWOL is limited perceptually by the most stressful component
in the combination (Jiang et al. , 1986; Ciriello, et al., 1993
and Snook, et al., 1991) .
Table 16. POST HOC Test of Task (Tukey's Test) on MAWOL
Matrix of Pairwise Comparison ProbabilitiesL C LC LCS
L 1.00C 0.152 1.00LC 0.459 0.004" 1.00LCS 0.235 0.001" 0.971 1.00
* Statistically significant at level a = 0.05.Note :L = Lifting C = CarryingLC = Combined Lifting and CarryingLCS = Combined Lifting, Carrying and Shearing
Since combined lifting and carrying and combined lifting,
carrying and shearing were not found to be significantly
different from each other (mean values of 18.5 and 15.9 vs
18.9 and 14.4 for frequencies of 2 and 4/min., respectively),
the addition of upper-extremity activity in the form of
shearing task did not seem to have any significant effect on
MAWOL.

72Similarly probability figures for the test of Frequency
on MAWOL show that the values of MAWOL for the two frequencies were significantly different from each other. Table 8
quantitatively justifies this inference and also shows that
the values of MAWOL were higher at lower frequencies and lower
at higher frequencies (mean values of 20.4 vs 17.6 for
lifting; 23.2 vs 20 for carrying; 18.5 vs 15.9 for combined
lifting and carrying; and 18.9 vs 14.4 for combined lifting,
carrying and shearing for frequencies of 2 and 4/min.,
respectively). These results agree with the conclusion of the
researchers (Ayoub, 1977 and Garg, et al., 1979).
Table 17. Tukey's Test of Task on Steady-state Heart RateMatrix of Pairwise Comparison ProbabilitiesL C LC LCS
L 1.000C 0.215 1.000LC 0.343 0.986 1.000LCS 0.813 0.034* 0.062 1.000
* Statistically significant at level a = 0.05.
Post Hoc Test of Task on Steady-state Heart Rate
ANOVA summary (Table 14) showed that task had significant
effect on the steady-state Heart Rate. Tukey's test of Task
on steady-state Heart Rate (Table 17) and Frequency show that
combined lifting, carrying and shearing task was significantly
higher (107.5 and 112.1 vs 92.7 and 96.2 at frequencies of 2
and 4 per minute, respectively) than the individual carrying
task. Tukey's test of Frequency on steady-state Heart Rate

73show that the values of heart rates at higher frequency were
higher than those at lower frequencies(98.95, 92.743, 91.350> 107.525 vs 113.975, 96.2, 108.775, 112.125 for lifting,
carrying, combined lifting and carrying and combined lifting,
carrying and shearing tasks at frequencies of 2 and 4/min., respectively).
Post Hoc Test of Task on Estimated Energy expenditure
Table 18 shows that the carrying task had significantly
lower energy expenditure than lifting task (2.27 and 2.67 vs
2.85 and 4.33 for lifting and carrying at frequencies of 2 and
4 per minute, respectively). Similarly, the values of energy
expenditure were significantly lower for lower frequency than
for higher frequency (2.85, 2.27, 1.55, and 3.57 vs 4.33,
2.67, 3.25, and 3.48 for the tasks at frequencies of 2 and 4
per minute, respectively).
Estimated energy expenditure values for tasks were higher
for higher frequency than those at lower frequency. However,
the mean energy expenditure value for combined lifting,
carrying and shearing task was lower for higher frequency than
that for lower frequency. The reason for this was because of
the involvement of more number of cycles of shearing task at
lower frequency for the combined task. Four cycles of
shearing operation was simulated for a frequency of 2/min. for
the combined task while only two cycles of shearing operation
was simulated - corresponding to a frequency of 4/min. for the
combined task. This is justified by the value of power output

74data (Table 18) obtained from the LIDO Workset.
Table 18. Power Output Values (Kg-m/sec.) from LIDOSubject LCS2 LCS4I 5.54 4.852 11.36 10.673 5.82 4.164 8.17 8.455 14.69 5.826 6.10 9.977 10.25 9.428 9.00 7.48Mean 8.87 7.6
Pearson Correlation (Pairwise)
Correlation between Frequency and MAWOL and between
steady-state Heart Rate and MAWOL was found to be negative
(-0.236 and -0.152, respectively) while the correlation
between Frequency and Steady-state Heart Rate was found to be
positive (0.291) .
Comparison of Results
Due to variations in the protocol used by different
researchers, it is not possible to compare the results of this
study in particular to any one result from previous studies.
However, the frequencies of lift and height range of lift
being the same, the results of MAWOL values from the study
conducted by Fernandez, et al. , (1988) have been taken to
compare with the results of lifting task at a frequency of 2

75per minute of this study. Table 19 gives the values of MAWOL
from the previous study and this study.
Tablel9. MAWOL Values from Previous Study and Present Study(Kg) .
Frequencyllft/mln
MAWOL (Kg) Sample Slze(n) Std. Dev. (S)
Fernandez(1988) 2 24.21 kg (53.75 lbs) 12 5.97 kg (13.14
lbs)Present Study 2 20.4 kg 8 6.4 kg
Testing of two means
Kq : Ul - Uz H1: Ui — UzLevel of significance: a = 0.05
Criteron: reject H0 if t > t.025-18 or t < -t.025(18
where.
(X1-Z2) -6\J (JI1-I) Si + (̂ z2-I) S22 ^
Ii1Xn2 ( H ^ n 2-Z) In1̂ n2)
Calculation: Substituting the corresponding values in the
above equation, t = 3.454 which is greater than 2.101 the
value corresponding to t .Q25lI8
Decision: Since t = 3.454 exceeds the value 2.101, H0
must be rejected at level a = 0.05. Thus MAWOL values
for the two samples are not the same.

76
CHAPTER 6
CONCLUSIONS AND, RECOMMENDATIONS
Conclusions
The following are the conclusions derived in terms of
objectives of this study:
1 . The shearing activity involving the upper-extremity
is not a limiting factor on maximum acceptable weight of lift
in combined manual, materials handling task. At this time,
therq is no reason to suspect that MAWOL values would need to
be adjusted for upper-extremity activities.
2. The values of maximum acceptable weight of lift for
different tasks showed that frequency was an important factor
in determining the MAWOL with the, psychophysical approach.
MAWOL values' are inversely proportional to frequency of
handling. This result agreed with the conclusion arrived at
from previous studies (Ayoub, 1977 and Garg, et al., 1979) .
3. Among the Tasks involving lifting, lifting is a
limiting factor on the value of MAWOL. The value of MAWOL for
all combinations examined is nearer to the value of MAWOL for
individual lifting alone under ' the same experimental
conditions. This agrees with the result of study on the

11
77
effect of combined manual materials handling activities on the capacity of workers by Jiang, et al., 1986.
4. Estimated energy expenditure varied with the change
in frequency of handling. The mean value of estimated energy-
expenditure for individual task is more for higher frequency
than for lower frequency. The exception to this, according to
the result of analysis, is the values of energy consumption
for combination of lifting, carrying and shearing, in which
case it was lower at lower frequency. The reason for this is
the involvement of four cycles of shearing activity in the
combination with frequency of 2/min and 2 cycles of shearing
in the combination with frequency of 4/min. Thus the
combination with lower frequency had lower value for the
estimated energy consumption. ■
5. The energy consumption for the combination of
activities is not equal to the sum total of the energy
required by the individual components in the combination.
Recommendations for Future Research
I. This study, being the first of its kind, used one
specific type of upper-extremity task for the analysis. The
results of this study may not be applicable to all types of
upper-extremity activity. Hence, research should be continued
to study other upper-extremity tasks and compare the results
to determine if any type of locally stressful upper-extremity
activity is insignificant to the value of MAWOL.

782. This study utilized the change in the heart rate
above the resting heart rate level of an individual to assess
the physiological stress during the performance of .a task.
Though the results obtained have been consistent, future
studies could utilize other methods of assessing energy
consumption (i .e ., measurement of VO2) and compare the
results.3. Duration of an individual task on the combination of
tasks might have some effect on the value of MAWOL. Future
research could study such combinations. Since this study
involved an upper-extremity - task with average power
requirement of 8.87 Kg-m/sec, research could, be done with
tasks requiring more than this value.

79
i
REFERENCES
/

80
\
REFERENCES
• Applied Ergonomics Handbook. Published by INCREASE Science and.Technology Press Ltd., INCREASE House, 32 High Street, Guildford, Surrey, England GUI 3EW.
Ayoub, M. M. (1977) . Lifting Capacity of Workers. Journal of Human Ergology, 6 : , pp. 187-192.
Ayoub, M. M., Dryden, R., McDaniel, J., Knipfer, R., andDixon, D . (1979). Predicting Lifting Capacity. American Industrial Hygiene Association Journal, 40:12, p p . 1075- 1084.
Ayoub, M.M., Mital7A., Asfour, S.S., and Bethea, N.J. (1980). Review, Evaluation, and Comparison of Models for Predicting Lifting Capacity. ■ Human Factors,' 22:3, p p . 257-269.
'Ayoub, M.M., Mital, A., Bakken, G.M., Asfour, S.S., andBethea,N.J. (1980) ._ Development of Strength and Capacity Norms for Manual Materials Handling Activities: The State of Art. Human Factors, 22:3, pp. 271-283.
Ayoub, M.M., and Selan, J .L . (1983). An Ergonomic Approachfor the Design of Manual Materials-Handling Tasks. Human Factors, 25:5, pp. 507-515.
Ayoub, M.M. (1987) . The Problem of Manual Materials Handling. Trends in Ergonomics/Human Factors IV, S .S . Asfour (Editor), Elsevier Science Publishers B . V. (North - Holland), pp. 901-907.
Chaffin, D.B., Andres, R.O., and Garg, A. (1983). Volitional Postures During Maximal Push/Pull Exertions in the Sagittal Plane. Human Factors, 25:5, pp. 541-550.
CiriellozV.M., Snook, S.H.(1983). A Study of Size, Distance, Height, and Frequency Effects on Manual Handling Tasks. Human Factors, 25:5, pp. 473-483.
Ciriello7V.M., Snook, S.H.(1983). A Study of Size, Distance, Height, and Frequency Effects on Manual Handling Tasks. Human Factors,■ 25:5, pp. 473-483.
_

81Ciriello, V.M., Snook,S .H.,Blick, A.C. and Wilkinson,
P .L . (1990) . The Effect•of Task Duration on Psychophysically-determined'Maximum Acceptable Weights and Forces. Ergonomics,33:2, pp. 187-200.
Ciriello, V.M., Snook, S.H., and Hughes, G.J. (1993). Further Studies of Psychophysically Determined Maximum Acceptable Weights and Forces. Human Factors, 35:1, pp. 175-186.
Clark, T . S., and Corlett, E . N. (1984). The Ergonomics of Workplaces and Machines: A Design Manual. Taylor &Francis, London and Philadelphia.
Drury, C.G., and PizatellazT. (1983). Hand Placement in Manual Materials Handling. Human Factors, 25:5, pp .■ 551- 562 .
Drury, C.G., Deeb, J.M., Hartman, B., Wolley, S., Drury, C.E., and Gallagher, S . (1989) . Symmetric and AsymmetricManual Materials Handling- Part I: Physiology andPsychophysics. Ergonomics, 32:5, pp. 467-489 ..
Dutta, S.P., and Taboun, S . (1989). Developing Norms forManual carrying Tasks using Mechanical Efficiency as the Optimization criterion. Ergonomics, 32:8, pp. 919-943.
Eastman Kodak Company (1986). Ergonomic Design for People at Work. Eastman Kodak Company, Ergonomics Group, Health and Environment Laboratories. Van Nostrand Reinhold CompanyzNew York.
Fernandez, J. E . (1986). Psychophysical Lifting Capacity over Extended Periods. Unpublished Ph.D. Dissertation, Texas Tech University, Lubbock, TX.
Fernandez, J. E .(1988). The Psychophysical Approach: Thevalid Measure of Lifting Capacity. Trends in 'Ergonomics/Human Factors V . pp. 837-845.
Gallagher, S ., and Unger, R . L . (1990) . Lifting in FourRestricted Lifting Conditions: Psychophysical,Physiological and Biomechanical Effects of Lifting in Stooped and Kneeling Postures. Applied Ergonomics, 21:3, pp. 237-245.
Gallagher, S . (1991) . Acceptable Weights and PhysiologicalCosts of Performing Combined Manual Materials Handling Tasks in Restricted Postures. Ergonomics, 34:7, pp. 939- 952 .
I I
82Garg, A., and Saxena, U. (1979). Effects of Lifting Frequency
and Technique on Physical Fatigue with Special Reference to Psychophysical Methodology and Metabolic Rate. American Industrial Hygiene Association Journal, 40:4, p p . 894-903.
Garg, A., and Saxena, U. (1980). Container Characteristics and Maximum Acceptable Weight of Lift. Human Factors, 22:4, pp. 487-495.
Garg, A., and Ayoub, M.M. (1980). What Criteria Exist for Determining' How Much Load Can be Lifted Safely. Human • Factors, 22:4, pp. 475-486.
Grandjean, E . (1986) . Fitting the Task to Man: An ErgonomicApproach. Taylor & Francis, London and Philadelphia.
Hicks, C-. R. (1982). Fundamental Concepts in the Design of Experiments: Third Edition. Holt, Rinehart and Winston, New York, Chicago, San Francisco.
Jiang, B.C. (1986). Psychophysical Modelling for Combined Manual Materials-Handling Activities. Ergonomics, 29:10, pp. 1173-1190..
KarwowskizW., and' Yates,J.W. (1986). Reliability of the Psychophysical Approach to Manual Lifting of Liquids by Females. Ergonomics, 29:2, pp. 237-248.
Kroemer, K . H . E . (1983 ) . An Isoinertial Technique to Assess Individual Lifting Capability. Human Factors, 25:5, p p .
' 493-506.
Legg, S.J. and Myles, W.S. (1985) . Metabolic and Cardiovascular Cost, and Perceived Effort over an 8-hour Day When Lifting Loads Selected by the Psychophysical Method. Ergonomics, 28:1, pp. 337-343.
Loredan: LIDO Workset II System - User's Guide.
MarleyzR.J. (1990). The Effect of Frequency upon PhysicalWork Capacity for Lifting Tasks. Ph.D. Dissertation, Wichita State University.
Miller, I., Freund, J . E., and Johnson, R . A. (1990).Probability and Statistics for Engineers, Fourth Edition. Prentice Hall/ Englewood Cliffs, New Jersey.
Milliken, G.A. and Johnson, D .E . (1984). Analysis of MessyData. Van Nostrand Reinhold Company, New York.

83Mital, A., and Ayoub, M.M. (1980). Modeling of Isometric
Strength and Lifting Capacity. Human Factors, 22:3, pp. 285-290.
Mital, A., and Manivasagan, I. (1983). Maximum Acceptable Weight of Lift as a Function of Material Density, Center of ' Gravity Location, Hand Preference, and Frequency. Human Factors, 25:1, pp. 33-42.
Mital, A . (1983). The Psychophysical Approach in Manual Lifting- A Verification Study. Human Factors, 25:5, pp. 485-491.
Mital, A. (1984). Comprehensive Maximum Acceptable Weight of Lift Database for Regular 8-Hour Work shifts. Ergonomics, 27:11, pp. 1127-1138.
Mital,A., Nicholson,A.S ., and Ayoub,M.M. (1993) . A Guide toManual Materials Handling. Taylor and Francis, London, Washington D.C.
Morrissey,S .J., and LiouzY.H . (1988). Maximum Acceptable Weights in Load Carriage. Ergonomics, 31:2, p p . 217-226.
Nicholson, A.S . (1989). A Comparative Study of Methods for Establishing Load Handling Capabilities. Ergonomics, 32:9, pp. 1125-1144.
NIOSH (1976) . Report on International Symposium oh Safety in Manual Materials Handling. State University of New York
• at Buffalo, July 18-20, 1976. US Department of Health, Education and Welfare, Public Health Service, Center for Disease control, NIOSH.
NIOSH Technical Report (1981). Work Practices Guide to Manual Lifting. U.S. Dept, of Health and Human Services, Public Health Service, Centers for Disease Control, National Institute for Occupational Safety and Health.
Pheasant, S . (1986). Bodvsoace: Anthropometry, Ergonomics and Design. Taylor & Francis, Philadelphia.
Polar Vantage XL: Heart Rate Monitor - User's InstructionManual.
Sensormedics: 2900 Metabolic Measurement Cart - Operator'sManual.
Sharp, M.A. and Legg S.J. (1988). Effects of Psychophysical Lifting Training on Maximal Repetitive Lifting Capacity. American Industrial Hygiene Association Journal, 49:12,

84p p . 639-644.
Singleton, W. T. (1972). Introduction to Ergonomics. World Health Organization, Geneva.
Smith, J . L., and Jiang, B . . C . (1984). A Manual MaterialsHandling Study of Bag Lifting. American IndustrialHygiene AssociationrJournal, 45:8, pp. 505-508.
Snook, S . H., Irvine, C . H., and Bass, S . F . (1970) . Maximum Weights and Work Loads Acceptable to Male Industrial Workers: A Study of Lifting, Lowering, Pushing, Pulling, Carrying, and Walking Tasks. American Industrial Hygiene Association Journal, 31, pp. 579-586.
Snook,S.H. (1978). The Design of Manual Handling Tasks.Ergonomics, 21:12, pp. 963-985.
Snook,S.H.(1985). Psychophysical Considerations inPermissible Loads. Ergonomics, 28:1, pp. 327-330.
Snook, S.H., Ciriello, V.M. (1991). The Design of Manual Handling Tasks: Revised Tables of Maximum AcceptableWeights and Forces. Human Factors, 34:9, pp. 1197-1213.
Stevenson, J.M., Andrew, G.M., Bryant, Greenhorn, D.R., and Thomson, J.M. (1989). Isoinertial Tests to Predict Lifting Performance. Ergonomics, 32:2, pp. 157-166.
Taboun, S . M., and Dutta, S.. P . (1989) . Energy Cost Modelsfor Combined Lifting and Carrying Tasks. International Journal of Industrial Ergonomics, Elsevier Science Publishers B .V., Amsterdam, pp. 1-17.
Woodson, W. E., Tillman, B., and Tillman, P . (1992). HumanFactors Design Handbook. McGraw-Hill, Inc.

APPENDICES

86
APPENDIX'A
PRELIMINARY FORMS

I A
I MONTANA J STATE UNIVERSITY
87
College of Engineering Montana State University Bozeman, MT 59717-0384
D epartm ent of Industrial and Management Engineering
Ifelephone 406-994-3971
SUBJECT CONSENT FORM - FOR
PARTICIPATION IN HUMAN RESEARCH
You ̂ are invited to participate in a study titled "Evaluation of the Effect of Upper Extremity Activities on the Maximum Acceptable Weight of Lift of a Combined Manual Materials Handling Task." This study will examine the use of a subjective method (the psychophysical approach) to determine the acceptable limits of weight handling for a combination of manual materials handling (MMH) tasks as often observed in the industries. The results of the study are expected to aid industrial engineers in determining the maximum limits of load handling for any MMH task which, ultimately, will lead to reduced risk of back injury due to unsafe and excessive load handling.
If you decide to participate, you will be required to perform simulated lifting,• carrying, and combination of lifting, carrying and bending tasks. Beginning with an unknown weight of load, you will keep adjusting the load (increasing or decreasing) till you feel confident of handling the load for an extended period of 8 hours without feeling unduly stressed, overheated or overexhausted. Two frequencies of handling will be used and each of the session will last for 25 minutes. Including orientation and familiarization sessions, you will be expected to participate for a total of about 5 hours of observations spread over a maximum of 8 days.
Depending upon the stage of experimentation, further information will be collected. These variables include anthropometric measures such as body height, body weight, knuckle height etc. During performance of the simulated tasks, measures of heart rate and oxygen consumption may be monitored.

88Because these tasks are simulated using a non-functional
tool, and the dependent physiological measures taken are non- invasive, you should not experience any unusual discomfort nor risk of injury resulting from the equipment or procedures. Because the tasks involve the musculature of the upper extremities, however, you may experience some minor soreness in these muscles and/or stiffness in the involved joints. The I&ME Department or Montana State University .cannot provide compensation for such conditions or any other health problems that might arise as a result of this experiment.
You have voluntarily accepted to participate in the experiment and hence, will not be monetarily compensated for your effort. Since your participation is completely voluntary, you may choose to withdraw from participation at any time and for whatever reason. Such a withdrawal will not affect your relationship, if any, with the I&ME Dept, or with Montana State University. All information obtained during this study by which you could be identified will be held in strict confidence.
If at any time you have questions regarding this research, you may contact either the student assistant or Dr. Robert Marley, Industrial & Management Engineering Dept, 315 Robert Hall, Montana State University, Bozeman, MT 59717, (406) 994-3971.
By placing your signature below, you are indicating that you have read all of the above information and are willing to participate. You may keep a copy of this form.
Signature of Participant Date
Date
/
Dr. Robert J. Marley (or authorized assistant)

89
Form II
\
Instruction of Psychophysical Approach for Subjects:
The objective of this study is to determine the weighthandling ability of individuals in a representative work situation. This is an experiment to find reasonable quantities that normal healthy persons can handle under different manual materials handling activities at two and four handling per minute. These activities are: lift from floor to knuckle height (L); carry for 2.1 m (C); L and C; L and C and bending activity for 20 seconds at 2 handling per minute and for 10 seconds at 4 handling per minute.THIS IS NOT A TEST TO DETERMINE YOUR MAXIMUM WEIGHT-LIFTING CAPACITY. I • repeat, THIS IS NOT A TEST TO DETERMINE YOUR MAXIMUM WEIGHT-LIFTING CAPACITY. Rather, it is a study to find reasonable quantities - I repeat, reasonable quantities - that individuals can handle repetitively under the specified conditions.
We want you to imagine that you are working in a steel furniture factory during a normal working day, getting paid for the amount of work that you do. In other words, the more work you do the more money you make. You are expected to work continuously at least 30 minutes, as hard as you can, without straining yourself or without becoming unusually tired, weakened, overheated or out of breath.
ONLY YOU WILL ADJUST THE WORKLOAD. If you feel that you can work harder without getting overloaded, add more weight to the box. If you feel you are working too hard and could not keep up the rate for half hour, you should remove some weight from the box. Remember, only you will adjust this workload.
DO NOT BE AFRAID TO MAKE ADJUSTMENTS. You have to make enough adjustments so that you get a good feeling for what is too heavy and what is too light. You can never make too many adjustments, but you can make too few.
REMEMBER....THIS IS NOT A CONTEST. NOT EVERYONE IS EXPECTED TO DO THE SAME AMOUNT OF WORK. WE WANT YOUR JUDGEMENT ON HOW HARD YOU CAN WORK WITHOUT BECOMING UNUSUALLY TIRED. TAKE IT EASY.
Remember to adjust the weight, when necessary, so that the box represents the maximum weight that you would be willing to handle at this pace, height and distance.

APPENDIX B
DATA COLLECTION FORMS

91
Form I : Physiological data of the subjects.
Date: Time:Name of the Subject : Subject # :
Age ( Years ) :Body Weight ( Kg ) : .Height ( cm ) :Shoulder Height (cm):Knuckle Height ( cm)Knee Height ( cm ) :

92
Form II : MAWOL for Lifting Task
Subject # MAWOL (kg)
; ■
Oxygen Consumption (1/min)
HR max Date Time
I2345678 -
Form III : MAWOL for Carrying Task
Carrying Height from the floor (cm) : Range of Carry (cm) : .Frequency of Handling :
Subject # 'MAWOL (kg) HR max Date TimeI2345678

IL U
93
Form IV : MAWOL for Combined Lifting and Carrying Task
Height of Lift (cm) :Distance of Carry (cm) : Frequency of Handling (/min) :
Subject # MAWOL (kg) HR max Date TimeI2
■ 345678
Form V : MAWOL for Combined Lifting, Carrying and Shearing TasksHeight of Lift (cm) :Distance of Carry (cm) :Shearing Torque Applied (Kg-m) :Frequency of Handling (/min) :
Subject # MAWOL (kg) HR max Date TimeI23• 45678

94
Form VI : Heart Rate MeasurementSubject # :Unit of measurement: Beats/min (bpm) \Interval of HR Measurement (min) : I
L2 L4 , C2 C4 LC2 LC4 LCS2 LCS4
Time HR HR HR HR ' HR HR HR HRI23456
I
8910111213141516171819202122232425 ■

95
Form VII : Estimated Energy Expenditure for the Tasks
Subject # Lifting(L) Carrying
(C) ■L + C L+C+S
I2345678

96
Primary Data Collection Form
Subject #:Age:Body Height: Body Weight: Shoulder Height: Knuckle Height:
Experiment #: I Date:Resting Heart Rate (RHR) :Mean Heart Rate(last 5 min.): Oxygen Consumption(L/min.): Energy Consumption(Kcal/min.): MAWOL(Kg):
Experiment #: 2 Date:Resting Heart Rate (RHR) :Mean Heart Rate(lasft 5 min.): Oxygen Consumption(L/min.): Energy Consumption(Kcal/min.): MAWOL(Kg):
Experiment #: 3 Date:Resting Heart Rate(RHR):Mean Heart Rate(last 5 min.): Energy Consumption(Kcal/min.): MAWOL(Kg):
Experiment #: 4 Date:Resting Heart Rate (RHR) :Mean Heart Rate(last 5 min.): Energy Consumption(Kcal/min.): MAWOL(Kg) -
Experiment #: 5 Date:Resting Heart Rate (RHR) :Mean Heart Rate (last 5 min.).: Energy Consumption(Kcal/min.): MAWOL(Kg):
Time:HR Max:
Time:HR Max:
Time:HR Max:
Time:HR Max:
Time:HR Max:

97
Experiment #: 6 Date:Resting Heart Rate(RHR).:Mean Heart Rate(last 5 min.): Energy Consumption(Kcal/min.) : MAWOL(Kg):
Experiment #: 7 Date:Resting Heart Rate (RHR) :Mean Heart Rate(last 5 min.): Energy Consumption(Kcal/min.): MAWOL(Kg):
Experiment #: 8 Date:Resting Heart Rate (RHR):Mean Heart Rate(last 5 min.): Energy Consumption(Kcal/min.): MAWOL(Kg):
Time:HR Max:
Time:HR Max:
Time:HR Max:

APPENDIX CRAW DATA

99Table 20. Raw Data
SUBJECT TASK FREQUENC MAWOL SSHR ENERGYi I I 12 90 3i I 2 11 94 3.982i 2 I 17 89.4 0.84i 2 2 16 . 136.2 5.42i 3 I 9 91 1.3i 3 2 9.5 96.2 2.22i 4 I 11.5 105 2.6i 4 2 8.5 118.6 3.962 I I 30 94.4 3.1942 I 2 28.5 125 4.1862 2 I 38.5 90 1.22 2 2 37 100 4.22 3 I 22.5 95 2.12 3 2 22 144.8 6.882 4 I 25 127.6 4.562 4 2 16 115 3.93 I I 22.5 95.4 3.353 I 2 20 110.6 5.4083 2 I 25 87.8 0.683 2 2 22.5 99.2 1.723 3 I 26 86.8 1.483 3 2 17 120.2 3.523 4 I 25.5 94.4 0.943 4 2 15 91.4 1.144 I I 27.5 97.2 4.2164 I 2 22.5 97.2 3.644 2 I 33.5 78.6 0.664 2 2 23.5 89 1.64 3 I 25.5 85.8 0.784 3 2 24 100.6 2.264 4 I 35 106.6 2.264 4 2 24 110.6 2.665 I I 17.5 125.6 1.5425 I 2 18 136.2 7.425 2 I 17.5 123 4.95 2 2 15.5 87.6 1.26

1 0 0
Table 20. (Contd.)5 3 I 17 116.8 4.885 3 2 16 124.4 4.945 4 I 12 137.8 6.685 4 2 10.5 144.4 7.346 I I 19 98 2.8166 I 2 15.5 102.6 4.3226 2 I 20 136.2 6.126 2 2 18 98.8 2.386 3 I 16.5 77.6 0.366 3 2 14 77.6 0.966 4 I 10 79.6 1.166 4 2 11 94 1.97 I I 13 103.2 0.9567 I 2 12 135 1.8767 2 . I 14.5 90.2 1.427 2 2 13 103.4 2.847 . 3 I 16 91.6 1.067 3 2 10.5 110.8 3.487 4 I 13 103.4 7.367 4 2 12 118.6 48 I I 21.5 87.8 3.6928 I 2 13.5 111.2 3.7888 2 I 19.5 90.2 2.328 2 2 14.5 95.4 1.948 3 I 15.5 86.2 0.428 3 2 14.5 95.6 1.768 4 I 19.5 105.8 2.988 4 2 18.5 104.4 2.94

101
Table 21. Resting Heart Rate Values(Beats/minute) for Different Tasks at Two Frequencies.
Sub. L2 L4 C2 C4 LC 2 LC 4 LCS2 LCS 4I. 73 74 81 82 78 74 79 792. 73 75 78 58 74 76 82 763. 86 82 81 82 72 85 85 804. 78 72 72 73 78 78 84 845. 74 62 74 75 68 75 71 716. 76 75 75 75 74 68 68 757. 76 72 76 75 81 76 75 788. 75 76 67 76 82 78 76 75

102Table 22. RANDOM NUMBER TABLE FOR LOAD
SUBJECT #Task I 2 3 4 5 6 7 8L2 0.12 0.37 0.34 0.46 0.67 0.71 0.79 0.75L4 0.02 0.78 0.13 0.760.75 0.69 0.79 0.12C2 0.41 0.47 0.53 0.78 0.51 0.310.26 0.97C4 0.42 0.07 0.34 0.52 0.34 0.11 0.31 0.67LC2 0.95 0.75 0.35 0.57 0.29 0.23 0.67 0.18LC4 0.25 0.68 0.41 0.78 0.43 0.09 0.74 0.02LCS2 0.08 0.35 0.66 0.87 0.26 0.62 0.57 0.76LCS4 0.47 0.55 0.59 0.55 0.08 0.64 0.84 0.12
Even numbers signify HEAVY LOAD
Odd numbers signify LIGHT LOADTask I 2 3 4 5 6 7 8L2 H L H H L L L LL4 H H L H L L L HC2 L L L H L L H LC4 H L H H H L L LLC2 L L L L L L L HLC 4 L H L H L L H HLCS2 H L H L H H L HLCS 4 L L L L H H H H

103
APPENDIX D
GRAPHS

104FIGURE 7
Studentized Residual vs EstimateFor MAWOL
I I I I I I I I I I I I I I I M I I I I I I I I I I I I I I I I I I I I I I I I I I I I I I I I I I I I I I I I
1416121229322827242622212932272718201615182016151518131319221717 11139 8 2629242420231918262824231417121214171212121410 9 16181414
Estimate

105FIGURE 8
Studentized Residual vs EstimateFor Steady-state Heart Rate
E 8687888993949696979798989999************************************ 8687888993939596969798989899************************************
Estimate

Stud
ent
106FIGURE 9
Studentized Residual vs EstimateFor Estimated Energy Expenditure
813 -
2 -
I -
81
BIBI
oBI
BI B
BI B BB B
BI BI B
BB
B B B
BB
B B
B g BB
-I
-2 -
BB
-3
B B
I I I I I I M I I I I I I I I I I I I I I M I I I I I I I I I I I I I I I I I I M I I I I I I I I M I I I I I I I I I I
Estimate

MONTANA STATE UNIVERSITY LIBRARIES
3 I /62 10219966 O