Embed Size (px)
Citation preview

Windows is a registered trademark of Microsoft Corporation.WCA is a registered trademark of A&D Company, Limited.
Noise & Vibration Analysis Systems - ADCC-01-CR1-14200
...Clearly a Better Value
Vereyskaya str.17, Moscow, 121357 RUSSIATelephone: [7] (495) 937-33-44 Fax: [7] (495) 937-55-66
509 Udyog Vihar Phase VGurgaon-122 016, Haryana, INDIATelephone: [91](124) 471-5555 Fax: [91](124) 471-5599
A&D Instruments India Private Limited
3-23-14 Higashi-lkebukuro, Toshima-ku,Tokyo 170-0013 JAPANTelephone:[81](3) 5391-6132 Fax:[81](3) 5391-6148http://www.aandd.jp
1756 Automation Parkway, San Jose, CA 95131 U.S.A.Telephone:[1](408) 263-5333 Fax:[1](408) 263-0119
32 Dew Street, Thebarton, South Australia 5031 AUSTRALIATelephone:[61](8) 8301-8100 Fax:[61](8) 8352-7409
A&D Australasia Pty Ltd.
Unit 24/26 Blacklands Way Abingdon Business Park, Abingdon, Oxon OX14 1DY UNITED KINGDOMTelephone:[44](1235) 550420 Fax:[44](1235) 550485<German Sales Office>Hamburger Straße 30 D-22926 Ahrensburg GERMANYTelephone:[49](0) 4102 459230 Fax:[49](0) 4102 459231
Manhattan Bldg. 8F, 36-2 Yoido-dong, Youngdeungpo-gu, Seoul, KOREATelephone:[82](2) 780-4101 Fax:[82](2) 782-4280
http://www.aandd.jpExamples of FFT analyzer with different sensors
■ Acceleration sensor with built-in amplifier
■ Charge output acceleration sensor
■Microphone and constant current pre-amplifier
■Microphone and pre-amplifier
Rotation pulse Voice memos
To the BNC connectors of
the CompactWCA and
WCAmini external input channels
Impulse hammer
Microphone amplifier
Rotation sensor
Digital revolution indicator
Charge amplifier
To the 3.5mm connector
of the WCAmini MIC
input channel123456
To the BNC connector of
the measurement input channel
Noise & VibrationAnalysis Systems
Hardware development starting from A/D conversion technology
Software development with high-speed DSP and wave analysis technology
PC for measurement/analysis AD5443 On-the-spot relay box
LAN Temperature/32-channelStatic strain/16-channel
Temperature (K type thermoelectric couple)Static strain (Load cell, etc.)
Measurement object
*Communication is possible with RPT development tools from other companies
Crank angleSignal (analog)A/D 48ch
BNC BOX for high-speed A/D
Charge amplifierTorque amplifier
FV, etc.
ADX:RPT*
Test chamber Measurement chamber
Analog signal
CAN communication
21
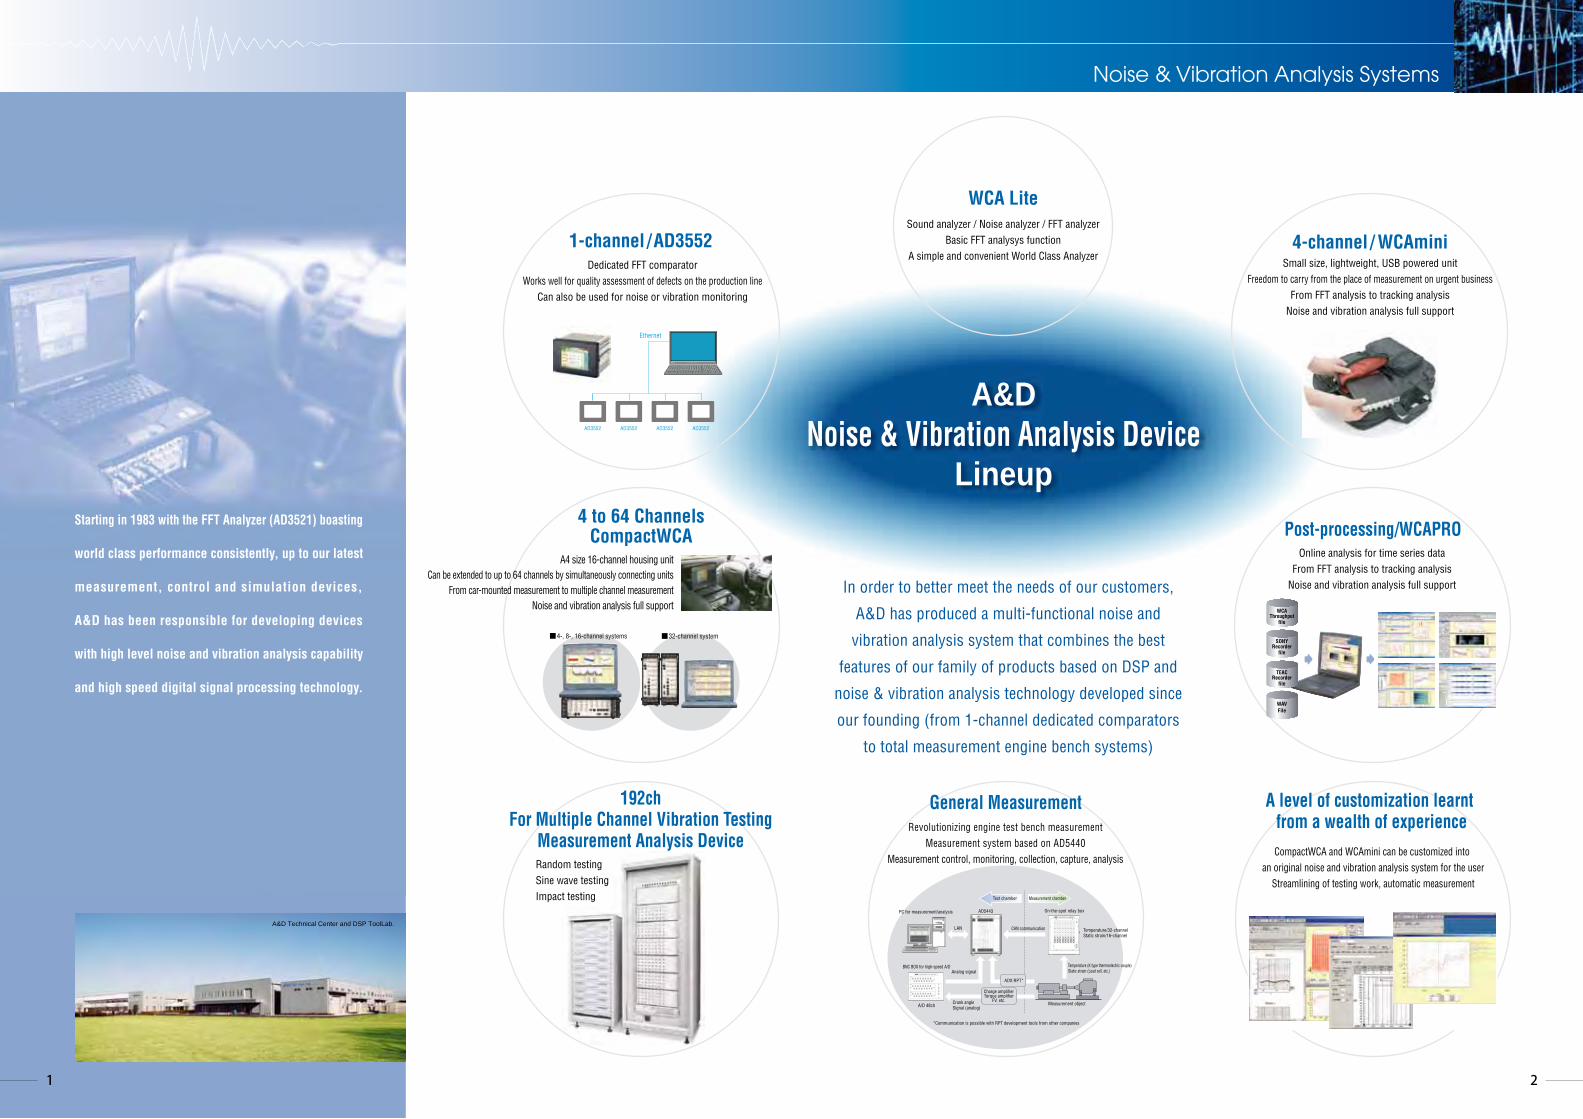
A4 size 16-channel housing unitCan be extended to up to 64 channels by simultaneously connecting units
From car-mounted measurement to multiple channel measurementNoise and vibration analysis full support
Online analysis for time series dataFrom FFT analysis to tracking analysis
Noise and vibration analysis full support
Random testingSine wave testingImpact testing
4 to 64 ChannelsCompactWCA
Revolutionizing engine test bench measurementMeasurement system based on AD5440
Measurement control, monitoring, collection, capture, analysis
General Measurement A level of customization learnt from a wealth of experience
Post-processing/WCAPRO
192chFor Multiple Channel Vibration Testing
Measurement Analysis Device
Noise & Vibration Analysis Systems
■4-, 8-, 16-channel systems ■32-channel system
CompactWCA and WCAmini can be customized into an original noise and vibration analysis system for the user
Streamlining of testing work, automatic measurement
In order to better meet the needs of our customers,
A&D has produced a multi-functional noise and
vibration analysis system that combines the best
features of our family of products based on DSP and
noise & vibration analysis technology developed since
our founding (from 1-channel dedicated comparators
to total measurement engine bench systems)
Starting in 1983 with the FFT Analyzer (AD3521) boasting
world class performance consistently, up to our latest
measurement, control and simulation devices,
A&D has been responsible for developing devices
with high level noise and vibration analysis capability
and high speed digital signal processing technology.
Small size, lightweight, USB powered unitFreedom to carry from the place of measurement on urgent business
From FFT analysis to tracking analysisNoise and vibration analysis full support
Sound analyzer / Noise analyzer / FFT analyzerBasic FFT analysys function
A simple and convenient World Class Analyzer4-channel / WCAmini
Dedicated FFT comparatorWorks well for quality assessment of defects on the production line
Can also be used for noise or vibration monitoring
1-channel /AD3552
WCA Lite
Ethernet
AD3552 AD3552 AD3552 AD3552
A&D Technical Center and DSP ToolLab.
WCAThroughput
file
SONYRecorder
file
TEACRecorder
file
WAVFile
A&DNoise & Vibration Analysis Device
Lineup
43
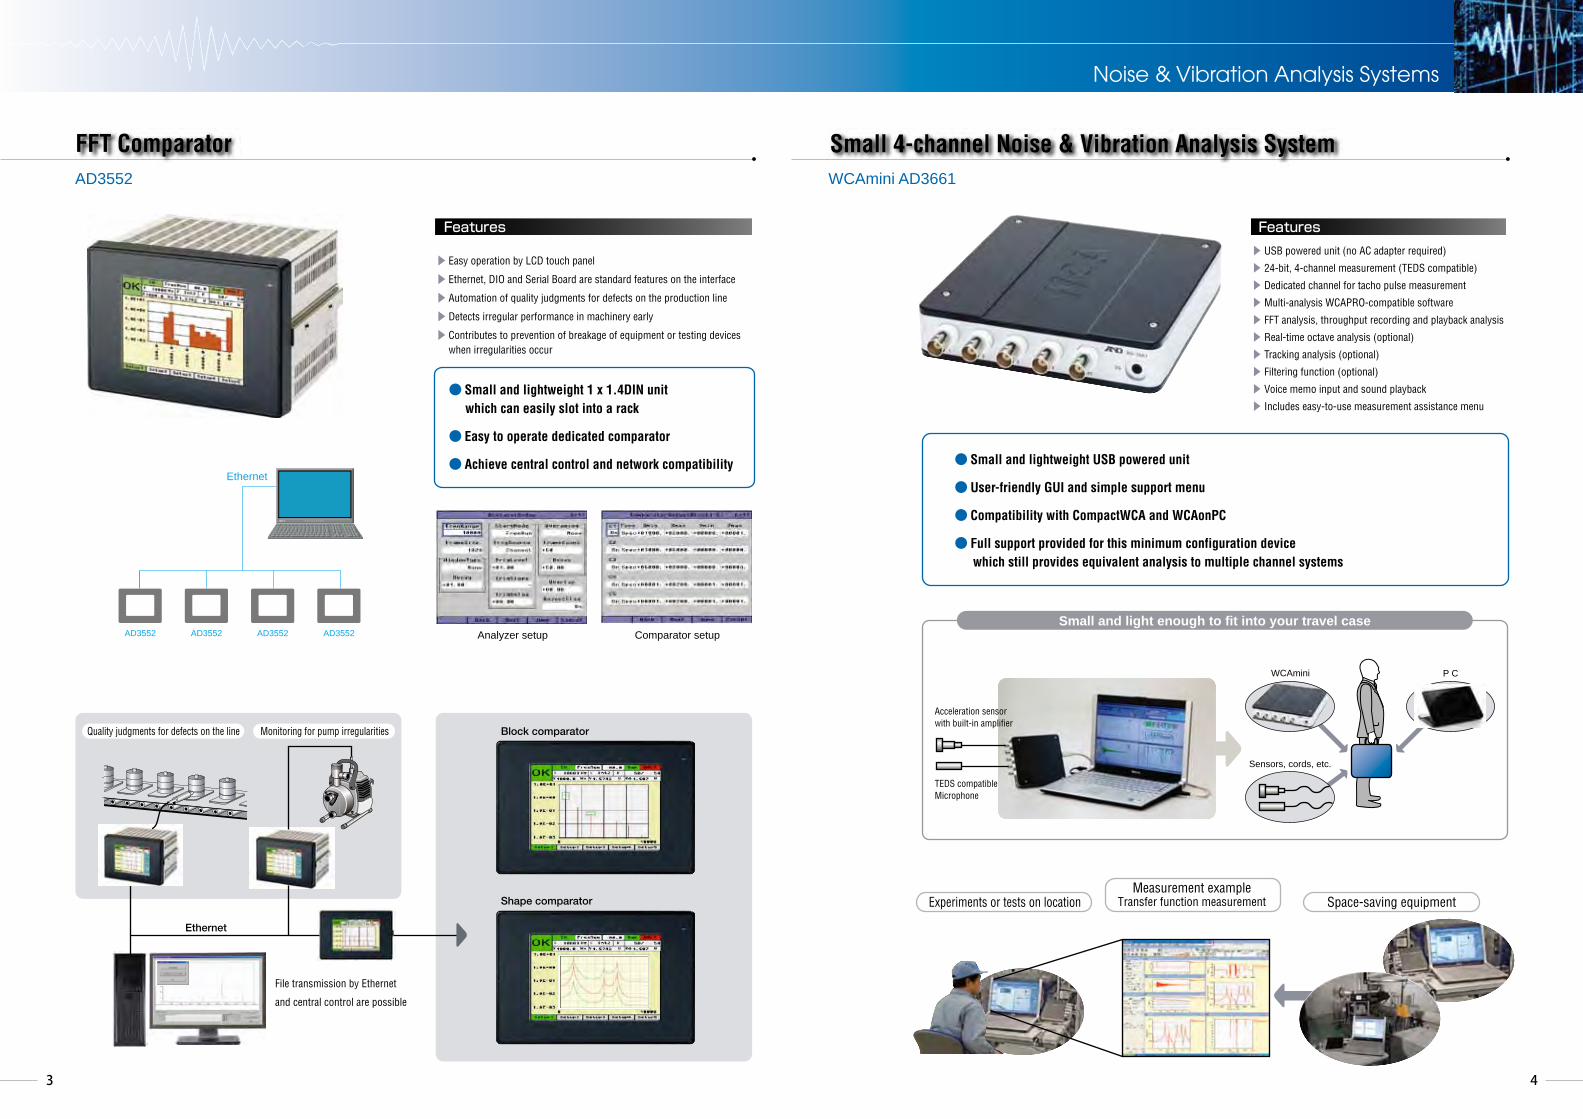
FFT Comparator
● Small and lightweight 1 x 1.4DIN unit which can easily slot into a rack
● Easy to operate dedicated comparator
● Achieve central control and network compatibility
Analyzer setup Comparator setup
Quality judgments for defects on the line Monitoring for pump irregularities
Ethernet
Block comparator
Shape comparator
● Small and lightweight USB powered unit
● User-friendly GUI and simple support menu
● Compatibility with CompactWCA and WCAonPC
● Full support provided for this minimum configuration device which still provides equivalent analysis to multiple channel systems
▶ USB powered unit (no AC adapter required)
▶ 24-bit, 4-channel measurement (TEDS compatible)
▶ Dedicated channel for tacho pulse measurement
▶Multi-analysis WCAPRO-compatible software
▶ FFT analysis, throughput recording and playback analysis
▶ Real-time octave analysis (optional)
▶ Tracking analysis (optional)
▶ Filtering function (optional)
▶ Voice memo input and sound playback
▶ Includes easy-to-use measurement assistance menu
Experiments or tests on location Space-saving equipment
Ethernet
AD3552 AD3552 AD3552 AD3552
WCAmini P C
Small and light enough to fit into your travel case
Features Features
Noise & Vibration Analysis Systems
Small 4-channel Noise & Vibration Analysis System
▶ Easy operation by LCD touch panel
▶ Ethernet, DIO and Serial Board are standard features on the interface
▶ Automation of quality judgments for defects on the production line
▶ Detects irregular performance in machinery early
▶ Contributes to prevention of breakage of equipment or testing devices when irregularities occur
File transmission by Ethernet
and central control are possible
Acceleration sensor with built-in amplifier
TEDS compatibleMicrophone
Sensors, cords, etc.
Measurement exampleTransfer function measurement
AD3552 WCAmini AD3661
Noise & Vibration Analysis Systems
65
Analysis
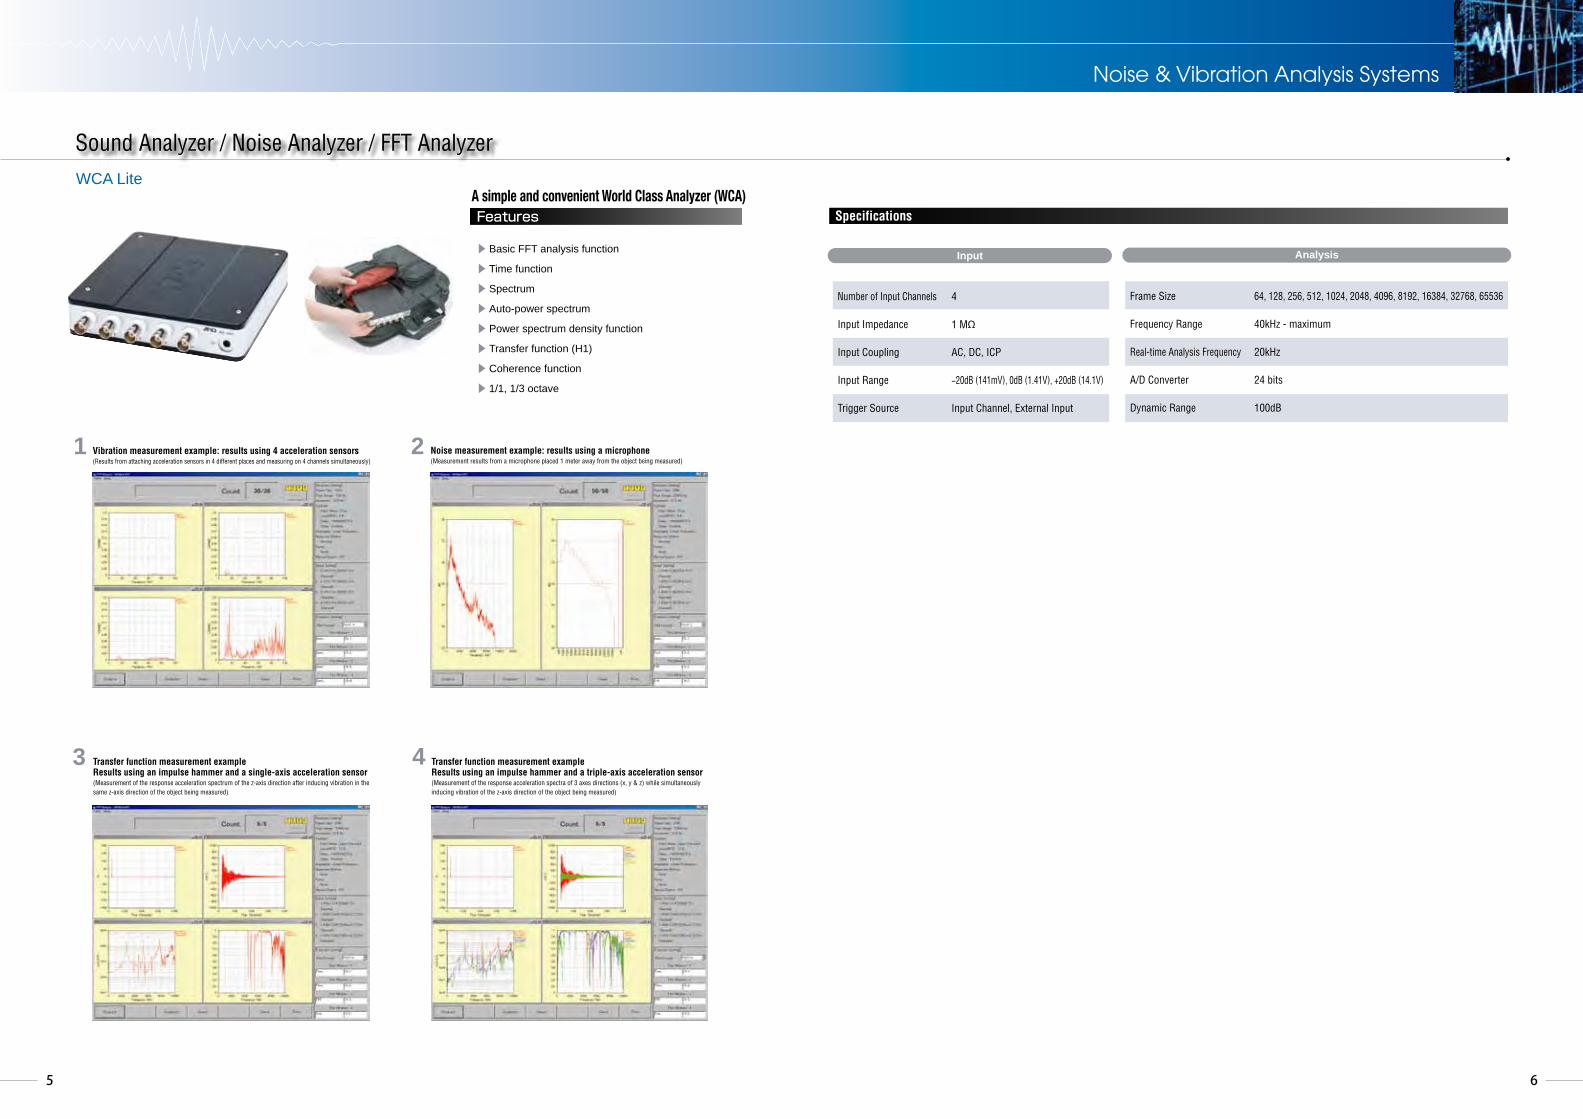
Sound Analyzer / Noise Analyzer / FFT Analyzer
Specifications
Number of Input Channels
Input Impedance
Input Coupling
Input Range
Trigger Source
4
1 MΩ
AC, DC, ICP
−20dB (141mV), 0dB (1.41V), +20dB (14.1V)
Input Channel, External Input
▶Basic FFT analysis function
▶ Time function
▶Spectrum
▶Auto-power spectrum
▶Power spectrum density function
▶ Transfer function (H1)
▶Coherence function
▶ 1/1, 1/3 octave
Frame Size
Frequency Range
Real-time Analysis Frequency
A/D Converter
Dynamic Range
64, 128, 256, 512, 1024, 2048, 4096, 8192, 16384, 32768, 65536
40kHz - maximum
20kHz
24 bits
100dB
Input
WCA Lite
Features
Vibration measurement example: results using 4 acceleration sensors(Results from attaching acceleration sensors in 4 different places and measuring on 4 channels simultaneously)
Noise measurement example: results using a microphone(Measurement results from a microphone placed 1 meter away from the object being measured)
Transfer function measurement exampleResults using an impulse hammer and a single-axis acceleration sensor(Measurement of the response acceleration spectrum of the z-axis direction after inducing vibration in the same z-axis direction of the object being measured)
Transfer function measurement exampleResults using an impulse hammer and a triple-axis acceleration sensor(Measurement of the response acceleration spectra of 3 axes directions (x, y & z) while simultaneously inducing vibration of the z-axis direction of the object being measured)
1 2
3 4
A simple and convenient World Class Analyzer (WCA)
87
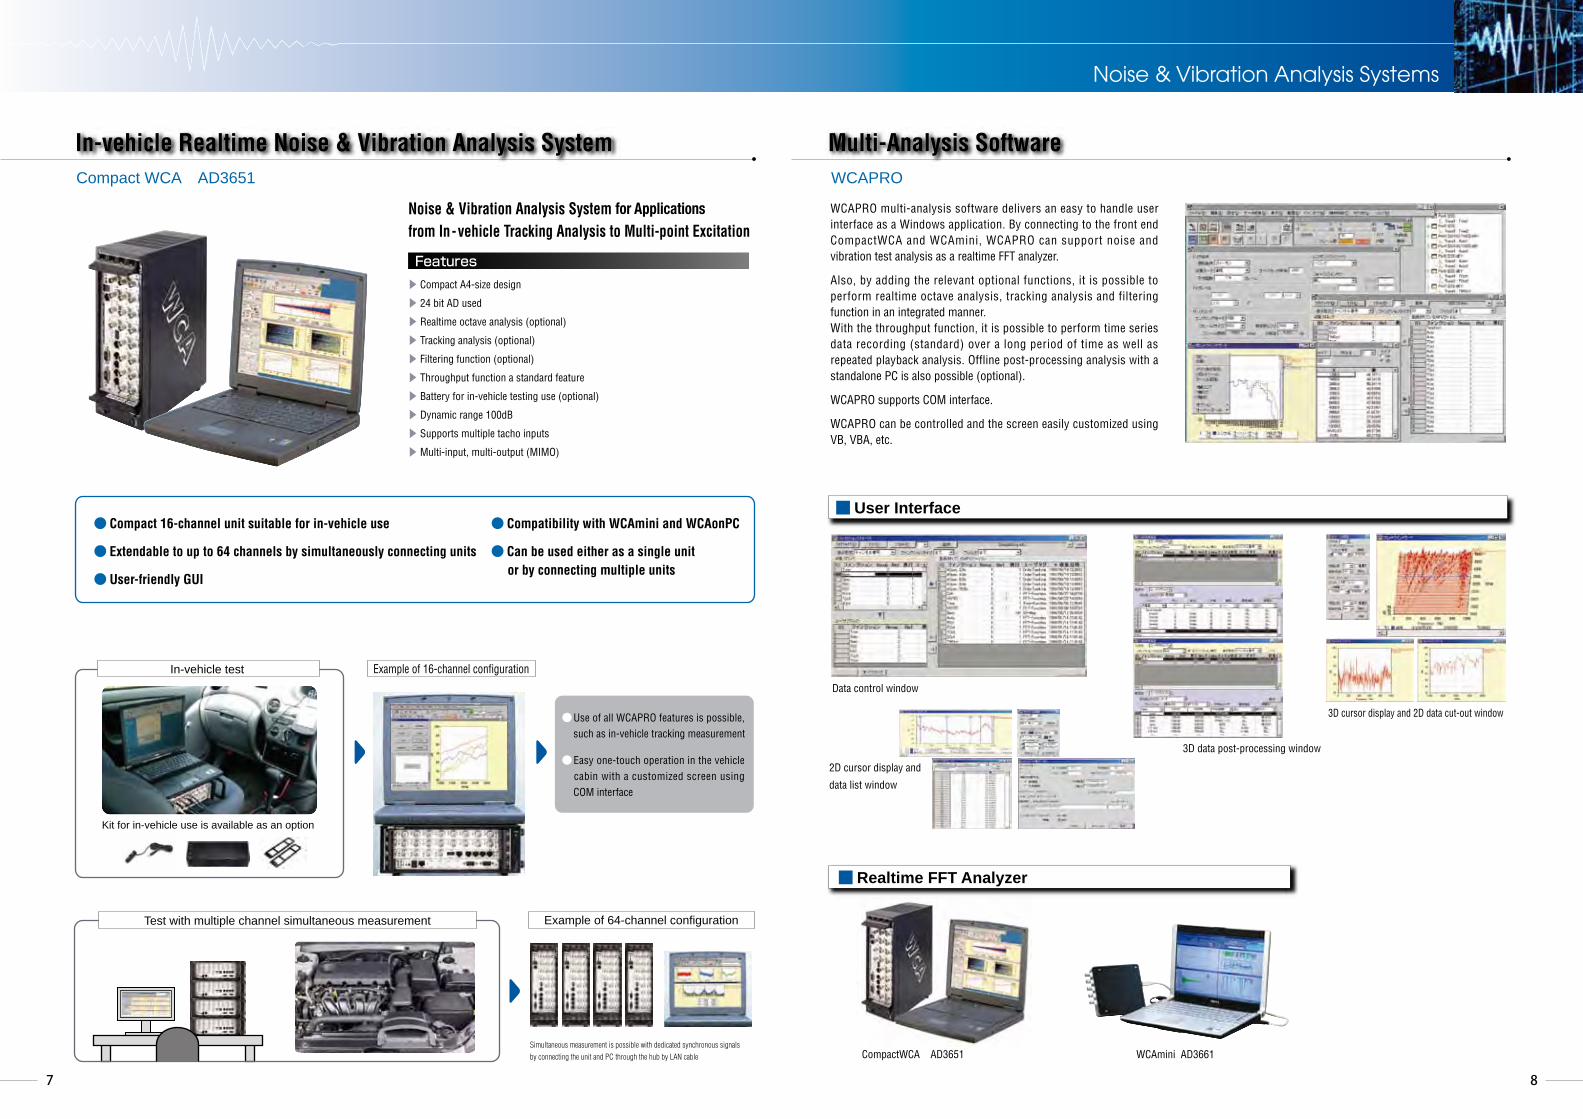
In-vehicle Realtime Noise & Vibration Analysis System
Kit for in-vehicle use is available as an option
● Compact 16-channel unit suitable for in-vehicle use
● Extendable to up to 64 channels by simultaneously connecting units
● User-friendly GUI
Multi-Analysis Software
Data control window
3D data post-processing window
Noise & Vibration Analysis System for Applications from In-vehicle Tracking Analysis to Multi-point Excitation
In-vehicle test
Test with multiple channel simultaneous measurement
Example of 16-channel configuration
Example of 64-channel configuration
Simultaneous measurement is possible with dedicated synchronous signals
by connecting the unit and PC through the hub by LAN cable
WCAPRO multi-analysis software delivers an easy to handle user interface as a Windows application. By connecting to the front end CompactWCA and WCAmini, WCAPRO can support noise and vibration test analysis as a realtime FFT analyzer.
Also, by adding the relevant optional functions, it is possible to perform realtime octave analysis, tracking analysis and filtering function in an integrated manner.With the throughput function, it is possible to perform time series data recording (standard) over a long period of time as well as repeated playback analysis. Offline post-processing analysis with a standalone PC is also possible (optional).
WCAPRO supports COM interface.
WCAPRO can be controlled and the screen easily customized using VB, VBA, etc.
3D cursor display and 2D data cut-out window
CompactWCA AD3651 WCAmini AD3661
Features▶ Compact A4-size design
▶ 24 bit AD used
▶ Realtime octave analysis (optional)
▶ Tracking analysis (optional)
▶ Filtering function (optional)
▶ Throughput function a standard feature
▶ Battery for in-vehicle testing use (optional)
▶ Dynamic range 100dB
▶ Supports multiple tacho inputs
▶Multi-input, multi-output (MIMO)
Compact WCA AD3651 WCAPRO
■User Interface
■Realtime FFT Analyzer
振動・騒音解析 Noise & Vibration Analysis SystemNoise & Vibration Analysis Systems
● Compatibility with WCAmini and WCAonPC
● Can be used either as a single unit or by connecting multiple units
●Use of all WCAPRO features is possible, such as in-vehicle tracking measurement
●Easy one-touch operation in the vehicle cabin with a customized screen using COM interface
2D cursor display and
data list window
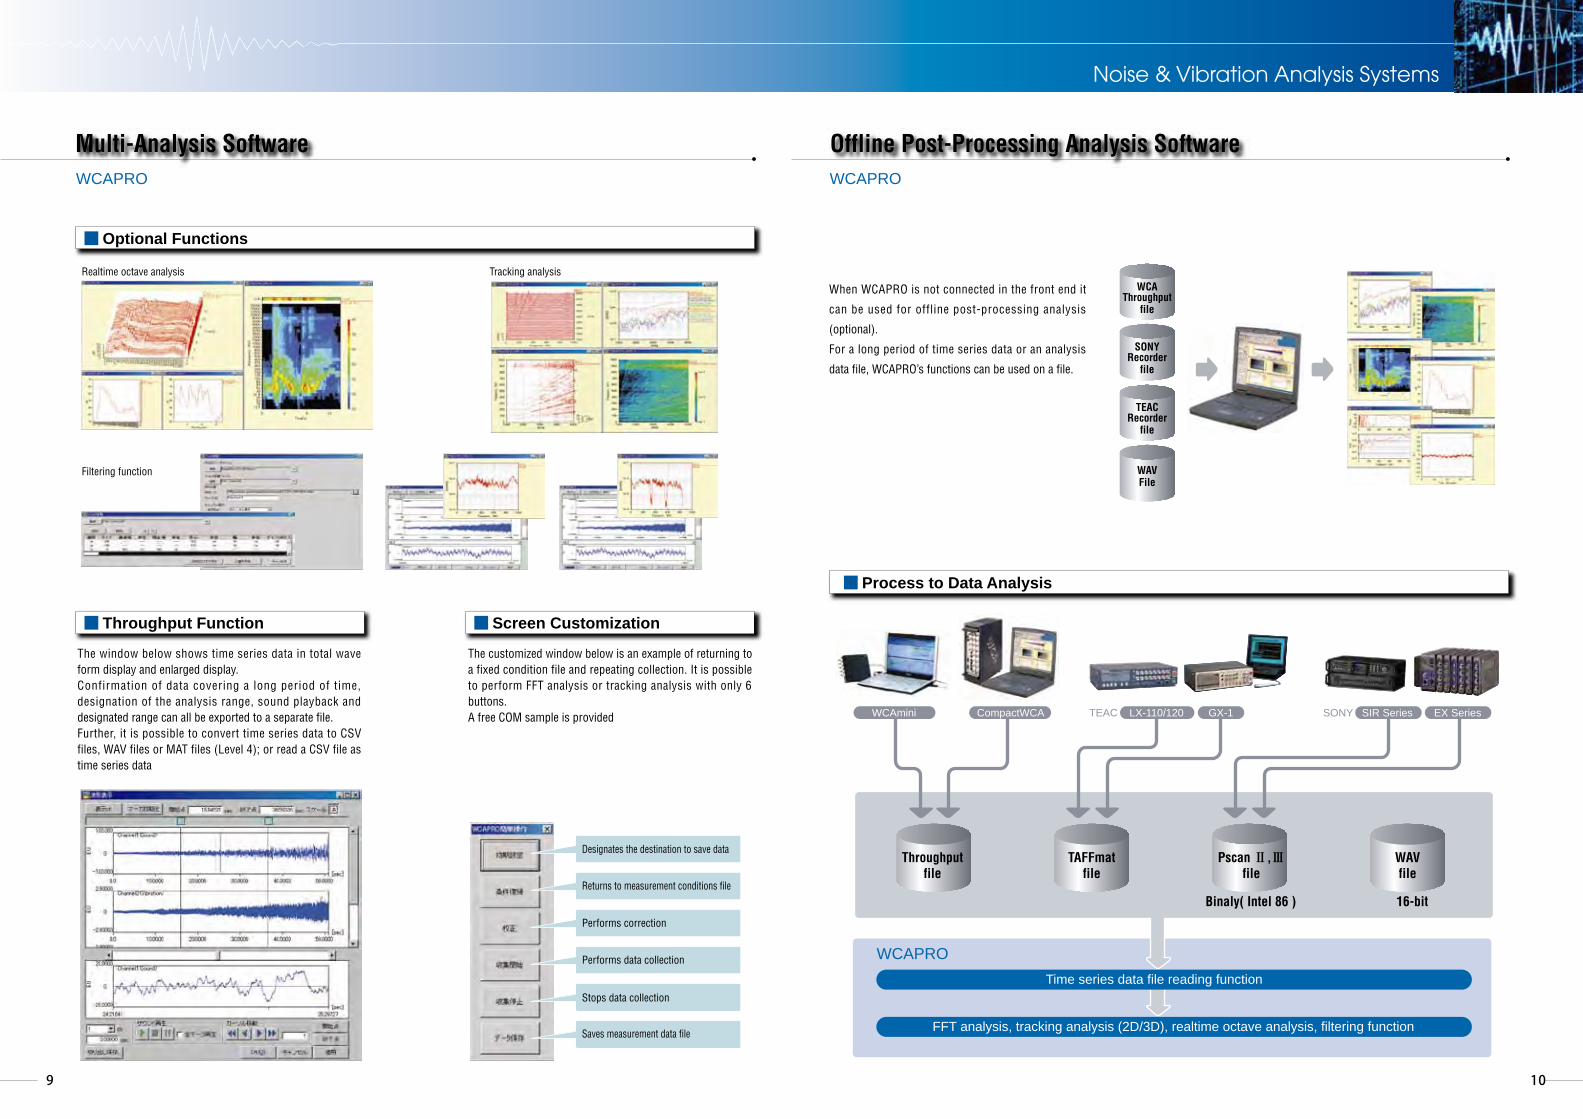
Time series data file reading function
FFT analysis, tracking analysis (2D/3D), realtime octave analysis, filtering function
WCAPRO
109
Multi-Analysis Software Offline Post-Processing Analysis Software
■Optional Functions
■Process to Data Analysis
■ Throughput Function ■Screen Customization
Realtime octave analysis Tracking analysis
Filtering function
The customized window below is an example of returning to a fixed condition file and repeating collection. It is possible to perform FFT analysis or tracking analysis with only 6 buttons.A free COM sample is provided
WCAThroughput
file
SONYRecorder
file
TEACRecorder
file
WAVFile
When WCAPRO is not connected in the front end it
can be used for offline post-processing analysis
(optional).
For a long period of time series data or an analysis
data file, WCAPRO’s functions can be used on a file.
TAFFmatfile
Binaly( Intel 86 )
Pscan Ⅱ,Ⅲfile
16-bit
WAVfile
CompactWCA TEAC LX-110/120 GX-1 SONY SIR Series EX Series WCAmini
WCAPRO WCAPRO
Designates the destination to save data
Returns to measurement conditions file
Performs correction
Performs data collection
Stops data collection
Saves measurement data file
振動・騒音解析 Noise & Vibration Analysis SystemNoise & Vibration Analysis Systems
The window below shows time series data in total wave form display and enlarged display. Confirmation of data covering a long period of time, designation of the analysis range, sound playback and designated range can all be exported to a separate file.Further, it is possible to convert time series data to CSV files, WAV files or MAT files (Level 4); or read a CSV file as time series data
Throughputfile
1211
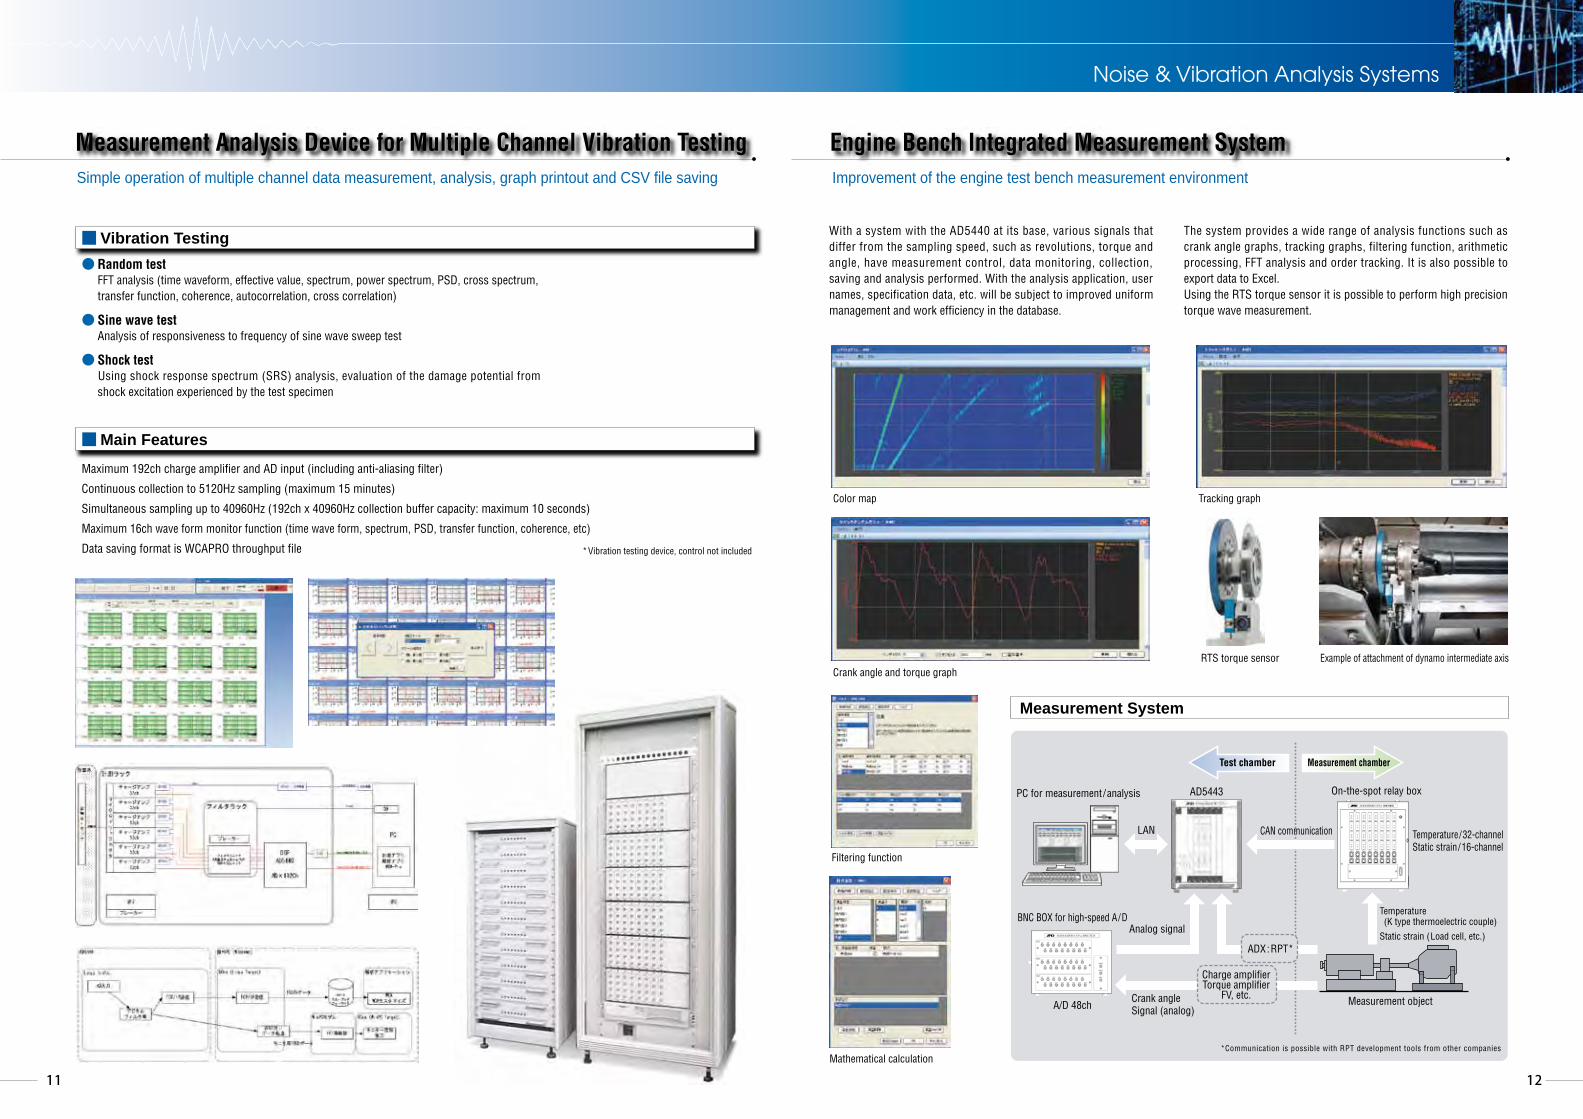
Measurement Analysis Device for Multiple Channel Vibration Testing Engine Bench Integrated Measurement System
■Vibration Testing
Simple operation of multiple channel data measurement, analysis, graph printout and CSV file saving Improvement of the engine test bench measurement environment
With a system with the AD5440 at its base, various signals that differ from the sampling speed, such as revolutions, torque and angle, have measurement control, data monitoring, collection, saving and analysis performed. With the analysis application, user names, specification data, etc. will be subject to improved uniform management and work efficiency in the database.
The system provides a wide range of analysis functions such as crank angle graphs, tracking graphs, filtering function, arithmetic processing, FFT analysis and order tracking. It is also possible to export data to Excel.Using the RTS torque sensor it is possible to perform high precision torque wave measurement.
● Random test FFT analysis (time waveform, effective value, spectrum, power spectrum, PSD, cross spectrum, transfer function, coherence, autocorrelation, cross correlation)
● Sine wave test Analysis of responsiveness to frequency of sine wave sweep test
● Shock test Using shock response spectrum (SRS) analysis, evaluation of the damage potential from shock excitation experienced by the test specimen
■Main Features
Measurement System
Maximum 192ch charge amplifier and AD input (including anti-aliasing filter)
Continuous collection to 5120Hz sampling (maximum 15 minutes)
Simultaneous sampling up to 40960Hz (192ch x 40960Hz collection buffer capacity: maximum 10 seconds)
Maximum 16ch wave form monitor function (time wave form, spectrum, PSD, transfer function, coherence, etc)
Data saving format is WCAPRO throughput file *Vibration testing device, control not included
Color map
Filtering function
Mathematical calculation
Tracking graph
RTS torque sensorCrank angle and torque graph
Example of attachment of dynamo intermediate axis
振動・騒音解析 Noise & Vibration Analysis SystemNoise & Vibration Analysis Systems
PC for measurement/analysis AD5443 On-the-spot relay box
LAN Temperature/32-channelStatic strain/16-channel
Temperature (K type thermoelectric couple)
Static strain (Load cell, etc.)
Measurement object
*Communication is possible with RPT development tools from other companies
Crank angleSignal (analog)A/D 48ch
BNC BOX for high-speed A/D
Charge amplifierTorque amplifier
FV, etc.
ADX:RPT*
Test chamber Measurement chamber
Analog signal
CAN communication
1413
Introducing the Applications
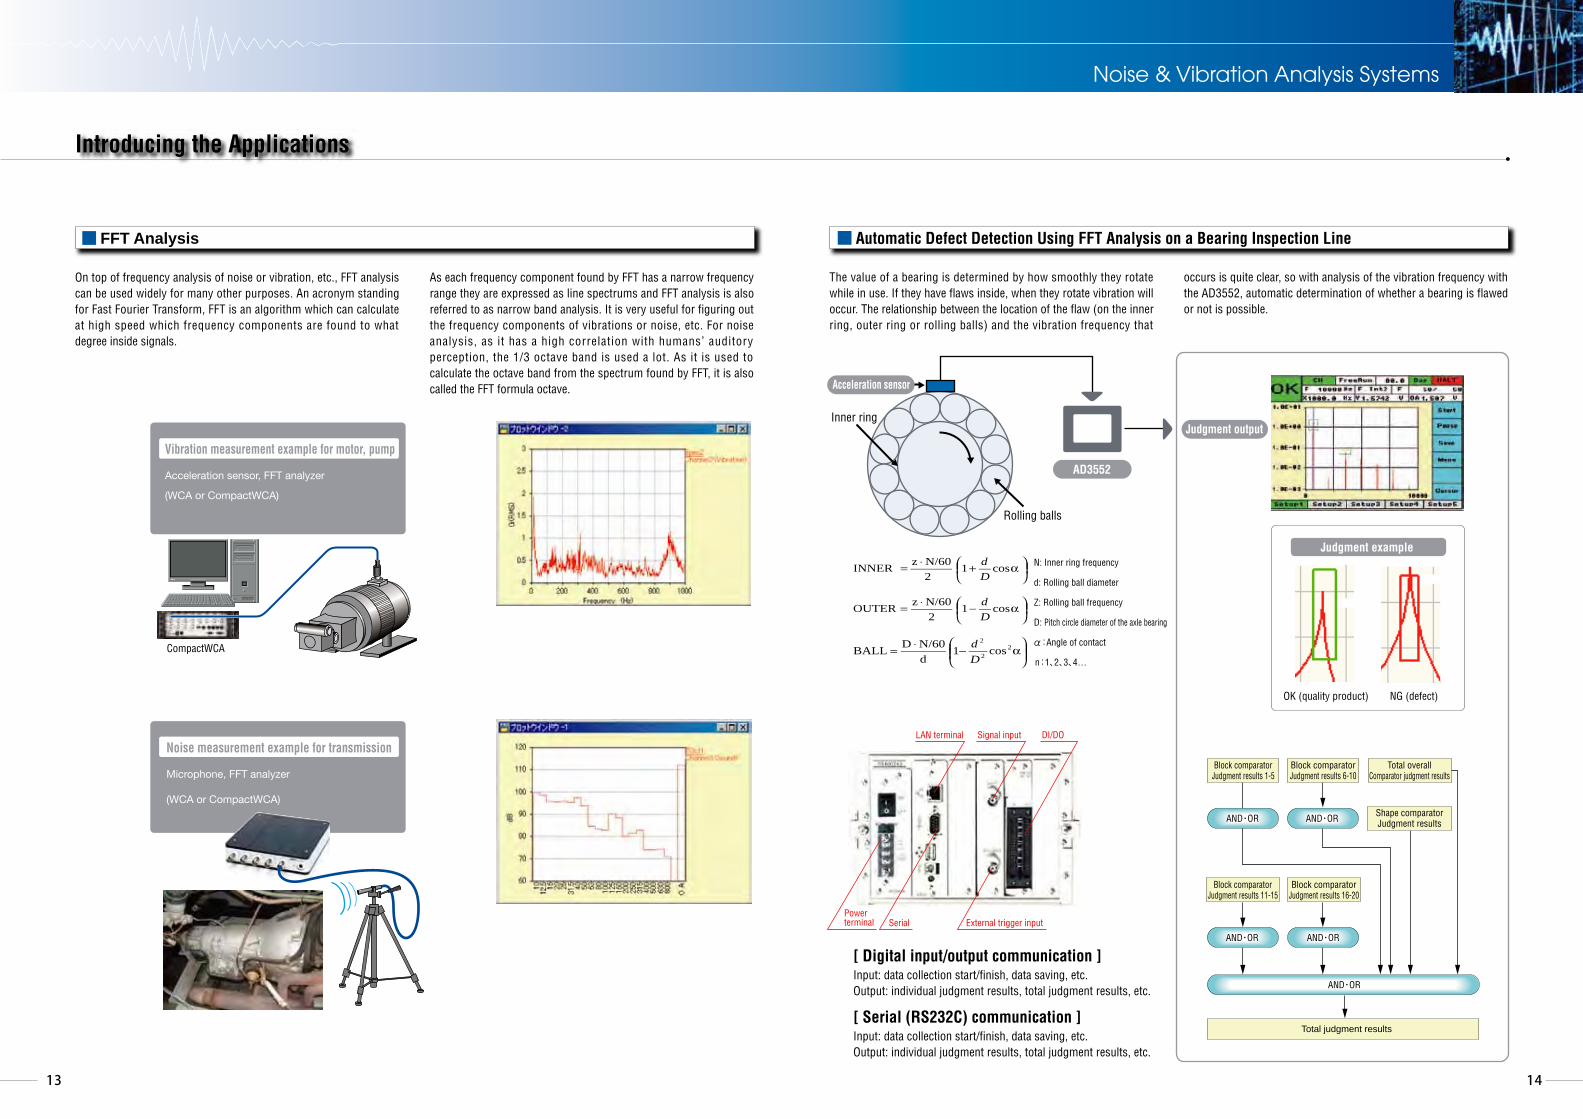
■ FFT Analysis
On top of frequency analysis of noise or vibration, etc., FFT analysis can be used widely for many other purposes. An acronym standing for Fast Fourier Transform, FFT is an algorithm which can calculate at high speed which frequency components are found to what degree inside signals.
As each frequency component found by FFT has a narrow frequency range they are expressed as line spectrums and FFT analysis is also referred to as narrow band analysis. It is very useful for figuring out the frequency components of vibrations or noise, etc. For noise analysis, as it has a high correlation with humans’ auditory perception, the 1/3 octave band is used a lot. As it is used to calculate the octave band from the spectrum found by FFT, it is also called the FFT formula octave.
The value of a bearing is determined by how smoothly they rotate while in use. If they have flaws inside, when they rotate vibration will occur. The relationship between the location of the flaw (on the inner ring, outer ring or rolling balls) and the vibration frequency that
occurs is quite clear, so with analysis of the vibration frequency with the AD3552, automatic determination of whether a bearing is flawed or not is possible.
■ Automatic Defect Detection Using FFT Analysis on a Bearing Inspection Line
[ Digital input/output communication ]Input: data collection start/finish, data saving, etc.Output: individual judgment results, total judgment results, etc.
[ Serial (RS232C) communication ]Input: data collection start/finish, data saving, etc.Output: individual judgment results, total judgment results, etc.
Vibration measurement example for motor, pump
Acceleration sensor, FFT analyzer
(WCA or CompactWCA)
Noise measurement example for transmission
Microphone, FFT analyzer
(WCA or CompactWCA)
−⋅= α2
2
2
cos1dN/60DBALL
Dd
−⋅= αcos1
2N/60zOUTER
Dd
+⋅= αcos1
2N/60zINNER
Dd N: Inner ring frequency
d: Rolling ball diameter
Z: Rolling ball frequency
D: Pitch circle diameter of the axle bearing
α:Angle of contact
n:1、2、3、4…
Judgment output
OK (quality product) NG (defect)
Inner ring
Rolling balls
CompactWCA
Signal input DI/DO
External trigger inputPowerterminal Serial
LAN terminal
Block comparatorJudgment results 1-5
Block comparatorJudgment results 6-10
Block comparatorJudgment results 11-15
Block comparatorJudgment results 16-20
Total overallComparator judgment results
Shape comparatorJudgment results
Total judgment results
AND・OR
AND・OR
AND・OR
AND・OR AND・OR
Judgment example
Acceleration sensor
AD3552
Noise & Vibration Analysis Systems
1615
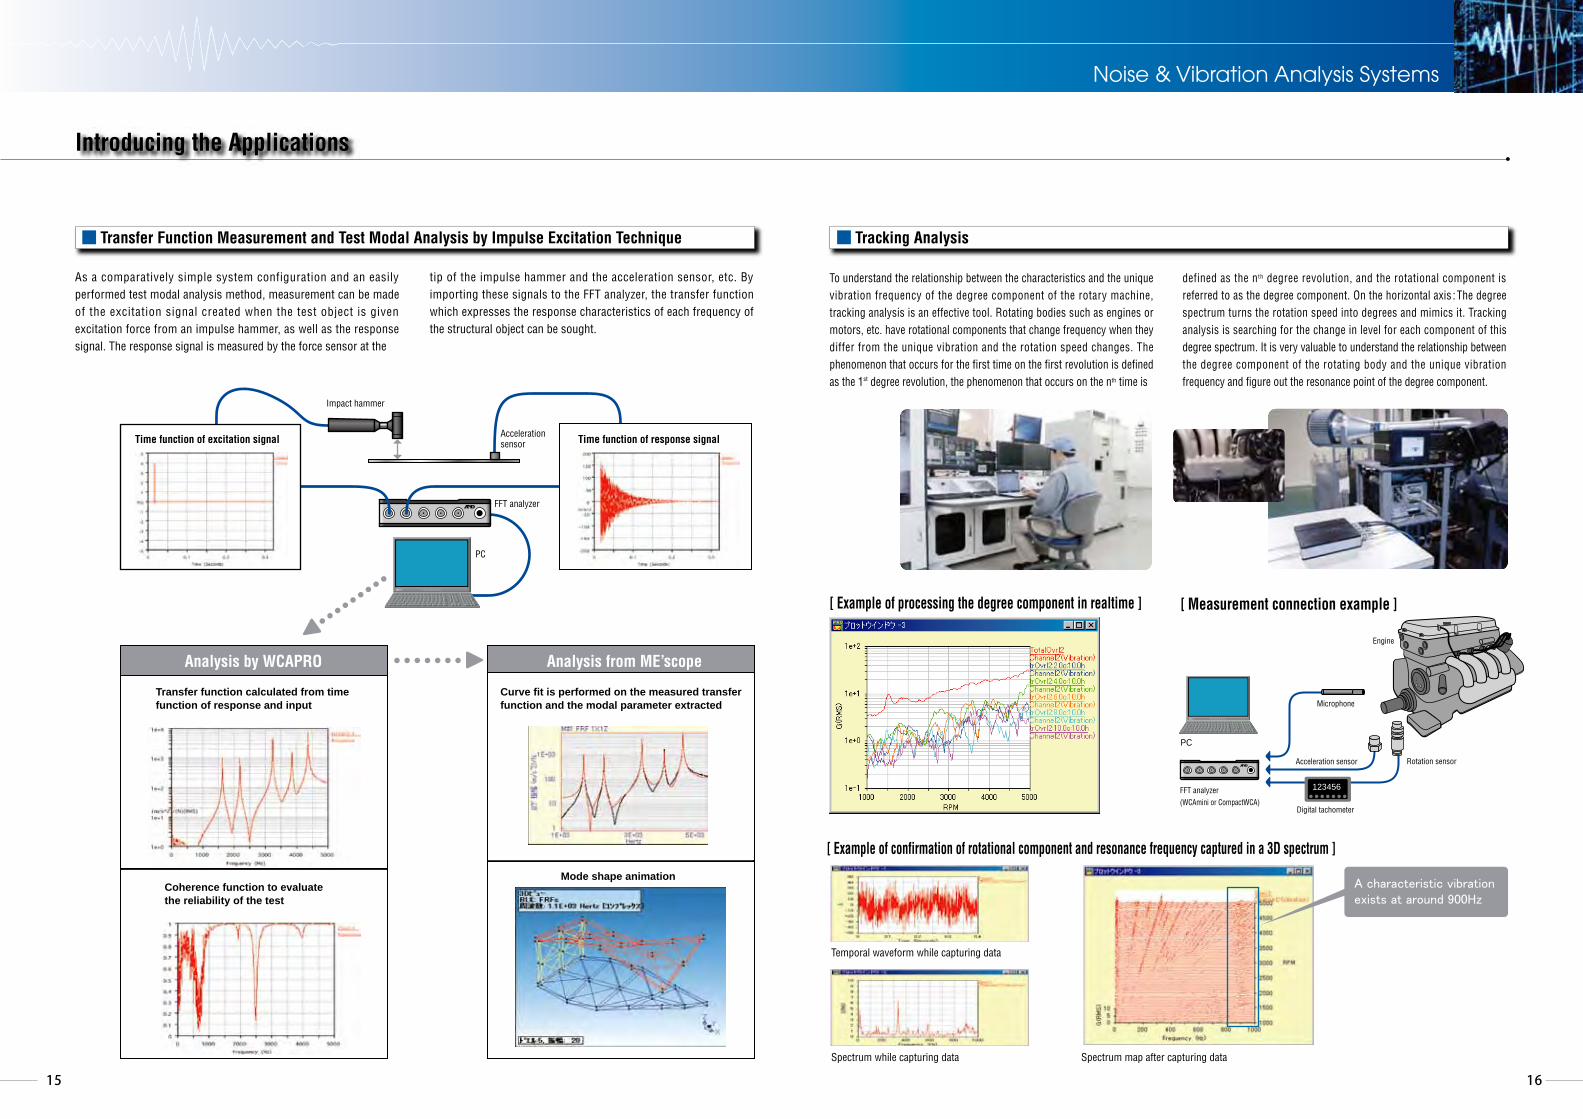
■ Transfer Function Measurement and Test Modal Analysis by Impulse Excitation Technique ■ Tracking Analysis
As a comparatively simple system configuration and an easily performed test modal analysis method, measurement can be made of the excitation signal created when the test object is given excitation force from an impulse hammer, as well as the response signal. The response signal is measured by the force sensor at the
tip of the impulse hammer and the acceleration sensor, etc. By importing these signals to the FFT analyzer, the transfer function which expresses the response characteristics of each frequency of the structural object can be sought.
To understand the relationship between the characteristics and the unique vibration frequency of the degree component of the rotary machine, tracking analysis is an effective tool. Rotating bodies such as engines or motors, etc. have rotational components that change frequency when they differ from the unique vibration and the rotation speed changes. The phenomenon that occurs for the first time on the first revolution is defined as the 1st degree revolution, the phenomenon that occurs on the nth time is
defined as the nth degree revolution, and the rotational component is referred to as the degree component. On the horizontal axis : The degree spectrum turns the rotation speed into degrees and mimics it. Tracking analysis is searching for the change in level for each component of this degree spectrum. It is very valuable to understand the relationship between the degree component of the rotating body and the unique vibration frequency and figure out the resonance point of the degree component.
Temporal waveform while capturing data
Spectrum while capturing data Spectrum map after capturing data
A characteristic vibration exists at around 900Hz
Transfer function calculated from timefunction of response and input
Curve fit is performed on the measured transfer function and the modal parameter extracted
Coherence function to evaluate the reliability of the test
Mode shape animation
Analysis by WCAPRO Analysis from ME’scope
[ Example of processing the degree component in realtime ]
[ Example of confirmation of rotational component and resonance frequency captured in a 3D spectrum ]
Acceleration sensor
Microphone
Engine
Rotation sensor
Digital tachometer
FFT analyzer(WCAmini or CompactWCA)
………
123456
Impact hammer
Acceleration sensor
FFT analyzer
PC
PC
Time function of response signalTime function of excitation signal
Noise & Vibration Analysis Systems
Introducing the Applications
[ Measurement connection example ]
1817
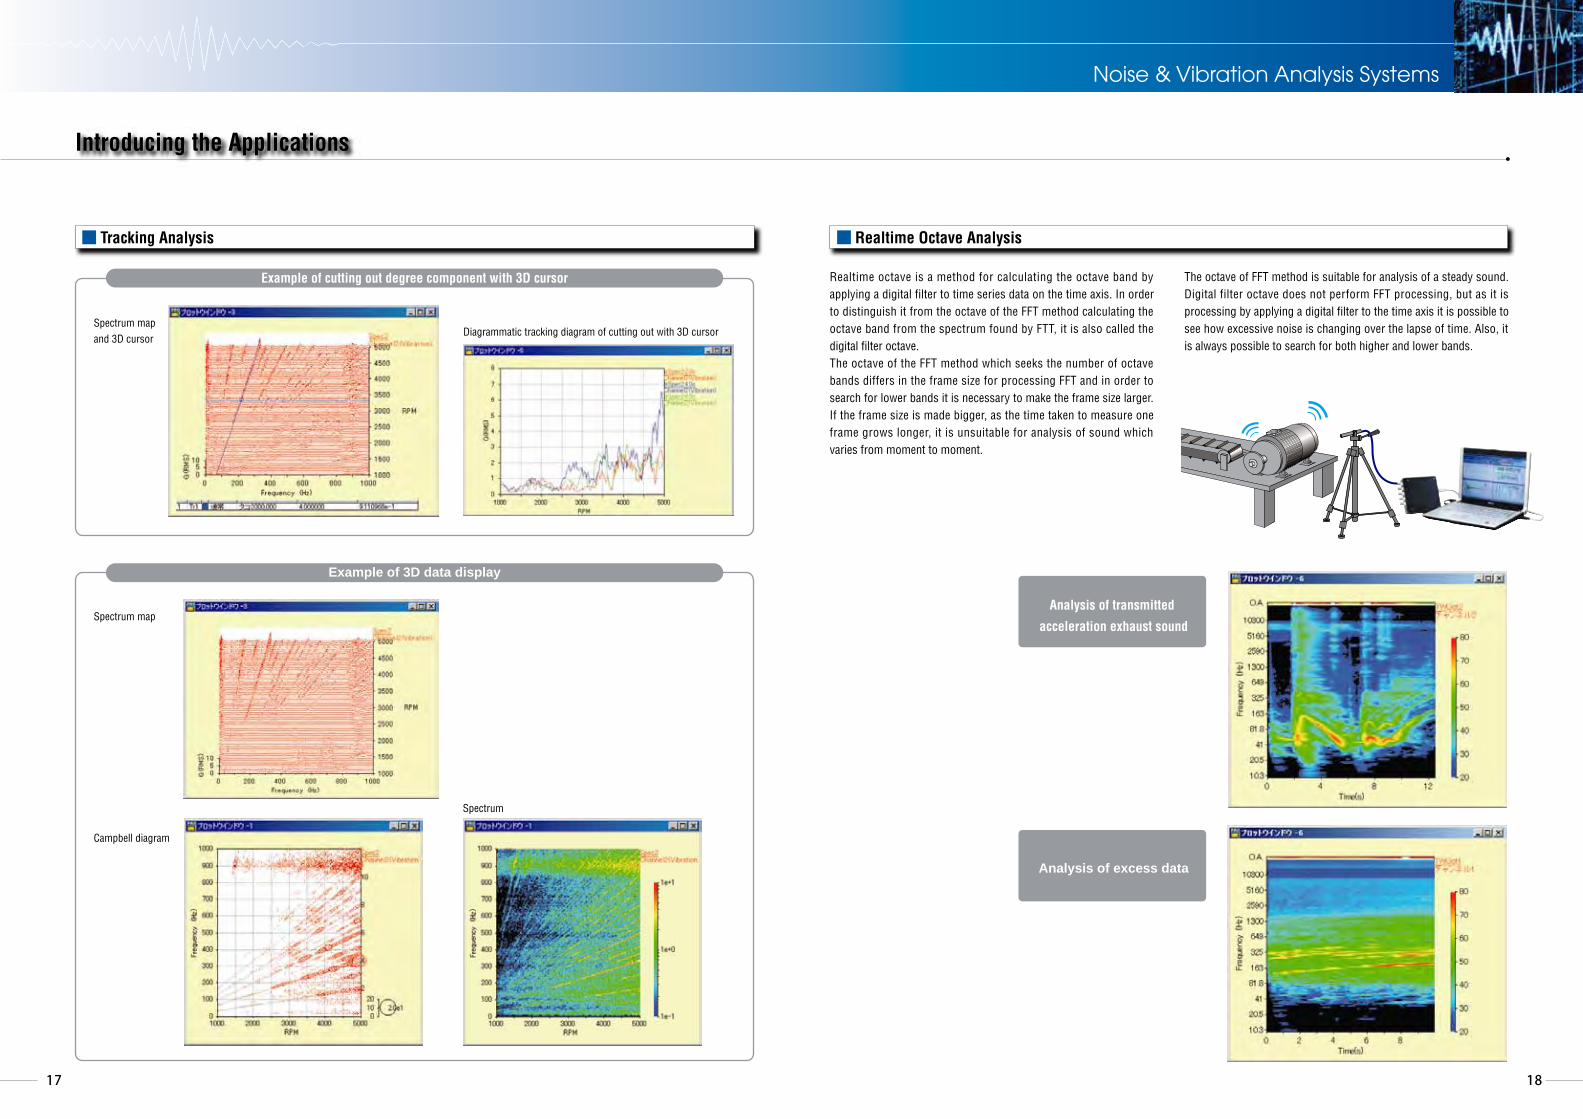
Example of 3D data display
Realtime octave is a method for calculating the octave band by applying a digital filter to time series data on the time axis. In order to distinguish it from the octave of the FFT method calculating the octave band from the spectrum found by FTT, it is also called the digital filter octave.The octave of the FFT method which seeks the number of octave bands differs in the frame size for processing FFT and in order to search for lower bands it is necessary to make the frame size larger. If the frame size is made bigger, as the time taken to measure one frame grows longer, it is unsuitable for analysis of sound which varies from moment to moment.
The octave of FFT method is suitable for analysis of a steady sound.Digital filter octave does not perform FFT processing, but as it is processing by applying a digital filter to the time axis it is possible to see how excessive noise is changing over the lapse of time. Also, it is always possible to search for both higher and lower bands.
Analysis of transmitted
acceleration exhaust sound
Analysis of excess data
Noise & Vibration Analysis Systems
Introducing the Applications
■ Tracking Analysis ■ Realtime Octave Analysis
Spectrum map and 3D cursor
Spectrum map
Campbell diagram
Spectrum
Diagrammatic tracking diagram of cutting out with 3D cursor
Example of cutting out degree component with 3D cursor
2019
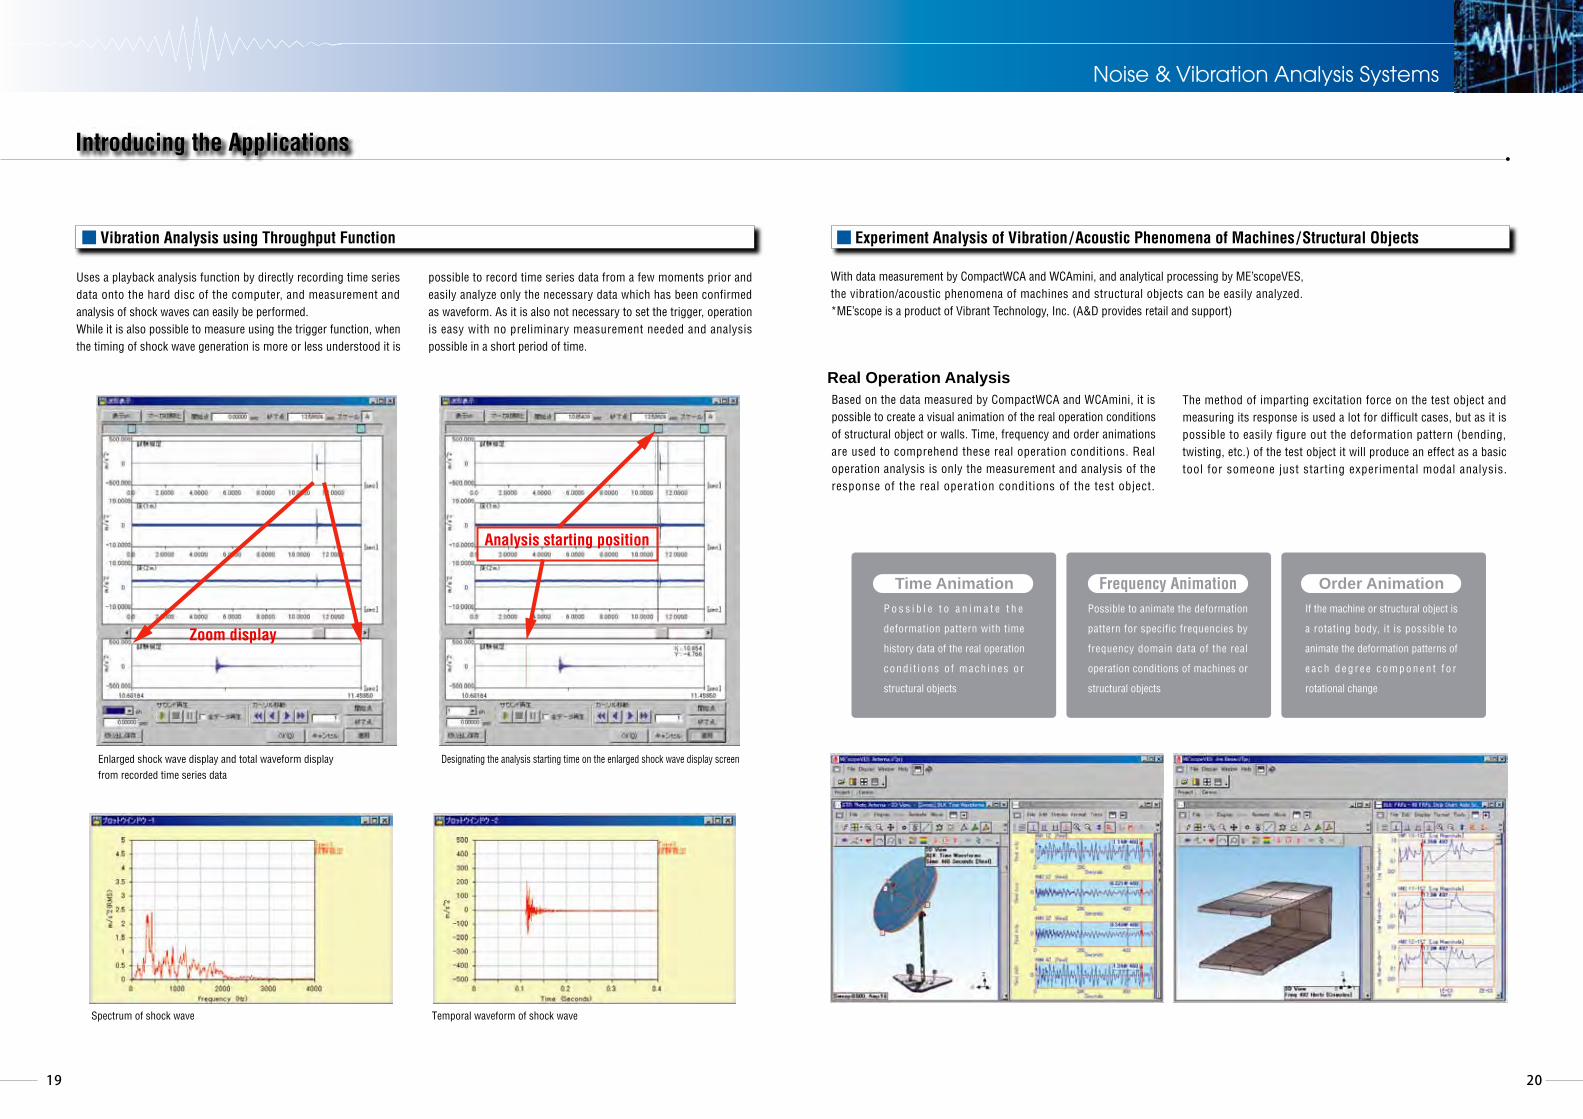
Uses a playback analysis function by directly recording time series data onto the hard disc of the computer, and measurement and analysis of shock waves can easily be performed.While it is also possible to measure using the trigger function, when the timing of shock wave generation is more or less understood it is
possible to record time series data from a few moments prior and easily analyze only the necessary data which has been confirmed as waveform. As it is also not necessary to set the trigger, operation is easy with no preliminary measurement needed and analysis possible in a short period of time.
■ Vibration Analysis using Throughput Function ■ Experiment Analysis of Vibration/Acoustic Phenomena of Machines/Structural Objects
Enlarged shock wave display and total waveform display from recorded time series data
Designating the analysis starting time on the enlarged shock wave display screen
Spectrum of shock wave Temporal waveform of shock wave
Analysis starting position
Zoom display
With data measurement by CompactWCA and WCAmini, and analytical processing by ME’scopeVES, the vibration/acoustic phenomena of machines and structural objects can be easily analyzed.*ME’scope is a product of Vibrant Technology, Inc. (A&D provides retail and support)
Based on the data measured by CompactWCA and WCAmini, it is possible to create a visual animation of the real operation conditions of structural object or walls. Time, frequency and order animations are used to comprehend these real operation conditions. Real operation analysis is only the measurement and analysis of the response of the real operation conditions of the test object.
The method of imparting excitation force on the test object and measuring its response is used a lot for difficult cases, but as it is possible to easily figure out the deformation pattern (bending, twisting, etc.) of the test object it will produce an effect as a basic tool for someone just starting experimental modal analysis.
Real Operation Analysis
Time AnimationP o s s i b l e t o a n i m a t e t h e
deformation pattern with time
history data of the real operation
cond i t i ons o f mach ines o r
structural objects
Frequency AnimationPossible to animate the deformation
pattern for specific frequencies by
frequency domain data of the real
operation conditions of machines or
structural objects
Order AnimationIf the machine or structural object is
a rotating body, it is possible to
animate the deformation patterns of
e a c h d e g r e e c o m p o n e n t f o r
rotational change
Noise & Vibration Analysis Systems
Introducing the Applications

2221
Experimental Modal AnalysisStress tracking can be performed using CompactWCA or WCAmini’s tracking analysis functions. Maximum stress and minimum stress synchronized to the number of revolutions are measured and intensity towards the parts of the rotary machine can be confirmed. From the maximum and minimum stresses the average and difference is sought and on the horizontal axis the stress tracking lines for the revolutions are drawn.
Sound AnalysisBased on data measured by CompactWCA and WCAmini, sound intensity, sound pressure level (SPL) and sound power are sought and it is possible to effectively display the relationship between the vibration of the surfaces of machines or structural objects and sound data. Further, with the creation of an animation displaying vibration and sound data together, vibration and sound issues can be tested.
■ Stress Tracking
Strain gauge
Amplifier
Rotation sensorDigital tachometer
123456
Introducing the Applications
Based on data measured by CompactWCA and WCAmini, it is possible to identify the unique vibration frequencies of structural objects (mode frequencies), damping ratios and mode shapes. With experimental modal analysis, from imparting excitation force on the test object, measuring the response, and using the transfer
function data from that response, the dynamic characteristics (unique vibration frequencies, damping ratios and mode shapes) of machines and structural objects can be sought. From mode shape, the differences in deformation patterns (bending, screwing, etc.) in each unique vibration frequency can be figured out.
Noise & Vibration Analysis Systems

2423
■ Field Balance
Sound power level measurement can be per formed using CompactWCA or WCAmini’s realtime octave analysis. Sound power level can be obtained from the sound pressure level recorded by 10 microphones set up on the measurement side of the object.
Field balance is determined by using the tracking analysis function of CompactWCA or WCAmini. The size of the unbalance of the rotating body is measured, and using the test weight it is possible to
define the attributes of the unbalance (location, mass) and reduce its size. Either a one-sided or two-sided balance can be corrected at just one speed.
[ Processing flow for a one-sided balance ]
With measurement by 1 point per 1 side, 1ch measurement channel and 1ch tach input are used.
(1) Initial test: data is gathered for the condition of the unbalance
(2) Test weight: Data collection with the test weight attached
(3) Modified calculation: Based on the above result,
mass and location of the test weight are calculated
(4) Confirmation test: Data collection with the test weight attached
Initial test
Test weight
Modified calculation
Confirmation test
Complete
Vibration signal no. 1Rotation signal
USB cable
Vibration signal no. 2
P C
MotorRotating body(rotor)
Rotation sensorAcceleration sensor
Digital rotation indicator123456
Connection example
Photocopying machine or similar
Basic microphone setup
Standard container
y
z
x
Measurement surface
Noise & Vibration Analysis Systems
Introducing the Applications
■ Sound Power Level Measurement

2625
It is possible to analyze the rotational fluctuation component from the rotational signal (time series data) recorded with the throughput function of CompactWCA or WCAmini.
By the instantaneous frequency method using analytical signals, the instantaneous angle of rotation of the rotating body can be sought. The f luctuat ion in the angle of rotat ion is found from the instantaneous angle of rotation and the difference from its average value of movement.
The torsional vibration component is found from the difference in the angle of rotation between two points on the rotational axis, e.g. drive side and load side.
By tracking analysis of the torsional vibration component, for the intensity between the two points on the axis, it can be learnt at around which frequency there is a transformation from rigid to soft, etc.
Rotational fluctuation and torsional vibration do not remain the cause of unwanted vibration noise, but can influence the durability of the rotating machinery, and sometimes could lead to damage of the system. It is very important to determine the resonance point of the degree component and unique frequency of the axis.
CompactWCA and WCAmini can be used to customize a user original vibration noise analysis system
●WCAPRO can be freely controlled with COM interface
●An original system is presented, applying 27 years of history of the FFT analyzer and an abundance of support experience
An operation system is realized with user control of FFT analysis, hammering analysis, octave band analysis and further original analysis by the user
① Channel settings② Calibration③ Collection condition settings④ Analysis condition settings⑤ Data collection
⑥ Measurement data confirmation⑦ Data saved⑧ Post-processing⑨ Graph display/printing⑩ Data management
FFT analysis
Tracking analysis
[ Example of torsional rotation analysis ]
Main menu
Screen during measurement
FFT analysis menu
Settings are for necessary functions
only, other settings are automatically
set on the customized application for
improved work efficiency.
With the same operation system used
for different types of analysis a manual
is no longer needed.
Example of Customization
Vibration Noise Total Analysis System
Electromagnetic pickup
Intended usage : rotational fluctuation analysis of ship engines
Torsional vibration analysis of the crankshaft of car engines
Ch1 rotational pulse signalCh2 rotational pulse signal
Computation of the angle of rotation using instantaneous frequency
Difference in the angle of rotation between two channels
Fluctuation Ch1
Fluctuation Ch2
Torsion Ch1-2
Signal
Fourier transformation
Set the frequency of the load to zero
Inverse Fourier transformation
Instantaneous phase (frequency)
Calculate the average value ofmovement and its difference
Fluctuation in angle of rotation
Time seriesdata file
Extraction of rotational fluctuation(torsional vibration) component
Noise & Vibration Analysis Systems
Introducing the Applications
■ Customization based on years of experience■ Rotational Fluctuation/Torsional Vibration Analysis
Time seriesdata file
Recording of time series data

2827
Testing System with Durable Operational Performance Performance Testing SystemVibration, unwanted noise, temperature, load data, etc. can be measured over a long duration and performance tests performed.As abnormal values trigger an alarm and stop the testing device, it is possible to keep any damage to the device to a minimum.
CompactWCA
Transmission method
DIO, Ethernet, Serial, etc
■ Customization based on years of experience
Please try formulating your own personalized vibration and sound analysis system.Office-wide operating procedures or configurations can be refined and with data management the efficiency of test results can be improved.For repeatable tests, by pre-defining measurement patterns automatic measurement can be realized.A&D’s customization skills garnered through years of experience can be of use to any customer.
● Extraction of peak value at each designated section
and statistical processing possible
● Possible to save analysis data and output as text
● Possible to redisplay saved and overwritten data
● Possible to print graph display (individual or collated)
Vibration
Unwanted noise
Temperature
Rotation pulse
Amplifier
It is possible to automatically repeat tracking analysis on the operation pattern of transmission benches, etc., and conduct performance tests.
By performing consecutive sound and vibration analysis when
testing the durability of an engine’s transmission or brakes, etc.,
it can be applied as abnormal or evaluative back data.
Together with a safer testing environment, it can be of great help
for endurance testing.
Strain gauge
Noise & Vibration Analysis Systems
Introducing the Applications
● Possible to perform tracking analysis on vibrations and unwanted noise together,
and make judgments according to standard values
● Possible to gather data for a spectrum map,
and perform degree processing by post-processing
● Degree spectrum analysis possible at steady rotation time