Embed Size (px)
Citation preview

Accelerating your Revenue Cycle:From Patient Encounter Through Account Resolution
Chastity D. Werner, RHIT, CMPE, NCP
NextGen Educational SeriesJuly 22, 2014

Learning Objectives
Characteristics of Best Performers
Efficient Encounters = Revenue Cycle Success
Measuring Revenue Cycle Performance
Identifying Your Opportunities

Accelerating your Revenue Cycle:
Characteristics of Best Performers• Technology• Staff• Payers• Process
From Patient Encounter Through Account Resolution

Characteristics of Best Performers
Technology• Systems
Interface when possible Efficient templates

Characteristics of Best Performers
Technology• HIE

Characteristics of Best Performers
Technology• EHR/PMS communicate• Upgraded regularly• Continued education• Embrace new opportunities

Schedulers
Efficient, strong phone & customer service skills, understands billing process, well trained in patient collections and payer policies and procedures.
Characteristics of Best Performers
Staff• Right fit• Productivity• Weekly meetings
Front desk
Smiles, friendly, efficient, multi-tasking abilities, high energy, strong communication skills, organized, well trained in patient collections.
Set expectations:
They represent your officePatients are firstTeam environmentBilling issues affect all departments
Reasons for underproduction
Do not know what to do
Do not know how to do it
Do not know why they are doing it
My way is better
Something else is more important
I must be doing it, you left me alone
I am rewarded for not doing it
Weekly meetingCharges/payments
Payer updates/changes
Patient issues
Upcoming events
Training
Areas of concern
End it on a positive note!
Always follow-up on questions/concerns
Time to huddle….let’s go team!

Characteristics of Best Performers
Staff• Team player• Reinvest• The “Why” factor
THE
“WHY” FACTOR

Characteristics of Best Performers
“The lowest level of performance by any employee, allowed to continue without corrective action, becomes the highest level of performance that can be required of any other employee in a similar position with the employer.”
Mini-Max Principal
Reference: Rosemarie Nelson MGMA Healthcare ConsultantThe ROI of IT: Best Billing Practices

Characteristics of Best Performers
Payers• Credentialing• Payment rules• Appeal process• Stay up-to-date
http://www.ama-assn.org/ama/pub/physician-resources/practice-management-center/health-insurer-payer-relations/payer-specific-information.page?
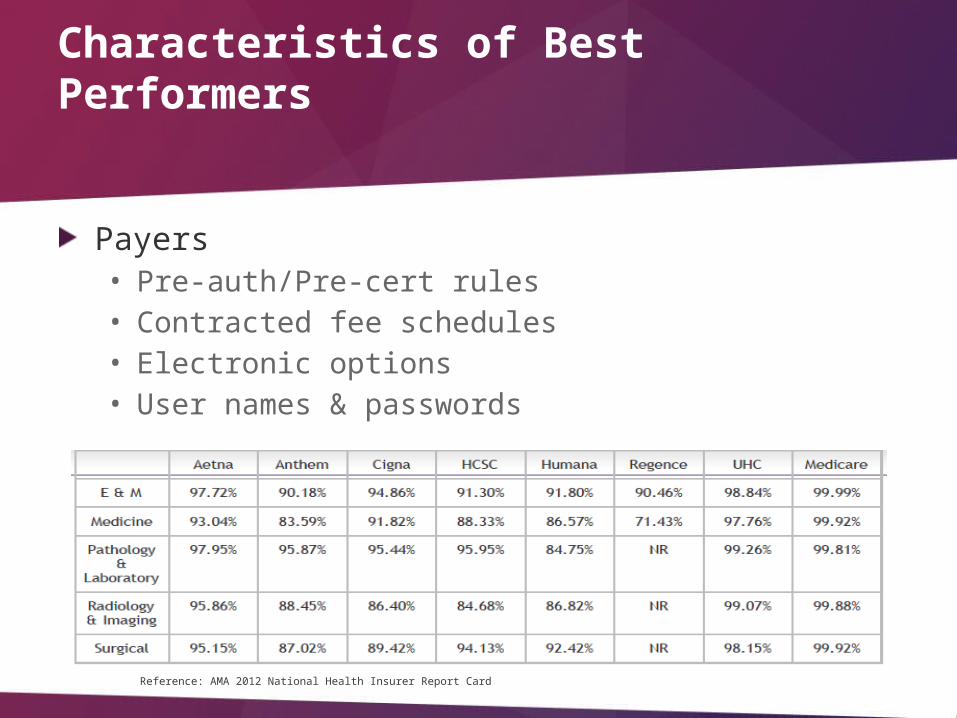
Characteristics of Best Performers
Payers• Pre-auth/Pre-cert rules• Contracted fee schedules• Electronic options• User names & passwords
Reference: AMA 2012 National Health Insurer Report Card

Characteristics of Best Performers
Process• Does it make sense?• Uniform• Set expectations• Policies & procedures
Standardized Update regularly

EFFICIENT ENCOUNTERS = REVENUE CYCLE SUCCESS

Accelerating your Revenue Cycle:
Efficient encounters• Scheduling• Eligibility & benefits verification• TOS• Claims generation• Payment processes• Account resolution• Collection process
From Patient Encounter Through Account Resolution

Efficient Encounters = Revenue Cycle Success
SchedulingCapture the right information
Account review
Patient expectations
Patient demographics
Work #, cell phone, email
Guarantor details
Employer information
Insurance details
“Ms. Smith,I see you have a past due amount of
$50.00. How would you like to take care of that today? We accept Visa,
MasterCard, or do you have an FSA?”“We expect payment at the
time of service. ”

Sources: (left) Kaiser Family Foundation/Health Research and Educational Trust, Employer Health Benefits Annual Surveys, 1999–2012; (right) authors’ estimates based on CPS ASEC 2001–12, Kaiser/HRET 2001–12, CMS OACT 2012–21.
Projected average family premium as a percentage of median family
income, 2013–2021
Cumulative changes in insurance premiums and workers’ earnings,
1999–2012%%
180%
47%
38%
Projected
172%
Efficient Encounters = Revenue Cycle Success
Eligibility & Benefits

Efficient Encounters = Revenue Cycle Success
Eligibility & Benefits
Percentage of Covered Workers Enrolled in a Plan with a General Annual Deductible of $1,000 or More for Single Coverage
Note: These estimates include workers enrolled in HDHP/SO and other plan types. Source: Kaiser/HRET Survey of Employer-Sponsored Health Benefits, 2006-2010.
“National health expenditures are expected to increase from $2.9 trillion to $5.5 trillion. Business and households are projected to pay half of total nation health care costs in 2023, while the federal government will pay 32% and state and local governments will pay 18%.
Confronting Costs: Stabilizing U.S. Health Spending While Moving Toward High Performance Health Care System. 2012

Efficient Encounters = Revenue Cycle Success
Reference: InstaMed Trends in Healthcare Payments Annual Report: 2012
% of providers who knew
patient responsibility at
the TOS
% of patients who knew their
financial responsibility
It costs between $0.05-$0.74 to check
eligibility
How much will it save you to know what your
patient owes at the TOS?
Eligibility & BenefitsVerification

Efficient Encounters = Revenue Cycle Success
Reference: http://www.aetna.com/provider/medical/service_med/electronic_med/edi_calculator/EDI_Savings_Calc.html
Eligibility & benefits verification• Increase time with patients• Faster payments• Increased efficiency

Efficient Encounters = Revenue Cycle Success
Eligibility & Benefits Verification
Automate
Centralize
Payer websites
Is it worth it? Choose your criteria:ServicesPayers
Everything
Use the information obtained!
3 days in advance

Efficient Encounters = Revenue Cycle Success
Compare coverage toexpected treatment & fee schedule
Contact patient– patient counseling
Set alerts in system & schedule
Collect at TOS
Eligibility & Benefits Verification

Efficient Encounters = Revenue Cycle Success
TOS• Confirm information• Collect at check-in• Collect at check-out
“How would you like to pay today? We accept Visa, MasterCard, cash and checks.”

Efficient Encounters = Revenue Cycle Success
“If patient payments are not managed correctly, they can cost three to five times more to collect than payer payments due to paper-based, manual processes.
These costs are further escalated by rising patient bad debt, which was estimated to have been more than $65 billion in 2010.”
High deductible health plans have increased from1,000,000 to over 11,000,000 since 2005.
TOS Collection % for Providers
Reason the provider did not collect
Reference: InstaMed Trends in Healthcare Payments Annual Report: 2012
TOS

Efficient Encounters = Revenue Cycle Success
TOS• Complete record 24 hours• Computer Assisted Coding (CAC)• Interface charges
Do your providers override the
suggested codes?

Efficient Encounters = Revenue Cycle Success
Claim generation• Charge lag 24 hours (48
hours out of office services)• Claim scrubbing
Edits Correction
Do you update your claim edits on a regular basis?

Efficient Encounters = Revenue Cycle Success
Utilize a clearinghouse
Submit charges within 24-48
hours
Initial follow-up24 hours
Level 1 rejections
997 claim rejection report
277u claim status report

Efficient Encounters = Revenue Cycle Success
Payment Processing
Reconciliation
ERA/EFT
PPACA
Zero pays
Automate
46%51%
6% increase over 2 year period
Reference: InstaMed Trends in Healthcare Payments Annual Report: 2012
Reason payer payments were not
received electronically

Efficient Encounters = Revenue Cycle Success
Reference: www.cms.gov/.../HIPAA-Administrative-Simplification/.../Deadlines-and...
Payment processing• PPACA

Efficient Encounters = Revenue Cycle Success
Reference: AMA 2012 National Health Insurer Report Card
Payment Processing
96 – Non-covered charge(s). At least one Remark Code must be provided.
Claim Adjustment Reason Codes
(CARC)
Claim adjustment reason codes communicate an adjustment, meaning that they must communicate why a claim or service line was paid differently than it was billed. If there is no adjustment to a claim/line, then there is no adjustment reason code.
16 – Claim/service lacks information which is needed for adjudication. At least one Remark Code must be provided.
www.wpc-edi.com/reference/codelists/healthcare/
204 – The service/equipment/drug is not covered under the patient’s current plan.

Efficient Encounters = Revenue Cycle Success
Reference: AMA 2012 National Health Insurer Report Card www.wpc-edi.com/reference/codelists/healthcare/
Remittance Advice Remark Codes (RARC)
Remittance Advice Remark Codes (RARCs) are used to provide additional explanation for an adjustment already described by a CARC or to convey information about remittance processing. Each RARC identifies a specific message as shown in the RARC List. There are two types of RARCs- majority are supplemental to the CARC codes, but some are for information purposes only.
N130 – Consult plan benefit documents or guidelines for information about restrictions for this service.
N179 – Additional information has been requested from the member. The charges will be reconsidered upon receipt of that information.
Payment ProcessingN386 – The decision was based on a National Coverage Determination (NCD). An NCD provides a coverage determination as to whether a particular item or service is covered. A copy of this policy is available at www.cms.gov/mcd/search.asp. if you do not have web access, you may contact the contractor to request a copy of the NCD.

Efficient Encounters = Revenue Cycle Success
Payment Processing• Contractual • Non-contractual• Post all zero pays• Utilize system automation• Reconciliation

Efficient Encounters = Revenue Cycle Success
Payment processing• Reconciliation Process:
1) Separate deposits 2) One batch per deposit (i.e. ERA/EFT) 3) Uniform batch description
» (i.e. $34,584.03 Anthem 5/6/2013) 4) Match to bank deposits to system
» Download each into Excel format» Data sort by dollar amount» Utilize other data to compare if needed

Efficient Encounters = Revenue Cycle Success
Patient Statements• Electronic statements
Cost 58% less than paper
• Make it convenient• Two statements
Day 0 Day 30
• Collection letter Day 60• Day 75 turnover
E-statements save providers approximately 42% compared
to paper statements.
In paying their medical bills electronically
It is estimated that consumers in the U.S. will spend more than
$300 billion online in 2016.
Increased 7% from 2011-2012
% of patients receiving
medical bills via email
Reference: InstaMed Trends in Healthcare Payments Annual Report: 2012Reference: Gartner Group, HFMA, and HH&N Research

Efficient Encounters = Revenue Cycle Success
Account resolution• 24 hours after submission• Universal note area• 277/997 reports• Automate when possible• Appropriate reports• Review notes & tasks• 14-21 days clearinghouse• 31+ days payer website/phone
Payer
High $$$ Down
DOS
Group by Patient
Report Criteria

______________
Efficient Encounters = Revenue Cycle Success
Denied Claims
Submitted Claims=
Denial Rate

Efficient Encounters = Revenue Cycle Success
100 claims a day X 20 days a month
2,000 claims
20% denial rate
2,000 claims X 20% = 400 claims
33% of denials are never recovered
400 X 33% = 132
132 X $100.00 (average reimbursement) = $13,200 monthly
Source: The Physician Billing Process: 12 potholes to avoid in the road to getting paid, ed 2, Walker-Keegan, Woodcock, Larch.13
$158,400 Annually

Efficient Encounters = Revenue Cycle Success
Source: The Physician Billing Process: 12 potholes to avoid in the road to getting paid, ed 2, Walker-Keegan, Woodcock, Larch.13
$10.67 staff time
$ 1.50 supplies
$ 1.75 interest
$ 1.00 overhead_______________________
$14.92
$14.92x 400
$5,968Monthly
_______$5,968x 12
$71,616Annually
________
Cost of working denials

Efficient Encounters = Revenue Cycle Success
Denial Management
Should it be written off?
Contractual versus non-contractual
adjustment
Is a correction needed?
If so,correct & resubmit!
Should it be appealed?
Collect data, follow payer process,
involve patient & track status

Efficient Encounters = Revenue Cycle Success
Collection process• Automate process• Monitor results• Write-off at turnover
Write off utilizing specific code; create reports by specific code to track
agency results.
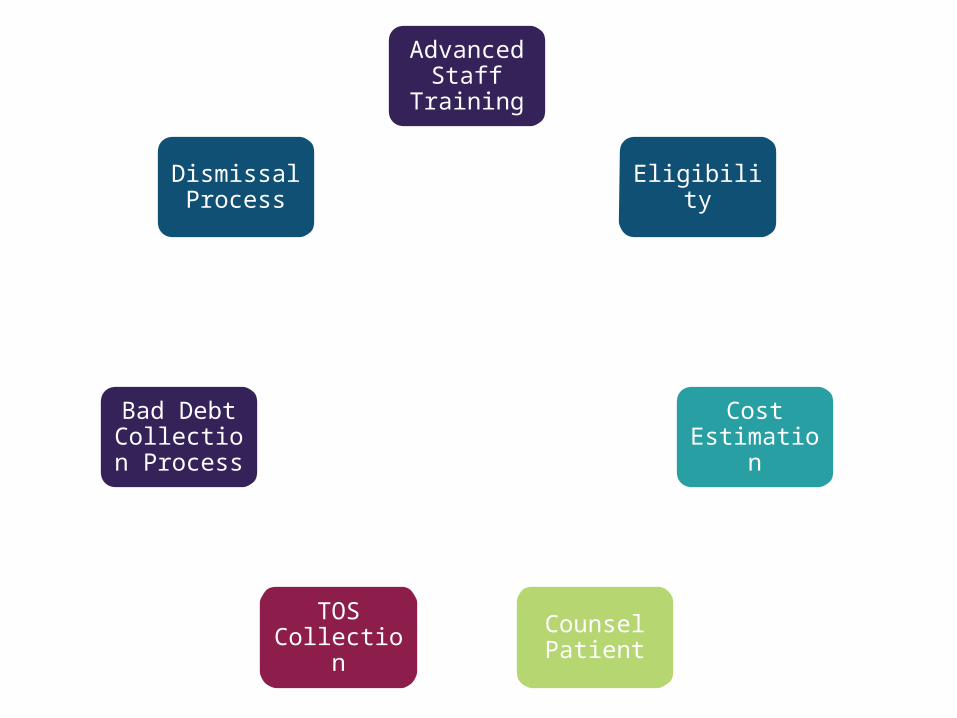
Advanced Staff Training
Eligibility
Cost Estimation
Counsel Patient
TOS Collection
Bad Debt Collection Process
Dismissal Process

Efficient Encounters = Revenue Cycle Success
Reference: http://caqh.org/eft_enrollment.phpCAQH Universal EFT Enrollment
Where do you go from here?Decide what is right for your practice!
Investigate your options
Automate when possible
Centralize processes
Stay up-to-date on new options
Partner with your clearinghouse
Keep an open mind
Think outside the box

MEASURING REVENUE CYCLE PERFORMANCE

Measuring Revenue Cycle Performance• What is important?• Reporting and analysis• Tracking and acting
Accelerating your Revenue Cycle:From Patient Encounter Through Account Resolution

Measuring Revenue Cycle Performance
What is important?• Collections
Cash in the door
• Production Units to produce the cash

Measuring Revenue Cycle Performance
What is important? Collections!• A/R
Charges, payments, & adjustments– Provider– Practice
Days outstanding Payer mix Collections per RVU
– Service line– Provider

Measuring Revenue Cycle Performance
What is important? Collections• Payments
Third party– Underpayments– Denials and rejections
Patient– TOS collections– Commitment to payment plans

Measuring Revenue Cycle Performance
What is important? Collections• Credit balances
Patient Third party
• Bad debt % bad debt to total revenue Collection agency recovery

Measuring Revenue Cycle Performance
What is important? Production!• CPT/RVU production
Location Provider
• Case mix Location Provider

Measuring Revenue Cycle Performance
“You cannot manage what you do not
measure.”
“In Search of Excellence” Tom Peters
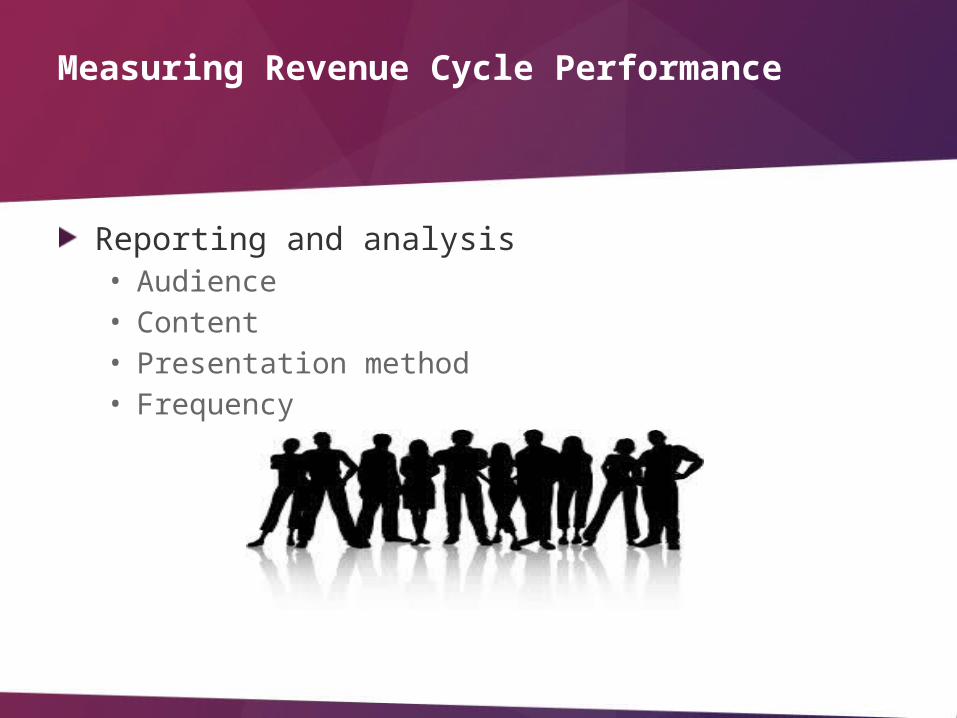
Measuring Revenue Cycle Performance
Reporting and analysis• Audience• Content• Presentation method• Frequency

Measuring Revenue Cycle Performance
Reporting and analysis• Audience - Providers
Short & sweet Personalized
• Audience - Executive Broader content
• Presentation method Narrative Columnar Graphical

Measuring Revenue Cycle Performance
Reporting and analysis• Daily
Denials and rejections TOS collections Appointments with no charges EFT/ERA reconciliations

Measuring Revenue Cycle Performance
Reporting and analysis• Weekly
Third party underpayments TOS collections

Measuring Revenue Cycle Performance
Reporting and analysis• Monthly
Charges/payments/adjustments CPT/RVU utilization Denials and rejections summary Bad debt Credit balances Patient underpayments

Measuring Revenue Cycle Performance
Reporting and analysis• Quarterly
Capitation plan performance Payer mix
– Charges– Payments
• Annually Fee schedule assessment Capitation plan performance Budgeted revenue vs. actual revenue Budget production vs. actual production

Measuring Revenue Cycle Performance
Tracking and acting• KPI
Data point or criteria
• Benchmark Type of KPI Data point to measure results against Internal or external

Measuring Revenue Cycle Performance
Tracking and acting• Why use KPI’s?
Measure what’s important Identify trends Compare progress to expectations Incentivize desired behaviors

Measuring Revenue Cycle Performance
Tracking and acting• KPIs
% Co-pays collected vs. total possible co-pays Charge lags
– Office visits– Off-site services
Budgeted charges % clean claims Unbilled charges Staff production standards Denials Payer mix

Measuring Revenue Cycle Performance
Tracking and acting• How do you use KPI’s?• Dashboard
Snapshot summary of key results– Internal benchmarks
» Historical– External benchmarks
» Marketplace» Industry

Measuring Revenue Cycle Performance
Tracking and acting• Dashboard
Decide what’s most important Identify the data point to measure Identify the benchmark for comparison Design dashboard to meet your practice’s needs Populate dashboard Act on variances to the benchmark

Measuring Revenue Cycle Performance
Key IndicatorsIndicator Calculation Significance Frequency Trend
Gross Days Receivable Outstanding (DRO)
Total A/R divided by Average Daily Charge
Indicates how long it takes to convert a claim into cash. Monthly
Should be downward trend- Less than 30
Gross Calculation Ratio
Total YTD Payments divided by Total YTD Charges
Indicates proportion of charges that are converted to cash. Monthly Should be upward trend.
Net Collection Ratio
Total YTD Payments divided by Total YTD Charges less YTD Contractual Adjustments
Indicates effectiveness of collection efforts on potential dollars, including point of service payments. Monthly
Should be upward trend. 96% or greater.
% Insurance A/R 90+ Days
Insurance A/R greater than 90 days divided by Total Insurance A/R
Low proportion indicates that accounts are collected effectively.
MonthlyShould be downward trend- Less than 10%
Identify KPIs and Benchmarks
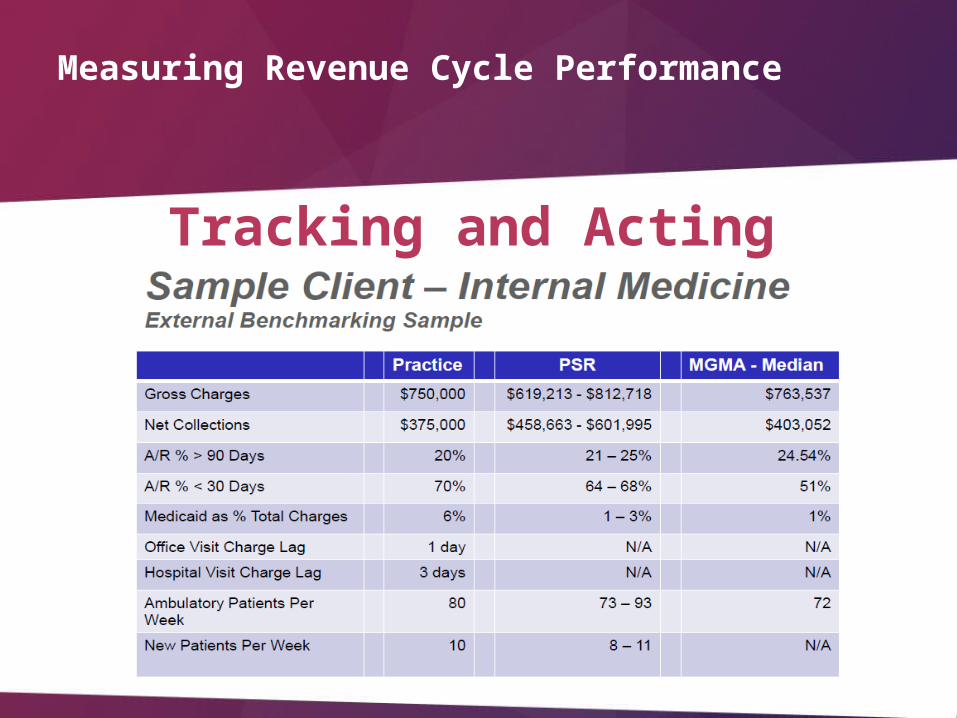
Measuring Revenue Cycle Performance
Tracking and Acting

Measuring Revenue Cycle Performance
Month Charge Amount Adjustment Amount Payments
Jan-11 $ 47,163.00 $ 3,756.00 $ 8,545.00
Feb-11 $ 74,423.00 $ 18,543.00 $33,769.00
Mar-11 $ 88,231.00 $ 36,833.00 $56,173.00
Apr-11 $ 79,734.00 $ 35,148.00 $59,501.00
May-11 $ 80,554.00 $ 18,787.00 $43,334.00
Jun-11 $ 77,603.00 $ 30,781.00 $55,724.00
Jul-11 $ 83,068.00 $ 29,480.00 $59,983.00
Aug-11 $ 71,680.00 $ 18,202.00 $36,654.00
Sep-11 $ 91,644.00 $ 28,819.00 $55,324.00
Oct-11 $ 84,040.00 $ 29,118.00 $53,786.00
Nov-11 $ 68,435.00 $ 36,704.00 $54,793.00
Dec-11 $ 98,092.00 $ 29,624.00 $52,754.00
$40,544 $40,575 $40,603 $40,634 $40,664 $40,695 $40,725 $40,756 $40,787 $40,817 $40,848 $40,878
$- $50,000 $100,000 $150,000
Payments
Adjustment Amount
Charge Amount
Decrease in charges one month means decrease in
payments succeeding month!
Tracking and Acting
Analyze charges, adjustments & payments monthly. Correlate with practice/provider production.

Measuring Revenue Cycle Performance
Payment Analysis Payer Name Encounter Chg Amt Count Adj Amt Allowed Amount Fee Schedule Variance99204 Anthem Blue Choice PPO 15302 $225.00 1 -$105.00 -$120.00 $125.93 -$5.9399204 Anthem Blue Choice PPO 15536 $225.00 1 -$102.00 -$123.00 $125.93 -$2.9399204 Anthem Blue Choice PPO 16075 $225.00 1 -$102.00 -$123.00 $125.93 -$2.9399204 Anthem Blue Choice PPO 16077 $225.00 1 -$102.00 -$123.00 $125.93 -$2.9399204 Anthem Blue Choice PPO 16078 $225.00 1 -$102.00 -$123.00 $125.93 -$2.9399204 Anthem Blue Choice PPO 17630 $225.00 1 -$185.00 -$40.00 $125.93 -$85.9399204 Anthem Blue Choice PPO 17631 $225.00 1 -$185.00 -$40.00 $125.93 -$85.9399204 Anthem Blue Choice PPO 17721 $225.00 1 -$139.07 -$85.93 $125.93 -$40.0099204 Anthem Blue Choice PPO 17722 $225.00 1 -$139.07 -$85.93 $125.93 -$40.0099204 Anthem Blue Choice PPO 18002 $225.00 1 -$205.00 -$20.00 $125.93 -$105.9399204 Anthem Blue Choice PPO 18121 $225.00 1 -$100.42 -$124.58 $125.93 -$1.3599204 Anthem Blue Choice PPO 18179 $225.00 1 -$99.07 -$125.93 $125.93 $0.0099204 Anthem Blue Choice PPO 18203 $225.00 1 -$99.07 -$125.93 $125.93 $0.0099204 Anthem Blue Choice PPO 18363 $225.00 1 -$100.42 -$124.58 $125.93 -$1.3599204 Anthem Blue Choice PPO 18715 $225.00 1 -$99.07 -$125.93 $125.93 $0.0099204 Anthem Blue Choice PPO 18821 $225.00 1 -$99.07 -$125.93 $125.93 $0.0099204 Anthem Blue Choice PPO 18862 $225.00 1 -$139.07 -$85.93 $125.93 -$40.0099204 Anthem Blue Choice PPO 19051 $225.00 1 -$99.07 -$125.93 $125.93 $0.0099204 Anthem Blue Choice PPO 19605 $225.00 1 -$100.42 -$124.58 $125.93 -$1.3599204 Anthem Blue Choice PPO 19734 $225.00 1 -$99.07 -$125.93 $125.93 $0.0099204 Anthem Blue Choice PPO 19755 $225.00 1 -$99.07 -$125.93 $125.93 $0.0099204 Anthem Blue Choice PPO 19867 $225.00 1 -$99.07 -$125.93 $125.93 $0.0099204 Anthem Blue Choice PPO 20213 $225.00 1 -$99.07 -$125.93 $125.93 $0.00
•Run CPT report for date span, by appropriate payer, & including “Allowed Amount” •Export the file from PMS to Excel•Insert column with allowed amount if needed•Create conditional formula to identify variances
Compare “allowed amount” not paid
amount

DOS to date of documentation
(DOD)
Measuring Revenue Cycle Performance
Start heretracking results

IDENTIFYING YOUR OPPORTUNITIES

Identifying Your Opportunities• Assess the situation
Revenue cycle assessment System assessment
• Prioritize the opportunities• Develop plan for capitalizing• Implement plan• Monitor and track results
Accelerating your Revenue Cycle:From Patient Encounter Through Account Resolution

Identifying Your Opportunities
Revenue cycle assessment• Lost revenue• Staff productivity and quality• Provider documentation• Payer billing issues• Common denials• Missing links in process

Identifying Your Opportunities
Revenue cycle assessment• Select span of time
90, 120 or 180 days?
• Set expectations Charge lag time
– 24 hours Bill lag time
– 48 hours Claim note
– 30 days Work denial
– 24 hours Collection agency turnover
– 90 days from patient responsibility

Identifying Your Opportunities
Patient Name (L, F) Payer DOS Code(s) Charges DCE DCFDate Paid Paid Adj. Balance Activity Status Rating
1 2 3 4 5 6 7 8 9
10 11 12 13 14 15
TotalAverage
Legend:DCE - Date Charge EnteredDCF - Date Claim Filed
Tracking Results

Identifying Your Opportunities
System assessment EHR PMS Interfaces
• Set criteria

Accelerating your Revenue Cycle
What Does An Accelerated Revenue Cycle Mean?• Communication• Efficient processes• Effective procedures• Optimal systems utilization• Effective use of resources• Attentive management
From Patient Encounter Through Account Resolution

Accelerating your Revenue Cycle
What Does An Accelerated Revenue Cycle Mean?
Maximum return on investment on accounts receivables.
More Revenue.
More Quickly!
From Patient Encounter Through Account Resolution

Accelerating your Revenue CycleFrom Patient Encounter Through Account Resolution

www.anderscpa.com/webinar-series
September 18
Sustainable Compensation Models that Incentivize: Trends & Examples
November 6
Operational Effectiveness and Profitability: Identifying and Prioritizing Opportunities
December 4Keeping the Financial Pulse of Your Practice Healthy: Benchmarking and Trends

Anders Health Care Services
Anders Health Care Services optimizes staff, resources and revenue for hospitals and
physicians by offering solutions and direction to complex practice management issues.
We provide an integrated approach from the financial, operational, compliance and strategic
perspectives.

Anders Health Care Services
Jerrie K. Weith, FHFMA, CMPE
314-655-5558
Chastity D. Werner, RHIT, CMPE, NCP
314-655-5561

Anders Health Care Services
Jessica Johnson [email protected]
Brian McCook [email protected]
John McGuire [email protected]
Brian Meyers [email protected]
314-655-5500
www.andershealthcare.com