Embed Size (px)
Citation preview

March, 2001 ECN-C--01-052
Accelerating the Market Penetration of Renewable EnergyTechnologies in South Africa
J. W. Martens (ECN)T.J. de Lange (ECN)
J. Cloin (ECN)S. Szewczuk (CSIR)
R. Morris (RMA)J. Zak (UCCEE-RISØ)

2 ECN-C--01-052
AcknowledgementThis report is the final publication under the European Commission Synergy Programme project‘Strategy to accelerate the Market Penetration of Renewable Energy Technologies in South Af-rica’, registered under contract number 4.1041/D/99-033. The Netherlands Energy ResearchFoundation ECN (co-ordinator), CSIR, UNEP Collaborating Centre on Energy and the Envi-ronment/RISOE and Richard Morris and Associates have carried out this project between De-cember 1999 and March 2001.
During the study various stakeholders in the South African renewable energy sector have beeninterviewed, including representatives of renewable energy industry, the Solar Energy Societyof South Africa Department of Minerals and Energy, ESKOM, research institutes, municipali-ties and private consultants. At the end of the project, the results of the study have been dis-cussed at a 2 - day workshop at the CSIR premises in Pretoria. The proceedings of the workshopare on the Internet: www.ecn.nl/unit_bs/resa/main.html. The project team would like to expressits sincere gratitude to all those who have taken their time and effort to provide us with infor-mation and their views on the various aspects of renewable energy in South Africa. These inputshave considerably improved the quality of our work. Also particular reference should be madeto the DANCED/DME study on Bulk Renewable Energy Independent Power Producers(DANCED, 2001), which provided major input in recommendations for grid-connected renew-able energy. The responsibility of the text, including its inevitable flaws, remains with theauthors.
This study was awarded funding under the EU Synergy Programme in 1999. Besides the Euro-pean Commission Synergy Programme each of the respective participating organisations con-tributed half of their expenses under this project. The support from the European Commissionand each participating organisation has been highly appreciated. The funding by the EU does byno means imply that this report contains EU-statements.
AbstractThere exists a big potential for renewable energy technologies in South Africa and despite thefact that rapid growth of the application of renewable energy is taken place in many parts of theworld, the current installed renewable capacity in South Africa is negligible. The objective ofthis study was to address this gap by analysing ways to accelerate the market penetration of re-newable energy technologies in South Africa. The activities undertaken in this study containtwo major components: a thorough analysis of South Africa's specific constraints and barriers torenewable energy implementation, and a review of the lessons learnt from Member States of theEU on the promotion of renewable energy development.
The focus of the study was restricted to the analysis of electricity generating technologies, inparticular solar, biomass, wind and mini-hydro renewable energy technologies. The report sug-gests recommendations to stimulate the market penetration of renewable energy technologies inSouth Africa. They are structured in:• actions to enhance the policy framework for renewable power generation,• actions to enhance the policy framework for off-grid renewable energy, and• recommendations to stimulate renewable energy project development.

ECN-C--01-052 3
CONTENTSLIST OF ACRONYMS AND ABBREVIATIONS 6
EXECUTIVE SUMMARY 9
1. INTRODUCTION 121.1 Background: Renewable Energy in South Africa 121.2 European Experience 121.3 Methodology and structure of the report 13
2. CURRENT ENERGY ISSUES IN SOUTH AFRICA 172.1 Introduction 172.2 South African energy demand sectors 19
2.2.1 Households 202.2.2 Industry, commerce and mining 202.2.3 Transport 202.2.4 Agriculture 20
2.3 South African energy supply sectors 202.3.1 Electricity 202.3.2 Nuclear energy 202.3.3 Oil: exploration 202.3.4 Oil Production and Import 212.3.5 Gas 212.3.6 Coal 212.3.7 Renewable energy sources 21
2.4 Reconstruction and Development Programme (RDP) 212.5 White Paper on Energy Policy 22
2.5.1 Energy policy priorities, 1998 White Paper 232.6 Cross-cutting issues 24
2.6.1 Integrated energy planning 242.6.2 Energy efficiency 242.6.3 Capacity building, education and information dissemination 242.6.4 International energy trade and co-operation 252.6.5 Governance and institutional capacities 25
2.7 Restructuring of Electricity Generation, Transmission & Distribution Industry 25
3. RENEWABLE POWER GENERATION 263.1 Current grid-connected renewable power generation 27
3.1.1 ESKOM’s Sabre-Gen Programme 273.1.2 Other ESKOM renewable energy projects 293.1.3 Renewable power generation by IPPs and REDs 29
3.2 Barriers 323.2.1 Economic and financial viability 323.2.2 Restructuring ESKOM and the municipal distribution companies 343.2.3 IPP regulatory framework 35
3.3 Support for renewables within the restructuring process 363.4 Opportunities for further actions 37
3.4.1 Policy related activities 373.4.2 Demonstration projects 393.4.3 Commercial project opportunities 40
4. OFF-GRID RENEWABLE ENERGY 444.1 Grid connected rural electrification 444.2 Current initiatives 45
4.2.1 Non-Grid Electrification Programme 454.2.2 The commercial solar market 474.2.3 Solar demonstration projects 49

4 ECN-C--01-052
4.2.4 CSIR Lubisi project 494.2.5 Remote area power supply programme - IDT 504.2.6 Hluleka Nature Reserve: Mini-Grid 51
4.3 Barriers and key issues in off-grid renewable energy 524.3.1 Implementation of the Non-grid Electrification Programme 524.3.2 Renewable energy and income generation 544.3.3 Renewable energy and economic development in the Eastern Cape 554.3.4 Co-ordinate electrification with other development programmes 56
4.4 Opportunities for further action 574.4.1 Non-grid Electrification Programme 574.4.2 Commercial market 584.4.3 Integrate renewable energy policy into Integrated Development Planning 594.4.4 Strengthening implementation capacity at the local level 594.4.5 Support mechanisms to stimulate the implementation of hybrid mini-grid
systems 60
5. RENEWABLE ENERGY TECHNOLOGIES IN THE EUROPEAN UNION 635.1 Wave Energy 63
5.1.1 The Technology 635.1.2 The market 645.1.3 European competitiveness 645.1.4 Market Barriers 655.1.5 Relevance for South Africa 65
5.2 Wind energy 655.2.1 The Technology 655.2.2 The Market 665.2.3 European Competitiveness 665.2.4 Technical and Market Barriers 665.2.5 Relevance for South Africa 66
5.3 Tidal energy 675.3.1 The Technology 675.3.2 Market overview 675.3.3 European competitiveness 675.3.4 Market Barriers 675.3.5 Relevance for South Africa 68
5.4 Electricity generated by biomass 685.4.1 Technology overview 685.4.2 The Market 695.4.3 EU competitiveness 695.4.4 Market barriers 695.4.5 Relevance for South Africa 69
5.5 Photovoltaic Energy 705.5.1 Overview of technology 705.5.2 Market overview 705.5.3 European Competitiveness 715.5.4 Technical and Market Barriers 715.5.5 Relevance for South Africa 72
5.6 Solar Thermal - Water & Space Heating 725.6.1 Technology Overview 725.6.2 The Market 725.6.3 European Competitiveness 735.6.4 Technical and Market Barriers 735.6.5 Relevance for South Africa 74
5.7 Solar Thermal - Electricity Production 745.7.1 Technology Overview 74

ECN-C--01-052 5
5.7.2 The Market 755.7.3 European Competitiveness 755.7.4 Technical and Market Barriers 765.7.5 Relevance for South Africa 76
5.8 Small-scale Hydro 765.8.1 Technology overview 765.8.2 The market 775.8.3 European competitiveness 775.8.4 Technical and Market Barriers 785.8.5 Relevance for South Africa 78
6. EUROPEAN INITIATIVES IN RENEWABLE ENERGY 796.1 Background 796.2 RE Support Strategies 806.3 Motivation for RE 816.4 Renewable Energy Support Mechanisms in the European Union 81
6.4.1 Subsidies 826.4.2 Feed-In Tariffs 836.4.3 Tradable Green Certificates 836.4.4 Tendering Systems 846.4.5 Fiscal Measures 856.4.6 Overview of European Union Renewable Energy Support Mechanisms 85
6.5 European Union Export Subsidies for the promotion of Renewable Energy 866.5.1 European Union, General 866.5.2 Country specific export stimulation measures 866.5.3 Conclusions 88
7. CLIMATE CHANGE SUPPORT MECHANISMS FOR RENEWABLES 897.1 UNFCCC financial mechanism 897.2 EU climate change-related support 90
7.2.1 European Commission 907.3 Promoting renewables through the Clean Development Mechanism 91
7.3.1 Likely benefits and problems of the CDM 927.3.2 An Enabling Environment for the CDM 927.3.3 Renewable energy and the CDM 937.3.4 Financing of renewables 937.3.5 Special procedures for off-grid renewable energy projects 94
7.4 Climate Change framework in South Africa 947.4.1 Importance given to the CDM 957.4.2 Potential CDM project areas 95
8. ACTIONS FOR SOUTH AFRICAN - EUROPEAN CO-OPERATION ONRENEWABLE ENERGY 1018.1 Actions to enhance the policy framework for renewable power generation 1028.2 Actions to enhance the policy framework for off-grid renewable energy 1048.3 Actions to promote demonstration and commercial projects 1088.4 Other actions for South African - European co-operation 110
REFERENCES 111

6 ECN-C--01-052
LIST OF ACRONYMS AND ABBREVIATIONS
€ EuroAEBIOM European Biomass AssociationAEC Atomic Energy CorporationAIJ Activities Implemented JointlyAMEU Amalgamated Municipal Electricity UndertakingsANC African National CongressBcm Billion cubic metresBIT BilateralBOO Build, Own, OperateBOS Balance Of SystemCAM Wind Analysis programmeCARI Spanish Agreement on Reciprocal Adjustment of Interest RatesCDM Clean Development MechanismCER Certified Emission ReductionCESCE Spanish Export Credit Insurance CompanyCNS Council for Nuclear SafetyCO2 Carbon DioxideCOGEN European Association for the promotion of Cogeneration in EuropeCOP Conference of the PartiesCPPP Community Public Private PartnershipsCSIR South African scientific research councilDACST Department of Arts, Culture, Science and TechnologyDANCED Danish Co-operation for Environment and DevelopmentDBSA Development Bank of Southern AfricaDEAT Department of Environmental Affairs and TourismDME Department of Minerals and EnergyDoH Department of HousingDTI Department of Trade and IndustryDWAF Department of Water Affairs and ForestryEC European CommissionECCP European Climate Change ProgrammeECN Netherlands Energy Research FoundationEDF Electricité de France, French National UtilityEDI Electricity Distribution IndustryEDRC Research and Development CentreEFTA European Free Trade AssociationsEOLE French Utility Wind Energy ProgrammeESI Electricity Supply IndustryESKOM South Africa’s National electricity utilityET Emissions TradingEU European UnionFAD Spanish Development Aid FundFEV Spanish Fund for Feasibility StudiesFFS Fee For ServiceFIB Friedenheim Irrigation BoardGDP Gross Domestic ProductGEAR Ingredients of RDP: Growth, Employment and RedistributionGEF Global Environmental FacilityGEF Global Environment FacilityGGP Gross Geographical Product

ECN-C--01-052 7
GoSA Government of South AfricaGSR Guarantee of Solar ResultsGWh Giga (109) Watt HourICEX Spanish Foreign Trade InstituteIDC Industrial Development CorporationIDP Integrated Development PlanningIDT Independent Development TrustIEP Integrated Energy PlanningIPP Independent Power ProducerIPPF Investment Project Preparation FundIRP Integrated Resource PlanningISRD Integrated Sustainable Rural DevelopmentISRE Implementation Strategy for Renewable EnergyJOULE Non-Nuclear RTD Programme of the European UnionKVA Kilo Volt Ampère, measurement of powerkWh Kilo Watt Hour, measurement of powerLPG Liquid Propane GasMEPC Mineral & Energy Policy CentreMW Mega Watt (or 106) WattMWp Mega Watt PeakNAFTA North American Free Trade AgreementNCCC South African National Climate Change CommitteeNEF National Electrification FundNER National Electricity Regulator in South AfricaNFFO Non-fossil Fuel ObligationNFPA Non-Fossil Purchasing AgencyNGEP Non-Grid Energy PlanNREL National Renewable Energy Laboratory, USANRTF National Research and Technology Foresight StudyNufcor Nuclear Fuel CorporationNUON Large Dutch UtilityODA Official Development AssistanceOECD Organisation for Economic Co-operation and DevelopmentORET/MILIEV Dutch Export Promotion ProgrammePESP Dutch Programme Economic Co-operation ProjectsPIMS Planing and Implementation Management SupportPJ Pèta (or 1015) JoulePPA Power Purchase AgreementPPP Public Private PartnershipPSOM Dutch Programme Co-operation Upcoming MarketsR RandR&D Research & DevelopmentRDP Reconstruction & Development PlanRE Renewable EnergyREC Regional Electricity CompaniesRED Regional Electricity Distribution CompaniesRES Renewable Energy SourcesRISØ Danish National Research & Technology CentreRTD Research Technology DevelopmentSA South AfricaSABRE-Gen South African Bulk Renewable Energy – GenerationSADC Southern African Development CommunitySDI Spatial Development InitiativeSHS Solar-Photovoltaic Home SystemSLOT School Leaver Operational Training

8 ECN-C--01-052
SME Small and Medium Sized EnterprisesSWOT Strength, Weakness, Opportunities, ThreatsThe Government The national Government of the Republic of South AfricaTHERMIE Demonstration Component of the Non-Nuclear RTD Programme of
the European UnionTWh Tera (1012) Watt HourUNDP United Nations Development ProgrammeUNFCCC The United Nations Framework Convention on Climate ChangeVAT Value Added TaxWASP Wind Atlas Analysis and Application ProgrammeWPEP White Paper on Energy Policy
ECN-C--01-052 9
EXECUTIVE SUMMARY
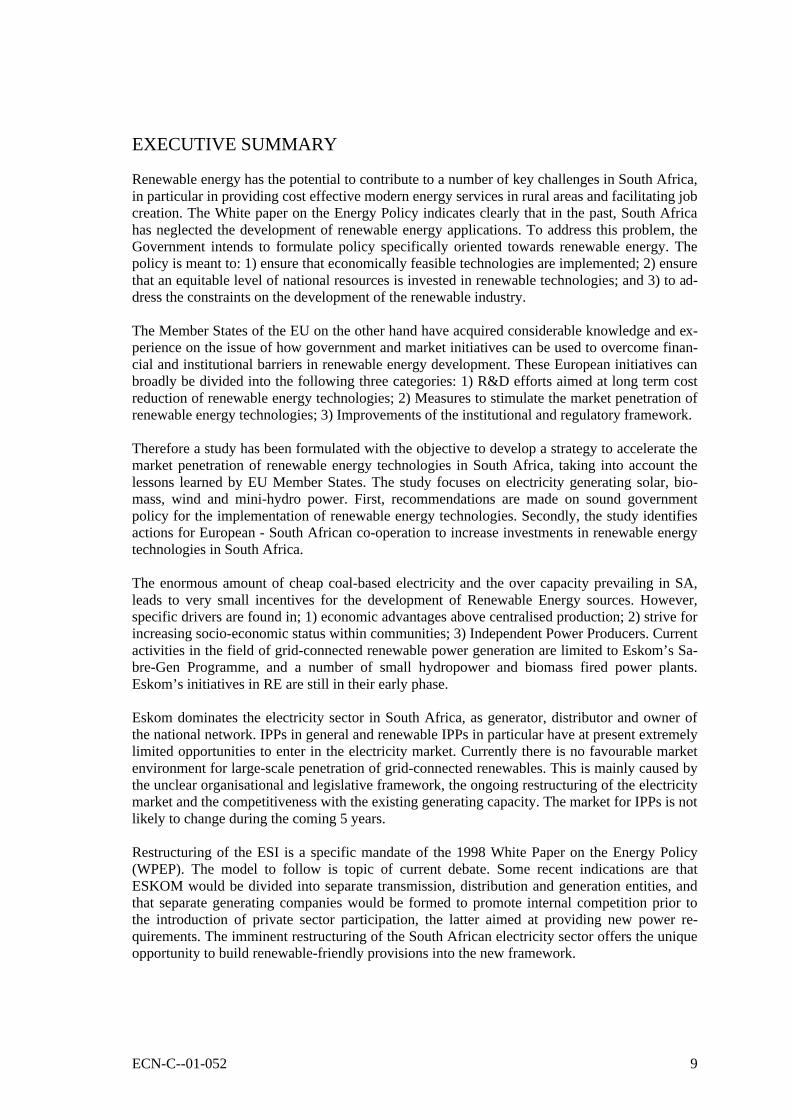
Renewable energy has the potential to contribute to a number of key challenges in South Africa,in particular in providing cost effective modern energy services in rural areas and facilitating jobcreation. The White paper on the Energy Policy indicates clearly that in the past, South Africahas neglected the development of renewable energy applications. To address this problem, theGovernment intends to formulate policy specifically oriented towards renewable energy. Thepolicy is meant to: 1) ensure that economically feasible technologies are implemented; 2) ensurethat an equitable level of national resources is invested in renewable technologies; and 3) to ad-dress the constraints on the development of the renewable industry.
The Member States of the EU on the other hand have acquired considerable knowledge and ex-perience on the issue of how government and market initiatives can be used to overcome finan-cial and institutional barriers in renewable energy development. These European initiatives canbroadly be divided into the following three categories: 1) R&D efforts aimed at long term costreduction of renewable energy technologies; 2) Measures to stimulate the market penetration ofrenewable energy technologies; 3) Improvements of the institutional and regulatory framework.
Therefore a study has been formulated with the objective to develop a strategy to accelerate themarket penetration of renewable energy technologies in South Africa, taking into account thelessons learned by EU Member States. The study focuses on electricity generating solar, bio-mass, wind and mini-hydro power. First, recommendations are made on sound governmentpolicy for the implementation of renewable energy technologies. Secondly, the study identifiesactions for European - South African co-operation to increase investments in renewable energytechnologies in South Africa.
The enormous amount of cheap coal-based electricity and the over capacity prevailing in SA,leads to very small incentives for the development of Renewable Energy sources. However,specific drivers are found in; 1) economic advantages above centralised production; 2) strive forincreasing socio-economic status within communities; 3) Independent Power Producers. Currentactivities in the field of grid-connected renewable power generation are limited to Eskom’s Sa-bre-Gen Programme, and a number of small hydropower and biomass fired power plants.Eskom’s initiatives in RE are still in their early phase.
Eskom dominates the electricity sector in South Africa, as generator, distributor and owner ofthe national network. IPPs in general and renewable IPPs in particular have at present extremelylimited opportunities to enter in the electricity market. Currently there is no favourable marketenvironment for large-scale penetration of grid-connected renewables. This is mainly caused bythe unclear organisational and legislative framework, the ongoing restructuring of the electricitymarket and the competitiveness with the existing generating capacity. The market for IPPs is notlikely to change during the coming 5 years.
Restructuring of the ESI is a specific mandate of the 1998 White Paper on the Energy Policy(WPEP). The model to follow is topic of current debate. Some recent indications are thatESKOM would be divided into separate transmission, distribution and generation entities, andthat separate generating companies would be formed to promote internal competition prior tothe introduction of private sector participation, the latter aimed at providing new power re-quirements. The imminent restructuring of the South African electricity sector offers the uniqueopportunity to build renewable-friendly provisions into the new framework.

10 ECN-C--01-052
European experiences and potential contributionsDuring the last decades, many European countries have gained a lot of experiences with renew-able energy technologies (RE). Most EU governments now have RE as part of their nationalpolicy and have developed promotion strategies. Most of these employ several policy instru-ments in parallel to promote the generation of electricity from renewable sources. These instru-ments include investment subsidies, Feed-in tariffs, Tenders, Fiscal incentives and Green cer-tificates. In addition, other policies such as grid access and tariff regulations or local spatialplanning procedures, are also very relevant in the development of the RE projects. For RE tech-nologies, there are generally no requirements concerning the operational quality of the equip-ment, such as the amount and reliability of output and the conversion efficiency. Incentives tomaintain and increase operational performance can very effectively be tied to the supportmechanism that is used. Furthermore, subsidies on output provide a strong incentive to improveoperational performance. Support mechanisms that are based on competitive mechanisms, suchas tendering and tradable green certificates, also reward RE generators for maintaining and im-proving continued generation, reliability and efficiency. Moreover, competitive mechanismsprovide an incentive to reduce the cost of renewable electricity generation at the same time.
Although the deployment of renewable energy varies throughout the EU, the member stateshave in general an advanced renewable energy development programme compared to South Af-rica. This can be advantageous for South Africa through the experience with financial incentivesand institutional arrangements and the availability of the technology. The recommended actionsare based on the analysis done by the Project team, and have been discussed and prioritised at aworkshop held with relevant stakeholders.
Recommendations for increased market penetration of RE in South AfricaActions to enhance the policy framework for grid-connected renewable power generation:1. development of a 200 MW set-aside programme,2. develop and implement power purchase regulation,3. capacity building.
Other policy related actions are:1. disseminate successes and failures,2. integrated resource planning,3. improve tariff Structure,4. apply innovative financing,5. use green power marketing.
Actions to enhance the policy framework for off-grid renewable energy are:1. Government stakeholders should convey the same message;.2. Raise awareness of end-users on electrification planning, the non-grid rural electrification
programme, and renewable energy technologies.3. Make electrification planning more transparent.4. Integrate energy planning into Integrated Development Planning Process.5. Capacity building to support the implementation of the non-grid electrification programme
focusing on: improved monitoring and evaluation capacity at DME, NER and technical andfinancial assistance for concessionaires.
Other relevant actions by stakeholders include:1. Conduct research on the optimal rural energy service structure.2. Concessionaires should be responsible for all non-grid energy services in their concession
area.3. Special risk mitigation measures for economic activities.4. Launch integrated PV follow up programme.

ECN-C--01-052 11
Off-grid renewable energyDespite ESKOM’s electrification programme, it is estimated that 3.3 million households are notconnected to the grid and that 2.1 million of these will not receive ESKOM electricity in thenear future. Electrification of households is one of the core objectives of the Government ofSouth Africa and it recognises the potential role for solar home systems (SHS) and other renew-able energy technologies in providing energy services to remote rural communities.
Until recently, the off-grid renewable energy market has been small. An estimated 50,000 to80,000 SHSs have been installed, plus a number of small-scale pilot projects. The DME has de-veloped the Non-Grid Rural Energy Programme to provide rural energy services to 300,000households in the next 5 years, with each concessionaire being responsible for 50,000 house-holds. In anticipation of implementation, the following hurdles may be expected:• ESKOM/Concessionaires relations with regard to ESKOM disclosing grid extension pro-
grammes in the assigned concession areas.• Fee-for-service concept is a new approach and still needs to be proven in the South African
context, especially in terms of payment discipline and ownership issues.• Social impact: if poor households cannot afford the monthly fee, the Non-Grid Electrifica-
tion Programme ends up benefiting only more affluent households in rural areas.• Bad image of photovoltaic (PV) in rural areas in South Africa through fly-by-night compa-
nies that sell low-quality systems without technical backup.
Energy plays a key role in enabling rural development, such as income generation activities andrural energy provision, and facilitating social services such as health and education. The keychallenge for rural energy in South Africa is therefore how development and energy can bepromoted simultaneously.
Climate change support mechanisms for renewablesThe EC and its member states are assisting developing countries in the implementation of theirobligations within the UNFCCC. Specific priorities for funding are preparatory activities for theimplementation of the Clean Development Mechanism (CDM), energy efficiency and renew-able energy. The assistance is aimed at giving incentives to the private sector in the host countryto invest in CDM projects and assisting governments to put in place the necessary structures forthe identification, evaluation and selection of projects. Priority must be given to projects whichfavour the development of clean technologies and/or which involve NGOs in the process of se-lecting projects. Denmark, Finland, the Netherlands and Sweden already have concrete CDMinitiatives.
Climate change issues are co-ordinated by the Department of Environmental Affairs and Tour-ism (DEAT), advised by the National Centre for Climate Change. Identified potential CDMproject areas with regard to renewables are: wind farms, solar energy and electricity from bio-mass. For off-grid renewable energy projects to be viable within the CDM, it is recommendedthat the Government of South Africa adopt a special CDM window for off-grid renewable en-ergy systems.
12 ECN-C--01-052
1. INTRODUCTION
1.1 Background: Renewable Energy in South Africa
South Africa boasts a relatively sophisticated energy sector which reflects the abundance ofmineral resources (coal in particular) and economic characteristics (a significant industrial base)of the country, as well as past priorities of the Government of the day. Whilst this degree of so-phistication has catered adequately for the supply of energy services to the economic sectorssuch as industry, mining, commerce, agriculture and transport, there is a serious problem inmeeting the basic needs of a significant portion of the population, the majority of whom residein rural areas.
On the issue of relevance to national priorities, the Government, initially through the Recon-struction and Development Programme (RDP) and through GEAR (Growth, Employment andRedistribution) has placed emphasis on economic and social restructuring to achieve sustainedeconomic growth and development. Included in this commitment is the improvement of infra-structure, (which includes power and electricity), the broader participation of the population inthe economic activities, decision making and the eradication of poverty. In the White Paper onEnergy Policy attention is focused on achieving greater equity within the energy demand andsupply sub-sectors, with a particular emphasis on social equity, economic efficiency and envi-ronmental sustainability.
Renewable energy has the potential to contribute to a number of key challenges in South Africa,in particular in providing cost effective modern energy services in rural areas and facilitating jobcreation. This has been recognised by the Government of South Africa. With regard to renew-able energy, the White Paper indicates clearly that in the past, South Africa has neglected thedevelopment of renewable energy applications. To address this problem, the Government ofSouth Africa intends to formulate policy specifically oriented towards renewable energy. Thepolicy is meant to:1. ensure that economically feasible technologies are implemented,2. ensure that an equitable level of national resources is invested in renewable technologies,
and3. to address the constraints on the development of the renewable industry.
As a follow up to the White Paper, the Department of Minerals and Energy is currently formu-lating an Implementation Strategy for Renewable Energy. As part of their efforts to introducemodern energy services into South Africa’s deprived rural areas, the DME has initiated theNon-Grid Electrification Programme (NGEP). Acknowledging that it is impossible to electrifyall of South Africa’s rural households in the near future, this programme aims at providing en-ergy services by means of off-grid renewable energy systems, such as Solar Home Systems orhybrid mini-grid systems such solar-wind or wind-diesel systems.
1.2 European Experience
The oil crises in the seventies, but also increasing environmental concerns such as acid rain andclimate change, have stimulated in the past the development and deployment of renewable en-ergy. Over the years, the Member States of the European Union (EU) have acquired consider-able knowledge and experience on the issue of how government and market initiatives can beused to overcome financial and institutional barriers in renewable energy development. SuchEuropean initiatives can broadly be divided into the following three categories:

ECN-C--01-052 13
1. Research and development efforts aimed at long term cost reduction of renewable energytechnologies.
2. Measures to stimulate the market penetration of renewable energy technologies focusing on(among others):• inclusion of external social costs in energy market decisions by removal of subsidies
which discriminate in favour of conventional energy and new financial incentives forrenewable energy technologies.
• increased access to capital for renewable energy development.3. Improvements of the institutional and regulatory framework which focus on:
• creation of a legal framework for independent power producers and power purchaseagreements,
• spatial planning,• encouragement of broad participation of stakeholders in energy decision-making.
1.3 Methodology and structure of the report
There exists a big potential for renewable energy technologies in South Africa and de-spite the fact that rapid growth of the application of renewable energy is taken place inmany parts of the world, the current installed renewable capacity in South Africa isnegligible.
The CSIR initiated and catalysed a project that it undertook with Garrad Hassan and Partnersand the Netherlands Energy Research Foundation (ECN) that was entitled ‘Renewable energyresources for rural electrification in South Africa’. The CSIR and the European CommissionTHERMIE Programme co-funded this project under contract number STR/1388/97-GB. Theprimary objective of this THERMIE project was to identify commercially viable opportunitiesfor rural electrification in the Eastern Cape Province of South Africa. During the execution ofthis project it became clear that there were many barriers that prevent the more widespread useof renewable energy in South Africa. Consequently the CSIR and ECN formulated the frame-work of this Synergy project and was fine-tuned with inputs from RISØ and Richard Morris andAssociates. It is intended that the resultant Action Plan developed in this Synergy project willcontribute towards overcoming these barriers.
The focus of the study was in particular on solar, biomass, wind and mini-hydro renewable en-ergy technologies1. The outcomes of the study consist of two parts. Firstly, recommendationswill be provided for supporting the formulation of sound government policy for the implemen-tation of renewable energy technologies. These recommendations will be the result of:• a thorough analysis of South Africa’s specific constraints and barriers to renewable energy
implementation,• the consideration of current proposals on policy and strategy being discussed by govern-
ment and stakeholders,• the lessons learnt from Member States of the EU on the promotion of renewable energy de-
velopment.
Secondly, the study aimed at identifying actions for European - South African co-operation toincrease investments in renewable energy technologies in South Africa. This actions will con-tain a list of potential renewable energy projects, will complement and build on existing initia-
1 It should be noted that this analysis is limited to electricity generating renewable energy technologies. Considering
the wide range of applications of renewable energy technologies and the diversity in the different markets it wasfelt among the project team members that clear focus was required. This focus has been put on renewable electric-ity generating technologies as this is the area where the most relevant linkages can be found between South Africaand Europe.

14 ECN-C--01-052
tives in South Africa and will identify opportunities for co-operation between these initiativesand the European renewable energy industry.
• Phase 1 - Review of the role of Renewable Energy in South Africa,• Phase 2 - Identification and Evaluation of Concrete Renewable Energy Projects in South Af-
rica,• Phase 3 - Determination of the potential European contribution to renewable energy devel-
opment in South Africa in terms of lessons learnt, useful technologies and investment pro-grammes,
• Phase 4 - Recommendations and dissemination of results.
The first part of the project consisted of fact funding: identifying the needs and opportunities forrenewable energy technologies in South Africa by means of a literature analysis (phase 1) anda stakeholder analysis (phase 2). During the stakeholder analysis, various stakeholders in theSouth African renewable energy sector have been interviewed, including representatives of re-newable energy industry, the Solar Energy Society of South Africa, DME, ESKOM, researchinstitutes, municipality and private consultants.
Section 1 of this report reports the results of our fact-finding. Chapter 2 provides backgroundinformation on the key energy issues in South Africa. The opportunities and barriers relating togrid-connected power generation with renewable energy technologies are highlighted in Chapter3. Chapter 4 provides an overview of the key issues pertaining off-grid renewable energy.
The second part of the project consisted of reviewing the experiences and potential contribu-tions from Europe and identifying the potential contribution of the EU and its member States tothe market of development of renewable energy in South Africa. The chapters 5, 6 and 7 inSection II provide an overview of the EU review in terms of technologies (Chapter 5), policyexperiences (Chapter 6) and the promises of international climate initiatives for renewable en-ergy collaboration (Chapter 7).
The resulting recommendations have been discussed during a final workshop in Pretoria. Theworkshop has resulted in re-evaluation and prioritisation of the proposed actions, which havebeen integrated in the recommendations of the report. Section III (Chapter 8) provides an over-view of the recommended actions to further stimulate the market penetration of renewable en-ergy technologies in South Africa. They are structured in:• Actions to enhance the policy framework for renewable power generation,• Actions to enhance the policy framework for off-grid renewable energy; and• Recommendations to stimulate renewable energy project development.

ECN-C--01-052 15
Section I
Opportunities and Barriers for RenewableEnergy in South Africa

16 ECN-C--01-052

ECN-C--01-052 17
2. CURRENT ENERGY ISSUES IN SOUTH AFRICA
2.1 Introduction
Describing the South African energy economy begins with its large dependence on coal, asituation that is likely to prevail deep into the 21st century. South Africa has vast untapped coalresources (see Table 2.1). Estimates show a current reserve of 55 billion ton that would be suffi-cient, at current production levels, for the next three centuries. The coal is the cheapest producedworldwide and has lead to the development of electricity generation plants that are of the mostwater efficient and that utilise the lowest grades of coal.
Table 2.1 Energy resources of South Africa (source: Howells, 1999)
Resource Reserves
Coal 1,298,000 [PJ]Crude oil 1,920 [PJ]Natural gas 1,418 [PJ]Coal bed methane 3,500 [PJ]Uranium 157,853 [PJ]Hydro 20 [PJ/year]Wind 50 [PJ/year]Solar 8,500,000 [PJ/year]Wood 220 [PJ/year]Agricultural waste 20 [PJ/year]Municipal solid waste 34 [PJ/year]Bagasse 49 [PJ/year]
South Africa’s dependency on coal can be seen when the total primary energy supply is ana-lysed. Figure 2.1 shows that, in 1995, coal and imported crude oil dominate the primary con-sumption. ‘Other’ includes hydro and nuclear.
crude oil
gas
biomass other
coal
Figure 2.1 Total Primary Energy Supply for 1995. Total: 4500 PJ (source: Howells, 1999)
The non-conventional energy resources of South Africa itself include nuclear, limited hydro-power and limited petroleum resources and the traditional biomass fuels associated with mostAfrican countries. However, the Southern African sub-continent as a whole has vast untappedconventional energy resources. This includes large hydropower resources that are renewable innature but often regarded as conventional, because of their impact on the local ecosystem.

18 ECN-C--01-052
Electricity, generated in large power stations and transmitted and distributed through a grid, isgenerally accepted as the modern norm for energy supply. It is relatively easy to generate, canbe transmitted over long distances and distributed geographically to consumers at comparativelylow cost. Electricity is highly versatile, easily controlled and readily convertible into the re-quired form Therefore, energy supply strategies for the future will centre largely on broadeningaccess to electricity, especially in the developing countries.
Howells (1999) notes that the most uncertain figure in this total primary supply is for traditionalbiomass and the figure here is a best estimate. Traditional Biomass includes wood, firewood anddung in the residential sector, but also biomass for industrial energy, notably in the sugar andpaper industry.
South Africa has an installed generation capacity of some 39 000 MW, with an extended na-tional grid spanning some 267 000 km of high voltage transmission, distribution and reticulationlines. These at present largely owned and operated by ESKOM, the national electricity utility.The grid is interconnected with all bordering countries.
South Africa boasts the second lowest unit price of electricity in the world at 10.08 Rand2
cents/kWh ( € 0.015/kWh), with an undertaking by ESKOM to reduce the cost of electricityfurther in real terms by 15% over the next decade.
Although a large potential exists for renewable energy exploitation in South Africa and despitethe fact that rapid growth of the application of renewable energy is taking place in many parts ofthe world, the current installed renewable capacity in South Africa is negligible. As clearly indi-cated in the White Paper on the Energy Policy, South Africa has neglected the development ofrenewable energy applications (DME, 1998).
To address this problem, the Government of South Africa intends to formulate policy specifi-cally oriented towards renewable energy. The policy is meant to: 1) ensure that economicallyfeasible technologies are implemented; 2) ensure that an equitable level of national resources isinvested in renewable technologies, given their potential and compared to investments in otherenergy supply option; and 3) to address the constraints on the development of the renewable in-dustry (DME, 1998).
The electrification of households is of particular interest. It is a stated objective of the WhitePaper on Energy Police that ‘Government commits itself to implementing reasonable legislativeand other measures, within its available resources, to progressively realise universal householdaccess to electricity’.
However, projections of the domestic grid electrification programme show that when this pro-gramme is completed, some 20-25% of the population, or 2 to 3 million households, will stillnot have electricity in their homes by 2012. These are the people who live too far from the gridto be considered for economic interconnection. They live in remote communities with very dis-persed housing and with a demand for electricity that is very low, rendering grid extension un-economical. From a development perspective these communities are of the most fragile andlargely representative of the ‘poorest of the poor’.
Furthermore, field experiences in the grid extension programme indicate that access to electric-ity does not imply immediate conversion to this energy form. The consumption in newly electri-fied homes is extremely low with no indication of significant growth in the short to mediumterm. Analysis of the ESKOM experience up to 1996 indicates that the average electricity salesper new service point is 86 kWh per month (cash flow of about R 27; € 3.85), while the averagevariable cost of supply is R 21 (€ 3.20) per service point. The average capital cost per grid sup-
2 1 € ~ 7 Rand, in March 2001

ECN-C--01-052 19
ply point, thus far mainly in the more densely settled rural and peri-urban areas, since the incep-tion of the programme is approximately R 3417 (€ 520). The capital costs per service point aretherefore practically fully subsidised.
The total subsidisation per rural electricity service point is projected to grow by factors of 2 to3, as more remote areas are targeted. The average sales in these remote areas are well below thecurrent national average of 86 kWh per month, with electricity largely being used for lightingand the powering of televisions and radios. These adverse economics seriously hamper theelectricity distribution industry from reaching the more remote rural customer.
It is now realised that the conventional electricity network cannot economically satisfy this ob-jective for all the communities within South Africa, especially those in the more remote ruraland often underdeveloped areas. At the same time it is realised that electrification can in itselfnot address the total energy demand of the poorer sector of the population, as far as the moreenergy intensive thermal requirements are concerned, necessitating the concept of ‘energisation’- widening access to all relevant energy services.
Fossil fuels, such as coal, liquid fuels and gas, and also uranium, play a central role in the socio-economic development of South Africa and consequently sets the tone for the structure of theenergy system. The description of the SA energy sector is divided into three sections, SA energydemand sectors, SA energy supply sectors and crosscutting issues.
2.2 South African energy demand sectors
The total final energy demand of South Africa is depicted in Figure 2.2 and shows that final en-ergy demand is dominated by refined liquid fuels, coal, electricity and traditional biomass, withsmall amounts of crude oil and gas (Howells, 1999).
Final Energy Demand by user
Households
Transport
Agriculture
Industry, commerce and mining
Figure 2.2 Final Energy Demand by user in South Africa (source: Howells, 1999)
South Africa’s energy demand sectors can also be subdivided into various users and are: house-holds; industry, commerce and mines; transport and agriculture. Figure 2.3 shows these users asa percentage of total energy demand.

20 ECN-C--01-052
2.2.1 HouseholdsSouth African households consume some 24% of the country’s energy. By the end of 1997,about 60% of households had access to electricity. Yet this energy source contributed only 20%of household energy consumption. Most energy was obtained from fuel wood (65%). Other fu-els used include coal (9%) and illuminating paraffin (8%), and a small amount from liquid pe-troleum gas (LP Gas) makes up the remainder.
2.2.2 Industry, commerce and miningIndustry, mining and commerce account for about 60% of commercial energy consumption inSouth Africa, at a cost of approximately R18 billion in 1995. The low price of coal and electric-ity in South Africa has contributed to the development of an economy with a large energy-intensive primary industrial sector. Mining and minerals beneficiation were responsible for 11%of South Africa’s Gross Domestic Product and over 50% of South Africa’s foreign exchangeearnings in 1995.
2.2.3 TransportThe transportation of people and goods is an essential social and economic service, and ac-counts for about 24% of total energy consumption. More than 90% of transport energy con-sumption is derived from liquid fuels.
2.2.4 AgricultureAbout three per cent of the total energy used in South Africa is consumed by agriculture, mainlyby commercial farmers. Traction and transport tasks dominate this energy use, as evidenced bythe fact that liquid fuels meet three-quarters of commercial agriculture’s energy requirements.Stationary operations, such as lighting and refrigeration, are generally performed with electric-ity, although diesel is also used to power pumping and dehulling activities.
2.3 South African energy supply sectors
2.3.1 ElectricitySouth Africa produced 179 450 GWh of electrical energy in 1997. Ninety-six per cent of thisamount is generated by ESKOM and transported over its national transmission network to dis-tributors countrywide. More than 400 distributors, mainly municipal electricity departments,supply electricity to end customers. ESKOM is also the largest single distributor in the countryin terms of energy sales for final consumption and number of customers.
2.3.2 Nuclear energyNuclear energy is a minor component of the South African energy sector. It contributed about3% during 1997 of the national primary energy supply, and about 5% of the country’s electric-ity. The main actors in the nuclear sector are the Atomic Energy Corporation (AEC), ESKOM,the Council for Nuclear Safety (CNS) and the private sector Nuclear Fuel Corporation (Nufcor).
2.3.3 Oil: explorationDespite its generous minerals endowment, South Africa has no significant proven crude oil re-serves, but it is believed that potential exists for offshore discoveries of both natural oil and gasand onshore coal-bed methane.

ECN-C--01-052 21
2.3.4 Oil Production and ImportPresent crude oil refinery capacity is 455,000 barrels per day with the capacity of the Sasolsynthetic fuels plant being 150,000 barrels per day and Mossgas 45,000 barrels per day of crudeoil equivalent. About one-third of fuel demand is met by the synthetic fuels industry.
During 1997 South Africa imported approximately 23,6 million tons of crude oil and 21 300million litres of refined product was consumed. Crude oil is South Africa’s single largest importitem. Approximately 15% of South Africa’s primary energy consumption is currently met byimported crude oil. Taking synthetic fuel production into consideration, liquid fuels meet ap-proximately 28% of South Africa’s final energy needs.
2.3.5 GasSouth Africa has relatively small known gas resources of 30 billion cubic metres (bcm) off thesouth coast and some very small recent discoveries (3 bcm) off the West Coast. However, thepotential natural gas resources have not yet been fully investigated. To date, South Africa hasundertaken limited exploration for oil and natural gas leading to twenty gas and nine oil discov-eries. The exploration and exploitation of the Kudu Extension gas field and the MozambiquePande gas field with its planned pipeline to Sasol in Secunda indicates that gas is going to playan increasingly important role in the energy mix in South Africa.
2.3.6 CoalSouth Africa has a coal resource of approximately 121 billion tonnes, of which about 55 billiontonnes are classified as economically recoverable reserves. Although coal’s contribution toSouth Africa’s total primary energy supply has declined slowly (approximately 75% during1997), it still dominates the energy sector. Approximately half the coal consumed in South Af-rica is used for the generation of electricity, and a quarter for the production of synthetic liquidfuels. A large number of urban households in the central industrialised area still continue toburn coal, even after electrification.
2.3.7 Renewable energy sourcesRenewable energy resources provide approximately 10% of South Africa’s primary energy.Traditional biomass, in the form of firewood, wood waste, dung, charcoal and bagasse, accountsfor close to 10% of net energy use at the national level (60% of household energy consumption).Hydro-electric power contributes less than 1% of electricity generation and most of that ispumped storage. Other renewable energy sources make up a small but increasing proportion ofenergy supply. These include biogas and landfill gas, which need to be promoted in order to ad-dress thermal energy needs.
Although more than 484,000 m2 of solar water heater panels have been installed, this constitutesless than 1% of the potential market. The government is currently looking at strategies to in-crease the use of Solar Water Heaters.
The installed capacity of photovoltaic systems is approximately 5 MWp, of which 50% is usedfor telecommunications. A total of 280,000 water-pumping windmills are in operation and theinstalled capacity of small-scale hydropower exceeds 60 MW.
2.4 Reconstruction and Development Programme (RDP)
The RDP programme was the central policy guideline for the new government when taking of-fice in 1994 (ANC, 1994). Its driving force was redistribution of economic benefits and devel-

22 ECN-C--01-052
opment of the disadvantaged sectors. Targets included land reform; housing, water supply andelectrification for currently non-served population; supply of electricity to schools and hospitals,universal access to telecommunications, public transportation systems, nutritional security andpublic health reform. Special funds and mechanisms were established to implement the pro-gramme.
Paragraph 2.7 of the RDP is dedicated to energy and electrification. The driving principle is thatenergy policy must concentrate on the supply of basic energy needs of poor households, stimu-late production and provide energy for community services such as schools, clinics and watersupply.
Regarding electricity, the RDP outlined an accelerated electrification programme to provideelectricity for an additional 2.5 million households by the year 2000, thereby increasing theelectrification level to about 72 % of all households (double the number in 1994). Both grid andnon-grid power sources were to be employed. All schools and clinics would be electrified.
According to the RDP, the electrification programme would be financed via cross-subsidiesfrom other electricity consumers as far as possible. Where necessary the Government wouldprovide concessionary finance for the electrification of poor households in remote rural areas. ANational Electrification Fund was to be created to raise finance from lenders and investors.
As indicated below, the efforts of the new government were concentrated on the drafting, publicdiscussion and release of a new White Paper on Energy Policy, consistent with the RDP, and inenhancing the electrification process already in place by ESKOM. During the last few years theGovernment has been taking the initial steps to restructure and deregulate the energy sector.
2.5 White Paper on Energy Policy
At the end of 1998 the Government issued the new energy policy through the publication of theWhite Paper on Energy Policy (DME, 1998). The former white paper was published in 1986and South Africa’s priority at the time of writing was to secure energy supplies. The change ofgovernment brought a shift in the energy policy that needed to be formalised in a new white pa-per. The revision process commenced with the drafting of a discussion document (Green Paper),released in 1995 for analysis and comment. The resulting Draft White Paper was revised during1997-1998 and Cabinet approved its release in mid 1998.
The 1998 White Paper is aimed at clarifying government policy regarding the supply and con-sumption of energy, but it does not attempt to deal with implementation strategies, as they arepart of the core functions of the Department of Minerals and Energy (DME). The White Paper isintended for parliamentarians and all involved parties in the energy sector, and is expected toconstitute a formal framework for the operation of the energy sector within the broad nationalstrategy.
The policy priorities of the White Paper are summarised below. Issues directly dealing with re-newable energy are highlighted in italic face.

ECN-C--01-052 23
2.5.1 Energy policy priorities, 1998 White PaperTable 2.2 Energy policy priorities (source: 1998 White Paper)Objective Short-term priorities Medium-term priorities
Increased accessto affordableenergy services
• Develop electrification policy• Address off-grid electrification• Facilitate management of woodlands• Establish thermal housing guidelines
• Stimulate use of new and renewable energysources
• Promote improved wood stoves• Support capacity building, education and
information disseminationImproving energygovernance
• Improve government’s capacity togovern
• Restructure DME’s budget• Establish energy policy advisory
board• Promulgate electricity regulatory bill• Manage deregulation of oil industry• Establish energy information systems
• Develop research strategy• Restructure state energy assets• Implement new regulation of nuclear
energy• Establish renewable energy database• Develop institutions to implement energy
efficiency programmes
Stimulatingeconomicdevelopment
• Encourage black economicempowerment in the energy sector
• Manage electric distribution industryrestructuring
• Restructure the state’s energy assets• Remove energy trade barriers and
facilitate investment in energy sector• Introduce special levies to fund
regulators and other energy agencies
• Introduce competition in electricity market• Establish cost-of-supply approach to
electricity pricing• Manage deregulation of liquid fuels
industry• Promote energy efficiency• New regulatory system for natural gas• Develop standards/code-of-practice for
renewable energy• Introduce voluntary appliance labelling
Managingenergy-relatedenvironmentalimpacts
• Improve residential air quality• Monitor reduction of candle/paraffin
fires resulting from electrification• Introduce safety standards on paraffin
stoves• Adopt ‘no-regrets’ approach to
energy-environment decisions
• Develop policy on nuclear wastemanagement
• Evaluate clean energy technology• Investigate options for coal discards• Participate in strategies to address climate
change• Investigate environmental levy
Securing supplythrough diversity
• Develop South African Power Pool• Pursue international co-operation• Stimulate energy research• Facilitate regional energy co-
operation
• Utilise integrated resource planning• Reappraise coal resources and support
introduction of other primary energycarriers where appropriate
The White Paper points out that renewable energies are particularly advantageous for remoteareas where grid electricity supply is not feasible, and can provide the least cost energy servicewhen social and environmental costs are included.
Following the White Paper, Government should provide focused support for the development,demonstration and applications of renewable energy, and facilitate the sustainable productionand management of solar power and non-grid electrification systems, such as:• solar home systems (SHS),• wind home systems,• solar cookers,• solar pump water supply systems,• solar systems for schools and clinics,• solar heating systems for homes,• hybrid electrification systems, and• wind mini-grid.

24 ECN-C--01-052
Renewable energy systems should be mainly targeted at rural communities. Government shouldalso promote appropriate standards, guidelines and codes of practice for renewable energy andwill establish suitable renewable energy information systems.
The White Paper specifically foresees new joint hydro-power developments for the CahoraBassa scheme (Mozambique), and similar developments in southern and central Africa.
2.6 Cross-cutting issues
2.6.1 Integrated energy planningIntegrated energy planning (IEP) is a process involving various technical functions to supplyand use the information on energy demand and supply required to inform policy development inthe South African energy sector. Such capacity does not currently exist within South Africa.
DME has requested proposals from suitably skilled consultants to undertake scenario develop-ment and modelling work for the Integrated Energy Planning (IEP) process which is presentlyunderway in South Africa. While the scenario development and modelling work are to be un-dertaken as discrete parts, they are combined into one appointment to ensure co-ordination be-tween the work areas and in the interests of cost-effective and rapid completion.
The DME has established two working groups to advise the process, as well as an overall IEPSteering Committee. The working groups will be closely involved in the above work as follows:• Review Group - advise, comment on and guide the Scenario Development component,• Modelling Working Group - advise, comment on and guide the Modelling work.
Two working groups are necessary because the Scenario Development work requires detailedexpertise of the energy sector as whole or specific components thereof. The Modelling work re-quires detailed expertise on different models and their applicability, as well as data availabilityand limitations. Nevertheless, it is expected that a measure of overlap in functions will occur,and thus close communication between these groups will often be necessary.
The DME has appointed the Mineral and Energy Policy Centre (MEPC) to facilitate the imple-mentation of the IEP, and they will thus be in close contact with working groups as well as theconsultants appointed to undertake the above work
2.6.2 Energy efficiencySince expenditure on energy constitutes a large portion of the country’s GDP (15%) and a sig-nificantly larger proportion of poor households’ expenditure, it is necessary to give attention tothe effective and efficient use of energy. Significant scope for improved energy efficiency existswithin the industrial, commercial, domestic, and transport demand sectors.
2.6.3 Capacity building, education and information disseminationSouth African energy consumers, ranging from low-income households to business and indus-try, are poorly informed about efficient energy-use practices and options. This lack of consumerknowledge about the efficient use of energy undermines economic competitiveness, thesustainability of development initiatives, the environment and people’s health. That educationand information can play a central role in addressing these problems is borne out by interna-tional experience.

ECN-C--01-052 25
2.6.4 International energy trade and co-operationSouth Africa is actively involved in energy trade and co-operation with a number of countries inthe region and overseas. Imports include crude oil and energy conversion plants and equipmentand exports include coal for international markets and refined liquid fuels for regional markets.Active co-operation with a number of countries and organisations has developed over the years,particularly since 1993, and official participation in Southern African Development Community(SADC) activities commenced in June 1994.
2.6.5 Governance and institutional capacitiesAt present, parliament and its committees are responsible for energy legislation and the supervi-sion of the executive arm of government. The executive consists of cabinet, the minister and thedepartment, who are together responsible for formulating and implementing energy policy. Ap-pointed boards or councils supervise a range of government-owned energy organisations, somecreated by means of a specific act, in order to provide them with strategic direction on their op-erational activities.
2.7 Restructuring of Electricity Generation, Transmission & DistributionIndustry
ESKOM is a large and powerful utility, even on a world scale. Its restructuring is part of thebroader policy of South Africa to dismantle a number of large parastatals. Specifically, there areseveral reasons behind the need to reform the power sector. Independent power producers areincreasingly interested in entering the local power market, while black economic empowermenthas to be boosted and other forms of bulk generation explored.
The Department of Public Enterprises aims to have a competitive market structure in the elec-tricity generation sector by 2004. The first possible phase of restructuring of generation wouldbe the separation of ESKOM’s power stations into a number of independent competing genera-tion companies directly owned by the state.
The ministry of Minerals and Energy has initiated the restructuring process for the distributionsector. The White Paper on Energy Policy proposed that ESKOM’s transmission group, whichoperates the national grid, be separated from the distribution and generation divisions. This pro-cess will amalgamate ESKOM’s distribution division with the local authority distributors into anumber of regional electricity distribution companies (REDs). As an interim step, ESKOM’sdistribution division would form part of a holding company, EDI Holdings, for the entire distri-bution industry (see DME, 2000a and DME 2000b).
To prepare ESKOM for this restructuring process, the process of incorporating the ESKOMholding company with a regulated business subsidiary (generation, transmission and distribu-tion) and a non-regulated subsidiary being ESKOM Enterprises, has been embarked on. Theformation of a separate generation and transmission company is part of the future design withthe final restructuring model for ESKOM having yet to be decided.
With the benefit of a broad restructuring strategy in place, the Department of Minerals and En-ergy has moved rapidly to get the process underway. A consortium led by Pricewaterhouse-Coopers is technical adviser and had less than a year to come up with an implementation strat-egy for the restructuring of the electricity distribution industry. The Development Bank of SouthAfrica (DBSA) has been appointed by the DME as project manager for the restructuring initia-tive.
26 ECN-C--01-052
3. RENEWABLE POWER GENERATION
This Chapter deals with grid-connected power generation, describing its political context,ESKOM’s current activities as well as current activities of municipalities and REDs.
Political contextIn Europe and other developed countries, environmental concerns provide the main drives forrenewable energy development. In South Africa, the interest for renewable energy, is driven bysocial and economic needs. The ministerial foreword of the Energy White Paper of 1998 de-scribes this clearly (DME, 1998):
‘As government pursues its macro-economic policy on growth, employment and redis-tribution, as well as its policy of reconstruction and development, changes take placewithin the energy sector that continue to present us with interesting challenges. Thesechallenges include the transformation of state-owned entities, the reshaping of govern-ance principles, the enhancement of socio-economic welfare within communities, andeven changing people’s attitudes towards the use and importance of national energy re-sources.’
For understandable reasons, environmental concerns are relatively low on the priority list of theSouth African government. Cheap electricity helps to attract major industrial activities andthereby boost economic development and job creation. These are the overarching political pri-orities in South Africa. The negative impact of the use of huge quantities of cheap coal, beingused for electricity production, is neglected almost completely. Being the cheapest commercialpower source available in South Africa, there is no economical drive to look for alternatives.The main drivers for renewable power generation are therefore formed by:• economic advantages above centralised production,• supporting the transformation of state-owned entities, including the reshaping of governance
principles,• increasing the socio-economic welfare within communities
The scarce funding available for subsidy programmes is used in order to support these policygoals. This means that there are no specific financial incentives for renewable energy. Giventhat cheap coal is abundantly available in South Africa, it may be concluded that in the currentcontext, there is little scope for grid-connected renewable energy.
Leaving aside the lack of a financial incentive, there are other political motives driving invest-ment in renewable power. ESKOM provides the following reasons (ESKOM, 2000c):1. Possible future environmental pressure (health on national level and Kyoto-related on inter-
national level.2. It may be a cost-effective means to meet the challenge of electrification eventually en-
hanced by climate change-related financing, mainly the CDM).3. To avoid being forced (by the government) to investigate and finance projects that are initi-
ated outside of ESKOM which from their point of view are not viable.4. The need for diversification in fuel-input.
Others claim that the ultimate goal of ESKOM in conducting these activities is window-dressing, i.e. showing that they are doing something with renewable energy. Some parties evenclaim that ESKOM in the end want to de-motivate potential green IPPs and to provide a soundbasis for the conclusion that renewable energy is not viable compared to coal-fired plants or thepebble bed reactor.

ECN-C--01-052 27
3.1 Current grid-connected renewable power generation
3.1.1 ESKOM’s Sabre-Gen ProgrammeESKOM’s SABRE-Gen (South African Bulk Renewable Energy – Generation) project isplanned to investigate the potential of using renewable energy for bulk electricity generation inSouth Africa. The program’s ultimate objective is to evaluate whether utility scale, renewableelectricity generation, is a viable supply-side option for ESKOM and South Africa. The objec-tives of the programme are:• Understanding the implications of using renewable energy on a large scale in an African
environment.• Determining the most suitable applications for renewable energy.• Determining the most appropriate scale of implementation.• Obtaining all necessary information for the effective implementation of renewable energy.• Preparing the market and industry for implementation.• Investigating the sustainability of renewable energy in an African environment.
Demonstration facilities are an integral part of this project. Although it will provide input on allthe points raised above, it’s primary objective is to prepare the market and industry for renew-able energy implementation. In other words, the demonstration facilities are envisaged to pro-vide:• Demonstrations to the public and other interested parties not currently informed or educated
on bulk renewable energy.• Opportunities for technology transfer, training and practical experience for the industry and
potential renewable energy supporting industries and organisations.• Opportunities to break down barriers to the implementation of renewable energy such as
negative social perceptions, non understanding of the technical potential of renewable en-ergy, perceptions that renewable energy is too expensive, etc.
Four energy sources are planned to be investigated, namely wind energy, solar thermal power,biomass and wave energy. Of the four, the Wind and Solar Thermal Electric components are themost advanced, with demonstration projects to be implemented soon. The Solar Thermal Elec-tric component receives support from the GEF. The Biomass and Wave initiatives are still in theearly stages of project development, but in all four technology areas it is planned to have dem-onstration plants running by the year 2005 (ESKOM, 2000b).
Wind energyAt present ESKOM conducts three activities: wind resource assessment, feasibility assessmentand setting up a pilot/demonstration wind farm (ESKOM, 2000d).
The wind resource assessment is being done on a grid of 75 * 75 km with WASP and 150 * 150km with CAM (more general). Measurements of weather stations over 4-7 years on 5-minutebasis are being used. The main focus is on data related to the coastal provinces, less attention isbeing given to Gauteng, the inland area and the Northern Cape.
The feasibility assessment is focussed on the development of a pilot/demonstration wind farm.The project is planned to have 4-6 turbines of 750-1500 kW each. Four potential sites have beenselected so far and a tendering procedure has been started.
Although the wind resource assessment is being conducted on a rather general scale (withmeasurements of weather stations), the impression is that there is enough expertise (and con-tacts with EU-experts) to make a first draft of a South African wind atlas. Further measurementson a more detailed level and with more accurate measuring equipment are necessary on specificsites that are, or will be, identified for establishing wind farms.

28 ECN-C--01-052
In the field of technical feasibility assessment, it is important to realise that up till now there isno experience with establishing and operating larger wind turbines. The only wind turbinespresently in operation are in the smaller capacity range (below 100 kW) and for non-grid appli-cations. This means that there is no specific wind energy related expertise in the field of civilengineering, mechanical engineering, electrical engineering (grid connection, grid quality issueslike stability of voltage and frequency) and expertise in operating and maintaining wind tur-bines.
In setting up a pilot/demonstration wind farm, foreign expertise will be essential. This will pre-vent South African parties from reinventing the wheel. In the first stage, the foreign expertisecould be transferred by conducting the implementation process jointly and thus build up capac-ity in South Africa. At a later stage, the foreign involvement could be reduced to more specificcontributions.
Another main issue is the local manufacturing of components or building blocks in South Af-rica. In the first stage the complete technology could be transferred from Europe or the USA.But at a later stage the manufacturing of towers, the assembly of the turbine or the manufactur-ing of the blades could offer interesting opportunities for foreign parties as well as for the de-velopment of wind energy in South Africa.
Solar Thermal PowerESKOM is involved in a Concentrating Solar Power Project, which is funded through the WorldBank/GEF. In this project options have been screened together with NREL (National Renew-able Energy Laboratory - USA) and in March 2000 an evaluation was done and a selectionmade. The following two years will be spent on a full feasibility and it is the intention to build a100 MW solar thermal demonstration plant by 2004.
Apart from this, several small-scale options will be demonstrated: 2 installations of 10 kW each(of which 1 off-grid) and 1 installation of 25 kW grid-connected, using dish collectors and Stir-ling engines. There are several European companies involved, e.g. a German company (for Stir-ling Engines) and a Spanish company (ESKOM, 2000e).
BiomassWork on the biomass project only started during the first half of 2000. An interesting possibilityseems to be the introduction of fast growing crops. This is being looked at initially in the East-ern Cape (where there are severe erosion problems) and then subsequently on national level.Crop growing for material and energy production fits in with the central policy aims of the gov-ernment: job-creation.
ESKOM’s plans for this area of technology cover the following (ESKOM, 2000f):1. identification of biomass streams that are not used at the moment and the development of
cash crop farming,2. technology identification and ranking (including South African developments).
Wave energyAt the moment ESKOM is making an inventory of different technologies available and evalu-ating these concepts. One option that they are looking at is a development in the USA (Jersey)where a wave-breaker system is being developed which takes about 95% of the energy out ofthe waves. A 2 MW first of a kind unit is being planned in the USA. Another option is the 1MWdevice developed in Scotland and now in operation on Islay (Off-shore Scotland).
Although a lot of activities related to wave energy are going on world wide, most of the tech-nology is far less mature than e.g. biomass technology or wind energy. South Africa doesn’thave any experience with wave energy, but the available wave resources offer a large potentialfor this technology (ESKOM, 2000g).

ECN-C--01-052 29
3.1.2 Other ESKOM renewable energy projectsESKOM inherited four small hydro power plants in the present Eastern Cape Province from theTranskei government when the homeland governments were dissolved and integrated into theSouth African government in 1994. These hydro power plants, described below in Table 3.1, areconnected to the national transmission network and are providing base load to the ESKOMsystem (NER, 2000a).
Table 3.1 ESKOM small hydro plants (NER, 2000a)
Name LicensedCapacity
[MW]
Maximum powerproduced
[MW]
Net energy sentout
[MWh]
Privateconsumption
[MWh]
Load factor
[%]
Collywobbles 42 42 257 544 0 70First Falls 6 6 36 792 0 70Second Falls 11 11 67 452 0 70Ncora 2 2 12 264 0 70
3.1.3 Renewable power generation by IPPs and REDsBesides, ESKOM’s projects there are a few renewable IPPS operating in South Africa with alicense from the NER. The National Electricity Regulator has licensed 8 renewable energybased non-ESKOM operated power plants. Of these 4 are bagasse burning sugar mills, 3 aremunicipal owned hydro power plants and one is a privately owned small hydro power station.The current overview is based on NER (2000a).
Private-owned small hydro-powerFriedenheim hydroFriedenheim hydro can be viewed as the only existing IPP in South Africa. It is privatelyowned, sells the bulk of the generated electricity through a Power Purchase Agreement (PPA)and is a profitable operation. The plant is operated as a commercially profitable and sustainablebusiness venture. It was financed through equity provided by investors (Friedenheim IrrigationBoard - FIB).
The small hydro power plant is situated next to the town of Nelspruit in the Mpumalanga prov-ince. It is owned by the members of Friedenheim Irrigation Board and operated by MBB an en-gineering firm. The plant provides power for water pumping to FIB, but 93% of the power gen-erated is sold to the Nelspruit local authority through a PPA that sets the tariff at 12% below theprice at which Nelspruit buys power from ESKOM (its bulk electricity provider).
The Friedenheim Hydro scheme has proved a profitable and viable investment. Its successfultrack record has gone along way towards dispelling the myths common in the electricity supplyindustry that it is impossible to compete with ESKOM, especially with small and renewable en-ergy producers selling energy wholesale.
The motivation for the PPA with the Nelspruit Local Authority was based on the cost savingsinvolved in buying electricity at a rate below that of ESKOM and to a lesser extent the increasedsecurity of supply offered through this diversification in suppliers.
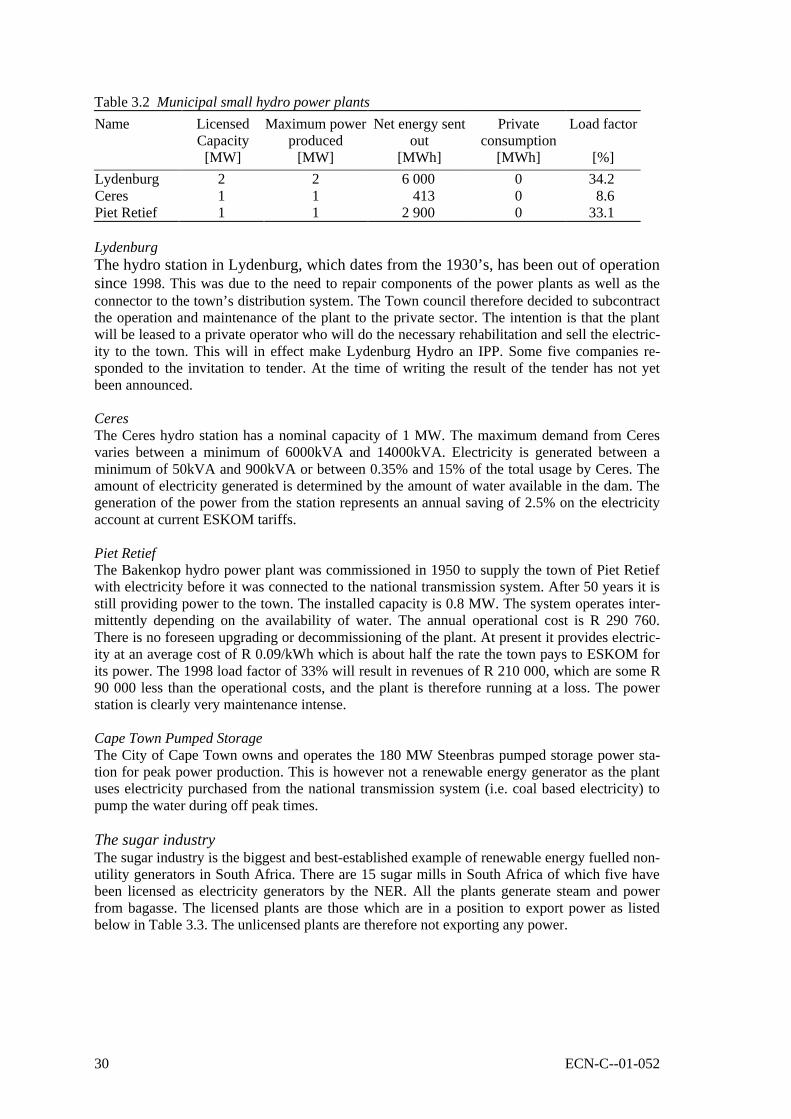
Municipal owned hydro power stationsThree small municipalities are currently licensed to operate small hydro power stations. Thesestations date from the 1930’s, and although these plants can be expected to operate for manymore years operating efficiencies are decreasing. This is evident from the low load factors,which are at best half that experienced at the more modern Friedenheim plant. This implies thatthe plants were in full-scale operation for only some 50% of the year. An overview of the plantsare provided in Table 3.2.
30 ECN-C--01-052
Table 3.2 Municipal small hydro power plants
Name LicensedCapacity
[MW]
Maximum powerproduced
[MW]
Net energy sentout
[MWh]
Privateconsumption
[MWh]
Load factor
[%]
Lydenburg 2 2 6 000 0 34.2Ceres 1 1 413 0 8.6Piet Retief 1 1 2 900 0 33.1
LydenburgThe hydro station in Lydenburg, which dates from the 1930’s, has been out of operationsince 1998. This was due to the need to repair components of the power plants as well as theconnector to the town’s distribution system. The Town council therefore decided to subcontractthe operation and maintenance of the plant to the private sector. The intention is that the plantwill be leased to a private operator who will do the necessary rehabilitation and sell the electric-ity to the town. This will in effect make Lydenburg Hydro an IPP. Some five companies re-sponded to the invitation to tender. At the time of writing the result of the tender has not yetbeen announced.
CeresThe Ceres hydro station has a nominal capacity of 1 MW. The maximum demand from Ceresvaries between a minimum of 6000kVA and 14000kVA. Electricity is generated between aminimum of 50kVA and 900kVA or between 0.35% and 15% of the total usage by Ceres. Theamount of electricity generated is determined by the amount of water available in the dam. Thegeneration of the power from the station represents an annual saving of 2.5% on the electricityaccount at current ESKOM tariffs.
Piet RetiefThe Bakenkop hydro power plant was commissioned in 1950 to supply the town of Piet Retiefwith electricity before it was connected to the national transmission system. After 50 years it isstill providing power to the town. The installed capacity is 0.8 MW. The system operates inter-mittently depending on the availability of water. The annual operational cost is R 290 760.There is no foreseen upgrading or decommissioning of the plant. At present it provides electric-ity at an average cost of R 0.09/kWh which is about half the rate the town pays to ESKOM forits power. The 1998 load factor of 33% will result in revenues of R 210 000, which are some R90 000 less than the operational costs, and the plant is therefore running at a loss. The powerstation is clearly very maintenance intense.
Cape Town Pumped StorageThe City of Cape Town owns and operates the 180 MW Steenbras pumped storage power sta-tion for peak power production. This is however not a renewable energy generator as the plantuses electricity purchased from the national transmission system (i.e. coal based electricity) topump the water during off peak times.
The sugar industryThe sugar industry is the biggest and best-established example of renewable energy fuelled non-utility generators in South Africa. There are 15 sugar mills in South Africa of which five havebeen licensed as electricity generators by the NER. All the plants generate steam and powerfrom bagasse. The licensed plants are those which are in a position to export power as listedbelow in Table 3.3. The unlicensed plants are therefore not exporting any power.

ECN-C--01-052 31
Table 3.3 Sugar mills licensed by the NER
Name LicensedCapacity
[MW]
Maximumpower produced
[MW]
Net energysent out[MWh]
Privateconsumption
[MWh]
Load factor
[%]
TH Amatikulu 12 10 43 775 43 775 51.0TH Darnall 13 7 27 388 27 388 44.7TH Felixton 32 22 79 935 79 935 41.5TH Maidstone1 29 20 79 582 44 917 45.4TransvaalSuiker2
20 - - - -
1 The Tongaat Hulett Maidstone is a combined bagasse/coal plant2 Transvaal Suiker was awarded a generation license in June 1998 and no data is available at present
The wood and pulp industriesThe industry consists of two sectors, the production of timber and the production of wood pulpfor paper and board manufacture. A large proportion of the output of softwood mills in SouthAfrica is in the form of kiln-dried timber resulting in a great demand for thermal energy. Almostall of these mills use their wood wastes as boiler fuel for steam generation while some alsopractice cogeneration. Most of the wood mills only utilise the steam generated and still buy theirelectricity from the local distributor - usually ESKOM. Only three of the South African millsgenerate their own electricity.
A reason why only steam is produced is that kiln heating steam is required round the clock butelectricity is only required for the 10-12hours/day of the sawmill’s operation. For the sawmillsto generate power it must be possible to sell this surplus power when the mill is not operating.The electricity generation potential through co-generation technology is about two to three timesthe mill’s own demand.
Steam is produced in the sawmills by the combustion of the wood wastes that result from thetimber production process. Saw mill waste makes up about 34% of the tree as harvested.
In all three cases, where South African saw mills are producing electricity, the electricity is gen-erated though the use of steam condensing turbines. These turbines were invariably purchasedsecond hand from small municipal power stations.
The saw milling industry is well aware of the potential for co-generation power production. Thispotential is not realised due to the competitive tariffs offered by ESKOM and the high cost ofinstalling new power generation equipment.
The pulp and paper mills generate some power for their internal needs. This is mostly due to theneed for reliability in electricity supply during production. A dip in power supply can have seri-ous effects on production. Power is derived from burning waste wood bark in combination withcoal and the distillate from wood chips (black liquor). The energy recovery from black liquorand bark is typically a third of that which is found in similar plants in Scandinavia. There is onlyone recorded case of a South African mill burning bark for power generation.
There is therefore potential for upgrading of these plants to provide more heat and power. Theavailability of the resource cannot be seen as the constraint rather the financial viability of con-verting the plants into power exporters and selling electricity into the available market.
Table 3.4 below lists the wood and paper mills in South Africa that process wood for paper pro-duction. There are a number of other mills in South Africa that produce paper but these do notprocess wood as pulp source and therefore doe not have power generating capacity.
32 ECN-C--01-052
Table 3.4 Pulp and paper mills in South Africa
Name Number of mills
Mondi Group 6Sappi Group 7
The fact that none of the wood or paper mills are licensed by the NER is an indication that nopower is currently exported from these mills compared to the licensed bagasse plants. The millsare opting to buy power from ESKOM and to utilise their own generation capacity for increasedsecurity of supply. This is a good indication of the perception within the industry of the eco-nomic value of own power production. At present bulk electricity prices, the mills do not seethemselves competing with ESKOM. The mills will have to more than double their energy pro-duction in order to meet own demand and have power available for export.
3.2 Barriers
The above overview illustrates that the renewable power generation market is still underdevel-oped. ESKOM’s initiatives are still in their early phase and have explicitly an investigative anddemonstrative character, they do not intend to put up a full-blown renewable power programme.With regard to IPPs, only a few licences have been awarded for relative small installations(around six, based on the above overview).
The conclusion that the IPP market is underdeveloped also stems from our analysis of policyenvironment. Currently there is no favourable market environment for large-scale penetration ofgrid-connected renewables. Major changes need to occur before that is going to happen.There are three main policy issues related to IPPs:• economic and financial viability,• ESI restructuring,• institutional and legislative framework.
3.2.1 Economic and financial viabilityEnvironmental concerns in themselves often represent economic values, such as avoided healthcosts, opportunity costs for depleting the countries stock of fossil fuel energy and benefits ofpreserving natural resources for future generations. Apart from the environmental costs, subsi-dies which were provided to coal electricity have to be included in cost pricing. These externalcosts and benefits are not reflected in present accounting methods for ESKOM’s electricity. Inanalysing the viability of renewables in South Africa, a case based on the current situation (fi-nancial viability) should be prepared, this should then be compared to a case which includes es-timates of external costs (economic viability).
Financial viability of renewable IPPsBecause of its decentralised nature, renewable power can offer electricity directly to its cus-tomer, the local distribution utility or a big consumer. Renewable power can therefor avoid theexpensive transmission costs associated with conventional grid electricity.. The renewable IPPscosts for production would have to be below this wholesale tariff in order to be competitive withESKOM’s power.
The wholesale price of ESKOM power varies greatly depending on geography and scale of theutility. For illustrative purposes we will take the Cape Town Metropolitan Council, which paysat this moment on average 12,5 - 13,5 Rand cents per kWh, of which app. 8-9 Rand cents perkWh can be attributed to transmission costs. If the transmission costs are deducted and the re-maining price is compared to typical generation prices of renewables (Table 3.5), it is clear that

ECN-C--01-052 33
this price is hardly competitive for any renewables, except in certain cases for micro-hydropower or the use of biomass waste.
Table 3.5 provides an overview of renewable generation costs. It should be borne in mind thatthe real price of renewables are very site-specific, because they are highly influenced by localresource availability, accessibility of the site, existing power infrastructure, etc.
Table 3.5 Overview of typical ranges of renewable generation costs
Renewable Energy Technology Production costs[Rand cents per kWh]
Wind 30 - 45Solar Thermal Power App. 40Biomass 10 - 50Hydro 10 - 50
Economic viability of renewablesWhen economic viability is taken into costs, not only the financial costs are considered, but alsothe hidden costs of each options. These hidden costs consists of two components: subsidies andenvironmental costs.
ESKOM claims the electricity generation costs to be 3-5 Rand cents per kWh. These low costsreflect the low fuel prices (cheap coal, abundantly available), but they also reflect the fact that alarge part of the capital costs are not included in the cost price calculation. It should be expectedthat ESKOM’s generation costs will rise substantially once new investments have to be doneand the capital costs have to be included. Due to increase in demand and age of a number ofcoal-fired power plants. the current situation of over-capacity in electricity generation is ex-pected to end by 2008. New plants will have to be built by the year 2008 and onwards. Based onprices of new coal power stations in Europe, it is assumed that the investment costs will bearound 10 Rand cents, of which 50% are required for end-of-pipe measures.
The same applies for transmission costs. ESKOM’s coverage for transmission is now around 8Rand cent per kWh. Once ESKOM is privatised, transmission is likely to be owned by a state-owned monopoly who will charge the private users of its network with real costs in order tomake up for new investments in the transmission grid. In the case of South Africa, these costscan be particularly high, considering the long transmission distances involved.
Incorporating environmental pollutionLocal environmental problems, such as acid rain, soot particles, etc. have severe local healthimpacts. It is difficult to make exact economic estimates of such health impacts. Therefore wetake as a reference the opportunity costs of avoiding such emissions, i.e. the costs end-of-pipemeasures.
With regard to global environmental pollution, i.e. greenhouse gas emissions, the same methodcan be applied and an international carbon reference price can be taken as a shadow price to es-timate the benefits of avoided carbon emissions. Estimates show that if a carbon price of US$8per tCO2 is taken, this amounts to Rands 0,07 per kWh.
Table 3.6 provides a summary of the economic costs of current electricity production in SouthAfrica3. It shows clearly that if the economic benefits are taken into account the viability gapmay be reduced to 6 Rand cents/kWh. If the Government of South Africa were to install a re-newables financial support mechanism including a shadow price for renewable generation of
3 It should be borne in mind that these figures are based on rough expert assumptions. Nevertheless, we believe that
the real figures would be in the proxy of these figures.
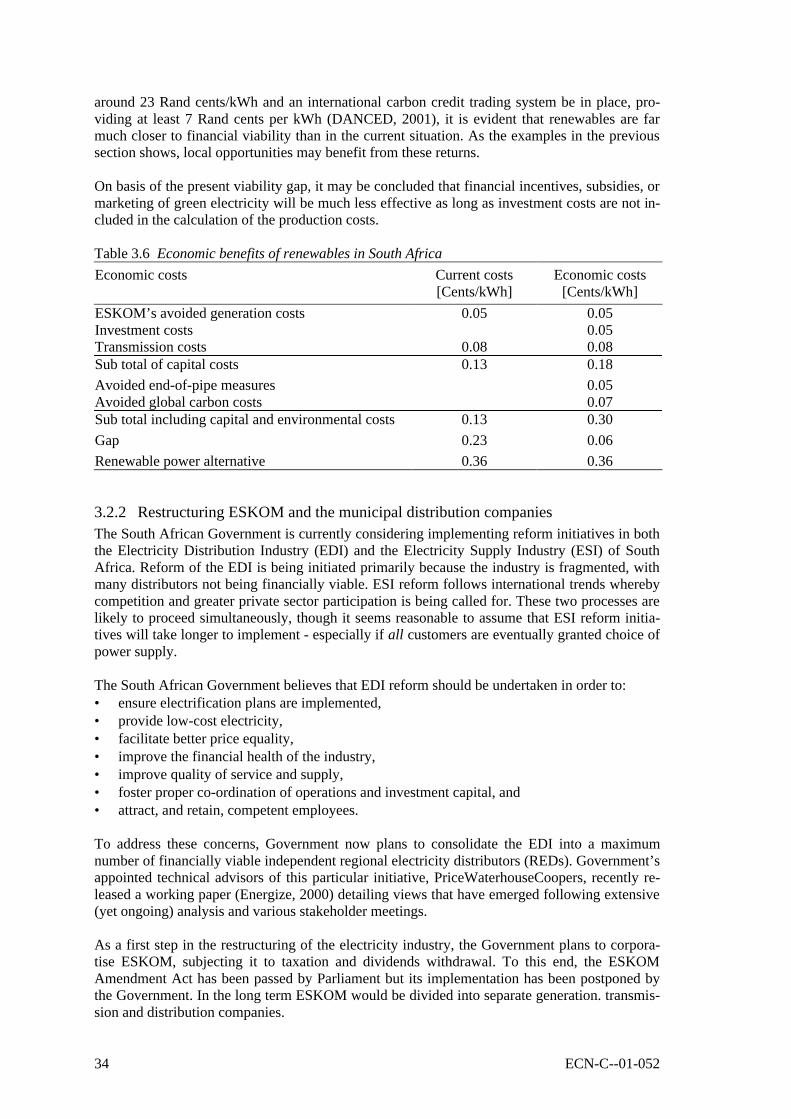
34 ECN-C--01-052
around 23 Rand cents/kWh and an international carbon credit trading system be in place, pro-viding at least 7 Rand cents per kWh (DANCED, 2001), it is evident that renewables are farmuch closer to financial viability than in the current situation. As the examples in the previoussection shows, local opportunities may benefit from these returns.
On basis of the present viability gap, it may be concluded that financial incentives, subsidies, ormarketing of green electricity will be much less effective as long as investment costs are not in-cluded in the calculation of the production costs.
Table 3.6 Economic benefits of renewables in South Africa
Economic costs Current costs[Cents/kWh]
Economic costs[Cents/kWh]
ESKOM’s avoided generation costs 0.05 0.05Investment costs 0.05Transmission costs 0.08 0.08Sub total of capital costs 0.13 0.18
Avoided end-of-pipe measures 0.05Avoided global carbon costs 0.07Sub total including capital and environmental costs 0.13 0.30
Gap 0.23 0.06
Renewable power alternative 0.36 0.36
3.2.2 Restructuring ESKOM and the municipal distribution companiesThe South African Government is currently considering implementing reform initiatives in boththe Electricity Distribution Industry (EDI) and the Electricity Supply Industry (ESI) of SouthAfrica. Reform of the EDI is being initiated primarily because the industry is fragmented, withmany distributors not being financially viable. ESI reform follows international trends wherebycompetition and greater private sector participation is being called for. These two processes arelikely to proceed simultaneously, though it seems reasonable to assume that ESI reform initia-tives will take longer to implement - especially if all customers are eventually granted choice ofpower supply.
The South African Government believes that EDI reform should be undertaken in order to:• ensure electrification plans are implemented,• provide low-cost electricity,• facilitate better price equality,• improve the financial health of the industry,• improve quality of service and supply,• foster proper co-ordination of operations and investment capital, and• attract, and retain, competent employees.
To address these concerns, Government now plans to consolidate the EDI into a maximumnumber of financially viable independent regional electricity distributors (REDs). Government’sappointed technical advisors of this particular initiative, PriceWaterhouseCoopers, recently re-leased a working paper (Energize, 2000) detailing views that have emerged following extensive(yet ongoing) analysis and various stakeholder meetings.
As a first step in the restructuring of the electricity industry, the Government plans to corpora-tise ESKOM, subjecting it to taxation and dividends withdrawal. To this end, the ESKOMAmendment Act has been passed by Parliament but its implementation has been postponed bythe Government. In the long term ESKOM would be divided into separate generation. transmis-sion and distribution companies.

ECN-C--01-052 35
Besides ESKOM, around 400 municipalities distribute electricity, most of them buying it inbulk from ESKOM. A reduced number of municipalities also operate their own power plants.The municipal distributors are represented by the Amalgamated Municipal Electricity Under-takings (AMEU). As part of the restructuring process, the distribution part will be divided in sixregional Electricity Distributors. The shares of the REDs will be owned by the local and na-tional government (the national government taking on ESKOM’s assets).
Due to the policy of transformation of state-owned entities and the reshaping of governanceprinciples, there will be room for IPPs to enter the market in the near future, but apart fromsome existing smaller entities, the first one still has to be established. This first IPP is facing alot of organisational and juridical troubles, but will in the end probably pave the way for otherinitiatives.
Therefore it may be concluded that rationalisation of the EDI will not in itself impact considera-bly on the fate of renewable energy generation in South Africa. It provides however an essentialstep towards a better environment for IPPs because ESI reform initiatives assume a maximumnumber of financially viable REDs operating in a more competitive environment, and one inwhich there is ultimately more private sector participation.
The following impacts of the rationalisation process on the position of IPPs can be distin-guished:• It is likely that under the reformed REDs a different tariff structure for wholesale electricity
delivery will apply. Wholesale prices will be more dependent on the time of consumption(peak demand versus low demand). This will make local generation more favourable. Thistariff reform is expected to take place within two years. First signs are already noticeable:ESKOM is operating at this moment an internal power pool in order to stimulate competi-tion and to gain experience.
• At this moment there is a proposal that an RED may not own more than 50 MW of embed-ded power generation capacity in order to control peak load power demand. The remainingpeak load will have to be bought on the market. It is still unclear when this restructuringprocess will be finished, but according to the general opinion, this may take up to five years.
3.2.3 IPP regulatory frameworkThere are three main issues with regard to the regulatory framework for IPPs:• the possibility of a long-term PPA,• the role of the National Electricity Regulator,• open access to the National Transmission System.
Long-term PPAAn important issue for private investors is the possibility of negotiating a long-term PPA. In thepresent environment, securing a PPA is critical to the success of IPPs. A long-term PPA is es-sential for obtaining commercial financing for the project. Unfortunately NER has stated that itwill not approve applications for generation license involving long-term PPA. Since NER re-quires such license for generation above 5 GWh/year, this stance is a very critical barrier. Oneof the reasons for NER’s stance is the perceived risk of allowing competition too early in therestructuring process. The lack of long-term PPAs resulting from NER’s stance makes it verydifficult for the developers to secure debt for their projects. The alternative, financing only withequity, is usually not practical.
Larger banks in South African have divisions specialised in financing of projects, capable ofdealing with IPPs. Issues to be secured are mainly:• commercial viability,• scale of the debt component,

36 ECN-C--01-052
• long-term PPA,• credit ranking of the purchaser,• stable regulatory and policy environment,• risk sharing with equity holder.
IPPs are perceived as risky by the banking sector. This leads to higher interest rates and selec-tive financing to most secure and profitable projects. The debt component should be R30 mil-lion and over; assuming a debt/equity ratio of 50/50 the minimum project size is around 10MW. The above implies financial barriers, especially for less profitable or smaller projects.
The role of the National Electricity RegulatorIPPs will have to arrange their contracts with the National Electricity Regulator. At this momentthe NER is opposing contracts with clients or with IPPs for longer than 5 years. Current plansare to allow big consumers (over 100 MW) buying their electricity from any supplier nationwide.
The White Paper on Energy Policy (WPEP) notes that IPPs will be allowed to enter the elec-tricity market, but that full competition will not occur until distribution sector restructuring andelectrification is completed (DME, 1998). In the interim period before the advent of full compe-tition the WPEP envisages ESKOM’s transmission business publishing ‘approved tariffs for thepurchase of co-generation and independently generated electricity on the basis of full avoidedcosts’. This establishes a situation where IPPs and co-generators act as contractors to ESKOMin meeting customer’s electricity needs, but do not compete openly with ESKOM.
The WPEP requires the NER to approve the tariffs paid by ESKOM Transmission to IPPs andco-generators. An important consideration will be whether the tariff arrangements proposed byESKOM adequately reflect the full avoided costs of purchasing electricity from IPPs andwhether they are sufficient to encourage the entrance of new players. The NER will also be re-quired to issue licenses to these new players and to make the necessary amendments toESKOM’s licences. Licences will stipulate for how long the proposed tariff arrangements willlast and to whom IPPs are allowed to sell during the interim period.
Potential IPP investors need to assess their likely returns over the economic life of their invest-ment. Therefore the NER is also likely to be required to give some consideration to the regula-tory arrangements which will be put in place as more open competition in the generation marketis introduced.
Open access to the National Transmission SystemThe WPEP recognises that open non-discriminatory access to the transmission lines is a prereq-uisite for open competition in the generation market. This requires the NER to ensure that nei-ther the technical terms on which access is provided, the access charging levels, nor the methodof calculating use of the transmission system forms a barrier to entry for independent genera-tors. In this field a lot of arrangements still have to be made.
3.3 Support for renewables within the restructuring process
It can be concluded that the short term perspectives for IPPs in general and more specifically forgreen IPPs are not very positive. The unclear organisational and legislative framework, the on-going restructuring of the electricity market and the competitiveness with the existing generat-ing capacity are the main barriers.
It can also be concluded that the policy focus in South Africa is currently on the restructuring ofthe ESI, a time consuming process expected to take another 4-5 years, which will establish theframework for IPPs competing with ESKOM. The current regulations for green renewable IPPs

ECN-C--01-052 37
are very unattractive and it is unlikely that they will be addressed prior to the set up of the IPPframework under the ESI restructuring. Hence, a more sustainable market environment forgreen renewable IPPs is likely to wait another 4 to 5 years.
Currently the electricity sector in South Africa is dominated by ESKOM, the parastatal utility,as it is by far the largest generator, owns the national transmission network and is the singlelargest distributor. In the presence of this de facto monopoly, IPPs in general and renewableIPPs in particular have at present extremely limited opportunities to enter in the electricity mar-ket. Very few independent generators are currently operating. Those that are, were set up in veryspecial circumstances and not as a result of an intentional IPP development.
This situation may gradually change in the future since both the electricity supply and distribu-tion industries are to be restructured. The reform of the ESI, most relevant for IPPs, aims atopening the current monopoly to competition and private sector participation.
Restructuring of the ESI is a specific mandate of the 1998 White Paper on the Energy Policy(WPEP) and is the basis of the current South African energy policy. The model to follow is stillbeing debated. Some recent indications are that ESKOM would be corporatised into separatetransmission, distribution and generation entities, and that separate generating companies wouldbe formed to promote internal competition prior to the introduction of private sector participa-tion, the latter aimed at providing new power requirements.
A functional framework for IPPs resulting from the restructuring process will be necessary. Thismay not be sufficient to encourage new renewable IPPs. These generators will be at an inherentdisadvantage to conventional IPPs. Special provisions should be introduced in the framework tohave renewable IPPs competing on a level playground. The imminent restructuring of the SouthAfrican electricity sector offers the unique opportunity to build renewable-friendly provisionsinto the new framework.
3.4 Opportunities for further actions
3.4.1 Policy related activitiesFrom the previous sections it is readily seen that regarding grid-connected renewable genera-tion, the WPEP and the Implementation Strategy for Renewable Energy (ISRE) emphasis is onthe assessment of resources and technologies (DME, 2000e). The political priority is rather thedeployment of off-grid renewables, as the energy supply to disadvantaged sectors. However, thegreater part of renewable resources can only be tapped through on-grid generation. This poten-tial has not been fully addressed at the political and governmental levels.
It is important to note that since 1998 DME and an EU party, the Danish Co-operation for Envi-ronment and Development (DANCED), have taken steps to support bulk wind energy genera-tion in South Africa, using the Darling Wind Farm as a pilot project. Studies for the develop-ment of the farm would be financed by DANCED and the United Nations Development Pro-gramme (UNDP), with some of the funds coming from the Global Environment Facility (GEF).
The first step was to carry out research on independent bulk power production with renewableenergy sources. The initial results were discussed with relevant stakeholders in September 2000.The DME/DANCED study, released in January 2001, presents recommendations to DME andNER on the way forward (DANCED, 2001).
The South African needs for support are elaborated upon in the next paragraphs, providing anoverview of potential opportunities for further actions. Being based upon the DME/DANCEDstudy, it is recommended that any new initiatives of co-operation in this field should be co-

38 ECN-C--01-052
ordinated between DME, DANCED, other interested EU parties and South Africanstakeholders.
• Development of a set-aside programmeThe concept is to reserve a fraction of the total power demand (an initial block of 200 MW isbeing proposed in the DME/DANCED study) to the most competitive renewable energy pro-ducers. The distribution companies would be obliged to purchase the renewable power at pre-mium prices.
Expertise would be required to assist DME and NER in designing the pilot phase of the set-aside and fitting it in the ESI and EDI restructuring processes. Interested developers and inves-tors would also need assistance to participate in the selection process and then in the develop-ment of the IPPs.
Potential foreign collaboration for the above may be requested from implementing bodies ofcountries already well experienced on set-aside programmes, notably the Department of Tradeand Industry in the UK, responsible for the Non-fossil Fuel Obligation (NFFO). Foreign devel-opers and investors participating in the national set-aside programmes could also be linked totheir counterparts in South Africa, in order to develop collaboration and partnerships.
• Power purchase regulationRenewable IPPs and utilities have conflicting views on the value of the power to be transacted,so the purchase needs to be regulated by an independent body (e.g. NER). An interim regulationis proposed from the beginning of the set-aside programme, to be later amended to encouragerenewable IPPs beyond the set-aside.
Some expertise is needed to help the power purchase regulator in developing key issues (e.g.determination of avoided costs, compensation for externalities etc).
• Integrated resource planningThe WPEP requires the implementation of Integrated Resource Planning (IRP) in the ESI. IRPentails formulating plans to meet the country’s future electricity needs at the lowest possiblecost. Grid-connected renewables should be properly considered among the alternatives to con-ventional power supply, in order to ensure the gradual incorporation of the renewable potentialin the energy system.
Expertise is required at DME and NER to include renewables in the modelling and forecastingprocedures that will produce data for the IRP exercise.
• Tariff structureThe WPEP states that tariffs for IPPs should consider full avoided costs; furthermore, it notesthat environmental costs should be included in order to promote renewable generation. Alongwith power purchasing agreements, tariffs are the most important issue for making renewableIPPs viable beyond the set-asides.
Expertise is needed to design a tariff structure that promotes competition and efficiency, and atthe same time considers the inherent disadvantages of renewables, especially environmentalexternalities.
• Innovative financingRenewable IPPs face much more expensive finance compared to conventional utilities. Exper-tise is required to assess the real risks of lending to renewable IPPs and to develop innovativefinance packages addressing the particular characteristics of renewable grid generation, e.g. eq-uity and debt capital, risk guarantee schemes, etc.

ECN-C--01-052 39
Most EU countries are familiar with specialised financing for renewables. Implementation bod-ies in these countries may be in the position to collaborate with South African parties in the de-velopment of appropriate financial mechanisms.
• Green power marketingDemand for green energy is slowly emerging in South Africa, initially from companies seekingto provide environmentally friendly products in foreign markets. Such demand should be linkedto renewable IPPs as a way of covering their incremental costs.
Expertise is required to design the green energy option within the regulatory framework. Ini-tially the regulator would approve the green tariff in a case by case basis. A market-based ap-proach could be developed in a later stage, e.g. through green certificates.
Different EU countries are involved in green investment funds, tariffs and/or certificates (e.g.Denmark, Belgium, Germany, Italy, Finland, Sweden and the UK). Some of this experiencemay be used to assist South African parties as required.
• Capacity buildingThe upcoming restructuring process of the electricity sector will be very demanding for DMEand NER, especially if the development of grid-connected renewables is to be integrated in theprocess. Both institutions feel that their capacity on renewables should be further developed.
Additional support for the implementation of grid-connected renewables may be obtained fromother EU parties with relevant experience.
3.4.2 Demonstration projectsWind energy• Wind measurementsWind measurements on a more detailed level and with more accurate measuring equipment arenecessary on specific sites that are or will be identified for establishing wind farms.
• Capacity building in the field of technical feasibility assessmentForeign experts could offer an important contribution in assisting the technical feasibility as-sessment, but even more in building up expertise in South Africa.
• Implementation capacityIn setting up a pilot/demonstration wind farm, foreign expertise will be essential. The involve-ment of foreign experts will prevent South African parties reinventing the wheel. To start with,foreign expertise could be transferred by conducting the implementation process jointly andthus build up capacity in South Africa. At a later stage, foreign involvement could be reduced tomore specific contributions.
• Local manufacturingAnother important issue is that of local manufacturing of components or building blocks inSouth Africa. Initially the complete technology could be transferred from Europe or the USA.But at a later stage, the manufacturing of towers, the assembly of the turbine or the manufac-turing of the blades could offer interesting opportunities for foreign parties as well as for the de-velopment of wind energy in South Africa.
40 ECN-C--01-052
Solar Thermal Power• Transfer of knowledge and experience with development and implementationThe main South African demand in this field is knowledge of and experience with the develop-ment and implementation of specific technologies. An inventory of companies that are activelyinvolved in projects that have been implemented in the EU, could provide a useful base for fur-ther co-operation.
Biomass• Developing a roadmapThe diverse biomass resources, the different available technologies and the numerous possibleapplications make it hard to get a proper overview of the most interesting opportunities. InEurope different studies have been conducted in which an inventory of all resources, technolo-gies and applications is made and analysed in order to develop a roadmap on which further ac-tions can be based. Apart from a methodology, many characteristics and data have been gath-ered in order to create such a roadmap. This experience could assist South Africa in creating asimilar road map. The main focus would be on− screening available technologies on their applicability and characterising them in technical
and economical terms,− conducting a resource assessment in terms of quantity and quality of available biomass,− comparing the export of foreign technology and possible manufacturing of this technology
in South Africa to own technology.
Wave energy• Working out a business plan for an international wave energy testing siteGiven the priorities in South African energy policy it is not advisable that South Africa becomeinvolved in basic research on this topic. An attractive opportunity for South Africa would be toestablish an international wave energy testing site at which developers of different technologiescould test and further develop there technology. Such a site, taking advantage of the good waveregime at the South African coast, probably could be co-financed by the parties involved inwave energy R&D. The establishment of such a test site would offer opportunities for South Af-rica to get involved in wave energy, but could also boost the development of wave energy tech-nology world wide.
A first step would be to work out a business plan together with interested foreign parties in-volved in wave energy developments.
3.4.3 Commercial project opportunitiesDespite the current unfavourable environment to the development of IPPs, especially renewableones, there are niche markets where particular conditions can eventually make renewable IPPsviable and competitive. The more promising opportunities in these markets appear to be mini-hydro plants, wind turbines and renewable generation in the sugar, wood and pulp industries.
Mini-hydro projectsThe hydropower potential of South Africa is concentrated along the eastern escarpment, espe-cially in the Eastern Cape Province, with up to 8000 potential sites. Given the high variability ofthe flow patterns along the year, most of them would require storage. Due to the negative envi-ronmental and social impacts of large dams, some international organisations (e.g. the EU) onlyconsider renewable plants below 10 to 15 MW, a limit to bear in mind within the present study.
A study sponsored by the European Commission in the Eastern Cape (CSIR et al., 2000)showed for example that sites with higher potential (0,8 t0 10 MW) are located on the KraaiRiver (north east), and on the Sondags and Groot Vis rivers (southern coastal area).

ECN-C--01-052 41
The above and similar studies contain portfolios of projects that could be further investigated bySouth African and EU parties. This could be done within the scoping study on small hydro-power systems being proposed by the DME within Action 6 of the ISRE. An initial contact withEU developers through the European Small Hydropower Association (ESHEA) may be appro-priate.
It is worth mentioning that one mini-hydro IPP is already being developed by South African andEU parties. The IPP is called Bethlehem Hydro (see Box 3.1) and is one of the four applicantsto the NER for renewable generation as of December 2000. The company intends to implementthe project under a BOO (Build, Own, Operate) scheme. Some potential shareholders and equitypartners are EU companies, namely Cinergy Global Power Ltd (UK), Electricité de France(EDF) and eventually NUON (Netherlands). Part of the additional costs are to be covered byenvironmental concessionary finance via the AIJ (Activities Implemented Jointly) Programmeof the Dutch Government.
Box 3.1 - Bethlehem Hydro
• Mini Hydro Power project of 9,81 MW. (1.05 MW, 3.7 MW and 5,06 MW).• All the plants within an acceptable range of a major rural town. The town(s) will be
the major base client(s) for the plant(s).• Two plants to be constructed on the Axle River close to the town of Bethlehem.• Of these plants one at an existing dam wall with a head of 10-12 m, the other at a
drop in the Axle River of approximately 40 m. The long-term water resource in theAxle River amounts to some 12 m³/s.
Economics:• Total cost estimate R 65 million complete.• Approx. 8-10 year payback at 13 c/kWh and interest rate of 16%.• Present average yearly electricity price for town is 14,6 c/kWh.• Estimated rate of return on equity after taxes is +20 % based on pre-feasibility.• Avoided CO2 emissions approx. 64.000 tons/CO2/year.• Cost per ton CO2 mitigated (based on AIJ-finance) is approximately US$8/ton CO2
(depreciated in 1 year) or US$0.43/ton CO2 (depreciated over lifetime).
Project Status• Project identification and pre-feasibility completed.• Project development team secured. Intent to purchase obtained from base client.
Discussions ongoing with Town Council re. Power Purchase.• Detailed feasibility study required.• Pending feasibility study outcome, project development to be completed.• Project participants identified, IPP Company established. Commitments from
stakeholders secured.• Concession to generate power applied for from National Government. In principle
approval obtained.• Tentative permit to utilise water resource applied for and received.• Financing for feasibility study to be secured.• Pending study outcome bulk financing, equity partners and investors to be finalised.
Source: DANCED (2001)

42 ECN-C--01-052
Wind powerWind resource is good along most of the South African coast with specific locations offeringhigher potential (mean annual speeds above 6 m/s and power exceeding 200 W/m2). Moderatewind power is found in the Eastern Highveld Plateau, Bushmanland, Eastern Cape and Kwa-Zulu-Natal.
A detailed regional assessment was made in the Eastern Cape Province, as part of the abovementioned EU-sponsored study (CSIR et al., 2000). The coastal areas show good potential, es-pecially around Cape Recife, Patensie and Uitenhage. Moderate potential exists on the inlandcoastal plain. The mountains around Fort Beaufort, Graaf Reinet and Jamestown show a slightlybetter potential. Following this assessment, site-specific studies in the most promising areas areneeded to identify new projects.
Action 6 of the ISRE foresees the development of a national plan for wind power, and the sup-port to three demonstration wind farms. As indicated in Box 4.1 above, one of these farms(Darling) may receive assistance from DANCED for its preparation. EU parties have alreadycollaborated with the promoter of the farm, i.e. the wind turbine manufacturers AN WindenergieGmbH (Germany) and Bonus Energy A/S (Denmark). Collaboration from other EU parties maybe possible, both in the present project (5 MW) and in its eventual extension.
The other two projects to be supported within DME’s national wind power plan (Strandfonteinand Kanonkrop) may also be open for collaboration of EU parties.
Further opportunities exist in a longer term for the development of new projects in areas of ma-jor potential, for example in the Eastern Cape Province. The resulting new initiatives should belinked to DME’s national wind power plan, in order to take advantage of the benefits it may of-fer (e.g. promotion of wind IPPs and links to international funding).
Sugar industryFifteen sugar mills operate in South Africa and cogenerate steam and power from bagasse (oneof them used also coal). Only five plants are currently in a position to export power as indicatedbelow.
Table 3.7 Sugar mills exporting power
Name LicensedCapacity
[MW]
Maximum powerproduced
[MW]
Netenergy exported
[MWh]
Internalconsumption
[MWh]
Loadfactor[%]
TH Amatikulu 12 10 43 775 43 775 51.0TH Darnall 13 7 27 388 27 388 44.7TH Felixton 32 22 79 935 79 935 41.5TH Maidstone1 29 20 79 582 44 917 45.4Transvaal Suiker2 20 - - - -1 Combined bagasse/coal plant2 Generation license awarded in June 1998. No data is available.
The cogeneration technology currently used is rather old and produces in average 70 kWh perinput ton. Conventional steam cycles can produce 120 kWh/ton and combined cycles up to 460kWh/ton. Upgrading these installations would significantly increase their electricity export po-tential. This is an opportunity for EU parties to look at more closely, especially when policymeasures are put in place to promote renewable energy generation.
Links for collaboration with relevant EU parties may be established through the European Bio-mass Association (AEBIOM) and the European Association for the Promotion of Cogeneration(COGEN Europe).

ECN-C--01-052 43
Wood industryMost of the production in this industry consists of kiln-dried timber which demands hugeamounts of thermal energy. Almost all of the mills burn their wood wastes for steam generationand buy electricity. Only three of them cogenerate heat and power.
The potential to generate electricity in the sawmills is two to three times the internal demand.The owners are well aware of the power exporting potential but have not installed the equip-ment needed for economic reasons: the current tariffs for feeding the grid do not justify the in-vestment.
This situation may change in the foreseeable future when policy measures are implemented topromote renewable generation. EU parties may get involved in the process of implementing thecogeneration facilities needed to make use of the existing potential. On this respect, an initialcontact with the already mentioned AEBIOM and COGEN Europe may be advisable.
The pulp and paper industryThere are 13 plants in this sector that process wood for paper production. These plants self gen-erate electricity for critical processes that demand high reliability in the power supply. Wastewood bark, black liquor and sometimes coal is burned for this generation. The rest of the elec-tricity requirement are supplied by the grid. In 1994 for example, self generation was 279 MW,total demand 590 MW, and 335 MW were purchased from ESKOM.
The current specific electricity self production is only one third of that reported in similar plantsin Scandinavia, so there is potential to more than double the internal generation. This would al-low the plants to cover their own demand and sell the excess to the grid. The current tariffs forfeeding the grid once again do not justify the investment needed to upgrade the cogenerationfacilities.
Policy measures to promote renewable generation could reverse the situation. In the years tocome there may be opportunities for EU parties to collaborate in fully exploiting the cogenera-tion potential of this industry. Initial contacts may be established through relevant EU associa-tions (AEBIOM and COGEN Europe).
A recent development shows the way ahead. In December 2000 NER board granted a license toBiomass Energy Ventures to operate a 17,5 MW power station. The developer plans to usewaste products from a paper mill of the Mondi group near Durban to fire the station, which willsupply about 15% of the mill’s electricity requirements.
44 ECN-C--01-052
4. OFF-GRID RENEWABLE ENERGY
Electrification of households is one of the core objectives of the Reconstruction and Develop-ment Programme (RDP) adopted by the Government of South Africa in 1994. The RDP set anaccelerated electrification programme to provide electricity for an additional 2.5 million house-holds by the year 2000, thereby increasing the electrification level to about 72 per cent of allhouseholds (double the number in 1994). Both grid and non-grid power sources were to be em-ployed.
Throughout South Africa, two-thirds of households have been electrified, whilst in rural areas,more than half the population is not electrified (see Paragraph 4.1 for further information ongrid connected rural electrification efforts in South Africa). In 1992, ESKOM launched thecampaign ‘Electricity for all’ and embarked upon an ambitious programme to electrify SouthAfrica. Despite an impressive record of ESKOM in terms of connecting people, it is estimatedthat still 3.3 million households are not connected to the grid and that 2.1 million of these willnot receive ESKOM electricity in the near future.
For these households, the Department of Minerals and Energy (DME) has developed a mecha-nism to provide electricity and power to those communities that are not planned to be connectedto the electricity grid, the Non-grid Rural Electrification Programme. This Programme is meantto start in 2001 and aims at providing energy services to 300,000 households by means of off-grid renewable energy. This ambitious target makes the Non-Grid Electrification Programmethe single best opportunity for promoting the large-scale penetration of renewable energy tech-nologies in South Africa. The Non-Grid Electrification Programme and other off-grid renewableenergy initiatives are highlighted in Paragraph 4.2.
Two of the key national priorities in South Africa are job creation and rural development. Theissue of improving energy services in rural areas is very much inter-linked with both these pri-orities. The key policy challenge facing South Africa is to address these three issues in an inte-grated manner and is discussed in Paragraph 4.3. Paragraph 4.4 identifies opportunities for fu-ture actions.
4.1 Grid connected rural electrification
In 1998, the Government released the White Paper on Energy Policy (DME, 1998). The Paper isaimed at clarifying government policy regarding the supply and consumption of energy, but itdoes not attempt to deal with implementation strategies, as they are part of the core functions ofthe Department of Minerals and Energy (DME). The White Paper’s objective is to constitute aformal framework for the operation of the energy sector within the broader national economicdevelopment strategy.
DME considers electrification as the most important policy objective of the White Paper in theelectricity sub-sector. This criterion is consistent with the broader socio-economic targets of theRDP and with the important electrification process led by ESKOM mainly through grid-connections. The White Paper recognises the role of Solar Homes Systems (SHS) and other re-newable energy technologies in providing energy services to remote rural communities.
Most of the 43 million South Africans live in urban areas. 80% of the urban households areconnected to the grid. In rural areas, more than half the population is not electrified. This highconnection rate in urban areas coupled with the high urbanisation rate results in two out of threepeople in South Africa being connected to the grid.
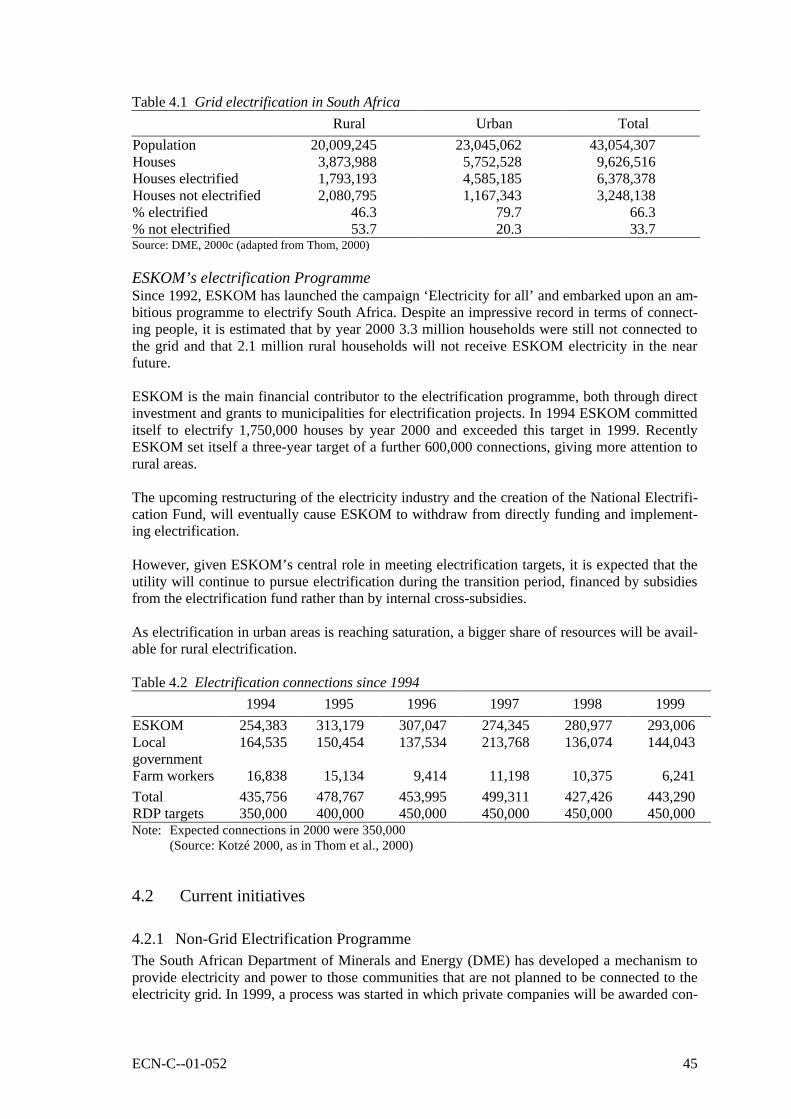
ECN-C--01-052 45
Table 4.1 Grid electrification in South Africa
Rural Urban Total
Population 20,009,245 23,045,062 43,054,307Houses 3,873,988 5,752,528 9,626,516Houses electrified 1,793,193 4,585,185 6,378,378Houses not electrified 2,080,795 1,167,343 3,248,138% electrified 46.3 79.7 66.3% not electrified 53.7 20.3 33.7Source: DME, 2000c (adapted from Thom, 2000)
ESKOM’s electrification ProgrammeSince 1992, ESKOM has launched the campaign ‘Electricity for all’ and embarked upon an am-bitious programme to electrify South Africa. Despite an impressive record in terms of connect-ing people, it is estimated that by year 2000 3.3 million households were still not connected tothe grid and that 2.1 million rural households will not receive ESKOM electricity in the nearfuture.
ESKOM is the main financial contributor to the electrification programme, both through directinvestment and grants to municipalities for electrification projects. In 1994 ESKOM committeditself to electrify 1,750,000 houses by year 2000 and exceeded this target in 1999. RecentlyESKOM set itself a three-year target of a further 600,000 connections, giving more attention torural areas.
The upcoming restructuring of the electricity industry and the creation of the National Electrifi-cation Fund, will eventually cause ESKOM to withdraw from directly funding and implement-ing electrification.
However, given ESKOM’s central role in meeting electrification targets, it is expected that theutility will continue to pursue electrification during the transition period, financed by subsidiesfrom the electrification fund rather than by internal cross-subsidies.
As electrification in urban areas is reaching saturation, a bigger share of resources will be avail-able for rural electrification.
Table 4.2 Electrification connections since 1994
1994 1995 1996 1997 1998 1999
ESKOM 254,383 313,179 307,047 274,345 280,977 293,006Localgovernment
164,535 150,454 137,534 213,768 136,074 144,043
Farm workers 16,838 15,134 9,414 11,198 10,375 6,241
Total 435,756 478,767 453,995 499,311 427,426 443,290RDP targets 350,000 400,000 450,000 450,000 450,000 450,000Note: Expected connections in 2000 were 350,000
(Source: Kotzé 2000, as in Thom et al., 2000)
4.2 Current initiatives
4.2.1 Non-Grid Electrification ProgrammeThe South African Department of Minerals and Energy (DME) has developed a mechanism toprovide electricity and power to those communities that are not planned to be connected to theelectricity grid. In 1999, a process was started in which private companies will be awarded con-

46 ECN-C--01-052
cessions to supply energy services to rural households beyond the reach of the national grid bymeans of the fee-for-service (FFS) approach.
In the FFS approach, an energy service company provides solar electricity for a monthly fee torural households such as utilities do for grid-connected electricity. Although the system is basedin the house of the customer, the system will be owned and maintained by the energy-servicecompany. The concessionaire will have to invest in setting up a rural infrastructure to imple-ment the activities, but will also have the monopoly right to supply energy services in his area.The concessionaires will be supervised by the NER. International experience with the FFS ap-proach reveals that in almost all of the countries where the FFS approach is applied, the energy-services company will be regulated by government and awarded monopoly status for specificgeographic regions (Martinot et al., 2000; Martinot and Reich, 2000).
The objective of the concession pilot programme in South Africa is to electrify 300,000 house-holds in 5 years, divided into 50,000 households per concessionaire. The energy service compa-nies could in principal deploy any technology they think is the most appropriate to deliver theenergy services to the end-users. With regard to South Africa, in most cases the concessionaireswill use solar PV systems, given the low ability to pay of the end-users, the dispersed nature ofthe households and the lack of institutional end-users.
In order to create a level playing field for renewable energy technologies, the concessionaireswill receive the same subsidy as ESKOM per established connection, which is Rand 3000.Based on a SHS price of about R.3500-4000 this is about 75% subsidy of the initial hardware.As of the end of 2000, there would not be a subsidy on the tariffs of SHS, but DME might con-sider this once experience shows that the monthly tariffs for year 2000 of around R. 45 were toohigh.
Important stakeholdersA number of key players are involved in the concession approach. They are:• DME• NER• Concedantes• The private consortiums forming concessionaires.
ConcedantesESKOM and the Durban Electricity Authority, being the licensed electricity distributors in therelevant areas, will function as concedantes in this whole process. The role of concedantes is tomonitor the implementation of the concessions to ensure that the services are delivered as perthe contract. Another role of the concedante is to ensure that the necessary planning takes placethat will allow the integration of the grid and off-grid electrification activities (Banks et al.,2000).
National Electricity RegulatorThe National Electricity Regulator is the national regulating body of the electricity supply in-dustry. The NER is at present not only responsible for the issuing licenses for electricity distri-bution, it has also been mandated by the DME to regulate the implementation of the Non-gridElectrification Programme.
The NER as one of its functions in the concession programme, dispenses the subsidy for eachsystem installed to the concessionaire. NER is also responsible for identifying target areas forconcessions, granting licenses to concessionaires, controlling prices, setting service standards,settlement of disputes, and monitoring and evaluation of the programme (NER, 2000b). Thislatter role is overlapping with the role of the concedante to prevent ESKOM getting insight intocommercially sensitive information from (potential) competitors (Banks et al., 2000).

ECN-C--01-052 47
Institutional structure of the National Electrification ProgrammeFigure 3.2 summarises the institutional structure of the rural electrification programme, includ-ing both grid and non-grid. The DME is the responsible Government Department, the NER (andthe future National Electricity Fund) is responsible for the regulatory framework and the fund-ing of grid electrification through either ESKOM or local utilities (after the electricity restruc-turing the Regional Electricity Distributors, or non-grid electrification through the concession-aires.
Electrification Options
Grid Non-Grid
NER NEF
DME
NationalGovernment
External Int .Donors
ESKOM
ESKOM/Utility ConcedanteUtility/ESKOM
Concessionaire - Business Plan
FutureFunding
Future Funding
FundAdministrator
Regulation (Licenses)Future FundAdministrator
Must be licensed toReceive Funding
Should be licensed toReceive Funding
Contract (License Condition)
Customers
Renewable Hybrid Mini-grid
Customers Customers
Figure 4.1 Institutions involved in the rural electrification Programme (source: NER, 2000b)
4.2.2 The commercial solar marketBanks et al. (2000) estimate that total sales of SHSs in South Africa through the cash marketamounts up to 50,000 systems since the start of commercial SHS activities. This amounts to lessthan 1% of the initially un-electrified community. This seems however a conservative estimate.Stassen and Holm (1996) estimated an installed capacity in 1994 of 40,000 systems. Based onthe figures in Stassen and Holm (1996) a yearly production of 12,000 SHS can be estimated, re-sulting in total installed systems of 70-80,000 in South Africa in 2000. Based on the unverified

48 ECN-C--01-052
accounts from our field survey among SHS companies, the yearly sold figures would alsomount up to 12,000-15,000 systems a year. This does not look impressive compared to the tar-get group for SHS, it only covers 0.5% (see Stassen and Holm, 1996; Banks et al., 2000). Com-pared to other SHS markets in the world, however, the figure of 50,000 to 80,000 systems putsSouth Africa in the top ten of SHS markets in the world (compare with Nieuwenhout et al.,2000, p.16).
Commercial retail channels for cash salesAn interesting finding is that all companies in this category distributed their systems throughurban centres, not via rural distribution networks. Arguments mentioned by companies to thereasons for this are:• Maintaining a rural network for SHS delivery was clearly seen as too expensive for the low
margins on PV systems.• SHS belongs to a category of products, durable consumer products, for which customers
spend a lot of money and for which they are willing to travel as opposed to conveniencegoods. Customers also purchase their television, radio and other electrical appliances in ur-ban centres, so why not SHSs?
• SHS are often donated to rural end-users by urban relatives, who earn a higher income thantheir rural family. There exists thus an urban client base for SHS even though they are notthe end-users.
The commercial retail channels for cash sales can be subdivided in:• Sales from own workshop• Integrated retail channel• Independent retail channels.
Sales from own workshop:This is a limited strategy: low costs low results. It is mostly applied by PV companies for whomthe SHS market is not their core market. Thus they will serve the upmarket SHS clients withspecific design requirements.
Integrated retail channels:PV companies who have their own existing retail channels can use them for SHS as well. InSouth Africa, this was found for the battery producers.
Independent distribution channels:This is a retail channel in which no contractual relation exists between retailer and wholesalerand where the retailer supplies different types of SHS on a more or less regular basis. The scopeof this research was too limited to do an extensive research to existing retail channels in SouthAfrica, but they include:• Major chain groups: Makro, Dion, Games, etc.• Supermarkets – Supermarkets may see certain advantages in dumping cheap PV panels but
will have little opportunity to provide back-up services.• Mine worker concession stores - A concession store is a store at a mineworkers compound
who hold the monopoly right to sell to the mineworkers. These stores also sell PV panelswhich mine-workers will buy for their families in rural areas. This channel was brought upas an example of how PV has got a bad name in South Africa. Since the concession storeshave monopoly right to sell to the mineworkers and the buyers are not the ultimate end-users, they have an incentive to sell low quality products.
CreditSouth Africa has relatively little experience in applying micro-credit for SHSs. Credit is used topurchase furniture and fridges. As one of the respondents noted, unlike SHSs, these productshave high margins for the retailers, which limits the relevance of their credit mechanisms for

ECN-C--01-052 49
SHSs. Their higher margins can facilitate the credit provision. Also, existing financial retailchannels are not geared towards facilitating loans for PV given their high interest rates and shortrepayment periods.
The general view of interviewed companies is that credit would help the market, but is very dif-ficult to organise. It will only work if it is organised on a commercial basis, but there is notmuch experience so far. Two of the interviewed companies mentioned experience with credit.The first mentioned of an experience with a pilot project, which failed. The second companywas more successful and has been using credit for a long time and experienced little problems.The company installs the system (to know the location of the customer), and the consumer hasto pay 50% deposit, and the remaining amount in a 12 months period with a commercial interestrate of 26%. If the customer does not meet its commitment, than the company will take awaythe panel (about 50% of the cost). This results in people starting to pay again. The lower incomecustomers are typically the market sector that ask for credit.
4.2.3 Solar demonstration projectsApart from commercial channels or the Non-Grid Electrification Programme, also other sourcesprovide funding for SHSs, such as local government bodies, donors or NGOs. These are typi-cally one-of-a-kind projects and as such they can hardly be qualified as a retail strategy for SHSas the driving actor is not the company but the donor. A number of non-grid electrification pilotprojects have been implemented in South Africa (see Table 3.11).
Table 4.3 Demonstration SHS projects in South Africa (source: Thom et. al., 2000)Project area Description SHS installed Support System size
KwaBhaza the provision of an integrated energy packageat KwaBhaza by ESKOM and Total.
140 R1500/SHSFinance
49 Wp
Maphephethe A private commercial non-subsidised SHSdissemination pilot at Maphephethe.
60 Projectdevelopment
Loan
55 Wp
Folovhodwe A joint project between the Bavariangovernment and the DME at Folovhodwein the Northern Province.
Free State farmworkers programme
A District Council initiative to supply farmworkers with SHS in the Free StateProvince.
1800 R2000-2500/SHS
50 Wp(estimate)
4.2.4 CSIR Lubisi projectThe Lubisi Dam project started in 1994 as a project to demonstrate the use of renewable (hydro,wind, solar and biomass) energy to accelerate development in a rural area. Since then the projecthas become an integrated and integrative project to demonstrate a wide range of suitable tech-nologies in the creation of jobs. The project has been assisted by CSIR Corporate InvestmentThrust status since late 1996.
During the first 18 months of the project, no technology flow occurred at all, as the time wasspend on the sociological aspects of encouraging the local people to form a representativestructure. This structure could strategically plan for development in the area in the knowledgethat all elements of the local society, including women, traditional leaders, youth, churches, po-litical parties and others would be included in the decision making processes. The resultantstructure consists of the Conference (6 members from each of the 23 participating villages), whoelect a 23 member Forum, and finally the 6 member Executive, with a total of about 80 000people now being able to participate and make decisions about the overall development of their

50 ECN-C--01-052
area. The Forum was then led through and participated in a SWOT4 analysis and a survey todetermine local resources and needs. Out of this process emerged the five top priorities, withoverwhelming consensus, for the community as a whole:1. water supply,2. agriculture,3. job creation through Small and Medium Enterprises,4. transport and transport infrastructure,5. energy and electricity.
Energy was seen to be key to any future development. The region is currently off-grid.
The CSIR subsequently embarked on a series of feasibility studies to determine, from the localresource base and its own knowledge, the range of technologies that could be applied and theextent of sustainable job creation. A number of reports now exist in this regard and a number ofpotential projects have been identified. These include:a. Water supply projects totalling R 25 million now submitted to The Department of Water Af-
fairs and Forestry (DWAF) for approval,b. Fish farming, resulting in the creation of a least 6 small subsistence fishing enterprises, with
a potential annual income of around R 200 000.c. Road upgrading training, to enable the local people to crush their own stone and upgrade lo-
cal roads by themselves.d. Cotton farming under irrigation, in conjunction with a local Cotton company.e. Fence making in conjunction with better stock management training, to enable the creation
of permanent pasture for sheep and goats.f. Boat building, an SME to complement the fish farming.g. Fish hatchery and breeding (trout),h. Micro-hydro electric plant driven by a local spring to supply power to the fish hatchery,i. Six small wind turbines from Scotland, funded 50% by Scottish Enterprises and 50% by
CSIR, to power woodworking and other job creation projects.j. Manufacture of wooden toys and ornaments for export,k. A sewing group involving up to 180 women to produce ethnic garments for export,l. A nursery project to cultivate drought resistant fodder,m. A home garden project to enhance the home cultivation of vegetables,n. A school leaver’s training pilot to learn employment skills in conjunction with the SLOT or-
ganisation,o. A waste recovery and water utilisation project to generate fertiliser, bio-gas and compost in a
pilot project towards the creation of sustainable villages where water supply is coupled withjob creation, energy needs and food production.
p. An overall feasibility project to determine the uses to which a large-scale hydro-electric plantinstalled on the dam itself could be put to attain the overall transformation of the area,
q. A feasibility study with possible Finnish government funding to investigate the sustainableutilisation of existing plantation and natural forest resources in the area for energy and in-dustrial use.
4.2.5 Remote area power supply programme - IDT5
Gwagwa (2000) mentions of the plans for a remote area power supply programme, which willprovide an opportunity for partnerships to bring the greatest impact in rural economic develop-ment through energisation. It is envisaged that the programme will be launched through the ini-tiation of 50 pilot projects sites across the country.
4 An analysis focusing on Strengths-Weaknesses-Opportunities-Threats of the subject.5 Entire section based on Gwagwa (2000).

ECN-C--01-052 51
Three ingredients are needed to pilot such projects successfully:• technology• financing, and• institutional capacity.
The technology for viable off-grid electrification of communities (rather than households) basedon renewables is available, proven and reliable. Financing for piloting off-grid projects to accel-erate the pace of rural electrification is available from a variety of concessional sources.
In addition, by bringing in private and NGO partners in the delivery of public policy, Independ-ent Development Trust (IDT) is also enhancing the capacity of Government in implementing itspolicies, and:• Crystallising the integrative potential of energisation.• Being an integrative facilitator in the process of rural development by bringing together vari-
ous role players who could add value to the process.• Working with experts in the energy field to find practical energy solutions to local economic
needs.• Alternative forms of energisation that are inherently short term with a view to crystallise lo-
cal communities into economic activities that eventually lead to integration with the maingrid.
• Make communities understand the importance of energy as a key to enhancing their own as-pirations for development.
• Instil within technical experts an understanding of the needs of the people and the culturaland social frameworks within which energisation will be determined and applied.
• Ensuring that the focus of interventions should be to make traditional ways of rural commu-nities more efficient.
• IDT drawing on its comparative advantage in terms of mobilising community groups in thedelivery of services and acting as a bridge between the public and private sector, the NGOsand communities.
The ‘gap’ in making progress with off-grid rural electrification lies in the institutional capabilityneeded to undertake and implement such pilot projects successfully. Unlike many other coun-tries, South Africa does not have a rural electrification administration or a network of ruralelectricity co-operatives. But it has a rich endowment of NGOs which have successfully imple-mented infrastructure projects at village and community levels. Therefore, although it is notclear immediately which institutions should be the implementing agencies for such an initiativein South Africa, three clear possibilities exist:a. A large NGO which has proven experience and the internal staff capability to undertake rural
infrastructure provision and work effectively at the community level,b. ESKOM itself, which has the monopoly and mandate to universalise electricity provision but
which is constrained by the other urgent demands being made upon its resources and by con-siderations involving its own evolution and transformation, and
c. Sub-national governments, such as the Provinces, local governments or rural districts.
The IDT understands that the technical aspects of energy are quite specialised and it wouldmake no claims to be experts in this regard. Which is why the building of partnerships brings tothe scene the required and relevant expertise for an integrated approach to rural developmentespecially as it relates to growing and developing these local economies and the potential thatresides within them.
4.2.6 Hluleka Nature Reserve: Mini-GridThe potential for eco-tourism at the Hluleka Nature Reserve provides an anchor for new eco-nomic activities that could benefit the nature reserve as well as create new jobs for the adjacent
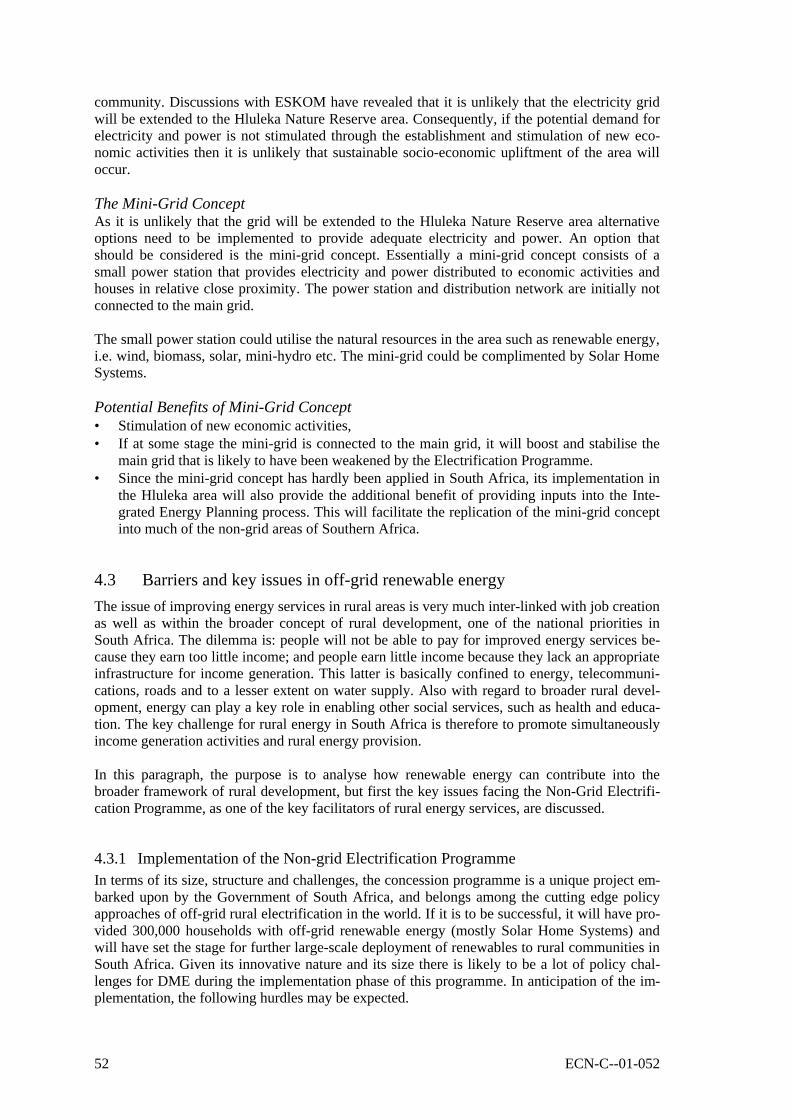
52 ECN-C--01-052
community. Discussions with ESKOM have revealed that it is unlikely that the electricity gridwill be extended to the Hluleka Nature Reserve area. Consequently, if the potential demand forelectricity and power is not stimulated through the establishment and stimulation of new eco-nomic activities then it is unlikely that sustainable socio-economic upliftment of the area willoccur.
The Mini-Grid ConceptAs it is unlikely that the grid will be extended to the Hluleka Nature Reserve area alternativeoptions need to be implemented to provide adequate electricity and power. An option thatshould be considered is the mini-grid concept. Essentially a mini-grid concept consists of asmall power station that provides electricity and power distributed to economic activities andhouses in relative close proximity. The power station and distribution network are initially notconnected to the main grid.
The small power station could utilise the natural resources in the area such as renewable energy,i.e. wind, biomass, solar, mini-hydro etc. The mini-grid could be complimented by Solar HomeSystems.
Potential Benefits of Mini-Grid Concept• Stimulation of new economic activities,• If at some stage the mini-grid is connected to the main grid, it will boost and stabilise the
main grid that is likely to have been weakened by the Electrification Programme.• Since the mini-grid concept has hardly been applied in South Africa, its implementation in
the Hluleka area will also provide the additional benefit of providing inputs into the Inte-grated Energy Planning process. This will facilitate the replication of the mini-grid conceptinto much of the non-grid areas of Southern Africa.
4.3 Barriers and key issues in off-grid renewable energy
The issue of improving energy services in rural areas is very much inter-linked with job creationas well as within the broader concept of rural development, one of the national priorities inSouth Africa. The dilemma is: people will not be able to pay for improved energy services be-cause they earn too little income; and people earn little income because they lack an appropriateinfrastructure for income generation. This latter is basically confined to energy, telecommuni-cations, roads and to a lesser extent on water supply. Also with regard to broader rural devel-opment, energy can play a key role in enabling other social services, such as health and educa-tion. The key challenge for rural energy in South Africa is therefore to promote simultaneouslyincome generation activities and rural energy provision.
In this paragraph, the purpose is to analyse how renewable energy can contribute into thebroader framework of rural development, but first the key issues facing the Non-Grid Electrifi-cation Programme, as one of the key facilitators of rural energy services, are discussed.
4.3.1 Implementation of the Non-grid Electrification ProgrammeIn terms of its size, structure and challenges, the concession programme is a unique project em-barked upon by the Government of South Africa, and belongs among the cutting edge policyapproaches of off-grid rural electrification in the world. If it is to be successful, it will have pro-vided 300,000 households with off-grid renewable energy (mostly Solar Home Systems) andwill have set the stage for further large-scale deployment of renewables to rural communities inSouth Africa. Given its innovative nature and its size there is likely to be a lot of policy chal-lenges for DME during the implementation phase of this programme. In anticipation of the im-plementation, the following hurdles may be expected.

ECN-C--01-052 53
ESKOM-concessionaires relationsESKOM has yet to reveal what their grid extension programmes are in the assigned concessionareas. The negotiations between DME and ESKOM on this subject are still going on. Below thisissue is a more substantiated point that the South African case is quite particular due to the pres-ence of ESKOM. In the current situation, two companies have the monopoly right to provideenergy services to rural households. ESKOM for grid connected, and the concessionaire for theremaining technologies. Since grid-extension is the most favoured technology if it is viable, theconcessionaire will have to wait with the plans of ESKOM. Potential problems:• There may be technological shade areas, where it is not clear who is responsible.• Risk exposure versus rewards. Experience from other countries (Chile) reveals that busi-
nesses do not merit rural electrification on the current cash flows, but also on expected fu-ture cash flows. These are likely to increase over time due to development of rural areas andcorresponding increased energy demand. In the case of the concessionaires, a situation maydevelop where they take all the risk in putting up local infrastructure, promoting develop-ment and increasing energy demand, and once a profitable sustainable market has arisen,ESKOM may come in with grid extension and take over the customers from the conces-sionaires. This risk in itself may provide a disincentive to the concessionaires to invest inlarger systems, such as mini-grids, which may have more potential in the long run or pro-mote income generation activities and other development benefits.
• ESKOM may not be able/willing to provide detailed cases of its grid extension pro-grammes. For instance, villagers in Maphephethe, where a solar pilot project took place,where greatly annoyed to find out that grid was extended to neighbouring villages threeyears after the start of the project, while at the beginning of the solar project ESKOM de-clared that the area would not be electrified for at least five years (Annecke, 1999).
• The Electricity Sector Industry is undergoing a restructuring process (see elsewhere in thisstudy). It is highly likely that competition will be introduced. ESKOM may not be verymuch willing to co-operate with each of the concessionaires, who may turn out to be theirdirect competitor within a few years.
Fee-for-service conceptThe fee-for-service concept applied in the concession systems is an innovative approach to dis-seminate PV systems to rural household. However, there are few proven examples of the con-cept so far.• The payment discipline required under the programme may be too strict for rural house-
holds. Experience in Uganda reveals that keeping up payment discipline among end-users ishard when it’s getting over a year time.
• Another issue is ownership. Interviews held among local PV dealers saw as the biggest dis-advantage of the fee-for-service concept the lack of ownership of households. There are tworeasons behind ownership: 1) households prefer to own the system, and 2) ownership isclearer incentive for the household to learn about operation and maintenance.
• Social impact - Thom et al. (2000) argue that the monthly fee of R. 50 will not be affordableto a large percentage of rural households and that a large-scale subsidised programme likethe Non-Grid Electrification Programme will only benefit the more affluent households inrural areas.
The bad image of PV• Desirability of PV - PV is not always the most preferred technology in rural areas. This is
partly due to the ‘Electricity for all’ promise of ESKOM in the early nineties, which madepeople wanting to wait for grid-connection, because of inferior PV products sold in the pastby commercial ‘fly-by-night’ operators, and because PV is seen as a second class supplysince it has low capacity (e.g. not possible to cook or heat water) but a much higher kWhcost that grid supply.

54 ECN-C--01-052
4.3.2 Renewable energy and income generationIn a global evaluation study of the socio-economic impacts of renewable energies Aguado-Monsonet (1998) noted the significant impact renewable electricity projects had on stimulatinglocal productive activities. It was concluded that productive activities were stimulated in 65% ofthe wind projects, 50% of the biomass projects and in 40% of the PV projects. Another conclu-sion which became clear from these results is that larger systems have a higher impact thansmaller systems. The global survey also indicated that the rural electrification had a positive im-pact on social projects and played a role in preventing migration to the urban areas.
What type of income generating activities could be generated with renewable energy? The pro-motion of renewable applications in rural areas can have positive impact on job creation inSouth Africa in the following three areas:1. Manufacturing
• Manufacturing of renewable energy systems, once they are locally produced.• Manufacturing of electrical appliances, especially DC appliances. During the People’s
Power workshop it was noted that there is hardly any manufacturing of DC appliancescurrently being done in South Africa, while there will be increasing demand, once theconcession programme becomes operational.
2. Implementation (Concessionaires)• Installation of renewable energy systems.• Maintenance of PV systems. Rule of thumb appears to be around 1 person for every 100
PV systems installed (for the 300,000 PV systems under the concession programme thatmeans 3,000 people being employed).
3. Indirect: energy provision for income generation activities.
The first category is unlikely to promote rural job creation, since manufacturing is typicallydone in urban areas. Activity number 2 and 3 however, will lead to job creation in rural areas.Since category 2 is already covered under the concession approach the main challenge with re-gard to job creation relates to category 3.
Potential income generation activities related to rural electrification can be subdivided into anumber of categories:
Household income generation activitiesThe mere introduction of lighting has enabled people embarking upon new income generationactivities. The introduction of solar PV has enabled the following examples:• sewing machines running directly on solar PV during the day,• poultry farming by lighting henhouses during the evening,• video. People running a video and colour TV with their SHS were found organising video
evenings for the village and making a profit (Uganda),• cottage industry.
Small-scale rural enterprises• hotel, restaurant, bar by having light and PV fridges,• fishing with solar light. This is obviously confined to areas bordering the sea or great lakes.• eco-tourism.
Small-scale farmingIn the ‘Implementation Strategy for Renewable Energy for South Africa’ renewable energy forsmall scale farming was promoted.
‘Re-introduction and revitalisation of small-scale farming is projected to be backboneof economic stabilisation and growth in many of the economically depressed remote ar-eas. Locally available renewable energy resources could be employed cost-effectively insupport of such ventures.’ (DME, 2000d, p.33)

ECN-C--01-052 55
Small-scale rural industry• sawmills• workshops• food processing industry (grain milling, coffee factories).
4.3.3 Renewable energy and economic development in the Eastern CapeCSIR, ECN and Garrad Hassan and Partners Limited undertook a project under the THERMIEprogramme to investigate ‘Renewable energy sources for rural electrification in South Africa’(CSIR, et al., 2000). CSIR was the catalyst for the original proposal and the aim of the projectwas to identify commercially viable opportunities for rural electrification in the Eastern CapeProvince of South Africa using wind, hydro and biomass powered Remote Areas Power Supplysystems. The Eastern Cape Province was chosen for the study in view of its low rural electrifi-cation rate and relatively good renewable energy resources. The study was premised on the as-sumptions that:• the potential for any type of renewable energy system to meet only domestic electricity
needs is minimal because consumers could not afford to pay for it,• the potential for new, electricity dependent economic activities exploiting local natural re-
sources is stifled at present by the lack of access to basic infrastructure, including cost-effective electricity supply,
• cost is the determining factor in limiting further extensions to the grid in the foreseeablefuture.
It was intended to determine the potential net financial return per unit throughput for a numberof selected economic activities. However, the scarcity of information on economic activities inthe Eastern Cape Province that became apparent in the course of the study had a major influenceon how renewable energy should be used in the rural areas, namely to provide electricity andpower to new and productive economic activities.
Within the Eastern Cape Province, due to the likely scenario that grid electricity will not reachmuch of the area, it was decided to focus effort on the Transkei region. Potential electricity de-mand forecasts for the magisterial districts that make up the Transkei were developed to theyear 2020 in 5 year intervals. These forecasts were done for each of the domestic, agricultural,manufacturing and commercial sectors. Population growth, grid electrification rates and house-hold consumption coefficients were used to derive projections for the domestic sector. Projec-tions for the three non-domestic sectors were derived from sector-specific Gross GeographicalProducts (GGP’s) and electricity consumption coefficients. Because they are indexed to GGP(future trends which are extrapolated from historical trends) the demand forecasts for the agri-cultural, manufacturing and commercial sectors represent estimates of economic activitieswhich might be expected to occur if historical trends continue.
As an example of a forecast, the aggregated energy demand from each magisterial district of theTranskei for 2010 was determined, to be:• domestic - 95% of total,• agriculture - 2% of total,• manufacturing - <3% of total,• commercial - <<1% of total.
Hence, assuming no intervention measures only 5% of demand for electricity in the Transkei in2010 will be for productive economic activities.
Similar forecasts can be done for the rest of SA and it is highly likely that the demand for elec-tricity in the rural areas for productive economic activities will be a low percentage of total ruralelectricity demand.

56 ECN-C--01-052
This does not bode well for job creation in the rural areas, particularly since this is a nationalpriority of South Africa.
Hence it is obvious of the significant impact that renewable energy can have on the economicdevelopment in the rural areas of South Africa, particularly if such energy is linked to new andproductive economic activities.
For the rural areas of the Eastern Cape Province, at least, three economic sectors seem to havegood potential for further development in terms of available resources, namely:• agriculture• forestry and• eco-tourism.
4.3.4 Co-ordinate electrification with other development programmesIt is important to recognise that the relation of rural electrification to economic development isnot straightforward. Apart from the provision of electricity, there are a number of other condi-tions which have to be met in order for rural electrification to result in net economic benefits forrural areas (these conditions were identified by the World Bank already in 1975; Annecke,1998). Electrification may contribute to economic development provided that:• The quality of infrastructure, particularly of road is reasonably good.• There is evidence of growth of output from agriculture.• There is evidence of a growing number of productive uses in farms and agro-industries.• There are a large number of villages, not too widely scattered.• Income and living standards are improving.• There are plans for developing the area.
Apart from these, also the provision of a basic telecommunications network is often consideredas an important element in order to provide telecommunication and basic multi-media services.Besides the focus on economic development, also the contribution of electrification towards so-cial development will require additional support.
This has been reflected in the new integrated approach of the National Electrification Strategy,in which the ‘promotion of socio-economic development of previously disadvantaged commu-nities’ through institutional electrification and ‘integration of electricity with other infrastructurecreation initiatives and other social and economic development programmes’ are recognised(Thom et al., 2000)
This approach links closely to, what in development circles has been called, the sustainablelivelihood approach. In this approach it ‘is not sufficient to simply provide a service to thecommunity, but rather to support that community in generating the demand for the given serv-ice’(Gwagwa, 2000, p.6). Creating income generating activities is a very real challenge in SouthAfrica’s rural areas where high unemployment results in considerable poverty (see Table 4.4).
Table 4.4 Stratification of rural population, (source: Gwagwa 2000)
Stratification [%] in each class
Very poor (< R600 per person per month) 25Poor (< R1000 p.p.p.m.) 38Remaining 37Total 100
In order to improve the impact of energy services on development, an integrated approach inwhich the provision of improved energy services is co-ordinated with other development ap-

ECN-C--01-052 57
proaches is required. The actors for off-grid renewables will be the concessionaires, ESKOMand future REDs.
Thom et al. (2000) list a number of recommendations regarding the co-ordination of the ruralenergy programme with other development programmes, including:• Domestic water supply projects - Department of Water Affairs and Forestry (DWAF),• Irrigation projects as part of small-scale agricultural schemes involving collectives of small
growers,• Clinic electrification programme - Department of Health,• School electrification programme - Department of Education,• Institutions responsible for Small and Medium Scale Enterprise development (for example
Ntsika Enterprise Promotion Agency.
Other areas for collaboration are:• The business development programmes for which the Department of Trade and Industry is
responsible.• Department for Provincial and Local Government to co-ordinate development efforts and to
strengthen local development initiatives.
4.4 Opportunities for further action
4.4.1 Non-grid Electrification ProgrammePV is one of the most proven renewable energy technologies in developing countries because ofits cost effectiveness in one niche-market: the niche-market of stand-alone systems for smallelectricity loads. It is also an interesting technology for the purpose of this research, because onone hand, there are ambitious programmes for the application of PV in rural households inSouth Africa which will result in a increased demand for PV. On the other hand, PV technologyautomatically includes international technology transfer, because solar PV cells, the nucleus ofthe technology, are only produced in industrialised countries, including in quite a number of EUmember states.
In South Africa there is already a rather developed market for PV-systems providing electricityto rural households. Several projects have been realised and there exists a cash market to house-holds. A new, promising development is the non-grid rural electrification programme in whichthe Ministry for Minerals and Energy is granting concessions to private companies in order toprovide rural households with energy services by means of the fee-for-service approach. Apartfrom these initiatives, there exists a well-developed PV market in South Africa including theelectrification of schools and clinics, Telecom applications and water pumping. In the report ananalysis of the opportunities and barriers of the different markets has been made, providing in-put for the following recommendations, in which also the EU and its member states could offermajor contributions:
1. Technical assistance to DMEIn terms of its size, structure and challenges, the concession programme is a unique project em-barked upon by the Government of South Africa, and belongs among the cutting edge policyapproaches of off-grid rural electrification in the world. Especially given its size and the factthat it is not sponsored by the GEF (compare with other initiatives in Martinot et al. (2000). If itis to be successful, it will have implemented 300,000 SHSs and will have set the stage for fur-ther large-scale deployment of renewables to provide electricity to rural communities in SouthAfrica.

58 ECN-C--01-052
Given this unique character of the programme, it may be good to provide long term technicalassistance to DME during the implementation of the programme, which DME can deploywhenever there are new issues on the horizon. This technical assistance could focus on strength-ening the monitoring and evaluation capacity at DME and assist in finding creative solutions forthe problems and draw lessons from international experience. Apart from improving the per-formance of the South African programme, the improved monitoring and evaluation of the pro-gramme will make it more easy for other countries to draw valuable lessons learned from thisprogramme.
2. Flexibility to address implementation issuesThis programme is at the moment the largest opportunity for promoting the large-scale penetra-tion of renewable energy technologies in South Africa. Given its experimental nature, there islikely be a lot of policy challenges for DME during the implementation phase of this pro-gramme. Policy flexibility on the side of DME is therefore an important component to meet itsambitious targets. without jeopardising the needs of the end-users and the financial operationsof the private companies.
4.4.2 Commercial market1. Launch integrated PV follow up programmeApart from addressing PV SHSs for rural households, DME may also wish to consider devel-oping PV policy targeted at commercially sold PV SHSs and other PV systems. Such policiescould target improvement of operation and maintenance of installed PV systems and therebyimproving the public image and acceptance of PV systems. Key components of such pro-grammes are training of solar technicians, and creating awareness amongst end-users to enablethem to make informed choices.
Although part of such components can be found in individual programmes, it is crucial for theimage of PV that such issues are addressed during in integrated programme. Morris (2000)launched the idea to set up a big maintenance campaign to provide after-sales services to all thepilot projects, which overlooked that, as well as the clinics and schools programmes. The ideawas that before starting new pilot project, first clean up the mess of the old ones.
Such a programme can at the same time be combined with training local technicians, and raisingawareness on the potential of PV among end-users, and train end-users on how to properly useand maintain PV systems. A potential way to implement such a programme would be under thesector specific education support programme. It could also be linked to the PV infrastructurewhich will be put up by the concessionaires. Stakeholders to be involved in this programme arethe concessionaires, PV suppliers, ESKOM, DTI, DME, DoH.
2. Create a sustainable business environment for PVThe SHS market for rural households is highly integrated with other PV markets. There are fewsuppliers, international and local, who concentrate solely on the households markets. Govern-ment agencies and parastatals together are responsible for a large demand for PV panels. Theycould use this market power to co-ordinate and distribute their demand more evenly over time.This will allow the South African market for PV better anticipate demand and hence providetheir customers with better services and lower prices.

ECN-C--01-052 59
4.4.3 Integrate renewable energy policy into Integrated Development PlanningThe major challenge when trying to integrate energy into other development activities is thelevel where the integration will take place. In the past many national and provincial governmentprogrammes have failed at the point of delivery due to lack of capacity or involvement of localgovernments. As a reaction, The Department of Provincial and Local Government has intro-duced the Integrated Development Planning (IDP) tool. IDP is the tool for reorganising localgovernment and setting strategic frameworks for project delivery. In the week of 18 September,legislation was passed that every district will have to submit IDPs. The objectives of this is thatit will become a means of mediating between national, provincial objectives and local priorities(Patel, 2000). The level where electrification plans can be integrated with other developmentinitiatives has to match with the existing institutional structure the SA government to promoterural development, which is the IDP process.
Box 4.1 Major implication of new municipal boundaries (Patel, 2000)The re-demarcation of municipal boundaries has major implications for rural developmentin South Africa:1. For the first time many rural areas will fall under the jurisdiction of a municipality.2. Most rural areas will be amalgamated with urban centres or peri-urban nodes to form
single municipalities.3. This has implications for institutional and administrative arrangements but more impor-
tantly the question of rural and urban migration has a better chance of being addressed.4. Rural areas will have the opportunity of accessing the revenue bases of urban centres.5. Capacity problems in rural areas can partly be solved by amalgamation.6. Rural development strategies and programmes will be incorporated in a much more
focused way in municipal plans (that is IDPs).
Current capacity at the local level is limited, but initiatives are underway (for instance throughthe Independent Development Trust) to develop local capacity (Patel, 2000):• Municipalities will require technical assistance to identify and elaborate appropriate energy
programmes.• The Department of Provincial and Local Government is in the process of establishing
PIMS-Centres (Planing and Implementation Management Support Centres) at each newDistrict Municipality to bolster local government planning and delivery capacity.
• The Integrated Sustainable Rural Development Strategy (ISDR strategy) suggest a tool fordata and information collection and analysis to support local planning processes.
Energisation plansConsidering that energy issues and income generations are high on the priority list of ruralcommunities, developing energy planning tools at district to assist energy planning and deci-sion-making is very relevant. It will enable local communities to make informed choices ofwhat is feasible and will help them expressing their needs towards ESKOM or concessionaire inthat area. Such tool could be made available through the PIMS-Centre or other relevant localbody.
A parallel can be found with the experience in Namibia. The long-term energy planning processenabled local communities to assess the future of their energy situation, and enabled them to re-spond to it and get into active negotiations with policy makers (Morris, 2000).
4.4.4 Strengthening implementation capacity at the local levelBy setting up the concession system, there is now an implementation capacity in place to deliverenergy services in rural areas. The concessionaires will in the first instance be very much fo-

60 ECN-C--01-052
cused on delivering energy services to rural households, i.e. for consumptive applications. Atthe same time, there is a need for establishing energy services for rural industries as well. Thisraises the interesting question how the concession could exploit that market as well.
Linking municipalities with the concessionaires and relevant ESKOM departmentsThe concessionaires are established at the national level by DME, while the development plan-ning through the IDP will take place at the district level. It seems therefore a priority to link theplanners at the municipal level with the concessionaires. The concessionaire and the municipal-ity could engage in the energy planning for each area and identify potential energy activities.Through such a process, concessionaires can be linked to income generation activities and assistin providing energy solutions to those initiatives.
4.4.5 Support mechanisms to stimulate the implementation of hybrid mini-grid systemsThe government should try to put in place separate measures to facilitate the investments in re-newable energy projects to economic activities in rural areas, likewise they had done it forhouseholds. During the concluding workshop of this study, a number of barriers were identifiedhindering the deployment of renewable energy for economic activities:• lack of training & awareness,• lack of funding,• Sectoral instead of holistic approach blocking development initiatives,• High-risk,• No IPP-framework,• Confusion on ESKOM task division.
Of the main barriers to economic activities is the lack of rural economic activities. This could beadvantaged by integrating energy into the IDP process (see point above) with a special emphasison involving local communities.
It was concluded that the concessionaires should be the main responsible for providing energyservices to economic activities in rural areas (see also previous point). They would have accessto finance to develop decentralised energy projects and could in turn sell the power to the proj-ect developer under a power purchase agreement. However, concessionaires would only get en-gaged if such ventures are commercially viable for them. Energy projects for economic activi-ties require higher investments than household and hence are surrounded with more risk. Theyinvolve small-scale activities from companies which often have no financial track record andwhich face uncertain market prospects. Special support measures, similar to the ones providedto rural households, are therefore also required for off-grid renewable energy projects for eco-nomic activities. Such measures could include:• subsidy on capital expenditures (similar to the one provided for households) to create a level
playing field with grid extension,• guarantee fund to provide guarantees for the power purchase agreement,• assistance to project developers: economic, financial, legal skills to set up commercial proj-
ects.,• integrate this into the IDP process (see point above),• make concessionaires responsible for such activities (see point above).

ECN-C--01-052 61
Section II
European experiences andpotential contributions

62 ECN-C--01-052

ECN-C--01-052 63
5. RENEWABLE ENERGY TECHNOLOGIES IN THE EUROPEANUNION
The following is a review of the present state-of-the-art renewable energy technologies availablein the European Union(EU)6. An overview is given of the different technologies available; afterthat, the current market position of the specific technology is described, followed by the mainmarket barriers and opportunities. Lastly, the relative competitiveness of the technology is out-lined and the relevance for South Africa is discussed.
5.1 Wave Energy
Waves, particularly those of large amplitude, contain large amounts of energy. Wave energy isin effect a stored and concentrated form of solar energy, since the winds that produce waves arecaused by pressure differences in the atmosphere arising from solar heating. The strong windsblowing across the Atlantic Ocean create large waves, making the west coast of Europe ideallysuited to wave energy schemes.
5.1.1 The TechnologyWave energy is a relatively new technology. Research was most intense during the 1970s and‘80s under various government and industry sponsored programmes. Wave energy research isstill carried on and has benefited from funding provided by the European Commission (EC). Asa result, a wide variety of wave energy devices have been proposed over the last three decades.These comprise many different shapes, sizes and energy extraction methods. Although most ofthem never passed beyond the outline design stage, some have been the object of intensive re-search and development work and a number have been deployed in the sea as prototypes ordemonstration schemes.
Figure 5.1 Sidecut view of Scottisch Wavepower technology (source: www.europa.eu.int/)
The main EU countries involved with the development of wave power have been Denmark,Ireland, Portugal, UK. These projects have been developed independently and so a wide varietyof possible technologies have been developed. Most of these remain in the research stage but asmall number have been deployed in the sea as demonstration schemes.
6 Source: http://www.europa.eu.int/en/comm/dg17/atlas/

64 ECN-C--01-052
Several ways of classifying wave energy devices have been proposed, based on the energy ex-traction method, the size of the device, etc. The method adopted here uses the location of thedevice with respect to the shoreline, i.e. shoreline devices, near-shore devices and off-shore de-vices. Only devices at or near the demonstration stage or which at least have been object of sub-stantial research and development (R & D) effort will be considered here.
The wave energy potential in the EU has been estimated conservatively as 120-190 TWh/year(offshore) and 34-46 TWh/year (near-shore). The global wave power resource is in excess of 2TW, with potential for generation of more than 2000 TWh annually.
5.1.2 The marketWave energy technology has developed to the stage where the first demonstration schemes arebeing built, so there is only a small market at present. Wave energy (like many other renew-ables) is unlikely to be economically competitive with conventional generation capacity in theimmediate future, except for isolated communities that are not connected to the grid. This situa-tion could change in the medium-term future:• technology developments have already reduced the predicted costs of wave energy ten times
over the past two decades,• wave energy could supply coastal communities in those countries without a national elec-
tricity grid, thereby avoiding transmission line costs,• wave energy could supply arid coastal communities with potable water.
A conservative estimate indicates a future global wave energy market (in 2010) of approxi-mately 5.5 TWh per year. The overall future market for wave energy is in excess of 2000 TWh.
5.1.3 European competitivenessEurope still remains the world leader in wave energy technology. With some European coun-tries investing in R&D or demonstration projects, the EU should be well placed to competewhen a commercial market for the technology evolves. Several commercial devices are cur-rently under construction and planned for export. However, there are significant advances beingmade in non-European countries (e.g. India, Japan and USA).
Figure 5.2 Landward view of 500 kW Scottish wave power technology at Limpet, Islay(source: Wavegen, 1999)

ECN-C--01-052 65
5.1.4 Market BarriersThere are a number of non- technical barriers to the successful development of wave energy.These include long development times and high development costs as well as perceived risk andhigh historical costs. It is essential that the current demonstration schemes are successful in or-der to overcome these barriers.
5.1.5 Relevance for South AfricaWave power is in its infancy. Commercial units are only now being developed and generatingcosts are therefore higher than they will be in a few years time. It is expected that wave powerdevelopment will be similar to wind power where it took a number of years for it to becomecompetitive. There are extensive stretches of the South African coastline where wave powercould be expected to be commercially viable at some point in the future.
5.2 Wind energy
Wind energy is one of the most promising renewable energy technologies. Modern wind tur-bines for power generation became popular in the early 1980s. Development was initially fo-cused in the USA but, since 1988, Europe has been the fastest growing market.
5.2.1 The TechnologyWind turbines extract energy from the wind by transferring the momentum of passing air to therotor blades. Energy is thus concentrated into a single rotating shaft. The power in the shaft canbe used in many ways; modern turbines convert it into electricity. Rotors can be set on either ahorizontal or a vertical shaft. However, horizontal axis turbines have proved the more cost-effective option and dominate the world market. Vertical axis machines have made no signifi-cant contribution in Europe.
Figure 5.3 Wind farm in Greece (source: www.europa.eu.int/)
Wind energy costs have fallen dramatically in recent years: costs in the Netherlands fell by afactor of three between 1985 and 1995 and in Germany by a third between 1991 and 1994.Wind farms due to be developed within the next five years in the UK should generate electricityat costs as low as € 0.03/kWh. Wind energy technology is highly reliable and routinely achievesan availability of 98% and over, but operating experience, particularly with the larger (600 kW-plus) machines, is limited to a few years. There is no experience of machines of this size overthe projected life spans of 20 years or more.

66 ECN-C--01-052
5.2.2 The MarketEurope’s wind energy generating capacity currently totals 3500 MW, with world capacitystanding at some 6000 MW. New capacity continues to be added to the European market at arate of around 1000 MW/year. The trend is towards an increasingly global demand with the400 MW/year of capacity currently being installed outside Europe expected to rise rapidly. It isdifficult to make long-term predictions for future installed capacity for wind power due to thecomplexity and dynamics of world markets. A simplistic estimation from current indicatorssuggests installed capacities of 17,500 MW in Europe and 37,700 world-wide by 2010.
5.2.3 European CompetitivenessEuropean manufacturers have dominated the world market for wind turbines for some years,e.g. about half of all plant installed in 1995 were from Danish manufacturers, nearly a quarterfrom Germany and much of the remainder from European/Indian joint venture companies.
The European wind industry manufactures machines with a total capacity of 1000 MW/year anddevelopment of the largest, 1 MW-plus, turbines has taken place exclusively in Europe. Theother major manufacturing country is the USA, but activity there has reduced considerably inrecent years. Japanese manufacturers are also present in the market. All the early wind turbinemanufacturers in Europe started as SMEs. This and the inconsistency of local markets for windhave led to many companies changing ownership and some going bankrupt. There are still moreturbine manufacturers than the market can sustain. A few large multinational companies are in-volved in the wind industry; this is likely to increase as the world market grows.
5.2.4 Technical and Market BarriersDespite falling costs, wind energy remains more expensive than conventional energy sources;therefore cost continues to be the most serious barrier to its further development. The wind in-dustry will continue to rely on public support for the short to medium term. Perhaps the nextlargest barrier is the varying level of public acceptance of the visual impact of turbines. Thedrive to minimise costs led initially to the siting of many turbines on high ground where windspeeds are highest but the visual impact of turbines is greatest. Noise generated by wind tur-bines is another problem and a barrier to development close to homes.
Both of these barriers would be reduced by a better understanding of wind regimes and theirinteraction with wind turbines. Reducing technical uncertainties would give designers the toolsto reduce the cost of turbines, to build turbines to operate at lower wind speeds (and thus on lessvisible sites) and to reduce noise.
5.2.5 Relevance for South AfricaThe European wind energy industry is well-placed to continue its success in developing windpower within the EU. It should also concentrate some of its efforts towards manufacturing andmarketing for wider markets. This could include the study of wind energy resources in SouthAfrica, where there are different market conditions. The country has a reasonable wind resourcewhich is mainly concentrated along the coastline and the Drakensberg Escarpment. There is agood potential for wind farms transmitting power through the national grid and for smaller unitsin off-grid applications.
While South Africa has little experience in modern large wind turbines, the technology could bereadily imported from Europe.
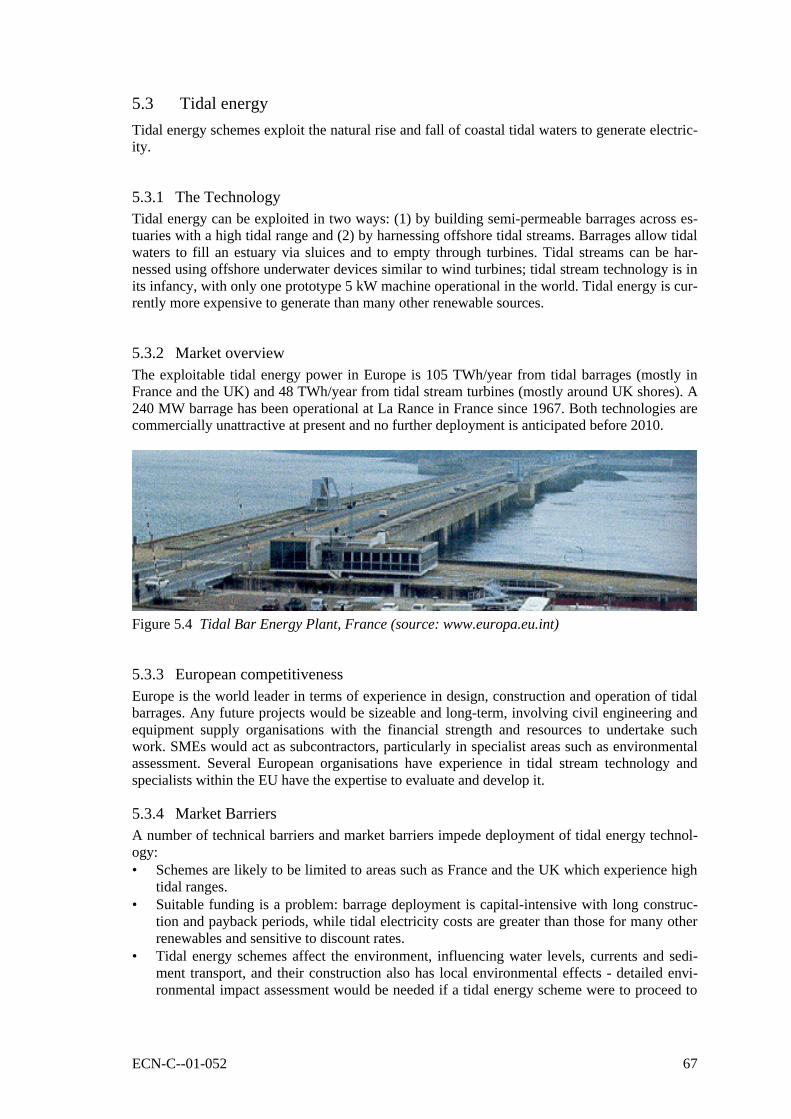
ECN-C--01-052 67
5.3 Tidal energy
Tidal energy schemes exploit the natural rise and fall of coastal tidal waters to generate electric-ity.
5.3.1 The TechnologyTidal energy can be exploited in two ways: (1) by building semi-permeable barrages across es-tuaries with a high tidal range and (2) by harnessing offshore tidal streams. Barrages allow tidalwaters to fill an estuary via sluices and to empty through turbines. Tidal streams can be har-nessed using offshore underwater devices similar to wind turbines; tidal stream technology is inits infancy, with only one prototype 5 kW machine operational in the world. Tidal energy is cur-rently more expensive to generate than many other renewable sources.
5.3.2 Market overviewThe exploitable tidal energy power in Europe is 105 TWh/year from tidal barrages (mostly inFrance and the UK) and 48 TWh/year from tidal stream turbines (mostly around UK shores). A240 MW barrage has been operational at La Rance in France since 1967. Both technologies arecommercially unattractive at present and no further deployment is anticipated before 2010.
Figure 5.4 Tidal Bar Energy Plant, France (source: www.europa.eu.int)
5.3.3 European competitivenessEurope is the world leader in terms of experience in design, construction and operation of tidalbarrages. Any future projects would be sizeable and long-term, involving civil engineering andequipment supply organisations with the financial strength and resources to undertake suchwork. SMEs would act as subcontractors, particularly in specialist areas such as environmentalassessment. Several European organisations have experience in tidal stream technology andspecialists within the EU have the expertise to evaluate and develop it.
5.3.4 Market BarriersA number of technical barriers and market barriers impede deployment of tidal energy technol-ogy:• Schemes are likely to be limited to areas such as France and the UK which experience high
tidal ranges.• Suitable funding is a problem: barrage deployment is capital-intensive with long construc-
tion and payback periods, while tidal electricity costs are greater than those for many otherrenewables and sensitive to discount rates.
• Tidal energy schemes affect the environment, influencing water levels, currents and sedi-ment transport, and their construction also has local environmental effects - detailed envi-ronmental impact assessment would be needed if a tidal energy scheme were to proceed to
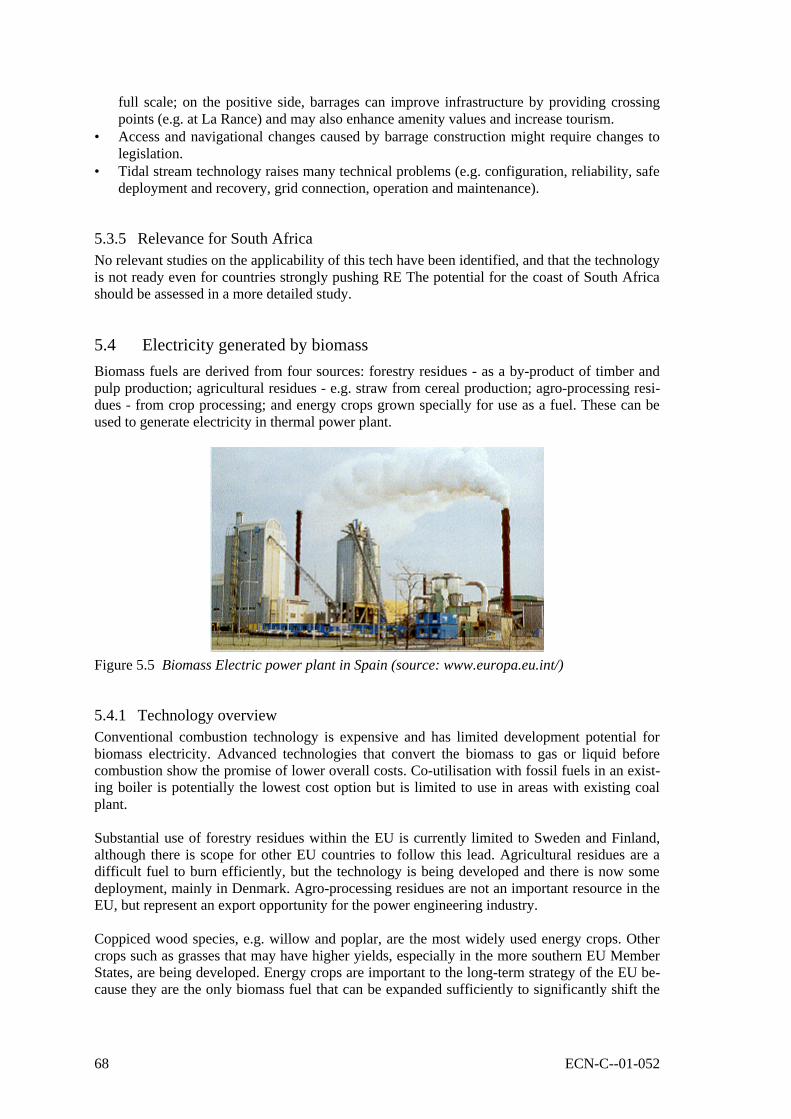
68 ECN-C--01-052
full scale; on the positive side, barrages can improve infrastructure by providing crossingpoints (e.g. at La Rance) and may also enhance amenity values and increase tourism.
• Access and navigational changes caused by barrage construction might require changes tolegislation.
• Tidal stream technology raises many technical problems (e.g. configuration, reliability, safedeployment and recovery, grid connection, operation and maintenance).
5.3.5 Relevance for South AfricaNo relevant studies on the applicability of this tech have been identified, and that the technologyis not ready even for countries strongly pushing RE The potential for the coast of South Africashould be assessed in a more detailed study.
5.4 Electricity generated by biomass
Biomass fuels are derived from four sources: forestry residues - as a by-product of timber andpulp production; agricultural residues - e.g. straw from cereal production; agro-processing resi-dues - from crop processing; and energy crops grown specially for use as a fuel. These can beused to generate electricity in thermal power plant.
Figure 5.5 Biomass Electric power plant in Spain (source: www.europa.eu.int/)
5.4.1 Technology overviewConventional combustion technology is expensive and has limited development potential forbiomass electricity. Advanced technologies that convert the biomass to gas or liquid beforecombustion show the promise of lower overall costs. Co-utilisation with fossil fuels in an exist-ing boiler is potentially the lowest cost option but is limited to use in areas with existing coalplant.
Substantial use of forestry residues within the EU is currently limited to Sweden and Finland,although there is scope for other EU countries to follow this lead. Agricultural residues are adifficult fuel to burn efficiently, but the technology is being developed and there is now somedeployment, mainly in Denmark. Agro-processing residues are not an important resource in theEU, but represent an export opportunity for the power engineering industry.
Coppiced wood species, e.g. willow and poplar, are the most widely used energy crops. Othercrops such as grasses that may have higher yields, especially in the more southern EU MemberStates, are being developed. Energy crops are important to the long-term strategy of the EU be-cause they are the only biomass fuel that can be expanded sufficiently to significantly shift the
ECN-C--01-052 69
pattern of EU energy supply. The use of wood residues in the wood processing industry is wide-spread and the equipment used can be considered mature.
5.4.2 The MarketBiomass fuel is available throughout the world. Wood residue, the dominant fuel, is readilyavailable where there is an active forestry industry. For large-scale plant the high capital cost ofconversion equipment usually makes biomass an expensive fuel; however, these plants havebeen developed where waste management measures were necessary in sawmills and pulp andpaper industry. Financial incentives, including high taxes on fossil fuels and capital grants, havebeen critical for stimulating the use of biomass in co-generation plants for district heating sys-tems.
In 1994, generation of biomass electricity in the EU was 11.9 TWh. This is projected to increaseto 27 TWh in 2010 if appropriate measures are put in place. Total world-wide energy generationfrom biomass is currently 127 TWh/year and is set to rise to 291 TWh/year.
5.4.3 EU competitivenessSince the inclusion of Finland and Sweden, the EU has been the market leader in electricitygeneration using biomass in conventional steam cycle power plant, and is moving towards thesame position in advanced biomass technologies. The Nordic countries are dominant in forestryharvesting systems due to their strength in the timber, paper and pulp industries. The projectedincrease in biomass electricity generation in the EU represents some 2400 MWe of new plant inthe period up to 2010.
5.4.4 Market barriersThe principal barriers to the further development of the biomass electricity markets are:• Lack of information for decision makers at different levels and the public in general, leading
to a lack of understanding of the benefits of biomass for power.• Lack of integrated policies for achieving specific targets at EU and Member State levels,
particularly between the agriculture and energy sectors.• High capital and fuel costs relative to fossil fuels.• A perceived high technical risk in most of the EU that makes finance expensive.• Considerable uncertainty about future European standards for atmospheric emissions.• Lack of information on the complex environmental issues related to biomass schemes; some
environmental regulations have increased the cost of biomass systems while, at the sametime, less stringent legislation has applied to fossil fuel systems.
• Lack of farmers willing to plant energy crops, due to cost, uncertain profit etc.• Incentives are not co-ordinated - and experience of problems and advantages is not readily
transferred - between countries.• Widely differing opinions on the merits of long-term fuel contracts between fuel supply
companies and the power generation industry.
5.4.5 Relevance for South AfricaGiven the readily available technology as a result of EU and other world-wide research efforts,and the abundant supply of biomass in South Africa, electricity generation by biomass is likelyto have a prominent role in the energy supply at some time in the future.

70 ECN-C--01-052
5.5 Photovoltaic Energy
5.5.1 Overview of technologyMost commercial PV cells are manufactured from crystalline silicon, although research is iden-tifying other suitable materials, some of which are now being marketed. The individual cells aregrouped into modules and encapsulated between a sheet of glass and a backing material (alsooften glass) within a frame. Modules are then connected together to provide the voltage and cur-rent levels required to meet a particular load.
Figure 5.6 Off-Grid rural application of PV in South Africa (source: Renewable Energy World,January 2000)
A complete PV system incorporates a wide range of other components, e.g. cabling, batteriesand inverters. These ‘balance of system’ (BOS) components provide the necessary interfacebetween the PV modules and the electricity distribution grid or other specific application.
PV systems are both reliable and environmentally friendly Furthermore, although costs havefallen, efficiencies have improved, and the more advanced crystalline silicon cells achieve effi-ciencies of more than 24% under laboratory test conditions and 15% in commercial applica-tions.
5.5.2 Market overviewThe market for PV power applications is essentially fourfold:1. Consumer products, e.g. calculators and watches.2. Stand-alone power systems for remote locations.3. Building-integrated, grid-connected systems.4. Large-scale, grid-connected power generation.
Of these, consumer products and stand-alone systems are particularly well developed, resultingin an annual world-wide PV deployment of about 375 MWp by 1995. This is expected to rise to6300 MWp by 2010 of which 2000 MWp would be in Europe.

ECN-C--01-052 71
Figure 5.7 Grid-connected PV application in Denmark (source: Renewable Energy World,January 2001)
Two markets offer considerable potential for the future:Stand-alone systems can make an important contribution to rural development in developingcountries, providing electricity for homes, schools, health centres, communications, and waterpumping and purification. They can also contribute to development in grid-connected areas,particularly where grid supplies are unreliable. In Europe, too, where stand-alone systems arewidely used for communications, cathodic protection, water processing and distribution, and theprovision of electricity in isolated rural dwellings, the market potential is estimated to be 100MWp - 200 MWp by 2010.
The main market emphasis in the developed countries of Europe, the USA and Japan is onbuilding-integrated, grid-connected PV systems in which the PV modules double as architec-tural cladding elements, thereby helping to reduce system costs. The technology has alreadybeen successfully applied, usually with public support, and the aim now is to develop systemsthat are commercially viable in their own right.
5.5.3 European CompetitivenessEuropean manufacturers of PV cells and modules - most of them big multinational companies -have traditionally held a strong position in world markets. In 1994, their share of the total wasmore than 31%. However, the recent move towards large-scale manufacturing to reduce costshas caused some of these companies to switch their production facilities to the USA. As a result,Europe’s market share fell to 21% in 1996. This has significantly reduced the region’s short-term export potential and weakened its position vis-à-vis its North American and Far Easterncompetitors.
The production of BOS components, together with most design and installation activities, ismainly in the hands of SMEs. These companies, often supported by EU initiatives such asJOULE and THERMIE, have developed a range of high quality products and significant levelsof expertise. Provided they have the ability to operate at the trans-national level, these compa-nies are well placed to take advantage of expanding markets throughout the world.
5.5.4 Technical and Market BarriersThere are several technical and market barriers to the more widespread deployment of PVpower in Europe and elsewhere:• limited understanding of the technology and its existing commercial potential,• high initial costs and the difficulties of securing finance,

72 ECN-C--01-052
• the low apparent cost of conventional electricity,• the high import charges often associated with export markets,• the lack of proper standards for system components, design and installation,• the lack of grid-connection regulations adapted to PV.
5.5.5 Relevance for South AfricaPV technology is relevant for South Africa in a number of ways. First, there is the importantrole that PV can play in off-grid applications, such as telecommunication, very remote signalapplications and off-shore. PV has been the preferred technology for supplying isolated ruralhouseholds, schools and clinics under the electrification programme. The same can be predictedfor the concession areas.
5.6 Solar Thermal - Water & Space Heating
Solar thermal systems convert energy from the sun directly into heat through ‘passive’ systems,or gather the solar energy and transfer it to a working fluid to heat water or air in ‘active’ sys-tems. Solar thermal installations are well suited to use as part of an overall energy conservationprogramme,. This section covers ‘active’ systems; ‘passive’ systems will not be discussed asthey are part of the housing design sector.
5.6.1 Technology OverviewActive solar thermal systems comprise equipment such as solar collectors, storage tanks, pumps,piping, controllers etc. Solar thermal applications can be characterised by the size of the instal-lation:• Small-scale systems: solar collectors are placed on or integrated into the roof, facade etc of
individual dwellings or buildings for their private thermal energy consumption - usually do-mestic water heating.
• Large-scale systems: larger central arrays are combined or incorporated in group heatingsystems for the supply of multi-family buildings and/or district heating.
• Solar domestic water heating systems: can meet up to 60% of the water heating needs oftypical households in Northern Europe and up to 90% of the water heating needs of house-holds in Southern Europe.
Current installation costs are 1000-5500 € for a typical domestic system; the lower end of thescale relates to smaller and simpler systems commonly used in Southern Europe and the higherend characterises Northern European systems. The more expensive systems employ larger col-lector areas, high performance flat plates or evacuated tube collectors.
For climate-related reasons, prices of larger, more complex systems used in Northern and Cen-tral Europe will never fall as low as those used in Southern Europe. However, prices of the morecomplex and sophisticated systems are expected to continue to fall during the coming decade.
5.6.2 The MarketThere has been a market for thermal solar heating systems in the EU for some 20 years. How-ever, the present market is very small compared to the existing potential.

ECN-C--01-052 73
Figure 5.8 Domestic Water Heaters in Israel (source: Renewable Energy World. Mar 2000)
In 1994, the EU had an estimated installed area of 4.4 million m2 of glazed collectors and 1.2million m2 of unglazed collectors. The largest installed area is in Greece, with over 2 million m2.Outside the EU, the largest installed collector area in the world is in the USA, with over 6 mil-lion m2 already in 1994. Japan, Israel and Australia also have large installed areas and, in recentyears, there has been an increase of installations in China. The expected deployment in the EUin 2010 is 20 million m2 of collector area, while world-wide deployment is expected to reach100 million m2.
5.6.3 European CompetitivenessIn most EU countries, around 90% or more of the home market is supplied by manufacturersfrom within that country. Companies in Greece, Germany and the UK are the largest exportersof collectors in the EU. Greece, the largest exporter within the EU, exported 60,000 m2 of col-lectors in 1994. Japan and Australia are the principal world exporters.
Sales of glazed and unglazed collectors in the EU amounted to 0.5 million m2 and 160,000 m2
respectively in 1994. Germany, Austria and Greece dominate the EU market, sharing over 80%of the total sales of glazed collectors. The German market is the largest in the EU for unglazedcollectors, followed by Austria and France. The solar heating industry throughout Europe isprincipally made up of SMEs, with only 26 companies in Europe employing more than 30 peo-ple each. There are in total a few thousand solar heating companies Europe-wide.
5.6.4 Technical and Market BarriersThe main barriers to the further adoption of solar thermal applications are the lack of legislationencouraging environmentally friendly energy systems and the fact that solar technology is notcompetitive with the energy services provided by the utilities.
The present generation of systems has proved to be reliable and systems usually have a lifespanof 15-20 years. However, there could be a perceived risk associated with the technical perform-ance of systems, particularly in countries which have had experience of badly installed systemsin the past. Improved information availability and marketing would help to combat this per-ceived risk.
In addition, a ‘Guarantee of Solar Results’ (GSR) scheme has been developed with support fromthe solar industry and the EC to combat the perceived risk of poor performance and to improvethe quality of overall energy service provided. Under the GSR system, suppliers contract to

74 ECN-C--01-052
compensate customers if the system fails to supply a designated minimum quantity of energyeach year.
In some countries a relative lack of public awareness of available systems constitutes a barrierto their more widespread deployment. This could be addressed by information campaigns, bothfor the general public and for professionals. Limited access to funds also presents a barrier tosolar water heating, which is characterised by a high initial investment.
The complexity and cost of different national testing and certification procedures are barriers toEuropean trade in solar systems. New European standards have been developed since 1998 andwill ensure a single quality level for consumers and help to overcome this barrier.
5.6.5 Relevance for South AfricaSolar water heating is not widely used in South Africa. One of the reasons for this is the smallfinancial incentive that people find for investing in such a system. Only when a tax system pro-motes the use of Solar Water Heaters can the market fully develop. In other parts of the world,legislation has been used to encourage the development of solar water heating. The technologycould be readily imported into South Africa and could help create jobs in manufacturing thesesystems. The potential for off-grid application of this technology is enormous.
5.7 Solar Thermal - Electricity Production
Solar thermal electricity generation systems collect direct sunlight in special focusing collectorsand convert this into thermal energy, which is then used to generate electricity.
Figure 5.9 Solar electricity production in California (source: www.europa.eu.int/)
5.7.1 Technology OverviewThe generators in solar thermal electricity systems are driven by steam turbines or heat enginesin the same way as conventional electricity generation. However, these systems are powered byconcentrating the sun’s rays rather than by combustion of fossil fuels or by nuclear heat. Solarsystems use special focusing (rather than flat) reflectors to achieve the temperatures required tooperate such systems efficiently.

ECN-C--01-052 75
Three main types of generator have been demonstrated, all of which require direct sunlight -solar systems are therefore most suitable for Southern European countries and non-EU countrieswith high direct solar radiation levels, often arid or semi-arid regions:
Solar farms use parabolic trough reflectors which focus solar radiation onto a line receiver con-taining the heat transfer medium in pipes. The medium, often a thermal oil (although oncethrough water-steam systems are being investigated), is collected and passed through a heat ex-changer where steam for the turbines is produced. Temperatures produced vary between 350°Cand 400°C and system sizes are typically 30-80 MW. To increase operating temperatures (andthus efficiency) as well as provide firmer power, steam from the solar system may be heated in afinal stage by conventional fuels to higher temperatures.
Solar power towers use one central receiver mounted on top of a tower which is surrounded by afield of heliostats - concentrating mirrors which follow the sun. Reflected light is focused ontothe receiver and absorbed by the heat transfer medium, which could be sodium, water, moltensalt or air. Temperatures of 500-1000°C can be achieved and proposed systems also incorporateenergy storage using molten salts. System sizes up to 200 MW are possible.
Parabolic dish systems use parabolic concave mirrors which have a receiver mounted at the fo-cus. These systems achieve the highest temperatures, 600-1200°C, but systems are small, 10-50kW for a single unit. The main application is decentralised electricity generation.
The technology’s dependence on direct sunlight for efficient operation usually limits load fac-tors to less than 25%. Ways of improving the load factor include designing plant, which incor-porates energy storage (e.g. by passing the heated working fluid through a storage medium suchas molten salts) or by combining solar thermal electric plant with conventional generation in ahybrid system.
5.7.2 The MarketSolar thermal electricity generation is still at the development stage and is not yet ready forcommercial deployment without assistance. The most developed system is the solar farm con-cept, and several farms generating up to 80 MW have been demonstrated in California, wherethe total installed capacity is now around 350 MW. In Europe the technology has been appliedonly as prototypes. Solar towers have been developed at sizes up to 10 MW and, while para-bolic mirror systems have been tested in several countries (at up to ~50 kW) the technology isstill under development. By 2010, the predicted potential for Europe is ~0.5 TWh/year, whilstthat for the world is approximately 4 TWh/year.
There is no commercial deployment of solar thermal electricity generation in Europe. Given thescale of investment required, a maximum potential deployment of the technology within the EUis estimated at some 300 MW by 2010. There is potential for systems in Greece, Italy, Portugaland Spain to generate 1 TWh a year. World potential deployment could be up to 3000 MW by2010.
5.7.3 European CompetitivenessThe EU has an established research community for solar thermal electricity systems, includinguniversity departments as well as some large commercial organisations and industries, particu-larly in Germany. As it nears commercialisation, the technology is likely to involve larger com-panies, with SMEs as subcontractors.
If an export market for the technology emerges, the likely market areas will be Northern andSouthern Africa, Western Australia, California, the Middle East, Asia and parts of Latin Amer-

76 ECN-C--01-052
ica. However, the established US industry would provide a challenge to EU companies in acompetitive market.
5.7.4 Technical and Market BarriersThe main barriers to the use of solar thermal electricity generation are financial, so the costs ofthe technologies need to be reduced and technology risks minimised. Perhaps the highest costreduction potential lies in the integration of solar systems with conventional power generation.The investment required for a 100 MW plant - up to 250 million € - is too large to be consideredunder existing national funding programmes.
5.7.5 Relevance for South AfricaAt present, the cost effectiveness of grid connected solar thermal power production, even inSouth Europe, is considered to be barely sufficient for commercial development. However,European technological know-how can be exported to sunnier places, like South Africa. Euro-pean engineering companies are involved with several large international solar thermal projects,the 2.5 million square meters of parabolic trough mirrors, used in the solar electric generatingplants in California, were manufactured in Germany. This is an example of a project that shouldbe of comparable feasibility in South Africa.
5.8 Small-scale Hydro
Although many Hydro applications concern large project, in this chapter, we will only discussprojects below 1 MW. In terms of installed capacity and energy yield, hydro-electric power isthe foremost electricity-producing renewable energy technology in Europe and world-wide. Inthe EU, most of the sites which are suitable for large-scale schemes have already been devel-oped, and work therefore now concentrates on small-scale schemes.
5.8.1 Technology overviewSmall-scale hydro schemes are typically defined as having an installed capacity of less than 10MW. They generate electricity by converting the energy available in flowing water (rivers, ca-nals or streams).
Schemes require a suitable rainfall catchment area, a hydraulic head, a pipe or millrace carryingwater to the turbine and a turbine house containing power generation and water regulationequipment. Water is returned to its natural course after it has been used. The technology iscommercially and technically mature. Innovations in design, equipment and con-trol/instrumentation would improve performance and increase access to export markets, aswould systems to mitigate environmental impact.

ECN-C--01-052 77
Figure 5.10 A typical micro-hydro scheme (source: www.europa.eu.int/)
5.8.2 The marketFigures for the 15 EU countries indicate that small-scale hydro schemes totalling 33 TWh a year(8000 MW) were operational in 1995. EU figures are expected to reach 45 TWh a year, (9500MW) by 2010, with Spain, Italy, Sweden, Germany and Austria experiencing most growth.
The economically viable world hydro potential is around 7300 TWh a year, of this 32% hasbeen developed, 5% of it at small-scale sites. Small-scale hydro deployment world-wide is in-creasing at about 900 MW annually and is expected to reach 220 TWh per year (55,000 MW)by 2010. Rapid expansion is expected in Asia, Latin America, Central and Eastern Europe andthe former Soviet Union. Countries within the EU/EFTA and NAFTA are expected to concen-trate on upgrading/refurbishing existing hydro power assets rather than developing new capac-ity.
5.8.3 European competitivenessThe EU occupies a leading position in the world market, with a multi-disciplinary and highlyskilled small-scale hydro industry employing about 10,000 people. Annual turnover exceeds400 million €. Small companies and multinational organisations are represented. The industryoffers the full range of products and services required for development of small hydro projects.Very little equipment is imported from outside the EU. Around 75% of the 900 MW of newsmall hydro capacity added annually world-wide, most of it in developing countries, is ac-counted for by European companies. Competition comes principally from India, Canada, theUSA, China and Japan.
Although the technology is particularly suited to SMEs, which currently account for a high pro-portion of activity in the small hydro sector, these organisations often lack the resources to enterexport markets where most growth is expected. They may need help with marketing, promotion,finance and credit guarantees.
Very few governments within and outside the EU are offering incentives to increase small hy-dro deployment. Projects involve significant capital expenditure and typical payback periods often years. Such investments do not easily attract private finance without incentives (e.g. pre-mium price electricity purchase contracts). A key development issue is the need to get projectappraisals in place quickly, preferably through a single approvals body.

78 ECN-C--01-052
5.8.4 Technical and Market BarriersThe main barriers to the further deployment of small-scale hydro technology are:• complex and lengthy administrative procedures,• lack of understanding of hydro schemes among consenting authorities and the financial
community,• the requirement, in many countries, for an environmental impact assessment to be carried
out for small-scale hydro proposals; these assessments cover a range of issues, e.g. fisheryprotection, river ecology, water quality and turbine noise.
• the lack of a universally adopted method of determining an acceptable minimum river flow,• technical, resource and commercial risk involved in hydro development.
It should be noted that the cheapest schemes to develop tend to be in mountainous areas, al-though the best sites have already been exploited and environmental sensitivity is an importantfactor in those remaining. Low head schemes, by comparison, are often close to populationcentres, where the grid is strong and the rivers ponded or polluted, with consequently less envi-ronmental objections. Particular potential exists in terms of modernisation/refurbishment of ex-isting or dormant sites.
5.8.5 Relevance for South AfricaMicro hydropower is mature technology with very limited scope for technical improvement.Developments are very site specific and there are increasing environmental concern regardingthe construction of major new schemes. There is more scope for developing smaller schemes(under 10 MW), including run-of-river schemes. A large potential has been shown recently inamong others, the Eastern Cape Province (CSIR et al., 2000). Unlike many other renewable en-ergy sources, hydropower is usually continuous and often has some element of energy storagebuilt in.
There are an estimated 8000 potential sites of up to 100 MW mainly in the eastern parts of thecountry. Development of these could clearly make a very useful contribution to the countriesenergy supply.

ECN-C--01-052 79
6. EUROPEAN INITIATIVES IN RENEWABLE ENERGY
6.1 Background
Within the European Union (EU) oil is the major source of energy followed by gas and coal.The use of nuclear and coal power are in decline. Gas consumption is increasing rapidly as moreis imported from the former Soviet bloc countries.
All of the countries in the EU are committed to developing their Renewable Energy (RE) re-sources. Environmental aspects, linked to national greenhouse gas reduction targets, are themain motivation for governments to promote RE, together with energy supply security. There isa commitment following the Kyoto conference to reduce the emission of greenhouse gases 8%by the period 2008-2012 relative to their levels in 1990. Other important factors include jobcreation and the increasing competitiveness of renewable energy sources.
In 2000 the European Commission published a draft directive proposing renewable energy tar-gets for 2010 for the member states. Figure 6.1 below shows these target figures together withthe actual renewable energy contribution for the year 1997. As can be seen from this figure,there is a wide variation across Europe. The figures proposed are in line with the commitmentsmade by the various member states and if implemented will raise the renewable energy contri-bution to 23%.
AustriaSwedenPortugalFinland
SpainItaly
FranceDenmark
GreeceIreland
NetherlandsLuxembourg
UKBelgium
EU
0 20 40 60 80 100
Electricity generated from renewable energy [%]
1997actual2010target
Figure 6.1 Renewable energy: share of electricity use - existing and proposed - in the EU
Currently renewable energy accounts for around 6% of European total energy usage and 15% ofelectricity consumption. The pattern of renewable energy usage varies widely across the EU andis mainly determined by geographical factors. Biomass is used in the form of forestry wasteproducts in the northern countries where there are abundant resources. Hydropower7 has been inuse for many years and accounts for 30% of the total. It is well developed in the areas wheremountains and rainfall permit. Wind is undoubtedly the fastest growing renewables sector.
As can be seen from Figure 6.1, progress has been made in encouraging the development of RE.To achieve this the Member States have used a wide variety of incentive schemes. If the ambi-tious targets set by the Kyoto Protocol are to be achieved then this process will have to be ac- 7 Large-scale hydropower is not considered renewable.

80 ECN-C--01-052
celerated. In 1998 the European Commission initiated a ‘Survey on Renewable Energy Policy,Plans and Programmes in EU Member States and Norway’. This involved the member statescompleting questionnaires submitted to them by the European Commission. This section of thereport draws heavily on this survey which was completed in 1999 as well as on Kühn et al.(1999), Schaeffer et al. (1999). Detailed information on EU-wide and Member State RE policiescan be found on the following website: www.agores.org.
6.2 RE Support Strategies
In order for industry to invest in renewable energy, there has to be a reliable favourable long-term financial framework in place. This requires governments to set targets and to identify andremove any non-technical barriers. Most EU governments now have RE as part of their nationalpolicy and have developed and published promotion strategies. These are listed in Table 6.1.Given the high level of attention that this subject is attracting, Member States are reviewingtheir policies and targets on a regular basis.
Table 6.1 RE Policy Documents and National Targets (1998)Country Coherent RES Policy Paper
(National Plan, White Paper)Targets (‘96-’99)
Austria ‘Energiekonzept der Bundesregierung’ No national, but regional targetsBelgium Wallonia: ‘Strategie de Promotion des
Energies Renouveables’ underpreparation
Wallonia: No targets. Forecast: 5 to 6% by 2010(‘ambitious’, actual share 1.2%); Flanders:Doubling RES by 2000, 3%RES share in energyconsumption by 2010, 5%by 2020
Denmark ‘Energy 21’: comprehensive reformpackage on energy legislation underpreparation
Wind: 1,500 MW land based before 2005; 4000 MWoff-shore before 2030; biomass: 60% increase from1995 to 2005; linked to CO2 reduction targets
Finland Only sectoral programmes High share already now: 19% of total energyconsumption (biofuels, without peat); increase ofbioenergy of 27% (1994-2005)
France Only sectoral programmes and targets No national target: EOLE 2005 target is beingmodified
Germany No national targets; forecast:2.5 to 3% by 2020;regional targets in some federal states
Greece Action plan ‘2001’ Objective: Increase of RES share in national energybalance from 5.4% to 8.5% in 2010 mainly via windand biomass (linked to reduction of C02 emissionstargets)
Ireland ‘Green Paper on Sustainable Energy’under preparation
Will be considered in the context of the Green Paper
Italy National White Paper on RenewabIeEnergies (to be approved 1999)
Doubling of RES contribution to the energy balanceby 2010; linked to greenhouse gas reduction targets
Luxembourg ‘Plan National de development durable’;likely to be valid from 1/99 on
Netherlands Third White Paper on Renewable;‘Renewable Energy - AdvancingPower’: Action Programme for 1997-2000
Around 3% of energy demand from RES, 10% by2020
Portugal ‘Program Energia’ 180 MW by the end of 1999 (RES electricity; withinthe Energy Programme)
Spain ‘Plan de Fomento de las EnergiasRenovables’
White Paper: 12% of energy demand by 2010 to becovered by RES
Sweden Bill on a Sustainable Energy Supply(June 1997)
UK New and renewable energy policyreview, under preparation
10% of electricity demand by RES by 2010

ECN-C--01-052 81
6.3 Motivation for RE
Motivation for RES Policy
0
2
4
6
8
10
12
14
Number of EUmember states
Environmental aspectsEnergy supply securityInnovation/Knowhow promotionOthersJob creation/Social economyEconomy of energy supply
Figure 6.2 Motivation for RES Policy
The survey concluded that the main object of European governments for favouring renewableenergy is to achieve sustainable, environmentally sound energy supply. This was the case for allEU countries with the exception of France and Belgium, which are both heavily dependent onnuclear power. The second important reason was that as RE resources are indigenous they canbe considered to increase security of supply. Job creation effects and improvement of economyof energy supply were also seen as being important. Figure 6.3 tabulates the responses given tothe questionnaire.
6.4 Renewable Energy Support Mechanisms in the European Union
Tools of RES policy implementation
0
2
4
6
8
10
12
14
16
Number of EU member states
RES electricity support Grants, soft loansR&DTax incentivesDemonstrationInformationNorms, standards, etc.Training
Figure 6.3 Tools for RES Policy Implementation

82 ECN-C--01-052
The focus in this paragraph is on economic support mechanisms for RE in the EU. EconomicRE support mechanisms in the EU are mainly quota based systems, such as tradable green cer-tificates and tendering systems, and direct price support mechanisms, such as feed-in tariffs andsubsidies. Moreover, fiscal measures that seek to internalise the cost of environmental pollutioncan be employed to improve the competitive position of renewable electricity generation.
There is a wide range of renewable energy technologies: some provide electricity, others heat.Some are small-scale and decentralised others are in the multi-MW-range. Some are economi-cally competitive; others still need - apart from niche market applications - additional support.Some are ‘classical’, others still in the experimental stage. This diversity needs flexible ‘tailor-made’ promotional instruments and the survey clearly show that Member States are generallylooking for packages of appropriate instruments.
All national surveys of Member States indicate that independent power production is necessaryfor ‘green’ electricity to be injected into the grid. All the Member States mention special, fa-vourable tariffs for electricity generated from RE. The approaches, however, vary greatly. Suchtariffs may be subject to competition, may be mandatory on utilities at a price level fixed by thegovernment, or may be the consumer’s choice. Tariffs may also vary in relation to the energysource in question (higher for PV, lower for wind, biomass and small hydro).
Governments generally consider electricity feed-in tariffs alone as not sufficient to trigger wide-scale RE dissemination, and therefore provide additional assistance in form of grants, low-interest loans, or tax incentives. Such support may be given for RE producing heat (solar col-lectors, firewood, biofuels). Likewise, electricity generating RE considered not yet economi-cally competitive or to balance less favourable boundary conditions (e.g. wind in off-shore ar-eas).
Renewable energies are a classical field for research and technology. Ten of the surveys re-ceived explicitly mention national RTD programmes. These are mainly limited to institutionalsupport to research centres and universities but also include programmes for the support of indi-vidual projects. RTD programmes generally focus on the RE offering the largest national po-tential. Photovoltaics is considered by many to be the sector offering the greatest cost reductionpotential via technological innovations.
In nine responses, demonstration projects were identified as being a good means to bridge thegap between lab-scale or pilot plants (as the result of an RTD project) and large-scale imple-mentation.
Technology and investment-related support measures are usually accompanied by actions ad-dressing legislation and standardisation. Information and advice to potential consumers as wellas professional training activities are also required.
6.4.1 SubsidiesThe most widespread instrument to stimulate RE sources has been subsidies. Subsidies are usedmainly for two purposes, stimulating the development of RE technologies and enhancing thecompetitiveness of RE technologies in the market. The latter can generally be divided into sub-sidies on RE capacity and subsidies on renewable electricity generation. Subsidies on capacityonly stimulate capacity instalment, but do not stimulate generation and the demand for renew-able electricity. To stimulate the development of less economical RE technologies, such asrooftop photovoltaic systems, higher subsidies are required than these given for technologiesthat are closer to the market, such as wind.

ECN-C--01-052 83
Uncertainties in subsidy schemes arise from budgetary issues, and the administrative process bywhich they are established and allocated. For instance, subsidies on installed capacity might beunfairly distributed if the total amount of subsidy is limited. In general, if the subsidised tech-nology becomes too widespread, the subsidy may have to be abolished because of the high cost.These issues are particularly sensitive if the total subsidy budget is subject to annual govern-ment appropriation.
6.4.2 Feed-In TariffsFeed-in tariffs are a special case of subsidies on renewable electricity generation. They come inthe form of guaranteed premium prices in combination with a purchase obligation by the utili-ties. The levels of guaranteed prices and the basis on which they are established varies consid-erably from country to country. In several countries the feed-in tariff is based on the avoidedcost of the utility that has the purchase obligation. Furthermore, the tariff can be differentiatedaccording to season, time-of-day, and continuity of supply.
The German electricity feed-in law (Stromeinspeisungsgesetz) provides for a fixed price for allrenewable generators. Grid operators are obliged to accept renewable electricity produced intheir area at the fixed feed-in price. To protect the grid operators against high financial loads, atoughness condition is included in the law. A regional limit of 5% renewable electricity is set. Ifthe renewable electricity production surpasses this threshold in a supply area, the operator is ex-empted from the obligation to purchase and refund.
Feed-in tariffs have proved to be very successful in promoting the deployment of renewable en-ergy sources. However, utilities that are located in areas with a large potential of renewable en-ergy sources will likely be offered more renewable electricity, and will therefore have to paymore premium tariffs. In a liberalised electricity market this puts these utilities at a competitivedisadvantage relative to utilities in areas with low renewable energy potentials. Some kind ofcompensation mechanism could be designed to avoid this problem.
In the short term, fixed feed-in tariffs give maximum investment security to RE developers.However, as the contribution from renewable sources to the generation mix increases, the costof a fixed feed-in tariff system would become to high in the longer term, and political supportfor the system will diminish. Thus the long-term investment security is low because of the in-herent political instability of the system.
Contrary to competitive market-based support mechanisms, such as tendering systems andgreen certificate trading systems, fixed feed-in tariffs do not provide incentives for innovationsand cost reductions. To counter this deficiency the appropriate regulatory authority may lowerthe fixed tariff to reflect falling prices caused by technological and operational progress. How-ever, this may be resisted by existing renewable electricity generators.
6.4.3 Tradable Green CertificatesRather than stimulating supply of electricity from RE, a green certificate system seeks tostimulate the demand. The green certificate system is based on the separation of electricity as aphysical commodity, and its ‘greenness’ emanating from the use of renewable sources. The‘greenness’ is incorporated in the green certificate, which is issued at the moment of production,and which can be traded separately from the physical commodity. Certification provides an ac-counting system to register production, authenticate the source of electricity, facilitate trade, andto verify whether demand has been met. Demand may be voluntary, based on the customer’swillingness to pay for green electricity, or it can be imposed by the government. In the lattercase, penalties are applied if the demand obligation is not met.

84 ECN-C--01-052
The principle advantage of trading in green certificates is that it provides a cost-effective meansof achieving a RE generation target. Furthermore, the level of ambition of the target or obliga-tion is reflected in the price of the green certificates. This can provide a clear price signal to po-tential investors in RE projects. Moreover, green certificate trading stimulates competition be-tween RE producers, which will lead to declining costs of renewable electricity generation.
The critical issues in the design of a green certificate trading system are the definition of renew-ables to be used, the timing aspects of the obligation, the penalty for not reaching the target andthe parties bearing the demand obligation. With regard to the timing aspect, the targets, the win-dow for meeting the obligations and the time validity of the certificates should be determined.Moreover, the number of years that the demand obligation will be in force affects the uncer-tainty faced by RE project developers.
Green certificates can be traded, banked and consumed like any other commodity. In several EUMember States they are predominantly traded through bilateral contracts, but it is expected thatboth a spot market, and a forward and options market to hedge against price risks, will developfor green certificates. Forward prices will provide a powerful price signal for the developmentof new RE projects.
Green certification systems have only recently been introduced in the Netherlands, Denmarkand Belgium. In the Netherlands the system and demand obligation is currently based on a vol-untary agreement between all electricity producers. The certificates are only valid in the year inwhich they are produced. The price is therefore very sensitive to annual weather variability.Furthermore, as most certificates are traded bilaterally, the market is not very transparent. Onlya small fraction (3%) of the certificates is traded through the spot market. The relatively smallnumber of market players in the Dutch electricity market does not encourage the developmentof the spot market. This reduces the investment incentive that green certificates can provide.Moreover, it poses a problem for determining the penalty rate. Currently the penalty rate is de-fined as 150% of the average annual certificate market price. This has the benefit of not puttinga cap on certificate prices. On the other hand it is hard to determine a representative averagemarket price if most trades are bilateral.
6.4.4 Tendering SystemsIn tendering systems a limited subsidy on output is awarded to a restricted number of investors.Potential investors have to compete for this subsidy through a competitive bidding system. Ineach bidding round only the most cost-effective offers will be selected to receive the subsidy.The bidding may be differentiated in bands of different technologies and RE sources. Thismeans that wind projects compete against other wind projects but not against, for example,biomass projects. The marginal accepted bid sets the price for the whole technology band. Thegovernment decides on the desired level of electricity from each of the renewable sources, theirgrowth rate over time, and the level of long-term price security offered to RE generators overtime. The bidding is accompanied by an obligation on the part of electricity providers to pur-chase a certain amount of electricity from renewable sources at a premium price. The differencebetween the premium and market price is reimbursed to the electricity provider, and is financedthrough a non-discriminatory levy on all domestic electricity consumption.
The UK has a tendering system known as the Non-Fossil Fuel Obligation (NFFO). The NFFOobliges the Regional Electricity Companies (RECs) to buy a certain amount of renewable elec-tricity at a premium price. These specified amounts are met with NFFO contracts that areawarded as a result of competitive bidding within a technology band on a pre-arranged date. Thecheapest bids per kWh within each technology band are awarded contracts. The NFFO genera-tors are paid the premium price per kWh. The Non-Fossil Purchasing Agency (NFPA), a whollyowned accounting body of the RECs, reimburses the difference between the premium price and

ECN-C--01-052 85
the pool selling price to the RECs. This difference is paid for by a Fossil Fuel Levy on electric-ity, paid for by all electricity consumers.
The NFFO has been very successful at bringing down the price of renewable electricity. Since1990 five tendering rounds have been held, NFFO-1 to NFFO-5. From NFFO-3 to NFFO-5 theaverage price of renewable electricity has dropped by almost 40%. The average bid price underNFFO-5 was only about 0.02 €/kWh above the reference market price for bulk electricity sup-ply.
Depending of the duration of the contract offered to the RE generator, a tendering system givesmore or less revenue security in the long term. Long term obligations, accompanied with longterm contracts increase revenue security and can lower the cost of finance of RE projects.
The cost to RE project developers of preparing for a bidding round is significant, with a highrisk of being declined. This high up front risk will lead to larger companies being the main bid-ders, rather than small local enterprises.
From the government point of view tendering systems may have several advantages. Tenderingin technology bands allows taking other interests into consideration, such as stimulating domes-tic industry, local employment and the country’s export potential.
6.4.5 Fiscal MeasuresSeveral EU countries support renewable electricity via their tax system. The form of theseschemes may range from rebates on general energy taxes, rebates from special emission taxes,proposals for lower Value Added Tax (VAT) rates, tax exemption for green funds, to fiscal at-tractive depreciation schemes. In these countries the gap between renewable and non-renewableelectricity cost has declined. However, because of considerations of international competitionthese taxes have never been put at such a level that they contribute substantially to the deploy-ment of RE sources. Harmonisation of green tax systems across the EU would be needed toavoid this problem.
6.4.6 Overview of European Union Renewable Energy Support MechanismsMost EU Member States employ several policy instruments in parallel to promote the genera-tion of electricity from renewable sources (www.agores.org and www3.jrc.es/projects/eneriure).Table 6.2 lists the main and additional policy instruments per Member State. It should be notedthat, in addition to specific RE policies, other policies, such as grid access and tariff regulationsor local spatial planning procedures, may also be very important to the development of the REprojects. Both often impose significant barriers to RE project realisation.
Another aspect that deserves some attention is the quality of the installed equipment. RE tech-nology often has to meet certain safety requirements. These can be technology specific, as is thecase for wind turbines, or they can coincide with sector or industry codes, such as buildingcodes for the integration of photovoltaic systems in rooftops. There are no requirements con-cerning the operational quality of the equipment, such as the amount and reliability of outputand the conversion efficiency. Incentives to maintain and increase operational performance canbe tied to the support mechanism that is used. Subsidies on output provide a strong incentive toimprove operational performance, since the amount of subsidy is directly proportional to theoutput that is generated. Support mechanisms that are based on competitive mechanisms, suchas tendering and tradable green certificates, also reward RE generators for maintaining and im-proving continued generation, reliability and efficiency. Moreover, competitive mechanismsprovide an incentive to reduce the cost of renewable electricity generation at the same time.
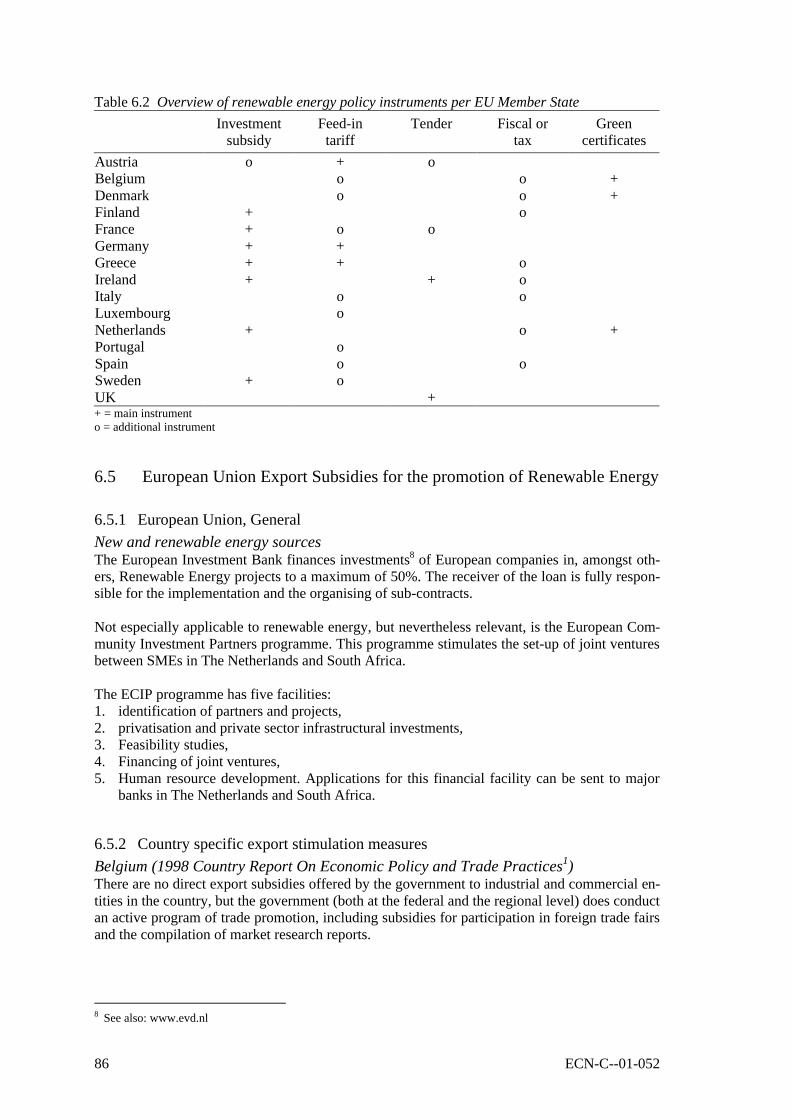
86 ECN-C--01-052
Table 6.2 Overview of renewable energy policy instruments per EU Member State
Investmentsubsidy
Feed-intariff
Tender Fiscal ortax
Greencertificates
Austria o + oBelgium o o +Denmark o o +Finland + oFrance + o oGermany + +Greece + + oIreland + + oItaly o oLuxembourg oNetherlands + o +Portugal oSpain o oSweden + oUK ++ = main instrumento = additional instrument
6.5 European Union Export Subsidies for the promotion of Renewable Energy
6.5.1 European Union, GeneralNew and renewable energy sourcesThe European Investment Bank finances investments8 of European companies in, amongst oth-ers, Renewable Energy projects to a maximum of 50%. The receiver of the loan is fully respon-sible for the implementation and the organising of sub-contracts.
Not especially applicable to renewable energy, but nevertheless relevant, is the European Com-munity Investment Partners programme. This programme stimulates the set-up of joint venturesbetween SMEs in The Netherlands and South Africa.
The ECIP programme has five facilities:1. identification of partners and projects,2. privatisation and private sector infrastructural investments,3. Feasibility studies,4. Financing of joint ventures,5. Human resource development. Applications for this financial facility can be sent to major
banks in The Netherlands and South Africa.
6.5.2 Country specific export stimulation measuresBelgium (1998 Country Report On Economic Policy and Trade Practices1)There are no direct export subsidies offered by the government to industrial and commercial en-tities in the country, but the government (both at the federal and the regional level) does conductan active program of trade promotion, including subsidies for participation in foreign trade fairsand the compilation of market research reports.
8 See also: www.evd.nl

ECN-C--01-052 87
In addition, exporters are eligible for a reduction in social security contributions by employersand benefit from generous rules for cyclical layoffs. The latter programs -- known as Maribel --come close to the definition of an export subsidy, and have already been denounced as such bythe European Commission. All of these programs are offered to both domestic and foreign-owned exporters.
Denmark (1998 Country Report On Economic Policy and Trade Practices9)The government does not directly subsidise exports by small and medium size companies.Denmark does, however, have programs which indirectly assist export promotion and estab-lishment of export networks for small and medium sized companies, research anddevelopment, and regional development aimed at increasing exports.
Germany (1998 Country Report On Economic Policy and Trade Practices1)Germany does not directly subsidise exports outside the European Union’s framework for ex-port subsidies for agricultural goods. Governmental or quasi-governmental entities do provideexportfinancing, but Germany subscribes to the OECD guidelines that restrict the terms and conditionsof export finance.
The Netherlands 10
The Netherlands has programs for the promotion of pilot projects, demonstrating the use of re-newable energy. There are hardware subsidies available for a small number of systems or com-ponents. Furthermore, there are investment subsidies available up 800 k € under the so-calledPSOM programme. The so-called PESP programme funds feasibility studies that are necessaryto prove an export opportunity of Dutch hardware. A minimum amount of 60% value added hasto be generated in The Netherlands.
Next to this, there are specialised innovation-type of projects fundable under the so-called BITprogramme. This programme is aimed at, amongst others, South Africa. There is an export sub-sidy available for environmentally friendly products that currently are not commercially viable.This subsidy, called ORET/MILIEV can also be used to promote export to a country like SouthAfrica.
Furthermore, there is a programme to stimulate the technological co-operation between SouthAfrican and Dutch companies and research institutions. The accent lies on the establishing ofcontacts, the broadening of networks and the set up of concrete co-operation projects. This fundwas not installed especially for renewable energy purposes, but could potentially be used forjoint development of renewable energy projects and local adaptation of existing technologies.
The Joint Implementation Facility is a programme that is specifically targeting the reduction ofgreenhouse gas emissions. There is a subsidy available for investments that contribute to the de-crease of CO2 emission. When a South African business utilises Dutch technology or a Dutchenterprise utilises South African technology to decrease CO2 emissions, a subsidy can be ap-plied for.
Lastly, there are a number of general financial facilities aimed at promoting exports from TheNetherlands to South Africa. More information on these facilities can be found at the Depart-ment of Trade and Industry in South Africa.
9 Country Library (http://www.tradeport.org/ts/countries/) The source is the U.S. Department of Commerce.10 www.senter.nl; www.novem.nl
88 ECN-C--01-052
Spain (1998 Country Report On Economic Policy and Trade Practices5)Spain aggressively uses ‘tied aid’ credits to promote exports, especially to Latin America, theMaghreb, and more recently, China. Such credits reportedly are consistent with the OECD ar-rangement on officially supported export credits11.
The Spanish Government offers a variety of instruments to support exports.• Development Aid Fund (FAD): The Spanish State uses this fund to offer concessional loans
to developing countries. The loans however are bound to Spanish goods and services.• Fund for Feasibility Studies (FEV): This fund finances feasibility studies of projects. The
studies must be performed by Spanish consulting companies and the projects must havepotential for the Spanish exporting sector. The financing is organised by means of donationsto beneficiary governments or by co-financing the studies.
• Export Credit Insurance: Its purpose is to cover political risks, irrespective of the term, andcommercial risks beyond 3-years terms. The insurance is operated by the Spanish ExportCredit Insurance Company (CESCE).
• Agreement on Reciprocal Adjustment of Interest Rates (CARI): This is a interest rate stabi-lisation system by which Spanish exporters can transform variable interest rates, as avail-able on the financial market, to fixed interest rates for their foreign clients. Some Autono-mous Communities have systems of their own for exporters located in their territory.
• Initiation Plan for Foreign Promotion (PIPE 2000): The plan is run by the Spanish ForeignTrade Institute (ICEX), jointly with the Council of Chambers of Commerce and theAutonomous Communities. It offers tutorial support to small and medium enterprises intheir initial efforts in the foreign markets.
6.5.3 ConclusionsSeveral economic RE support mechanisms are currently used in various EU Member States.These support mechanisms can be distinguished in competitive quota-based mechanisms, i.e.tendering and tradable green certificates, and non-competitive subsidies and feed-in tariffs.Furthermore, support may be targeted towards RE capacity or RE generation. Support mecha-nisms that reward a RE generator for its generated output provide a strong incentive to maintainand improve operational performance and to increase the generator’s output. This is preferableto capacity support if a government seeks to increase the share of electricity from renewablesources in the overall generation mix. Output subsidies and feed-in tariffs, however, can becomevery costly as the renewable electricity generation increases. Contrary to output subsidies andfeed-in tariffs, quota-based mechanisms stimulate competition and thereby provide a strong in-centive to reduce the cost of renewable electricity. Furthermore, fiscal instruments can be em-ployed to reduce the cost differential between renewable and non-renewable electricity genera-tion. In practice most EU countries use more than one support mechanism at a time. In additionto economic policy support mechanisms several other policies, such as grid access regulations,safety regulations, building codes and spatial planning procedures, play an important role in theimplementation of RE projects.
11 Plan for the promotion of renewable energies in Spain, December 1999.

ECN-C--01-052 89
7. CLIMATE CHANGE SUPPORT MECHANISMS FORRENEWABLES
Growing scientific evidence that human activities are inducing changes in the climate started aprocess to adopt an international treaty to address the problem. The United Nations FrameworkConvention on Climate Change (UNFCCC) was signed in 1992 with the aim to stabilise green-house gas concentrations and thus avoid dangerous interference with the climate system. Manyof the original signatory countries have ratified the Convention and additional states have ac-ceded.
All parties to the Convention committed to prepare inventories on emissions and removals ofgreenhouse gases. In addition, developed (Annex I) parties committed to return their emissionof greenhouse gases to 1990 levels by year 2000, and to finance the costs incurred by develop-ing (non-Annex I) parties in complying the obligation mentioned in first place.
Article 4, Paragraph 5 of the Convention is especially relevant to the implementation of renew-able energies in developing countries through climate change-related initiatives. This paragraphstates that parties included in Annex II (i.e. developed parties excluding countries with econo-mies in transition) ‘shall take all practicable steps to promote, facilitate and finance, as appro-priate, the transfer of, or access to, environmentally sound technologies and know-how to otherParties, particularly developing country Parties, to enable them to implement the provisions ofthe Convention’. The European Economic Community (nowadays European Union) and all itsmember countries are Annex II parties (UNFCCC, 2000a).
7.1 UNFCCC financial mechanism
The Convention established a financial mechanism, served by the Global Environment Facility(GEF), for the provision of grant or concessional funds to meet the agreed incremental costs ofactivities addressing climate change in non-Annex I parties. Funds come from more than 30Annex I countries, including the EU and its member countries.
The GEF Operational Strategy on climate change sets out the financing for enabling, mitigation,and adaptation activities, defined as follows. Enabling activities facilitate implementation ofcountry commitments to the Convention. Mitigation measures reduce emission of greenhousegases or enhance removal of such gases by sinks. Adaptation activities minimise the adverse ef-fects of climate change (GEF, 1996a).
As of May 2000, the GEF had four operational programs in climate change, one of them (Pro-gram 6) aimed at promoting renewable energy (GEF, 1996b). Its objectives are to remove thebarriers to the use of commercial or near-commercial RETs, and reduce any additional imple-mentation costs stemming from a lack of practical experience, initial low volume markets, orfrom the dispersed nature of applications. The market applications initially identified are listedbelow but other commercially viable applications may be considered.• wind pumps for mechanical water pumping for agriculture and domestic water supply,• low-temperature solar thermal heat for household and agricultural sectors,• biomass and geothermal heat, including combined heat and power, and use of urban and in-
dustrial wastes for process heat and district heating.• wind, biomass, photovoltaics, small-scale hydro, and other renewable energy for rural elec-
tricity supply.• renewable energy for grid-connected electricity (e.g. wind farms),

90 ECN-C--01-052
• storage systems (e.g. batteries) for cost-effective but intermittent renewable energy supplies,and
• biogas digesters for lighting and water pumping (family-size digesters for home lighting andcooking; community-size digesters coupled with engines and electric generators for waterpumping, lighting, and village power needs).
Those cases where RE are not yet cost-competitive with conventional energy are targeted byGEF Operational Program 7, ‘Reducing the Long-Term Costs of Low Greenhouse Gas-emittingEnergy Technologies’. The following supply-side technologies are considered (but not limitedto): grid-connected photovoltaics, advanced biomass (gasification and liquid fuels conversion),solar thermal electric technologies, large-scale wind power and fuel cells.
7.2 EU climate change-related support
The EU and its member countries support activities addressing climate change in developingcountries not only through contributions to the GEF but also directly and through other multilat-eral channels.
7.2.1 European CommissionSupport to environmental initiativesThe overarching objective of the European Commission (EC) in its support to developing coun-tries is poverty eradication. This priority is reflected in the aim of the EC budget line B7-6200‘Environment in Developing Countries’ to support innovative pilot activities and strategic stud-ies that address negative environmental trends while contributing simultaneously to povertyeradication. By August 2000 a budget of 93 million ECU for a 7-year period (2000-2006) waspending of approval; 11,7 million were allocated for years 2000 and 2001 (European Commis-sion, 2000a).
Priorities for co-operation are set year to year. One of the priority themes for years 2000-2001 isassisting developing countries in the implementation of their obligations within the UNFCCC.Specific priorities for funding are preparatory activities for the implementation of the Clean De-velopment Mechanism (CDM)12, energy efficiency and renewable energy.
Under the budget heading B7-8110 ‘Climate Change, Clean Development Mechanism’ the ECis contributing to capacity building of institutions in non-Annex I countries. By May 2000 theavailable budget allocation was 150.000 ECU for up to three projects. Such projects should giveincentives to the private sector in the host country to invest in CDM projects (research, educa-tion, communication and public awareness) and should assist the public administration to put inplace the necessary structures for the identification, evaluation and selection of projects. Prioritymust be given to projects which favour the development of clean technologies (for example, re-newable energies) and/or which involve NGOs in the process of selecting projects (EuropeanCommission, 2000b).
European Climate Change ProgrammeThe EC has taken many climate-related initiatives since 1991, including the promotion of re-newable electricity generation, voluntary commitments by equipment manufacturers and taxa-tion of energy products. However, it is clear that action by member states and the EC needs en-hancement if the EU is to meet its commitments under the Kyoto Protocol (reduction of green-house gas emissions 8% below 1990 levels by 2008-2012).
12 Details on the CDM are provided in the next section.

ECN-C--01-052 91
The EU Council of environment ministers has asked the EC to develop proposals on priorityactions and policy measures. In June 2000 the Commission launched the European ClimateChange Programme (ECCP), with the goal of identifying and developing all the necessary ele-ments of an EU strategy to implement the Protocol. The ECCP is preparing a range of additionalEU-level policies and measures to cut greenhouse gas emissions as well as an EU emissionstrading scheme (European Commission, 2000c).
Although the initial scope of the Programme is limited to the most promising emission reduc-tion measures, in order to achieving the Kyoto target, in a mid- and long-term perspective theECCP should incorporate issues such as adaptation, research, demonstration of efficient andclean technologies, training and education, and international co-operation, e.g. capacity-buildingand technology transfer in developing countries.
EU member countriesTo what extent EU members states will be engaged in CDM depends on their national reductiontargets in relation to the costs of greenhouse gas abatement in their own countries. Certainly notall countries will be actively looking for purchasing CDM credits. These countries also usemultilateral institutions like the UNDP and World Bank13 to promote capacity building and topurchase credits. EU member countries which do have already concrete initiatives on CDM are:Denmark, Finland, the Netherlands and Sweden.
7.3 Promoting renewables through the Clean Development Mechanism
The 1997 Third Conference of the Parties (COP-3) adopted the Kyoto Protocol under whichAnnex I parties will reduce their emissions by at least 5% compared to 1990 by the period 2008-2012. The Protocol defines as well the so called Kyoto (flexibility) mechanisms that allow An-nex I parties to include into their emission reductions those made available by other parties.Such mechanisms are Joint Implementation (JI), Emissions Trading (ET) and the CDM. Thefirst two are limited to Annex I parties, so only the CDM can be applied in developing countries(UNFCCC, 2000b).
Since not enough parties have ratified the Kyoto Protocol, it has not entered into force as yet.Before the 2000 Sixth Conference of the Parties this was expected to happen at the Rio +10Conference in 2002 at the latest. However, the lack of agreements at the 2000 session in TheHague (to be resumed in July 2001) and the statements by the U.S. Government of March 2001have tuned down the expectations.
The CDM is defined in Article 12 of the Kyoto Protocol as follows:Its purpose ‘shall be to assist Parties not included in Annex I in achieving sustainable develop-ment and in contributing to the ultimate objective of the Convention, and to assist Parties in-cluded in Annex I in achieving compliance with their quantified emission limitation and reduc-tion commitments under Article 3.’• Under the CDM, ‘parties not included in Annex I will benefit from project activities result-
ing in certified emission reductions’. ‘Parties included in Annex I may use the certifiedemission reductions accruing from such project activities to contribute to compliance withpart of their quantified emission limitation and reduction commitments’. ‘Emission reduc-tions resulting from each project activity shall be certified by operational entities’ on the ba-sis of: ‘Voluntary participation approved by each Party involved’.
• ‘Real, measurable, and long-term benefits related to the mitigation of climate change’, and• ‘Reductions in emissions that are additional to any that would occur in the absence of the
certified project activity.’
13 Most notably the Prototype Carbon Fund of the IFC will be actively looking for purchasing CDM credits.
92 ECN-C--01-052
In short, the CDM allows industrialised countries to purchase certified emissions reductionsfrom projects in developing countries. Such projects should not only reduce greenhouse gasemissions that otherwise would occur (i.e. baseline scenario) but also contribute to the sustain-able development of non-Annex I parties. Annex I parties can account the purchased reductionsas part of their own emission reductions. Reductions can be accounted retrospectively from thebeginning of year 2000 on despite the Kyoto Protocol not being ratified.
It is clear that the CDM requires further definition and much tighter specification before be-coming operational. The next paragraphs present the views of key African negotiators and re-searchers on the main issues regarding the CDM (RISØ, 1999). Given their specific needs andcompetitive situation in the world economy, African countries should pay particular attention tosome additional issues:• CDM projects should be undertaken within a national programme approach to ensure
meaningful contribution to overall development objectives.• Due attention should given to the selection of CDM projects. Choosing low cost options at
an early stage, will make more difficult to later undertake options with higher cost or majordevelopment benefits.
• CDM projects should involve significant and genuine technology transfer in order to en-hance local capabilities.
7.3.1 Likely benefits and problems of the CDMProvided an effective system for the operation of CDM is attained, this mechanism can provebeneficial to developing countries, especially to those like the African having a relativelygreater need for development projects. The CDM is expected to:• attract an increased flow of investments and capital intensive projects,• incentive technology co-operation and partnership,• stimulate market development and expand existing markets,• improve the overall business environment,• reduce the overall abatement cost by investing in countries with lower marginal costs,• greatly enhance the negotiating capacity of Parties to the Convention,• have positive impacts on the sustainable development of non-Annex I parties.
There are also problems that may emerge due to the introduction of the CDM:• The level of contribution of CDM credits to the commitments of Annex I Parties will de-
termine how well the global objective of UNFCCC is met.• CDM would increase the administrative burden of Parties to the Convention.• Countries with a weak private sector would find it difficult to effectively participate in
CDM projects.• Monitoring and verification of credits would become cumbersome, especially due to the
varied nature of possible projects.
7.3.2 An Enabling Environment for the CDMCDM projects should be compatible with national development and environmental priorities ofthe host countries. Therefore they need a well-articulated list of these priorities. Many develop-ing countries like the African lack such information. In addition, host countries need to developbasic capacities and a well-organised business environment.
The following are the main elements needed:• A very strong regulatory framework that is transparent, enforceable and clearly defined, in-
cluding a complimentary arbitration system.

ECN-C--01-052 93
• An established business environment (including an effective banking system, insurancecompanies and stock market).
• An effective project information database for local and external investors.• An organised and co-ordinated public institutional framework.• An adequate and well maintained public infrastructure (energy, water and transport).• A critical mass of experienced project developers, and business managers and strategists.• A critical number of small and medium scale local firms capable of exploiting market
niches and sub-contracting at acceptable standards.• Strong and effective partnership links between government, private sector and NGOs.
7.3.3 Renewable energy and the CDMEnergy production and use is one of the main sectors responsible for the emission of greenhousegases. On the other hand, the way energy resources are transformed and consumed has directimplications on the long-term sustainability of human development. This means that energyprojects clearly qualify for CDM under the conditions set in Article 12 of the Kyoto Protocol,despite any further definitions and specifications for making the CDM effectively operational.In broad terms, energy projects that qualify for CDM may be classified into energy efficiency,energy substitution and renewable energies.
Specifically, renewable energy projects comply with CDM requirements when avoiding or re-ducing the use of fossil fuels (and thus emissions), either at the point of use or anywhere up-stream in the energy chain, and at the same time contribute to sustainable development (e.g. byreducing local pollution and creating employment). One factor particularly in favour of renew-able energy projects is that baselines are usually clear and emissions avoided easy to estimate.
7.3.4 Financing of renewablesSince certified emission reductions (CERs) would be traded in an international market, pricepaid for reduction of greenhouse gases at a given moment would in principle depend of supply(e.g. number and size of CDM projects operating) and demand (e.g. amount of CERs neededand proximity to the end of commitment period).
Different estimates on such price have been made for a variety of projects. It is very difficult tojudge which of them is the best estimate, but the average is around US$8 per ton of CO2-equivalent emission.
Just to show the possible effect of this price in grid-connected renewables in South Africa, theestimated contribution of CDM to a 300 kW windmill would amount US$ 0,01/kWh or Rands0,07 per kWh, equivalent to 15% of the capital cost of the project (adapted from DANCED,2001). Interestingly enough, this is twice as much as the current electricity generation costclaimed by ESKOM.
Two common expectations on CDM are that it may turn cost-effective otherwise unattractiveprojects, and that it would provide the full investment. However, this may not necessarily hap-pen and the above example is useful to show this. Rather, CDM credits may enhance alreadycost-effective project and in a way ‘subsidise’ part of the capital or reduce operating cost.
On the other hand, the contribution of the CDM would not be completely free, in the sense thatboth national and international procedures, set respectively by the host country and the Conven-tion, should be completed. If such procedures are excessively complicated and slow, projectpromoters may decide not to apply for CDM as resulting costs may offset the credits.

94 ECN-C--01-052
7.3.5 Special procedures for off-grid renewable energy projectsThe current design of the modalities and guidelines of the CDM would involve high transac-tions costs per project, which would make it quite difficult for off-grid renewable energy proj-ects to derive value from participating in the CDM. If not specifically addressed, the currentCDM regulations would mostly favour large-scale urban and industrial projects and leave outopportunities for promoting clean rural development. This would be very unfortunate, since off-grid renewable energy projects rank high in terms of fostering sustainable development as wellas offering a safe and long-term solution for climate change.
A current study undertaken by ECN, IT Power and Sunrise Technologies on streamlining proc-esses for Solar Home Systems under the CDM indicates that even with competitive CER prices,the CDM could still make a valuable contribution to the dissemination of SHS (see Ybema etal., 2001). The same conclusion is also likely to apply to other off-grid renewable energy tech-nologies.
Small-scale renewable energy systems can be excellent fit for the CDM’s objectives, consider-ing that they reduce greenhouse gas emissions while providing important development benefitsfor poor rural communities. The benefits of off-grid renewable energy include amongst others:• Addressing the needs of a large percentage of the rural population, leading to:
− improved living standards (especially for women and children) by increasing the qualityof light and decreasing the fire hazard and toxic fumes from traditional lighting,
− improved access to modern communication facilities,− increased rural economic development,
• Less local and indoor environmental pollution,• Less reliance on foreign energy resources and thereby improving trade balance positions
and reducing economic vulnerability to oil crises,• Promoting the transformation to a sustainable energy provision by increasing the use of de-
centralised technologies using efficient appliances.
If off-grid projects are to be viable within the CDM, the transactions costs of their participationmust not outweigh the value of CERs they generate. In order to keep transaction costs low,CDM eligibility rules should be fit for purpose and CER calculation procedures kept simple.This has been recognised by the UNFCCC Parties (UNFCCC, 2001):
‘Standardised baselines (..) may be used for small-scale projects and renewable energy proj-ects. The Executive Board is asked to elaborate on and make recommendations on preferen-tial treatment of these specific project types’.
Apart from the issue of standardised baselines, it is important to recognise that streamlined pro-cesses for off-grid renewable energy projects should not be limited to baseline developmentalone. Transaction costs are involved in every step of the CDM project cycle. Streamlined proc-esses are required for monitoring plans, verification procedures, and credit purchasing schemes.Hence, the necessity for the Parties of the UNFCCC to make a special CDM window for off-grid renewable energy projects.
7.4 Climate Change framework in South Africa
Climate change issues are officially dealt with by the Department of Environmental Affairs andTourism (DEAT). The National Climate Change Committee (NCCC) is mandated to adviseDEAT in these matters. NCCC is formed by representatives of many sectors including govern-ment, large industries (ESKOM, Sasol, etc.), industry associations, universities, research insti-tutions and NGOs, and chaired by DEAT.
Other governmental departments involved in climate change through NCCC are:• Department of Minerals and Energy (DME),

ECN-C--01-052 95
• Department of Trade and Industry (DTI),• Department of Finance.
South Africa ratified the UNFCCC but not the Kyoto Protocol as yet. This is the very first stepto be taken by the country to participate in upcoming CDM projects.
The government is committed to address climate change and was preparing a response strategyto be issued by the end of 2000 which involves minerals and energy, trade and industry, wateraffairs and forestry, transport, and agriculture. First indication of actions points to households,energy intensive industries and export sector.
In the international arena the government concerns are directed to reduce the potential impactsof climate change policies, to be implemented in Annex I parties, on South African exports ofenergy intensive products and coal to such countries.
On the export of energy intensive products, the strategy is to show commitment to reducingemissions, mainly from coal-fired power generation, in anticipation of any import barriers.
Regarding coal exports, based on Article 4.8 of the UNFCCC, South Africa demands that de-veloped countries should not affect fossil fuel imports from developing countries. In the samecontext, South Africa calls for the diversification and expansion of economies of non-Annex Icountries, highly dependant on fossil fuel exports, by the use among others of the financial andflexibility mechanisms under the UNFCCC and the Kyoto Protocol.
The use of the CDM as a vehicle to transfer technology is given special emphasis in the abovestatement. Analyses of technology needs are suggested, where national priorities and needs de-termine technology choices, and acceptability criteria select proven technologies for each appli-cation.
7.4.1 Importance given to the CDMThe CDM is present in the agenda of DEAT and NCCC but only a limited number of peoplefully understand the mechanism and its implications. CDM opportunities are only seen by largecompanies; e.g. ESKOM in the energy sector, NGOs and specialised research centres.
One of the few initiatives to enable South Africa for CDM was developed by the Energy andDevelopment Research Centre (EDRC) at the University of Cape Town. The Project ‘CapacityBuilding in CDM Project Activities: South Africa’ was financed by the United Nations Envi-ronment Programme (UNDP) under its enabling activities on climate change. The purpose wasto help local stakeholders prepare for the eventual introduction of the CDM in South Africathrough providing background information on national priorities, identifying opportunities forCDM and developing case studies.
According to EDRC, CDM projects have the potential for generation of revenues for South Af-rica while supporting development. The CDM may contribute in increasing the presently limitedhuman and technical resources, and at the same time alleviate impacts on local and environ-ment. To take advantage of this potential, stakeholders must clearly understand the CDM proc-ess and create an enabling environment for attracting promoters.
7.4.2 Potential CDM project areasThe CDM capacity building project prepared a scan of the full range of potential CDM projectareas, intended to convey a sense of their range and variety. Since CDM is open to innovative

96 ECN-C--01-052
and entrepreneurial initiatives, successful projects may emerge from areas not considered in thescan. The areas identified are summarised below (Davis et al., 1999).
Table 7.1 Potential CDM project areasSector Potential CDM project area Comment
Gas-fired generation stations Likely future fuel sourceClean-coal technology Some potential reductions in emissionsLarge scale hydro-electricity Requires regional tradeNuclear plant Depends on pebble bed technologyCogeneration 1,200 MW potential estimated by ESKOMRenewable energy Small contribution to total electricity supplyElectricity from biomass Dedicated plantations for power plantsClosure of Sasol/Mossgas Decision dominated by non-environmental
factors
Energy supply
Conversion of Sasol’s feedstock to gas Likely scenario
Conversion to gas Many potential opportunitiesEnergy efficiency Many potential opportunities
Manufacturing
Structural change Unlikely to be CDM activity
Energy efficiency Some opportunitiesMethane emissions from coal mines Beginning to be investigated
Mining
Control of coal dump fires Already being dealt with
Afforestation Not yet within CDM scopeImproved management of natural woodlands Potential opportunities in SA & regionControl of fires Difficult to measure impact
Agriculture &forestry
Better use of forest & agricultural wastes For steam & power production
Improved public transport Significant opportunitiesUrban planning Difficult to measure impactsImproved vehicle efficiency Problem dominated by old vehicle fleet
Transport &communications
‘Telecommuting’ Difficult to measure impacts
Efficient appliances in households Lighting, refrigerationSolar water heating Significant potentialFuel switching in households Small contribution to overall energy use
Household
Energy efficient dwelling design Significant potential
Government &commerce
Energy efficiency in buildings Significant potential
Energy efficient building design Significant potential
The areas identified for renewables are further commented as follows:• Wind farms
There is increasing interest in the development of small-scale wind generating stationsin the Western Cape. While these projects will be small compared with overall capacity,their viability may be improved significantly if included in a CDM initiative.
• Solar energySmall scale and stand-alone photovoltaic systems represent a cost-effective solution toremote area power supply. Again, this is unlikely to make a large impact on the overallsupply of energy but represents a niche opportunity for CDM projects.
• Electricity from biomassCombustion of plant material grown expressly for electricity production.
Co-generation (of heat and power) as mentioned by EDRC may include the use of renewables.The most likely case in South Africa is increasing cogeneration in sugar mills and sawmills overtheir internal power demand, thus feeding the excess to the grid. In certain conditions, pulp andpaper mills can also cogenerate and sell excess power.

ECN-C--01-052 97
One of the case studies developed within the CDM project refers to solar electrification in theconcession area in the Northern Province, to be undertaken by the Rural Alternative PowerStores (RAPS) - NUON joint venture (the concession scheme is described elsewhere in this re-port).
The conclusion from the case study was that projects using SHS might not be the ideal for CDMfrom a purely emission reduction perspective, because of the high costs and relatively smallemissions reductions. From a national perspective, the SHS system might be financially attrac-tive if all the external costs of using the alternative fuels are captured in the analysis. However,cost effectiveness from the CDM investor’s perspective depends on the specific financial ar-rangements between partners and agreements on credit sharing. Full details are provided inDavis et. al. (1999).

98 ECN-C--01-052

ECN-C--01-052 99
Section III
Recommended Actions to Stimulate theMarket Penetration of Renewable Energy
Technologies in South Africa.

100 ECN-C--01-052

ECN-C--01-052 101
8. ACTIONS FOR SOUTH AFRICAN - EUROPEANCO-OPERATION ON RENEWABLE ENERGY
Although the deployment of renewable energy varies throughout the EU, the member stateshave in general an advanced renewable energy development programme compared to South Af-rica. This can be advantageous for South Africa in two ways:• South Africa can benefit from the experience gained in the use of financial incentives and
institutional arrangements for the promotion of renewable energy technologies,• South Africa can benefit from the experience gained and the availability of mature renew-
able energy technologies together with a developed renewable energy industry includingproducers, developers and investors.
In this chapter, further actions are recommended to stimulate the market penetration of renew-able energy technologies in South Africa. They are structured in actions to enhance the policyframework for renewable power generation (4.1), actions to enhance the policy framework foroff-grid renewable energy (4.2) and recommendations to stimulate renewable energy project de-velopment (4.3). The text box below provides a summary of the actions.
Text Box 8.1 Summary of recommendations to stimulate the marketpenetration of renewable energy technologies
Actions to enhance the policy framework for renewable power generationAction 1: Development of a 200 MW set-aside programmeAction 2: Develop and implement power purchase regulationAction 3: Capacity building
Other policy related actions• Disseminate successes and failures• Integrated resource planning• Tariff Structure• Innovative financing• Green power Marketing
Actions to enhance the policy framework for off-grid renewable energyAction 1: Government stakeholders should convey the same messageAction 2: Raise awareness of end-users on electrification planning, the non-grid rural electrification
programme, and renewable energy technologiesAction 3: Make electrification planning more transparentAction 4: Integrate energy planning into Integrated Development Planning ProcessAction 5: Capacity building to support the implementation of the non-grid electrification programme
focusing on:1. improved monitoring and evaluation capacity at DME, NER2. technical and financial assistance for concessionaires
Other relevant actions:• Conduct research on the optimal rural energy service structure• Concessionaires should be responsible for all non-grid energy services in their concession area• Special risk mitigation measures for economic activities• Launch integrated PV follow up programme
Actions to promote demonstration and commercial projectsAction 1: Provide financial supportAction 2: Capacity buildingAction 3: Provide technology

102 ECN-C--01-052
The recommended actions are based on the analysis done by the Synergy Project team, the re-sults of which have been discussed at the workshop held with relevant stakeholders in February2001 in Pretoria. In this workshop the recommendations were evaluated, elaborated, discussedand prioritised. Of course, the responsibility for the recommendations lies entirely with the proj-ect team.
8.1 Actions to enhance the policy framework for renewable power generation
In order to utilise the EU experiences, activities like knowledge transfer, studies and co-operative research should play an important role. This paragraph elaborates upon the potentialrole of the EU and EU countries in policy related activities.
It is important to note that since 1998 DME and an EU party, the Danish Co-operation for Envi-ronment and Development (DANCED), have taken steps to support bulk wind energy genera-tion in South Africa, using the Darling Wind Farm as a pilot project. Studies for the develop-ment of the farm would be financed by DANCED and the United Nations Development Pro-gramme (UNDP), with some of the funds coming from the Global Environment Facility (GEF).
The first step was research on independent bulk power production with renewable energysources. The initial outcomes were discussed with relevant stakeholders in September 2000. Theresulting DME/DANCED study presents recommendations to DME and NER on the way for-ward. The actions presented below are in line with many of those recommendations.
Action 1: Development of a set-aside programmeThe SA government commits itself to the development of a set-aside programme. The aim ofthis programme is to reserve a fraction of the total power demand (an initial block of 200 MW isbeing proposed) to the most competitive renewable energy producers. The distribution compa-nies would be obliged to purchase the renewable power at premium prices.
Expertise would be required to assist DME and NER in designing the pilot phase of the set-aside and fitting it in the ESI and EDI restructuring processes. Interested developers and inves-tors would also need assistance to participate in the selection process and then in the develop-ment of the IPPs.
Potential EU collaboration for the above may be requested from implementing bodies of coun-tries already well experienced on set-aside programmes, notably the Department of Trade andIndustry in the UK, responsible for the Non-fossil Fuel Obligation (NFFO). EU developers andinvestors participating in the national set-aside programmes could also be linked to their coun-terparts in South Africa in need of assistance, in order to develop collaboration and partnerships.
The majority of the Synergy workshop participants regarded the development of a set-asideprogramme as the most important action to be implemented on short term. Some additional re-marks were made:• the 200 MW set-aside should be seen as an initial target, not as a limit,• legislation should be adapted in order to put the set-aside in place,• clear and transparent rules must be developed and applied in order to enable a fair and
proper competition,• it should be clarified whether ESKOM should be able to participate in the competition; the
general feeling was that this should be the case, but that ‘small’ producers should be pro-tected against large ones.
For most stakeholders, it is unclear what they have to expect in the near future. In order to de-velop strategies and plans, it is essential for DME to develop and communicate a clear policy,including a time frame with deadlines, available budgets and responsible bodies. EU contribu-

ECN-C--01-052 103
tions in the policy field should be clearly focussed on assisting DME in realising this short-termtarget.
Action 2: Develop and implement power purchase regulationRenewable IPPs and utilities have conflicting views on the value of the power to be transacted,so the purchase needs to be regulated by an independent body (e.g. NER). In theDME/DLANCED study an interim regulation is proposed from the beginning of the set-asideprogramme, to be later amended to encourage renewable IPPs beyond the set-aside.
Some expertise is needed to help the power purchase regulator in developing key issues (e.g.determination of avoided costs, compensation for externalities…). Bodies responsible for regu-lation and/or tariff setting in most EU countries (e.g. Germany, Denmark, Spain, just to mentionsome) have experience on these issues that may be relevant to South Africa.
The Synergy workshop participants regarded this action as highly important. The followingitems were addressed during the workshop:• the roles and mandates of NER and DME should be updated. Their competence should be
clearly defined to avoid mutual interference and conflicts,• NER should revise the 5-year limitation to PPA currently in place,• NER should conduct capacity planning aimed at ensuring continuity of electric supply.
Also for this action it is essential for DME and NER to develop and communicate on short terma clear policy, including a time frame for actions with deadlines and responsible bodies. BothDME and NER could benefit largely from specific assistance of relevant EU bodies.
Action 3: Capacity buildingThe pending restructuring process of the electricity sector will be very demanding for DME andNER, especially if the development of grid-connected renewables is to be integrated in the pro-cess. Both institutions feel that their capacity on renewables should be further developed.
It is important to note that DANCED is preparing a possible support to the DME on renewablesand energy efficiency. A study tour to Denmark was arranged for August 2000 with participantsfrom DME and NER, aimed at providing them with a direct insight of the Danish policies,strategies, regulation and institutional arrangements regarding renewables and energy effi-ciency.
Additional support on the implementation of grid-connected renewables may be obtained fromother EU parties with relevant experience. For example, the current collaboration betweenDME, CSIR and the Netherlands (e.g. ECN) may be enhanced towards complementing the pos-sible support by DANCED.
Bilateral programs between EU countries and South Africa have been shown to be effective andshould be extended and further developed.
Other policy related actions
• Disseminate successes and failuresEurope has gained a lot of experience in matters of policy, regulation, market liberalisation,standards, project implementation, etc. Many South African stakeholders are interested to hearabout the lessons learnt in Europe. This dissemination of success stories and failures should beorganised in a structured way.
104 ECN-C--01-052
• Integrated resource planningThe WPEP requires the implementation of Integrated Resource Planning (IRP) in the ESI. IRPentails formulating plans to meet the country’s future electricity needs at the lowest possiblecost. Grid-connected renewables should be properly considered among the alternatives to con-ventional power supply, in order to ensure the gradual incorporation of the renewable potentialin the energy system.
Expertise is required at DME and NER to include renewables in the modelling and forecastingprocedures that will produce data for the IRP exercise. Some collaboration is already on the waybetween DME and the Netherlands Energy Foundation (ECN) regarding integrated energyplanning at the sectoral level. This could be extended to cover the above mentioned needs ofDME and NER, with the eventual participation of other relevant EU parties.
• Tariff structureThe WPEP states that tariffs for IPPs should consider full avoided costs; furthermore, it notesthat environmental costs should be included in order to promote renewable generation. Alongwith power purchasing agreements, tariffs are the most important issue for making renewableIPPs viable beyond the set-asides.
Expertise is needed to design a tariff structure that promotes competition and efficiency, and atthe same time considers the inherent disadvantages of renewables, especially environmentalexternalities. As mentioned earlier, bodies responsible for tariff setting in most EU countrieshave extensive expertise to share with South African counterparts.
• Innovative financingRenewable IPPs face much more expensive finance as compared to conventional utilities. Ex-pertise is required to assess the real risks of lending to renewable IPPs and to develop innova-tive finance packages addressing the particular characteristics of renewable grid generation, e.g.equity and debt capital, risk guarantee schemes, etc.
Most EU governments are familiar with specialised financing for renewables, notably in France,the UK, Spain, Germany and Italy. Implementation bodies in EU countries may be in position tocollaborate with South African parties in the development of appropriate financial mechanisms.
• Green power marketingDemand for green energy is slowly emerging in South Africa, initially from companies seekingto provide environmentally friendly products in foreign markets. Such demand should be linkedto renewable IPPs as a way of covering their incremental costs.
Expertise is required to design the green energy option within the regulatory framework. Ini-tially the regulator would approve the green tariff in a case per case basis. A market-based ap-proach could be developed in a later stage, e.g. through green certificates.
Many EU member countries are involved in green investment funds, tariffs and/or certificates(Denmark, the Netherlands, Belgium, Germany, Italy, Finland, Sweden and the UK). Some ofthese experiences may be used to assist South African parties as required.
8.2 Actions to enhance the policy framework for off-grid renewable energy
In all the actions, mentioned below, the main actor to move is the Government of South Africa,and in most cases DME. The EU and European Governments could play a catalysing role byproviding financial support and sharing their technical expertise for these actions. In Europethere is vast experience with the technical assistance and policy support for off-grid renewableenergy projects gained through Official Development Aid and international climate change pro-

ECN-C--01-052 105
grammes. Apart from such knowledge transfer from Europe, direct exchanges with institutionsfrom other developing countries responsible for rural electrification should also be stimulated.
Key actions:Action 1: Government stakeholders should convey the same message.One of the main problems perceived by the concessionaires is that DME and ESKOM (Distri-bution) provide different interpretations/messages on the concession programme. Action re-quired is: DME, ESKOM-D, NER should convey the same message. Also participation of theconcessionaires in the whole design process should be ensured by means of formal representa-tion.
Action 2: Raise awareness of end-users on electrification planning, the non-grid rural electrifi-cation programme, and renewable energy technologiesPV suffers from a bad image in South Africa. This may distort consumer choices to participatein the Non Grid Electrification Programme and lead to misconceptions of what to expect fromSHSs. This is due the lack of clarity in the government plans with regard to grid electrificationand non-grid electrification and enforced by the ‘Electricity for all’ promise of ESKOM in theearly nineties. Another reason for the bad image of SHSs is the bad experience with inferior PVproducts sold in the past by commercial ‘fly-by-night’ operators.
During the workshop participants argued that the effort required to address this lack of aware-ness is beyond the scope of the private sector participants but should be a task for the govern-ment. The objective of such an awareness programme is to enable end-users to make informedchoices on the rural energy services options provided to them either via electrification, the Non-Grid Electrification Programme (NGEP) or commercial channels. Important components ofsuch an awareness programme are:• electrification planning for communities,• explanation of the NGEP,• explanation on SHSs and other relevant renewable energy technologies, the services it does
and does not provide, different available technologies and important questions to ask..
Action 3: Make electrification planning more transparentOne of the most important issues, which has stalled the finalisation of the concession pro-gramme, is the lack of clarity on grid extension planning. Often grid extension plans are lack-ing, or promises have not been fulfilled. The lack of transparency of grid extension planningmay have two causes. ESKOM may not be willing to disclose information because it may ex-pose it to more political pressure. On the other hand, disclosing such information accuratelyover a long period of time is also quite difficult, especially given the scale and speed ofESKOM’s operations. These two issues should be approached together. Special legislation maybe adopted to tackle the first issue and capacity building to tackle the second.
Action 4: Integrate energy planning into Integrated Development Planning processThe major challenge when trying to integrate energy into other development activities is thelevel where the integration will take place. In the past many national and provincial governmentprogrammes have failed at the point of delivery due to lack of capacity or involvement of localgovernments. As a reaction, The Department of Provincial and Local Government has intro-duced the Integrated Development Planning (IDP), a tool for reorganising local government andsetting strategic frameworks for project delivery.
The level where electrification plans can be integrated with other development initiatives has tomatch with the existing institutional structure of the South African government to promote ruraldevelopment, which is the IDP process. The integration of energy into the IDP process has twomajor components:• Energy planing into IDP - Considering that energy issues and income generation are high on
the priority list of rural communities, it is quite relevant to develop local energy planning

106 ECN-C--01-052
tools to assist districts in energy planning and decision-making. It will enable local commu-nities to make informed choices of what is feasible and will help them express their needstowards ESKOM or the concessionaire in that area. Such a tool could be made availablethrough the PIMS-Centre or other relevant local body.
• Making use of the implementation infrastructure of the concession programme- The conces-sionaires are established at the national level by DME, while the development planningthrough the IDP will take place at the district level. It seems therefore a priority to link theplanners at the municipal level with the concessionaires. The concessionaire and the mu-nicipality could engage in the energy planning for each area and identify potential energyactivities. Through such a process, concessionaires can be linked to income generation ac-tivities and assist in providing energy solutions to those initiatives.
In order to find out how energy actions can be integrated into the local IDP process, it was sug-gested at the workshop that a pilot project with a few interested municipalities could take placeto identify the needs and key issues for such an action on the local level.
Action 5: Capacity building to support the implementation of the Non-Grid Electrification Pro-grammeThe Non-grid Electrification Programme is the single best opportunity for promoting the large-scale penetration of renewable energy technologies in South Africa. Because European partiesare already deeply involved, stimulating this Programme is also a good opportunity tostrengthen South African - European integration on renewable energy.
Given its experimental nature, there is likely be a lot of policy challenges for DME during theimplementation phase of this programme. Policy flexibility on the side of DME is therefore animportant component to meet its ambitious targets without jeopardising the needs of the end-users and the financial operations of the private companies. This flexibility should be enhancedwithin the involved implementation bodies, i.e. DME, NER and the concessionaires.
• Improve monitoring and evaluation capacity at DME, NERThe chances of addressing these policy challenges will be increased if proper monitoring andevaluation of the programme is conducted. It is therefore recommended that long term technicalassistance to DME is provided during the implementation of the programme to strengthen themonitoring and evaluation capacity at DME and assist in finding creative solutions for the pol-icy challenges. This technical assistance could also include a review of similar international ini-tiatives in order to learn from other experiences with non-grid electrification in other countries.
• ConcessionairesThe role of the concessionaires is in the first place is to operate a commercial rural energy serv-ice business in a commercial way within the margins of the NGEP. The low margins/high risknature of their business combined with the constraints of commercial operations is likely to re-sult in little space for the concessionaires to develop and test new practices to improve theirservices and try new technologies which in the long run would improve their energy services. Inorder to provide the flexibility within the NGEP to develop the most appropriate deliverymechanism, it is desirable to provide separate assistance to the concessionaires.
Assistance can be provided in two ways:• Technical assistance to the concessionaires to expose them to other experiences with non-
grid energy service delivery to poor rural households.• Technical assistance to expose them to the latest technological developments on off-grid
renewable energy, including new applications such as stand-alone small-scale wind tur-bines, small-scale biomass power generators and thermal energy providers.
• Financial assistance to enable the concessionaires to experiment with new delivery mecha-nisms and technologies which in the long term can improve energy service delivery in ruralareas.

ECN-C--01-052 107
Apart from improving the performance of the South African programme, the improved moni-toring and evaluation of the programme will make it easier for other countries to draw valuablelessons learned from this programme.
Other relevant actions
• Conduct research on optimising South Africa’s rural energy servicesCurrently, the delivery of rural energy services is distributed over different providers (ESKOM,municipalities and concessionaires), which provides unclear situation on responsibilities. At thesame time, as part of the Electricity Sector Restructuring, the formation of 6 Regional Electric-ity Distribution Companies is being considered. Apart from these developments in the electric-ity sector, natural gas is being introduced. These developments raise a number of questions,which are relevant for long-term energy service strategy in rural areas in South Africa. Researchin the provision of rural energy services models as well as analysing the compatibility of thecurrent models to meet the long term energy needs of rural provisions would provide useful in-puts into the long term rural energy policy decision making.
• Concessionaires should be responsible for all non-grid energy services in their concessionarea
By setting up the concession system, there is now an implementation capacity in place to deliverenergy services in rural areas. The concessionaires will in the first instance be very much fo-cused on delivering energy services to rural households, i.e. for consumptive applications. Atthe same time, there is a need for establishing energy services for rural industries as well. Sinceconcessionaires have already the infrastructure in place, and the level of risk of such activities istoo high to allow competition, they should also be mandated to provide other off-grid energyservices in their area.
• Special risk mitigation measures for economic activitiesThe government should try to put in place separate measures to facilitate the investments in re-newable energy projects to economic activities in rural areas, likewise they had done it forhouseholds. During the workshop, a number of barriers were identified hindering the deploy-ment of renewable energy for economic activities:• lack of training & awareness,• lack of funding,• sectoral instead of holistic approach blocking development initiatives,• high-risk,• no IPP-framework,• confusion on ESKOM task division.
One of the main barriers to economic activities is the lack of rural economic activities. Thiscould be advantaged by integrating energy into the IDP process (see point above) with a specialemphasis on involving local communities.
It was concluded that the concessionaires should be the main responsible for providing energyservices to economic activities in rural areas (see also previous point). They would have accessto finance to develop decentralised energy projects and could in turn sell the power to the proj-ect developer under a power purchase agreement. However, concessionaires would only get en-gaged if such ventures are commercially viable for them. Energy projects for economic activi-ties require higher investments than household and hence are surrounded with more risk. Theyinvolve small-scale activities from companies which often have no financial track record andwhich face uncertain market prospects. Special support measures, similar to the ones provided

108 ECN-C--01-052
to rural households, are therefore also required for off-grid renewable energy projects for eco-nomic activities. Such measures could include:• subsidy on capital expenditures (similar to the one provided for households) to create a level
playing field with grid extension,• guarantee fund for the power purchase agreement,• assistance to project developers: economic, financial, legal skills to set up commercial proj-
ects,• integrate this into the IDP process (see point above),• make concessionaires responsible for such activities (see point above).
• Launch integrated PV follow up programmeAs part of the programme to improve the public image of PV, DME may wish to consider de-veloping policies targeted at improving operation and maintenance of installed PV systems inthe field. This operation and maintenance campaign could be targeted at all pilot and public PVprojects which overlooked a clear operation and maintenance back up strategy in the project im-plementation, for example, the clinics and schools programmes, and the farmer project in theTransvaal. The idea is that before starting new PV project, the mess of old ones has to becleaned up.
Such a programme could at the same time be combined with training local technicians, andraising awareness on the potential of PV among end-users, and train them on how to properlyuse and maintain PV systems. It could also be linked to the PV infrastructure that will be put upby the concessionaires. Stakeholders to be involved in this programme are the concessionaires,PV suppliers, ESKOM, Department of Trade & Industry (DTI), DME, Department of Housing(DoH).
8.3 Actions to promote demonstration and commercial projects
Different demonstration projects have been implemented or are in development. These includeprojects in the field of wind, biomass, solar thermal power and wave energy. Also grid-connected PV and low cost energy efficient housing are being considered. Being not commer-cial viable, these demonstration projects need financial support. This support could be given bythe government or international co-operation. At present, several demonstration projects are al-ready in further stages of development. In the development of a set-aside programme, specialattention should be given to those projects. Opening a tendering procedure under the set-asideprogramme could easily kill these projects, although probably a lot of efforts have been investedalready. One option would be to allow for demonstration elements within the set-aside pro-gramme.
The following actions can be distinguished:
Action 1: Providing financial support• Financing for renewable energy projectsFinancing for renewable energy projects is currently provided via export subsidies and ad hocfunding by the overseas development assistance (ODA). Export subsidies are not considered theappropriate route to stimulate financing of renewable energy technologies in South Africa. Theydo not favour optimal technology assessments, create unfair competition between companiesfrom different EU member states and have a negative impact on developing a local manufac-turing capacity in South Africa.
The other route, via ODA, is characterised by its ad hoc nature. Donors often shift priorities andco-ordination among them is lacking. There could be case for providing such funding on a moresystematic basis by linking EU parties willing to invest in green energy abroad with project op-
ECN-C--01-052 109
portunities in South Africa. This may be formalised through the set-up of a renewable energyfund.
Although many foreign countries are hesitating to provide financial support on project level,South African stakeholders clearly expressed the view that providing financial support is essen-tial for implementing the majority of renewable energy projects. Apart from existing exportsubsidies and the CDM, European governmental bodies should seriously look into the possibil-ity of setting-up a renewable energy fund. This does not necessarily have to be restricted toSouth Africa, but could apply to the whole SADC-region.
• Clean Development Mechanism of the UNFCCC14
Upon entry into force and ratification of the Kyoto Protocol, the possibility will exist to sell CO2
reduction credits from South Africa through the CDM. Considering its excellent fit with theobjectives of this mechanism, renewable energy should play an important role in the CDM ac-tivities of both EU and South Africa. Special concern in this regard is required for off-grid re-newable energy projects.
For off-grid renewable energy projects to be viable within the CDM, the transactions costs oftheir participation must not outweigh the value of Certified Emission Reductions (CERs) theygenerate. In order to keep transaction costs low, CDM eligibility rules should be fit for purposeand CER calculation procedures kept simple. This would be stimulated if the EU, EU memberStates and the Government of South Africa would adopt a special CDM window for off-grid re-newable energy systems under the CDM.
Action 2: Capacity buildingIn order to institutionalise capacity building it is recommended to start a mutual South African -EU programme that could serve as a focal point and match-making platform for different kindof stakeholders. This focal point could also serve to inform about, and eventually to co-ordinateactivities in South Africa conducted bilaterally by different EU countries.
Another part of this action could be to organise an educational programme comprising for ex-ample student exchange, centres of excellence and chairs for renewable energy.
The capacity building programme could include the following areas:
• Building-up technological expertiseThe European Union is actively promoting the implementation of renewable energy. This re-sulted during the past years in many projects being developed and implemented throughout theUnion. Parties involved in these projects have gained expertise and know-how that could bevaluable in South Africa. Specific items, where one could think about are:• integrating renewable technologies in the grid,• technical design aspects of mini-grids,• wind measurements,• local manufacturing of components.
• Building-up expertise on project development and implementationDue to the large amount of renewable energy projects being developed and implemented inEurope, there is large experience with conducting extensive feasibility studies, preparing bank-able business plans, and implementing projects. This experience could be of valuable means forSouth African parties.
14 United Nations Framework Convention on Climate Change.

110 ECN-C--01-052
• Building-up expertise on dissemination of knowledge and informationIn order to promote renewable energy technologies in specific countries or regions, demonstra-tion projects have been implemented with a focus on gaining and disseminating knowledge andinformation. Apart from specific target groups, these demonstration projects were also used inorder to get a broader public acquainted with specific technologies.
Action 3: Providing technologyEurope has well-established renewable energy production facilities. In the field of wind energy,Europe can be regarded as the world market leader. Also biomass technologies are being manu-factured in Europe at a large scale. Wave energy and solar thermal energy technologies are lessmature, but there are a number of European manufacturers involved in developments in thisfield.
This means that Europe can provide technological hardware for projects in South Africa. Thesetechnologies have been exported already world-wide for years and have proved to be suitablefor different climatological conditions. These conditions however change from region to region.Therefore it is recommended to develop joint research and development programmes, aimed ba-sically at adapting EU technologies to (South) African conditions and to analyse possibilities formanufacturing in South Africa.
8.4 Other actions for South African - European co-operation
Some elements of an EU - South African action plan for grid-connected renewables were sug-gested by the participants. EU parties should see this collaboration as a starting point to accessthe SADC market.• disseminate successes and failures within the EU in matters of policy, regulation, market
liberalisation, standards, project implementation, etc.• link EU parties willing to invest in green energy abroad with project opportunities in South
Africa. This may be formalised through the set-up of a renewable energy fund.• organise an educational programme comprising for example student exchange, centres of
excellence and chairs for renewable energy (I would suggest a small survey on existing ini-tiatives to find out whether we should build on them or start something new).
• develop joint research and development programmes, aimed basically at adapting EU tech-nologies to (South) African conditions.
• analyse possibilities for manufacturing in South Africa,• research successes and failures of renewables in South Africa by EU parties.
ECN-C--01-052 111
REFERENCES
Annecke, W., 1999: Non-Economic Determinants of Energy Use in Rural Areas of South Africa.EDRC-NREL.
Annecke, W., 1998: Integrated energy supply in the context of the rural electrificationprogramme. EDRC, University of Cape town.
Banks, D.I., J. Willemse and M. Willemse, 2000: Energy Services to Rural Areas: An integratedApproach, Rural Area Power Solutions (Pty) Ltd., Glenstantia.
CSIR, Garrad Hassan and ECN, 2000: Renewable Energy for Rural Electrification in EasternCape, Garrad Hassan and Partners, European Commission, Joule-Thermie Programme.
Department of Minerals and Energy (DME), 1998: White Paper on Energy Policy, Departmentof Minerals and Energy, www.dme.gov.za/energy/whitepaper1998.htm.
Department of Minerals and Energy (DME), 2000a:www.dme.gov.za/energy/restructuring_of_the _electricity.htm.
Department of Minerals and Energy (DME), 2000b:www.dme.gov.za/energy/directorate-challenges.htm.
Department of Minerals and Energy (DME), 2000c: NECC Status Report No.2, Department ofMinerals and Energy, Pretoria.
Department of Minerals and Energy (DME), 2000d: Implementation Strategy for RenewableEnergy in South Africa, Draft 2, Department of Minerals and Energy, Pretoria.
Danish Co-operation for Environment and Development (DANCED), 2001: Bulk RenewableEnergy Independent Power Producers in South Africa, DANCED, Denmark.
Davis, M., N. Wamukonya, 1999: Capacity Building in CDM Project Activities, South Africa.,Energy & Development Research Centre, University of Cape Town.
Energize, 2000: ENERGIZE EE-Mail List, [email protected], www.ee.co.za, June 26, 2000.
ESKOM, 2000b: www.sabre-gen.co.za - October 2000.
ESKOM, 2000c: personal communication with Mr. Kevin Nassiep of the Corporate TechnologyGroup of ESKOM, Johannesburg, 2000.
ESKOM, 2000d: personal communication with Mrs. L. Kok of ESKOM Enterprises -TSI/DRET, Johannesburg, 2000.
ESKOM, 2000e: personal communication with Mr. L. van Heerden of ESKOM Enterprises -TSI/DRET, Johannesburg, 2000.
ESKOM, 2000f: personal communication with Mr. B. Scott of ESKOM Enterprises -TSI/DRET, Johannesburg, 2000.
ESKOM, 2000g: personal communication with Mr. M. Bipath of ESKOM Enterprises -TSI/DRET, Johannesburg, 2000.
European Commission, 2000a: General Guidelines for Interventions to be Financed Under theEnvironment in Developing Countries (Budget line B7–6200) in 2000 And 2001,European Commission, Brussels.
European Commission, 2000b: Theme A.2-3, Climate Change - CDM, Budget B7-8110,European Commission, Brussels.

112 ECN-C--01-052
European Commission, 2000c: EU policies and measures to reduce greenhouse gas emissions:Towards a European Climate Change Programme (ECCP), European Commission,Brussels.
GEF, 1996a: Operational Strategy, Global Environment Facility. Washington D.C.
GEF, 1996b: Operational Programmes, Global Environment Facility, Washington D.C.
Gwagwa, 2000: Facilitating economic development in rural areas based on the energisationstrategy (IDT competencies and inputs), Workshop paper for Independent DevelopmentTrust at People’s Power Workshop, World Bank/DME, Mid Rand.
Howell M.I., 1999: Baseline And Greenhouse Gas Mitigation Options For Bulk Energy Supply,Energy Research Institute, University of Cape Town.
Kotzé, S., 2000: ‘The South African National Electrification Programme: Past lessons andfuture prospects’, Proceedings of ISES 2000 Utility Initiative for Africa: Ruralelectrification in Africa, Midrand, South Africa.
Kühn, I., G.J. Schaeffer, M.H. Voogt, and C. Crookall-Fallon, 1999: How to improve theframework and design of national policies for the promotion of renewable electricity,Observations on Germany, the Netherlands and the U.K., Final Paper, RenewableElectricity and Liberalising Markets (REALM), Working Group III.
Martinot, E., A. Cabraal, S. Mathur, 2000: ‘World Bank/GEF solar home system projects:experiences and lessons learned 1993 - 2000’, Renewable & Sustainable energyreviews.
Martinot, E., R. Ramankutty, F. Ritter, 2000: ‘Thematic Review of the GEF Solar PV Portfolio:Emerging experience and lessons’, GEF Working Paper, draft June 2000, GEF,Washington D.C.
Martinot, E., Kilian Reiche, 2000: ‘Regulatory approaches to rural electrification and renewableenergy: Case studies from six developing countries’, World Development.
Morris, Glynn, 2000: Personal communication, August 2000.
National Electricity Regulator (NER), 2000a: Electricity Supply Statistics for South Africa,1999, NER, Pretoria.
National Electricity Regulator (NER), 2000b: Regulatory Framework for Non-GridsElectrification in the Republic of South Africa, NER, Pretoria.
Nieuwenhout, F.D.J. et al., 2000: Monitoring and Evaluation of Solar Home Systems,Experiences with applications of solar PV for households in developing countries,Energy Research Centre of the Netherlands, report ECN-C--00-089.
Patel, Yusuf, 2000: ‘The role of Integrated Development Plans (IDPs) in Rural Energisation’,Department of Provincial and Local Government, People’s Power Workshop, WorldBank/DME, Mid Rand.
RISØ National Laboratory, 1999: African Perspectives on the Clean Development Mechanism,RISØ, Roskilde, Denmark.
Schaeffer, G.J., M.G. Boots, T. Anderson, C. Mitchell, C. Timpe, and M. Cames, 1999: TheImplications of Tradable Green Certificates for the Deployment of RenewableElectricity, Mid-Term Report, ECN-C--99-072.
Stassen G., D. Holm, 1996: An overview of PV, windpower, solar water heating and smallhydropower supply industries in South Africa up to 1994/5, Journal of Energy in SouthAfrica, vol. 8, nr.2.
Thom, C., W. Annecke and J. Mavhungu, 2000: Review of South Africa’s rural electrificationstrategy, EDRC, September 2000.

ECN-C--01-052 113
Ybema, J.R., P. Kroon, T.J. de Lange en G.J. Ruig, 1999: The contribution of renewable energyin The Netherlands until 2020 (in Dutch), ECN-C--99-053, Petten, The Netherlands.
Ybema, J.R., J. Cloin, F.D.J. Nieuwenhout, A.C. Hunt, S.L. Kaufman, 2000: Towards aStreamlined Process for Solar Home Systems: Emission Reductions from implementedsystems and development of standardised baselines, Netherlands Energy ResearchFoundation ECN, ECN-C-00-109.
UNFCCC, 2000a: United Nations Framework Convention on Climate Change, www.unfccc.int,September 2000.
UNFCCC 2000b: The Kyoto Protocol to the Convention on Climate Change, www.unfccc.int,September 2000.
UNFCCC 2001: Note by the president - CoP.6, www.unfccc.int, January 2001.