Embed Size (px)
Citation preview

January 2008
Accelerated Release: A Literature Review
Carolina GuzmanBarry KrisbergChris Tsukida
FOCUSViews from the National Council on Crime and Delinquency
IntroductionThe incarceration rate in our nation is by far the high-est in the world at over 700 per 100,000 citizens. Most European nations have rates less than 175. The impact on communities—and the hardest hit are communi-ties of color—is devastating. High incarceration rates often lead to prison overcrowding. One way to address this overcrowding is through accelerated release pro-grams. In accelerated release programs, eligible prisoners may be released ahead of their sentenced release dates through the application of good time credit, intense community supervision, or other methods. Accelerated release programs have been implemented throughout the country in different ways and at different times. They have always been confronted with opposition by critics who claim that accelerated release poses a threat to public safety.
NCCD conducted a review of published studies to examine the accuracy of that assumption. This FOCUS presents the ndings of this literature review.
MethodsThis literature review included more than 12 peer-re-viewed articles, dissertations, state reports, policy-related reports, and national data reports, all of which evaluate accelerated release programs and their impact on public safety. The programs took place at various times over a 23-year period and in a number of states and cities in the US and Canada. The reports draw on data from 1981 to 2004.
Using a variety of databases—Rutgers University’s Don Gottfredson Criminal Justice Library, the National Insti-tute of Corrections Information Center, and the Na-tional Criminal Justice Reference Service—we searched for relevant articles in peer-reviewed publications, monographs, and state reports from 1980-2007. The search terms used singly and in combination were: early release, prison population caps, recidivism, public safety, and effect. This review covers the studies found that re-port on the impact of accelerated release on recidivism, excluding those with unspeci ed methods.
Views from the National Council on Crime and Delinquency January 20082
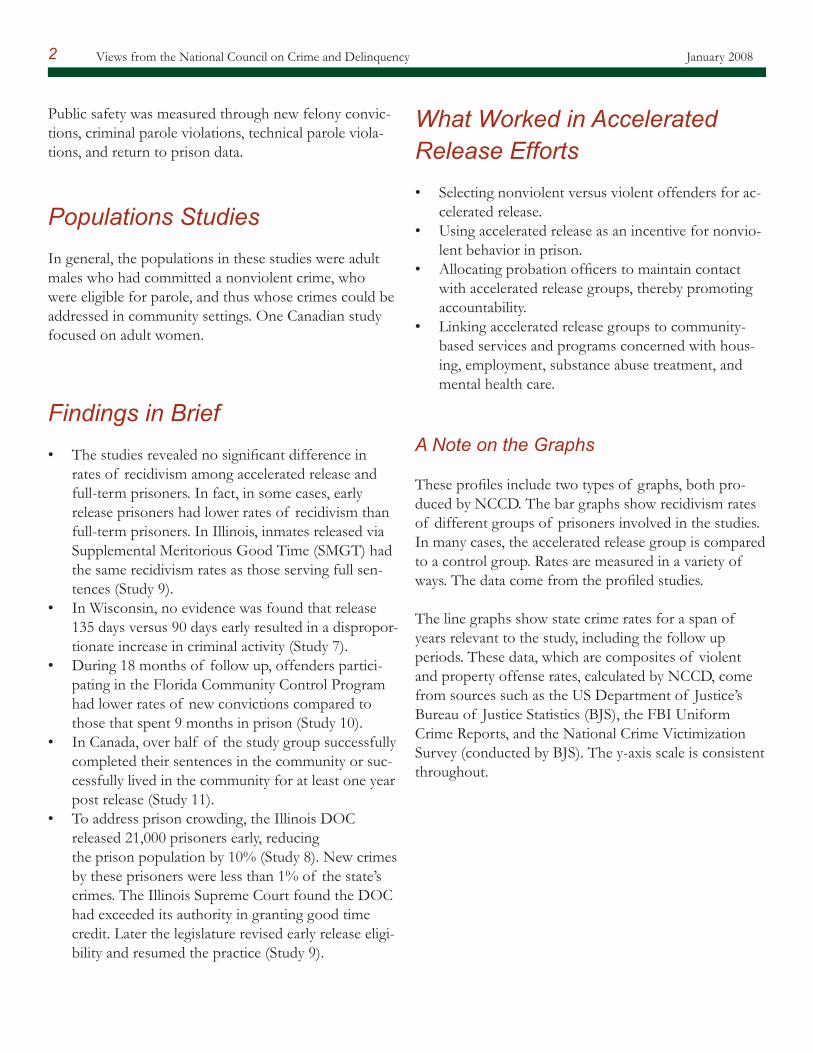
Public safety was measured through new felony convic-tions, criminal parole violations, technical parole viola-tions, and return to prison data.
Populations StudiesIn general, the populations in these studies were adult males who had committed a nonviolent crime, who were eligible for parole, and thus whose crimes could be addressed in community settings. One Canadian study focused on adult women.
Findings in BriefThe studies revealed no signi cant difference in rates of recidivism among accelerated release and full-term prisoners. In fact, in some cases, early release prisoners had lower rates of recidivism than full-term prisoners. In Illinois, inmates released via Supplemental Meritorious Good Time (SMGT) had the same recidivism rates as those serving full sen-tences (Study 9).In Wisconsin, no evidence was found that release 135 days versus 90 days early resulted in a dispropor-tionate increase in criminal activity (Study 7).During 18 months of follow up, offenders partici-pating in the Florida Community Control Program had lower rates of new convictions compared to those that spent 9 months in prison (Study 10).In Canada, over half of the study group successfully completed their sentences in the community or suc-cessfully lived in the community for at least one year post release (Study 11).To address prison crowding, the Illinois DOC released 21,000 prisoners early, reducing the prison population by 10% (Study 8). New crimes by these prisoners were less than 1% of the state’s crimes. The Illinois Supreme Court found the DOC had exceeded its authority in granting good time credit. Later the legislature revised early release eligi-bility and resumed the practice (Study 9).
•
•
•
•
•
What Worked in Accelerated Release Efforts
Selecting nonviolent versus violent offenders for ac-celerated release.Using accelerated release as an incentive for nonvio-lent behavior in prison.Allocating probation of cers to maintain contact with accelerated release groups, thereby promoting accountability.Linking accelerated release groups to community-based services and programs concerned with hous-ing, employment, substance abuse treatment, and mental health care.
A Note on the Graphs
These pro les include two types of graphs, both pro-duced by NCCD. The bar graphs show recidivism rates of different groups of prisoners involved in the studies. In many cases, the accelerated release group is compared to a control group. Rates are measured in a variety of ways. The data come from the pro led studies.
The line graphs show state crime rates for a span of years relevant to the study, including the follow up periods. These data, which are composites of violent and property offense rates, calculated by NCCD, come from sources such as the US Department of Justice’s Bureau of Justice Statistics (BJS), the FBI Uniform Crime Reports, and the National Crime Victimization Survey (conducted by BJS). The y-axis scale is consistent throughout.
•
•
•
•

Views from the National Council on Crime and DelinquencyJanuary 2008 3
Early Release: Prison Overcrowding and Public Safety Implications
Sims, B., O’Connell, J.Washington State Of ce of Financial Management
Olympia, Washington1979-1983
Study group size: 1,674Inmates released an average of 6 months before their expected release dates.
Comparison group size: 1,867Inmates released during the 12 months prior to the rst early release program.
Method: This court-mandated, longitudinal study compares early-release cohorts to a historical comparison group of inmates released between July, 1978, and July, 1979.
The effect of accelerated release on public safety, as measured by recidivism rates of those inmates, is measured at one, two, and three years following release and compared with a historical com-parison group. The graph shows year one recidivism rates.
Summary: The state of Washington’s rst accelerated release programs to attempt to control inmate population size started in 1979. During accelerated release efforts, inmates were paroled prior to their sentence dates at the discretion of the state Board of Prison Terms and Paroles. Starting in 1982, legislation prohib-ited accelerated release of inmates convicted of treason, any class-A felony, or inmates found to be sexual psychopaths. In 1983 the law was amended to prohibit the accelerated release of inmates legally de ned as violent offenders.
1
12%12%
0%
20%
40%
60%
80%
100%
Study Comparison
Rec
idiv
ism
Rat
e
3500
4500
5500
6500
7500
8500
9500
1977 1978 1979 1980 1981 1982 1983 1984 1985 1986 1987 1988
Inde
x C
rimes
per
100
,000
Res
iden
tsStudy Period
Views from the National Council on Crime and Delinquency January 2008
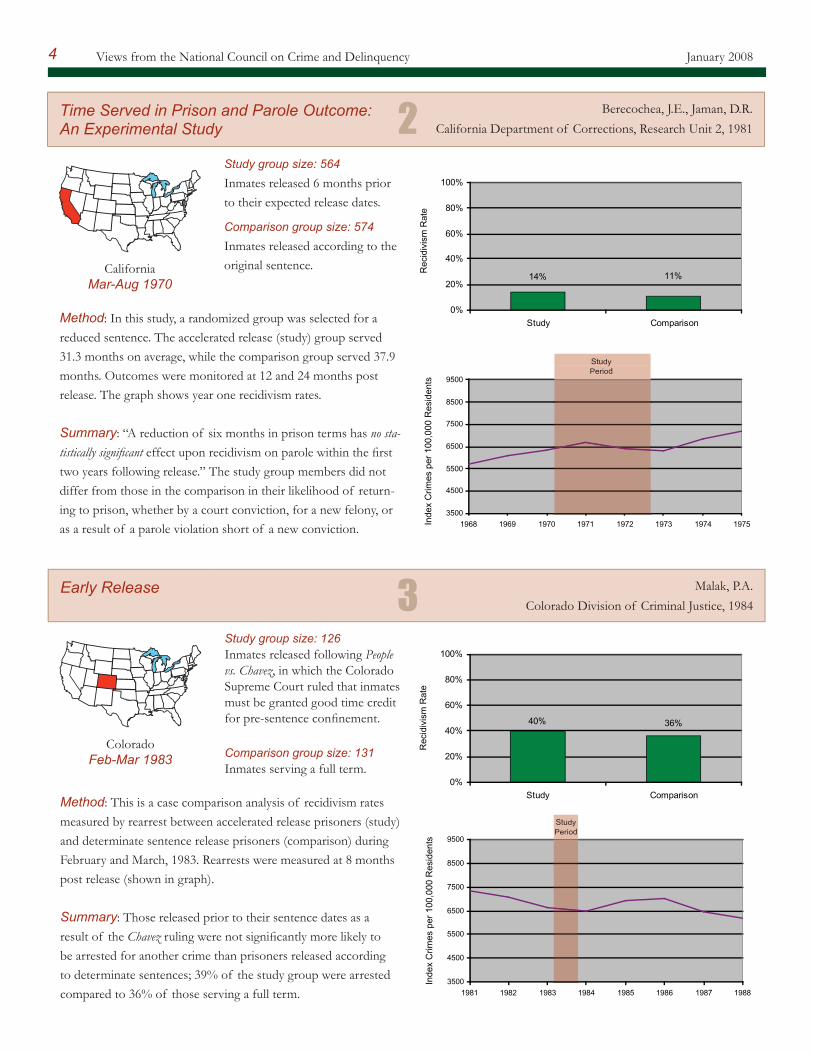
Early Release Malak, P.A.Colorado Division of Criminal Justice, 1984
ColoradoFeb-Mar 1983
Study group size: 126Inmates released following People vs. Chavez, in which the Colorado Supreme Court ruled that inmates must be granted good time credit for pre-sentence con nement.
Comparison group size: 131Inmates serving a full term.
Method: This is a case comparison analysis of recidivism rates measured by rearrest between accelerated release prisoners (study) and determinate sentence release prisoners (comparison) during February and March, 1983. Rearrests were measured at 8 months post release (shown in graph).
Summary: Those released prior to their sentence dates as a result of the Chavez ruling were not signi cantly more likely to be arrested for another crime than prisoners released according to determinate sentences; 39% of the study group were arrested compared to 36% of those serving a full term.
4
Time Served in Prison and Parole Outcome: An Experimental Study
Berecochea, J.E., Jaman, D.R.California Department of Corrections, Research Unit 2, 1981
CaliforniaMar-Aug 1970
Study group size: 564Inmates released 6 months prior to their expected release dates.
Comparison group size: 574Inmates released according to the original sentence.
Method: In this study, a randomized group was selected for a reduced sentence. The accelerated release (study) group served 31.3 months on average, while the comparison group served 37.9 months. Outcomes were monitored at 12 and 24 months post release. The graph shows year one recidivism rates.
Summary: “A reduction of six months in prison terms has no sta-tistically signi cant effect upon recidivism on parole within the rst two years following release.” The study group members did not differ from those in the comparison in their likelihood of return-ing to prison, whether by a court conviction, for a new felony, or as a result of a parole violation short of a new conviction.
2
3
11%14%
0%
20%
40%
60%
80%
100%
Study Comparison
Rec
idiv
ism
Rat
e
40% 36%
0%
20%
40%
60%
80%
100%
Study Comparison
Rec
idiv
ism
Rat
e
3500
4500
5500
6500
7500
8500
9500
1981 1982 1983 1984 1985 1986 1987 1988
Inde
x C
rimes
per
100
,000
Res
iden
ts
Study Period
3500
4500
5500
6500
7500
8500
9500
1968 1969 1970 1971 1972 1973 1974 1975Inde
x C
rimes
per
100
,000
Res
iden
ts
Study Period

Views from the National Council on Crime and DelinquencyJanuary 2008
3500
4500
5500
6500
7500
8500
9500
1988 1989 1990 1991 1992 1993 1994 1995 1996 1997 1998
Inde
x C
rimes
per
100
,000
Res
iden
ts
Study Period
Results of Early Release: Study Prompted by Passage of HB 685
Leonardson, G.Montana Board of Crime Control, 1997
Montana1990-1993
Study group size: 667The Montana legislature enacted HB 685 to cap the prison population, in part by decreasing the average time spent in prison.
Method: This study draws on historical information on persons in the accelerated release, regular parole, or community probation (“intensive supervision program”). All were surveyed after 12 months of supervision.
Summary: After 12 months, 40% of the accelerated release group was sent back to prison, compared to 36% of the regular parole prisoners. Furthermore, the community probation recidi-vism rate was 25%.
5
4
Release Outcome Study: Early Mandatory Release
Eisenberg, M.State of Texas Board of Pardons and Paroles,
Division of Budget and Planning, 1985
Texas
Jan-Jun 1983
Study group size: 2,07255% were parolees, 16% were mandatory release cases, and 29% were early mandatory release cases (Board authority to release selected inmates up to 180 days early).
Method: This was a systematic review of a sample of cases released from the Texas Department of Corrections between January and June, 1983. All released prisoners were monitored one year post release.
Summary: The return rate to the Department of Corrections was similar among the mandatory release and early mandatory release cases. A large percentage of early mandatory release cases with reports of violations or arrests did not result in a return to prison.
5
25%
40% 36%
0%
20%
40%
60%
80%
100%
Accelerated Release Regular Parole Community Probation
Rec
idiv
ism
Rat
e
16% 17%13%
0%
20%
40%
60%
80%
100%
Parole Mandatory Release Early MandatoryRelease
Ret
urne
d to
Pris
on
With
in O
ne Y
ear
3500
4500
5500
6500
7500
8500
9500
1981 1982 1983 1984 1985 1986
Inde
x C
rimes
per
100
,000
Res
iden
ts
Study Period

Views from the National Council on Crime and Delinquency January 20086
Identifying Parole Candidates among Mandatory Release Inmates
Wisconsin Department of Health and Social ServicesWisconsin Parole Board, 1984
Wisconsin1980-1982
Study group size: 1,433Inmates released through discretionary parole.
Comparison group size: 1,867Inmates released through manda-tory release program.
Method: This study was conducted by selecting inmates with characteristics considered ideal for discretionary parole. Of the comparison group, 85% were released on their mandatory dates. The other 15% were released 90 days early through the Special Action Release Program.
Summary: Inmates who received the discretionary parole (study group) were much less likely to be returned to prison for criminal activity during the one-year follow up period than inmates who received a mandatory release (comparison group).
6
Special Action Release: Three Year Follow Up
Wisconsin Department of Health and Social ServicesWisconsin Division of Corrections, 1985
Wisconsin
1981
90-day group: 606Prisoners released 90 days early earned under Special Action Release. 135-day group: 286Prisoners released 135 days early earned under Special Action Release.
Method: This is a case comparison among two Special Action Release (SAR) groups: 90-day accelerated release and 135-day accelerated release. Behavior was observed 6 and 12 months post release. SAR was meant to reduce institutional crowding through the release of carefully selected prisoners.
Summary: No evidence was found that accelerated release exten-sion from 90 to 135 days resulted in a corresponding increase in criminal activity.
7
28%17%
0%
20%
40%
60%
80%
100%
Study Group Comparison Group
Rec
idiv
ism
Afte
rO
ne Y
ear
25%20%
0%
20%
40%
60%
80%
100%
90 day 135 day
Rec
idiv
ism
Afte
r13
5 D
ays
3500
4500
5500
6500
7500
8500
9500
1983 1985 1987 1989 1991 1993 1995 1997Inde
x C
rimes
per
100
,000
Res
iden
ts
Study Period
3500
4500
5500
6500
7500
8500
9500
1983 1985 1987 1989 1991 1993 1995 1997Inde
x C
rimes
per
100
,000
Res
iden
ts
Study Period

Views from the National Council on Crime and DelinquencyJanuary 2008 7
Using Early Release to Relieve Prison Crowding: A Dilemma in Public Policy
Austin, J.Crime and Delinquency, Vol. 32 No.4, October, 1986
Illinois
1979-1983
Study group size: 1,202Inmates released during accelerated release period.
Comparison group size: 355Inmates who served their full terms.
Method: This was a longitudinal study of a random sample of prisoners in accelerated release programs and those completing full terms. Almost 21,000 prisoners were released over 3 years.
Summary: Prisoners released early did not have a higher prob-ability of arrest or return to prison than those who had served a full prison term. Institutional conduct, severity of current offense, prior criminal history, and age at release were better predictors of recidivism. By 1983 the Illinois prison population was reduced by approximately 2,500 as a direct result of early release.
8
The Effectiveness of Reduced Prison Terms on Public Safety and Cost: Evaluation of the Illinois Supplemental Meritorious Good Time Program
Austin, J., Boylard, M.National Council on Crime and Delinquency, 1993
Illinois1990
Study group size: 4,640Inmates who were awarded Supplemental Meritorious Good Time (SMGT, 180 days). Comparison group size: 251Inmates who received Meritorious Good Time (MGT, 90 days).
Method: This was a random review of cases of inmates awarded (SMGT) by December, 1990. Cases were monitored for arrests or returns to prison, for both new crimes and violations of parole, during 12 months post release.
Summary: There was very little difference in the return-to-prison rates between the MGT and SMGT samples. The vast majority of the rearrests were for nonviolent misdemeanors.
9
49%42%
0%
20%
40%
60%
80%
100%
Early Release Complete Term
Arr
este
d or
Ret
urne
d to
Pris
on
17% 17%
0%
20%
40%
60%
80%
100%
SMGT MGT
Rec
idiv
ism
Rat
eA
fter 1
8 M
onth
s
3500
4500
5500
6500
7500
8500
9500
1987 1988 1989 1990 1991 1992 1993 1994 1995
Inde
x C
rimes
per
100
,000
Res
iden
ts
Study Period
3500
4500
5500
6500
7500
8500
9500
1978 1979 1980 1981 1982 1983 1984 1985 1986 1987 1988
Inde
x C
rime
per 1
00,0
00 R
esid
ents
Study Period

Views from the National Council on Crime and Delinquency January 2008
Evaluation of the Florida Community Control Program
Wagner, D., Baird, C.National Institute of Justice, 1993
Florida1985
Study group size: 630Cases of defendants who were placed on FCCP. Comparison group: 630Cases of defendants who were sentenced to prison.
Method: The Florida Community Control Program (FCCP), rst implemented in 1983, is an intensive supervision, house ar-rest, prison diversion program designed to alleviate institutional crowding while ensuring public safety. Cases were monitored 18 months post release.
Summary: After 18 months, only 20% of the FCCP group was convicted of a new offense, compared to 24% of similar offend-ers who spent an average of nine months in prison. This pro-gram was most effective for drug offenders; only 11% of drug offenders sentenced to FCCP were convicted of new offenses, compared to 27% of those sent to prison.
10
8
Predictors of Conditional Release among Substance Abusing Women Offenders
Verbrugge, R., Nunes, K., Johnson, S., Taylor, K.Correctional Service of Canada, 2002
Canada2002
Study group 1 size: 353Prisoners granted a conditional release and placed on day parole.
Study group 2 size: 41Prisoners granted a conditional release and placed on full parole.
Comparison group size: 89Prisoners released on their statutory release dates.
Summary: Revocation was de ned as admission to federal custody after conditional release and before warrant expiry. At the end of the follow-up period, of those prisoners that com-pleted their sentences in the community, in both study groups combined, 52% had remained out of prison after one year.
Method: This is a case review of women who were serving or had recently served federal sentences under the supervision of the Correctional Service of Canada. Conditional release was day parole, full parole, and statutory release.
11
46%54% 53%
0%
20%
40%
60%
80%
100%
Day Parole Full Parole Released at StatutoryDate
Rec
idiv
ism
Rat
e A
fter O
ne Y
ear
24% 20%
0%
20%
40%
60%
80%
100%
Prison Group FCCP
Rec
idiv
ism
Rat
e A
fter 1
8-M
onth
s
3500
4500
5500
6500
7500
8500
9500
1983 1984 1985 1986 1987 1988 1989 1990
Inde
x C
rimes
per
100
,000
Res
iden
ts
Study Period
Views from the National Council on Crime and DelinquencyJanuary 2008
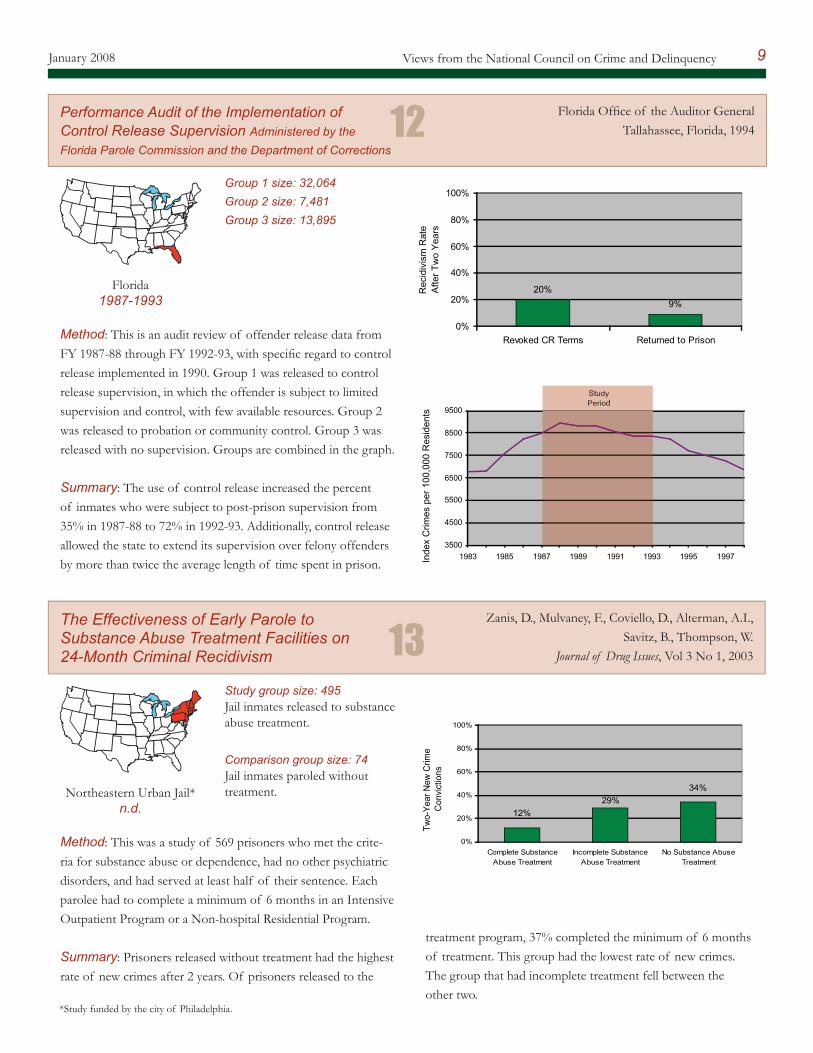
Performance Audit of the Implementation of Control Release Supervision Administered by the Florida Parole Commission and the Department of Corrections
Florida Of ce of the Auditor GeneralTallahassee, Florida, 1994
Florida1987-1993
Group 1 size: 32,064Group 2 size: 7,481Group 3 size: 13,895
Method: This is an audit review of offender release data from FY 1987-88 through FY 1992-93, with speci c regard to control release implemented in 1990. Group 1 was released to control release supervision, in which the offender is subject to limited supervision and control, with few available resources. Group 2 was released to probation or community control. Group 3 was released with no supervision. Groups are combined in the graph.
Summary: The use of control release increased the percent of inmates who were subject to post-prison supervision from 35% in 1987-88 to 72% in 1992-93. Additionally, control release allowed the state to extend its supervision over felony offenders by more than twice the average length of time spent in prison.
12
9
The Effectiveness of Early Parole to Substance Abuse Treatment Facilities on 24-Month Criminal Recidivism
Zanis, D., Mulvaney, F., Coviello, D., Alterman, A.I., Savitz, B., Thompson, W.
Journal of Drug Issues, Vol 3 No 1, 2003
Northeastern Urban Jail*n.d.
Study group size: 495Jail inmates released to substance abuse treatment.
Comparison group size: 74 Jail inmates paroled without treatment.
treatment program, 37% completed the minimum of 6 months of treatment. This group had the lowest rate of new crimes. The group that had incomplete treatment fell between the other two.
Method: This was a study of 569 prisoners who met the crite-ria for substance abuse or dependence, had no other psychiatric disorders, and had served at least half of their sentence. Each parolee had to complete a minimum of 6 months in an Intensive Outpatient Program or a Non-hospital Residential Program.
Summary: Prisoners released without treatment had the highest rate of new crimes after 2 years. Of prisoners released to the
13
29%12%
34%
0%
20%
40%
60%
80%
100%
Complete SubstanceAbuse Treatment
Incomplete SubstanceAbuse Treatment
No Substance AbuseTreatment
Two-
Yea
r New
Crim
e C
onvi
ctio
ns
*Study funded by the city of Philadelphia.
20%9%
0%
20%
40%
60%
80%
100%
Revoked CR Terms Returned to Prison
Rec
idiv
ism
Rat
eA
fter T
wo
Yea
rs
3500
4500
5500
6500
7500
8500
9500
1983 1985 1987 1989 1991 1993 1995 1997Inde
x C
rimes
per
100
,000
Res
iden
ts
Study Period


![SECURITIES AND EXCHANGE COMMISSION 17 CFR ...Release No. 33-8392 (Feb. 24, 2004) [69 FR 9722] for compliance dates applicable to accelerated filers. See Release No. 33-8760 (Dec. 15,](https://img.dokumen.tips/doc/110x75/6136a0ab0ad5d20676482574/securities-and-exchange-commission-17-cfr-release-no-33-8392-feb-24-2004.jpg)


![M Series Compact Excavator Literature 1st Release 2009 [1]](https://img.dokumen.tips/doc/110x75/577cc67a1a28aba7119e56b3/m-series-compact-excavator-literature-1st-release-2009-1.jpg)