Embed Size (px)
Citation preview

1
Accelerated Migration of Bur Oak Ecotypes for Climate Resilience Final Report. July 18, 2018
Lee E. Frelich
Director, University of Minnesota Center for Forest Ecology
Ryan Toot
Graduate student, University of Minnesota Natural Resources Science and Management program
Acknowledgement
Funding for this project was provided by the Minnesota Environment and Natural Resources
Trust Fund as recommended by the Legislative‐Citizen Commission on Minnesota Resources
(LCCMR).
Introduction
Climate change will affect future ecological restoration activities—different plants and ecotypes
may be best suited for Minnesota’s future climate than the current local ecotype and vegetation.
Because of our fragmented environment and distance and rate at which species will need to
travel to keep up with climate change, new plant species and ecotypes are unlikely to be able to
get here on their own (Galatowitsch, Frelich and Phillips-Mao 2009). Invasive species with
superior dispersal abilities could dominate future vegetation. Therefore, accelerated migration of
neonative species and ecotypes may be needed. Trees, with their low natural rate of migration
and slow life cycles, are especially in need of human assisted accelerated migration. Oaks are
among the most important mast and habitat trees in Minnesota, and the foundation species in
several of our native plant communities such as oak savanna and woodland. To maintain oak
trees in Minnesota’s future, the appropriate ecotype must be determined; this study will be a
vanguard study to identify appropriate bur oak ecotypes for Minnesota’s new climate.
Bur oak is intolerant of shade, casts low density shade, and is a poor competitor under conditions
that allow mesic tree species like sugar maple, red oak and basswood to thrive, but is a good
competitor on droughty sites or sites with frequent fire. It was historically abundant on savannas
and open woodlands mixed with other oaks (red, white, black) with frequent fires that kept
aggressive competitors at bay (Johnson 1990), it occurs as an occasional tree in northern
hardwood stands (Curtis 1959; Frelich, Montgomery and Oleksyn 2015). The species can survive
as grubs that are repeatedly top killed by fires (possibly for several centuries), but can sprout and
become a tree if an interval of several years without a fire occurs (Curtis 1959). Due to
development of thick bark at a relatively young age, the species can survive frequent surface
fires, and is the most fire tolerant of all oak species in the Midwest (Frelich, Reich and Peterson
2015). Bur oak also occurs as riparian species in major river systems, occupying areas that are
subject to short duration flooding events (2-3 weeks) just above the zone occupied by
cottonwood, silver maple and black willow where floods are of long duration. Bur oak had high
survivorship after 3-5 weeks of flooding, but growth was retarded compared to cottonwood and
swamp white oak (Kabrick et al 2012).

2
Bur oak trees can survive for 200-400 years, and are used for long-term tree-ring chronologies; a
chronology exists that spans years 912-2004 in the Midwest, with the possibility of eventually
going back 10,000+ years using fossil wood preserved in sediments (Stambaugh and Guyette
2009). The species is very resistant to wind damage, due to low branching and low center of
gravity, flexible wood, and low density crowns that don’t provide much surface area for the wind
to push on (Frelich and Ostuno 2012). The species is also less subject to road salt damage than
other oaks, especially red oak (Singh and Stasolla 2016).
Perhaps the most important characteristic of bur oak that makes it a good species for a warmer
future, is its resistance to heat waves and droughts. Trees are capable of obtaining most of their
water from water tables 6-7 m below the surface (Chimner et al. 2014). Bur oak is more drought
resistant than red oaks with lower mortality rates during an extreme drought (1987-1989) at
Cedar Creek Ecosystem Science Reserve (Faber-Langendoen and Tester 1993). Tree-ring-based
reconstructions of native savannas has shown that bur oak seedlings can become established
during severe droughts, such as during the 1930s (Ziegler et al. 2008).
Even if the mesic northern hardwoods are wiped out across the Midwest by the combined effects
of increasing temperatures, longer growing seasons, more droughts, storms, fires, invasive tree
diseases and pests, and earthworm invasion, oaks will still be able to grow throughout much of
the region (Frelich and Reich 2010). Increased fire in the future may help species like bur oak
replace northern conifer and shade-tolerant northern hardwoods in a warming climate (He,
Mladenoff and Gustafson 2002).
Conservation Issues
Relatively little ecologically intact bur oak savanna or woodland remains in the Midwest today
(Nuzzo 1986). There is a lot of evidence for the oak and fire hypothesis, that oaks require fire to
reproduce abundantly (Frelich et al 2015). Exclusion of fire by suppression and fragmentation of
the landscape since the early 1900s, has allowed mesophication of oak forests (Nowacki and
Abrams 2008). Mesophication results from a combination of fire exclusion, wetter summer
climate in recent years, invasion by mesic hardwood species like maple that cast dense shade and
keep the understory more moist, reinforcing fire exclusion. In some locations, changes in water
table due to climate and landuse change favor invasion by tree species (e.g. elms) that prefer very
wet conditions (Asbjornsen et al 2007). A few extremely dry, sandy sites are somewhat of an
exception to the general rule that bur oak stands have been mesophied, although even on these
sites, some woody encroachment has occurred (Dickie et al 2007, Peterson and Reich 2001).
Another issue of concern is invasion of bur oak savannas and woodlands by the exotic shrubs
common buckthorn (Rhamnus cathartica), Tatarian honeysuckle (Lonicera tatarica), and others
that follow European earthworm invasion (Frelich et al 2006). Indeed, there is a substantial two-
way facilitation between European earthworms and buckthorn (Roth et al 2015). These invasive
shrubs are more aggressive in bur oak stands as compared to other under oak species (Schulte et
al 2011).
3
A third issue of concern for bur oak conservation is potential effects of genetic isolation of the
remaining stands. However, evidence for this concern is mixed. Oaks in general have high rates
of gene flow due to wind-dispersed pollen, and avian and mammal seed dispersal (Gerber et al.
2014). For bur oak, average pollination distance was found to be 42-70 meters within stands,
with substantial proportions of pollination originating from outside of stands, well over 100
meters away 9Craft and Ashley 2010). Seed distribution is very good for a relatively large-
seeded species, especially for northern ecotypes with small acorns that can be moved up to 2 km
by Bluejays (Darely-Hill and Johnson (1981). Temperature and rainfall constrain acorn size, so
that acorns are smaller in north and quite large in the south (Koenig et al. 2009). Bluejays
probably cannot disperse acorns from bur oaks in Iowa and southward (due to acorns being too
large to hold in their beaks), leading to concern that southern ecotypes will not be able to move
northwards very fast on their own. In Illinois, half of all acorns fall straight down under the
crown of parent tree, but some are dispersed 100-165 m (Dow and Ashley 1996). To sum up,
there is some genetic connectivity among isolated bur oak stands (Craft and Ashley 2010) and no
genetic structure was fund in isolated bur oak savanna remnants scattered over 160 km was
found in Illinois (Craft and Ashley 2007), implying that adequate gene flow is occurring even
when stand are several miles apart. However, more extreme isolation in bur oak remnants along
the along the Minnesota River in southern Minnesota apparently has had some effect on gene
flow among bur oak stands (Kittelson et al 2009). There is no evidence that proves that bur oak
will be able to respond through natural movement of pollen and seeds, to the large geographical
magnitude of shift in climate expected to occur over the next century in the Midwest.
Why plant bur oaks now?
The increasing desirability of restoring native vegetation, the suitability of bur oak for a future
warmer climate in the Midwest, and the conservation problems related to fragmentation, lack of
fire, invasive species, and climate change that is too rapid for most tree species to respond to,
have all led to the great interest in planting oaks and learning about the success of planting
techniques at this time. In addition, competition with herbaceous old field vegetation and limited
mycrorrhizal infection more than 20 m from existing oak stands both limit bur oak invasion into
fields from nearby forest stands (Dickie et al. 2007), and planting oaks can get around these
difficulties.
Bur oak stands have been especially hard hit by land use conversion for agriculture, fire
exclusion and invasion by native and exotic species (Marcum 2010, Schulte et al. 2011), At the
same time, oaks are likely to fare better than mesic hardwood species with the future warming
climate (Frelich, Montgomery and Oleksyn 2015). The niche of oak on the landscape—the
proportion of sites where it can compete—will increase with a warmer climate, or with the
restoration of fire (Frelich and Reich 2002). Climate is likely to change faster than rate at which
this species can move (Iverson et al 2011).
Finally, although provenance trials (where seeds or seedlings from several locations are planted
in a common garden) have been conducted for many tree species, a search of the literature
(Johnson 1990 plus searches in USDA Forest Service TreeSearch and Web of Science) does not
reveal any such trials for bur oak. This is probably because bur oak is mostly of ecological

4
importance and historically has not been a big player economically in the forest industry.
Therefore, this experiment (described in detail below) should yield valuable information about
bur oak, one of the most ecologically important tree species in the Midwest.
Bur oak and climate projections
Climate envelope models attempt to predict where a given species of tree will grow under a
future, warmer climate (Prasad et al 2007-ongoing, Iverson et al 2008). They do this by taking
information on precipitation and temperature for the growing season (May-September) at the
edges of the range, and projecting the new geographic locations where those same combinations
of climatic variables would fall in the projected future climate.
The problem with bur oak is that there is little projected movement, because the range spans
from the Gulf of Mexico in Texas to Lake Winnipeg in Manitoba, Canada (Figure 1). Therefore,
the species shows little sensitivity to climatic warmth in the climate envelope model (Figure 2),
and a 300-mile projected northward shift in climate (Figure 3) causes little projected change in
places where bur oak is projected to grow well.
In reality, however, species like bur oak with very broad north-to-south ranges, have a gradient
of ecotypes that are adapted to local climate, related to length of growing season and summer
warmth. Acorn size in bur oak is one expression of this gradient (Koenig et al 2009). These
adaptations include large acorns in warmer climates, more conservative leaf out times in warmer
climates (i.e. trees wait for more growing degree days to accumulate in spring before leafing out
in the south as compared to the north), greater
Figure 1. Range of bur oak. Stars show the north, central and southern seed source locations.

5
tree height in a warmer climate, more horizontal branching in a warmer climate, and earlier
shedding of leaves in the north. Therefore, genetically fixed ecotypes arranged by latitude likely
exist. However, compared to other tree species, very little research has been done on bur oak
ecotypes. The current situation for Minnesota is that we are in the early phases of very large
magnitude climate change, and are close to the northern edge of the range of bur oak, and thus,
bur oak is expected to fare better in the future at the expense of other tree species, but unlikely to
be able to respond on its own.
Figure 2. Current bur oak abundance based USDA Forest Service on inventory data (left) and
projected bur oak abundance for a high (business as usual CO2 emissions scenario, right). From
Prasad et al 2007-ongoing.
Figure 3. Projected future climate envelopes (light gray) for northeastern and south-central MN
(dark gray), based on a business as usual scenario, from Galatowitsch, Frelich and Phillips-Mao,
2009.
6
Experimental design, acorn collection and seedling planting
The basic design is to plant bur oak seedlings of northern, central, and southern ecotypes in four
common garden location in the Twin Cities Metro Area. The three ecotypes came from: Roseau
in northwestern Minnesota, Rice County in south-central Minnesota, just south of the Twin
Cities Metro Area, and Iowa, with the approximate centroid of the seeds included centered
around Des Moines in the center of the state, at least 100 miles further south and likely averaging
200 miles further south than the Rice County seed source (stars in Figure 1). 5889 seedlings were
planted (Table 1).
The experiment will tell us whether the local ecotype of bur oak still does better than those from
Iowa (given the warming that has already occurred), or whether it is time to start switching to
seed sources from further south (Figure 3, right). In addition, it will inform how bur oak in
northern Minnesota will fare when the climate there becomes similar to the central seed source
location, close to the Twin Cities Metro Area, since one part of the experiment involves planting
acorns from northern Minnesota in the Metro Area (Figure 3, left). Thus, although not
envisioned at the time the experiment originated, this experiment could inform the future of the
Boundary Waters Canoe Area Wilderness, which is expected to convert to oak savanna due to
shallow soils and projected warmer summers (Frelich and Reich 2010, Galatowitsch, Frelich and
Phillips-Mao 2009).
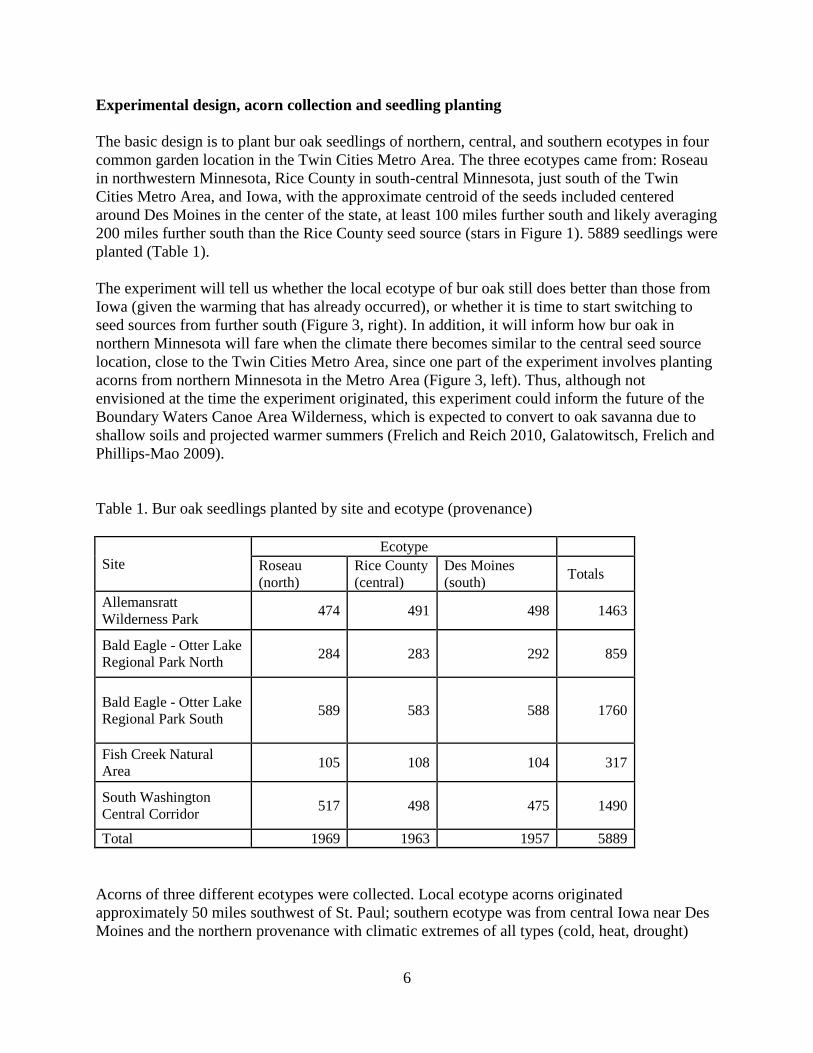
Table 1. Bur oak seedlings planted by site and ecotype (provenance)
Site
Ecotype
Roseau
(north)
Rice County
(central)
Des Moines
(south) Totals
Allemansratt
Wilderness Park 474 491 498 1463
Bald Eagle - Otter Lake
Regional Park North 284 283 292 859
Bald Eagle - Otter Lake
Regional Park South 589 583 588 1760
Fish Creek Natural
Area 105 108 104 317
South Washington
Central Corridor 517 498 475 1490
Total 1969 1963 1957 5889
Acorns of three different ecotypes were collected. Local ecotype acorns originated
approximately 50 miles southwest of St. Paul; southern ecotype was from central Iowa near Des
Moines and the northern provenance with climatic extremes of all types (cold, heat, drought)

7
originated in northwestern Minnesota, near Roseau. Collection was done through Greening’s
network of acorn providers via paid collection followed by location verification for southern and
northern ecotypes, and via Mn-DNR Forestry acorn purchase program for local ecotype . These
acorns were custom grown using ecotype specific beds in a common nursery operation under
identical conditions, at Mn-DNR’s Badoura Nursery. At this nursery, leaves were painted
according to DNR protocol using a different color for each ecotype.
Bur oak seedlings were planted at four old field sites in the suburban and exurban Twin Cities
Metro Area. Site preparation at each site consisted of mowing the existing vegetation while
dormant. Colored pin flags were used to mark the location of each planting with a spacing of
approximately 9 feet. The pin flag colors correspond to seedling ecotype – orange for Des
Moines, blue for Rice County, and white for Roseau. The ecotypes are randomly distributed
throughout each site to mitigate the effects of local variations in topography and soil. The
seedlings were planted on a range of dates by different crew combinations (Table 2). Before
planting, the seedlings were kept in cool moist conditions by use of small plastic coolers, plastic
bags, and a walk in plant cooler. During planting, seedlings were distributed to crew members in
color coded buckets filled with moist straw. Colored flagging was used to aid recording of which
date each seedling was planted. The stem of each seedling was painted the color corresponding
to its ecotype. Seedlings were planted at the Allemansratt Wilderness Park and the Fish Creek
Natural Area sites in a 2 foot diameter hole deep enough for the bare rootstock. Soil was then
filled in around the roots, up to the root flare. The holes were dug by hand, often supplemented
by a power auger. These seedlings were watered with approximately ½ gallon of water
immediately after planting. Seedlings were planted at the Bald Eagle - Otter Lake Regional Park
and the South Washington Central Corridor sites with a dibble bar. Multiple entries with the
dibble bar were made for each seedling at perpendiculars to enable the roots to grow in all
directions. The holes were then closed around the bare rootstock. These seedlings were not
watered after planting. The seedlings at the Fish Creek site were mulched shortly after planting
(Table 2) with woodchips. The other sites were mulched as stated in Table 2. All seedlings
planted at Allemansratt, Otter Lake, and Fish Creek were protected from herbivory shortly after
planting by securing a plastic mesh tube around the seedling on a bamboo stake.
Mulching with either plastic or organic materials such as straw has been shown to increase
survival of planted bare root oak seedlings (Truax and Gagnon 1993). Tree tubes are being used
in this experiment, which previous research has shown to increase the growth and survival of
planted oak seedlings for conditions where there is little competing vegetation (Laliberté,
Bouchard and Cogliastro 2008), and also reduced mortality caused by herbivores like deer and
voles, which can be significant for oaks. Success rates 2-4 years post-planting of 60-90% for
bare root bur oaks have been reported in the literature (Truax and Gagnon 1993, Cogliastro,
Gagnon and Bouchard 1997, Laliberté, Cogliastro and Bouchard. 2008, Laliberté, Bouchard and
Cogliastro 2008). Seedling root depth typically reaches 4.5 feet during the first growing season
after planting (Johnson 1990), so that the seedlings become well established with ability to
withstand drought, competition and top-kill by fires, despite the slow above-ground growth in
the first few years.

8
Hypotheses to test
Hypothesis 1: Bur oak seedling growth will be positively related to initial seedling size (height)
at time of planting, both across all provenances (seed origins) and within each provenance.
Rationale: Larger seedlings get more sunlight, have more stored energy and nutrients. Many
studies show that absolute growth rate of seedlings and trees is directly related to initial size.
Size of acorns very likely follows the latitudinal gradient (small in the north, large in the south),
which is a very important factor in first and second year seedling size.
Hypothesis 2: Bur oak seedling growth will be negatively related to latitude of origin (northern
MN seed source > Metro > Iowa), even if initial seedling size is taken into account.
Rationale: Almost all tree species show a pattern of slower growth towards the northern edge of
their range, which is genetically fixed and remains when different seed sources are planted in a
common garden experiment. Even if this pattern does not show up in absolute growth rate (due
to confounding effects of initial acorn size being larger in the south), it could still be evident in
relative growth rates, and/or a subset of southern seedlings that were relatively small for their
provenance, and northern seedlings that were relatively large for their provenance, which are
similar in size, that can be compared.
Hypothesis 3: Growth rates within each provenance will be the same among the four planting
sites.
Rationale: The alternative hypothesis is that growth rates will differ at one or more sites, so that
site must be taken into account as a factor when evaluating the other hypotheses. Spatial
structure of oak seedling survival and growth rates in previous research in Quebec was related to
soil characteristics, although acorn size and genetics also explain some of variation (Laliberté,
Cogliastro and Bouchard. 2008). Bur oak height growth markedly different among soil types in a
previous planting experiment that had 4-year survival of 60-90% in Quebec. Survival was
highest on moraine ridges, stony and sandy soils (Cogliastro, Gagnon and Bouchard 1997).
Moisture and light are two of the most important factors for growth of but oak seedlings (Wycoff
et al 2012), and light is not a limiting factor on our open-field plating sites, so soil spatial
variation in growth and mortality within and/or among sites is likely to be related to soil moisture.
Hypothesis 4: Timing of planting, relative to end of planting season will make a difference in
growth; the later the planting date the slower the growth in the first season.
Rationale: Seedlings planted a few weeks earlier had more time for root establishment before soil
freezing and will therefore be better able to grow faster during summer of 2017. If this
hypothesis is true, then timing will have to be taken into account as a factor when evaluating the
other hypotheses.
9
Study site details
Allemansratt Wilderness Park
The Allemansratt Wilderness Park planting site is located in Lindstrom, MN, at 45.400184 N, -
92.837491 W. It is a previously grassy open field with some topography that dishes to the center
to encompass a small low, wet area. The vegetation over most of the field consisted primarily of
old field vegetation, dominated by non-native invasive smooth brome (Bromus inermis)prior to
planting. The enclosed wet area is comprised mostly of reed canary grass, and was largely
avoided for oak planting.
Bald Eagle - Otter Lake Regional Park
The planting sites at Bald Eagle - Otter Lake Regional Park are located at north site: 45.120856
N, -93.029561 W; south site 45.119068 N, -93.028645 W, in White Bear Lake, MN. Both sites
were primarily open grassy fields, with non-native cool season grasses as the main components.
Both sites also contain some mature trees. The north planting site is sloped to the southeast, and
is bordered there by a wetland. The south planting site slopes to the southwest and is bordered
there by a wetland. The other borders of both sites are comprised of mixed woodland.
Fish Creek Open Space
The Fish Creek Open Space planting site is located at 44.894462 N, -93.002963 W in
Maplewood, MN. It was a grassy open field, sprayed and seeded to dry-mesic prairie with
minimal native prairie establishment. It slopes gradually to the west. It is bordered on the south
by and oak forest, and on the other three sides by reconstructed dry-mesic prairie. an
South Washington Central Corridor
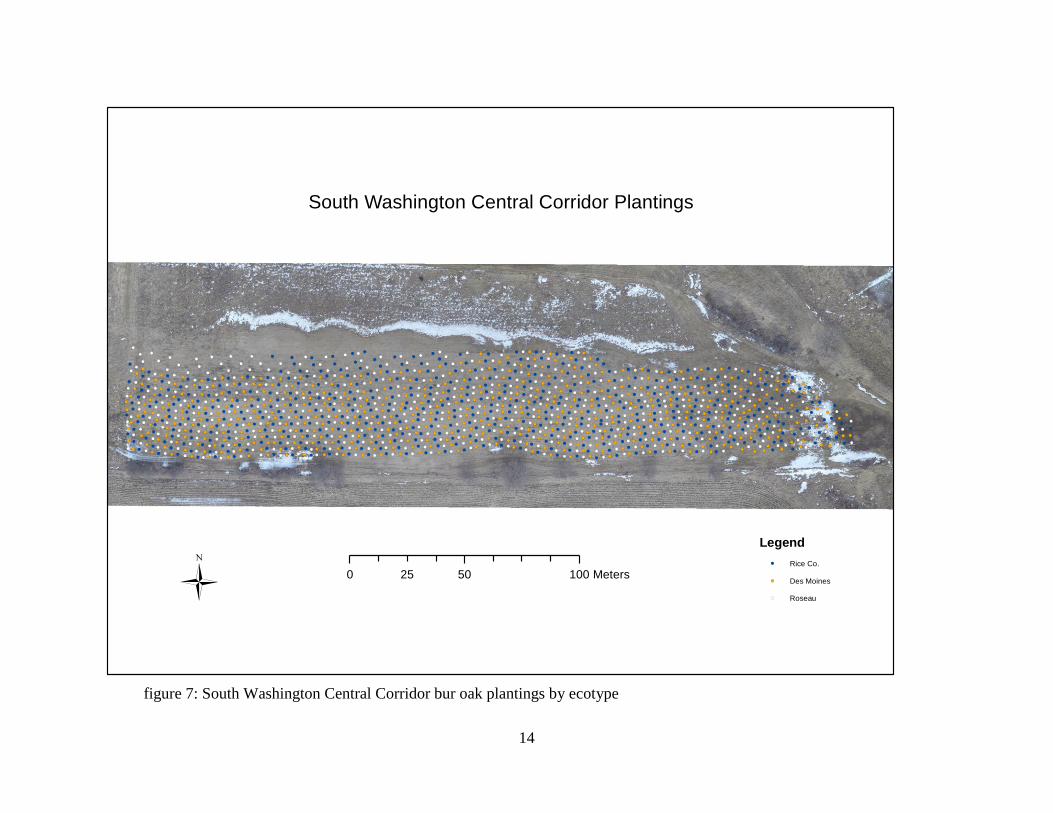
The South Washington Central Corridor planting site (SWCC) is located at 44.862168 N, -
92.911866 W in Woodbury, MN. It is a previously grassy field of reconstructed dry-mesic
prairie. It slopes to the north and east. It is bordered on the south and west by farm fields, on the
north by white oak plantings in mesic reconstructed prairie , and to the east a low grassy swale
supporting a small woody component.

10
Table 2. Summary of planting and mulching details
Planting Site Planting Date Crews Flagging Color/Area
Descritiption Method Mulching Date Crew Type
Allemansratt
Wilderness Park
10/29/16 Volunteers, GRG Neon Green
2' D hole, watered
12/22/2016, and
3/16/17-3/27/17
GRG/VOL
Woodchips
11/2/16 GRG, CCM No Flagging
11/3/16 PRI, CCM Pink
11/9/16 GRG, PRI Yellow
11/10/16 GRG, PRI Yellow
Bald Eagle - Otter
Lake Regional Park
South
11/15/16 GRG, PRI North to South on South
Plot. Border was flagged
Dibble Bar, not watered
4/3/17-4/5/17
GRG/CCM
Tree Mats
11/16/16 GRG, PRI North to South on South Plot. Border was flagged
11/17/16 GRG, PRI, CCM Plot Finished
Bald Eagle - Otter
Lake Regional Park
North
11/17/16 GRG, PRI, CCM South to north. Border flagged
Dibble Bar, not watered 4/3/17-4/5/17
GRG/CCM
Tree Mats
11/22/16 GRG, PRI, CCM North plot finished
Fish Creek Natural
Area
11/4/16 Volunteers, GRG East to west, border flagged
2' D hole, watered
16-Nov-16 RCCF
Woodchips
11/7/16 GRG East to west, border flagged 21-Nov-16 RCCF
11/8/16 GRG East to west, plot finished 21-Nov-16 RCCF
South Washington
Central Corridor
11/23/16 PRI Southwest to East. Border
was flagged Dibble Bar, not watered
n/a
n/a
None
11/24/16 MNL Plot finished
GRG - Great River Greening Crew VOL – Great River Greening Volunteers
CCM - Conservation Corps of Minnesota
PRI - Prairie Restorations, Inc.
MNL - Minnesota Native Landscapes, Inc.
RCCF - Ramsey County Correctional Facility

11
Allemansratt Wilderness Park Plantings
0 30 6015 Meters.Legend
Rice Co.
Des Moines
Roseau
figure 4: Allemansratt bur oak plantings by ecotype

12
Otter Lake Regional Park North Plantings
Ü 0 30 6015 Meters
Legend
Rice Co.
Des Moines
Roseau
figure 5: Otter Lake North bur oak plantings by ecotype

13
Legend
Rice Co.
Des Moines
Roseau
0 30 6015 MetersÜ
Otter Lake Regional Park South Plantings
figure 6: Otter Lake South bur oak plantings by ecotype
14
!( !( !( !( !( !( !( !( !( !( !( !( !( !( !( !( !( !( !( !( !( !( !( !( !( !( !( !( !( !( !( !( !( !( !( !( !( !( !( !( !( !( !( !( !( !( !( !( !( !( !( !(!( !( !( !( !( !( !( !( !( !( !( !( !( !( !( !( !( !( !( !( !( !( !( !( !( !( !( !( !( !( !( !( !( !( !( !( !( !( !( !(
!(!(!(!(!(!(!(!(!(!(!(!(!(!(!(!(!(!(!(!(!(!(!(!(!(!(!(
!(!(!(
!(!(!(!(!(!(!(!(!(!(!(!(!(!(!(!(!(!(!(!(!(!(!(!(!(!(!(!(!(!(!(!(!(!(!(!(!(!(!(!(!(!(!(!(!(!(!(!(!(!(!(!(!(!(!(!(!(!(!(!(!(
!(!(!(
!( !(!( !( !(
!( !( !( !( !( !( !( !( !( !( !( !( !( !( !( !( !( !( !( !( !( !( !( !( !( !( !( !( !( !( !( !( !( !( !( !( !( !( !( !( !( !( !( !( !( !( !( !( !( !( !(!( !( !( !( !( !( !( !( !(
!( !( !( !( !( !( !( !( !( !( !( !( !( !( !( !( !( !( !( !( !( !( !( !( !( !( !( !( !(!(
!(
!(!(
!(!(!(!(!(!(!(!(!(!(!(!(!(!(!(!(!(!(!(!(!(!(!(!(!(
!(!(!(!(!(!(!(!(!(!(
!(!(!(!(!(!(!(!(!(!(!(!(!(!(!(!(!(!(!(!(!(!(!(!(!(!(!(!(!(!(!(!(!(!(!(!(!(!(!(!(!(!(!(!(!(!(!(!(
!(!(!(!(!(!(!(!(!(!(
!(!(
!(
!(
!(
!(
!(!( !( !( !( !(!( !( !( !( !( !( !( !( !( !( !( !( !( !( !( !( !( !( !( !( !( !( !( !( !( !( !( !( !( !( !( !( !(
!( !( !( !( !( !( !( !( !( !( !( !( !( !( !( !(!( !( !( !( !( !( !( !( !( !( !( !(
!( !( !( !( !( !( !( !( !( !( !( !( !( !( !( !( !( !( !( !( !( !( !( !( !( !( !( !( !( !( !( !( !(
!( !(!(
!(!(
!(!(!(!(!(!(!(!(!(!(!(!(!(!(!(!(!(!(!(!(!(!(!(!(!(!(!(!(!(!(
!(!(!(
!(!(!(!(!(!(!(!(!(!(!(!(!(!(!(!(!(!(!(!(!(
!(
!(!(!(!(!(!(!(!(!(!(!(!(!(!(!(!(!(!(!(
!(
!(!(!(!(!(!(!(!(!(!(!(!(!(!(!(!(!(!(!(!(!(!(
!(!(!(!(!(
!( !( !(!( !( !( !(!( !( !( !( !( !( !( !( !( !( !( !( !( !( !( !( !( !( !( !( !( !( !( !( !( !( !( !( !( !( !( !( !( !( !( !( !(
!( !( !(!( !( !( !( !( !( !( !( !( !( !( !( !( !( !( !( !( !( !( !( !(
!( !( !( !( !( !( !( !( !(!( !( !( !( !( !( !( !( !( !( !( !( !( !( !( !( !( !( !( !( !( !(
!(!(!(
!(
!(!(
!(!(
!(
!(
!(
!(
!(
!(
!(!( !(
!(!(
!(!(
!(!(
!(!(
!(!(
!(
!(!(
!(!(
!(!(
!(!(
!(!(!(!(!(!(!(!(!(!(!(!(!(!(!(!(!(!(!(!(!(!(!(!(!(!(!(!(!(
!(!(!(
!(!(!(!(!(!(!(!(!(!(!(!(!(!(!(!(!(!(!(!(!(!(!(!(!(!(!(!(!(!(!(!(!(!(!(!(!(!(!(!(!(!(!(!(!(!(!(!(!(!(!(!(!(!(!(!(!(!(!(!(!(
!(!(!(!(!(!(!(
!(!( !( !(!(
!( !( !( !( !( !( !( !( !( !( !( !( !( !( !( !( !( !( !( !( !( !( !( !( !( !( !( !( !( !( !( !( !(!( !( !( !( !( !( !( !( !( !(
!( !( !(!( !( !( !( !( !( !( !( !( !( !( !( !( !( !( !(
!( !( !( !( !( !( !( !( !(!( !( !( !(
!(
!( !(!( !( !(
!( !( !( !( !( !( !( !( !(!( !(
!(!(
!(!(
!(!(
!(!(
!(
!(!(
!(!(
!(!(!(
!(!(!(!(!(!(!(!(!(!(!(!(!(!(!(!(!(!(!(!(!(!(!(!(!(!(!(!(!(
!(!(!(!(!(!(!(!(!(!(!(!(!(!(!(!(
!(!(!(!(!(!(!(!(!(!(!(!(!(!(!(!(!(!(!(!(!(!(!(!(!(!(!(!(!(!(!(!(!(!(!(!(!(!(!(!(!(!(!(!(!(!(!(
!(!(!(!(
!( !( !(!( !( !( !( !( !( !( !( !( !( !( !( !( !( !( !( !( !( !( !( !( !( !( !( !( !( !( !( !( !( !( !( !( !( !( !( !( !( !( !( !( !( !(
!(!( !( !( !( !( !( !( !( !( !( !( !( !( !( !( !( !(
!(!( !( !( !(
!( !( !( !(!( !( !( !( !( !( !( !( !( !( !( !( !( !(
!( !( !( !( !(!( !(
!(!(
!(!(
!(
!( !(!(
!(
!(
!(
!(
!(
!(
!(
!(!(
!(
!(
!(!(
!(!(
!(!(
!(!(!(!(!(!(!(!(!(!(!(!(!(!(!(!(!(!(!(!(!(!(!(!(!(!(
!(
!(!(!(!(
!(!(!(!(!(!(!(!(!(!(!(!(!(
!(!(!(!(!(!(
!(!(!(!(!(!(!(!(!(!(!(
!(!(!(!(!(!(!(!(!(!(!(!(!(!(!(!(!(!(!(!(!(
!(!(!(!(!(!(!(!(
!(!(
!(
!(!( !(
!( !( !( !( !( !( !( !( !( !( !( !( !( !( !( !( !( !( !( !( !( !( !( !( !( !( !( !( !( !( !( !( !(!( !( !( !( !( !(
!( !( !( !( !(!(
!( !( !( !(!( !( !( !( !( !( !( !( !( !( !( !(
!( !( !(!( !( !(
!( !( !( !(!( !( !( !( !( !( !( !( !( !(
!( !( !( !( !( !( !( !( !( !(!(
!(
!( !(!(
!(!(
!(
!(!(
!(
!(
!(
!( !(
!(
!(
!(
!(
!(!(
!(
!(
!(!(
!(!(
!(!(
!(
!(!(!(!(!(!(
!(!(!(!(!(!(
!(!(!(!(!(
!(!(!(!(!(!(!(!(!(!(!(!(!(!(!(!(!(
!(!(!(!(
!(!(
!(!(
!(!(
!(
!( !(
!(!(
!( !(
!(!(
!(
!(
!(
!(
!(
!(
!(
!(
!( !(
!(
!(
!(
!(
!( !(
!(
!( !(
!( !(
!(!(
!(!( !( !( !( !(
!( !( !( !( !( !( !( !( !( !( !( !( !( !( !(
!( !( !(
!(
!(
!(
!(!(
!( !(
!(
!(!(
!(!(
!(!(!(
!(
!(
!(
!(
!(
!(
!(
!(
!(
!(!(!(
!(!(!(
!(
!( !( !( !(
!(
!(!(
!(!(
!(
South Washington Central Corridor Plantings
0 50 10025 Meters
Legend
!( Rice Co.
!( Des Moines
!( RoseauÜ
figure 7: South Washington Central Corridor bur oak plantings by ecotype

15
figure 8: Fish Creek bur oak plantings by ecotype

16
2017 Maintenance, data collection, methods and analysis:
Allemansratt
Data collection and maintenance
The height of the Allemansratt seedlings was measured in December 2016 and March 2017.
Summary statistics are shown in Table 3. A small number of seedlings (12) had been browsed
between planting and measurement. The heights of these seedlings are included in the summary
table. In addition, there were 2 seedlings whose ecotype was misrecorded. These seedlings have
been left out of the summary table, but will be kept in the database and updated after
measurement during the 2017-2018 dormant season. The seedlings were mulched with
woodchips during the 2016-2017 dormant season. The mesh tubes currently remain on the
seedlings at the Allemansratt site. A perimeter fence was constructed around the Allemansratt
plantings starting 10/23/2017 and completed on 11/20/17 to prevent ungulate herbivory.
Methods and data analysis
Analysis of variance (ANOVA) was performed on the 2016-2017 dormant season mean height
of the seedlings to detect statistically significant differences between ecotypes at Allemansratt.
The ANOVA tests the null hypothesis that mean height is equal across ecotypes, the alternative
hypothesis being that they are not equal. A pairwise t test was subsequently performed using
Bonferroni’s p-adjustment method, to determine which ecotypes’ mean height differed
significantly from another. The assumption of normally distributed data was assessed with a QQ
plot and a residuals plot (not shown).
Results
Based on the results of the ANOVA, the null hypothesis can be rejected at significance < 0.001.
Inspection of the QQ and residuals plot confirm sufficient normality of the data. The pairwise t
test shows that all three ecotypes differed from one another at a significance level < 0.001.
Table 3 : Allemansratt planted seedling height summary statistics and significance Ecotype Seedlings Mean (cm) Standard Deviation (cm) Standard Error
Roseau 474 18.0 (a) 7.0 0.3
Rice Co. 491 15.0 (b) 4.8 0.2
Des Moines 498 20.5 (c) 6.5 0.3
(a) (b) (c) indicate significant differences
Otter Lake North
Data collection and maintenance
Otter Lake North seedlings were measured in April and May of 2017. Summary statistics are
shown in Table 4. Some seedlings had begun growing by the time they were measured for the
2016-2017 dormant season. However, the new growth was clearly distinguishable from the older
growth, and the measurements reflect the height of the seedling during the 2016-2017 dormant
season. A small number of seedlings (33) had been browsed, and some stems had been damaged
by rodents between planting and measurement. The heights of these seedlings are included in the
summary table. In addition, there were 2 seedlings whose ecotype was misrecorded. These

17
seedlings have been left out of the summary table, but will be kept in the database and updated
after measurement during the 2017-2018 dormant season.. The majority of the tree tubes at Otter
Lake North were removed after measurements, with the exception of the seedlings measured on
the first day at the site. It was later discovered that seedlings were being browsed at the site, so
the remaining tubes were left on, and currently still remain on the seedlings. A perimeter fence
was constructed around the Otter Lake North plantings starting 11/29/2017 and completed on
12/5/2017 to prevent ungulate herbivory.
Methods and data analysis
ANOVA was performed on the 2016-2017 dormant season mean height of the seedlings to detect
statistically significant differences between ecotypes at Otter Lake North. The ANOVA tests the
null hypothesis that the mean height is equal across ecotypes, the alternative hypothesis being
that they are not equal. A pairwise t test was subsequently performed using Bonferroni’s p-
adjustment method, to determine which ecotypes’ mean height differed significantly from
another. The assumption of normally distributed data was assessed with a QQ plot and a
residuals plot (not shown).
Results
Based on the results of the ANOVA, the null hypothesis can be rejected at significance < 0.001.
Inspection of the QQ and residuals plots confirm sufficient normality of the data. The pairwise t
test shows that the Des Moines ecotype differs from both the Roseau and the Rice County
ecotypes at a significance level of <0.001. The Rice County and Roseau ecotypes do not
significantly differ from one another.
Table 4: Otter Lake North planted seedling height summary statistics Ecotype Seedlings Mean (cm) Standard deviation (cm) Standard error
Roseau 284 17.4 (a) 7.0 0.4
Rice Co. 283 17.3 (a) 5.3 0.3
Des Moines 292 22.6 (b) 8.4 0.5
(a) (b) (c) indicate significant differences
Otter Lake South
Data collection and maintenance
Otter Lake South seedlings were measured in April and May of 2017. Summary statistics are
shown in Table 5. As with the Otter Lake North site, some seedlings had begun growing by the
time they were measured for the 2016-2017 dormant period. As before, the new growth was
clearly distinguishable from the older growth, and the measurements reflect the height of the
seedling during the 2016-2017 dormant period. A small number of seedlings (58) had been
browsed between planting and measurement, and some stems had been damaged by rodents
between planting and measurement. The heights of these seedlings are still included in the
summary table. In addition, there were 3 seedlings whose ecotype was misrecorded. These
seedlings have been left out of the summary table, but will be kept in the database and updated
upon measurement during the 2017-2018 dormant period. Stem diameter at ground level was
measured on a random sample of 323 seedlings. These summary statistics are shown in table 6.
The mesh tree tubes at Otter Lake South were removed in May 2017 due to concern about the
seedlings intertwining with the mesh, making the tubes being difficult to remove in the future.

18
Browse on the seedlings at the site was noticed shortly after removal. A perimeter fence was
constructed around the Otter Lake South plantings starting 11/29/2017 and completed on
12/5/2017 to prevent ungulate herbivory.
Methods and data analysis
Analysis of variance (ANOVA) was performed on the 2016-2017 dormant season mean heights
and the mean ground level diameters of the seedlings to detect statistically significant differences
between ecotypes at Otter Lake South. The ANOVA tests the null hypothesis that the means are
equal across ecotypes, the alternative hypothesis being that they are not equal. A pairwise t test
was subsequently performed using Bonferroni’s p-adjustment method, to determine which
ecotypes’ mean height and diameter differed significantly from one another. Normality of the
data was assessed with a QQ plot and a residuals plot (not shown).
Results
Based on the results of the ANOVA, the null hypotheses regarding 2016-2017 dormant season
height and the null hypothesis regarding diameter can both be rejected at significance < 0.001.
Inspection of the QQ and residuals plot confirm sufficient normality of the data. The pairwise t
test shows that the three ecotypes’ mean height differed from one another at a significance level
< 0.001. The mean diameter of the Des Moines seedlings differed significantly from the Rice
County seedlings at a significance < 0.001, and from the Roseau seedlings at a significance of <
0.05. The mean diameters of the Roseau and Rice county seedlings did not differ significantly
from one another.
Table 5: Otter Lake South planted seedling height summary statistics Ecotype Seedlings Mean (cm) Standard Deviation (cm) Standard Error
Roseau 589 19.0 (a) 7.9 0.3
Rice Co. 583 16.5 (b) 5.2 0.2
Des Moines 588 23.5 (c) 8.2 0.3
(a) (b) (c) indicate significant differences
Table 6: Otter Lake South planted seedling diameter summary statistics Ecotype Seedlings Mean (mm) Standard Deviation (mm) Standard Error
Roseau 106 6.1 (a) 1.8 0.2
Rice Co. 110 5.9 (a) 1.4 0.1
Des Moines 107 6.8 (b) 1.9 0.2
(a) (b) (c) indicate significant differences
Fish Creek
Data collection and maintenance
Fish Creek seedlings were measured in October and November in 2017. Height data was
collected in 2017 using a tablet with a georeferenced pdf file and its associated attribute file. The
files were created using the drone imagery created in 2016.
For the 2018-2018 dormant season, the measurement was made from the highest point on the
seedling, regardless of whether that point was live or dead tissue. The measurement was made
plumb to the ground surface level at the base of the seedling without manipulating the seedling.

19
This is in contrast to the first season measurements, for which the seedling length was measured.
This affects the growth calculation because many seedlings were not planted and/or are not
growing perfectly plumb. This biases the growth calculations lower than true growth to a degree
varying by both seedling angle and length. Because the seedlings are relatively small and
because the analysis entails a very robust data set being analyzed among ecotypes rather than
analyzing absolute growth, this inconsistency does not pose a serious problem. The method
change was made to ensure that in the future the measurement can remain consistent. When the
seedlings become more rigid and taller, measuring length will not be feasible, but measuring
height will be.
The seedlings were mulched during the 2016-2017 dormant season. At the time of 2017 data
collection nearly all tubes at Fish Creek had been removed. Removal occurred in May of 2017,
due to concern about seedlings entwining in the mesh and being difficult to remove in the future.
At that time it was thought that herbivory would not be a problem due to the abundance of other
vegetation for ungulate grazing and browsing. Unfortunately, browsing at the Fish Creek site
during the 2017 growing season was fairly heavy, as evidenced by the number of seedlings used
for the growth calculations. In addition to there was a small amount of rodent damage to some
stems. A perimeter fence was constructed around the Fish Creek plantings starting 9/25/2017 and
completed on 11/24/2017 to prevent ungulate herbivory.
Methods and data analysis
Table 7 shows the summary statistics from the 2016-2017 dormant season height measurements.
Table 8 shows the summary statistics from the 2017-2018 dormant season measurements for all
seedlings >0 cm. The growth for each seedling is calculated by subtracting the 2016-2017 height
measurement from the 2017-2018 height, and is shown in table 9. Growth is calculated for only
those seedlings whose main stem had not been obviously browsed or broken.
ANOVA was performed on the 2016-2017 dormant season height of each seedling to detect
statistically significant differences between ecotypes at Fish Creek. The ANOVA tests the null
hypothesis that the mean height is equal across ecotypes, the alternative hypothesis being that
they are not equal. A pairwise t test was subsequently performed using Bonferroni’s p-
adjustment method, to determine which ecotypes’ mean height differed significantly from one
another. The assumption of normally distributed data was assessed with a QQ plot and a
residuals plot (not shown). ANOVA was also performed on the calculated 2017 growth. A
pairwise t test was also performed using Bonferroni’s p-adjustment method, to determine which
ecotypes’ mean height growth differed significantly from one another. Again, the assumption of
normally distributed data was assessed with a QQ plot and a residuals plot (not shown).
Results
Based on the results of the ANOVA, the null hypothesis on 2016-2017 dormant season mean
height can be rejected at significance < 0.001. Inspection of the QQ and residuals plots confirm
sufficient normality of the data. The pairwise t test shows that the Rice County ecotypes’ 2016-
2017 dormant season mean height differed from that of both the Roseau and Des Moines
ecotypes at a significance level < 0.001. The Roseau and Des Moines 2016-2017 dormant season
mean heights are not significantly different. The null hypothesis regarding 2017 growth can be
rejected at significance < 0.001. Inspection of the QQ and residuals plot confirm sufficient

20
normality of the data. The pairwise t test shows that the Des Moines 2017 mean growth differs
from that of the Roseau ecotype at a significance of <0.01, and from the Rice County 2017 mean
growth at a significance of <0.1. The Rice County and Roseau seedlings’ mean growth differed
significantly from each other at a significance level of < 0.001.
Table 7: Fish Creek 2016-2017 dormant season height summary statistics Ecotype Seedlings Mean (cm) Standard Deviation (cm) Standard Error
Roseau 105 21.0 (a) 6.6 0.6
Rice Co. 108 16.7 (b) 4.4 0.4
Des Moines 104 22.7 (a) 6.6 0.7
(a) (b) (c) indicate significant differences
Table 8: Fish Creek 2017-2018 dormant season height summary statistics Ecotype Seedlings Mean (cm) Standard Deviation (cm) Standard Error
Roseau 95 20.9 10.3 1.1
Rice Co. 102 12.8 5.9 0.6
Des Moines 101 20.5 8.8 0.9
Table 9: Fish Creek 2017 seedling height growth summary statistics Ecotype Seedlings Mean (cm) Standard Deviation (cm) Standard Error
Roseau 50 1.7 (a) 7.4 1.0
Rice Co. 66 -4.1 (b) 4.7 0.6
Des Moines 57 -1.8 (c) 4.9 0.7
(a) (b) (c) indicate significant differences
South Washington Central Corridor
Data collection and maintenance Both the 2016-2017 and 2017-2018 dormant season height measurements were made during
2017, the former, during the months of April and May, the latter during the months of November
and December. In June of 2017, some of the seedlings had begun to grow, but the new growth
was clearly distinguishable from the prior year’s growth. In these cases, the measurements reflect
the height of the seedling during the 2016-2017 dormancy season. Measurement techniques
remained consistent across sites during each dormant season, such that the 2016-2017 dormant
season measurements at South Washington Central Corridor (SWCC) were seedling length,
while the 2017-2018 measurements were height, as described for the Fish Creek site. Those
implications apply to this site. At SWCC it was possible to infer which seedlings survived
planting, and which did not. This was noted and used to exclude dead seedlings from analysis.
Approximately 75% of the tree tubes were removed at SWCC during measurement in May and
June. The tree cages on the trees measured in April remained on the seedlings through the 2017
growing season, and were removed during the 2017-2018 dormant season measurements. There
was little browse at this site, and a small amount of rodent damage to the stems of some
seedlings.
A total of 15 Roseau seedlings, 135 Rice County seedlings, and 26 Des Moines seedlings
appeared to have no new growth since planting or were not found at the time of 2017-2018
dormant measurement.

21
Methods and data analysis
Table 10 shows the summary statistics from the 2016-2017 dormant season measurements. Table
11 shows the summary statistics from the 2017-2018 dormant season measurements for all
seedlings >0 cm that were found to be alive, excluding one seedling whose height was
misrecorded.
Table 10: SWCC 2016-2017 dormant season height summary statistics Ecotype Seedlings Mean (cm) Standard Deviation (cm) Standard Error
Roseau 517 17.6 (a) 7.4 0.3
Rice Co. 498 18.4 (a) 4.8 0.2
Des Moines 475 22.9 (b) 7.1 0.3
(a) (b) (c) indicate significant differences
Table 11: SWCC 2017-2018 dormant season height summary statistics Ecotype Seedlings Mean (cm) Standard Deviation (cm) Standard Error
Roseau 465 23.8 9.0 0.4
Rice Co. 318 18.3 4.8 0.3
Des Moines 410 25.2 10.7 0.5
Height growth for 2017 was calculated for seedlings that were not were browsed or broken, and
had tissue grown in 2017. In some cases the main stem tissue of the seedling was dead above a
certain point and was subsequently broken, but the seedling was alive and growing at a lesser
height. These are also excluded from the growth calculation. The summary statistics of the 2017
growth are shown in table 12.
ANOVA was performed on the 2016-2017 dormant season mean height to detect statistically
significant differences between ecotypes at SWCC. The ANOVA tests the null hypothesis that
the mean height is equal across ecotypes, the alternative hypothesis being that they are not equal.
A pairwise t test was subsequently performed using Bonferroni’s p-adjustment method, to
determine which ecotypes’ mean height differed significantly from one another. The assumption
of normally distributed data was assessed with a QQ plot and a residuals plot (not shown).
ANOVA was also performed for the calculated 2017 growth. A pairwise t test was again
performed using Bonferroni’s p-adjustment method, to determine which ecotypes’ mean height
growth differed significantly from another. The assumption of normally distributed data was
assessed with a QQ plot and a residuals plot (not shown).
Results
Based on the results of the ANOVA, the null hypothesis regarding 2016-2017 dormant season
mean height can be rejected at significance < 0.001. Inspection of the QQ and residuals plot
confirm sufficient normality of the data. The pairwise t test shows that the Roseau seedlings’
2016-2017 dormant season mean height differed from both the Des Moines and Rice County
ecotypes at a significance level of <0.001. The Rice County and Roseau seedlings’ 2016-2017
mean height did not differ significantly from eachother. The null hypothesis regarding 2017
22
mean height growth can be rejected at significance < 0.001. Inspection of the QQ and residuals
plot confirm sufficient normality of the data. The pairwise t test shows that 2017 mean height
growth of the Roseau seedlings differed from both the Rice County seedlings and the Des
Moines seedlings at a significance of <0.001, and the Rice County and Des Moines seedlings’
2017 mean height growth differed significantly from one another at a significance of <0.01.
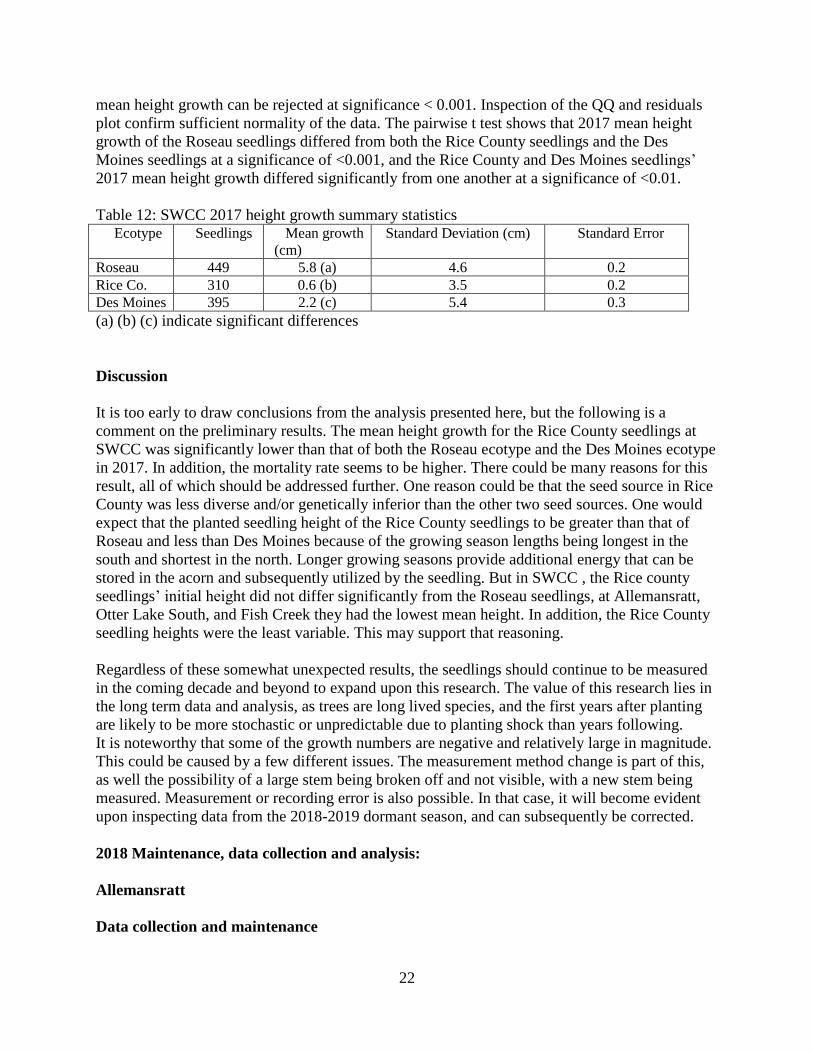
Table 12: SWCC 2017 height growth summary statistics Ecotype Seedlings Mean growth
(cm)
Standard Deviation (cm) Standard Error
Roseau 449 5.8 (a) 4.6 0.2
Rice Co. 310 0.6 (b) 3.5 0.2
Des Moines 395 2.2 (c) 5.4 0.3
(a) (b) (c) indicate significant differences
Discussion
It is too early to draw conclusions from the analysis presented here, but the following is a
comment on the preliminary results. The mean height growth for the Rice County seedlings at
SWCC was significantly lower than that of both the Roseau ecotype and the Des Moines ecotype
in 2017. In addition, the mortality rate seems to be higher. There could be many reasons for this
result, all of which should be addressed further. One reason could be that the seed source in Rice
County was less diverse and/or genetically inferior than the other two seed sources. One would
expect that the planted seedling height of the Rice County seedlings to be greater than that of
Roseau and less than Des Moines because of the growing season lengths being longest in the
south and shortest in the north. Longer growing seasons provide additional energy that can be
stored in the acorn and subsequently utilized by the seedling. But in SWCC , the Rice county
seedlings’ initial height did not differ significantly from the Roseau seedlings, at Allemansratt,
Otter Lake South, and Fish Creek they had the lowest mean height. In addition, the Rice County
seedling heights were the least variable. This may support that reasoning.
Regardless of these somewhat unexpected results, the seedlings should continue to be measured
in the coming decade and beyond to expand upon this research. The value of this research lies in
the long term data and analysis, as trees are long lived species, and the first years after planting
are likely to be more stochastic or unpredictable due to planting shock than years following.
It is noteworthy that some of the growth numbers are negative and relatively large in magnitude.
This could be caused by a few different issues. The measurement method change is part of this,
as well the possibility of a large stem being broken off and not visible, with a new stem being
measured. Measurement or recording error is also possible. In that case, it will become evident
upon inspecting data from the 2018-2019 dormant season, and can subsequently be corrected.
2018 Maintenance, data collection and analysis:
Allemansratt
Data collection and maintenance

23
A random sample of Allemansratt seedlings outside a 10 meter buffer around mature trees and a
5 meter buffer around a large patch of dense grass were visited in May 2018. The sampled
seedlings, totaling 284, are shown in figure 9. 11 of these seedlings were not found. The heights
of 91 Rice county seedlings, 91 Des Moines seedlings, and 86 Roseau seedlings were measured
and recorded. The herbivory protection cages were removed from all of the seedlings in April
during measurement. For these 2017-2018 dormant season measurements, height is from the
ground level to the highest point on the seedling, regardless of whether that point was live or
dead tissue. The measurement was made plumb to the ground surface level at the base of the
seedling without manipulating the seedling. This is in contrast to the 2016-2017 dormant season
measurements, for which the seedling length was measured. This affects the growth calculation
because many seedlings were not planted and/or are not growing perfectly plumb. This biases the
growth calculations lower than true growth to a degree varying by both seedling angle and length.
Because the seedlings are relatively small and because the analysis is between ecotypes rather
than absolute growth, this inconsistency does not pose a serious problem. The method change
was made to ensure that in the future the measurement can remain consistent. When the
seedlings become more rigid and taller, measuring length will not be feasible, but measuring
height will be.
Methods and data analysis
5 of the measured seedlings had been mowed down and were not included in this year’s analysis.
32 of the measured seedlings were browsed and were included in the analysis. Height growth
during 2017 was calculated for all included seedlings. The summary statistics of the 2017 growth
are shown in table 13. ANOVA was performed on the 2017 mean height growth of the seedlings
to detect statistically significant differences between ecotypes at Allemansratt. The ANOVA
tests the null hypothesis that the mean height growth is equal across ecotypes, the alternative
hypothesis being that they are not equal. A pairwise t-test with Bonferonni’s adjustment was
used to determine the significant differences between each pair of ecotypes. The assumption of
normally distributed data was assessed with a QQ plot and a residuals plot (not shown). ANOVA
was performed within each ecotype to test the null hypothesis that growth is equal across
planting dates.
Results
The results of the ANOVA indicate the null hypothesis regarding 2017 mean height growth can
be rejected at significance < 0.001. Inspection of the QQ and residuals plot confirm sufficient
normality of the data. The pairwise t test shows that 2017 mean height growth of the Roseau
seedlings differed from both the Rice County seedlings and the Des Moines seedlings at a
significance of <0.001, and the Rice County and Des Moines seedlings’ 2017 mean height
growth did not differ significantly from one another. The results of the ANOVA regarding plant
dates indicates that the null hypothesis cannot be rejected at a significance <0.1. There is no
evidence to support that the different planting dates have an effect on the growth of the seedlings.
Table 13: Allemansratt 2017 growth summary statistics Ecotype Seedlings Mean growth (cm) Standard Error
Roseau 91 8.6 (a) 0.74
Rice Co. 91 2.6 (b) 0.6
Des Moines 86 8.1 (a) 0.9

24
(a) (b) (c) indicate significant differences
Discussion
The mean height growth for the Rice County seedlings was less than that of both the Roseau
ecotype and the Des Moines ecotype in 2017 at Allemansratt. Although the analysis addresses
only one year’s growth in the field, the result is surprising and statistically significant.
Hypothesis 2 posited that the growth of the Rice County seedlings would be greater than that of
Roseau and less than Des Moines because of the growing season lengths being longest in the
south and shortest in the north. There could be many reasons for this discrepancy. It is possible
that the non-native ecotypes benefit from a lack of well-adapted enemies compared to the
relatively local Rice County ecotype, as in the enemy-release hypothesis. It is also possible that
the seed source in Rice County is diverse and/or genetically inferior than the other two seed
sources.
The seedlings should continue to be measured in the coming decade and beyond to expand upon
this research. The value of this research lies in the long term data and analysis, as trees are long
lived species, and the first years after planting are likely to be more stochastic or unpredictable
due to planting shock than years following.
Otter Lake North
Data collection and maintenance
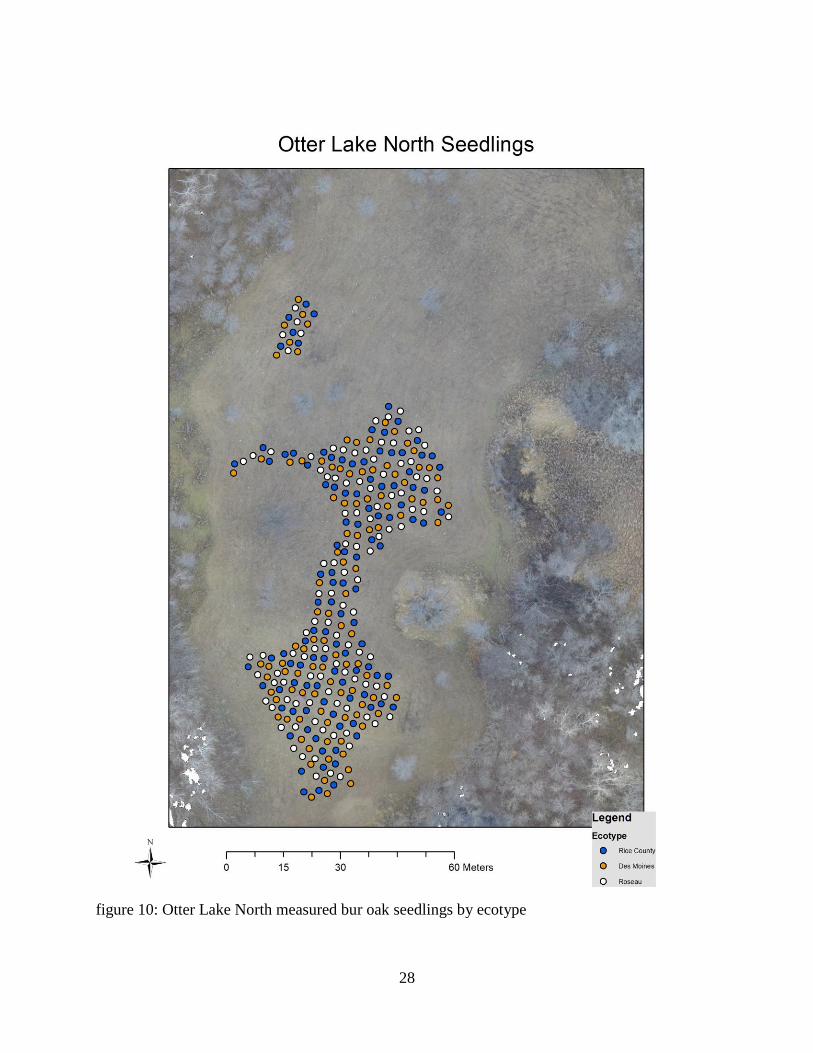
All Otter Lake North seedlings outside a buffer region around mature trees and forest and inside
the fenced exclosure were visited in May 2018. These seedlings, totaling 319, are shown in
figure 10. Of these seedlings, 36 were clearly dead, or not found. The heights of 89 Roseau, 97
Rice County, and 97 Des Moines seedlings were measured and recorded. A small number of
remaining tree tubes at Otter Lake North were removed after measurements. For the 2017-2018
dormant season measurements, height is from the ground level to the highest point on the
seedling, regardless of whether that point was live or dead tissue. The measurement was made
plumb to the ground surface level at the base of the seedling without manipulating the seedling.
This is in contrast to the 2016-2017 dormant season measurements, for which the seedling length
was measured. This affects the growth calculation because many seedlings were not planted
and/or are not growing perfectly plumb. This biases the growth calculations lower than true
growth to a degree varying by both seedling angle and length. Because the seedlings are
relatively small and because the analysis is between ecotypes rather than absolute growth, this
inconsistency does not pose a serious problem. The method change was made to ensure that in
the future the measurement can remain consistent. When the seedlings become more rigid and
taller, measuring length will not be feasible, but measuring height will be.
Methods and data analysis
Of the measured seedlings, many 44% had been browsed. Summary statistics of the height
growth for each ecotype are shown in table 14. ANOVA was performed on the 2017 mean height

25
growth of the seedlings to detect statistically significant differences between ecotypes at Otter
Lake North. The ANOVA tests the null hypothesis that the mean height growth is equal across
ecotypes, the alternative hypothesis being that they are not equal.
Based on the results of the ANOVA, the null hypothesis cannot be rejected at significance < 0.1.
The Rice County, Des Moines, and Roseau ecotypes do not significantly differ from one another
in mean height growth during 2017.
Table 14: Otter Lake North planted seedling height summary statistics Ecotype Seedlings Mean Growth (cm) Standard deviation (cm)
Roseau 89 0.1 (a) 7.0
Rice Co. 97 -1.6 (a) 5.3
Des Moines 97 -1.5 (a) 7.0
(a) (b) (c) indicate significant differences
Discussion
Heavy browse at this site complicates interpretation of the data and the analysis shouldn’t be
interpreted closely at this point. It is possible for any of the seedlings to have been browsed and
subsequently continued growing before the end of the season, rendering evidence of the
disturbance difficult or impossible to discern during dormant season measuring.
Otter Lake South
Data collection and maintenance
A random sample of Otter Lake South seedlings outside a 10 meter buffer around mature trees
were visited in April and May 2018. The sampled seedlings, totaling 318, are shown in figure 11.
21 of the visited seedlings were missing or clearly dead. The height and ground-level diameter of
97 Roseau, 101 Rice County, and 100 Des Moines seedlings were measured. For the 2017-2018
dormant season measurements, height is from the ground level to the highest point on the
seedling, regardless of whether that point was live or dead tissue. The measurement was made
plumb to the ground surface level at the base of the seedling without manipulating the seedling.
This is in contrast to the 2016-2017 dormant season measurements, for which the seedling length
was measured. This affects the growth calculation because many seedlings were not planted
and/or are not growing perfectly plumb. This biases the growth calculations lower than true
growth to a degree varying by both seedling angle and length. Because the seedlings are
relatively small and because the analysis is between ecotypes rather than absolute growth, this
inconsistency does not pose a serious problem. The method change was made to ensure that in
the future the measurement can remain consistent. When the seedlings become more rigid and
taller, measuring length will not be feasible, but measuring height will be.
Methods and data analysis
A large number of seedlings (238 or 75%) had been browsed. Summary statistics of height
growth for each ecotype are shown in table 15. Analysis of variance (ANOVA) was performed
on the 2017 season mean height growth. The ANOVA tests the null hypothesis that the means
are equal across ecotypes, the alternative hypothesis being that they are not equal. Summary
statistics of diameter for each ecotype are shown in table 16. ANOVA was also performed on the

26
mean seedling diameter of each ecotype. No analysis was done on diameter growth as the
overlap between the sample measured last season and this season did not result in a dataset
robust enough for analysis.
Based on the results of the ANOVA, the null hypothesis regarding height growth cannot be
rejected at significance < 0.1. The results of the ANOVA indicate that the null hypothesis
regarding seedling diameter cannot be rejected at a significance <0.01.
Table 15: Otter Lake South seedling height growth summary statistics Ecotype Seedlings Mean growth (cm) Standard Error
Roseau 104 -3.5 (a) 0.7
Rice Co. 105 -4.3 (a) 0.5
Des Moines 109 -5.4 (a) 0.6
(a) (b) (c) indicate significant differences
Table 16: Otter Lake South 2017-2018 dormant diameter statistics Ecotype Seedlings Mean diameter (cm) Standard Error
Roseau 91 0.6 (a) 0.74
Rice Co. 91 0.6 (a) 0.6
Des Moines 86 0.6 (a) 0.9
(a) (b) (c) indicate significant differences
Discussion
Heavy browse at this site complicates interpretation of the data and the analysis shouldn’t be
interpreted closely at this point. It is possible for any of the seedlings to have been browsed and
subsequently continued growing before the end of the season, rendering evidence of the
disturbance difficult or impossible to discern during the dormant season measuring.

27
2018 Seedlings Measured Maps
figure 9: Allemansratt randomly sampled bur oak seedlings by ecotype
28
figure 10: Otter Lake North measured bur oak seedlings by ecotype

29
figure 11: Otter Lake South randomly sampled bur oak seedlings by ecotype

30
Summary and Conclusions, 7/18/2018
Hypothesis #1 was partially addressed using planted seedling height as a proxy for acorn size.
Unexpectedly, the Rice County seedlings were the smallest at Allemansratt, Otter Lake South,
and Fish Creek. They were not significantly different from the Roseau seedlings at Otter Lake
North and at SWCC. The reason for this is unclear, but it could be due to genetics.
To date, Hypothesis #2 has been addressed at each site. At the two sites without significant
browse pressure, mean height growth for the Rice County seedlings was significantly less than
that of both the Roseau ecotype and the Des Moines ecotype in 2017. Although the analysis
addresses only one year’s growth in the field, the result is surprising and statistically significant
if both cases. Hypothesis 2 posited that the growth of the Rice County seedlings would be greater
than that of Roseau and less than Des Moines because of the growing season lengths being
longest in the south and shortest in the north. There could be many reasons for this discrepancy.
It is possible that the non-native ecotypes benefit from a lack of well-adapted enemies compared
to the relatively local Rice County ecotype, as in the enemy-release hypothesis. It is also possible
that the seed source in Rice County is diverse and/or genetically inferior to the other two seed
sources.
Hypothesis #4 was addressed at Allemansratt, which had the largest differences in planting dates,
but found no significant results.
Hypothesis #3 is not addressed in this report as the conditions and maintenance at each site were
different enough such that the results would not be meaningful at this time.
Mortality is reported only for SWCC where data is available. It not analyzed or discussed
thoroughly in this report as meaningful results won’t be obtained for another 2 to 4 years.
The results, discussion, and conclusions presented here are preliminary. Data collected in the
next few years will be used in more meaningful analysis and presented at that time.

31
Literature cited
Asbjornsen, H., M.D. Toner, M. Gomez-Cardenas, L.A. Brudvig, C.M. Greenan, K.Schilling.
2007. Tree and stand transpiration in a Midwestern bur oak savanna after elm
encroachment and restoration thinning. Forest Ecology and Management 247: 209-219.
Chimner, R.A. and S.C. Resh. 2014. Are riparian bur oak phreatophytic? A stable water isotope
study in Homestead National Monument, Nebraska. Natural Areas Journal 34: 56-64.
Cogliastro, A., D. Gagnon, and A. Bouchard. 1997. Experimental determination of soil
characteristics optimal for the growth of ten hardwoods planted on abandoned farmland.
Forest Ecology and Management 96: 49-63.
Craft, K.J. and M.V. Ashley. 2007. Landscape genetic structure of bur oak (Quercus
macrocarpa) savannas in Illinois. Forest Ecology and Management 239: 13-20.
Craft, K.J. and M.V. Ashley. 2010. Pollen-mediated gene flow in isolated and continuous stands
of bur oak, Quercus macrocarpa (Fagaceae). American Journal of Botany 97: 1999-2006.
Curtis, J.T. 1959. The vegetation of Wisconsin. Madison, University of Wisconsin Press.
Darley-Hill, S. and W.C. Johnson. 1981. Acorn dispersal by the blue jay (Cyanocitta crostata).
Oecologia 50: 231-232.
Dickie, I.A., S.A. Schnitzer, P.B. Reich and S.E. Hobbie. 2007. Is oak establishment in old fields
and savanna openings context dependent? Journal of Ecology 95: 309-320.
Dow, B.D. and M.V. Ashley. 1996. Microsatellite analysis of seed dispersal and parentage of
saplings in bur oak, Quercus macrocarpa. Molecular Ecology 5: 615-627.
Faber-Langendoen, D. and J.R. Tester. 1993. Oak mortality in sand savannas following drought
in east-central Minnesota. Bulletin of the Torrey Botanical Society 120: 248-256.
Frelich, L.E., R. Montgomery, and J. Oleksyn. 2015. Northern Temperate Forest. Chapter 3,
pages 30-45, In, K. Peh, R. Corlett and Y. Bergeron, Editors. Handbook of Forest Ecology,
Routledge Press.
Frelich, L.E., C.M. Hale, S. Scheu, A.Holdsworth, L.Heneghan, P.J. Bohlen, and P.B. Reich.
2006. Earthworm invasion into previously earthworm-free temperate and boreal forests.
Biological invasions 8: 1235-1245.
Frelich, L.E. and E.J. Ostuno. 2012. Estimating wind speeds of convective storms from tree
damage. Electronic Journal of Severe Storms Meteorology 7: 1-19.
Frelich, L.E., P.B. Reich, and D.W. Peterson. 2015. Fire in upper Midwestern oak forest
ecosystems: an oak forest restoration and management handbook. USDA Forest Service,
Pacific Northwest Research Station, General Technical Report PNW-GTR-914.
Frelich, L.E. and P.B. Reich. 2010. Will environmental changes reinforce the impact of global
warming on the prairie-forest border of central North America? Frontiers in Ecology and
Environment 8: 371-378. DOI: 10.1890/080191.
Frelich, L.E. and P.B. Reich. 2002. Dynamics of old-growth oak forests. Pages 113-126 in,
W.J. McShea and W.H. Healy, editors: The ecology and management of oaks for wildlife.
Johns Hopkins University Press, Baltimore, MD, USA.

32
Galatowitsch, S., Frelich, L.E., and L. Phillips-Mao. 2009. Regional climate change adaptation
strategies for biodiversity conservation in a midcontinental region of North America.
Biological Conservation 142: 2012-2022.
Gerber, S., J. Chadoeuf, F. Gugerli, M. Lascaux, J. Buiteveld, J. Cottreil et al. 2014. High rates
of gene flow by pollen and seed in oak populations across Europe. Plos One 9 (1): e85130.
He, H.S., D.J. Mladenoff, E.J. Gustafson. 2002. Study of landscape change under forest
harvesting and climate-warming induced fire disturbance. Forest Ecology and Management
155: 257-270.
Iverson, L. R., A. M. Prasad, S. N. Matthews, and M. Peters. 2008. Estimating potential habitat
for 134 eastern US tree species under six climate scenarios. Forest Ecology and
Management. 254:390-406. http://www.treesearch.fs.fed.us/pubs/13412
Iverson, L., A. M. Prasad, S. Matthews, and M. Peters. 2011. Lessons learned while integrating
habitat, dispersal, disturbance, and life-history traits into species habitat models under
climate change Ecosystems 14:1005-1020. http://treesearch.fs.fed.us/pubs/38757
Johnson, P.S. 1990. Quercus macrocarpa Michx, Bur oak. Pages 686-692 in, R.M Burns and
B.H. Honkala, Technical Coordinators, Silvics of North America Volume 2, Hardwoods.
Washington DC, USDA Forest Service, Agricultural Handbook 654.
Kabrick, J.M., D.C. Dey, J.W. Van Sambeek, M.V. Coggeshall and D.F. Jacobs. 2012.
Quantifying flooding effects on hardwood seedling survival and growth for bottomland
restoration. New Forests 43: 695-710.
Kittelson, P.M., C. Pinahs, J. Dwyer, A. Ingersoll, E. Mans, J. Rieke, et al. 2009. Age structure
and genetic diversity of four Quercus macrocarpa (Michx.) populations in fragmented oak
savanna along the central Minnesota River Valley. American Midland Naturalist 161: 301-
312.
Koenig, W.D., J. M.H. Knops, J.L. Dickinson and B. Zuckerberg. 2009. Latitudinal decrease in
acorn size in bur oak (Quercus macrocarpa) is due to environmental constraints, not avian
dispersal. Botany 87: 349-356.
Laliberté, E., A. Bouchard and A. Cogliastro. 2008. Optimizing hardwood reforestation in old
fields: the effects of treeshelters and environmental factors on tree seedling growth and
physiology. Restoration Ecology 16: 270-280.
Laliberté, E., A. Cogliastro and A. Bouchard. 2008. Spatiotemporal patterns in seedling
emergence and early growth of two oak species direct-seeded on abandoned pastureland.
Annals of Forest Science 65: 407.
Marcum, P.B., D.T. Busemeyer, L.R. Philippe, and J.E. Ebinger. 2010. Vascular flora and
woody plant structure and composition at Gooseberry Island Nature Preserve, Kankakee
County, Illinois. Castanea 75: 341-352.
Nowacki, G.j. and M.D. Abrams. 2008. The demise of fire and “mesophication” of forests in the
eastern United States. BioScience 58: 123-138.
Nuzzo, V.A. 1986. Extent and status of mid-west oak savanna: presettlement and 1985. Natural
Areas Journal 6: 6-36.
33
Peterson, D.W. and P.B. Reich. 2001. Prescribed fire in oak savanna: fire frequency effects on
stand structure and dynamics. Ecological Applications 11: 914-927.
Prasad, A. M., L. R. Iverson., S. Matthews., M. Peters. 2007-ongoing. A Climate Change Atlas
for 134 Forest Tree Species of the Eastern United States [database].
https://www.nrs.fs.fed.us/atlas/tree, Northern Research Station, USDA Forest Service,
Delaware, Ohio.
Roth, A.M., T.J.S. Whitfeld, A.G. Lodge, N. Eisenhauer, L.E. Frelich and P.B. Reich. 2015.
Invasive earthworms interact with abiotic conditions to influence the invasion of common
buckthorn (Rhamnus cathartica). Oecologia 178: 219-230.
Schulte, L.A., Mottl, E.C., and B.J. Palik. 2011. The association of two invasive shrubs, common
buckthorn (Rhamnus cathartica) and Tatarian honeysuckle (Lonicera tatarica), with oak
communities in the Midwestern United States.
Singh, S., and C. Stasolla. 2016. Response of bur and red oak seedlings to NaCl-induced salinity.
Acta Physiol Plant 38: 104.
Stambaugh, M.C. and R.P. Guyette. 2009. Progress in constructing a long oak chronology from
the central United States. Tree-ring Research 65: 147-156.
Truax, B. and D. Gagnon. 1993. Effects of straw and black plastic mulching on the initial growth
and nutrition of butternut, white ash and bur oak. Forest Ecology and Management 57: 17-
27.
Wyckoff, P.H., R. Greiman, A. Krueger, and L. Luce. 2012. Forest dynamics at Minnesota’s
prairie-forest border driven by invasive buckthorn (Rhamnus cathartica) and native bur
oak (Quercus macrocarpa). Journal of the Torrey Botanical Society 139: 311-322. Light,
size and soil moisture explain 2/3 variarion in bur oak sapling growth in west central MN.
Moisture more important for relative growth than absolute.
Ziegler, S.S., E.R. Larson, J. Rauchfuss, and G.P. Elliot. 2008. Tree establishment during dry
spells at an oak savanna in Minnesota. Tree-Ring Research 64: 47-54.


![Comparative Analysis of Arabidopsis Ecotypes Reveals a · Comparative Analysis of Arabidopsis Ecotypes Reveals a Role for Brassinosteroids in Root Hydrotropism1[OPEN] Rui Miao,a,2](https://img.dokumen.tips/doc/110x75/5fd77669ed73d6608c569009/comparative-analysis-of-arabidopsis-ecotypes-reveals-a-comparative-analysis-of-arabidopsis.jpg)