Embed Size (px)
Citation preview

1
ACCELERATED LABORATORY TESTING PROTOCOL TO MEASURE
ASPHALT MIXTURE FRICTION CHARACTERISTICS
Dr. Michael Heitzman, PE
Assistant Director, National Center for Asphalt Technology, Auburn University
Auburn, AL, USA, e-mail: [email protected]
Srikanth Erukulla
Master Student, Department of Civil Engineering, Auburn University
Auburn, AL, USA, e-mail: [email protected]
Submitted to the 3rd
International Conference on Road Safety and Simulation,
September 14-16, 2011, Indianapolis, Indiana USA
ABSTRACT
The surface asphalt mixture is a key component of the friction between the vehicle tire and
pavement surface. Some regions of the United States do not have local sources of friction
aggregate and, thus, transport friction aggregate long distances to meet friction criteria. Most
agencies are reluctant to place experimental test sections in the field because of the high cost of
construction, the multiple years to measure friction performance, and the risk to the public.
Current material testing only measures the friction characteristics of the coarse aggregate
particles and does not provide the agency with any guidance regarding the size or proportion of
the friction aggregate needed to sustain the desired friction. The National Center for Asphalt
Technology (NCAT) initiated a research program, sponsored by the Federal Highway
Administration (FHWA), to develop laboratory protocol that conditions and measures pavement
surface friction. The initial phase of this research developed a prototype device, the NCAT
Three-Wheel Polishing Device (TWPD), that accelerates the polishing of the pavement surface.
The second phase of this research program validated the ability of the NCAT TWPD to
distinguish between asphalt pavement surfaces with varying friction performance. The
validation study applies the laboratory test protocol to four surface mixtures with terminal field
friction performance ranging from SN(64)R of 20 to 50. This accelerated test protocol has the
potential to lower the cost of asphalt pavement surfaces, which stretches highway agency funds
to improve the surface friction of more lane-miles of the roadway network.
Keywords: asphalt, friction, laboratory, pavement.
INTRODUCTION
The asphalt mixture on the pavement surface is a key component of the friction between the
vehicle tire and pavement surface. The pavement surface macrotexture is controlled by the
asphalt mixture’s aggregate gradation; the surface microtexture is controlled by the aggregate
geology. (Kummer and Meyer, 1963; Forster, 1989) Microtexture defines the magnitude of skid
2
resistance; macrotexture controls the change of skid resistance as speed increases. At low
speeds, microtexture defines the level of friction, and macrotexture has little effect on friction.
Many regions of the United States have abundant sources of aggregates that have good friction
properties. Other regions do not have local sources of friction aggregate and are required to
transport friction aggregate long distances to satisfy pavement surface friction requirements.
Shipping high quality friction aggregate significantly increases the cost of the asphalt surface
mixture for the highway agency.
Highway agencies have several means to measure the characteristics of aggregate to specify the
required properties to achieve surface friction. Some of the common methods are the British
Polish Wheel and Pendulum Tester (ASTM D3319 and ASTM E-303), LA abrasion (ASTM C
535) and aggregate geology. These methods are generally used to measure or qualify the friction
characteristics of the coarse aggregate particles. (Nitta et al., 1990; Dewey et al., 2001) These
tests do not measure the response of the blend of aggregate in the surface mixture. The test does
not provide the agency with any guidance regarding the size or proportion of the friction
aggregate needed to sustain the desired surface friction characteristics.
Locked-wheel skid tester (LWST) (ASTM E-274) is the most commonly used device in the U.S.
for roadways. (Henry, 2000) In this method, the vehicle speed is the velocity between the
surface of the tire and the pavement surface in the left wheel path. The test measures the torque
for one second after the tire is fully locked and then computes the correspondent friction value.
The measurement of skid resistance using LSWT is affected by several factors, including
pavement surface texture, pavement age, and type of tire used. The friction measurement can be
performed with a ribbed tire (ASTM E 501) or smooth tire (ASTM E 524). The ribbed tire is
preferred by most United States highway agencies because it is less sensitive to water film
thickness than the smooth tire.
Agencies are interested in optimizing the amount of costly friction aggregate in the asphalt
mixture, but have been generally limited to placing full-scale field test sections to measure
friction performance. Most agencies are reluctant to place experimental field test sections
because of the high cost of preparing and placing test sections, the multiple years of
measurements to establish the friction performance, and the risk to the public if a test section
fails to maintain the desired level of friction. As a result, agencies continue to apply very
conservative prescriptive material specifications for asphalt surface mixtures. A surrogate
accelerated laboratory test is needed to develop cost-effective asphalt pavement surface mixtures
that maintain the optimal friction characteristics.
NCAT initiated a research program sponsored by the FHWA with the objective of developing a
laboratory protocol that can both condition (polish) and measure the pavement surface friction.
The initial phase of this research developed the TWPD, a prototype pavement surface
conditioning device that accelerates the polishing of the pavement surface. The second phase of
this research program validated the ability of the TWPD to distinguish between asphalt pavement
surfaces with good and poor friction performance.

3
The TWPD was developed as part of a 2006 initial study. Vollor and Hanson showed that the
friction values rapidly decreased during initial polishing. The friction values continued to
decrease on further polishing and finally reach a terminal condition. They reasoned that the
TWPD was able to polish the microtexture of exposed aggregates. (Vollor and Hanson, 2006)
This paper presents a portion of the validation phase of the FHWA study. In addition to
validating the TWPD concept, the second phase examined components of the test protocol and
explored the influence of varying amounts of coarse friction aggregate in the mixture. (Erukulla,
2011)
LABORATORY TEST PROTOCOL
The test protocol includes preparation of test slabs with hot mix asphalt (HMA) mixture and
cycles of testing and conditioning to achieve a friction performance history. The selected asphalt
mixture can be prepared in the lab with the component aggregates and asphalt binder or can be
prepared from loose plant-produced mixture. For this study, the mixtures were prepared from
the individual aggregate components obtained from their sources and blended with PG 76 -22 or
PG 67 -22 binder available in the NCAT lab. Each aggregate was dry screened and reblended to
match the field mix properties.
Loose mixture was prepared in the lab to make three slabs of each mixture. A test slab is 51.3
cm by 51.3 cm and 5.1 cm thick. The amount of mixture is determined by the theoretical
maximum specific gravity of the mixture and a target 7% compacted voids in the slab. The
correct amount of mixture is divided into four equal amounts, reheated to compaction
temperature, and placed in each quadrant of the slab mold. The slab compactor frame is
designed to compact the slab until the roller contacts the top of the slab mold to achieve the
target air voids in the mixture. The compacted mixture is allowed to cool in the mold before it is
removed.
The compacted slab is placed on a steel pallet for testing and conditioning. The slab is not
removed from the pallet until all testing and conditioning cycles are completed to avoid
damaging the slab. Prior to TWPD conditioning, each slab has initial testing with the dynamic
friction tester (DFT), ASTM E-1911, and circular texture meter (CTM), ASTM E-2157.
Templates are placed over the slab to properly align the testing devices with the circular pattern
polished by the TWPD, as shown in Figure 1. This ensures that the friction and texture
measurements are taken in the same location with each successive set of tests. Three replicate
measurements are taken for each DFT test. The CTM measurement is performed on the air-dried
slab surface.
The DFT consists of three rubber sliders mounted to a circular plate that reaches up to 100 km/h
tangential speed. The DFT system can be used to measure friction characteristics of laboratory-
compacted slabs as well as field pavements. Water is sprayed on the rubber pad and pavement
interface to simulate wet-weather friction. DFT measures a continuous spectrum of dynamic
coefficient of friction of the pavement surface over the range of 0 to 80 km/h with good
reproducibility. (Vollor and Hanson, 2006)

4
After the initial DFT and CTM measurements are taken, the slab is placed in the TWPD for a
prescribed number of conditioning cycles. The number of conditioning cycles is defined by the
planned test matrix and generally increases between testing as the series progresses. The TWPD
applies three 0.34 MPa pneumatic rubber tire footprints on the surface of the slab. The three-
wheel turntable riding on the slab weighs 41.4 Kg and moves at 60 rpm. The wheels rotate
around a 284 mm diameter circle, which matches the measurement path of DFT and CTM testing
devices. A re-circulating water spray is applied to the surface to remove asphalt and aggregate
debris abraded by the polishing process. Figure 2 shows the details of the NCAT TWPD. After
the planned number of conditioning cycles, the DFT and CTM are placed on the test slab to
measure the change in surface friction properties.
Circular Texture Meter Dynamic Friction Tester
FIGURE 1 Measuring friction and texture of laboratory-conditioned slabs
FIGURE 2 NCAT Three-Wheel Polishing Device

5
VALIDATION RESEARCH PLAN
Test Matrix
The test matrix for this validation study is intended to measure the laboratory performance of
HMA surface mixtures that have well-documented field friction performance. The original test
matrix planned to examine six mixtures. The final test matrix examined four mixtures.
The test matrix is designed to capture the complete laboratory friction performance history by
stopping the conditioning process at defined intervals and measuring both DFT and CTM. More
tests were performed early in the conditioning process to characterize the rapid change in friction
before the mixture surface reaches a terminal value. The planned testing intervals were 0 cycles,
500 cycles, 1000 cycles, 2000 cycles, 4K, 8K, 16K, 32K, 64K and 128K cycles. To shorten the
testing time, the dense-graded mix slabs were terminated at 100K cycles. This sequence of
cycles takes three to five days to complete one slab. With 54 slabs involved in the entire study,
slabs were divided into groups of six. Each set of six slabs were randomly re-sorted for each
cycle of conditioning and testing. This eliminated the potential for biased test results that could
be created by a fixed rotation of slabs.
According to ASTM 1911, the pads of the DFT need to be replaced after every 12 tests (drops).
Preliminary testing showed that the DFT pads did not show measurable wear, nor change in
measured friction, until after 54 drops on conventional dense-graded HMA surfaces. So the
ASTM 1911 protocol was modified and the pads were changed after every 54 drops for effective
pad use and cost reduction. Based on this test modification, the DFT pads were changed after
each three cycles of conditioning for a group of six slabs. The DFT device and pads are checked
for consistent measurement using a calibration plate after every set of six drops. The TWPD
tires are replaced at the beginning of each set of six slabs.
Selection of Asphalt Mixtures
The study applied the laboratory test protocol to four surface mixtures representing dense-graded
and gap-graded (stone mastic asphalt) mixtures with terminal field friction performance ranging
from SN(64)R of 20 to 50. The mixtures were selected from test sections on the NCAT
Pavement Test Track with friction performance measured with the Alabama DOT LWST,
ASTM E-274. The two gap-graded mixes had the highest (50) and lowest (20) terminal friction
performance. The two dense-graded mixtures had measured terminal friction performance of 40
and 25. The four mixtures provide two distinct surface macrotextures and the common range of
SN(64)R measured friction.
The NCAT Pavement Test Track is a full-scale accelerated pavement testing facility that
generates a new study every three years. Experimental sections on the Test Track are funded by
sponsors, most commonly state highway agencies. Forty-six different flexible pavements are
installed on the 2.8 km oval track. A total of 10 million equivalent single axle loads (ESALs) are
applied to the test sections over a period of two years. This is equal to approximately ten years

6
of truck traffic on the Interstate. The ESALs are applied with five fully loaded triple-trailer
trucks. The pavement surface friction performance is measured once a month.
Figure 3 shows the friction performance history of the selected mixtures at the Test Track. The
values, in general, are monthly LWST measurements taken in the middle 46 m of each 61 m test
section. The variability in the performance reflects a number of common factors. The
predominant variation is the location of the test wheel with respect to the wheel path. Other
factors include the cleanliness of the pavement surface, testing temperature, and equipment
measurement error.
Mixture E1 is a gap-graded limestone mix with a terminal friction value of 50 placed on the Test
Track in 2003. Mixture W7 is a gap-graded limestone mixture with the terminal friction of 20
placed on the Test Track in 2000. The figure shows mixture W7 was replaced after 6 million
ESALs of truck trafficking. Mixture N4 is a dense-graded granite mixture with the terminal
friction of 40, and mixture W3 is a dense-graded limestone mixture with the terminal friction of
25.
FIGURE 3 Friction performance of four selected mixtures on the NCAT Test Track
TEST RESULTS AND ANALYSIS
The focus of this paper is the correlation between the laboratory DFT values and NCAT
Pavement Test Track SN(64)R values.

7
For interested readers, the CTM Mean Profile Depth (MPD) values remained relatively
unchanged over the series of conditioning cycles. Mixture E1, gap-graded was approximately
0.65 mm MPD. Mixture W7, gap-graded was 0.78 mm MPD. Mixture N4, dense-graded was
0.20 mm MPD. Mixture W3, dense-graded was 0.26 mm MPD.
Dynamic Friction Tester Results
For each replicate test, the DFT measures and records the friction value at five different speeds
(0, 20, 40, 60, and 80 km/h). To verify the quality of the data, the DFT friction values were
analyzed statistically with respect to range for each group of three replicate tests. This value was
computed for each slab at each recorded speed and at each interval of polishing cycles. This
produced 50 computed range values for each slab for a comprehensive data quality analysis.
The outliers for the computed range were identified as values that fell outside three standard
deviations of the mean range. The values that fell outside this upper limit were marked as
potential outliers. In general, 10% of the range values were above the outlier limit, but 90% of
the identified outliers were associated with DFT(0) and DFT(80) measurements. The test results
at 0 and 80 km/h showed a large variation due to dynamic conditions of DFT response at the
beginning and end of each test. As a result, the measured DFT values at these extreme speeds
were not used for data analysis. The average friction for the three replicate measurements, on
each slab at the 40 km/h speed, is given in Tables 1, 2, 3 and 4. These values describe the
friction performance history of each mixture.
The standard deviation of the three replicate DFT tests at 20, 40 and 60 km/h ranged from 0.029
to 0.040. These values met the ASTM E1911 standard precision statement of eight
measurements on the same test surface with a range of standard deviations from 0.044 at 30
km/h to 0.038 at 60 km/h.
TABLE 1 Laboratory friction performance of Mix E1
E1 Mix
Cycles Slab 10 Slab 11 Slab 12 DFT(40) Avg.
0 0.239 0.228 0.231 0.232
500 0.344 0.339 0.287 0.324
1000 0.540 0.462 0.434 0.479
2000 0.551 0.492 0.468 0.503
4000 0.573 0.510 0.474 0.519
8000 0.581 0.543 0.522 0.549
16000 0.551 0.544 0.514 0.536
32000 0.542 0.538 0.533 0.538
64000 0.566 0.521 0.501 0.529
128000 0.488 0.503 0.482 0.491

8
TABLE 2 Laboratory friction performance of Mix W7
W7 Mix
Cycles Slab 16 Slab 17 Slab 18 DFT(40) Avg.
0 0.209 0.295 0.281 0.262
500 0.296 0.390 0.317 0.334
1000 0.372 0.416 0.367 0.385
2000 0.338 0.375 0.356 0.356
4000 0.328 0.339 0.341 0.336
8000 0.333 0.342 0.321 0.332
16000 0.318 0.314 0.310 0.314
32000 0.292 0.288 0.277 0.286
64000 0.260 0.262 0.280 0.267
128000 0.244 0.250 0.260 0.251
TABLE 3 Laboratory friction performance of Mix N4
N4 Mix
Cycles Slab 1 Slab 2 Slab 3 DFT(40) Avg.
0 0.320 0.294 0.253 0.289
500 0.508 0.585 0.428 0.507
1000 0.518 0.539 0.451 0.503
2000 0.493 0.507 0.430 0.477
4000 0.511 0.557 0.465 0.511
8000 0.519 0.564 0.520 0.534
16000 0.495 0.542 0.462 0.500
32000 0.508 0.504 0.483 0.499
64000 0.470 0.414 0.416 0.433
100000 0.465 0.391 0.438 0.431
TABLE 4 Laboratory friction performance of Mix W3
W3 Mix
Cycles Slab 1 Slab 2 Slab 3 DFT(40) Avg.
0 0.350 0.330 0.362 0.347
500 0.454 0.481 0.527 0.487
1000 0.445 0.448 0.504 0.466
2000 0.461 0.459 0.461 0.460
4000 0.437 0.459 0.487 0.461
8000 0.443 0.397 0.458 0.433
16000 0.360 0.372 0.450 0.394
32000 0.375 0.384 0.404 0.388
64000 0.352 0.368 0.383 0.368
100000 0.340 0.365 0.376 0.360

9
Correlation of Laboratory Data to Field Data
The objective of this section is to determine if a correlation exists between DFT results from
laboratory and friction history based on the Alabama DOT LWST measurements at the NCAT
Pavement Test Track. A reasonable correlation between the laboratory-measured and field-
measured friction values would help assess the friction performance of new mix design without
the need for costly, multi-year field test sections.
In 2008, Khasawneh studied the friction characteristics of pavement surfaces using the LWST,
DFT and CTM. Four pavement sections were selected, and the results showed that friction
values measured with a LWST did correlate with friction numbers measured using the DFT. The
LWST SN(64)R was found to significantly correlate to DFT64, but not to CTM MPD. This was
attributed to the use of ribbed tire on the LWST, which is insensitive to macrotexture.
(Khasawneh et. al., 2008)
The tables of laboratory data presented earlier in this paper were the DFT(40) values from the
study’s database. They are the measured values of friction properties of the test slabs at 40 km/h.
To more closely relate to the field LWST friction values at 64 km/h, the laboratory-measured
friction values at 60 km/h were used to examine the correlation. Figure 4 shows the measured
friction histories at 60 km/h from the laboratory-conditioned and tested mixtures.
FIGURE 4 Summary of laboratory DFT(60) measurements
10
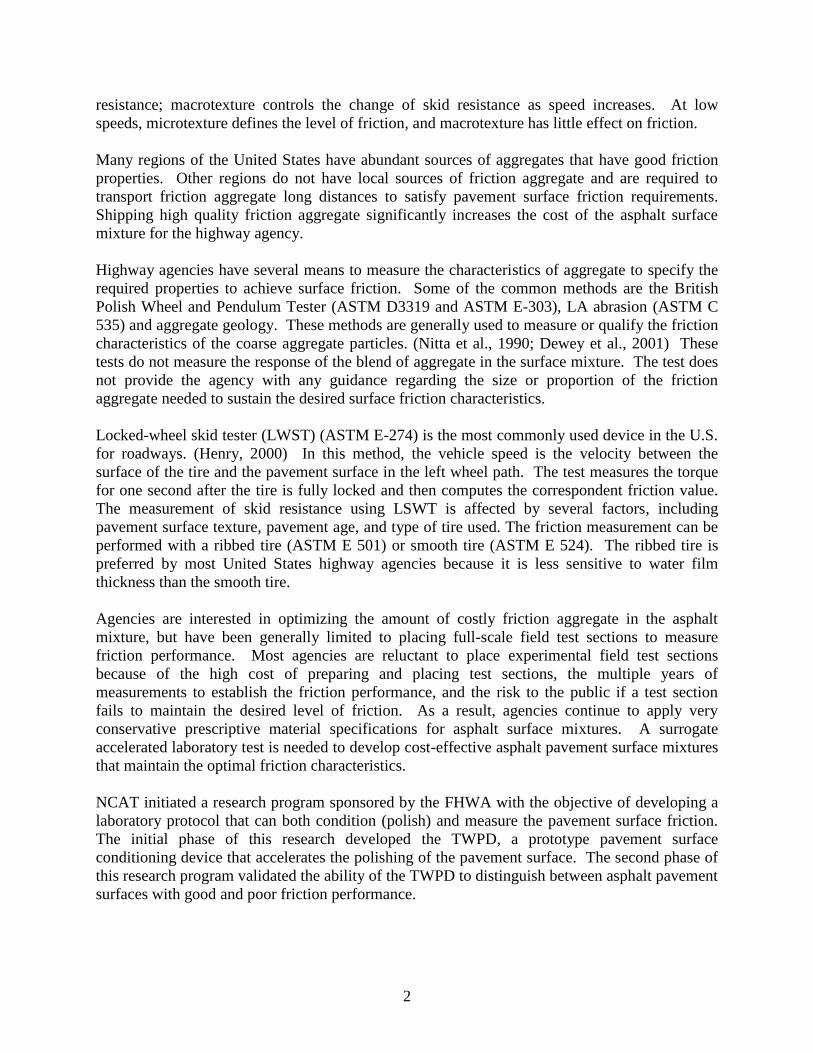
The ranking of the four mixtures based on the laboratory result in Figure 4 is in agreement with
Test Track mixture ranking, as shown in Figure 3. The results demonstrate that mix E1 had the
best friction performance of the four mixtures. Of the dense-graded mixes, mix N4 had better
friction performance when compared to mix W3. Mix W7 showed the poorest friction
performance of all the mixtures studied in this research. Table 5 shows the ranking of mixtures
based on laboratory and Test Track results.
TABLE 5 Ranking based on laboratory and Test Track results
Mix
Type
Ranking based on
Laboratory
Results
Test Track
Results
E1 1 1
N4 2 2
W3 3 3
W7 4 4
A simple linear regression analysis was performed to examine the correlation between the
laboratory friction data measured using DFT with field friction data measured using the LWST
for each mixture. The regression analysis was performed between the friction coefficients
measured by the DFT at slip speed of 60 km/h, DFT(60), and friction coefficient measured using
LWST at slip speed of 64 km/h, SN(64)R.
The early friction measurements from the Test Track and laboratory are not included in the
analysis due to the rapid change in friction values in that time period. The friction values tend to
stabilize after 16,000 cycles in the laboratory and after 1.2 million ESALs on the Test Track. To
match the field and laboratory data to examine the correlation, the laboratory polishing cycles are
matched with corresponding Test Track ESALs in systematic order. The laboratory DFT(60)
value at 16,000 cycles is matched with the SN(64)R value at 1.2 million ESALs. As the number
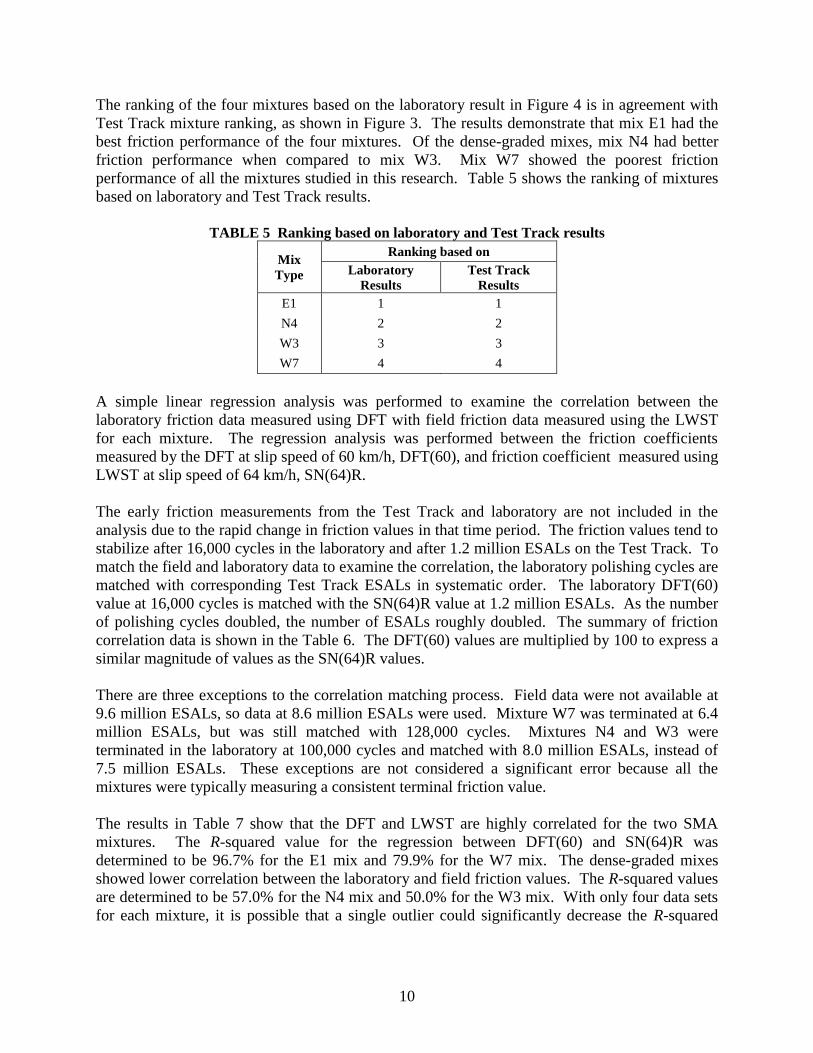
of polishing cycles doubled, the number of ESALs roughly doubled. The summary of friction
correlation data is shown in the Table 6. The DFT(60) values are multiplied by 100 to express a
similar magnitude of values as the SN(64)R values.
There are three exceptions to the correlation matching process. Field data were not available at
9.6 million ESALs, so data at 8.6 million ESALs were used. Mixture W7 was terminated at 6.4
million ESALs, but was still matched with 128,000 cycles. Mixtures N4 and W3 were
terminated in the laboratory at 100,000 cycles and matched with 8.0 million ESALs, instead of
7.5 million ESALs. These exceptions are not considered a significant error because all the
mixtures were typically measuring a consistent terminal friction value.
The results in Table 7 show that the DFT and LWST are highly correlated for the two SMA
mixtures. The R-squared value for the regression between DFT(60) and SN(64)R was
determined to be 96.7% for the E1 mix and 79.9% for the W7 mix. The dense-graded mixes
showed lower correlation between the laboratory and field friction values. The R-squared values
are determined to be 57.0% for the N4 mix and 50.0% for the W3 mix. With only four data sets
for each mixture, it is possible that a single outlier could significantly decrease the R-squared
11
value. For example, the DFT(60) value at 32,000 cycles (46.8) for N4 mix is higher when
compared to SN(64)R data (39.8), which resulted in a low R-squared value.
TABLE 6 Matched friction data for DFT and LWST correlation
Mix Type Cycles DFT(60)*100 ESALs (millions) SN(64)R
E1
16000 51.1 1.2 50.0
32000 51.8 2.5 50.2
64000 50.2 4.8 49.9
128000 46.4 8.6 47.2
W7
16000 31.2 1.2 22.3
32000 29.0 2.5 21.6
64000 27.7 4.8 20.5
128000 26.7 6.4 17.9
N4
16000 46.9 1.2 46.4
32000 46.8 2.5 39.8
64000 41.0 4.8 38.8
100000 40.7 8.0 36.5
W3
16000 37.2 1.2 32.6
32000 37.3 2.5 26.5
64000 35.3 4.8 25.3
100000 34.8 8.0 24.7
TABLE 7 Simple linear regression between DFT(60) and SN(64)R
Mix
Type Model
ANOVA Table R-squared, %
F-Statistic p-value
E1 SN(64)R = 20.3 + 0.582 DFT60*100 59.34 0.016 96.7
W7 SN(64)R = -4.6 + 0.878 DFT60*100 7.93 0.106 79.9
N4 SN(64)R = -0.3 + 0.927 DFT60*100 2.65 0.245 57.0
W3 SN(64)R = -44.0 + 1.97 DFT60*100 2.00 0.293 50.0
The results of the regression analysis are supported by ANOVA results. The regression equation
for mix E1 shows that the DFT(60)*100 p-value is below the 0.05 significance level. The
regression equation for mix W7 did not meet the 0.05 level, but the analysis computed a high R-
squared value. This difference reflects a bias between the measurements of DFT(60) and
SN(64)R even though they are highly correlated. The positive slope in the regression equations
indicates that the two variables tend to increase together.
The data for all four mixtures were combined to look at an overall correlation. Figure 5 shows
linear regression between the DFT(60) and SN(64)R for the combining data set. The R-squared
value for the correlation between DFT(60) and SN(64)R was determined to be 0.953. Based on
this observation, it can be concluded that the laboratory-conditioned and measured DFT(60)
terminal friction values correlate very well to the field-measured SN(64)R terminal friction
values across different mixture types with different friction characteristics.

12
FIGURE 5 Laboratory DFT(60)*100 versus NCAT Pavement Test Track SN(64)R friction data
CONCLUSIONS AND RECOMMENDATIONS
Based on the information presented in this paper, the following conclusion can be stated.
1) The TWPD rapidly evaluates the friction characteristics of asphalt surface mixtures. The
TWPD can achieve a terminal surface friction condition with less than 100,000 cycles of
polishing. At 60 cycles per minute, the terminal friction of a test slab can be evaluated in
two days.
2) The results of this second phase validation study demonstrate that the TWPD polishes the
mixture surface in a similar pattern as field traffic.
3) The laboratory-conditioning and testing protocol correctly ranked the four mixtures in the
study, which had differing gradation and friction characteristics.
4) The method used to match the field and laboratory friction data, ESALS to cycles, was a
reasonable approach, but should be explored further.
5) Results showed very good correlation of terminal friction performance between the
laboratory and field measurements over a range of friction (SN(64)R from 20 to 50) and
two types of surface macrotextures (gap-graded and dense-graded, MPD from 0.78 to
0.20 mm).
The results of this study lead to the following recommendations.
1) The NCAT TWPD test protocol can be used to predict field terminal friction of asphalt
mixtures.
13
2) This study has only examined four mixtures. Additional mixtures should be studied to
strengthen the laboratory to field correlation for terminal friction.
3) The NCAT TWPD test protocol can be used to begin examining the influence of the
aggregate properties in the mixture on pavement surface friction.
The results of the validation study showed that the laboratory protocol correlated very well with
friction performance of controlled field sections at the NCAT Pavement Test Track. The test
protocol gives highway agencies a tool to quickly evaluate alternative blends of aggregates to
establish cost-effective surface mixtures that maintain optimum friction characteristics. This
accelerated test protocol has the potential to lower the cost of asphalt pavement surfaces, which
stretches highway agency funds to improve the surface friction of more lane-miles of the
roadway network.
ACKNKOWLEDGEMENTS
The authors thank the FHWA for sponsoring this research program. The authors also thank the
guidance and assistance of the NCAT Laboratory Service Center to accomplish the laboratory
testing. The content of this report reflects the views of the authors who are responsible for the
facts and accuracy of the data presented. The content does not reflect the official views of
NCAT, Auburn University, or the FHWA.
REFERENCES
Dewey, G. R., Robords, A. C., Armour, B. T., and Muethel, R. (2001), “Aggregate Wear and
Pavement Friction,” Transportation Research Board, Annual Meeting CD-ROM, 17p.
Erukulla, S. (2011), “Refining a Laboratory Procedure to Characterize Change in Hot-Mix Asphalt
Surface Friction,” Master of Science thesis, Auburn University, Auburn, AL.
Forster, S.W. (1989), “Pavement Microtexture and its Relation to Skid Resistance,” Transportation
Research Record 1215, Transportation Research Board, TRB, National Research Council,
Washington D.C., pp. 151–164.
Henry, J. J. (2000), “Evaluation of Pavement Friction Characteristics,” NCHRP Synthesis of Highway
Practice 291, Transportation Research Board, National Research Council.
Khasawneh, M. and Liang, R. (2008), “Correlation Study Between Locked Wheel Skid Trailer
and Dynamic Friction Tester,” Proceedings of the 2008 Annual Meeting of Transportation
Research Board, Washington D.C., 2008.
Kummer, H.W. and Meyer, W.E. (1963), “Penn State Road Surface Friction Tester as Adapted
to Routine Measurement of Pavement Skid Resistance,” Road Surface Properties, 42nd Annual
Meeting, January.
Nitta, N. Saito, K. and Isozaki, S. (1990), “Evaluating the Polishing Properties of Aggregates and
Bituminous Pavement Surfaces by Means of the Penn State Reciprocating Polishing Machine,”
Surface Characteristics of Roadways, 194 International Research and Technologies, ASTM SPT

14
1031, W. E. Meyer, and J. Reichert, Eds., American Society for Testing and Materials,
Philadelphia, PA, pp. 113–126.
Vollor, T. W., and Hanson, D. I. (2006), “Development of Laboratory Procedure for Measuring
Friction of HMA Mixtures – Phase I,” NCAT Report No. 06-06, National Center for Asphalt
Technology.