Embed Size (px)
Citation preview

ACCELERATED CURING PROTOCOL FOR BITUMEN STABILIZED MATERIALS
Percy Kgothatso Moloto B. (Eng)
Thesis presented in partial fulfilment of the requirements for the degree of Master of Science (Engineering) at Stellenbosch University
Prof. K. J. Jenkins Ph.D. Supervisor
March 2010

ii

iii
DECLARATION I, the undersigned, hereby declare that the work contained in this thesis is my own original work and that I have not previously in its entirety or in part, submitted it at any university for a degree. Signature : .................................... P. K. Moloto Date : ....................................
Copyright © 2008 Stellenbosch University All rights reserved

iv

v
For Lynee, Kegoratile and Kgothatso

vi

vii
Executive Summary
The research conducted in this study forms part of the Phase II process of the Bitumen Stabilized Materials (BSMs) Guideline improvement initiative. The initiative aims to address areas of concern in the cold mix design procedures for BSMs. Current road rehabilitation using the bitumen stabilization process requires testing of representative specimens as means to evaluate pavement performance over time. In order to adequately acquire specimens representative of field conditions, it is necessary to condition the materials in a process called curing. Although curing procedures have been standard in many countries on different continents, the protocols are varied and an acceptable procedure is currently not available. In order to develop an acceptable curing protocol for BSMs, both field and laboratory environments were investigated. Considering that curing takes time in the field, production of representative samples intended for laboratory testing must undergo accelerated curing in the laboratory. Given the complexities involved in achieving close correlations between field and laboratory environments, the research strived to reconcile field and laboratory material behaviour. In particular, the main objective of the research was to unify the curing protocol for BSMs, with the standardization of the curing protocol being top priority. In this study, laboratory results have confirmed that the different natures of curing mechanisms inherent in a BSM-foam and BSM-emulsion contribute to irreconcilable material behaviour(s). Results have confirmed that curing of BSM-foam is largely a function of water repulsion, with the addition of active filler dominating material performance almost immediately. Unlike BSM-foam, curing of BSM-emulsion is both a function of the breaking of emulsion during the initial phase and the gradual release of moisture with time. In this instance, BSM-emulsion material performance resembled active filler influences past the breaking of the emulsion cycle. Consequently, given the observed differences regarding material behaviour(s), the unification of the curing protocol for BSMs has not been successful. In terms of accommodation of active filler in the final curing protocol for BSMs, findings in this research have revealed that active filler’s tendency to absorb moisture in the initial stages requires longer curing time to help extract the absorbed moisture during the curing process. Although the use of active filler has an impact on curing, its inclusion in a BSM does not justify its extension in the curing time as cementation is not one of the desired properties of these materials. BSMs are primarily desirable for their flexibility in pavement structures. For this reason, active filler was omitted in the final curing protocol due to reasons of simplifying the mix design process. In conclusion, different curing protocols were tested and developed to help produce reconcilable material behaviour in both the field and laboratory environments. Through the reconciliation of key material properties such as the resilient modulus, long term equilibrium moisture conditions and shear parameters, an acceptable standardized curing protocol for BSM-foam and BSM-emulsion intended for application in industrial laboratories across South Africa was successfully developed.

viii
Opsomming
Die navorsing tydens hierdie studie gedoen, vorm deel van die Tweede fase van die Bitumen Gestabiliseerde Materiale Riglyne verbeteringsinisiatief. Die inisiatief het ten doel om areas van bekommernis in die kouemengsel-ontwerp-prosedures vir Bitumen Gestabiliseerde Materiale aan te spreek. Huidige padrehabilitasie wat gebruik maak van die Bitumen Gestabiliseerde Materiale proses, vereis toetsing van verteenwoordigende monsters om sodoende plaveiselgedrag oor ‘n tydperk te evalueer. Materiale moet deur die verouderingsproses gekondisioneer word, om sodoende monsters te verkry wat akkuraat verteenwoordigend van veldtoestande is. Alhoewel verouderingsprosesse in meeste lande - op verskillende kontinente - gestandariseerd is, is die protokol verskillend en ‘n aanvaarbare prosedure is nie tans beskikbaar nie. Beide veld- en laboratoriumomgewings is ondersoek, om sodoende ‘n aanvaarbare verouderings-protokol vir Bitumen Gestabiliseerde Materiale te ontwikkel. Wanneer in ag geneem word dat veroudering in die veld tydrowend is, moet vervaardiging van verteenwoordigende monsters vir laboratoriumgebruik versnelde veroudering in die laboratoruim ondergaan. Gegee die kompleksiteite betrokke om goeie korrelasie tussen veld- en laboratoriumomgewings te verkry, het die navorsing daarna gestreef om die veld- en laboratoriummateriaalgedrag te verenig. Die hoofdoel van die navorsing was om die verouderingsprotokol vir Bitumen Gestabiliseerde Materiale te verenig met die stardaardisering van die verouderingsprotokol as top prioriteit. In hierdie studie het laboratorium resultate bevestig dat die verskillende aard van voorbereidings- meganismes inherent in BSM-skuim en BSM-emulsie bydra tot onversoenbare materiaalgedrag. Resultate het bevestig dat voorbereiding van BSM-skuim ’n funksie van waterrepulsie het en met die byvoeging van aktiewe vullers dominieer dit die materiaalgedrag byna onmiddelik. Anders as BSM-skuim is die voorbereiding van BSM-emulsie beide ’n funksie vir die breek van emulsie tydens die begin fase en die geleidelike vrystelling van vog oor tyd. In hierdie geval het BSM-emulsie se materiaalgedrag die invloed van aktiewe vuller getoon nadat die emulsie gebreek het. Gevolglik, weens die waargenome verskille rakende materiaalgedrag is die vereniging van die voorbereidings- protokols vir BSMs nie suksesvol nie. In terme van inagneming van aktiewe vullers in die finale voorbereidingsprotokol vir BSM’s, is deur navorsing bevind dat aktiewe vullers neig se neiging om vog te absorbeer in die beginstadia dit benodig dus ‘n langer verouderingstyd vir die ontrekking van die geabsorbeerde vog. Hoewel die gebruik van aktiewe vullers ’n impak het op die voorbereiding, reverdig dit nie die verlenging van die verouderingstyd vir die insluiting daarvan in BSM nie, siende dat sementering nie een van die gewenste eienskappe van hierdie materiaal is nie. BSMs word hoofsaaklik verkies vir sy buigsaamheid in paveiselsturkture. Om die mengselontwerp prosesse te vereenvoudig, was aktiewe vullers dus weggelaat in die finale voorbereidingsprotokol. Ter afsluiting was verskeie voorbereidings protokolle getoets en ontwikkel om te help met die vervaardiging van versoenbare materaalgedrag in beide veld-en-laboratoriumomgewings. Deur die versoening van kern materiaal eienskappe soos die elastisiteitsmodulus, lang termynewewigvog kondisies en skuifparameters, is ’n aanvaarbare gestandariseerde voorbereidingsprotokol vir BSM-skuim en BSM-emulsie bedoel vir aanwending in industriele laboratoriums regoor Suid Afrika suksesvol ontwikkel.

ix
ACKNOWLEDGMENTS First and foremost, I would like to acknowledge my father and closest friend, The Lord Jesus Christ. Our journey during my studies has been one full of joy and wonderful memories. I would like to thank you sincerely for all you’ve been to me during this time. I am also equally grateful to the following persons: • My loving wife Lynée. My love you were in South Korea during this time and you still
managed to inspire and encourage me. May the Lord continue to bless you for the wonderful wife you are to me. Thank you Mrs. Moloto.
• To my wonderful mother and brother, Mavis and Kamogelo. The two of you have truly inspired me during my thesis. I love you both so much.
• To my wonderful mother and angel Genie McLachlan. I love you so much. I still maintain that you are my angel on earth. Thank you for sharing your life with me. Thank you David, Allan, Kate and Jeff and the most beautiful girls in the world, Samantha and Stephanie.
• My wonderful friend, Josef Minkowitsch. Your great company, top quality wines, tasty dishes, occasional braais and laughter have transformed me completely. I am so grateful to have you in my life.
• To my supervisor Professor Kim Jenkins, thank you for offering me the opportunity to acquire my masters. I will forever be grateful for your time and mentorship during my studies. Thank you for pointing me in the right direction to pursue Pavement Engineering. I am currently thriving in this field and I love the roads environment so much! Baie Dankie!
• To my fellow friends and colleagues, Elias Twagira, Lucas Ebels, William Mulusa, Rex Kelfkens, Collin Isaacs, Gaven Williams, Allet Slabbert, Janine Myburgh, Prof. Hugo and Dr. De Wet and others
• To my best friends, Neil and Lucy Cocks, Shane and Corine Salzwedel, Morne Isaacs, Rhulani Madale and many more, thank you all for a wonderful time in Stellenbosch

x
Table of Contents Executive Summary ..................................................................................................................................viii
Opsomming ................................................................................................................................................ix
Acknowledgements .....................................................................................................................................x
List of Figures ...........................................................................................................................................xiii
List of Tables .............................................................................................................................................xv
List of Abbreviation ..................................................................................................................................xvii
List of Symbols ........................................................................................................................................xviii
1 INTRODUCTION ........................................................................................................ 1
1.1 Scope of Work .................................................................................................................... 2 1.2 Objectives ........................................................................................................................... 3
2 LITERATURE REVIEW ................................................................................................ 4 2.1 Historical Overview and Recent Curing Developments ........................................................ 4 2.2 Mechanisms of Curing......................................................................................................... 7
2.2.1 The Definition of Curing ........................................................................................ 8 2.2.2 Factors Leading to Curing...................................................................................... 8
2.2.2.1 High Pore Water Pressures ................................................................... 8 2.2.2.2 Water Expulsion.................................................................................... 9 2.2.2.3 Evaporation .......................................................................................... 9
2.3 Factors Influencing Curing................................................................................................. 10 2.4 Monitoring of Curing using Mechanical Strength Tests ...................................................... 18
2.5 Seismic Pavement Tests as Reliable Technique for Monitoring Field Modulus ................... 22
3 METHODOLOGY ...................................................................................................... 24 3.1 Methodology Overview and Solution Flowchart ................................................................. 26
4 PRELIMINARY CURING EXPERIMENTATION AND PROJECT SCOPE FORMULATION .... 28 4.1 Preliminary Curing Experimentation Phase: Solution Flowchart ......................................... 29
4.2 Proposed Tests Matrix ...................................................................................................... 30 4.3 Implemented Materials Properties ..................................................................................... 30 4.4 Long Term Curing Conditions ............................................................................................ 32 4.5 Proposed Testing Protocol ................................................................................................ 33
4.6 Results and Findings......................................................................................................... 35
4.6.1 Moisture Behaviour of Variable Mould Sizes: Emulsion Mixes ............................... 36 4.6.2 Moisture Behaviour of BSMs - Emulsion and Foam Mixes ..................................... 37 4.6.3 BSM-emulsion and BSM-foam Mixes Tangent Modulus ......................................... 40
4.7 Discussions....................................................................................................................... 42
5 FIELD MONITORYING AND INVESTIGATION ............................................................ 44 5.1 Field Monitoring Phase: Solution Flowchart ....................................................................... 44 5.2 N7 CIPR Project Overview ................................................................................................ 46 5.3 Crushed Rock Hornfels Material Properties ....................................................................... 47
5.4 Moisture Sampling and Trends .......................................................................................... 49 5.5 Field Temperature and Humidity Conditions ...................................................................... 51 5.6 Field Compaction and Resilient Modulus Behaviour .......................................................... 55 5.7 Resilient Modulus Modelling and Corresponding Field Trends ........................................... 62
5.8 Discussions....................................................................................................................... 64

xi
6 LABORATORY INVESTIGATION AND CURING PROTOCOL IMPROVEMENTS ................ 66 6.1 Laboratory Investigation Phase: Solution Flowchart ........................................................... 66 6.2 Laboratory Investigation and Curing Protocol Improvements: Test Matrix Diagram ............ 68
6.3 Controlled Grading ............................................................................................................ 70 6.4 Emulsion and Foam Binder Mixing Properties ................................................................... 72 6.5 Controlled Vibratory Compaction ....................................................................................... 79 6.6 Oven Curing Environments ............................................................................................... 82
6.7 Development of Short Dynamic Resilient Test Parameters using Monotonic Testing ......... 83 6.8 Short Duration Non Destructive Dynamic Resilient Modulus Test Method .......................... 89 6.9 Results and Findings......................................................................................................... 93
6.9.1 BSM-foam Laboratory Trends .............................................................................. 93
6.9.2 BSM-emulsion Laboratory Trends ...................................................................... 100 6.10 Discussions..................................................................................................................... 106
7 RECONCILIATION OF FIELD AND LABORATORY ENVIRONMENTS ............................ 108 7.1 Selection of Curing Temperature (s) ................................................................................ 109 7.2 Moisture and Relative Humidity Considerations ............................................................... 110
7.3 Resilient Modulus Considerations.................................................................................... 112
8 FORMULATION OF DRAFT CURING PROTOCOL AND SYNTHESIS ............................. 115 8.1 Synthesis ........................................................................................................................ 120
9 VALIDATED LABORATORY ACCELERATED CURING PROTOCOL ................................ 123 9.1 BSM-foam Laboratory Accelerated Curing Protocol ......................................................... 123
9.2 BSM-emulsion Laboratory Accelerated Curing Protocol ................................................... 124 9.3 Validation of Laboratory Curing Protocols using Equilibrium Moisture Properties ............. 125 9.4 Validation of Laboratory Curing Protocols using Monotonic Shear Properties .................. 127
10 CONCLUSIONS AND RECOMMENDATIONS .............................................................. 129 10.1 Conclusions .................................................................................................................... 130 10.2 Recommendations .......................................................................................................... 132
11 REFERENCES ........................................................................................................ 133 12 APPENDICES......................................................................................................... 136

xii
List of Figures Figure 2.1 Guidelines for suitability of aggregates for treatment with Foam Bitumen (Asphalt
Academy, 2002) ............................................................................................................. 11
Figure 2.2 Comparison of Vibratory and Conventional Compactors (Shuler et al, 1992)........................... 13
Figure 2.3 60% stable grade anionic emulsion - Dry ITS (A. Hodgkinson et al, 2002) ............................. 14
Figure 2.4 80/100 Pen Foamed Bitumen - Dry ITS (A. Hodgkinson, 2002 et al, 2002)............................. 15
Figure 2.5 Bitumen emulsion moisture loss with variable quantities of cement (S. Brown et al 2000) ............................................................................................................................. 16
Figure 2.6 Bitumen emulsion mixture with no cement (S. Brown et al 2000)........................................... 17
Figure 2.7 Bitumen emulsion mixture with 2% cement (S. Brown et al 2000) ......................................... 17
Figure 2.8 Correlations between different ITS and UCS test protocols on foamed BSM (Houston et al.) ............................................................................................................................. 19
Figure 2.9 Existing and recycled pavement structures, Athens (A. Loizos et al., 2007) ............................ 20
Figure 2.10 In-Situ foam mix Resilient Modulus using FWD analysis, Athens (A. Loizos et al., 2007) ............................................................................................................................. 21
Figure 2.11 Portable Seismic Pavement Analyser (S. Nazarian et al., 2002) ............................................ 22
Figure 2.14 Relationship between seismic and low strain resilient modulus for granular base material (S. Nazarian et al., 2002) .................................................................................. 23
Figure 3.1 Methodology Overview and Solution Flowchart ...................................................................... 27
Figure 4.1 Preliminary Curing Experimentation Solution Flowchart .......................................................... 29
Figure 4.2 Preliminary tests material grading curves ............................................................................... 31
Figure 4.3 Long term curing of crushed rock, ferricrete gravel & sand samples ....................................... 32
Figure 4.4 Monotonic Etan and Esec modulus analysis (Ebels, 2007) ...................................................... 33
Figure 4.5 Preliminary tests MTS testing protocol ................................................................................... 34
Figure 4.6 Applied load versus vertical strain during preliminary testing.................................................. 34
Figure 4.7 Applied stress versus vertical strain during preliminary testing ............................................... 35
Figure 4.8 BSM-emulsion moisture behaviour of variable specimen sizes ................................................ 36
Figure 4.9 Moisture behaviour of BSM-foam in laboratory at 23˚C and 65% Relative Humidity ............... 38
Figure 4.10 Moisture behaviour of BSM-Emulsion in laboratory at 23˚C , 65% Relative Humidity ............ 39
Figure 4.11 Tangent modulus of BSM-foam mixes versus curing period .................................................. 41
Figure 4.12 Tangent modulus of BSM-emulsion mixes versus curing period ............................................ 42
Figure 5.1 Field Monitoring Solution Flowchart........................................................................................ 45
Figure 5.2 Schematic process of N7 CIPR construction project, April 2007 .............................................. 47
Figure 5.3 Stockpile of 100% RAP crushed hornfels material on N7 & Laboratory grading curves ........... 47
Figure 5.4 Standard Proctor compaction machine at Stellenbosch University........................................... 48
Figure 5.5 N7 Graded crushed rock maximum dry density curve ............................................................. 49
Figure 5.6 Collection of moisture samples on site during and after construction...................................... 50
Figure 5.7 N7 Graded crushed rock %OMC curve over ±8 months of field curing ................................... 51
Figure 5.8 N7 centreline temperature & relative humidity button location within recycled layer............... 52
Figure 5.9 N7 schematic view of investigated points along the rehabilitated road ................................... 52

xiii
Figure 5.10 Installation of i-buttons on N7 highway for temperature & relative humidity measurements ................................................................................................................ 53
Figure 5.11 N7 BSM-emulsion centreline temperature and relative humidity data ................................... 53
Figure 5.12 Field compaction using high energy steel rollers and the relative impact on resilient modulus ......................................................................................................................... 55
Figure 5.13 N7 crushed rock day 0 resilient modulus behaviour after compaction on centreline position B2 (IL). ............................................................................................................. 56
Figure 5.14 N7 BSM-emulsion centreline resilient modulus development [Position B1-B3] ....................... 58
Figure 5.15 N7 BSM-Emulsion centreline resilient modulus development [Position B4-B6]....................... 59
Figure 5.16 N7 BSM-Emulsion centreline resilient modulus development [Position B1-B6]....................... 60
Figure 5.17 BSM-emulsion centreline resilient modulus ........................................................................... 63
Figure 5.18 BSM-Foam: PSPA resilient modulus analysis (CISR, 2008) ................................................. 64
Figure 6.1 Laboratory Investigation & Curing Protocol Improvements Solution Flowchart ....................... 67
Figure 6.2 Laboratory tests matrix diagram for investigations and curing protocol improvements ........... 69
Figure 6.3 Target grading curve of N7 crushed Hornfels rock material for laboratory mixes .................... 71
Figure 6.4 Laboratory pugmill mixer ....................................................................................................... 73
Figure 6.5 Laboratory bitumen emulsion briquettes ................................................................................ 73
Figure 6.6 Laboratory WLB10 pugmill mixer ........................................................................................... 75
Figure 6.7 Laboratory WLB10 foam plant machine.................................................................................. 76
Figure 6.8 Laboratory foam bitumen mixes............................................................................................. 77
Figure 6.9 Laboratory vibratory compaction protocol using Bosch hammer (Kelfkens, 2007) ................... 79
Figure 6.10 Time to yield 100% Mod. AASHTO compaction versus layer thickness (Kelfkens, 2007) ............................................................................................................................. 80
Figure 6.11 Laboratory draft oven curing environments .......................................................................... 82
Figure 6.12 Monotonic Triaxial Testing - Applied load versus Strain ........................................................ 84
Figure 6.13 Monotonic Testing Load cycle versus time........................................................................... 86
Figure 6.14 Testing of briquettes using laboratory MTS setup and external LVDT ................................... 89
Figure 6.15 External LVDT load signal vertical displacement measurement ............................................. 90
Figure 6.16 External LVDT load signal measurement .............................................................................. 91
Figure 6.17 Laboratory MTS computer setup .......................................................................................... 92
Figure 6.18 BSM-foam: Laboratory protocol improvements moisture trends............................................ 96
Figure 6.19 BSM-foam: Laboratory protocol improvements resilient modulus trends ............................... 98
Figure 6.20 BSM-foam: Laboratory resilient modulus interactions with moisture trends .......................... 99
Figure 6.21 BSM-emulsion: Laboratory protocol improvements moisture trends .................................... 103
Figure 6.22 BSM-emulsion: Laboratory protocol improvements resilient modulus trends ....................... 104
Figure 6.23 BSM-emulsion: Laboratory resilient modulus interactions with moisture trends................... 105
Figure 7.1 BSM-emulsion: Laboratory curing temperature(s) interactions diagram ................................ 109
Figure 7.2 BSM-emulsion: Field moisture trend ..................................................................................... 110
Figure 7.3 BSM-emulsion: Field resilient modulus trend ........................................................................ 113
Figure 7.4 BSM-foam: Field resilient modulus trend .............................................................................. 114
xiv
Figure 8.1 BSM-foam: Reconciliation of field and Laboratory resilient modulus and moisture trends........................................................................................................................... 118
Figure 8.2 BSM-emulsion: Reconciliation of field and Laboratory resilient modulus and moisture trends........................................................................................................................... 119
Figure 10.1 Mix factors considered for selection of curing protocol (TG2, 2009).................................... 130
Figure 11.1 BSM-foam monotonic shear properties of cement mixes .................................................... 136
Figure 11.2 BSM-foam monotonic shear properties of lime mixes ......................................................... 136
Figure 11.3 BSM-foam monotonic shear properties of mixes without active filler................................... 137
Figure 11.4 BSM-emulsion monotonic shear properties of cement mixes............................................... 137
Figure 11.5 BSM-emulsion monotonic shear properties of lime mixes ................................................... 138
Figure 11.6 BSM-emulsion monotonic shear properties of mixes without active filler ............................. 138
List of Tables Table 2.1 Different Curing Methods utilised for Foamed Mixes (Jenkins, 2000) ......................................... 5
Table 2.2 Amended Curing Procedures for Cold Mixes from 1999 to 2004................................................. 6
Table 2.3 South Africa’s Weinert N Value Climate Index ......................................................................... 10
Table 2.5 Constitution of the various cementitious binders (A. Hodgkinson et al, 2002) .......................... 14
Table 4.1 Proposed preliminary laboratory test matrix ............................................................................ 30
Table 4.2 Preliminary laboratory material properties ............................................................................... 31
Table 4.3 Preliminary tests long term curing conditions .......................................................................... 32
Table 4.4 Preliminary monotonic triaxial test conditions .......................................................................... 33
Table 4.5 Summary of Tangent Modulus Etan performance for BSM-foam and emulsion mixes............... 40
Table 5.1 Soil Lab density report on N7 highway prior to rehabilitation ................................................... 46
Table 5.2 N7 CIPR project properties...................................................................................................... 46
Table 5.3 Summary of centreline resilient modulus over ±8 months of curing: Position B2 (IL) .............. 56
Table 5.4 Summary of centreline PSPA resilient modulus - All positions [B1-B6] ..................................... 62
Table 6.1 Peak BSM-emulsion Centreline Temperature Data- N7 Northbound Carriageway [2007] ............................................................................................................................ 68
Table 6.2 Summary of laboratory tests matrix parameters for curing investigation and improvement .................................................................................................................. 70
Table 6.3 Summary of N7 crushed hornfels rock wet grading analysis .................................................... 70
Table 6.4 Summary of grading fractions used to maintain target laboratory grading ............................... 71
Table 6.5 Summary of BSM-emulsion briquettes and laboratory mixing properties .................................. 74
Table 6.6 Laboratory foam expansion test properties ............................................................................. 77
Table 6.7 Summary of BSM-foam briquettes and laboratory mixing properties ........................................ 78
Table 6.8 Controlled BSM-emulsion mix compaction of N7 crushed hornfels rock material ...................... 81
Table 6.9 Controlled BSM-foam mix compaction of N7 crushed Hornfels rock material ............................ 81
Table 6.10 TG2 2002 Curing Guideline ................................................................................................... 83
Table 6.11 Laboratory Monotonic Triaxial Test Matrix ............................................................................. 84
xv
Table 6.12 Determination of Monotonic Test Parameters ........................................................................ 85
Table 6.13 Determination of non destructive dynamic resilient modulus test parameters ........................ 87
Table 6.14 Number of repeat testing for the non destructive dynamic resilient modulus test .................. 88
Table 6.15 Resilient modulus analysis from cycle 1 of stress strain relationship graph ............................ 92
Table 6.16 Average resilient modulus analysis during 8 cycles ................................................................ 92
Table 6.17 BSM-foam (30˚C): Curing protocol improvement data........................................................... 94
Table 6.18 BSM-foam (40˚C): Curing protocol improvement data........................................................... 95
Table 6.19 BSM-emulsion (30˚C): Curing protocol improvement data ................................................... 101
Table 6.20 BSM-emulsion (40˚C): Curing protocol improvement data ................................................... 102
Table 8.1 BSM-foam: Draft Laboratory Accelerated Curing Protocol ...................................................... 116
Table 8.2 BSM-emulsion: Draft Laboratory Accelerated Curing Protocol ................................................ 117
Table 9.1 BSM-foam: Validated laboratory accelerated curing protocol ................................................. 123
Table 9.2 BSM-emulsion: Validated laboratory accelerated curing protocol ........................................... 124
Table 9.3 Equilibrium moisture characteristics of laboratory cured samples .......................................... 126
Table 9.4 Monotonic shear characteristics of laboratory cured samples ................................................. 127
Table 10.1 BSM-foam: TG 2009 Laboratory accelerated curing protocol................................................ 130

xvi
List of Abbreviations AASHTO American Association of Highway and Transportation Officials BSM Bitumen Stabilised Materials CBR Californian Bearing Ratio CIPR Cold In-Place Recycling COV Coefficient of Variation CSIR Council for Scientific and Industrial Research CBM Cement Bound Material EMC Equilibrium Moisture Content FI Foam Index FWD Falling Weight Deflectometer GDPTRW Gauteng Department of Transport, Roads and Works GEMS Granular Emulsion Mixes GPR Granular Penetration Radar HMA Hot Mix Asphalt ICL Initial Consumption of Lime ICC Initial Consumption of Cement ITS Indirect Tensile Strength Kg/m3 Kilogram per cubic meter kPa Kilo Pascal = 103 Pascal LP Laser Profile LTTP Long Term Pavement Performance LVDT Linear Variable Differential Transformer MDD Maximum Dry Density MMLS Model Mobile Load Simulator MPa Mega Pascal = 106 Pascal MTS Material Testing System OMC Optimum Moisture Content PSPA Portable Seismic Pavement Analyser RAP Reclaimed Asphalt Pavement RH Relative Humidity S.R Stress Ratio SABITA South African Bitumen Association SAMEDM South African Mechanistic Empirical Design Method SU Stellenbosch University Tcuring Curing Time TG2 Technical Guideline 2, published by the Asphalt Academy (2002/2009) TMH Technical Method for Highways UCS Unconfined Compressive Strength UTFC Ultra Thin Friction Course VMA Voids in Mineral Aggregate

xvii
List of Symbols C Cohesion Esec Secant Modulus Etan Tangent Modulus Mr Resilient Modulus ε Strain εf Strain-at-failure k1, k2 Material Characteristics σ Normal Stress σ1, σ2, σ3 Major, intermediate and minor principal stress σ1,f Major principal stress-at-failure σa,f Applied stress-at-failure σd Deviate stress = σ1-σ3 σdw Dead weight pressure ø Angel of internal friction

1
1 INTRODUCTION
In 2002, the Asphalt Academy published an Interim Technical Guideline (TG2) titled “The Design and Use of Foamed bitumen Treated Materials”. TG2 guideline currently includes mechanistic empirical structural design models for foamed bitumen treated materials for use in the South African Mechanistic-Empirical Design Method (SAMEDM). Consequently, various projects have been initiated to develop similar design models and improve existing ones for incorporation into an equivalent guideline document on emulsified bitumen treated materials. Thus far, the South African Bitumen Association (Sabita) and the Gauteng Department of Transport and Public Works (GDPTRW) have contributed significantly to improvement of TG2 Foamix Material Guideline. Further contributions have also aimed at addressing shortcomings of the current mix design and pavement design methods for bitumen stabilized materials (BSMs). The research conducted in this study forms part of Phase II process of the Bitumen Stabilized Material Guideline improvement initiative. The initiative aims to address areas of concern in the cold mix design procedures for foamed and emulsified bitumen treated materials. The following shortcomings as outlined in the Phase II process need investigation:
• The lack of a suitable laboratory curing method that is adequately linked to field curing. • The use of UCS and ITS tests for mix design and classification as applicable to foamed
bitumen. • The need for appropriate tests for assessing mix properties and performance, such as flexibility,
shear strength and durability. The Cold In Place Recycling (CIPR) bitumen process involves testing of representative specimens of foamed and emulsified treated materials as means to evaluate pavement performance over time. To adequately acquire representative specimens, it is necessary to condition the materials in a process called curing. Although curing procedures have been standard in many countries on different continents, the protocols are varied and an accepted procedure is currently not available. The lack of representation is due to complex process of curing simulation, as emphasized by the following challenges: • The complex composition and types of cold mixes to be conditioned in terms of:
o Binder type and content o Active filler type and content o Aggregate grading and type (porosity, parent rock, petrography) o Binder dispersion within the mix o Moisture content after compaction o Voids in the mix and particle orientation (linked to compaction method)
• Climate in the area of application (temperature, evaporation and relative humidity conditions)
• Mechanical properties • Time duration since construction that is being simulated • Service environment: Traffic effects and position of cold mix layer in the pavement structure In line with the abovementioned challenges, the proposed research presented in this study aims to develop a suitable accelerated curing protocol for bitumen stabilized materials intended for application in industrial laboratories across South Africa.

2
1.1 Scope of Work Recent research and publications have primarily focused on ways of refining and improving accelerated curing laboratory protocols for cold mixes. Despite valuable attempts, most focus has primarily been devoted to bitumen stabilized materials (BSMs), but rarely on developing a unified approach for BSM-foam and BSM-emulsion. For this reason, as a result of not having a unified curing approach for Bitumen Stabilized Materials, comparative data for accelerated curing techniques on different types of cold mixes is currently not available. Moreover, the current non standardized curing protocols as adopted in South Africa presents difficulty in comparing results of performance tests carried out on bitumen stabilized materials. Although additional research is needed, considering the environmental conditions required for an emulsion to “break” (flocculate, coalesce and densify) and then cure, relative to foamed bitumen (more simply water repulsion), it is unlikely that a single curing process will have the desired effect on both. In line with scope of work relative to this thesis as per Phase II process of the Bitumen Stabilized Material Guideline improvement initiative, the following key factors were taken into consideration during curing of bitumen stabilized materials and during the underlined phases: 1. Moisture In South Africa equilibrium moisture content (EMC) in bitumen stabilized materials after several years in the field can be estimated given certain material properties and climatic parameters. Moisture content in the mix during curing can be controlled by sealing specimens or curing at a set relative humidity. Moreover, emulsion mixes hold significantly more moisture than foamed bitumen and are less hydrophobic during the initial stages than foamed bitumen. 2. Temperature
Temperature is an important parameter as it influences curing rate, binder ageing and binder dispersion in the mix, amongst other factors. Generally, curing temperatures above the Ring and Ball softening point should be avoided, as this temperature causes the binder to flow which can alter mix properties adversely and may result in unrepresentative ageing of the binder. 3. Active Filler
Hydration time, and hence curing time as well as higher temperatures have different effects on bitumen stabilized materials that have active filler content as a variable. Emulsion treated mixes with cement as a variable require a longer ambient cure time than mixes with no cement. 4. Mechanical Properties
Dynamic properties of bitumen stabilized materials are important for defining the performance of these mixes. Resilient modulus values of the mix provide the most representative benchmark for validating how representative the accelerated curing has been and whether the mix duly represents the field equivalent. In order to capture the influence of the abovementioned variables on accelerated cured mixes, the following options as outlined in Phase II process of the Bitumen Stabilized Material Guideline improvement initiative needed consideration in standardizing the curing protocol:

3
• Implementation of standard procedure possibly with fixed temperature and curing times as means to obtain empirically comparable mixes for classification or ranking purposes (after mechanical testing).
• Implementation of standard temperature with different exposure times for moisture loss, so that
representative equilibrium moisture content (EMC) can be aimed for after curing, followed by mechanical testing.
• The Resilient Modulus should be selected as key parameter by which the appropriateness of
cured material is measured. • Although a standard curing protocol may have empiricism built into the procedure, “reasonable
representativeness” should be strived for. Standardization of the procedure should be a priority.
1.2 Objectives The objectives of the accelerated curing protocol as per Phase II process of the Bitumen Stabilized Material Guideline can be split into two main components, namely, Improvement and Validation of the amended curing protocol. The following tasks as extracted from TG2 Rewrite Project apply to both components: Curing: Task 7 - Improvement 1. Investigate potential curing protocols already identified as providing equivalent moisture content
in terms of resilient modulus reflective of field resilient modulus. 2. Identify boundaries of applicability (if any) regarding curing protocol for foamed and emulsion
binder type BSMs. Curing: Task 8 - Validation 1. Observe the change in field moisture in the BSM layer with time 2. Observe the change in field resilient modulus in the BSM layer with time 3. Try to relate both field moisture and resilient modulus trends 4. Devise and validate accelerated curing laboratory procedure in terms of field resilient modulus 5. Develop a unified curing protocol for both foam and emulsion mixes The main concluding objective was to develop if possible a unified curing protocol for BSM-foam and BSM-emulsion. Considering foamed bitumen and bitumen emulsion binders, with and without active filler, the main challenge is: Is a unified curing approach realistic? Furthermore, one of the main objectives was to improve current accelerated curing protocols already identified as providing equivalent moisture content (EMC) in terms of laboratory resilient modulus reflective of field resilient modulus and moisture trends. The research that has been undertaken has addressed objectives as outlined above and detailed findings have been incorporated in proceeding chapters. Conclusions have been drawn and further research recommendations have been presented.

4
2 LITERATURE REVIEW
This chapter explores some of few critical findings relative to curing as published by various known researchers in the field of BSMs. Most of presented findings will assist in addressing key objectives outlined in the research study and the espousal of research methodology. In pursuit of solving the curing challenge, a range of aspects pertaining to the curing process have been thoroughly explored. Due to the vast amount of challenges on curing of bitumen stabilized materials, focus has been applied to aspects that are widely accepted as important parameters to investigate when addressing curing. In view of the adopted research methodology, this chapter strives to achieve the following objectives: • Provide an understanding on the appropriateness and application of laboratory mechanical
tests used in assessing curing of bitumen stabilized materials • Explore the influence of active filler types on moisture behaviour and resilient modulus over
variable temperatures and time
• Gain understanding on the application of seismic pavement devices used for monitoring of in-situ resilient modulus
2.1 Historical Overview and Recent Curing Developments Following recent research, findings have shown that bitumen stabilized materials do not acquire their full strength after compaction until a large percentage of moisture is released in the mix. As a result, curing is a process whereby bitumen stabilized materials gain strength over time accompanied by a reduction in the moisture content. Current practices for accelerated curing laboratory are extremely vast and tend to vary significantly between diverse institutions. Subsequently, the following three distinct periods exist in the development of accelerated curing protocols: Early Curing Procedures (Pre-2000) Bowering (1970) stated that laboratory specimens only develop their full strength after a large percentage of the mixing moisture has been lost. The biggest challenge in simulating field cure is the complexities involved in modelling laboratory curing of a specific material in a particular environment. The later challenge led to the development of different curing protocols by various researchers as providing equivalent field curing. A summary of these accelerated curing protocols is outlined in Table 2.1.

5
Table 2.1 Different Curing Methods utilised for Foamed Mixes (Jenkins, 2000)
Curing Method Equivalent Field Cure Reference 3 days @ 60ºC + 3 days @ 24ºC Unspecified Bowering (1970)
3 days @ 60ºC Construction period + early field life Bowering and Martin (1976)
3 days @ 60ºC Between 23 & 200 days from Vane Shear Tests
Acott (1980)
1 day in mould Short term Ruckel et al. (1983)
1 day in mould +1 day at 40ºC Between 7 and 14 days (Intermediate) Ruckel et al. (1983) 1 day in mould +3 days at 40ºC 30 days (Long term) Ruckel et al. (1983)
1 day @ 38ºC 7 days Asphalt Institute (1992)
10 days in air + 50 hours @ 60ºC Unspecified Van Wijk and Wood (1983) 3 days @ ambient temp. + 4 days
vacuum dessicat. Unspecified Little et al. (1983)
3 days @ 23ºC Unspecified Roberts et al. (1984) 3 days @ 60ºC Unspecified Lancaster et al. (1994) 3 days @ 60ºC 1 year Maccarrone et al. (1994)
The vast amount of curing protocols developed by various researchers pre-2000 presented extreme difficult in developing uniform standards of practice for purposes of generating sound representative data on tested cured materials from different researchers for comparison reasons. In the aim to address the problem, Sabita (1993) proposed the use of 3 days at 60ºC for granular emulsion mixes in order to simulate long term field cure of Granular Emulsion Mixes (GEMs). In the same period Marais and Tait (1989) recognised that the material properties of emulsion mixes changed seasonally with significant variation in the first 6 months to 2 years. The most significant contributions relative to accelerated curing were made by Lee in 1981 when he highlighted the following key points: (a) A recommendation that due to the effect of curing on the strength development of foamed
mixes, mix design of foamed mixes should be locally based, using information obtained from trial sections.
(b) Both curing temperature and the presence or absence of a mould during curing have a direct impact on moisture content of the specimen, which invariable affects mix behaviour, particularly the Marshall Stability values.
Lee highlighted the importance of moisture considerations when selecting a curing procedure. Most researchers and mix designers in the period up to the year 2000 had ignored the importance of moisture content of cold mix during curing simulations. Residual moisture contents of less than 0.5% after oven curing at 60ºC were common. Lee’s findings mainly highlighted the need to link laboratory curing procedure with a mix property. Consequently, the effects of curing are material property dependent. Adjusted Curing Procedures (1999 to 2004) The 1999 to 2004 era marked an improvement towards curing procedures. The noticeable curing improvements were mainly driven by CIPR projects around South Africa. Following Lee’s findings, an improvement towards curing temperatures of cold recycled mixes followed, with temperatures of 60ºC being considered too high. The 60ºC curing temperature is above the softening point temperature of the base binder and may cause visual redistribution and dispersion of the bitumen. In addition, high curing temperatures can cause significant damage and ageing of the binder.

6
Subsequently, the most noticeable improvement followed when a target moisture content equivalent to field equilibrium moisture content (EMC) of the cold mix after curing for a specified period was established (Jenkins, 2000). A summary of the revised curing protocols is presented in Table 2.2.
Table 2.2 Amended Curing Procedures for Cold Mixes from 1999 to 2004
Curing Method Equivalent Field Cure Reference 24 hrs @ ambient + 48 hrs @ 40ºC (OMC<8%)
45 hrs @ 60ºC (OMC>8%) Emulsion mixes, medium term
(1 year field cure?) Sabita (1999)
7 days @ ambient & 28 days @ ambient Emulsion + cement Emulsion + no cement
Sabita (1999)
24hrs @ ambient in mould + 3 days @ 40ºC (sealed) 6 months field cure (foam) Asphalt Academy (2002) 24 hrs @ 40ºC (sealed) + 48 hrs @ 40ºC ambient
(unsealed) Medium term cure (foam and
emulsion) Robroch (2002)
24 hrs @ ambient 25ºC (unsealed) + 48 hrs @ 40ºC (sealed)
Long term foamed mix cure (1 to 2 years)
Houston and Long (2004)
24 hrs @ ambient (unsealed) + 48 hrs @ 40ºC (sealed) + 3 hrs cooling @ ambient (unsealed)
Medium term cure (foam and emulsion)
Wirtgen (2004)
20 hrs @ 30ºC (unsealed) + 2x24 hrs @ 40ºC (sealed – change bag midway)
Medium term cure (foam and emulsion)
Stellenbosch University (2004)
As observed in Table 2.2, curing temperatures of 40ºC were commonly used as means to retain field moisture conditions at the end of the curing process. Although the TG2 protocol resulted in making the cured specimens too moist as a result of sealing briquettes completely, several researchers adjusted the TG2 approach following 2002. The influence of active fillers was subsequently incorporated in the Sabita (1999) guideline where interventions were made for non elevated temperature curing. In the case of using cement for emulsion mixes, a 7 day cure at ambient temperature was recommended whilst for no cement mixes a 28 day ambient temperature cure was suggested. Quest for Unified Curing Method (2005+) Following recent trends in various curing protocols, the need for unified curing protocol method became increasingly necessary. The developments towards a unified curing protocol to date have been mainly pursued by Malubila (2005) and Kekwick (2005). As part of his thesis, Malubila evaluated many of the new curing protocols for foamed mixes developed subsequent to TG2 including those listed in Table 2.2. Also, Malubila re-evaluated the prediction models for equilibrium moisture content (EMC) of foamed mixes based on material properties of optimum moisture content (OMC), binder content (BC) and climate. Malubila carried out field tests on pavements incorporating these materials across South Africa and one case in Zambia. The following findings emerged from Malubila’s research:
• The development of separate EMC prediction models for foamed bitumen mixes produced from either coarse gravels or sands, each with good correlation coefficients.
• The curing protocol method proposed by Houston and Long (2004) as outlined in Table 2.2 provides the best correlation of specimen moisture content with field moisture content after several years.
• The UCS values obtained from specimen tested after accelerated curing are in the same order as UCS for field cores after several years, although significant variability exists.
Findings also highlighted that the most evident shortcoming of the TG2 guideline is the solely strength approach based classification system for foamed mixes using ITS and UCS results. Kekwick (2005) proposed that the materials resilient modulus as interpreted by the tangent

7
modulus from a stress-strain response measured in a modified CBR-type compression test be considered instead of ITS or UCS testing. Kekwick also suggested that curing time at ambient temperature that yields laboratory resilient modulus comparable to the resilient modulus used in the mechanistic design be established. As a result, an acceptable curing period would imply that a reasonable design modulus has been selected for the cold mix in question. In closure, Kekwick’s suggestions were never followed up with actual research. For this reason, the effects of curing on tangent modulus will be studied in this research. Recent Curing Developments In Europe, both Brown and Needham (2000) particularly investigated the influence of cement in emulsion mixes. Findings from their research concluded that, although cement dramatically increases mix resilient modulus, cement also consumes moisture from the mix. The OPTEL project in Europe (Potti et al, 2002) investigated procedures to improve the reliability of cold mix evaluation. This led to findings supporting a range of curing protocols with different combinations of temperatures (18ºC or 50ºC) and relative humidity conditions (10% or 50%). Although a conclusive unified curing protocol could not be established from the project, one conclusion emphasized that the most effective way to accelerate water reduction in a specimen without significantly altering material mix properties is achieved through humidity reduction rather than an increase in temperature. The latter was supported by similar trends in adjustment of curing protocols by South African practitioners. Colas mix design procedure curing procedure distinguishes between fresh and cured cold mix. The curing protocol uses different application times of temperature (18ºC or 35ºC) and relative humidity conditions (20% or 50%). Serfass et al. (2004) designate that in moderate regions a curing procedure of 14 days at 35ºC and 20% relative humidity simulates a period of 2 to 3 years of field curing. Serfass et al. (2003) also highlighted the importance of temperature by showing its effects on the ultimate mix resilient modulus. Serfass later concluded that equivalent modulus values are considered to be a more accurate reflection of the influence of curing. Saleh (2004) also emphasized the international trends towards the use of resilient modulus as a key material parameter. He further used ITT resilient modulus to expose the influence of curing and moisture content on the change in mix properties, as well as to validate the selection of design binder content for the mix. 2.2 Mechanisms of Curing Mechanisms of curing relate to well defined factors governing curing of bitumen stabilized materials. As noted in this portion of literature review, most factors driving curing are usually material specific and environmentally linked. Consequently, mechanisms and scientific laws governing curing of bitumen stabilized materials have been extensively explored with an emphasis on specific materials properties and environmental effects. As a result, only principal factors governing curing as confirmed by most researchers have been investigated. In conclusion, factors to be cognisant of when devising laboratory curing protocol have been highlighted. Guidelines extracted from this section have helped configure simulation of laboratory curing environments reflective of field conditions.

8
2.2.1 The Definition of Curing
Curing of cold bituminous materials is a process whereby the mixed and compacted material discharges water through evaporation, particle charge repulsion or pore-pressure induced flow paths, Jenkins (2000). Malubila (2005) explored the effects of regional evaporation on material curing. Malubila (2005) also devised models to be implemented in order to predict material’s equilibrium moisture content given the optimum moisture content of the material, binder content and Weinert’s N value of the climatic region under investigation. Findings from various researches emphasize the need to link the definition of curing to environmental effects and material properties. In this portion of literature, various environmental factors driving curing of bitumen stabilized materials have been explored. Although material science may explore factors such as particle charge repulsion or pore-pressure induced flow paths, the response of these mechanisms to the environment explain why materials cure in the first place. Moreover, further explorations of scientific mechanisms and environmental effects lead to firm understanding of why certain materials cure faster than others. The above mentioned aspects have been thoroughly explored and address in the following sections:
2.2.2 Factors Leading to Curing
Factors leading to curing are specific scientific influences that coerce materials to cure. These are scientific mechanisms which invariably influence the rate of curing and moisture behaviour within the mix. Subsequent to the investigation process, the following key factors have been explored:
2.2.2.1 High Pore Water Pressures
Laboratory and field compaction alike of bitumen stabilized materials are generally the cause of development of high pore water pressures in the compacted mix. In the field, areas with high water tables generally lead to development of high pore water pressures during compaction. The build up of such high pore water pressures regions often results in the migration of water to the surface of the recycled layer. Taking a closer look at laboratory compaction for instance, pore water pressures developed during compaction cannot fully dissipate because of confinement by steel moulds. The accumulation of pore water pressures as function of compaction time is common laboratory science, and in some instances of high moisture contents during compaction, water tends to seep through the bottom of steel moulds. As mentioned previously, the interaction of higher pore water pressures in the compacted material leads to water seeping out through voids in the mix during interactions with the outside environment. The result of this interaction often forces water to escape due to the differences in outside atmospheric pressures and internal pore water pressures. The migration of water from higher pore water pressures regions in the mix to lower atmospheric pressure zones towards the surface of the compacted material leads to surface curing.

9
2.2.2.2 Water Expulsion
Water expulsion is the physical release of compaction water from the mix during compaction. Furthermore, water expulsion amongst other factors is a consequence of high pore water pressures developing in the compacted material due to high compaction forces or energy. Other factors may stem from pore pressure interactions taking place between pavement structures and higher ground water table levels. Compaction of bitumen stabilized materials reduces volume of air/voids in the mixture through the application of external forces. The expulsion of air and consequently compaction water enables the mix to occupy less volume, and thereby increasing the density of the mass. These occurrences are often accomplished by high energy compactors which provide the necessary external forces. The expulsion of water through air voids/channels in the compacted mix continues even after compaction due to the migration of high pore water pressures as discussed earlier. Water expulsion is one of the additional factors driving curing of bitumen stabilized materials.
2.2.2.3 Evaporation
Evaporation is the process by which molecules in a liquid state spontaneously become gaseous or transform into water vapour. As a result, evaporation guides the curing process of BSMs. Evaporation is further driven by high pore water pressures and water expulsion characteristics present during the compaction process. In South Africa a climatic index called Weinert N-value can be used to estimate mean annual evaporation of regions under analysis. Weinert N-value is a climatic index on evaporation which is based on the warmest month of the year and annual rainfall. During the initial stages of curing, water evaporates at the exposed surface of the compacted mix, leading to surface interaction with the surrounding environment. Depending on evaporation characteristics of the surrounding environment, curing of bitumen stabilized materials will take place either at a faster or slower rate. Evaporation also contributes to moisture behaviour in compacted pavements over both the short and long term analysis. Malubila (2005) investigated the effects of environmental evaporation on field equilibrium moisture contents (EMC) of foam mixes. Malubila (2005) derived models to predict field EMC given the material’s OMC, binder content and Weinert’s N-value of the region under investigation. Malubila’s findings supported evaporation as a fundamental factor towards determining residual moisture contents in the field over the long term. In short, Malubila expanded on the works of Jenkins and Emery. In his findings, Malubila was able to calibrate EMC prediction models for granular materials and sands. Through the application of the revised EMC prediction models, Malubila was able to validate the BSM-foam curing protocol published in TG2 2002. As a result, Malubila’s EMC prediction models will be implemented in this study to help test and validate the revised curing protocol for BSMs.

10
2.3 Factors Influencing Curing Factors influencing curing are widely material specific and tend to vary depending on external factors such as binder type and various mixing properties. These factors are usually influenced by the material’s response to external factors such compaction and gradation. Aspects driving these factors have been thoroughly explored in the following sections:
2.3.1 Climate and the Environment
Climatic regions can best be described by the well known Weinert’s N value climate index. Curing of bitumen stabilized materials depends heavily on the environment. South Africa’s climate varies from extremely dry to subtropical humid with either summer or winter rainfall. These widely different conditions have been accommodated in the Weinert’s N value climate index. Weinert’s N value is ratio of evaporation during the warmest month (Ej) to mean annual precipitation (Pa). The following equation explains this:
12Ej
NPa
= Equation 1
The following regions in Table 2.3 summarize different climatic regions in South Africa:
Table 2.3 South Africa’s Weinert N Value Climate Index
Environment/Climate Wet Moderate Dry Weinert’s N value N<2 2<N<5 N>5
Different climates will dictate moisture conditions in the field, and depending on regional temperatures, the rate of curing will differ from wet to moderate and dry conditions. Malubila (2005) has also demonstrated the role of environment on equilibrium moisture contents trends in the field.
2.3.2 Gradation of the Material
Bitumen binder distribution in both foamed and bitumen emulsion treated mixes behaves differently from material gradation point of view. According to TG2, during mixing of aggregates with foamed bitumen, the dispersed bitumen droplets only partially coat the large aggregate particles. Furthermore, in foamed bitumen mixes both the filler, bitumen and water hold the coarser aggregate fractions together. Consequently, the coating of fine aggregates for foamed bitumen mixes is imperative. The requirements differ significantly to those of bitumen emulsion mixes. During bitumen emulsion mixing, the coating of the larger aggregate particles is greater. In order to accommodate both bitumen emulsion and foamed mixes, Mobil Oil established guidelines for gradations of aggregates suitable for foam stabilization (Jenkins, 2000). Mobil Oil developed general grading requirements and zones of most suitable aggregate composition as defined in Figure 2.1.

11
TG2 Broad Conceptual Guidelines for Suitability of Aggregates for Treatment with
Foamed Bitumen
0%
10%
20%
30%
40%
50%
60%
70%
80%
90%
100%
0.10 1.00 10.00 100.00
Particle Size (mm)
Cu
mu
lati
ve
Per
cen
tag
e P
assi
ng
Upper Limit (Unsuitable: Too Fine) Lower Limit (Unsuitable: Too Coarse)Ideal (Suitable) Poly. (Upper Limit (Unsuitable: Too Fine))Poly. (Ideal (Suitable)) Power (Lower Limit (Unsuitable: Too Coarse))
Zone A: Suitable-Ideal
Zone C: Unsuitable-Too Coarse
Zone B: Unsuitable-Too Fine
Figure 2.1 Guidelines for suitability of aggregates for treatment with Foam Bitumen and Bitumen Emulsion (Asphalt Academy, 2002)
The grading envelopes presented in Figure 2.1 can be refined by targeting a grading that provides the lowest Voids in the Mineral Aggregate (VMA). The Cooper grading relationship according to TG2 is ideal for achieving the most desirable foamed bitumen mixes with lower VMA, as it provides an allowance for variation in the filler content. The following Cooper relationship illustrates this:
( )( )( )
100 0.075
0.075
n n
n n
F dP F
D
− −= +
− Equation 2
Where P = percentage by mass passing a sieve of size d mm D = maximum aggregate size (mm) F = percentage filler content (inert and active) n = variable dependent on aggregate packing characteristics The Cooper relationship provides flexibility with the filler content and under normal practice, a value of n = 0.45 is utilized to achieve the minimum VMA. Given the n-value, the required percentage of particles passing (P) on a selected sieve size (d) can be determined, provided both percentage filler content (F) and maximum aggregate size (D) is known.

12
According to TG2, minimization of the VMA is particularly important for the fraction of mineral aggregate smaller than 2.36 mm, as bitumen droplets disperse within these fractions. Consequently, finer aggregates smaller than 2.36 mm carry the most binder in foamed bitumen mixes. In terms of grading influences on curing of bitumen stabilized materials, maintaining lowest Voids in the Mineral Aggregate (VMA) would be ideal for simulation of field conditions. By applying findings in Figure 2.1, a minimum requirement of 5% of filler content (fines passing through 0.075 mm sieves) is necessary for production of good foam mixes. Furthermore, although the grading envelope in Figure 2.1 applies more significantly to foamed treated mixes, emulsion treated mixes work equally well under the TG2 grading envelope guideline, with the exception of filler content (fines passing through 0.075 mm sieves) not being the main role players in carrying bitumen emulsion within the mix. In the case of bitumen emulsion, although obtaining field grading with significant filler content in the laboratory would be representative, coating of larger particles with BSM-emulsion during mixing is much more evident than in the case of BSM-foam.
2.3.3 Compaction Energy and Voids in the Compacted Material
Air void distribution within the mix is a function of many factors such as mix composition, compaction method and aggregate properties. The relative compaction method/energy appropriate to yield the desirable field properties is equally important. Moreover, the influence of compaction energy and the resulting air void content in bitumen stabilized materials is of utmost importance to the curing behaviour of these mixes. Compaction has a direct influence on aggregate orientation and final structure as reflected in the volumetric properties of the mixture. Typically, field compaction of Reclaimed Asphalt Pavements (RAP) material yields 12% to 15% air void content. This is generally achieved by high energy steel drum rollers, often with high energy oscillations or vibrations. As a result, voids percentage in the mix is a function of compaction energy which in turn is linked to the applied method. In the endeavour to replicate field compaction in the laboratory, understanding of field compaction is imperative. Typically, the largest steel drum vibratory roller compactor currently in use weighs close to 18-20 tones, with an axial length of about 2 m. Assuming a contact length of 100 mm in the roller direction, a typical drum applies contact stress of about 400 kPa in static conditions and higher stresses with vibrations. Research shows that a vibratory roller compactor typically applies 100 KPa in the first static breakdown pass to well over 1000 KPa as contact volume is reduced in the recycled layer. In terms of dynamics of application, compaction by the roller compactor usually occurs at 10 meters behind the recycler at speeds of 4 km/h (1.1 m/s). The 100 mm contact by steel roller drums is typically in contact with surface area of the recycled layer for about 0.2 seconds in each pass. In the field, the steel compactor typically vibrates at about 20 Hz with 8 passes yielding a total time of 1.6 seconds per contact area. The initial passes during compaction are normally carried out with a high amplitude/low frequency setting while final compaction is achieved by carrying out further passes with a high frequency/low amplitude setting. This process typically yields 96% to 100% Modified AASHTO compaction. In terms of voids in the mix, Shuler et al (1992) compared vibratory compaction of asphalt mixes with Marshall, Kneading, and Gyratory compaction procedures to determine differences between each method with respect to density and voids characteristics. The results are published in Figure 2.2 below:

13
Comparison of Vibratory and Conventional Compators
0%
2%
4%
6%
8%
10%
12%
14%
0 5 1 0 1 5 2 0 25 3 0 35
Air
Vo
ids
(%)
Marshall Hammer 50Hz Vibratory Demolition Hammer
50Hz Electromagnetic Testing Machine Hveem Kneading CompactorTexas Gyratory Compactor modified for 1deg & 6 Rev/min
35 50 75
No of Blows Mould Diameter (mm)
100 150 150
Foot base
small large (100 mm)
Mould Diameter
(mm)
200 Rev/Gyr
100 150 150 mm Dia
Figure 2.2 Comparison of Vibratory and Conventional Compactors (Shuler et al, 1992)
Findings in Figure 2.2 suggest vibratory compaction as consistent compaction method for asphalt concrete. In his findings, the achieved compaction by 50Hz vibratory demolition hammer using mould sizes of 100 mm and 150 mm diameters resulted in final air voids of the compacted material in the vicinity of 2-4%. Although findings in this portion of research have focused primarily on hot mix asphalt as a result of lack of appropriate research regarding compaction of bitumen stabilized materials, most researchers agree that vibratory laboratory compaction of cold mixes best simulates field compaction by high energy rollers. Both methods use high compaction energy per loading area, loading time and frequency vibrations. Moreover, the particle distributions and material settling during the compaction process by both techniques resemble similar behaviour. In conclusion, implementing vibratory compaction as appropriate laboratory technique will best simulate field conditions with reasonable air voids content in the mixes and will furthermore give impeccable meaning to laboratory curing.

14
2.3.4 The Role of Active Filler and Binder Content on Bitumen Stabilized Materials
This section explores findings by A. Hodgkinson and A. T. Visser, 2002. Cementitious stabilizing agents (Active Fillers) have been explored in terms of their overall effects on material (RAP) performance under dry and soaked ITS tests. All active fillers were subject to 1.5% volumetric content and both bitumen emulsion and foamed bitumen binders were used for analysis. The following table describes the different active fillers used in the undertaken research:
Table 2.4 Constitution of the various cementitious binders (A. Hodgkinson et al, 2002)
Generally speaking, inactive natural fillers had little effect on both bitumen emulsion and foamed bitumen binders when compared to both binder types without active filler (A. Hodgkinson et al, 2002). Contrary to the nature of fillers, active fillers had profound effect on materials performance. The following Figures explain this:
Figure 2.3 60% stable grade anionic emulsion - Dry ITS (A. Hodgkinson et al, 2002)

15
Figure 2.3 above shows an increase in ITS strength with addition of active fillers on bitumen emulsion mixes. Also, an increase in bitumen emulsion binder content increased material’s performance. There seems to be little improvement on material’s performance with addition of bitumen emulsion in the case of no active filler samples. CEM II AL 32.5 (With 10% Lime) showed lack of modifying properties for the case of bitumen emulsion mixes irrespective of binder content quantities as shown in Figure 2.3. In the case of BSM-foam, the effects of cement active fillers were noticeable. Contrary to BSM-emulsion, BSM-foam treated with CEM II AL 32.5 (With 10% Lime) had an effect on material’s strength. Generally speaking, the addition of any type of active filler seems to have direct modifying properties for the case BSM-foam. The following Figure explains this:
Figure 2.4 80/100 Pen Foamed Bitumen - Dry ITS (A. Hodgkinson, 2002 et al, 2002)
Following findings in figures 2.3 and 2.4, active filler will generally have modifying effects on BSMs. In terms of understanding the interactions of active fillers and binders, the following quote has been included to illustrate that whether BSM-foam or BSM-emulsion is being implemented, the initial consumption of lime or cement for a specific material must govern the mix design process: “The initial consumption of lime (ICL) test indicates that the ICL value of the material is the minimum amount of cement or lime that is required to satisfy the long term absorption of the calcium ions. Ballantine and Rossouw (1989) indicate that lime is typically used to determine the ICL and is accepted to also represent the initial consumption of cement (ICC). From tests done in the study by Liebenberg (2202) it appears that the cement dominates the UCS and ITS at high contents (above ICL) and that the addition of bitumen binders reduces the UCS and ITS of the
material as pozzolanic action and crystal formation cannot take place. At low cement content (lower than ICL) the effect of the cement is much less and the increase in bitumen tends to results in a slight increase in the UCS and/or ITS. The cement has little strengthening effect on the
material when the ICL requirement is not met. This therefore describes the greater benefit of the bituminous binder on the material at low cement contents (A. Hodgkinson, 2002)” In terms of the cement hydration process and bitumen emulsion mixes, Brown and Needham (2000) verified that cement hydration takes place due to the liquid phase of the bituminous emulsion. Furthermore, the presence of bitumen does not prevent the formation of cement

16
hydrated compounds. This further disqualify cement as an inert filler (which only assists with the breaking of bitumen emulsion), but rather as an active filler with modifying properties due to the observed stronger structures.
2.3.5 Moisture Behaviour during Curing Linked to Addition of Cement
Findings by Brown and Needham (2000) have confirmed that the addition of cement on bitumen emulsion mixes slows down curing or moisture loss with time. Although the observed trends were somewhat limited in that the trends were not wide spread across the spectrum, it may still be noteworthy to mention that under normal curing conditions, the mechanisms of bitumen emulsion binders and their need to break and then cure, coupled with the hydration process of cement seem to well slow down the curing process over time. The following Figure explains this:
Figure 2.5 Bitumen emulsion moisture loss with variable quantities of cement (S. Brown et al 2000)
Observing Figure 2.5 shows that in the case of bitumen emulsion mixes, mixes treated with 1-4% of cement content (active filler) will yield similar equilibrium moisture content (EMC) values with time. This could mean that in terms of moisture loss, cement content only has profound effects in the short term and not so much in the long term. It may well be assumed that over the short term, the effects of variable active filler contents are more common in terms of their impact on the resilient modulus property and the resulting moisture loss linked to the curing process. In addition, Figure 2.5 shows that the moisture loss from the 1% cement content mixes increases slightly as more cement is added (2% cement contents onwards). However, the observed trends represent moisture loss levels well below the case of materials treated without active filler. In the short term, it appears that one would need active filler levels beyond the 4% volumetric composition in order to match curing rates of materials treated without active filler. The addition of cement improves bitumen emulsion’s breaking rate and therefore invariably increases material’s curing rate. Although this trend is somewhat consistent in the short term curing phase, over longer term curing the trend seems to yield some equilibrium value in terms of moisture loss. Irrespective of the observed trends, mixes treated without cement (active filler) seem to cure at much faster rates.

17
In terms of cement and water, bitumen emulsion contains 40% water content by volume. Assuming that an emulsion content of 2-3% is common, with total water contents of 5-6% by mass, the cement content (1-2%) to water ratio would be very high, 1:6 or 2:6 (S. Brown et al 2000). The addition of cement in bitumen emulsion mixes may suggest the formation of composite binder which resembles much enhanced material performance properties when compared to bitumen emulsion mixes without cement (S. Brown et al 2000). Elemental analysis (microscopic test) confirmed that mixes without cement have smoother surfaces, showing no changes in the mastic properties. Figure 2.6 shown below confirms this:
Figure 2.6 Bitumen emulsion mixture with no cement (S. Brown et al 2000)
Contrary to Figure 2.6 shown above, bitumen emulsion mixes treated with cement appear much rougher in texture and the presence of calcium structures seems to alter/enhance the mastic properties. Figure 2.7 shown below illustrates this:
Figure 2.7 Bitumen emulsion mixture with 2% cement (S. Brown et al 2000)
This section has confirmed cement as an important variable when considering moisture loss trends or curing rates for bitumen emulsion mixes. Generally, the need to implement cement as aid in the breaking of emulsion and therefore impact on curing rates in the short term will also develop strong calcium composite mastics.

18
Research by S. Brown and Needham (2000) has confirmed cement as active filler and also as vital variable when addressing moisture loss during curing of samples. 2.4 Monitoring of Curing using Mechanical Strength Tests In South Africa, the two most commonly used active fillers in foam and emulsion treated materials is cement and lime. Cement and lime are known for their promotion of reaction during mixing accompanied by chemical change within a short space of time. Both cement and lime are generally used for different purposes in the construction industry and their application can vary significantly.
2.4.1 UCS and ITS Strength Tests
A number of attempts have been made around the world in the endeavour to classify bitumen stabilized materials using the Unconfined Compressive Strength (UCS) and Indirect Tensile Strength (ITS) tests according to TG2 guideline for foamed stabilized materials. In this section, the work of Houston et al is acknowledged. In the attempt to investigate classification of bitumen stabilized materials according to TG2, the following three critical regions and materials around the world were explored: MR439 • Calcareous sand • Dorbank (Red calcarenite, duricrust) • -13.3mm crusher dust Zambia • Weathered basalt • Reclaimed cement stabilized Kalahari sands (red and silty)
• Kalahari silty sand Greece • RAP • Graded crushed limestone • Reclaimed cement stabilized graded crushed limestone Investigations were done on 100x100mm and 150x150mm diameter briquettes. In addition, both cement and lime active fillers were used as part of the test matrix. The following foam and cement/lime ranges were applicable: • Foam : 2 - 4.5% • Cement : 1 - 1.5%
• Lime : 1 - 2.0% In terms of mixing ratio compositions, cement to foam ratios were kept at less that 0.75 whilst lime to foam ratios were maintained at less than 0.66. Both UCS and ITS results are presented below in Figure 2.8.

19
Figure 2.8 Correlations between different ITS and UCS test protocols on foamed BSM (Houston et al.)
The results presented in Figure 2.8 highlight the linear relationship between UCS and ITS tests of foamed bitumen stabilized materials. The close linear relationship between UCS and ITS tests have posed the question whether the tests are appropriate to determine flexibility and classification of bitumen stabilized materials (Houston et al. and Bondietti et al.). It was found by both researchers that a linear relation with good level of confidence exists between the ITS and UCS tests over a range of bitumen cement content ratios. In view of the findings highlighted by both Houston and Bondietti, the following conclusions followed from the investigation study on classification of foamed bitumen stabilized materials: • Both an ITS and UCS test on 150mm briquettes at equilibrium moisture content is not an
adequate indicator of the materials class and determination of optimum binder content. The research has mainly highlighted that the ITS and UCS material class system is fundamentally flawed (Houston et al.)
• Houston et al. further concluded that with the current TG2 2002 classification system an FB3
material will seldom be determined and that if a material falls into this category it is more likely to be the result of incorrect test results than the actual material parameters. Following further research, this classification has subsequently been updated in TG2 2009.
Findings in this section have mainly highlighted the use of UCS and ITS tests as being inappropriate to providing reliable and accurate measure of flexibility of materials treated with different lime and cement foam ratios. The inability of UCS and ITS tests to capture flexibility emphasize the need for a more fundamental mechanical test that provides reasonable measure of sensitivity to flexibility of bitumen stabilized materials. Houston and Bondietti have mainly highlighted the inadequacies of the TG2 classification system. The later has posed a challenge to rethink and research new classification parameters for bitumen stabilized materials.

20
2.4.2 Resilient Modulus Strength Tests
In view of the limitations of UCS and ITS tests, dynamic testing has been found to differentiate better between the levels of performance of cold mix materials. This further emphasizes that Resilient Modulus be selected as the key parameter by which representative cured materials are measured. Loizos et al investigated the effects of curing on newly constructed foam stabilized semi rigid pavement in Athens. The monitoring process involved in-situ resilient modulus analysis over a five year period. Performance monitoring of the CIPR foam stabilized pavement was achieved by using the following Non Destructive Tests (NDT):
• Falling Weight Deflectometer (FWD) • Ground Penetrating Radar (GPR) • Laser Profile (LP)
• Laboratory Tests (Coring of samples) A schematic view of the existing and newly recycled pavements is presented in Figure 2.9.
Figure 2.9 Existing and recycled pavement structures, Athens (A. Loizos et al., 2007)
The recycled semi rigid foam stabilized pavement is a combination of the old cemented bound material (CBM) layer and RAP materials. Monitoring of the CIPR layer over time showed an increase in resilient modulus as a result of curing. Figure 2.10 demonstrates the highlighted findings.
Subgrade
80 – 100 mm Asphalt layer
220 CBM layer
180 mm CBM layer (Granular)
Crushed Stone Drainage Layer
Existing Semi Rigid Pavement
Subgrade
90mm Asphalt base Surface Coarse
250 CIPR layer Foam Stabilized Base
Crushed Stone Drainage Layer
CIPR Foamed Semi Rigid Pavement
Remaining CBM layer (Granular)

21
Figure 2.10 In-Situ foam mix Resilient Modulus using FWD analysis, Athens (A. Loizos et al., 2007)
The observed increase in resilient modulus of foam stabilized pavement demonstrates the powerful effects of field curing. Moreover, resilient modulus of the foam treated base seems to stabilize after 6 months to 1 year period, although gradual growth is still apparent even after 4 years. Consequently, since curing has considerable effects on field resilient modulus, monitoring of resilient modulus as key parameter to validate laboratory curing protocol is imperative. Furthermore, Loizos et al. made the following conclusions following the foam CIPR project in Athens:
• There is an improvement to the overall pavement structural resilient modulus over time • Stabilization of structural resilient modulus after 6 months of heavy traffic is apparent • The back calculated foam moduli were higher than the relative ones obtained from ITSM
tests in cores
• Monitoring after 6 months of traffic and onwards shows that the average back calculated foam modulus values were higher than the related set for pavement design
Loizos has established resilient modulus as a dynamic parameter to capture the curing effects of bitumen stabilized materials. This further supports shared views by various research institutions, as it is currently known that dynamic tests are more sensitive to changes in mix properties than monotonic tests. It is further concluded that the research methodology adopted in this thesis should accept resilient modulus as a key parameter in the validation of accelerated curing protocol.

22
2.5 Seismic Pavement Tests as Reliable Technique for Monitoring Field Modulus Following objectives underlined in the research, it became apparent to adopt a non destructive testing (NDT) method for evaluation of field resilient modulus. Following comprehensive research, the Portable Seismic Pavement Analyser (PSPA) instrument was nominated for use regarding field modulus evaluation. The adopted approach proved practical regarding the need to assess field resilient modulus during construction and the service period. Tracking resilient modulus changes in the BSM-emulsion layer over time proved most beneficial regarding addressing of challenges outlined in the subject matter. The following Figure illustrates the PSPA device and the receiver source configurations. The PSPA device consists of two receivers and a source. PSPA is based on the principle of generating and detection stress waves in the medium or BSM-EMULSION in this instance.
Figure 2.11 Portable Seismic Pavement Analyser (S. Nazarian et al., 2002)
The receivers are connected to a digital signal analyser. An impact is applied to the pavement
surface to generate seismic surface waves. Surface waves (Raleigh waves or R waves) carry the most seismic energy and makes the dominant arrival making it easiest to measure. Particle movement caused by passing surface waves are sensed by receivers and transformed into
electrical signals, (De Vos, E. R, 2007). Raleigh waves can be estimated using the following equation:
XV
t
∆=
∆ Equation 3
∆X represents the distance between the two receivers and ∆t represents the wave travel time between the receivers. Consequently, shear wave velocity Vs is a combination of surface velocity or Raleigh velocity and poisson’s ration through the following equation:
( )1.13 0.16RV s V v= − Equation 4

23
Using shear wave velocity, shear modulus G can be estimated using the following expression:
2
zG Vρ= Equation 5
Young modulus E can therefore be estimated from shear modulus using poisson’s ratio relationship represented in the following equation:
( )2 1E v G= + Equation 6
Depending on the characteristics of the parent material under investigation, Raleigh velocity, shear modulus and consequently young modulus depend heavily on the material’s resilient modulus or mean effective stress state. Furthermore, the use of PSPA device can help determine unknown structural properties such as material resilient modulus per layer depth.
In terms of repeatability of results, a study was conducted between seismic and low strain resilient modulus for granular base materials. Figure 2.12 illustrates the observed consistency in maintaining minimal variability between the two different methods of modulus acquisitions.
Figure 2.12 Relationship between seismic and low strain resilient modulus for granular base material (S. Nazarian et al., 2002)
Following findings by Nazarian, a comparative study between PSPA and FWD test methods were carried out by Abdallah et al. (2003). In his findings, it was found that the PSPA and FWD provided complementary results. In addition, Mallick et all. (2005, 2006) further concluded that the PSPA moduli collection and prediction method produced reliable data with low variability and good accuracy, De Vos, E. R (2007).

24
3 METHODOLOGY
This chapter addresses how the investigation process was carried out and scientific findings which qualify the adopted methodology have been thoroughly discussed. Methodology as guided by the outlined phases in Chapter 1 followed comprehensive field and laboratory investigations. The investigation process primarily focused on factors which impact on material curing, mechanisms of field and laboratory resilient modulus linked to curing behaviour and the adopted decision criteria for curing validation. During the initial stages of the research, it was important to establish a system of criteria for evaluation and validation of revised accelerated curing laboratory protocol. The following three phases played a significant role in guiding the investigation process: Phase I: Formulation and Validation of Project Scope & Testing Criteria There’s general concern in South African industry regarding how long laboratory specimens need to be subjected to various curing environments prior to performing laboratory testing protocols. Kekwick (2004) in his speculations highlighted the following findings emerging from a conceptual investigation (not actual research) that evaluated current curing practices:
• There’s currently no conformity either nationally or internationally on laboratory practices • Realistic characterization of bitumen stabilized materials demands that laboratory processes
must closely reflect field conditions, especially regarding timing of mixing process, compaction of specimens and laboratory curing
• Field properties for any given mix will vary due to differences in environmental/climatic factors which influence the development of binder matrix.
Kekwick (2004) further emphasised that no standard laboratory curing method, in which time period, temperature and/or humidity are prescribed, will give consistent correlation with key field properties. Kekwick therefore recommended that curing under ambient temperature and humidity conditions day and night, but without direct exposure to sun or rain be adopted for most reliable comparison of laboratory and field properties. Kekwick (2005) also proposed that materials resilient modulus as interpreted by the tangent modulus from a stress-strain response measured in a modified CBR-type compression test be considered instead of ITS or UCS testing for the monitoring of curing process on the enhancement of material performance over time. Following the above, it became necessary to investigate the effects of ambient curing on material performance over time. Moreover, the effects of short and long term curing were studied, with an emphasis on moisture monitoring, the time it takes for various materials to yield equilibrium moisture content (EMC) and tangent modulus of these materials. Following Keckwick’s recommendations and objectives outlined in Chapter 1, the following influences/factors and/or areas of concern when dealing with curing of bitumen stabilized materials were addressed in this study:

25
• Ambient curing: Temperature and relative humidity conditions
• Long term effects on material curing and tangent modulus • Different materials considerations • Foam and emulsion binder types • The use of active fillers and its influences on curing rate • Specimen size considerations
In conclusion, factors arising from Phase I which needed incorporation in the final accelerated curing laboratory protocol were validated. Furthermore, the adopted resilient modulus testing protocol for monitoring accelerated curing effects was initiated for both Phase II and Phase III of the research methodology. Phase II: Field Monitoring and Validation
The newly constructed CIPR BSM-emulsion section on the N7 carriage highway from Cape Town towards Malmesbury served as project for field monitoring. The monitoring process involved both the construction phase and analysis/service period of up to ±8 months. The following key factors were monitored and investigated:
• Temperature and relative humidity conditions in the CIPR layer at variable depth positions • Moisture content behaviour over ±8 months using extracted samples
• Is situ resilient modulus during construction and service period In situ resilient modulus and its correlation to field compaction was thoroughly researched. Laboratory resilient modulus criteria and compaction methodology were established. Furthermore, findings arising from monitoring field characteristics were further used to validate curing of bitumen stabilized materials in Phase III. Phase III: Laboratory Investigation and Improvement Formulation of test matrix and performance criteria as validated from both Phases I and II followed a comprehensive laboratory investigation. This led to the following factors being investigated:
• Laboratory resilient modulus and moisture performance linked to field trends • Influence of curing temperature on resilient modulus and moisture content
• Application and influences of different active fillers on curing of bitumen stabilized materials • Boundaries of application for foam & emulsion mixes in the revised accelerated curing
protocol Subsequent to the widespread investigations from Phase III, conclusive results were put together with the revised accelerated curing laboratory protocol being fabricated. Findings pertaining to the investigation throughout the different phases will be discussed in detail in proceeding chapters.

26
In this research project, the following limitations are applicable:
• The full scale on site curing was limited to Western Cape’s climatic environment • The N7 CIPR pavement was treated with emulsion binder and cement as active filler • Construction of the CIPR layer involved ambient exposure of up to 14 days for the purpose
of moisture extraction prior to construction of hot mix asphalt. • In terms of timing of field construction, the construction process took place from February
(summer) to May (autumn) 2007, whilst analysis and monitoring of service period continued into November (spring) 2007.
• The curing experimentation was primarily limited by N7 G2 hornfels graded crushed rock material.
In the following sections, implemented mix design techniques and testing protocols have been validated by supportive literature as outlined in Chapter 2 of the thesis. 3.1 Methodology Overview and Solution Flowchart Experimentation of curing and validation thereof involved the three discussed phases, namely, Preliminary Investigation & Project Scope formulation, Laboratory Experimentation & Improvement and Field Monitoring & Validation.
Although the preliminary phase focused on definition of project scope as validated by published work, both laboratory experimentation and field monitoring were done simultaneously, with an emphasis on investigating boundaries of application for both BSM - foam and BSM-emulsion. The main challenge towards formulation/improvement of accelerated curing laboratory protocol was the aspect of reconciling published work with field performance of selected CIPR project. This was further challenged by laboratory experimentation which had to combine both field performance and published work into a single entity that gave meaning to the proposed final accelerated curing laboratory protocol. A solution system in a form of flowchart was proposed to help guide the investigation process and to also bring clarity to aspects that needed investigation and incorporation into the final solution. Furthermore, the proposed solution flowcharts served as improvement benchmark to validate the proposed solution against published work and the corresponding field performance of the CIPR project. The flowchart in Figure 3.1 describes how the investigation process was conducted and monitored, whilst emphasis was given to the reconciliation of field and laboratory moisture resilient modulus trends.

27
Figure 3.1 Methodology Overview and Solution Flowchart
PRELIMINARY CURING EXPERIMENTATION AND PROJECT SCOPE FORMULATION
Formulation and Validation of Project Scope & Testing Criteria as supported by: • Published Literature • Laboratory Experimentation/Results
FIELD MONITORING AND VALIDATION
Identification and Selection of Cold In Place Recycling project and field monitoring of: • Temperature and Relative Humidity
distribution in the CIPR layer • Moisture & Resilient modulus Trends
LABORATORY INVESTIGATIONS AND CURING PROTOCOL IMPROVEMENTS
Laboratory investigation of foamed and emulsion treated mixes behaviour relative to: • Variable Curing Temperatures and Humidity
Conditions • Moisture trends & the relative impact on
Resilient modulus with active filler
RECONCILIATION OF FIELD & LABORATORY TRENDS Comparison of Field and Laboratory Trends with the aim to accurately interpret results and give meaningful insight in terms of reconciliation of: • Moisture trends and the relative impact on Resilient modulus • Curing temperatures and influences of active filler types on
both Emulsion and Foam Mixes
FINAL INVESTIGATION & ACCELERATED CURING LABORATORY PROTOCOL PROPOSAL
Investigation into boundaries of application for foam and emulsion • Moisture behaviour relative to time of exposure to curing
temperature • Resilient modulus relative to active filler types, moisture trends
VALIDATION OF FINAL ACCELERATED CURING LABORATORY PROTOCOL
Conclusion of Laboratory experimentation and validation of proposed curing protocol by effectively performing the following: • System’s check/validation with Field Results • Cohesion and Friction Angle properties of cured specimens • Conclusions and Recommendations
Validation with Field Trends
Testing of Outcomes

28
4 PRELIMINARY CURING EXPERIMENTATION AND PROJECT SCOPE FORMULATION
Preliminary laboratory tests focused on curing experimentation with the aim to correlate published literature to the derived project scope/deliverables. Following findings by Keckwick (2004), it was necessary to investigate the effects of long term ambient curing on material performance. The influence of long term curing over tangent modulus was thoroughly investigated. In this chapter, crushed rock, ferrikrete gravel and sand materials have also been investigated to try and understand whether a single curing protocol would apply to all material types. These materials were mainly sourced around the Western Cape region for research purposes at Stellenbosch University. In addition, foamed and emulsion binder types were used, with active filler as an additional variable. Findings from preliminary phase have helped define project scope and conditions for curing experimentation. As a result, the need for dynamic fundamental test for evaluation of material properties was thoroughly addressed. Solution flowchart Figure 4.1 was implemented to help address key challenges pertaining to project scope formulation.
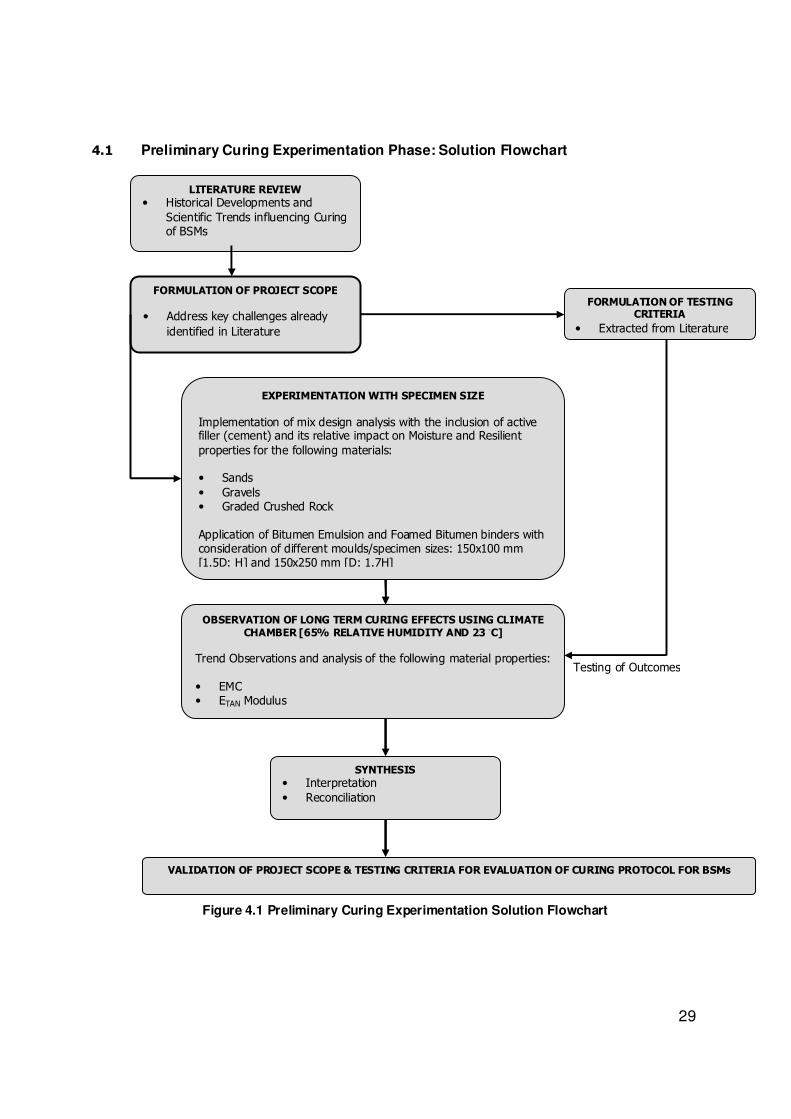
29
4.1 Preliminary Curing Experimentation Phase: Solution Flowchart
Figure 4.1 Preliminary Curing Experimentation Solution Flowchart
LITERATURE REVIEW • Historical Developments and
Scientific Trends influencing Curing of BSMs
FORMULATION OF PROJECT SCOPE
• Address key challenges already identified in Literature
FORMULATION OF TESTING CRITERIA
• Extracted from Literature
EXPERIMENTATION WITH SPECIMEN SIZE
Implementation of mix design analysis with the inclusion of active filler (cement) and its relative impact on Moisture and Resilient properties for the following materials:
• Sands • Gravels • Graded Crushed Rock Application of Bitumen Emulsion and Foamed Bitumen binders with consideration of different moulds/specimen sizes: 150x100 mm [1.5D: H] and 150x250 mm [D: 1.7H]
OBSERVATION OF LONG TERM CURING EFFECTS USING CLIMATE CHAMBER [65% RELATIVE HUMIDITY AND 23 ◦C]
Trend Observations and analysis of the following material properties: • EMC • ETAN Modulus
SYNTHESIS • Interpretation • Reconciliation
VALIDATION OF PROJECT SCOPE & TESTING CRITERIA FOR EVALUATION OF CURING PROTOCOL FOR BSMs
Testing of Outcomes

30
4.2 Proposed Tests Matrix In order to address accelerated curing laboratory protocol, it was necessary to investigate all material types associated with cold mix technology. In terms of investigated materials, crushed rock, sands and gravels were explored with an emphasis on curing rates, the duration for each material type to reach EMC and tangent modulus of these materials. As elaborated previously, these materials were sourced in the Western Cape region for research purposes. The following table summarizes the preliminary laboratory test matrix:
Table 4.1 Proposed preliminary laboratory test matrix
Material Type Foam Emulsion
Binder Content
Active Filler: CEM (%)
Specimen Size D x H (mm) Number of
(%) 1 0 150x100 150x250 Samples
Graded Crushed Rock X X 1.8 X X X X 8 x Day 1, 7, 28 & 1yr
Ferricrete Gravel X X 1.8 X X X X 8 x Day 1, 7, 28 & 1yr
Sand X X 1.8 X X X X 8 x Day 1, 7, 28 & 1yr Total 96
As observed from Table 4.1, foamed and emulsion binder types were used and cement was implemented as active filler. Laboratory sample sizes of 150x100 mm [1.5D: H] and 150x250 mm [D: 1.7H] were manufactured with the aim to measure effects of sample sizes on material curing. Furthermore, the use of different material types served as benchmark to validate whether a single curing protocol would be representative for all material types and whether or not each material type would require specific curing protocol. Although one of the main objectives of this study was to unify the accelerated curing protocol, it was equally imperative to qualify this approach by real laboratory results. In addition, it was anticipated that the CIPR project would assume gross emulsion content in the vicinity of 3% as validated by field moisture samples for purposes of achieving MDD in relation to compaction fluid content. For this reason, mixing of laboratory specimens with residual binder content of 1.8% [60% Emulsion Content] seemed reasonable during the preliminary testing phase. 4.3 Implemented Materials Properties Material properties were analyzed using standard modified AASHTO compaction. From the results in Table 4.2, ferricrete gravel showed the highest material OMC value, while crushed rock showed the highest MDD. Overall, all materials reached compaction during the mixing process and in the case of emulsion mixes, an extra 1% of moisture was included to aid with breaking of emulsion at the initial compaction stages. Additional moisture also aided with compaction, especially in the case of crushed rock due to its lower OMC value.

31
Table 4.2 Preliminary laboratory material properties
Material Type Classification MDD (kg/m3) OMC (%)
Graded Crushed Rock G2 to G3 2398 5.71
Ferricrete Gravel G4 2179 9.88
Sand G5 2067 6.4
Grading envelopes shown in Figure 4.2 qualified all materials for acceptable foamed mixes according to TG2. Although crushed rock lacked fines, laboratory mixes proved acceptable. The sand material also provided a BSM of normal quality for foamed mixes. Ferricrete gravel gave the best foamed mix properties as witnessed by the majority of coated fines after the mixing process.
0%
10%
20%
30%
40%
50%
60%
70%
80%
90%
100%
0.01 0.10 1.00 10.00
Percentage Passing
Particle Size (mm)
Preliminary Laboratory Tests: Material Grading Properties
Crushed Rock Gravel Sand
Figure 4.2 Preliminary tests material grading curves

32
4.4 Long Term Curing Conditions Curing conditions were mainly dictated by availability of climate chamber rooms at Stellenbosch University. Samples were cured for approximately 12 months, with an overlap into the 13th month. The following curing conditions were used:
Table 4.3 Preliminary tests long term curing conditions
Materials Temperature (◦C) Relative Humidity (%) Duration (Months)
General Conditions
Crushed Rock, Gravel and Sand 23 ± 1 60 ±5 12 Unsealed
Implemented climate chamber showed an average temperature fluctuation of 1ºC while relative humidity meter fluctuated by 5%, yielding temperature tolerances of 22ºC - 24ºC and relative humidity readings of 55% - 65%. Figure 4.3 illustrates the different specimen sizes and nature of the curing environment. Samples were exposed to ambient conditions and careful attention was given to proper handling of the specimens during weighing of mass for moisture analysis. Plates were used to mount samples to avoid small particles being lost during the handling process.
Figure 4.3 Long term curing of crushed rock, ferricrete gravel & sand samples
The use of relative humidity conditions in addition to temperature curing has been widely used by various researchers as published in literature review of Chapter 2. Such an approach makes sense as site conditions have both temperature and relative humidity distributions within the CIPR layer. Due to rising factors at the preliminary phase of research, it became necessary to investigate the effects of such curing conditions over material performance. In addition, longer curing durations were used to simulate field curing subject to similar environments whilst EMC of each material type was closely monitored.

33
4.5 Proposed Testing Protocol According to literature review in Chapter 2, Keckwick (2004) suggested that material resilient modulus as interpreted by the tangent modulus from a stress strain response measured in a modified CBR-type compression test be considered for evaluation of material properties. In terms of Keckwick’s research, the time required for curing to reach certain resilient modulus was thoroughly investigated. Following Keckwick’s findings, the monotonic test protocol was mainly adopted to measure the effects of long term curing on materials tangent modulus. According to literature, although dynamic tests are more sensitive to capture changes in materials strength’s properties during curing, for the purpose of establishing project scope it was decided that monotonic test be implemented due to the simplistic test setup. Figure 4.4 shown below illustrates the differentiation between tangent and secant modulus, as derived from stress and strain response graph for monotonic triaxial testing.
Figure 4.4 Monotonic tangent and secant modulus analysis (Ebels, 2007)
The following conditions in Table 4.4 were used to conduct laboratory monotonic testing:
Table 4.4 Preliminary monotonic triaxial test conditions
Materials
Specimen Dimension (mm) Compaction
Method
Monotonic Strain Confinement
Height Diameter Rate (min-1) Pressure (KPa)
Crushed Rock, Gravel and Sand 250 150 Mod Proctor 2.10% 100
For simplicity reasons, it was decided that all tests be conducted at confinement pressures of 100 kPa. Also, only specimen sizes of 150x250 mm [D: 1.7H] were used as per limitations by Stellenbosch University’s MTS (Material Testing System) protocol and MTS load cell dimensions.
σa
ε εf
σmax
Esec
Etan

34
The 2.1 % strain rate follows a test protocol adopted by Stellenbosch University. Based on Stellenbosch University testing protocol, lower strain rates have been adopted for triaxial testing of soil specimens, whilst higher strain rates have been applied to more stiff bound materials. Figure 4.5 below displays the MTS (Material Testing System) unit implemented to carry out the testing protocol.
Figure 4.5 Preliminary tests MTS testing protocol
Monotonic testing comprises a destructive test that entails loading of briquettes until failure. From this process, a stress strain response graph can be plotted, yielding tangent modulus and strain at failure. Figure 4.6 depicts monotonic crushing of specimen under MTS loading. Since testing load is known and displacement in the vertical direction is recorded by MTS internal LVDTs during material deformation, strain can be estimated by monitoring the change in specimen’s height.
0
5000
10000
15000
20000
25000
30000
0.0 1.0 2.0 3.0 4.0 5.0
Applied load [N]
Strain [%]
Applied Load versus Vertical Strain
Figure 4.6 Applied load versus vertical strain during preliminary testing
Stress can be calculated from the loading force over specimen’s area (150 mm diameter). By calculating stress and strain, the following stress strain response graph can be plotted. By

35
evaluating tangent modulus over the linear elastic region of the graph, both tangent and secant modulus can be estimated. Figure 4.7 illustrates this process.
0
200
400
600
800
1000
1200
1400
1600
1800
2000
0 2 4 6 8
Applied vertical stress sa[kPa]
strain [%]
Graded Crushed Rock : 25 ˚C Testing Temperature
Figure 4.7 Applied stress versus vertical strain during preliminary testing
Monotonic testing of materials was evaluated for day 1, day 7 and day 28 durations. The 1 year samples were only used for moisture analysis and dynamic loading resilient tests. This meant that a number of 24 specimens [8 samples per material type] x 4 analysis periods had to be made [Total of 96 Tests]. Although repeatability may be questioned as briquettes were crushed per testing, this exercise was aimed at reaching course conclusions regarding general trends which evolved from tangent modulus relative to laboratory curing. 4.6 Results and Findings Results from preliminary phase have confirmed trends observed by various researchers and provided absolute values. The investigation process initially focused on moisture behaviour of 150x100 mm [1.5D: H] and 150x250 mm [D: 1.7H] specimens for all material types. Emphasis was given to emulsion binder mixes, due to their high fluid contents at compaction as opposed to foam mixes. During formulation of project scope, it became necessary to focus on specimens with high fluid contents at compaction [emulsion mixes]. Moisture analysis from a high fluid content point of view proved reliable to help study the effects of long term curing on moisture behaviour. Emulsion mixes with cement as active filler were also considered to assist in investigating the effects of long term tangent modulus over 12 months. Once aspects of sample size impact on material curing were concluded for all material types, further investigation focused on material moisture behaviour and tangent modulus relative to long term curing. For the case of tangent modulus, specimen sizes of 150x250 mm [D: 1.7H] were considered due to limitations by Stellenbosch University’s MTS testing protocol and MTS load cell dimensions. Additionally, trends evolving from preliminary phase helped confirm test criteria and curing valuation for the revised accelerated curing laboratory protocol.

36
4.6.1 Moisture Behaviour of Variable Mould Sizes: Emulsion Mixes
In terms of moisture behaviour of 150x100 mm [1.5D: H] and 150x250 mm [D: 1.7H] specimen sizes, Figure 4.8 below depicts moisture trends of emulsion mixes with cement as active filler over 12 months. In terms of active filler influences, all material and the different sizes were treated with 1% cement and 3% anionic gross emulsion content.
y = 0.804x-0.15
R² = 0.913
y = 0.734x-0.14
R² = 0.878
y = 0.869x-0.14
R² = 0.852
y = 0.785x-0.14
R² = 0.869
y = 0.718x-0.13
R² = 0.847
y = 0.854x-0.12
R² = 0.820
20%
30%
40%
50%
60%
70%
80%
90%
100%
0 20 40 60 80 100 120 140 160 180 200 220 240 260 280 300 320 340 360 380
% OMC
Number of Curing Days
BSM-emulsion [cement]
Crushed Rock Gravel Material Sand Material
150x100 mm [1.5D: H]
150x250 mm [D: 1.7H]Sand
Sand
Gravel
Gravel
Rock
Rock
Figure 4.8 BSM-emulsion moisture behaviour of variable specimen sizes
Generally, ferricrete gravel seems to lose moisture at a more accelerated rate than crushed rock and sand materials. Also, all materials seem to approach EMC approximately after 10 to 12 months. As a point of clarity, the observed moisture trends are based on real moisture samples in the laboratory for the duration of 12 months. In terms of variability of results, both the equations the R2 value has been included to help clarify the levels of reliability concerning the adopted modelling techniques. In this instance, the idea is to compare trends with reasonable accuracy. Generally, specimen sizes seem to have little effect on curing rates for all material types with an average variability of 0-3% OMC between [1.5D: H] and [D: 1.7H] samples per material type. This implies that either 150x100 mm [1.5D: H] or 150x250 mm [D: 1.7H] specimens may be used for moisture analysis. The paramount observation is under similar curing conditions over 12 months, gravels approached 30% OMC, whilst crushed stone approached 33% OMC with sands approaching 38% OMC: Values extrapolated from solid lines or [D: 1.7H] samples.

37
The observed close correlations in generated trends could mean that a single curing protocol may be appropriate for all material types. However, this needs to be verified by more research concerning curing of different materials. Generally, different material types showed OMC fluctuations in the vicinity of 5% at the end of the analysis. Translating the 5% OMC variability in terms of actual moisture contents reveal that the crushed stone material varied by 0.29% moisture content when compared to sands at 0.32% and gravels at 0.49% moisture contents. The 5 %OMC variability in EMC trends over curing time is also attributed to all material types differing with initial %OMC values at compaction, since different material types required specific moisture contents for purposes of achieving reasonable compaction.
4.6.2 Moisture Behaviour of BSMs - Emulsion and Foam Mixes
For simplicity, it was decided that foam and emulsion moisture trends be plotted separately due to the unlikely event of capturing similar moisture trends for both foam and emulsion mixes for a given material type. Moreover, both cement treated and non cement treated materials trends were compared. Emphasis was devoted to typical final %OMC values of the same material type treated with both foam and emulsion binder types. In addition, all materials were subject to sample sizes of 150x250 mm [D: 1.7H] following restrictions by Stellenbosch MTS testing protocol. BSM-Foam Moisture Trends All foam treated materials were compacted at 80% OMC with the vibratory Bosch Hammer compaction technique. Moisture was monitored for 31 days instead of the proposed 12 months. The change in the analysis period was mainly driven by logistics challenges in the laboratory. Eventually, the analysis of BSM-foam was only limited to 31 days. Generally, moisture was analysed by observing the change in specimen’s weight over the analysis period. The dashed trend lines in Figure 4.9 represent specimens with no active filler whilst solid trend lines represent specimens treated with cement as active filler.
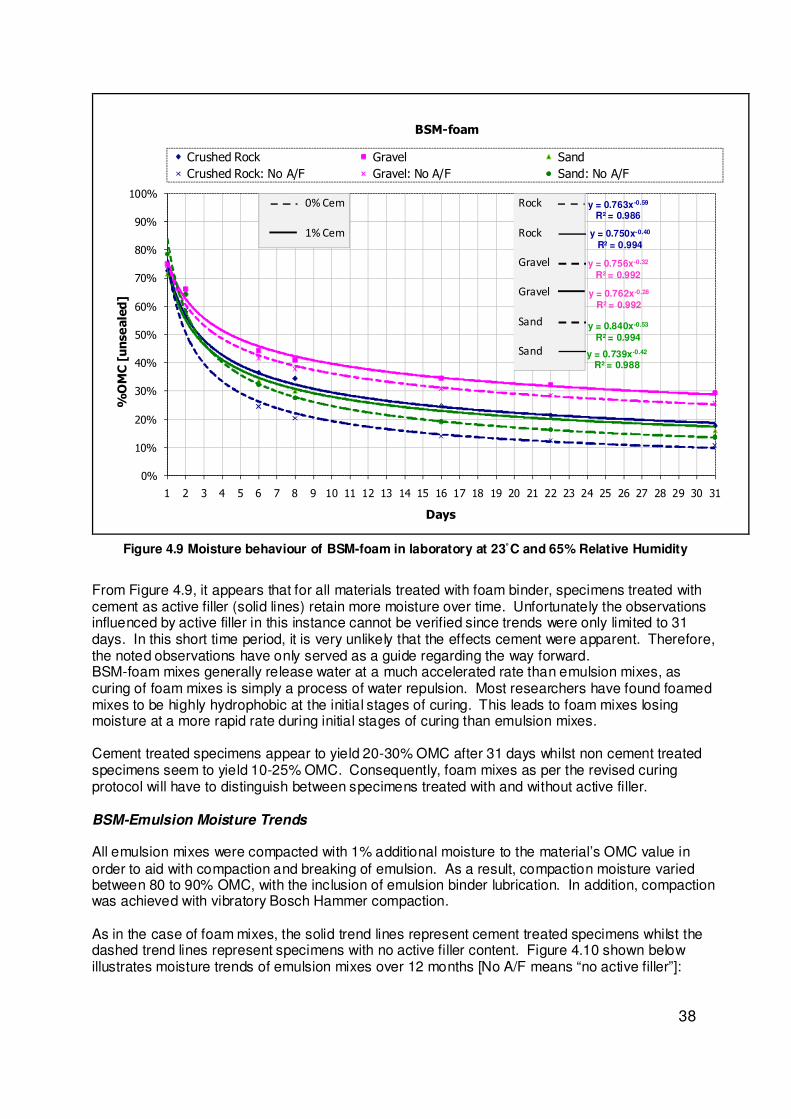
38
y = 0.750x-0.40
R² = 0.994
y = 0.762x-0.28
R² = 0.992
y = 0.739x-0.42
R² = 0.988
y = 0.763x-0.59
R² = 0.986
y = 0.756x-0.32
R² = 0.992
y = 0.840x-0.53
R² = 0.994
0%
10%
20%
30%
40%
50%
60%
70%
80%
90%
100%
1 2 3 4 5 6 7 8 9 10 11 12 13 14 15 16 17 18 19 20 21 22 23 24 25 26 27 28 29 30 31
%OMC [unsealed]
Days
BSM-foam
Crushed Rock Gravel Sand
Crushed Rock: No A/F Gravel: No A/F Sand: No A/F
0% Cem
1% Cem
Rock
Rock
Gravel
Gravel
Sand
Sand
Figure 4.9 Moisture behaviour of BSM-foam in laboratory at 23˚C and 65% Relative Humidity
From Figure 4.9, it appears that for all materials treated with foam binder, specimens treated with cement as active filler (solid lines) retain more moisture over time. Unfortunately the observations influenced by active filler in this instance cannot be verified since trends were only limited to 31 days. In this short time period, it is very unlikely that the effects cement were apparent. Therefore, the noted observations have only served as a guide regarding the way forward. BSM-foam mixes generally release water at a much accelerated rate than emulsion mixes, as curing of foam mixes is simply a process of water repulsion. Most researchers have found foamed mixes to be highly hydrophobic at the initial stages of curing. This leads to foam mixes losing moisture at a more rapid rate during initial stages of curing than emulsion mixes. Cement treated specimens appear to yield 20-30% OMC after 31 days whilst non cement treated specimens seem to yield 10-25% OMC. Consequently, foam mixes as per the revised curing protocol will have to distinguish between specimens treated with and without active filler. BSM-Emulsion Moisture Trends All emulsion mixes were compacted with 1% additional moisture to the material’s OMC value in order to aid with compaction and breaking of emulsion. As a result, compaction moisture varied between 80 to 90% OMC, with the inclusion of emulsion binder lubrication. In addition, compaction was achieved with vibratory Bosch Hammer compaction. As in the case of foam mixes, the solid trend lines represent cement treated specimens whilst the dashed trend lines represent specimens with no active filler content. Figure 4.10 shown below illustrates moisture trends of emulsion mixes over 12 months [No A/F means “no active filler”]:

39
y = 0.804x-0.15
R² = 0.913
y = 0.734x-0.14
R² = 0.878
y = 0.869x-0.14
R² = 0.852
y = 0.855x-0.10
R² = 0.888
y = 0.73x-0.15
R² = 0.880
y = 0.826x-0.13
R² = 0.705
20%
30%
40%
50%
60%
70%
80%
90%
100%
0 20 40 60 80 100 120 140 160 180 200 220 240 260 280 300 320 340 360
%OMC [unsealed]
Days
BSM-emulsion
Crushed Rock Gravel SandCrushed Rock: No A/F Gravel: No A/F Sand: No A/F
Rock
Rock
Gravel
Gravel
Sand
Sand
0% Cem
1% Cem
Figure 4.10 Moisture behaviour of BSM-Emulsion in laboratory at 23˚C , 65% Relative Humidity
Emulsion mixes are less hydrophobic during the initial stages of curing. Figure 4.10 confirms this phenomenon as moisture is lost at a much less rapid rate. BSM-emulsion mixes are unique in a sense that there seems to be no large differences between cement treated and non cement treated specimens. The biggest exception occurs with crushed rock, with cement treated specimens losing moisture more rapidly than non cement treated specimens. The recorded difference is almost 20% of final %OMC value. The noticeable difference supports some general research findings as cement treated emulsion mixes are expected to cure at a faster curing rate than non cement treated mixes. Although this phenomena is fairly acceptable, it’s relevance in this study will be explored further. Generally, it appears that during the hydration process moisture is locked in the initial curing phases for both bitumen emulsion and foamed bitumen mixes. These observed trends may suggest a longer curing time in the revised protocol for cement treated BSM’s. Generally, cement treated specimens appear to stabilize at 30-40% OMC after 12 months for the given conditions (65% relative humidity and 23 ºC) whilst non cement treated specimens seem to yield 30-50% OMC. The inclusion of cement seems to assist with the breaking of emulsion at the initial phase, a factor which accelerates curing whilst the non cement treated specimens seem to break the emulsion at a much slower rate. However, this observed trend seems extreme and applies only to graded crushed rock material. There seems to be close correlation of trends between cement treated and non cement treated specimens for both gravels and sands.

40
Without having clear reasons to explain different responses of materials to curing conditions, it is necessary to reserve certain tolerances when revising the curing protocol. Cleary, the observed trends are material specific especially when factors such as material grading, compaction and voids in the mix are negligible. Both gravels and sands seem to have similar trends, whilst crushed rock is different in all aspects. The inconsistencies in the observed trends pose a significant challenge in revising the curing protocol. It may be that a revised rough curing protocol may be envisaged, with an emphasis on acceptable tolerances.
4.6.3 BSM-emulsion and BSM-foam Mixes Tangent Modulus
In order to draw comparable results between BSM-foam and BSM-emulsion, the tangent modulus analysis for all materials was evaluated for 28 days of curing conditions. The implemented curing conditions involved room temperatures of 23˚C and 65% relative humidity conditions. As elaborated previously, all specimens were cured unsealed for the 28 days duration. All tested materials were crushed under the MTS machine and crushed samples were used for moisture analysis. Summary of results have been illustrated in Table 4.5 shown below:
Table 4.5 Summary of Tangent Modulus tangent performance for BSM-foam and emulsion mixes
Material Type
Binder Binder Specimen Active Filler Tangent Modulus Over time (MPa)
Type Content (%) Size (mm) Cement (%) 1 Day 7 Days 28 Days
Graded Crushed Rock Foam 1.8 150x250 1 198 245 332 Ferricrete Gravel Foam 1.8 150x250 1 200 257 299
Sand Foam 1.8 150x250 1 183 240 285
Graded Crushed Rock Foam 1.8 150x250 0 130 210 270
Ferricrete Gravel Foam 1.8 150x250 0 137 170 250 Sand Foam 1.8 150x250 0 150 197 264
Graded Crushed RockEmulsion 1.8 150x250 1 206 225 292
Ferricrete Gravel Emulsion 1.8 150x250 1 167 201 255
Sand Emulsion 1.8 150x250 1 153 179 210
Graded Crushed RockEmulsion 1.8 150x250 0 94 180 230
Ferricrete Gravel Emulsion 1.8 150x250 0 130 156 189 Sand Emulsion 1.8 150x250 0 117 153 189
Graphs representing tangent modulus over curing period for both emulsion and foamed mixes have been plotted separately. Trend lines have been plotted to differentiate material performance relative to curing period and ultimately moisture trends. It is further stressed that results merely represent general trends to help define project scope and curing evaluation criteria. BSM-foam Tangent Modulus Trends The solid bar charts presented in Figure 4.11 represent cement treated materials whilst dashed line bar charts represent non cement treated materials.

41
0
25
50
75
100
125
150
175
200
225
250
275
300
325
350
1 7 28
Tangent Modulus [M
Pa]
Curing Time [Days]
BSM-foam
Rock Gravel Sand
cement no filler
Figure 4.11 Tangent modulus of BSM-foam mixes versus curing period
The results illustrate general increase in tangent modulus over curing period. The increase in tangent modulus is directly attributed by the decrease in moisture contents due to curing. Generally, tangent modulus appears to be increasing even after 28 days of curing. Cement treated materials seem to outperform non cement treated materials in terms of the achieved tangent modulus. Generally, crushed rock offers the best tangent modulus, a factor attributed to the material’s high cohesion [particle interlocking] and friction angle properties. Gravels seem to come second in rank in terms of material strength. Overall, the 28 day curing technique at 23 ˚C and 65% relative humidity shows that the tangent modulus of BSM-foam is still on the increase. In other words, the effects of active filler on BSM-foam will continue to be apparent for some time before equilibrium of these mixes is reached. BSM-emulsion Tangent Modulus Trends Similar trends for emulsion mixes have also been identified. Figure 4.12 illustrates behaviour of BSM-emulsion.

42
0
25
50
75
100
125
150
175
200
225
250
275
300
325
1 7 28
Tangent Modulus [M
Pa]
Curing Time [Days]
BSM-emulsion
Rock Gravel Sand
cement no filler
Figure 4.12 Tangent modulus of BSM-emulsion mixes versus curing period
From the observed results, cement treated specimens have higher tangent modulus values than non cement treated specimens. Once again, the crushed rock material gave the best tangent modulus over the curing period. Both non cement treated gravel and sand specimens seem to assume similar tangent modulus characteristics over time. The most important observation is tangent modulus increases with reduction in moisture content. This implies that materials resilient modulus is indirectly related to moisture content. In addition, the inclusion of cement resembled strong impact on material tangent modulus. 4.7 Discussions Following findings from preliminary phase and accompanying supportive literature, conclusions were drawn regarding formulation of project scope and curing assessment criteria in terms of the following: 1. Material Type and Grading In order to simplify accelerated curing protocol investigation, it may be necessary to base all tests on selected good quality material type to help eliminate interpretation of complex behaviour(s) which are usually material specific. The use of a selected, representative single material should help generate reliable trends that may be used to answer some of key challenges facing curing. Controlled laboratory grading may be necessary to help eliminate variability of results, especially in the case of resilient modulus. Generating consistency in the observed trends should help monitor the revised curing protocol more closely. The choice of material type should satisfy TG2 grading parameters and should contain adequate fines. Additionally, the chosen material should respond reasonably well in terms of mixing properties for foamed and emulsion binder types.

43
2. Moisture The chosen material should ideally be mixed and compacted at the same moisture content for BSM-foam and BSM-emulsion. Mixing of BSM-foam and BSM-emulsion mixes at similar compaction moisture contents should help with comparisons regarding moisture curing relative to curing time for both binder types. There may be strong need to control moisture content and relative humidity conditions during curing of specimens. This process may be best controlled by sealing of specimens with plastic bags. 3. Curing Temperature In order to avoid ageing of the binder, it may be necessary to cure samples at temperatures below the Ring and Ball softening point of bitumen. Temperatures as low as 22 ◦C - 24 ◦C may not be conducive to facilitate accelerated curing at laboratory environments as the process will take too long making it impractical for mix design. Preliminary tests have confirmed this aspect. On average, it took 7 to 14 days for emulsion mixes to reach 50% OMC. Given production demands in the industry, long curing durations linked to ambient curing may pose considerable challenges. It may therefore be necessary to cure samples at slightly higher temperatures to speed up the process. 4. Active Filler From preliminary results and supportive research, both gravels and sands have confirmed the inclusion of cement during emulsion mixing as factor to slow down curing. The opposite was true for non cement treated mixes, with specimens curing at accelerated rates. Cement as active filler has an impact on material performance and the relative moisture trends need further investigation. The inclusion of cement during mixing and its effects on material strength and moisture trends will have to be incorporated in the revised curing protocol. 5. Mechanical Properties The much observed rapid curing of BSM-foam has led to higher increase in tangent modulus over time than BSM-emulsion. It may also be that tested materials responded better to foam binder than emulsion binder. In terms of the way forward, implementation of non destructive dynamic loading resilient modulus testing for the purpose of assessing accelerated curing laboratory protocol must seemed desirable. The adopted approach implies that specimens can be cured over time and tested at specific intervals for resilient modulus analysis. Repeat tests on specimens over time should help establish reliability and repeatability of results. The latter should help derive reliable trends needed for curing evaluation Conclusions Following findings from Preliminary phase, it was decided that curing of specimens be assessed using non destructive dynamic loading resilient tests. In terms of active filler, it was decided that both cement and lime be used to measure the impact on moisture and resilient modulus trends. In addition, it was decided that foamed and emulsion binder types be accommodated to assess boundaries of applicability for both binder types. In other words, the feasibility of a unified curing approach will be assessed for bitumen emulsion and foamed bitumen mixes, with and without active filler.

44
5 FIELD MONITORYING AND INVESTIGATION
Field monitoring and validation involved a thorough process following project scope findings as captured during preliminary phase in Chapter 4. The scope defined was mainly guided by objectives outlined in the introductory chapter of thesis work with strong emphasis being placed on capturing field moisture and resilient modulus trends. This Chapter involved capturing of field trends in terms of BSM-emulsion moisture, resilient modulus, temperature and relative humidity conditions over time. Given the vast scope to cover all relevant angles pertaining to accelerated curing, solution flowcharts as implemented during field monitoring guided the process. 5.1 Field Monitoring Phase: Solution Flowchart In terms of selected CIPR project, only BSM-emulsion was monitored in the field. Due to time limitations, BSM-foam had already been monitored for the field site (N7) under a separate research project undertaken by CSIR. The following solution flowchart as extracted in methodology section in Chapter 3 describes processes involved regarding field monitoring and validation:

45
Figure 5.1 Field Monitoring Solution Flowchart
INITIAL FIELD EVALUATION
• Soil Lab Investigations (Field Survey) • Residual binder analysis (RAP) • Residual field moisture contents • Bed Rock density profile / Terrain
Inspections / Establishment of test stations
CONSTRUCTION MONITORYING
UNSEALED BSM-EMULSION
• Daytime temperature measurements • Temperature impact on construction moisture
content • BSM-emulsion PSPA analysis
BSM-EMULSION PERFORMANCE LINKED TO FIELD CURING
Configuration of field resilient trends linked to: • BSM-emulsion Temperature and humidity [Field Curing] • Compaction and parent rock grading characteristics • Cement/active filler • Binder : Bitumen emulsion
STELLENBOSCH LABORATORY MATERIAL [RAP] PROPERTIES
• Grading analysis [RAP] • OMC [%]
QUALITY CONTROL Quality control focused on construction methods used and their impact on field material properties [post construction] • CIPR Process • Cement application • Emulsion binder application [milling machine] • Compaction sequence
SEALED BSM-EMULSION [SEALED WITH HMA] • Insertion of Temp/ RH buttons - BSM-emulsion • BSM-emulsion PSPA analysis • BSM-emulsion moisture content analysis [Used
oven dried samples for moisture analysis during
construction and service periods]
FIELD MONITORYING OF REHABILITATED BSM-EMULSION
FINAL ANALYSIS
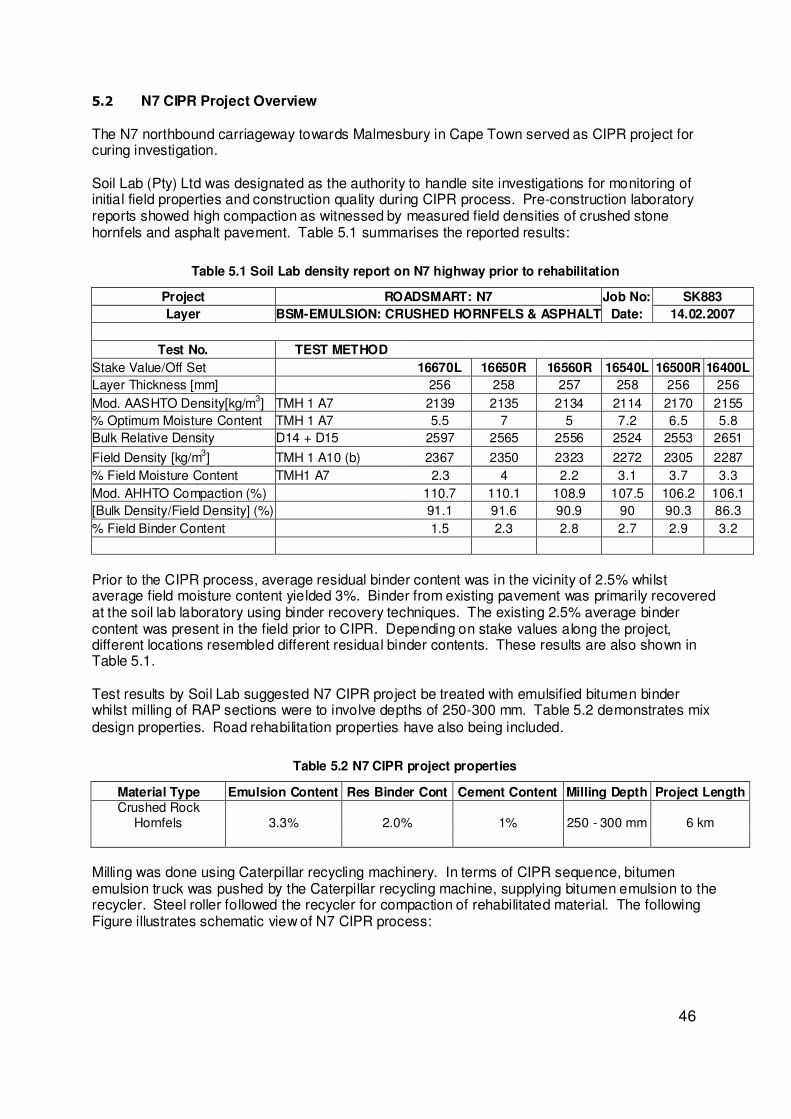
46
5.2 N7 CIPR Project Overview The N7 northbound carriageway towards Malmesbury in Cape Town served as CIPR project for curing investigation. Soil Lab (Pty) Ltd was designated as the authority to handle site investigations for monitoring of initial field properties and construction quality during CIPR process. Pre-construction laboratory reports showed high compaction as witnessed by measured field densities of crushed stone hornfels and asphalt pavement. Table 5.1 summarises the reported results:
Table 5.1 Soil Lab density report on N7 highway prior to rehabilitation
Project ROADSMART: N7 Job No: SK883
Layer BSM-EMULSION: CRUSHED HORNFELS & ASPHALT Date: 14.02.2007
Test No. TEST METHOD
Stake Value/Off Set 16670L 16650R 16560R 16540L 16500R 16400L
Layer Thickness [mm] 256 258 257 258 256 256
Mod. AASHTO Density[kg/m3] TMH 1 A7 2139 2135 2134 2114 2170 2155
% Optimum Moisture Content TMH 1 A7 5.5 7 5 7.2 6.5 5.8
Bulk Relative Density D14 + D15 2597 2565 2556 2524 2553 2651
Field Density [kg/m3] TMH 1 A10 (b) 2367 2350 2323 2272 2305 2287
% Field Moisture Content TMH1 A7 2.3 4 2.2 3.1 3.7 3.3
Mod. AHHTO Compaction (%) 110.7 110.1 108.9 107.5 106.2 106.1
[Bulk Density/Field Density] (%) 91.1 91.6 90.9 90 90.3 86.3
% Field Binder Content 1.5 2.3 2.8 2.7 2.9 3.2
Prior to the CIPR process, average residual binder content was in the vicinity of 2.5% whilst average field moisture content yielded 3%. Binder from existing pavement was primarily recovered at the soil lab laboratory using binder recovery techniques. The existing 2.5% average binder content was present in the field prior to CIPR. Depending on stake values along the project, different locations resembled different residual binder contents. These results are also shown in Table 5.1. Test results by Soil Lab suggested N7 CIPR project be treated with emulsified bitumen binder whilst milling of RAP sections were to involve depths of 250-300 mm. Table 5.2 demonstrates mix design properties. Road rehabilitation properties have also being included.
Table 5.2 N7 CIPR project properties
Material Type Emulsion Content Res Binder Cont Cement Content Milling Depth Project Length Crushed Rock
Hornfels 3.3% 2.0% 1% 250 - 300 mm 6 km
Milling was done using Caterpillar recycling machinery. In terms of CIPR sequence, bitumen emulsion truck was pushed by the Caterpillar recycling machine, supplying bitumen emulsion to the recycler. Steel roller followed the recycler for compaction of rehabilitated material. The following Figure illustrates schematic view of N7 CIPR process:
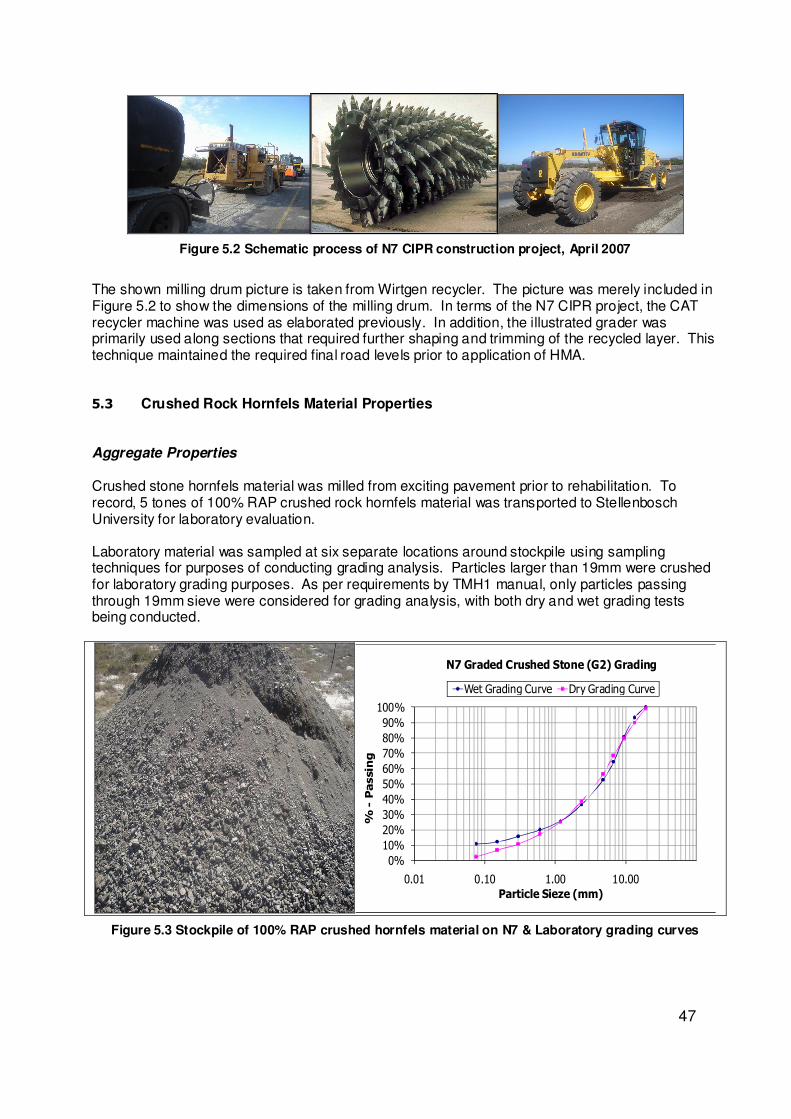
47
Figure 5.2 Schematic process of N7 CIPR construction project, April 2007
The shown milling drum picture is taken from Wirtgen recycler. The picture was merely included in Figure 5.2 to show the dimensions of the milling drum. In terms of the N7 CIPR project, the CAT recycler machine was used as elaborated previously. In addition, the illustrated grader was primarily used along sections that required further shaping and trimming of the recycled layer. This technique maintained the required final road levels prior to application of HMA. 5.3 Crushed Rock Hornfels Material Properties Aggregate Properties Crushed stone hornfels material was milled from exciting pavement prior to rehabilitation. To record, 5 tones of 100% RAP crushed rock hornfels material was transported to Stellenbosch University for laboratory evaluation. Laboratory material was sampled at six separate locations around stockpile using sampling techniques for purposes of conducting grading analysis. Particles larger than 19mm were crushed for laboratory grading purposes. As per requirements by TMH1 manual, only particles passing through 19mm sieve were considered for grading analysis, with both dry and wet grading tests being conducted.
0%10%20%30%40%50%60%70%80%90%
100%
0.01 0.10 1.00 10.00
% -Passing
Particle Sieze (mm)
N7 Graded Crushed Stone (G2) Grading
Wet Grading Curve Dry Grading Curve
Figure 5.3 Stockpile of 100% RAP crushed hornfels material on N7 & Laboratory grading curves

48
The wet grading curve illustrated in Figure 5.3 improved particles passing through 0.075 mm sieve by almost 7%. The wet grading curve satisfies TG2 grading envelopes for particles passing through 0.075 mm fraction. As mentioned in the literature review, particularly for BSM-foam, the filler content is responsible for most particle coating by foam binder in the pugmill mixer. Based on laboratory grading, filler content from wet grading analysis showed fractions well above 10%, a prerequisite for generating good quality foam binder mixing properties. The dry grading curve is equally important as it shows the number of fines that are accessible to foam bitumen during the mixing process. In closure, for the purpose of producing good laboratory mixes, controlled laboratory grading reflective of grading envelopes in Figure 5.3 will have to be implemented and closely monitored to help maintain consistent field grading. • Maximum Dry Density Properties Field investigations by Soil Lab from Table 5.1 reported average Mod. AASHTO MDD values of 2114-2170 kg/m3 corresponding to average field OMC values of 5-7.2%. In terms of laboratory environment, mould sizes of 150x100 mm [1.5D: H] were used for analysis of Mod. AASHTO MDD using proctor compaction illustrated in Figure 5.4 below.
Figure 5.4 Standard Proctor compaction machine at Stellenbosch University

49
Laboratory MDD investigation utilizing standard Mod. Proctor compaction provided the following illustrated MDD curve:
1950
2000
2050
2100
2150
2200
0 1 2 3 4 5 6 7 8 9
Dry Density (kg/m3)
Moisture Content (%)
N7 G2 Graded Crushed Stone Maximum Dry Density Curve
MDD 2138 kg/m3
OMC 5.12%
Figure 5.5 N7 Graded crushed rock maximum dry density curve
Laboratory analysis yielded MDD value of 2138 kg/m3 with corresponding OMC value of 5.12%. Results produced by Stellenbosch University proved to be in the same order of magnitude compared to field results by Soil Lab, emphasizing the close correlation maintained between laboratory and field environments. In terms of production of laboratory specimens, material properties obtained from MDD curve and wet grading envelopes will be implemented. Close correlation between laboratory and field conditions will be strictly maintained in the endeavour to yield comparable trends. 5.4 Moisture Sampling and Trends Moisture sampling took place during construction and traffic service periods. Design specifications on the project required that recycled layer be exposed to in situ climate conditions with no traffic effects prior to paving of HMA (wearing course). In the field, this process varied between 7 and 14 days maximum. Exposure of CIPR layer to in situ climatic conditions led to monitoring of field moisture during the first 7 to 14 days of exposure. Once the recycled layer was compacted, water was sprayed occasionally over the top surface to aid the cement hydration process. This technique was applied to stiffen the base and to create a smooth top surface layer for primer application. Following this process, the recycled layer was subject to field curing conditions with the objective to achieve 0.5 x %OMC at upper section of recycled layer (100 mm depth from top of surface), a prerequisite for priming the surface for application of HMA layer.

50
In situ moisture samples were retrieved by the breaking of recycled layer with the aid of a jack hammer. Holes up to 300 mm deep were drilled with the average depth being approximately 230 mm. Based on site location of testing stations, up to 12 points (B1-B6) along the road were investigated for moisture and resilient modulus analysis. The identified points were located at 20m stake values (chainages) per group of points over 1.2 km stretch of rehabilitated road. During daily in situ moisture monitoring, specific points indicating moisture contents at a particular location served as reference points for future monitoring. This meant that assessment of moisture measurements during future visits were performed within a localized radius of about 500 mm. The following Figure shows how moisture samples were collected during construction phase of road rehabilitation.
Figure 5.6 Collection of moisture samples on site during and after construction
In terms of time invested for moisture analysis, sampling of recycled layer continued well into traffic service environment with total analysis period of ±8 months. For purposes of establishing comparable trends, crushed rock moisture trend during the curing phase was expressed in terms of %OMC relative to environmental curing duration (days). In addition, all field moisture sampling and analysis are based on real oven dried samples, with %OMC being expressed as the change in moisture content. The following equations explain this:
wet dry
dry
Mass MassMass
Mass
−∆ = Equation 7
% 100Mass
OMCOMC
∆ = ×
Equation 8

51
45%
48%
50%
53%
55%
58%
60%
63%
65%
68%
70%
73%
75%
78%
80%
83%
85%
0 10 20 30 40 50 60 70 80 90 100 110 120 130 140 150 160 170 180 190 200 210 220 230 240
% OMC
Time (days)
BSM-emulsion[cement]
Figure 5.7 N7 Graded crushed rock %OMC curve over ±8 months of field curing
The observed gradual decrease in field moisture contents over time is mainly attributed to curing of rehabilitated layer. In addition, %OMC declined from ±75% during construction to ±50% after ±8 months of traffic service environment. It is further advised that moisture sampling took place at average depths of 230 mm within the rehabilitated layer. However, at 100 mm depth of the recycled layer, moisture contents varied from ±50% OMC during application of HMA to ±45% within ±8 months of traffic service environment [determined by field samples at these depths]. Following illustrated trend line in Figure 5.7, EMC appears achievable within 2 - 5 years of field curing. In conclusion, evidently most field moisture change occurs within 6 months to 1 year from time of construction. As a result, EMC should stabilize anywhere between 45-40% OMC within a period of 2 - 5 years. This purely an estimate based on data projection in Figure 5.7. 5.5 Field Temperature and Humidity Conditions In order to gain holistic understanding of field curing mechanisms, it was necessary to monitor temperature and relative humidity conditions in the recycled layer. Obtaining field data on temperature and relative humidity conditions helps guide the formulation of laboratory curing environments that are conducive to field curing simulation. Due to drainage channels in pavement structures, it was necessary to capture 2/3 depth of recycled layer on the shoulder section as validated by the presence of higher moistures levels at these locations. Capturing of 1/3 depth of recycled layer closer to road centreline was considered adequate. Distribution of temperature and relative humidity conditions at these locations was critical to unlocking understanding of field curing mechanisms at different positions within recycled

52
pavements. Illustrated drawing section below depicts typical positions maintained for button installations in recycled pavements.
Figure 5.8 N7 centreline temperature & relative humidity button location within recycled layer
Locations of temperature and relative humidity buttons were mainly governed by logistic challenges on the road. Due to safety and coordination issues, it was decided that the investigation of recycled pavement be performed closer to the N7 weigh bridge centre. A plan layout of investigated points along the recycled pavement is shown below in Figure 5.9. The designated OL means Outer Lane (closer to shoulder line) and IL means Inner Lane (closer to centreline). The red points represent temperature and humidity buttons whilst grey points represent additional points of investigations. In total, both moisture and resilient modulus analysis were performed on all 12 points during construction and traffic service period for the duration of ±8 months.
Figure 5.9 N7 schematic view of investigated points along the rehabilitated road
∞ Subgrade
H = 250 mm Emulsion Stabilized Base
40 mm HMA
20 mm UTFC
1/3 H
Temperature & Relative Humidity I-Button
B1 (IL)
B1
B2 (IL)
B2 (OL)
B3 (IL)
B3 (OL)
B4 (IL)
B4 (OL)
B5 (IL)
B5 (OL)
B6 (IL)
B6 (OL)
20 m
1.2 km
N7 Weigh Bridge Centre
North Bound Direction: Towards Malmesbury
Centreline

53
Installation of temperature and humidity buttons involved drilling of 10 mm diameter holes into recycled pavement. Buttons were backfilled with both dry soft sand and warm mix asphalt to enhance sealing of buttons against surface runoff. The instant field data measurements were concluded, buttons were extracted through coring utilizing 100 mm diameter cores. Figure 5.10 shown below illustrates button installations and extraction processes.
Figure 5.10 Installation of i-buttons on N7 highway for temperature & relative humidity measurements
All button installations were performed after construction of the UTFC layer to help maintain proper markings on the road surface. Centreline depths were maintained at 85 mm (1/3 H) into the recycled layer. Holes of 85 mm plus 40 mm of HMA and 20 mm of UTFC were drilled. This led to holes of up to 145 mm being drilled at centreline positions. Shoulder line holes were maintained at 230 mm (2/3 H). Both field temperature and relative humidity centreline data is presented in Figure 5.11. All data correlates to ±5 months of field curing.
Figure 5.11 N7 BSM-emulsion centreline temperature and relative humidity data
Equally, shoulder line temperature and humidity data have been included to compare centre-line and shoulder data. The following graphs illustrate shoulder data:

54
Figure 5.12 N7 BSM-emulsion shoulder line temperature and relative humidity data
Observations from field data have confirmed the rise in BSM-emulsion temperatures as seasons approach summer temperatures. The maximum recorded BSM-emulsion temperature was in the vicinity of 38◦C. It is further noted that temperatures of up to 40ºC and perhaps even higher temperatures may be evident in the field depending on typical summer temperatures. The reasoning behind the assumption regarding rising temperatures in the field is based on the fact that the maximum temperature during the month of November was 38˚C. In the Western Cape region, the hottest summer months are January and February respectively. Consequently, it is believed that BSM-emulsion temperatures will rise beyond the observed November temperature of 38˚C during the summer months. As a result, the observed BSM-emulsion temperatures suggest that it would be realistic and absolutely necessary to cure laboratory samples at similar observed temperatures for purposes of accelerating laboratory curing. In addition, temperature distributions at different depths and locations resemble similar trend line behaviour. On average, the rises and fall in daily temperatures between shoulder and centre-line data reveal that both locations experience similar temperatures. As part of the research process, it was desirable to be able to witness relative humidity conditions that showed a decrease in field trends corresponding to decreasing field moisture contents. Results in Figure 5.11 show relative humidity conditions that are well above 100% despite curing of recycled layer. Relative humidity readings above 100% are scientifically meaningless. In other words, theoretically such conditions cannot occur. Consequently, field humidity conditions have proven difficult regarding relating field moisture content to humidity conditions and also for the purpose of reconciling observed trends to moisture trends. Trial tests in the laboratory presented difficulty in reconciling humidity conditions to the moisture content of samples. The observed varying trends of field humidity conditions suggest that

55
temperature curing provides a more effective measure for modelling moisture change than controlled humidity conditions. Relative humidity conditions are a real part of the curing environment mechanisms necessary for curing simulation, but are not necessarily effective for accelerated moisture extraction. In-service, high relative humidity conditions are readily achieved in the layer even at relatively low moisture contents. As a result, relative humidity as recorded by buttons proved to be rather a measure of localized humidity and not necessarily a reliable measure of moisture content. Moisture content indicates with the compositional properties of the mix in terms of amount of water by mass, whilst relative humidity in a layer is little more than a reflection of moisture presence. 5.6 Field Compaction and Resilient Modulus Behaviour Field compaction is achievable using high energy steel-drum rollers. The working action of steel rollers coupled with high energy vibrations has significant impact on field resilient modulus trends. Depending on the surface contact-area, the kneading action of steel rollers influences shallow depth resilient modulus and particle orientation whilst bearing weight of compactor coupled with high amplitude vibrations impacts on deeper horizons of the recycled layer. The following Figure illustrates both caterpillar compactor and PSPA device used to monitor in situ resilient modulus.
Figure 5.13 Field compaction using high energy steel rollers and the relative impact on resilient modulus
In terms of acquired field resilient modulus data, although all 12 investigation points were monitored for in situ resilient modulus and moisture trends, position B2 (IL) in this instance was particularly chosen to illustrate the manner in which field data was processed and managed. The schematic view of resilient modulus patterns shown below demonstrate analysis of three measurements made by PSPA device on centreline position B2 (IL). The illustrated measurements were made hours after field compaction was achieved by high energy steel drum rollers. As elaborated previously, the kneading actions of rollers seem to impact the first 50 to 80 mm of recycled layer. The steel drum roller kneading effect and additional high frequency vibrations seem to generate greater layer resilient modulus at the top third of the recycled layer. In addition, there seems to be an interface region within the recycled layer where trends shift back to stiffer regions with increasing depth as witnessed from 150 mm onwards.

56
50
75
100
125
150
175
200
225
250
700 750 800 850 900 950 1000 1050 1100 1150 1200 1250 1300 1350 1400 1450 1500CIPR Layer Thickness: Depth (mm)
Resilient Modulus (MPa)
BSM-Emulsion Centerline Stiffness Analysis
Mr Measurement 1 Mr Measurement 2 Mr Measurement 3
Figure 5.14 N7 crushed rock day 0 resilient modulus behaviour after compaction on centreline position B2 (IL).
Resilient modulus patterns after compaction show that in situ resilient modulus is not constant within the recycled layer. The actions of steel drum rollers seem to have immediate impact on trends generated in resilient modulus. In addition, it was considered essential to the understanding of the effects of curing to monitor resilient modulus patterns with time during construction and the in-service traffic environments. Each resilient modulus distribution line represents a single measurement generated by the PSPA device. An average value was automatically calculated from the resilient modulus distribution of each measurement. The measured results for position B2 (IL) have been summaries in the following Table:
Table 5.3 Summary of centreline resilient modulus over ±8 months of curing: Position B2 (IL)
CENTER LINE RESILIENT MODULUS: POSITION B2 (IL)
Coverage of BSM layer
Longitudinal Direction Mr (MPa)
Date Top Resilient modulus: Mr (100-260mm Depth)
DAY Mr 1 Mr 2 Mr 3 Average Mr Std Dev COV (%)
11-Apr-2007 0 1079 1058 998 1045 42.254 4.04%
12-Apr-2007 1 995 1295 1175 1155 151.238 13.10%
Unsurfaced 14-Apr-2007 3 1285 1330 1503 1373 115.281 8.40%
16-Apr-2007 5 1367 1617 1562 1515 131.470 8.68%
18-Apr-2007 7 1632 1591 1566 1596 33.634 2.11%
20-Apr-2007 9 1600 1650 1550 1600 50.000 3.13%
Surfaced 5-Jul-2007 85 1596 2046 2416 2019 410.819 20.35%
15-Nov-2007 219 3243 2416 3053 2904 432.912 14.91%

57
All three PSPA measurements were made on Day 0 of compacted material at location B2 (IL). The three measurements have been averaged to yield Day 0 resilient modulus on location B2 (IL) provided that the coefficient of variation between all three measurements is less than 20%. Readings with coefficient of variation of more than 20% represent variability of measurements not supportive of localized trends. The underlined resilient modulus analysis process continued for the entire field monitoring process at all investigation stations. All 12 stations were monitored during the ±8 months of field analysis. Both moisture and resilient modulus trends were monitored on each occasion as per objectives outlined in Chapter 1 of thesis document. In order to capture field resilient modulus patterns, it was necessary to sketch all resilient modulus distribution curves on a single graph for the purpose of correlating field curing to resilient modulus behaviour. Curing of recycled layer involves release of moisture with time. The curing process hardens the recycled material, as witnessed from preliminary tests with tangent modulus increasing with decrease in moisture contents. The following Figures demonstrate average centreline resilient modulus behaviour of up to ±8 months of field data. All resilient modulus trends have been plotted against depth of recycled layer along centreline stations.

58
100
110
120
130
140
150
160
170
180
190
200
210
220
230
240
250
260
600 800 1000 1200 1400 1600 1800 2000 2200 2400 2600 2800 3000 3200 3400 3600 3800
Recycled Depth (mm)
Mr (MPa)
BSM-emulsion Mr Analysis versus Depth over 7 months of Field Cure: Position B1-B3
DAY 0 DAY 7DAY 5DAY 1 DAY 3 DAY 85 DAY 219
POSITION B1-B3
Figure 5.15 N7 BSM-emulsion centreline resilient modulus development [Position B1-B3]

59
100
110
120
130
140
150
160
170
180
190
200
210
220
230
240
250
260
400 600 800 1000 1200 1400 1600 1800 2000 2200 2400 2600 2800 3000 3200 3400 3600 3800
Recycled Depth (mm)
Mr (MPa)
BSM-emulsion Mr Analysis versus Depth over 7 months of Field Cure: Position B4-B6
DAY 0 DAY 3DAY 1 DAY 5 DAY 7 DAY 219DAY 85
POSITION B4-B6
Figure 5.16 N7 BSM-Emulsion centreline resilient modulus development [Position B4-B6]

60
100
110
120
130
140
150
160
170
180
190
200
210
220
230
240
250
260
400 600 800 1000 1200 1400 1600 1800 2000 2200 2400 2600 2800 3000 3200 3400 3600 3800
Recycled Depth (mm)
Mr (MPa)
BSM-emulsion Mr Analysis versus Depth over 7 months of Field Cure: Position B4-B6
DAY 0 DAY 1 DAY 3 DAY 7DAY 5 DAY 85 DAY 219
POSITION B1-B6
Figure 5.17 N7 BSM-Emulsion centreline resilient modulus development [Position B1-B6]

61
Based on field monitoring, a profound trend in resilient modulus development with time is noted. The development in resilient modulus with time is mainly attributed to field curing. The inclusion of cement in BSM-emulsion layer seems to contribute to accelerated layer stiffening. The variable Day 0 trends evolve into uniform resilient modulus distributions over time. The resilient modulus profiles become more linear in terms of distribution within depth of recycled BSM-emulsion layer. The upper portions of BSM-emulsion layer become stiffer than deeper portions. The rapid stiffening at shallow depths is manly attributed to loss of moisture at much faster rate near the surface due to higher surface temperatures. In terms of observed BSM-emulsion Mr trends, the important key finding suggests that the influence of moisture distribution begins to dominate the Mr effects above the influence of density distribution. Observations of the resilient modulus patterns reveal that the loss of moisture due to curing of BSM-emulsion attributes to changes in the variable stiffness patterns from the initial stages into linear patterns over time. In other words, the non uniform density profile of compacted BSM-emulsion initially produced stiffness patterns resembling variability with depth. The variable resilient modulus patterns seem to assume more linear relationships due to the effects of moisture distributions with. Subsequently with time, the effects of moisture distributions on resilient modulus are more dominant than the density distributions. In addition, prior to application of HMA layer, shallow depth moisture (100 mm) in the recycled layer reached 50% OMC on average compared to 65% OMC at deeper sections (230 mm). Consequently, it takes more time for the bottom section of recycled layer to lose moisture, leading to lower resilient modulus values as influenced by slightly higher moisture contents at these regions. Summary of all points along the road during construction and in service traffic environments has been presented. In terms of presented data, %OMC and corresponding in situ resilient modulus values have been summarised. In order to generate more sensible results, it was necessary to group and isolate locations B1-B3 and B4-B6. In terms of terrain characteristics, locations B4-B6 [higher road level stations] were located 1.2 km further uphill from B1-B3 stations [lower road level stations]. The two isolated regions were identified as the need to address terrain characteristic influences on in situ resilient modulus became apparent. The anticipated gain in strength of BSM-emulsion relative to curing had to be thoroughly understood in terms of whether the in situ resilient modulus trends generated were mainly attributed to layer curing or terrain characteristics or the combination of both. From assessed results, it became clear that both terrain characteristics and layer curing have influences on the types of resilient modulus trends generated. The observed trends were validated by variability in resilient modulus between the two isolated regions. In part, in situ resilient modulus trends at stations B4-B6 [higher road level region] proved to be much higher in magnitude as opposed to B1-B3 stations [lower road level region]. On average, the B-B3 stations were generally 10% lower in magnitude when compared to B4-B6 stations. Although actual measurements were not made, from vertical forces dynamics point of view, roller compactors on inclined surfaces exert much higher compaction forces due to vertical and additional perpendicular forces caused by the angle of incline as opposed to flat horizontal surfaces where only vertical forces are present. It may be that the anticipated higher compactions obtained at stations B4-B6 were attributed to additional perpendicular compaction forces, and thus resulting in higher density profiles at these regions, leading to much higher resilient modulus values. Another attributing factor to consider would be the possibility of much stiffer sub grade bedrock

62
characteristics at stations B4-B6 linked to years of compaction due to traffic. The following Table illustrates the differences in observed resilient modulus values between the two identified regions:
Table 5.4 Summary of centreline PSPA resilient modulus - All positions [B1-B6]
DAY %OMC B1 (MPa) B2 (MPa) B3 (MPa) B1-B3 Avg (MPa) Std Dev COV (%)
0 75% 830 963 900 898 66 7.39%
1 70% 975 980 958 971 11 1.17%
3 64% 938 1050 983 990 57 5.71%
5 69% 1133 1025 1200 1119 88 7.89%
7 63% 1163 1038 1120 1107 64 5.74%
9 67% 1283 1250 1100 1211 98 8.06%
86 63% 1617 1692 2192 1833 313 17.05%
219 55% 2900 3200 2700 2933 252 8.58%
DAY %OMC B4 (MPa) B5 (MPa) B6 (MPa) B4-B6 Avg (MPa) Std Dev COV (%)
0 72% 877 622 697 732 131 17.91%
1 65% 1033 850 933 939 92 9.78%
3 60% 983 940 833 919 77 8.40%
5 66% 975 1113 1117 1068 81 7.55%
7 62% 1070 1200 1183 1151 71 6.15%
9 64% 1225 1150 1300 1225 75 6.12%
86 60% 2321 2300 1940 2187 214 9.80%
219 50% 3630 2933 3067 3210 370 11.52%
PSPA resilient modulus analysis show almost identical but slightly higher resilient modulus values at locations B4-B6 as elaborated previously. As elaborated previously, notice that on average stations B1-B3 were generally 10% lower in resilient modulus magnitude when compare to stations B4-B6. 5.7 Resilient Modulus Modelling and Corresponding Field Trends Due to the scatter of measured field resilient modulus data, a modelling technique was employed to help sketch best fit trend lines. The following model has been widely accepted to describe the stress dependent behaviour of a granular material amongst others for its simplicity, Ebels (2008).
2
1
k
r curingM k T= Equation 9
Where, Mr : Predicted resilient modulus [MPa] Tcuring : Time linked to curing on the applicable x-axis scale K1, k2 : Model coefficients [material dependent] The upcoming sections illustrate transformation of raw data using the adopted stress dependent behaviour modelling for granular materials. In addition, the transformed data utilizing the adopted model has been summarized in tabular format located in Appendix C section of the thesis. The following graph illustrates in situ resilient modulus curve during the ±8 months of field curing:
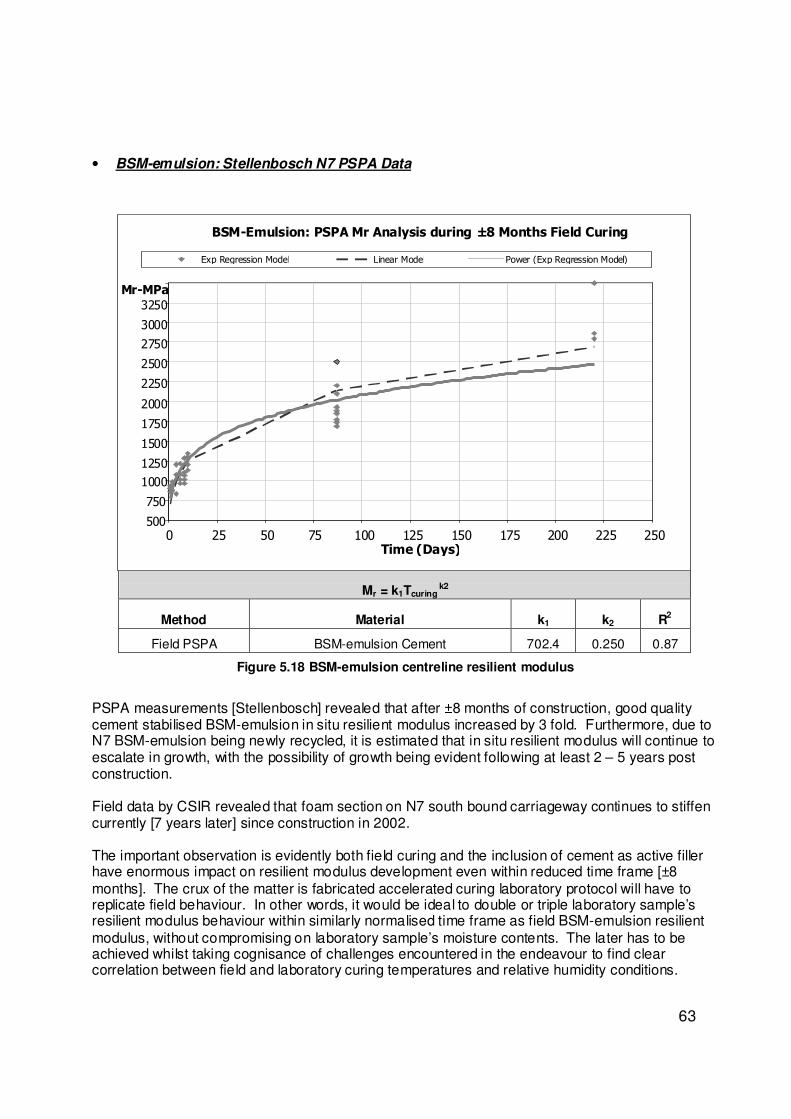
63
• BSM-emulsion: Stellenbosch N7 PSPA Data
Figure 5.18 BSM-emulsion centreline resilient modulus
PSPA measurements [Stellenbosch] revealed that after ±8 months of construction, good quality cement stabilised BSM-emulsion in situ resilient modulus increased by 3 fold. Furthermore, due to N7 BSM-emulsion being newly recycled, it is estimated that in situ resilient modulus will continue to escalate in growth, with the possibility of growth being evident following at least 2 – 5 years post construction. Field data by CSIR revealed that foam section on N7 south bound carriageway continues to stiffen currently [7 years later] since construction in 2002. The important observation is evidently both field curing and the inclusion of cement as active filler have enormous impact on resilient modulus development even within reduced time frame [±8 months]. The crux of the matter is fabricated accelerated curing laboratory protocol will have to replicate field behaviour. In other words, it would be ideal to double or triple laboratory sample’s resilient modulus behaviour within similarly normalised time frame as field BSM-emulsion resilient modulus, without compromising on laboratory sample’s moisture contents. The later has to be achieved whilst taking cognisance of challenges encountered in the endeavour to find clear correlation between field and laboratory curing temperatures and relative humidity conditions.
Mr = k1Tcuring k2
Method Material k1 k2 R2
Field PSPA BSM-emulsion Cement 702.4 0.250 0.87
BSM-Emulsion: PSPA Mr Analysis during ±8 Months Field Curing
500
750
1000
1250
1500
1750
2000
2250
2500
2750
3000
3250
0 25 50 75 100 125 150 175 200 225 250Time (Days)
Mr-MPa
Exp Regression Model Linear Model Power (Exp Regression Model)

64
• BSM-foam: CSIR N7 LTPP PSPA Data The following Figure illustrates foamed bitumen in situ resilient modulus behaviour since 2002:
5000
5500
6000
6500
7000
7500
8000
8500
9000
0.0 2.0 4.0 6.0 8.0 10.0 12.0 14.0 16.0 18.0 20.0 22.0 24.0
Mr (MPa)
Time (Months)
N7 BSM-foam Section LTPP
Figure 5.19 BSM-Foam: PSPA resilient modulus analysis (CISR, 2008)
PSPA measurements [CSIR] revealed that post 4 years of construction, good quality cement stabilised FTB in situ resilient modulus increased from 5500 MPa to 8200 MPa for Long Term Pavement Performance (LTPP) period of 2 years. To date, the road has been in service for 7 years. In conclusion, in situ resilient modulus trends and corresponding moisture contents as gathered by Stellenbosch University and CSIR will serve as benchmark to develop accelerated curing laboratory protocol for bitumen emulsion and foamed bitumen mixes. 5.8 Discussions The following conclusions were realised following in situ resilient modulus and moisture trends: • Temperature is a more effective curing variable for extracting moisture from a BSM than setting
relative humidity conditions. In a confined environment such as a layer, relative humidity is not an accurate variable to control moisture content within a layer as relative humidity values tend to be rather high; however, relative humidity provides an indication of localized moisture conditions. In a laboratory, the combination of relative humidity conditions and set curing
Mr = k1Tcuring k2
Method Material k1 k2 R2
Field PSPA BSM-foam Cement 6504.7 0.075 0.63

65
temperatures is more representative of field conditions than curing at set temperatures with no consideration of humidity conditions.
• Field resilient modulus increases with time relative to loss in moisture contents due to field
curing process. The loss in moisture contents appears to be dominated by temperature in the recycled layer.
• Field compaction has both kneading action and impact effects on a BSM layer. The kneading action of steel drum rollers in conjunction with different frequency settings, initially results in variability in the resilient modulus of the recycled layer with depth. The resilient modulus distributions with depth change with time due to curing of recycled layer and traffic loading impact, resulting in more uniform relationships.
• Amongst other factors, the inclusion of cement seems to increase field resilient modulus of
good quality BSM-emulsion up to three times the original value within ±8 months of field curing. In addition, both presence of hydration process of cement and additional moisture loss through upward evaporation near the surface of recycled layer could occur at faster rates due to higher surface temperatures, thus resulting in greater stiffening in the top portion of recycled layer.
In terms of speculation, in situ observations have added ample knowledge regarding steering of subject matter. For instance, prior to field investigations, the aspect of field roller compaction and its effects on generated resilient modulus trends was never identified as priority. Considerations of terrain characteristics and mechanisms of compaction and their overall impact on the required moisture contents for maximum dry densities were similarly undermined. Coincidently, maximum dry density compaction was achieved at slightly lower moisture contents at location B4-B6 [higher road level stations] as opposed to locations B1-B3 [lower road level stations]. Based on reasonable assumption, temperature as function of height may have had slightly more surface curing effects on higher road level than slightly lower road level locations. Accordingly, due to higher surface temperature effects, maximum dry density compaction at location B4-B6 [higher road level stations] was achievable at slightly lower moistures contents as a result of presence of higher forces of compactions coupled with high energy vibrations, thus resulting in much greater compaction densities at these locations. The above comments are merely speculation as presented research lacks in situ density profiles of compacted BSM-emulsion. It is further elaborated that the absence of in situ densities data presents difficulty in qualifying abovementioned comments. Consequently, the type of laboratory compaction protocol to be implemented will be critical to research as both resilient and moisture trends will have to replicate field behaviour, bearing in mind the underlined field terrain characteristic influences on resilient modulus trends. To rap up the argument, achievement of comparable laboratory and in situ behaviour [trends] will be paramount to reconciling both environments.

66
6 LABORATORY INVESTIGATION AND CURING PROTOCOL IMPROVEMENTS
Laboratory investigation was predominantly established to replicate in situ moisture and resilient modulus trends. Laboratory investigation process focused on assessing evolution of material resilient modulus through prolonging accelerated curing of specimens beyond field curing equivalent of 5 years [%OMC<30%]. The main objective for the adopted approach was aimed at establishing equilibrium regions for sample’s moisture and resilient modulus trends, where observed trends with time would reach a plateau. Through establishment of equilibrium conditions for moisture and resilient modulus trends, the effects of different curing temperatures and their impact on material performance can be studied. As per outlined objectives, laboratory curing and conditioning of specimens involved implementation of set temperatures. In order to thoroughly understand temperature curing, it was necessary to regulate external relative humidity conditions. For this reason, specimens were cured in an unsealed state for the duration of the analysis period. Understanding the influence of temperature during curing on moisture and resilient modulus trends proved critical to the research. Initially, emphasis was devoted to understanding factors which influence curing of BSMs and the associated stiffening of cured samples. In other words, at what stage does the temperature of curing prove redundant to causing continued growth concerning material’s resilient modulus? Longer laboratory curing times coupled with high curing temperatures present possibility of generating significant harmful effects concerning alterations of BSMs properties. In situ curing will always leave presence of residual moisture in a layer. In other words, all BSMs will retain some level of field moisture content irrespective of temperature effects and curing time implications. Consequently, the investigation process was aimed at exploiting the given notions: At what stage must laboratory curing be terminated for any given curing conditions? Which reliable indicators must be observed to initiate the given decision? And finally, how will laboratory curing be measured regarding replication of field behaviour? 6.1 Laboratory Investigation Phase: Solution Flowchart The investigation phase involved linking of literature and field behaviour observations by effectively replicating known trends in the laboratory. Information extracted between different phases was primarily guided by flowcharts for purposes of assessing critical findings. The following solution flowchart illustrates how information flow between different phases was managed:

67
Figure 6.1 Laboratory Investigation & Curing Protocol Improvements Solution Flowchart
LABORATORY INVESTIGATION & IMPROVEMENT
• Objective: Address key deliverables linked to literature and project scope
MIX DESIGN LINKED TO FIELD PROPERTIES
• Binder type considerations [Bitumen Emulsion & Foamed Bitumen] • Active filler types [Cement and Lime] • Material: Hornfels crushed rock [RAP]
LABORATORY QUALITY CONTROL
• Mixing techniques [Emulsion – pugmill mixer: Foamed – WB10] • Compaction procedure – vibratory [Linked to field compaction] • Controlled grading [Linked to RAP grading envelopes]
CURING ENVIRONMENT
• Draft ovens • Curing temperatures [Linked to field temperatures] • Selection of relative humidity conditions [Linked to
construction sequence: Unsealed and sealed BSM-emulsion
LABORATORY TESTING PROTOCOL
• Determination of test parameters [Monotonic testing - MTS] • Evaluation of resilient modulus [Short dynamic tests – MTS]
EVALUATION OF LONG TERM CURING LABORATORY PROTOCOL • Evaluation of laboratory resilient modulus and moisture trends
DERIVATION OF PARAMETERS FOR DEVELOPMENT OF DRAFT ACCELERATED CURING LABORATORY PROTOCOL
• Address key findings linked to laboratory long term resilient modulus and moisture trends and derive parameters for development of draft curing protocol

68
6.2 Laboratory Investigation and Curing Protocol Improvements: Test Matrix Diagram Findings from literature revealed specifics to be cognisant of governing laboratory curing of BSMs. The following areas of concern pertaining to laboratory curing of BSMs were addressed: • Different binder types with and without active filler • Variable curing temperatures and relative humidity considerations
• Non uniform curing environments [draft versus normal laboratory ovens] • Grading envelope considerations • Vibratory compaction considerations • Mixing temperature influences on binder dispersion within the mix In addition to the above, the following quality control mechanisms were implemented: • Aggregate handling during mixing
• Moisture handling post compaction • Testing temperature regulations during resilient modulus analysis • Management of aggregate ravelling during the testing phases
In terms of laboratory curing temperatures, the following field temperatures were used as guide for selection of representative temperatures to be implemented during laboratory accelerated curing:
Table 6.1 Peak BSM-emulsion Centreline Temperature Data- N7 Northbound Carriageway [2007]
Peak BSM-emulsion Temperature Data: Temperature and Humidity Buttons
Month Temperature
June 17 °C
July 23 °C
August 24 °C
September 29 °C
October 38 °C
November 35 °C
Following findings from literature, preliminary curing investigation phase and field data observations, it was decided that for purposes of laboratory investigations, two laboratory curing temperatures be selected for accelerated moisture extractions. For this purpose, in situ BSM-emulsion temperatures during September, October and November months seemed applicable. Following field temperature data, reservations were made for selection of 30 ºC and 40 ºC temperatures as representative field temperatures to be implemented during accelerated laboratory curing. In addition, the motive of curing investigation was primarily focused on accelerating laboratory curing. Accordingly, it was decided that typical ambient temperatures of 25 ºC be ignored as the process would prolong curing of BSMs. Tests results from preliminary section of research confirmed emulsion mixes took on average 7 days to reach 50% OMC. Consequently, due to requirements by the industry i.e. minimizing the time needed to carry out laboratory protocols, it was decided that implementation of higher curing temperatures, but remaining below Ring and Ball Softening Point values, would yield shorter curing durations.

69
In terms of active filler influences, lime and cement were considered for BSM-emulsion and BSM-foam mixes. Lime and cement as active fillers promote moisture consumption and migration in BSMs. Both active filler types are ideal for implementation due to their chemical change characteristics within short space of time during the mixing process. Considering diverse key variables to be accommodated during investigation phase, laboratory tests matrix was primarily established to address the noted broad research scope. The following Figure illustrates adopted test matrix for laboratory curing investigation and improvement process:
Figure 6.2 Laboratory tests matrix diagram for investigations and curing protocol improvements
Following laboratory tests matrix, the following laboratory testing parameters were implemented: [Note that 3 laboratory specimens were implemented per allocated variable for assistance in generating reliability of results]
30˚C
Emulsion
40˚C
Lime Cem
No Active Filler
Binder Type
Active Filler
N7 Crushed Hornfels Rock
Curing Temperature 40˚C
Lime
Foam
30˚C
No Active Filler
Cem

70
Table 6.2 Summary of laboratory tests matrix parameters for curing investigation and improvement
Material N7 Crushed Hornfels Material
Binder Type
Binder Content
Draft Oven Temperature
Humidity Conditions
Active Filler [1% Content]
Moisture & Resilient ModulusAssessment Intervals
No. of Briquettes
Emulsion 2.0% 30 ◦C Lime 3
Emulsion 2.0% 30 ◦C Unsealed Cement Day 0 Day 1 Day 2 Day 3 Day 7 3
Emulsion 2.0% 30 ◦C No Active Filler 3
Emulsion 2.0% 40 ◦C Lime 3
Emulsion 2.0% 40 ◦C Unsealed Cement Day 0 Day 1 Day 2 Day 3 Day 7 3
Emulsion 2.0% 40 ◦C No Active Filler 3
Foam 2.0% 30 ◦C Lime 3
Foam 2.0% 30 ◦C Unsealed Cement Day 0 Day 1 Day 2 Day 3 Day 7 3
Foam 2.0% 30 ◦C No Active Filler 3
Foam 2.0% 40 ◦C Lime 3
Foam 2.0% 40 ◦C Unsealed Cement Day 0 Day 1 Day 2 Day 3 Day 7 3
Foam 2.0% 40 ◦C No Active Filler 3
Total 18
6.3 Controlled Grading BSMs grading properties is known to influence majority of tangible variables linked to material performance. Production of laboratory specimens without target grading considerations would prove futile. In addition, production of laboratory specimens without in situ target grading considerations would result in unrepresentative field environment characteristics. In order to acquire reasonable trends during laboratory experimentation, it would be ideal to manage the variability of results. Variability in resilient modulus values can be greatly reduced by maintaining controlled grading during mixing. Controlled grading will assist in generating repeatability of results and therefore increase reliability in terms of field characteristics. The following Table illustrates wet grading sieve analysis of N7 Crushed Hornfels Rock [RAP] material:
Table 6.3 Summary of N7 crushed hornfels rock wet grading analysis
N7 CRUSHED HORNFELS ROCK [RAP]: WET GRADING ANALYSIS
Sieve Size (mm) % Passing through Sieve 19 100.0%
13.2 93.1%
9.5 80.8% 6.7 64.3%
4.75 52.5%
2.36 36.5% 1.18 25.9% 0.6 19.9%
0.3 15.7% 0.15 12.30% 0.075 10.90%

71
In the laboratory, controlled grading of produced specimens was achieved by implementing four sieving fractions for mixing purposes. The following target grading curve of RAP material served as bench mark for production of laboratory mixes:
0%
10%
20%
30%
40%
50%
60%
70%
80%
90%
100%
0.01 0.10 1.00 10.00
% -Passing
Particle Sieze (mm)
N7 Graded Crushed Stone - [G2 Material Classification]
Wet Grading Curve
Figure 6.3 Target grading curve of N7 crushed Hornfels rock material for laboratory mixes
Quality laboratory grading control was implemented using four sieving fractions as summarized in the following Table:
Table 6.4 Summary of grading fractions used to maintain target laboratory grading
Total mass per 150 x 250 mm [D:1.7H] briquette (g) 12000
Grading Retained % Mass Fractions
retained on sieve Mass Fractions per Briquette (g)
13.2 mm sieve 6.9% 828
4.75 mm sieve 40.6% 4874
2.36 mm sieve 16.0% 1920
Pen 36.5% 4378
Total 100.0% 12000
All mass fractions per individual sieve size as illustrated above were derived from target grading envelope. Initially, laboratory mixing of specimens on typical 150x250 mm moulds required not more than 12 kg of dry aggregate mass. Accordingly, each specimen’s individual grading fractions were based on 12 kg of dry aggregate mass. For this reason, each individual grading fraction per briquette was assembled and weighed according to stipulated mass fraction for the given sieve size. Implementation of controlled grading technique ensured consistency in mixing properties of produced briquettes. This in turn assisted in generating repeatability of results per given laboratory variable.
72
6.4 Emulsion and Foam Binder Mixing Properties Laboratory BSM binder mixing properties phase focused on quality production of briquettes. In total, 18 briquettes were treated with emulsified bitumen whilst the remaining 18 briquettes were treated with foamed bitumen binder. In summary, bitumen emulsion specimens were on average mixed at %OMC+1 to compensate for lost moisture during the breaking of emulsion process. In other words, the average mixing moisture for BSM-emulsion was calculated as [OMC-emulsion content] + 1%. Considering that OMC was calculated as 5.1% with emulsion content of 3.3%, then the equation [OMC-emulsion content] + 1% translates into [5.1%-3.3%] + 1%. This translates into 2.8% of mixing water to be added to dry aggregates. Bearing in mind that emulsion has 40% residual water by composition [40%x3.3% or 1.32%], the total final moisture content will be the addition of 2.8% and 1.32%. Consequently, the total moisture present at the mixing stage translates into 4.12% or 80% OMC. This makes sense since from the time of mixing to compaction, oven dried moisture samples for BSM-emulsion showed that the average moisture content after compaction was in the vicinity of 73.6% OMC. This confirms that some level of mixing moisture is lost from the time of mixing and after compaction. Similarly, BSM-foam specimens were similarly compacted at 80% OMC and yielded final moisture contents of 69.9% after compaction. On average, the noticeable 4% OMC difference in moisture contents after compaction between BSM-emulsion and BSM-foam may be treated as negligible since the observed moisture variations between the two binders translate into 0.2% volumetric aggregate moisture contents. Laboratory mixing of emulsion and foam binder briquettes at similar moisture contents is ideal and imperative for proposed research as comparisons in moisture trends behaviour between the two binder types can be analysed on equal scale. In addition, active fillers, binder types, mixing mechanisms and vibratory compaction influences on resilient modulus trends can be equally studied. The following processes describe how BSM mixes were produced in the laboratory:
BSM-emulsion Production of bitumen emulsion briquettes involved utilization of laboratory pugmill mixer. In terms of laboratory mixing sequence, all individual graded 12 kg mass fractions were stored in buckets and sealed with plastic bags for assistance in preventing hydroscopic moisture from coating fines. Once different mass fractions were prepared in individual buckets, the four applicable mass fractions comprising 12 kg of total dry aggregate mass were allocated to the pugmill mixer. Accordingly, laboratory briquettes were mixed with active filler in the pugmill mixer prior to addition of compaction fluid. Upon conclusion of mixing dry aggregate with applicable active filler, mixes were subject to treatment with compaction moisture [OMC + 1% additional moisture] to assist compensate for moisture loss during breaking of bitumen emulsion binder. Once dry aggregate mass was thoroughly mixed and coated with compaction moisture, appropriate bitumen emulsion content was added to the pugmill mixer to make up the required optimum fluid content applicable for generating maximum dry density compaction.

73
In terms of quality handling of mixed aggregates, laboratory emulsion binder mixes were allowed an hour of rest prior to vibratory compaction to assist with breaking of emulsion binder following the mixing process. Monitoring of the breaking of emulsion process was primarily guided by observing the change in colour of mixed aggregates. Generally, the breaking of emulsion resulted in the formation of aggregate’s rich brown colour. This process normally lasted an hour prior to the compaction process. The following Figure illustrates laboratory pugmill mixer utilised during mixing of bitumen emulsion mixes:
Figure 6.4 Laboratory pugmill mixer used for BSM-emulsion
Due to accelerated hydration process applicable to aggregates treated with active filler, relevant mixes were compacted almost immediately following breaking of emulsion process. The latter was primarily implemented to assist in minimizing rapid compaction moisture loss as a result of chemical changes taking place in aggregates treated with active filler as an additional variable. The following Figure illustrates colour and texture of produced bitumen emulsion briquettes:
Figure 6.5 Laboratory bitumen emulsion briquettes
By chemical default, emulsion mixes have rich brown colour with larger aggregates resembling exaggerated coating by bitumen emulsion binder as opposed to fines in the mix. The following

74
table illustrates summary of produced briquettes and relative laboratory compaction properties for bitumen emulsion mixes:
Table 6.5 Summary of BSM-emulsion briquettes and laboratory mixing properties
Specimens Curing Relative Binder Active Filler Compaction Height Compaction Mod.AASHTO
Vibratory
Temp Humidity Mass (g) (mm) Moisture Compaction
Briquette 1 30 ◦C Unsealed Emulsion 1% Lime 9778.8 250 72.85% 99.8%
Briquette 2 30 ◦C Unsealed Emulsion 1% Lime 9792.1 250 71.88% 100.0%
Briquette 3 30 ◦C Unsealed Emulsion 1% Lime 9897.8 250 72.27% 101.1%
Briquette 1 30 ◦C Unsealed Emulsion 1% Cement 9912.2 250 72.66% 101.2%
Briquette 2 30 ◦C Unsealed Emulsion 1% Cement 9879.1 250 72.46% 100.9%
Briquette 3 30 ◦C Unsealed Emulsion 1% Cement 9948.2 250 72.27% 101.6%
Briquette 1 30 ◦C Unsealed Emulsion No Active Filler 9984 250 72.66% 101.9%
Briquette 2 30 ◦C Unsealed Emulsion No Active Filler 9887.6 250 73.44% 100.9%
Briquette 3 30 ◦C Unsealed Emulsion No Active Filler 9922.2 250 75.78% 101.1%
Briquette 1 40 ◦C Unsealed Emulsion 1% Lime 9787.3 250 73.44% 99.9%
Briquette 2 40 ◦C Unsealed Emulsion 1% Lime 9881.3 250 71.10% 100.9%
Briquette 3 40 ◦C Unsealed Emulsion 1% Lime 9880.2 250 72.27% 100.9%
Briquette 1 40 ◦C Unsealed Emulsion 1% Cement 9822.1 250 73.83% 100.2%
Briquette 2 40 ◦C Unsealed Emulsion 1% Cement 9874.5 250 71.10% 100.9%
Briquette 3 40 ◦C Unsealed Emulsion 1% Cement 9877.1 250 73.44% 100.8%
Briquette 1 40 ◦C Unsealed Emulsion No Active Filler 9902.2 250 75.20% 100.9%
Briquette 2 40 ◦C Unsealed Emulsion No Active Filler 9804.3 250 79.69% 99.7%
Briquette 3 40 ◦C Unsealed Emulsion No Active Filler 9912.5 250 78.52% 100.9%

75
BSM-foam Laboratory manufacturing of foamed bitumen mixes followed similar mixing processes described under production of emulsified binder mixes. The differentiating factor in the case of production of foamed binder mixes comes into play regarding mixing of aggregates. In terms of aggregate mixing mechanisms inside WLB10 pugmill mixer, the motor driven mixing blades toss the aggregate fines upward, allowing expanded foamed bitumen binder the time needed to coat fines during spraying of foam under pressure. As a result, raw aggregates were mixed with active filler and compaction moisture [80% OMC] and stored inside sealed bags prior to mixing with foamed bitumen binder inside WLB10 pugmill mixer. In some instances depending on how cold the weather was, mixed raw aggregates were sealed inside bags and exposed to 25 °C temperature conditioning utilizing laboratory draft ovens. Accordingly, aggregate temperatures were monitored through implementation of laser temperature gauge instrument. Mixing of foamed bitumen mixes inside WLB10 pugmill mixer at 25 °C aggregate temperature is known to generate an acceptable quality of mix in terms of binder dispersion and compactibility. The following Figure shows the laboratory WLB10 pugmill mixer implemented during mixing of laboratory foamed bitumen aggregates:
Figure 6.6 Laboratory WLB10 pugmill mixer used for BSM-foam
As outlined previously, mixing of aggregates inside WLB10 pugmill mixer is achieved by the spinning action of electronic motor driven blades. The two suspended rotating paddle shafts have opposite rotating directions coupled with different speed settings. As a result, mixing of aggregates takes place at high rotating speeds to help afford aggregate fines the time needed to be suspended in midair during spraying of hot expanded foamed bitumen binder. Accordingly, larger aggregate fractions are the least coated by expanded foamed bitumen binder due to nature of mixing environment. As a result, selective dispersion of the bitumen amongst the fines aggregates allows BSM-foam to accommodate larger flexural strains. Depending on the method of compaction adopted and its associated effects on aggregate distributions within laboratory samples, foamed bitumen aggregate interlocking material properties
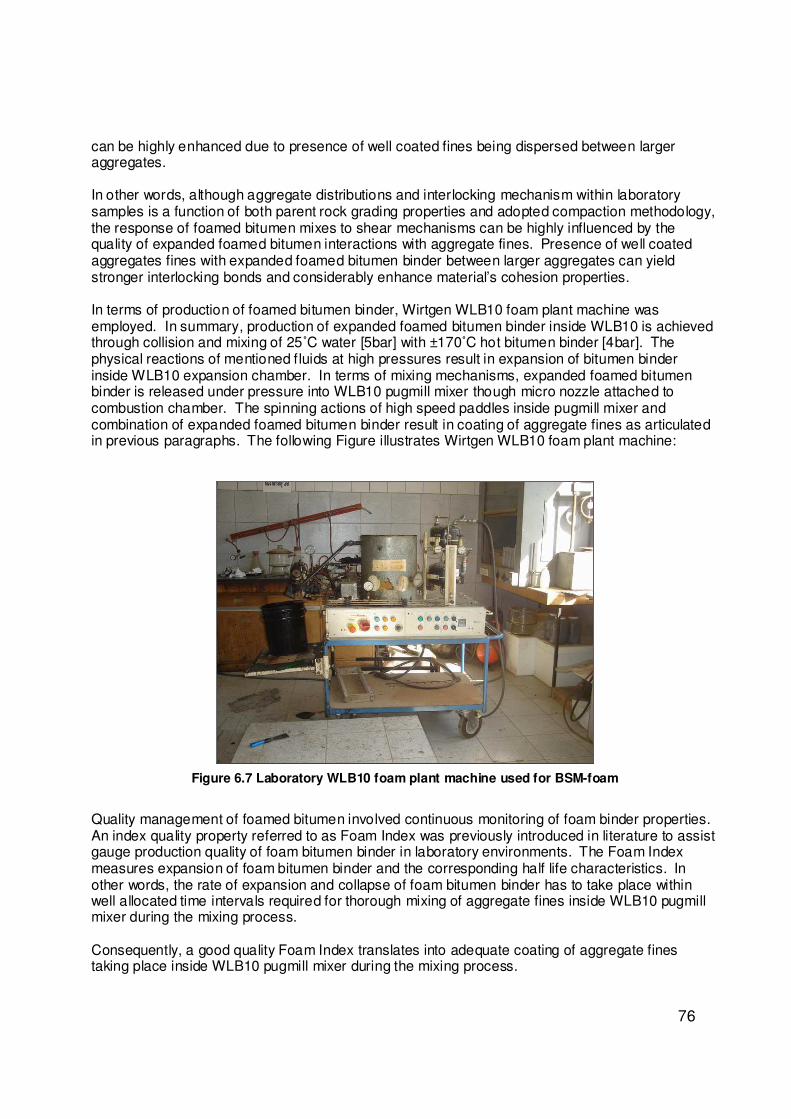
76
can be highly enhanced due to presence of well coated fines being dispersed between larger aggregates. In other words, although aggregate distributions and interlocking mechanism within laboratory samples is a function of both parent rock grading properties and adopted compaction methodology, the response of foamed bitumen mixes to shear mechanisms can be highly influenced by the quality of expanded foamed bitumen interactions with aggregate fines. Presence of well coated aggregates fines with expanded foamed bitumen binder between larger aggregates can yield stronger interlocking bonds and considerably enhance material’s cohesion properties. In terms of production of foamed bitumen binder, Wirtgen WLB10 foam plant machine was employed. In summary, production of expanded foamed bitumen binder inside WLB10 is achieved through collision and mixing of 25˚C water [5bar] with ±170˚C hot bitumen binder [4bar]. The physical reactions of mentioned fluids at high pressures result in expansion of bitumen binder inside WLB10 expansion chamber. In terms of mixing mechanisms, expanded foamed bitumen binder is released under pressure into WLB10 pugmill mixer though micro nozzle attached to combustion chamber. The spinning actions of high speed paddles inside pugmill mixer and combination of expanded foamed bitumen binder result in coating of aggregate fines as articulated in previous paragraphs. The following Figure illustrates Wirtgen WLB10 foam plant machine:
Figure 6.7 Laboratory WLB10 foam plant machine used for BSM-foam
Quality management of foamed bitumen involved continuous monitoring of foam binder properties. An index quality property referred to as Foam Index was previously introduced in literature to assist gauge production quality of foam bitumen binder in laboratory environments. The Foam Index measures expansion of foam bitumen binder and the corresponding half life characteristics. In other words, the rate of expansion and collapse of foam bitumen binder has to take place within well allocated time intervals required for thorough mixing of aggregate fines inside WLB10 pugmill mixer during the mixing process. Consequently, a good quality Foam Index translates into adequate coating of aggregate fines taking place inside WLB10 pugmill mixer during the mixing process.

77
The following table illustrates observed foaming properties generated during manufacturing of laboratory samples:
Table 6.6 Laboratory foam expansion test properties
Foam Expansion Tests 30 ◦C Briquettes
40 ◦C Briquettes
Date 8-Nov-2007 16-Nov-2007
Water Pressure 5 bar 5 bar
Air Pressure 4 bar 4 bar
Bitumen Temperature 176-177 ◦C 164
◦C
Bitumen Grade 80/100 80/100
Calculated Bitumen Flow 120 g/s 121 g/s
Water Flow: 2.75-3% Bit Flow 3.33 - 3.60 g/s 3.33 -3 .63 g/s
Bucket Temperature 50-60 ◦C 60
◦C
Foam (g) 500 grams 500 grams
Foam Spay Time 4.17 sec 4.13 sec
Measured Expansion 12 12
Recorded Half Life 24 sec 26 sec
Foam Index 175 sec 175 sec
Aggregate at 25˚C Good Good
The observed measured consistency on quality of expanded foam bitumen binder properties during different occasions further emphasizes good laboratory control measures implemented throughout the mixing process. Following laboratory mixing processes and whilst aggregates were warm due to mixing with hot expanded foam bitumen binder inside WLB10 pugmill mixer, compaction of laboratory samples followed immediately. In most cases, vibratory compaction of warm aggregates gave the best compaction properties as witnessed from achieved laboratory densities. The following Figure illustrates colour and texture of produced foam bitumen briquettes:
Figure 6.8 Laboratory foam bitumen mixes
Evidently, BSM-foam appears much lighter in terms of colour texture properties when compared to BSM-emulsion. Accordingly, in terms of BSM-foam samples there seems to be more coating of fines than larger aggregates as elaborated previously. The following table illustrates summary of produced briquettes and relative laboratory compaction properties for foam bitumen mixes

78
Table 6.7 Summary of BSM-foam briquettes and laboratory mixing properties
Specimens Curing Relative Binder Active Filler Aggregate Compaction Height Compaction Mod.AASHTO
Vibratory Temp Humidity Temperature Mass (g) (mm) Moisture Compaction
Briquette 1 30 ◦C Unsealed Foam 1% Lime 19
◦C 9817.4 250 68.75% 100.4%
Briquette 2 30 ◦C Unsealed Foam 1% Lime 20
◦C 9951.5 250 69.14% 101.8%
Briquette 3 30 ◦C Unsealed Foam 1% Lime 19 ◦C 9873.2 250 66.60% 101.1%
Briquette 1 30 ◦C Unsealed Foam 1% Cement 19
◦C 9819.3 250 69.92% 100.4%
Briquette 2 30 ◦C Unsealed Foam 1% Cement 18
◦C 9822.5 250 69.73% 100.4%
Briquette 3 30 ◦C Unsealed Foam 1% Cement 20 ◦C 9802.8 250 68.16% 100.3%
Briquette 1 30 ◦C Unsealed Foam No Active Filler 19
◦C 9809.5 250 71.29% 100.2%
Briquette 2 30 ◦C Unsealed Foam No Active Filler 20 ◦C 9700 250 67.77% 99.3%
Briquette 3 30 ◦C Unsealed Foam No Active Filler 19
◦C 9768.6 250 66.99% 100.0%
Briquette 1 40 ◦C Unsealed Foam 1% Lime 21 ◦C 9796.4 250 68.95% 100.2%
Briquette 2 40 ◦C Unsealed Foam 1% Lime 21
◦C 9810.2 250 69.73% 100.3%
Briquette 3 40 ◦C Unsealed Foam 1% Lime 20
◦C 9819.2 250 66.02% 100.6%
Briquette 1 40 ◦C Unsealed Foam 1% Cement 20 ◦C 9814.2 250 71.68% 100.2%
Briquette 2 40 ◦C Unsealed Foam 1% Cement 21
◦C 9829.2 250 73.44% 100.3%
Briquette 3 40 ◦C Unsealed Foam 1% Cement 20
◦C 9810.9 250 75.98% 100.0%
Briquette 1 40 ◦C Unsealed Foam No Active Filler 20 ◦C 9822.8 250 69.34% 100.4%
Briquette 2 40 ◦C Unsealed Foam No Active Filler 20
◦C 9831.6 250 67.97% 100.6%
Briquette 3 40 ◦C Unsealed Foam No Active Filler 21
◦C 9894.2 250 75.98% 100.8%

79
6.5 Controlled Vibratory Compaction Field roller compaction has both kneading characteristics and dynamic loading effects on BSMs. In laboratory, mechanisms of the adopted compaction protocol have to replicate field observations. In terms of choice of adopted laboratory compaction protocol, vibratory Bosch hammer was elected as appropriate instrument for field simulation. Although implementation of laboratory roller compaction protocol is ideal for field simulation in that both in situ and laboratory compactor mechanisms are similar, manufacturing of rectangular beds for purposes of resilient modulus testing was considered inappropriate due to BSM dimension limitations imposed by adopted laboratory resilient modulus testing protocol. In terms of contact surface pressures, both in situ steel roller and laboratory Bosch hammer compaction mechanisms exert uniform loading effects per contact area. Consequently, laboratory compaction was achieved utilising 248 mm diameter base plate affixed to bottom of Bosch hammer for assistance in generating uniform compaction per loading area [top of briquette layer]. For purposes of replicating in situ steel roller weight during high frequency dynamic loading, 10 kg surcharge weight was affixed on top of Bosch hammer. In terms of in situ steel roller dynamic loading effects, both in situ steel roller and Bosch hammer have similar loading effects regarding dynamic loading frequencies and contact pressure effects during compaction. Accordingly, in situ roadbed compaction was achieved in 150 mm layers. As per Mod. AASHTO field compaction equivalent, laboratory vibratory compaction was achieved in 50 mm layers [5 layers in total]. Accordingly, in situ steel roller kneading mechanisms are similarly comparable to rotating base plate affixed to laboratory Bosch hammer. Due to nature of Bosch hammer assembly and resulting high frequencies, the suspended moving actions of Bosch hammer somewhat contributes to rotation movements of 248 mm base plate affixed at the bottom of Bosch hammer. The noticeable base plate seems to rotate around mould central axis as observed during compaction of briquettes. Both in situ steel roller kneading mechanisms and laboratory rotating base plate actions constitute to dense particle packing and migration of aggregate fines toward void regions during layer compaction. The following Figure illustrates laboratory vibratory compaction loading assembly utilised during production of briquettes:
Figure 6.9 Laboratory vibratory compaction protocol using Bosch hammer (Kelfkens, 2007)
Manufacturing of laboratory briquettes was achieved through utilization of split moulds. During laboratory vibratory compaction, the working frequency action of Bosch hammer induced noticeable

80
high friction forces between mould walls and compacted briquettes. In some instances, split moulds jammed during extraction of compacted briquettes. For this reason, split mould release oil was continuously applied along walls of split moulds to assist in reducing friction forces present at these regions. In addition, the mounted surcharge weight affixed on top of Bosch hammer and the working frequency action of compaction base plate resulted in individual layers being excessively stiff upon completion. The latter contributed to additional layers shearing off at joint interface regions. In the effort to prevent shear from occurring, compacted layers were scarified with small chisel to assist loosen up the top 10 mm of material aggregates for purposes of bonding subsequent layers. In addition, prevention from tempering with briquette’s compacted grading properties was achieved through aiming the scarifying chisel at an angle with minimum force to avoid altering and damaging both raw aggregates and compacted layers. In terms of mechanisms of compaction yield per layer, the following Figure illustrates average time required per individual layer to yield 100% Mod. AASHTO compaction:
0
20
40
60
80
100
120
Layer 1 Layer 2 Layer 3 Layer 4 Layer 5Tim
e t
o Y
ile
d 1
00
% M
od
.
Aa
shto
Co
mp
act
ion
(se
con
ds)
50 mm Thick Layers
Time to Yield 100% Mod. Aashto Compaction
versus Layer Thickness
Figure 6.10 Time to yield 100% Mod. AASHTO compaction versus layer thickness (Kelfkens, 2007)
In laboratory environment, compaction yield per layer was initially monitored through observations of time elapsed per individual layer to compress to 50 mm thickness or 100% Mod. AASHTO equivalent. As a result, laboratory vibratory compaction yield resembles variable/quadratic relationship regarding compaction time required per individual layer to yield 100% Mod. AASHTO equivalent. Accordingly, findings outlined in this research led to formulation of the following hypothesis: Compaction yield by laboratory vibratory Bosch hammer appears to be a function of combination of loading frequency, residual bearing mass and lateral displacement of aggregate particles. Consequently, the addition of bearing mass during compaction contributes to longer durations
required by aggregate particles to compress to 100% Mod. AASHTO equivalent. The observed relationship is reversed in the final two layers, with layer thickness requiring reduced time to yield 100% Mod. AASHTO equivalent, a factor attributed to preceding layers gaining excess refusal
densities, Kelfkens (2007).
Layer 5
Layer 4
Layer 3
Layer 2
Layer 1

81
As a result, monitoring of layer thickness for purposes of achieving 100% Mod. AASHTO proved more reliable than monitoring associated compaction time. As a result, the laboratory vibratory compaction protocol was achieved by monitoring of layer thickness. In laboratory environment, calculation of 100% Mod. AASTHO equivalent mass per 50 mm compaction layer depended on aggregate binder type and compaction moisture. The following equation and tables illustrate calculations of required compaction mass per binder type:
100% .. Mod AASHTO wet PerLayerEquivalent Mass MaxDensity Volume= ×
2
100% .. 14
Mod AASHTO dry compaction
DEquivalent Mass MaxDensity Moisture
π = + × Equation 10
Table 6.8 Controlled BSM-emulsion mix compaction of N7 crushed hornfels rock material
100% Mod. AASHTO Compaction For Emulsion Mixes
Emulsion content 3.3%
Binder content 2.0%
Compaction moisture [Emulsion Content + 1% Additional Moisture] 4.3%
%OMC 84%
Specimen height (mm) 250
Height per layer (mm) 50
Max dry density (kg/m3) 2138
Max wet density (kg/m3) 2230
Required 100% Mod. AASTHO equivalent mass per 50 mm layer (g) 1970
For quality purposes, determination of 100% Mod. AASTHO equivalent mass per binder type varied per laboratory mixing session/occasion depending on present microscopic moisture. In retrospect, the equivalent 100% Mod. AASHTO mass per binder type resembled similar characteristics irrespective of different compaction moisture implications.
Table 6.9 Controlled BSM-foam mix compaction of N7 crushed Hornfels rock material
100% Mod. AASHTO Compaction For Foam Mixes
Binder content 2.0%
Compaction moisture [based on 80% OMC] 4.1%
%OMC 80%
Specimen height (mm) 250
Height per layer (mm) 50
Max dry density (kg/m3) 2138
Max wet density (kg/m3) 2226
Required 100% Mod. AASTHO equivalent mass per 50 mm layer (g) 1966

82
6.6 Oven Curing Environments In situ BSM-emulsion temperature observations resembled non uniform temperature behaviour with time at both the centreline and shoulder positions. Field buttons were installed at 2/3 depths along shoulder sections and 1/3 depth at centreline locations. Temperature trends showed identical temperatures at these depths and locations irrespective of variations in depth positioning of measuring buttons. In terms of replicating in situ observations in laboratory environment, it was decided that for purposes of simplifying the curing protocol, typical temperatures observed in the field during the unsealed and sealed BSM-emulsion base will be implemented in the laboratory. In other words, the most common temperatures will be utilized and kept constant during the different laboratory curing phases. In addition, maintaining uniform temperature distributions inside and around briquette’s surface volume is essential to generating realistic resilient modulus trends attributed to uniform volumetric moisture during curing. In terms of simulating uniform temperature curing in the laboratory, implementation of draft ovens instead of traditional ovens [non draft ovens] seemed appropriate. Draft ovens have the capacity to maintain uniform temperatures distributions in and around briquette’s volume. The implemented intervention is ideal since temperature and humidity buttons revealed that field temperature distributions along the shoulder and centreline locations are similar. In other words, laboratory draft oven curing must maintain similar temperature distributions around the briquette’s volume, since field observation confirmed that temperature patterns are similar in and around BSM-emulsion volume. Furthermore, the absence of relative humidity gauges in majority of industrial laboratories across South Africa presents a challenge regarding controlling and monitoring of relative humidity conditions inside draft ovens. In situ observations resembled relative humidity readings well above 100% despite curing of BSM-emulsion layer. Although the observed relative humidity conditions were unrealistic, the observed in situ relative humidity behaviour emphasizes temperature curing as effective mechanism for moisture extraction. Furthermore, the presence of field moisture inside BSM-emulsion after sealing the layer with HMA further illustrates the importance of maintaining some level of relative humidity conditions within selected curing environments. For this reason, it was decided that relative humidity in the laboratory be controlled using moisture bags. Relative humidity conditions are best simulated by sealing briquettes with solid moisture bags. Sealing of laboratory briquettes with solid moisture bags typically generates 100% relative humidity conditions around briquette’s surface during curing similar to field observations. The following Figure illustrates nature of curing environments implemented for laboratory curing:
Figure 6.11 Laboratory draft oven curing environments
Prior to accelerated curing of laboratory briquettes, draft ovens were subject to temperature conditioning whilst monitoring of curing temperatures. This was managed by implementing manual

83
temperature gauges. During draft oven temperature conditioning, implemented manual temperature gauge resembled measuring tolerances in the regions of ±1ºC. In conclusion, laboratory briquettes were mounted on top of 200 mm diameter cardboard sheets which were then placed inside laboratory aluminium plates to assist protect briquettes against ravelling during handling. The 200 mm cardboard sheets were also implemented to avoid thermo-conductivity taking place between bottom of briquettes and aluminium plates, a factor which may lead to uneven temperature distributions inside briquettes during draft oven curing. 6.7 Development of Short Dynamic Resilient Test Parameters using Monotonic Testing Evaluation of BSM performance in laboratory environment followed adoption of monotonic testing protocol. With the assistance of short dynamic resilient modulus testing, dynamic failure modes using monotonic testing for graded crushed hornfels material had to be established. Dynamic failure modes in the form of stresses at failure and the applicable stress ratios were developed for graded crushed hornfels material. In terms of simplifying the testing process, 25% stress ratios and 100 kPa confinement pressures were assumed as constant testing parameters for graded crushed rock hornfels material throughout the testing process. Dynamic testing parameters were developed for evaluation of resilient modulus trends relative to draft oven cure. The challenge came into effect regarding laboratory replication of in situ material response to dynamic loading under compaction during construction phase and in service traffic environment. In other words, given that laboratory briquettes will be subject to resilient modulus testing immediately after vibratory compaction and assuming continuous monitoring of resilient modulus relative to laboratory curing, how will initial laboratory dynamic test parameters cater for material evolution relative to oven curing effects and time? Will the developed laboratory material test parameters coincide with in situ material response to compaction and traffic effects? Moreover, will the developed laboratory dynamic mix properties represent both material properties after compaction and during oven cure? In terms of addressing the above challenges, it was decided that rather than developing laboratory dynamic testing parameters linked to resilient modulus testing at each different observations, the analysis can be simplified by assuming constant laboratory dynamic testing parameters despite the occurring material evolution processes linked to curing. Accordingly, dynamic loading test parameters were developed for cured BSM resembling long term field cure as per TG2 2002 curing guideline. At the time, curing was implemented using the TG2 2002 curing guideline as curing developments were still under investigations. Developing dynamic test parameters reflective of field cured BSM should assist bridge the gap between laboratory and field environments. In other words, laboratory dynamic test parameters will replicate field material response during in situ compaction phases and in service traffic environments. As a result, testing of resilient modulus implementing long term field cured dynamic test parameters within laboratory environment will replicate field material response during the testing phases. The following table illustrates implemented laboratory accelerated curing protocol for BSMs as per TG2 guideline:
Table 6.10 TG2 2002 Curing Guideline
Implemented Laboratory Accelerated Curing Procedure for BSM
20 hours at 30°C : Unsealed Replace wet plastic bags 2x specimen volume Simulated Field Conditions
48 hours at 40°C : Sealed with dry ones at every 24 hours interval Long term
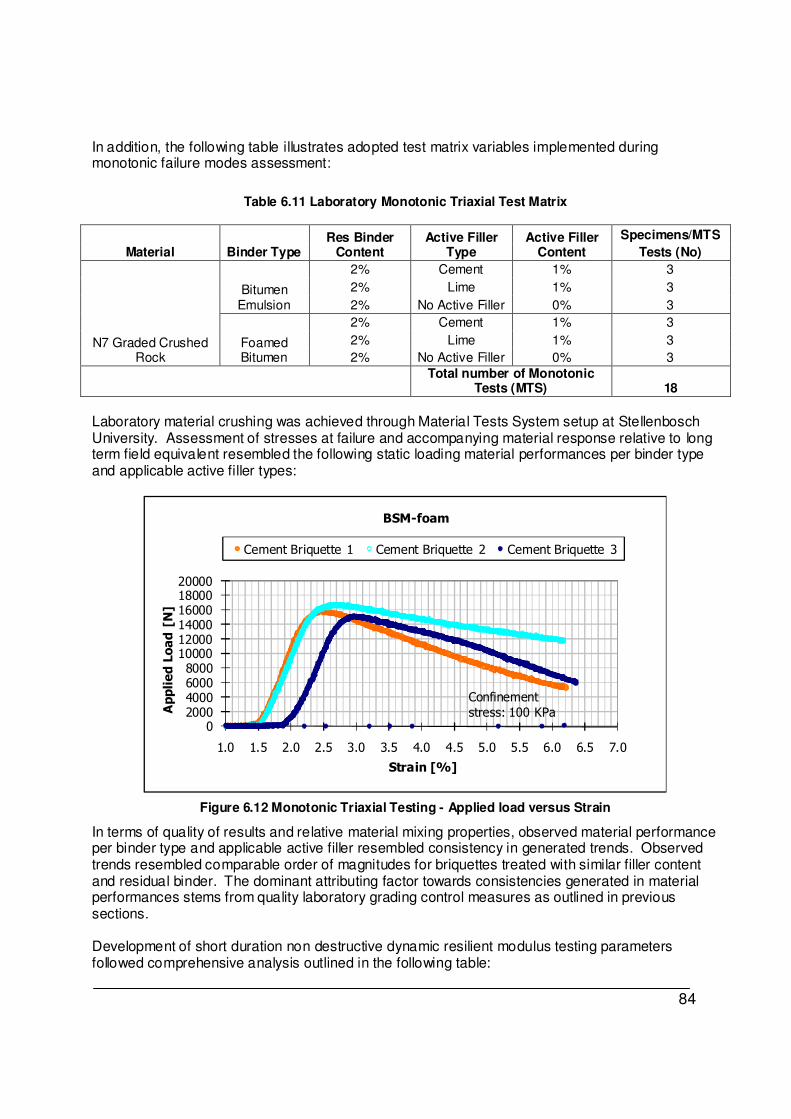
84
In addition, the following table illustrates adopted test matrix variables implemented during monotonic failure modes assessment:
Table 6.11 Laboratory Monotonic Triaxial Test Matrix
Laboratory material crushing was achieved through Material Tests System setup at Stellenbosch University. Assessment of stresses at failure and accompanying material response relative to long term field equivalent resembled the following static loading material performances per binder type and applicable active filler types:
02000400060008000
100001200014000160001800020000
1.0 1.5 2.0 2.5 3.0 3.5 4.0 4.5 5.0 5.5 6.0 6.5 7.0
Applied Load [N]
Strain [%]
BSM-foam
Cement Briquette 1 Cement Briquette 2 Cement Briquette 3
Confinementstress: 100 KPa
Figure 6.12 Monotonic Triaxial Testing - Applied load versus Strain
In terms of quality of results and relative material mixing properties, observed material performance per binder type and applicable active filler resembled consistency in generated trends. Observed trends resembled comparable order of magnitudes for briquettes treated with similar filler content and residual binder. The dominant attributing factor towards consistencies generated in material performances stems from quality laboratory grading control measures as outlined in previous sections. Development of short duration non destructive dynamic resilient modulus testing parameters followed comprehensive analysis outlined in the following table:
Material Binder Type Res Binder
Content Active Filler
Type Active Filler
Content
Specimens/MTS
Tests (No)
N7 Graded Crushed Rock
Bitumen Emulsion
2% Cement 1% 3
2% Lime 1% 3
2% No Active Filler 0% 3
Foamed Bitumen
2% Cement 1% 3
2% Lime 1% 3
2% No Active Filler 0% 3
Total number of Monotonic
Tests (MTS) 18

85
Table 6.12 Determination of Dynamic Test Parameters
σa,f σ1 - σ3
SR[%] =
Equation 9
1 1, 3f dwσ σ σ σ= + + Equation 10
σTest(MTS ) = σa,f - σdw
Equation 11
max ( )test MTS briquetteF Areaσ= × Equation 12
[ ]max
2
PreLoad FSetPoint
+= − Equation 13
[ ] veveSpan SetPoint PreLoad+−
= + Equation 14
Where, SR [%] = Stress ratio [25%] σa,f = Applied stress at failure σ3 = Confinement stress [100 KPa] σdw = Stress as a result of MTS dead weight of the top loading plate & piston σ1 = Major Principal Stress With stress ratio [SR] known and the principal stress at failure [σ1,f] determined from monotonic testing following the curing process, applied stress can be calculated using equation 10. This allows for maximum applied stress to be determined in equation 12.
σTest (MTS) = Maximum applied stress during short duration dynamic test Fmax = Maximum applied Load during short duration dynamic test Set Point = Applied compression load on briquette
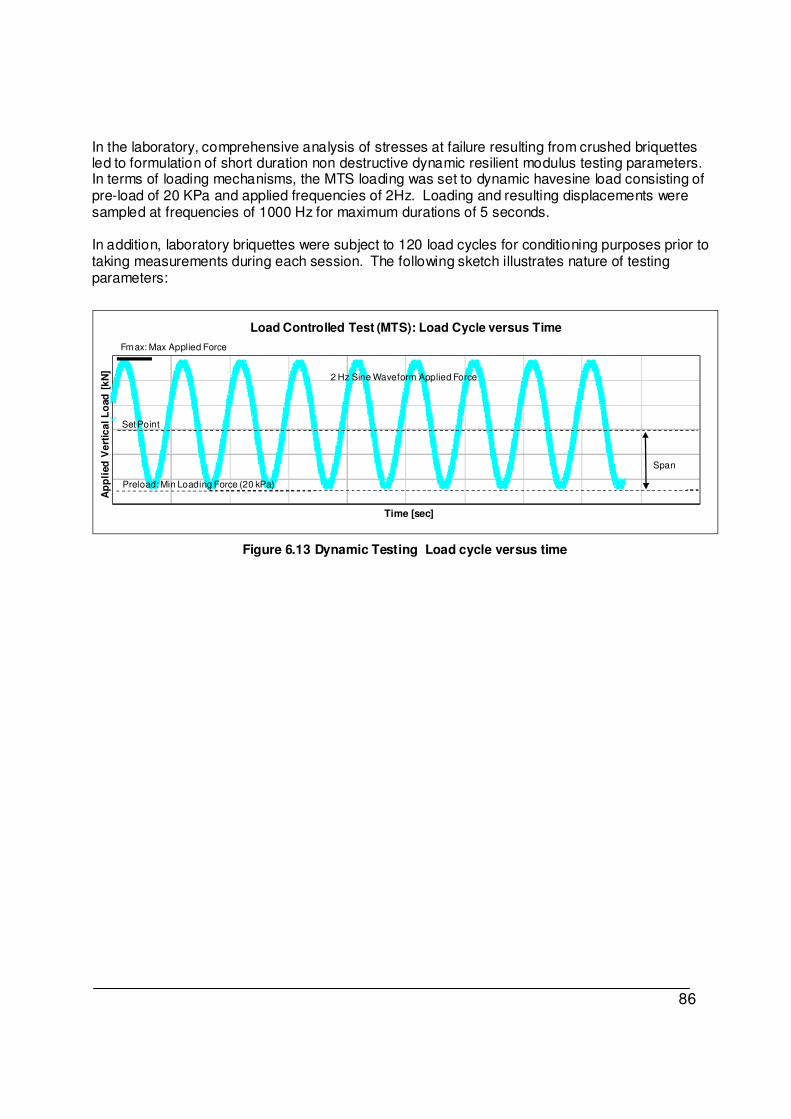
86
In the laboratory, comprehensive analysis of stresses at failure resulting from crushed briquettes led to formulation of short duration non destructive dynamic resilient modulus testing parameters. In terms of loading mechanisms, the MTS loading was set to dynamic havesine load consisting of pre-load of 20 KPa and applied frequencies of 2Hz. Loading and resulting displacements were sampled at frequencies of 1000 Hz for maximum durations of 5 seconds. In addition, laboratory briquettes were subject to 120 load cycles for conditioning purposes prior to taking measurements during each session. The following sketch illustrates nature of testing parameters:
Ap
pli
ed
Ve
rtic
al
Lo
ad
[k
N]
Time [sec]
Load Controlled Test (MTS): Load Cycle versus Time
Span
Preload: Min Loading Force (20 kPa)
Fmax: Max Applied Force
Set Point
2 Hz Sine Waveform Applied Force
Figure 6.13 Dynamic Testing Load cycle versus time

87
Following crushing of briquettes and assessment of monotonic failure modes for various binder types and active fillers, the following material properties for the non destructive resilient modulus test protocol were derived [as elaborated previously, the following samples were subject to TG2 2002 curing guideline outlined in Table 6.10]:
Table 6.13 Determination of non destructive dynamic resilient modulus test parameters
MONOTONIC TEST ANALYSIS OF FOAMED BINDER BRIQUETTES
SHORT DURATION DYNAMIC LOAD
TEST PARAMETERS σ3 Max
load Strain at Failure
σaf σ Etan Esec
SR
Max Load (Applied)
Set Point
Span σ3 Freq
[kPa] [kN] [%] [kPa] [kPa] [MPa] [MPa] [%] [kN] [kN] [kN] [kPa] [Hz]
FOAMED BITUMEN MIXES
1% Lime Treated Briquettes
25% 5.2 -2.8 2.4 100 2
Briquette 1 100 19.8 1.09 1119.5 1221.4 102.3 111.6
Briquette 2 100 19.5 1.24 1103.2 1205.2 89.0 97.2
Briquette 3 100 22.8 1.06 1293.0 1394.9 122.4 132.0
Average 100 20.7 1.13 1171.9 1273.8 104.6 113.6 1% Cement Treated Briquettes
25% 4.0 -2.2 1.8 100 2
Briquette 1 100 16.0 1.07 905.3 1007.3 84.6 94.1
Briquette 2 100 16.8 1.11 948.7 1050.7 85.6 94.8
Briquette 3 100 15.2 0.96 862.0 963.9 89.9 100.6
Average 100 16.0 1.05 905.3 1007.3 86.7 96.5
No Active Filler
25% 3.7 -2.0 1.7 100 2
Briquette 1 100 16.7 1.30 946.0 1048.0 72.6 80.4
Briquette 2 100 13.3 1.29 750.8 852.8 58.4 66.3
Briquette 3 100 14.8 1.03 837.6 939.5 81.2 91.1
Average 100 14.9 1.21 844.8 946.8 70.7 79.3 BITUMEN EMULSION MIXES
1% Lime Treated Briquettes
25% 4.6 -2.5 2.1 100 2
Briquette 1 100 17.8 0.84 1005.6 1107.6 154.5 131.7
Briquette 2 100 18.4 0.85 1043.6 1145.5 155.8 134.9
Briquette 3 100 19.7 1.00 1114.1 1216.0 138.2 121.3
Average 100 18.6 0.90 1054.4 1156.4 149.5 129.3 1% Cement Treated Briquettes
25% 3.3 -1.8 1.5 100 2
Briquette 1 100 15.1 1.26 853.8 955.8 123.4 75.7
Briquette 2 100 13.3 1.01 750.8 852.8 98.6 84.7
Briquette 3 100 11.8 1.01 669.5 771.5 102.4 76.3
Average 100 13.4 1.09 758.1 860.0 108.1 78.9 No Active Filler
25% 2.6 -1.5 1.1 100 2
Briquette 1 100 12.1 0.93 685.8 787.7 104.9 84.7
Briquette 2 100 10.2 0.89 577.4 679.3 90.4 76.1
Briquette 3 100 9.4 1.48 534.0 635.9 81.1 43.1
Average 100 10.6 1.10 599.0 701.0 92.1 68.0

88
To date, a total of 252 non destructive resilient tests were performed on laboratory samples. The following tables illustrated the number of tests undertaken:
Table 6.14 Number of repeat testing for the non destructive dynamic resilient modulus test
INNITIAL CURING PROTOCOL EXPERIMENTATION - IMPROVEMENT
Confinement
SR Binder Type
Briquettes Oven Curing Relative Test MTSTests
Stress: σ3 Temperature Humidity Frequency
[kPa] [%] [No] [°C] [%] [No]
100 25%
Bitumen Emulsion Cem 3
30 Unsealed Day 0,1,2, 3,7
15
Bitumen Emulsion Lime 3 15
Bitumen Emulsion No Filler 3 15
Bitumen Emulsion Cem 3
40 Unsealed Day 0,1,2, 3,7
15
Bitumen Emulsion Lime 3 15
Bitumen Emulsion No Filler 3 15
Foamed Bitumen Cem 3
30 Unsealed Day 0,1,2, 3,7
15
Foamed Bitumen Lime 3 15
Foamed Bitumen No Filler 3 15
Foamed Bitumen Cem 3
40 Unsealed Day 0,1,2, 3,7
15
Foamed Bitumen Lime 3 15
Foamed Bitumen No Filler 3 15
FINAL CURING PROTOCOL EXPERIMENTATION – VALIDATION
100 25%
Bitumen Emulsion Cem 3
30 & 40
Unsealed & Hrs
0,20,44,68
12
Bitumen Emulsion Lime 3 12
Bitumen Emulsion No Filler 3 Sealed 12
Foamed Bitumen Cem 3
30 & 40
Unsealed & Hrs
0,12,36,60
12
Foamed Bitumen Lime 3 12
Foamed Bitumen No Filler 3 Sealed 12
Total number of MTS tests 252

89
6.8 Short Duration Non Destructive Dynamic Resilient Modulus Test Method This section covers load controlled MTS testing protocol of laboratory cured briquettes, with applied dynamic loading parameters, relative frequencies and confinement pressures being the dominant features. In terms of nature of testing mechanisms, the non destructive approach regarding resilient modulus testing protocol required high level of sensitivity concerning material handling during testing phases. Laboratory briquettes required coverage with latex membrane for application of uniform confinement pressure. The mounting of briquettes inside MTS cylinder required careful positioning of loading plate to avoid eccentric loading of briquettes. Strict testing temperature measures were maintained during testing phases and consistent load conditioning cycles per briquettes prior to testing phases were equally maintained. The following Figure illustrates the handling process during briquette’s preparations prior to MTS testing:
Figure 6.14 Testing of briquettes using laboratory MTS setup and external LVDT
Laboratory MTS is built with internal LVDT [Linear Variable Displacement Transducer]. Internal LVDT is responsible for capturing vertical displacement of briquettes during dynamic loading. In laboratory, trial vertical displacement measurements showed discrepancies captured by MTS internal LVDT. Observed discrepancies are mainly attributed to movements occurring between loading plate and briquette’s top surface. Shear movements observed between briquette’s base plate and mounting shaft perpetuated the problem of eccentric loading. Given abovementioned challenges, an external additional LVDT was introduced and mounted/configured to capture briquette’s vertical displacement during dynamic MTS loading. The

90
external LVDT configuration mechanisms simplified acquisition of measurements during dynamic loading independent of movements occurring between briquette’s base plates and the MTS loading shaft. Following comprehensive calibration process for additional external LVDT, briquette’s vertical displacements were accurately captured. As a point of clarity, the externally mounted LVDT should not be compared to on specimen mounted LVDTs. On specimen mounted LVDTs normally comprise of 3 LVDTs symmetrically configured to measure materials long term resilient modulus behaviour over long testing hours. In our case, the external LVDT is a simple setup configured to capture material’s change in height during dynamic loading. The deflection measurements are therefore captured below the specimen at the bottom of the fixed end plate. In terms of laboratory testing technicalities, vibratory compacted specimens were conditioned with 10 000 loading cycles as per Stellenbosch University MTS test protocol. Load conditioning of compacted briquettes provided homogeneous specimens which assist initial resilient modulus reaching stability. Accordingly, conditioning preceded recording of vertical displacement measurements during dynamic loading test phase. Due to nature of fresh materials, most specimens failed after 5000 load repetitions. Consequently, all specimens were conditioned at 2000 load repetitions to avoid failure. Once fresh briquettes had been conditioned with 2000 load repetitions, resilient modulus measurements were taken. At the end of taking the initial resilient modulus measurements, the curing process of briquettes followed immediately. In terms of future resilient modulus measurements, cured briquettes only required 120 load repetitions before measurements were taken. Typically, fresh specimens were tested within 8 hours from the time of compaction. Oven curing of specimens followed 4 hours after testing of briquettes. Furthermore, specimens were tested at 24 hour intervals. Specimens were also allowed to cool for an average of 3 hours once taken out of the oven curing environment before testing. Furthermore, all tests were conducted at room temperatures. Figure 6.15 illustrates a typical load signal vertical displacement measurement. Typical measurement takes 5 minutes resulting in 10 cycles of measurements being captured.
0.00000.02000.04000.06000.08000.10000.12000.1400
0.1600
0.00 0.58 1.15 1.73 2.30 2.88 3.45 4.03 4.60 5.18 5.75
Dis
pla
cem
en
t [m
m]
Time [sec]
Ext LVDT
Figure 6.15 External LVDT load signal vertical displacement measurement

91
Once displacement is captured, vertical strain can be determined using the following equation:
H
Hε
∆= Equation 15
Where: H = Briquette’s Height ε = Vertical Strain Figure 6.16 shown below displays controlled dynamic loading signal applied on briquette’s surface area. The dynamic load is measured against time during loading of briquettes.
-4500.0-4000.0-3500.0-3000.0-2500.0-2000.0-1500.0-1000.0
-500.00.0
0.00 0.58 1.15 1.73 2.30 2.88 3.45 4.03 4.60 5.18 5.75
Lo
ad
[N
]
Time [sec]
Figure 6.16 External LVDT load signal measurement
Once dynamic load is captured, stress can be calculated as loading force per unit area. Dynamic resilient modulus can be calculated using the following equation:
rMσ
ε= Equation 16
Where: Mr : Resilient modulus σ : Applied vertical Stress ε : Rebound strain captured during unload cycle Resilient modulus was calculated for each peak shown in Figure 6.16. Table 6.15 shown below illustrates how vertical strain was calculated from the maximum and minimum peaks on the displacement graph. The estimated strain linked to vertical stress gave estimate to resilient modulus values.

92
Table 6.15 Resilient modulus analysis from cycle 1 of stress strain relationship graph
Cycle From To
LVDTExternal
1 0 mm 0.575 mm
Load σd
[N] [kPa] [mm]
minimum -4052.4 -229.3 0.0723
maximum -632.3 -35.8 0.1641
difference 3420.1 193.5 0.0918
axial strain [mstrain] 367.19
Stress [kPa] 193.5
Cstress [kPa] 193.5
Mr [MPa] 527
Table 6.16 shown below illustrates average resilient modulus values per loading cycle. The briquette’s resilient modulus was taken as the average resilient modulus occurring within a single specific loading cycle.
Table 6.16 Average resilient modulus analysis during 8 cycles
Cycle Mr [MPa]
1 527
2 527
3 527
4 538
5 525
6 524
7 527
8 538
Average Mr 529
Results were processed using the computer setup shown below in Figure G.34. LVDT Measurements were recorded on the binary factor of ±2048 in the analogue conversion by the computer. Once measurements were taken, the spreadsheet program converted the measured displacements into the ±10.0 V scale. Calibration of the external LVDT yielded 10.0 V/4 mm in the vertical direction. The 10.0 V scale was converted to SI units using 20% and 100% scale conversion for the load and vertical displacement measurements.
Figure 6.17 Laboratory MTS computer setup

93
6.9 Results and Findings This section contains moisture and resilient modulus trends obtained from Laboratory Investigation and Curing Protocol Improvements tests matrix outlined in Figure 6.2. Derived results have helped develop parameters for development of draft accelerated curing laboratory protocol for BSMs.
In terms of presented results, test briquettes were subject to 7 days of oven cure at 30 °C and 40 °C temperatures respectively. All briquettes were cured [unsealed] for the duration of 7 days. As elaborated in previous chapters, unsealed curing tests seemed desirable to help establish limit values in terms of final resilient modulus and moisture trends.
Establishing curing rates in the unsealed state helped determine the different times required to cure briquettes [unsealed] before sealing for purposes of simulating 100% relative humidity conditions. In terms of developing parameters for improvement of draft curing protocol(s) for BSMs, the following areas of concern when addressing factors influencing final resilient modulus and moisture limit values were explored: • Binder type considerations when addressing laboratory curing of BSMs • Active filler influences on material evolution during the curing phase • Temperature effects on material behaviour
• Relative humidity considerations when simulating laboratory curing environments Followings findings from generated laboratory resilient modulus and moisture trends, the subject of Unified Curing Protocol for BSMs was addressed. In addition, derived parameters for development of draft accelerated laboratory curing protocol for BSMs were finalised, with emphasis being devoted to reconciliation of field and laboratory trends.
6.9.1 BSM-foam Laboratory Trends
Following laboratory monotonic protocol test criteria and evaluation of material performance in the form of resilient modulus and moisture trends captured during long term laboratory curing, findings regarding BSM-foam were summarised in the following tables and sections:

94
Table 6.17 BSM-foam (30˚C): Unsealed curing protocol improvement data
Active Filler Briquettes Moisture % OMC Mr (MPa) Moisture % OMC Mr (MPa) Moisture % OMC Mr (MPa) Moisture % OMC Mr (MPa) Moisture % OMC Mr (MPa)
Briquette 1 3.5% 68.0% 354 1.9% 36.7% 349 1.5% 29.3% 456 1.3% 24.4% 474 0.7% 14.5% 6751% Lime Briquette 2 3.4% 67.0% 345 2.0% 38.9% 369 1.5% 29.7% 494 1.3% 24.6% 495 0.9% 17.0% 519
Briquette 3 3.4% 66.2% 323 2.0% 39.3% 387 1.6% 30.5% 485 1.3% 25.4% 469 0.9% 17.2% 489
Average 3.4% 67.1% 341 2.0% 38.3% 368 1.5% 29.8% 478 1.3% 24.8% 479 0.8% 16.2% 561Std Dev 0.05% 16 0.07% 19 0.03% 20 0.03% 14 0.08% 100Cov 1.3% 4.68% 3.6% 5.16% 2.0% 4.15% 2.1% 2.88% 9.4% 17.80%
Briquette 1 3.6% 69.9% 289 2.2% 43.8% 418 1.6% 30.9% 484 1.3% 24.4% 420 0.8% 15.6% 5381% Cement Briquette 2 3.6% 69.7% 254 2.2% 42.4% 462 1.5% 28.9% 511 1.2% 22.5% 521 0.7% 14.3% 468
Briquette 3 3.5% 68.2% 255 2.2% 42.8% 512 1.5% 28.3% 569 1.1% 21.3% 510 0.7% 12.7% 565
Average 3.5% 69.3% 266 2.2% 43.0% 464 1.5% 29.4% 521 1.2% 22.7% 484 0.7% 14.2% 524Std Dev 0.05% 20 0.04% 47 0.07% 43 0.08% 55 0.08% 50Cov 1.4% 7.49% 1.6% 10.14% 4.5% 8.33% 6.9% 11.46% 10.3% 9.56%
Briquette 1 3.6% 69.9% 318 2.3% 43.9% 382 1.6% 31.6% 485 1.3% 25.2% 448 0.8% 16.2% 479No Active Filler Briquette 2 3.4% 66.6% 282 2.0% 38.5% 362 1.4% 27.3% 574 1.1% 21.1% 584 0.6% 12.3% 580
Briquette 3 3.4% 65.6% 325 2.1% 40.4% 385 1.4% 28.1% 392 1.1% 21.7% 529 0.7% 12.9% 539
Average 3.5% 67.4% 308 2.1% 41.0% 376 1.5% 29.0% 484 1.2% 22.7% 520 0.7% 13.8% 533Std Dev 0.12% 23 0.14% 13 0.12% 91 0.11% 68 0.11% 51Cov 3.3% 7.48% 6.8% 3.32% 7.9% 18.82% 9.8% 13.15% 15.3% 9.54%
BSM-foam: 30 ◦C Curing Temperature Data
0 1 2 3 7Day

95
Table 6.18 BSM-foam (40˚C): Unsealed curing protocol improvement data
Active Filler Briquettes Moisture % OMC Mr (MPa) Moisture % OMC Mr (MPa) Moisture % OMC Mr (MPa) Moisture % OMC Mr (MPa) Moisture % OMC Mr (MPa)
Briquette 1 3.5% 68.0% 312 1.9% 36.5% 339 1.3% 25.0% 559 0.9% 18.4% 584 0.4% 8.2% 616
1% Lime Briquette 2 3.5% 68.8% 312 1.8% 35.5% 334 1.3% 25.6% 661 1.0% 19.3% 582 0.5% 9.2% 627
Briquette 3 3.3% 65.2% 285 1.5% 28.9% 353 0.9% 18.4% 619 0.7% 12.9% 738 0.2% 3.5% 841
Average 3.4% 67.3% 303 1.7% 33.7% 342 1.2% 23.0% 613 0.9% 16.9% 635 0.4% 7.0% 695
Std Dev 0.09% 16 0.21% 10 0.21% 51 0.18% 89 0.16% 127
Cov 2.7% 5.14% 12.3% 2.88% 17.5% 8.36% 20.6% 14.10% 43.5% 18.26%
Briquette 1 3.6% 70.9% 326 1.7% 33.0% 424 1.0% 20.1% 565 0.7% 14.5% 595 0.3% 6.4% 754
1% Cement Briquette 2 3.7% 72.9% 289 1.8% 34.4% 295 1.2% 23.4% 395 0.9% 17.8% 565 0.5% 10.0% 607
Briquette 3 3.9% 75.4% 282 1.9% 36.3% 384 1.3% 25.2% 418 1.0% 19.9% 513 0.7% 12.9% 755
Average 3.7% 73.0% 299 1.8% 34.6% 368 1.2% 22.9% 459 0.9% 17.4% 558 0.5% 9.8% 705
Std Dev 0.12% 24 0.09% 66 0.13% 92 0.14% 41 0.17% 85
Cov 3.1% 7.91% 4.8% 17.96% 11.3% 20.08% 15.9% 7.44% 33.0% 12.07%
Briquette 1 3.5% 68.9% 356 1.6% 30.3% 236 0.9% 18.2% 594 0.6% 12.5% 717 0.3% 5.3% 696
No Active Filler Briquette 2 3.5% 67.6% 276 1.5% 29.3% 457 0.9% 17.8% 470 0.6% 12.3% 433 0.3% 5.3% 595
Briquette 3 3.9% 75.4% 287 1.8% 34.8% 327 1.2% 24.2% 429 1.0% 19.1% 432 0.6% 12.5% 671
Average 3.6% 70.6% 306 1.6% 31.4% 340 1.0% 20.1% 498 0.8% 14.6% 527 0.4% 7.7% 654
Std Dev 0.21% 43 0.15% 111 0.19% 86 0.20% 164 0.21% 53
Cov 5.9% 14.16% 9.3% 32.67% 18.0% 17.26% 26.6% 31.15% 54.3% 8.04%
BSM-foam: 40 ◦C Curing Temperature Data0Day 1 2 3 7

96
• Laboratory moisture trends In terms of generated results, laboratory moisture trends have confirmed that from the onset, BSM-foam cures at different rates between samples exposed to 30˚C and 40˚C curing temperatures. Accordingly, both curing temperatures impact on the types of moisture trends generated, with the key distinguishing factor being the intensity of drop in moisture contents from the time of compaction. Figure 6.18 illustrates the differences in generated moisture trends between the two selected curing temperatures. In this instance, both presences of active fillers higher curing temperatures have subsequently influenced final retained moisture contents.
0%
5%
10%
15%
20%
25%
30%
35%
40%
45%
50%
55%
60%
65%
70%
75%
80%
85%
90%
0 0.5 1 1.5 2 2.5 3 3.5 4 4.5 5 5.5 6 6.5 7
% OMC
Number of Curing Days in Draft Oven [unsealed])
BSM-foam: Laboratory %OMC Trends
1% Lime 1% Cement No Active Filler
30˚C40˚C
Figure 6.18 BSM-foam: Laboratory protocol improvements moisture trends
Taking a closer look at generated moisture trends, there seems to be little differences between samples curing at similar temperatures over the analysis period. The noticeable behaviour seems to take place irrespective of presence of different active fillers, especially within the first 24 hours of curing. Observations of the 30˚C moisture trend lines reveal close correlations between different active fillers in the first 24 hours. Similar conclusions can be drawn for the 40˚C moisture trend lines, with the exception of cement samples behaving differently from the onset.

97
Presence of active fillers seems to only affect moisture trends beyond the 24 hours boundary line. Nonetheless, the differences in terms of generated moisture trends induced by presence of active fillers between similar curing temperatures show little variability over the duration of the analysis period. Although the observed findings are not exaggerated, samples treated with active filler seem to lock in more moisture during the analysis period. In terms of temperature influences, the drop in moisture contents in the first 24 hours between samples cured at 40˚C is excessive when compared to the 30˚C cured samples. On average, the drop in %OMC from 3 days to 7 days curing periods is in the vicinity of 5% OMC. The 5% OMC drop in moisture content when averaged over 4 days translates into 1.25% OMC drop in moisture content per day. The noticeable reduced curing rates suggest that samples are still curing and that the long term equilibrium moisture content is not yet reached. Consequently, samples will continue to cure until all moisture is driven out. These observations make sense since in the laboratory environment; the unsealed specimens lack the protection from temperature effects. In other words, sealing of specimens is equally important to help generate some level of moisture stability during the curing process. Drying out samples will generally not replicate field behaviour, as field EMC always maintains some levels of moisture inside BSMs. • Laboratory resilient modulus trends Laboratory findings for BSM-foam have confirmed that different curing temperatures have influences on the types of resilient modulus trends generated during the curing phase. The gradient of increase for resilient modulus trends from the initial curing phase is attributed to both curing temperature and active filler influences. Figure 6.19 illustrates the profound differences in resilient modulus trends observed during the curing analysis period. On average, laboratory resilient modulus trends doubled during the curing phase.

98
250
300
350
400
450
500
550
600
650
700
750
0 0.5 1 1.5 2 2.5 3 3.5 4 4.5 5 5.5 6 6.5 7
Mr (MPa)
Number of Curing Days in Draft Oven [Unsealed)]
BAM-foam: Laboratory Mr Trends
1% Lime 1% Cement No Active Filler
30˚C40˚C
Figure 6.19 BSM-foam: Laboratory protocol improvements resilient modulus trends
Laboratory curing temperature impacts on resilient modulus trends from the onset. Observations of samples without active filler reveal that mixes cured at 40˚C resemble final resilient modulus values which are 20% higher in magnitude when compared to the 30˚C cured samples. Accordingly, the rapid curing of briquettes subject to 40˚C curing temperatures attributes to higher resilient modulus values due to higher levels of moisture loss taking place. The initial steep resilient modulus gradient across all samples resembles rapid stiffening behaviour of briquettes taking place within the first 48 hours of curing. Resilient modulus trends seem to generally continue in their stiffening behaviour beyond the 3 and 7 days of unsealed curing. On average, the change in resilient modulus growth from 3 to 7 days increased by 10% for the case of the 30˚C cured samples when compared to 15% increase observed between the 40˚C cured samples. The minimal stiffening effect of samples should generally continue past the 7 day barrier since OMC trends revealed that unsealed samples were still continuing to cure despite the fact that excess moisture had already been released during the initial stages. Generally speaking, samples cured at similar curing temperatures seem to assume identical resilient modulus gradients from the first 24 hours onwards. On average, samples treated with lime, cement and no active filler and cured at 30˚C continued their identical gradual increases in resilient modulus trends throughout the curing phase. Similar behaviour seems to equally dominate the 40˚C cured samples.

99
In terms of active filler influences and contrary to moisture trends, the presence of active filler has profound impact on resilient modulus trends. Cement and lime contribute to higher resilient modulus values, with lime mixes performing better than cement mixes between the 40˚C cured samples. Accordingly, both lime and cement seem to have modifying properties over hornfels graded crushed rock material. • Laboratory interactions of resilient modulus and moisture trends Following findings elaborated in previous sections, it because necessary to understand interactions between resilient modulus and moisture trends. Figure 6.20 illustrates the said interactions.
200
250
300
350
400
450
500
550
600
650
700
750
800
5% 10% 15% 20% 25% 30% 35% 40% 45% 50% 55% 60% 65% 70% 75% 80%
Mr (M
Pa)
%OMC during 7 Day Curing [nsealed]
BSM-foam
1% Lime Briquettes: 40 C 1% Cement Briquettes: 40 C No Active Filler Briquettes: 40 C
30˚C
40˚C
Figure 6.20 BSM-foam: Laboratory resilient modulus interactions with moisture trends
The observed trends in Figure 6.20 suggest that in terms of resilient modulus growth attributed to moisture loss between the 40-70% OMC range, the 30˚C cured samples resemble similar resilient modulus growth when compared to the 40˚C cured samples. Interestingly, the drop in moisture contents from 70-40% OMC resembles the first 24 hours of laboratory curing. In this region, there is no presence of tangible differences in generated resilient modulus trends between the two curing temperatures. Larger differences in resilient modulus trends seem to dominate material behaviour beyond the 40-10% OMC or 24-168 hours equivalent, with the 40˚C cured samples dominating higher values of resilient modulus.

100
In terms of active filler influences on material performance, cement and lime contribute to rapid growth in resilient modulus trends, especially in the final curing stages where moisture content is in the vicinity of 25-10% OMC.
6.9.2 BSM-emulsion Laboratory Trends
BSM-emulsion followed similar test criteria outlined in previous sections concerning BSM-foam. The following tables and sections highlight findings of BSM-emulsion observed during the curing phases:

101
Table 6.19 BSM-emulsion (30˚C): Unsealed curing protocol improvement data
Active Filler Briquettes Moisture % OMC Mr (MPa) Moisture % OMC Mr (MPa) Moisture % OMC Mr (MPa) Moisture % OMC Mr (MPa) Moisture % OMC Mr (MPa)
Briquette 1 3.7% 71.9% 345 2.6% 50.6% 408 2.2% 42.8% 564 1.8% 35.9% 637 1.2% 23.6% 6311% Lime Briquette 2 3.6% 71.1% 279 2.5% 49.0% 472 2.1% 41.8% 442 1.8% 35.0% 472 1.2% 22.5% 610
Briquette 3 3.7% 71.3% 224 2.5% 48.6% 360 2.1% 40.6% 350 1.8% 34.6% 494 1.2% 23.0% 561
Average 3.7% 71.4% 283 2.5% 49.4% 413 2.1% 41.7% 452 1.8% 35.2% 534 1.2% 23.0% 601Std Dev 0.02% 61 0.05% 56 0.06% 107 0.04% 90 0.03% 36Cov 0.6% 21.43% 2.1% 13.59% 2.6% 23.75% 2.0% 16.77% 2.5% 5.98%
Briquette 1 3.7% 71.9% 259 2.7% 51.8% 560 1.9% 37.7% 448 1.5% 29.1% 406 0.9% 17.6% 6151% Cement Briquette 2 3.7% 71.7% 352 2.7% 52.3% 366 2.0% 38.5% 698 1.5% 28.9% 698 0.9% 17.2% 664
Briquette 3 3.7% 71.5% 341 2.7% 53.5% 384 2.0% 38.1% 431 1.5% 29.7% 459 0.9% 18.0% 617
Average 3.7% 71.7% 317 2.7% 52.5% 437 2.0% 38.1% 526 1.5% 29.2% 521 0.9% 17.6% 632Std Dev 0.01% 51 0.05% 107 0.02% 149 0.02% 156 0.02% 28Cov 0.3% 16.01% 1.7% 24.55% 1.0% 28.44% 1.4% 29.86% 2.2% 4.39%
Briquette 1 3.7% 71.7% 468 2.8% 54.1% 389 1.9% 36.9% 465 1.5% 29.3% 524 0.9% 17.0% 602No Active Filler Briquette 2 3.7% 73.0% 319 2.8% 55.3% 386 2.0% 39.1% 474 1.6% 31.6% 516 1.0% 18.9% 549
Briquette 3 3.8% 75.0% 285 2.9% 56.1% 312 2.0% 39.8% 480 1.7% 32.8% 411 1.0% 20.3% 631
Average 3.8% 73.2% 357 2.8% 55.1% 362 2.0% 38.6% 473 1.6% 31.3% 484 1.0% 18.8% 594Std Dev 0.09% 97 0.05% 44 0.08% 8 0.09% 63 0.09% 42Cov 2.3% 27.24% 1.8% 12.04% 3.9% 1.60% 5.7% 13.04% 8.9% 7.00%
BSM-emulsion: 30 ◦C Curing Temperature Data
Day 0 1 2 3 7

102
Table 6.20 BSM-emulsion (40˚C): Unsealed curing protocol improvement data
Active Filler Briquettes Moisture % OMC Mr (MPa) Moisture % OMC Mr (MPa) Moisture % OMC Mr (MPa) Moisture % OMC Mr (MPa) Moisture % OMC Mr (MPa)
Briquette 1 3.7% 72.7% 353 2.1% 40.2% 410 1.5% 29.7% 543 1.3% 24.4% 431 0.8% 14.8% 6271% Lime Briquette 2 3.6% 70.9% 353 1.9% 37.9% 407 1.4% 27.5% 562 1.2% 22.5% 534 0.7% 13.3% 617
Briquette 3 3.6% 70.9% 405 1.9% 37.7% 440 1.5% 28.9% 425 1.2% 23.2% 526 0.7% 13.5% 652
Average 3.7% 71.5% 370 2.0% 38.6% 419 1.5% 28.7% 510 1.2% 23.4% 497 0.7% 13.9% 632Std Dev 0.05% 30 0.07% 18 0.06% 74 0.05% 57 0.04% 18Cov 1.4% 8.11% 3.7% 4.36% 3.8% 14.55% 4.2% 11.53% 6.1% 2.85%
Briquette 1 3.7% 72.7% 271 1.9% 36.5% 458 1.3% 24.4% 475 1.0% 18.8% 576 0.5% 10.4% 6161% Cement Briquette 2 3.6% 70.5% 279 1.6% 31.8% 375 1.1% 22.1% 501 0.8% 16.0% 450 0.4% 7.8% 683
Briquette 3 3.7% 72.5% 274 1.9% 36.1% 396 1.2% 24.0% 561 0.9% 18.2% 573 0.5% 10.2% 641
Average 3.7% 71.9% 275 1.8% 34.8% 410 1.2% 23.5% 512 0.9% 17.6% 533 0.5% 9.4% 647Std Dev 0.06% 4 0.13% 43 0.06% 44 0.07% 72 0.07% 34Cov 1.7% 1.47% 7.5% 10.53% 5.3% 8.61% 8.2% 13.49% 15.0% 5.24%
Briquette 1 3.8% 74.2% 228 1.9% 37.7% 432 1.3% 25.2% 371 1.0% 19.1% 405 0.6% 10.9% 630No Active Filler Briquette 2 4.0% 78.7% 334 2.1% 41.8% 371 1.5% 29.7% 408 1.2% 24.0% 571 0.8% 16.0% 627
Briquette 3 4.0% 77.7% 233 2.1% 41.4% 402 1.5% 29.5% 417 1.2% 23.6% 677 0.8% 15.6% 605
Average 3.9% 76.9% 265 2.1% 40.3% 402 1.4% 28.1% 399 1.1% 22.3% 551 0.7% 14.2% 621Std Dev 0.12% 60 0.12% 31 0.13% 24 0.14% 137 0.14% 14Cov 3.1% 22.57% 5.6% 7.59% 9.0% 6.12% 12.2% 24.88% 19.9% 2.20%
BSM-emulsion: 40 ◦C Curing Temperature Data
Day 0 1 2 3 7
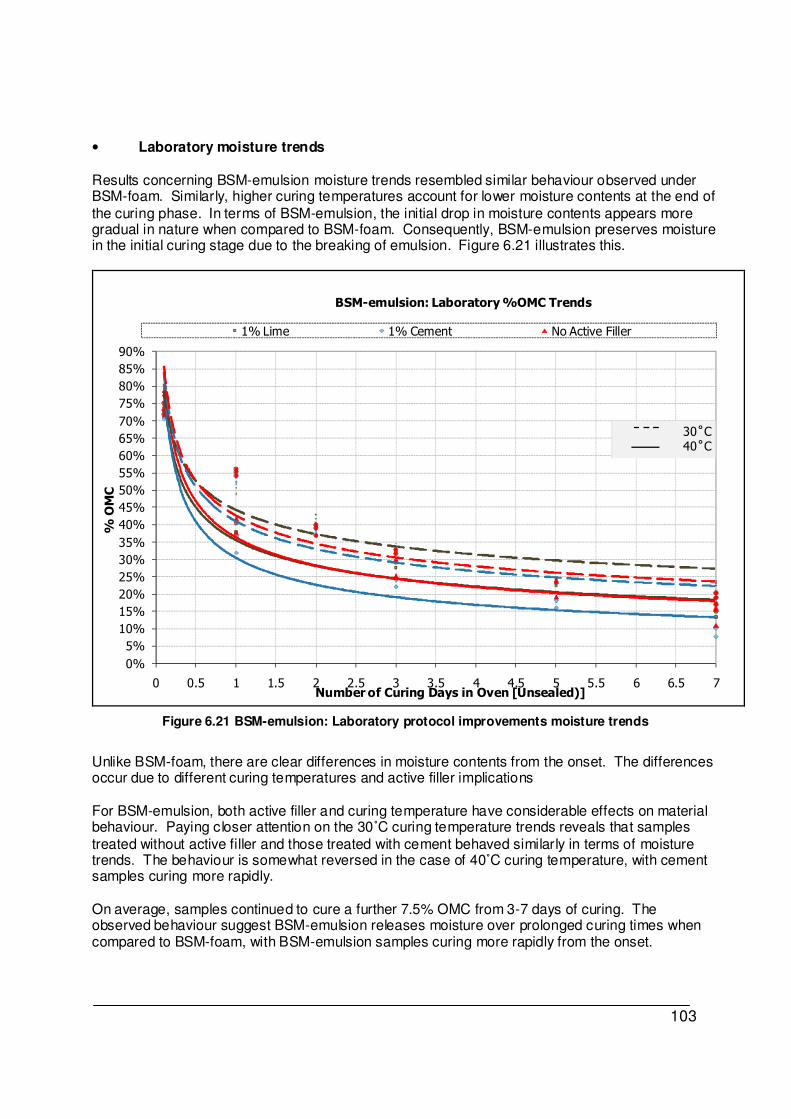
103
• Laboratory moisture trends Results concerning BSM-emulsion moisture trends resembled similar behaviour observed under BSM-foam. Similarly, higher curing temperatures account for lower moisture contents at the end of the curing phase. In terms of BSM-emulsion, the initial drop in moisture contents appears more gradual in nature when compared to BSM-foam. Consequently, BSM-emulsion preserves moisture in the initial curing stage due to the breaking of emulsion. Figure 6.21 illustrates this.
0%
5%
10%
15%
20%
25%
30%
35%
40%
45%
50%
55%
60%
65%
70%
75%
80%
85%
90%
0 0.5 1 1.5 2 2.5 3 3.5 4 4.5 5 5.5 6 6.5 7
% OMC
Number of Curing Days in Oven [Unsealed)]
BSM-emulsion: Laboratory %OMC Trends
1% Lime 1% Cement No Active Filler
30˚C40˚C
Figure 6.21 BSM-emulsion: Laboratory protocol improvements moisture trends
Unlike BSM-foam, there are clear differences in moisture contents from the onset. The differences occur due to different curing temperatures and active filler implications For BSM-emulsion, both active filler and curing temperature have considerable effects on material behaviour. Paying closer attention on the 30˚C curing temperature trends reveals that samples treated without active filler and those treated with cement behaved similarly in terms of moisture trends. The behaviour is somewhat reversed in the case of 40˚C curing temperature, with cement samples curing more rapidly. On average, samples continued to cure a further 7.5% OMC from 3-7 days of curing. The observed behaviour suggest BSM-emulsion releases moisture over prolonged curing times when compared to BSM-foam, with BSM-emulsion samples curing more rapidly from the onset.

104
• Laboratory resilient modulus trends BSM-emulsion revealed close correlation across spectrum in terms of resilient modulus trends when compared to BSM-foam. The observed gradients of increase in resilient modulus trends reveal similar behaviour across spectrum. At similar curing temperatures, the breaking of BSM-emulsion in the initial curing stages seems to contribute to similar resilient modulus trends in the short term. Trends seem to evolve into their individual patterns once the breaking of emulsion has concluded, with resilient modulus stiffening past the 7 day barrier.
200
250
300
350
400
450
500
550
600
650
700
0 0.5 1 1.5 2 2.5 3 3.5 4 4.5 5 5.5 6 6.5 7
Mr (MPa)
Number of Curing Days in Draft Oven [Unsealed]
BSM-emulsion: Laboratory Mr Trends
No Active Filler 1% Cement 1% Lime
30˚C
40˚C
Figure 6.22 BSM-emulsion: Laboratory protocol improvements resilient modulus trends
Trends observed in Figure 6.22 reveal that samples cured at 40˚C contribute to higher resilient modulus values at the end of the analysis period when compared to the 30˚C cured samples. Similar behaviour was observed regarding BSM-foam, with the 40˚C cured samples resembling higher resilient modulus values, a factor attributed to samples curing more rapidly at these temperatures. Similar to BSM-foam behaviour, BSM-emulsion resilient modulus values doubled in the final stages of curing. Comparing the two material types, BSM-foam resembled higher resilient modulus values, especially in the final stages of curing. In terms of gradient of trends, BSM-emulsion resembles a gradual increase in resilient modulus trends over the analysis period. On average, the

105
observed trends show that the 40˚C cured samples are generally 10% higher in magnitude when compared to the 30˚C cured samples. Overall, BSM-emulsion resembled consistent gradual increase in resilient modulus trends, emphasizing the nature of curing mechanisms inherent in BSM-emulsion. Curing of BSM-foam is a function of water repulsion, with active filler dominating material performance almost immediately. On the other hand, curing of BSM-emulsion is both a function of the breaking of emulsion in the initial curing phase and the gradual release of moisture with time. For BSM-emulsion, both combinations of curing mechanisms seem to delay the working action of active filler, with resilient modulus trends only resembling active filler influences past the breaking of the emulsion cycle. • Laboratory interactions of resilient modulus and moisture trends In terms of BSM-emulsion, interactions between laboratory resilient modulus and moisture trends reveal that the slopes of increase in resilient modulus trends differs between the 30˚C and 40˚C curing temperatures. The noticeable behaviour conflicts with findings observed under BSM-foam, where the gradient of growth in resilient modulus trends across spectrum revealed similar behaviour irrespective of active filler and curing temperature influences.
200
250
300
350
400
450
500
550
600
650
700
750
800
10% 15% 20% 25% 30% 35% 40% 45% 50% 55% 60% 65% 70% 75% 80%
Mr (MPa)
%OMC during 7 Day Curing [Unsealed]
BSM-emulsion
1% Lime 1% Cement No Active Filler
30˚C
40˚C
Figure 6.23 BSM-emulsion: Laboratory resilient modulus interactions with moisture trends
For BSM-emulsion, generated variable resilient modulus slopes of increase relative to moisture loss suggest that the breaking of emulsion during the curing phase has different effects on resilient modulus patterns. The observed behaviour seems to generally depend on the selected curing

106
temperature, with both the 30˚C and 40˚C cured samples resembling identical patterns within similar curing temperatures. The observed behaviour resembles conflicting patters when comparing the 30˚C and 40˚C cured samples. On average, the 40˚C slopes of increase in resilient modulus trends were more gradual when compared to more steep trends observed in the case of the 30˚C cured samples. 6.10 Discussions In order to adequately draw conclusions on findings observed during the analysis of laboratory resilient modulus and moistures trends, the following set of criteria have been formulated to address objectives outlined in the solution flowchart presented in Figure 6.1: • Unification of BSM Curing Protocol Laboratory results have confirmed that the different nature of curing mechanisms inherent in both BSM-foam and BSM-emulsion contributes to different material behaviour in terms of generated laboratory moisture and resilient modulus patterns. In addition, the inclusion of active filler in BSMs has different effects depending on the type of binder selected. Results have confirmed that curing of BSM-foam is largely a function of water repulsion, with active filler dominating material performance almost immediately. Unlike BSM-foam, curing of BSM-emulsion is both a function of the breaking of emulsion during the initial phase and the gradual release of moisture with time. In this instance, BSM-emulsion resilient modulus trends seem to largely resemble active filler influences past the breaking of the emulsion cycle. Given the above differences in observed material behaviour(s), the unification of laboratory accelerated curing protocol for BSMs is currently not feasible. Single unified laboratory curing protocol will unlikely have the desired effect on both types of binders in terms of generated laboratory resilient modulus and moisture trends reflective of field behaviour, especially given the complex material behaviour observed during the laboratory investigation phase. • Derivation of parameters regarding compilation of draft curing protocol Observations of laboratory results confirm the following parameters as key factors to consider when reconciling laboratory and field behaviour(s): a) Laboratory Curing Temperature(s) Depending on field temperatures, selection of appropriate laboratory curing temperature must satisfy material performance linked to field behaviour in terms of the types of generated resilient modulus and moisture trends. As a result, both 30˚C and 40˚C curing temperatures will be utilized in the formulation of the laboratory curing protocol, as material behaviour in terms of generated laboratory resilient modulus and moisture trends confirmed similar patterns observed in the field under similar curing conditions.

107
b) Relative Humidity Considerations The observed laboratory moisture trends were subject to unsealed curing conditions. As a result, samples continued curing past the 7 day barrier, with final %OMC in the vicinity of ±10%. By speculation, it is highly unlikely that field EMC will yield ±10% OMC conditions. For this reason, laboratory samples need to be protected against the drying effects of temperature during the curing process. Consequently, for purposes of generating realistic residual moisture contents commonly observed in the field, the action of simulating some levels of relative humidity conditions during the curing phase will be implemented. In this way, samples will be protected against temperature effects similar to the sealing of field BSM-emulsion with HMA. Although field relative humidity proved unreliable in terms of providing clear understanding regarding the simulation of curing mechanisms in the laboratory, the sealing of field BSM-emulsion suggest that relative humidity conditions were maintained during the curing process. For this reason, relative humidity conditions of ±100% will be maintained during the formulation of laboratory curing protocol. c) Active Filler Considerations In terms of the objectives outlined in the thesis, active filler considerations when performing laboratory curing protocol will be accommodated. In terms of the observed laboratory trends for BSMs, active filler has strong effects on generated resilient modulus and moisture trends. Consequently, active filler in the form of lime and cement will be accommodated during formulation of the laboratory curing protocol.

108
7 RECONCILIATION OF FIELD AND LABORATORY ENVIRONMENTS
Following findings outlined in both Chapter 5 [Field Monitoring and Improvement] and Chapter 6 [Laboratory Investigations and Curing Protocol Improvements], formulation of draft laboratory accelerated curing protocol was achieved by reconciling field and laboratory environments. Reconciliation of field and laboratory environments was primarily guided by literature and observations made during field investigations and laboratory experimentation phases. Field investigations and findings have primarily influenced the outcome of the research. In terms of material properties, field investigations covered newly constructed BSM-emulsion northbound section along the N7 carriageway towards Malmesbury. In addition, research conducted by CSIR provided research data for the BSM-foam southbound section. In terms of management of research investigations, BSM-emulsion section provided the primary findings through initial laboratory investigations taking place prior to the construction phase. The following aspects were covered: • In situ roadbed moisture levels
• Residual binder content • Residual density profiles • Parent rock characteristics • Field monitoring of material properties pre and post construction phases Field findings regarding BSM-emulsion behaviour helped configure formulation of laboratory accelerated curing protocol for BSM-emulsion. In terms of BSM-foam, research conducted by CSIR provided the following aspects of research data: • In situ BSM-foam resilient modulus data • Comprehensive research data dating back to 2002 [time of construction] Field data for BSM-foam conducted by CSIR helped develop laboratory accelerated curing protocol for BSM. In addition, aspects regarding reconciliation of field and laboratory environments for BSM-foam were thoroughly addressed. In terms of the way forward, the following sections highlight how the aspect of “reconciliation of field and laboratory trends” was approached and managed in terms of formulating laboratory accelerated curing protocol for BSMs:

109
7.1 Selection of Curing Temperature (s) Laboratory applications of appropriate curing temperatures were mainly guided and validated by research data extracted from in situ temperature and relative humidity buttons. Studying of field temperature and relative humidity patterns helped guide the selection of appropriate laboratory curing temperatures reflective of in situ behaviour. As a result, the 30˚C and 40˚C curing temperatures were selected for laboratory applications following validation by field temperature data. In terms of applications of selected laboratory curing temperatures, the interactions of curing temperatures versus laboratory moisture and resilient modulus trends had to be finalized. For this reason, an interaction diagram in the form of the applicable curing temperature(s) and its effects on the generated resilient modulus and moisture trends was developed. For this reason, BSM-emulsion [cement] data taken from section 6.9.2 was used to help plot Figure 7.1 shown below.
200
250
300
350
400
450
500
550
600
650
700
750
5%
10%
15%
20%
25%
30%
35%
40%
45%
50%
55%
60%
65%
70%
75%
0 1 2 3 7
Mr (MPa)
%OMC
Lab Curing Time ([Days - Unsealed]
Curing Temperature Impact on Resilient Modulus and Moisture ContentBSM-emulsion: Cement Treated Briquettes
30 Degrees %OMC 40 Degrees %OMC 30 Degrees Mr 40 Degrees Mr
%OMC
Mr
%OMC
Mr
Figure 7.1 BSM-emulsion: Laboratory curing temperature(s) interactions diagram
Interactions between variable curing temperatures and the associated impact on resilient modulus and moisture trends reveal that although curing at relatively higher temperatures enhances resilient modulus material property, the corresponding rapid curing taking place ought to reflect field moisture properties. In addition, curing at relatively lower temperatures may prolong the curing process, and consequently undermine material performance in terms of the realized resilient modulus trends.

110
An important observation is in the laboratory, curing samples at 40˚C will only improve final resilient modus values by 5% whilst the associated sample’s moisture will be 10% OMC lower in values when compared to 30˚C cured samples. In other words, curing at slightly higher temperatures will not necessarily improve resilient modulus values by a significant amount. Instead, the impact on moisture contents will be more severe and noticeable. In conclusion, curing temperatures of 30˚C and 40˚C were selected and concurrently applied during formulation of laboratory accelerated curing protocol. Accordingly, different curing phases called for applications of both selected curing temperatures whilst taking cognisance of the impact temperature has on sample’s resilient modulus and moisture trends. 7.2 Moisture and Relative Humidity Considerations
Replication of field moisture properties in the laboratory was achieved by studying BSM-emulsion field moisture patterns illustrated in Figure 7.2. Observation show that the optimum moisture curve evolved from ±75% during construction to± 50 % after 8 months of service period.
45%
48%
50%
53%
55%
58%
60%
63%
65%
68%
70%
73%
75%
78%
80%
83%
85%
0 10 20 30 40 50 60 70 80 90 100 110 120 130 140 150 160 170 180 190 200 210 220 230 240
% OMC
Time (days)
BSM-emulsion[cement]
Figure 7.2 BSM-emulsion: Field moisture trend
In terms replicating the observed trend in the laboratory, it was necessary to isolate construction activities into unsealed BSM-emulsion and sealed BSM-emulsion phases. During the two different phases, construction activities impacted on the types of generated moisture trends. In terms of replicating and managing the said processes in the laboratory environment, the following interventions were taken:

111
I. Unsealed Field BSM-emulsion Phase Construction activities maintained that during this phase BSM-emulsion be exposed to in situ climate conditions for ±14 days to help accelerate the curing of roadbed in the short term. As a result, the initial decrease in field %OMC was primarily due to field exposure of atmospheric temperatures that ranged between 20◦C and 30◦C. The observed field atmospheric temperatures represent Cape Town’s March - April temperatures. Although field relative humidity conditions were not physically measured during this phase, it was decided that for purposes of replicating field conditions in the laboratory environment, the initial curing phase will be mainly driven by the selected curing temperature. In terms of replicating the initial 14 days of BSM-emulsion exposure to field atmospheric temperatures in the laboratory, the following interventions were taken: • Selected Curing Temperature : 30 ◦C
• Relative Humidity Conditions : Unsealed • Target Moisture from Compaction : 60 - 50% OMC • Applicable Curing Time : Variable between BSM-emulsion and BSM-Foam II. Sealed Field BSM-emulsion Phase
In terms of construction activities and upon conclusion of moisture extraction from the roadbed, primer application followed immediately, with HMA being laid successively. Once HMA was laid, the prolonged curing phase of BSM-emulsion commenced. In this phase varied, moisture content shifted from 60-50% OMC in a period of 7 months. During the sealed prolonged curing phase, field relative humidity data revealed fluctuating values varying between 70-100% whilst BSM-emulsion temperatures fluctuated between 10 - 38.5˚C. Regarding the selection of appropriate temperature in this phase, it was decided that 40˚C would best replicate field behaviour whilst simultaneously achieving accelerated curing in the laboratory. In terms of the Western Cape climate, it was assumed that field temperature data will generally resemble BSM-emulsion temperatures that are well above 40˚C during the January and February summer temperatures. For this reason, although the 40˚C was not evident during field temperature analysis, it was decided that the observed 38.5˚C may be rounded off to 40˚C curing temperature. This intervention was also taken following concerns to simplify the curing protocol. In terms of replicating field conditions in the laboratory, it was decided that for purposes of formulating laboratory accelerated curing protocol, the initial phase be dominated by both relative humidity considerations and the applicable curing temperature. As a result, the following interventions were taken in the laboratory: • Selected Curing Temperature : 40 ◦C
• Relative Humidity Conditions : Sealed • Target Moisture from Compaction : 50 - 45% OMC • Applicable Curing Time : Variable between BSM-emulsion and BSM-Foam

112
7.3 Resilient Modulus Considerations Findings have revealed that despite countless endeavours taken to produce laboratory resilient modulus trends reflective of field resilient modulus values, the differences in the method of resilient modulus acquisitions between laboratory and field environments produced values that are irreconcilable. Generally speaking, field modulus values have illustrated profound growth attributed to field curing of BSM-emulsion whilst laboratory trends have only illustrated values much lower in magnitude compared to field observations. Interestingly, the noticeable growth in field resilient modulus trend occurred at similar moisture contents achievable in the laboratory. In the endeavour to explain the said differences, the following factors played a significant role in maintaining that laboratory and field resilient modulus trends were irreconcilable in terms of absolute values:
• Field terrain characteristics versus laboratory samples • Method of resilient modulus measurements: Laboratory Short Dynamic Loading Analysis (MTS)
versus High Frequency Wave Measurements in the field [PSPA] Field terrain characteristics compared to laboratory samples are inherently different. Field terrain has compositions of different pavement layers coupled with complex parent rock characteristics. In the laboratory, samples are a function of simple compacted layers with well defined grading properties. In the laboratory, the endeavour to try and replicate similar resilient modulus values has proven to be a futile exercise. In addition, the PSPA device utilises high frequency wavelengths with magnitudes of 20 MHz inside field BSM-emulsion to captured material’s resilient modulus, whilst the laboratory MTS setup measures material’s strain during the upload cycle under sine wave loading at a magnitude of 2 Hz to help generate material’s resilient modulus. In terms of reconciling field and laboratory resilient modulus behaviour, it was decided that for the purpose of formulating laboratory accelerated curing protocol, field and laboratory resilient modulus trends rather than absolute values be implemented as benchmark for laboratory curing validation. In closure, resilient modulus data measured with different scientific equipments have always proven difficult to reconcile. In practice, both FWD and PSPA resilient modulus have always resulted in higher values when compared to laboratory equipment. For this reason, generated trends between laboratory MTS and field PSPA will be compared in this study.

113
• BSM-emulsion Following the abovementioned interventions, field resilient modulus trends for BSM-emulsion were revisited.
Mr = k1Tcuringk2
Method Material k1 k2 R2
Field PSPA BSM-emulsion Cement 702.4 0.250 0.87
Figure 7.3 BSM-emulsion: Field resilient modulus trend
Field resilient modulus trends illustrate that on average, resilient modulus behaviour of good quality crushed rock treated with cement as active filler increased 3 fold from the time of construction within a period of 8 months. In terms of relating field BSM-emulsion trend to laboratory samples, it was decided that resilient modulus absolute values observed in the field be subdivided by some integer factor. Laboratory samples have demonstrated resilient modulus values ranging between 200-1000 MPa. For purposes of relating field and laboratory environments, it was decided that the scale of 0-1000 MPa be implemented for comparisons. In order to make logical sense or reduces BSM-emulsion trends and following the reduced scale guideline, field BSM-emulsion absolute values were reduced by a factor of 3. By implementing the said intervention, field BSM-emulsion resilient modulus trend was reconciled with laboratory resilient modulus behaviour.
500
750
1000
1250
1500
1750
2000
2250
2500
2750
3000
3250
3500
0 10 20 30 40 50 60 70 80 90 100 110 120 130 140 150 160 170 180 190 200 210 220 230 240
Mr (MPa)
Time (Days)
BSM-emulsion[cement]: Field PSPA Resilient Modulus Trend

114
• BSM-foam Following guidelines outlined under BSM-emulsion, field BSM-foam resilient modulus was equally reconciled.
5000
5500
6000
6500
7000
7500
8000
8500
9000
0.0 2.0 4.0 6.0 8.0 10.0 12.0 14.0 16.0 18.0 20.0 22.0 24.0
Mr (MPa)
Time (Months)
N7 BSM-foam Section LTPP
Figure 7.4 BSM-foam: Field resilient modulus trend
Observations of BSM-foam reveal that from the time of construction, resilient modulus increased in magnitude during the curing phase from an average of 1000 – 9000 MPa. In terms of replicating field BSM-foam resilient modulus trend in the laboratory and adopting the reduced scale guideline, it was decided that for purposes of reconciling field BSM-foam to laboratory trends, field BSM-foam absolute values be reduced by a factor of 10. Implementing the said intervention maintained that field BSM-foam trends were comparable to laboratory BSM-foam samples.
Mr = k1Tcuring k2
Method Material k1 k2 R2
Field PSPA BSM-foam Cement 6504.7 0.075 0.63

115
8 FORMULATION OF DRAFT CURING PROTOCOL AND SYNTHESIS
Formulation of draft accelerated curing protocol followed processes described in Chapter 7 [Reconciliation of Field and Laboratory Environments]. Accordingly, application of the said interventions involved implementation of the following laboratory processes: • Quality Control and Monitoring Quality control regarding handling of laboratory specimens followed quality control guidelines outlined in Chapter 6 [Laboratory Investigations and Curing Protocol Improvements]. Handling of laboratory specimens involved consideration of the following aspects during production: a) Controlled grading properties b) Management of aggregate disintegrations during the vibratory compaction process c) Regulation of draft oven temperatures during the curing process d) Regulation of aggregate temperatures prior to mixing e) Regulation in terms of adequate mixing of aggregates with active filler f) Proper handling of specimens during the investigation process
• Production of Laboratory Specimens In the laboratory, production of specimens was equally guided by management of the following aspects: a) Foam Index properties b) The breaking of emulsion process c) Production of BSM-foam and BSM-emulsion specimens utilising WLB10 and pugmill mixer d) Vibratory Mod.AASHTO compaction properties • Material testing and assessments The MTS apparatus was implemented regarding testing of outcomes in terms of resilient modulus trends. The following key aspects played a significant role in this process: a) Application of the MTS short dynamic load monotonic testing protocol b) Management and processing of laboratory data c) Comparisons of laboratory and field resilient modulus and moisture trends d) Conclusions of the curing analysis Upon conclusion of the abovementioned processes, laboratory data in the form of resilient modulus and moisture trends was conceived. The generation of data helped address the given notion; has the research managed to reconcile laboratory and field properties in terms of resilient modulus and moisture trends? In terms of addressing the said notion, the following graphs and tables illustrate material behaviour in terms of laboratory and field properties:

116
Table 8.1 BSM-foam: Draft Laboratory Accelerated Curing Protocol
BSM-foam: Draft Laboratory Accelerated Curing Protocol
Day After Compaction Unsealed for 12 hrs at 30 ◦C Sealed for 24 hrs at 40 ◦C Sealed for 24 hrs at 40 ◦C
Active Type Briquettes Moisture % OMC Mr (MPa) Moisture % OMC Mr (MPa) Moisture % OMC Mr (MPa) Moisture % OMC Mr (MPa)
Briquette 1 3.5% 68.4% 491 3.0% 58.8% 500 2.9% 57.0% 603 2.8% 55.5% 620 1% Lime Briquette 2 3.5% 68.6% 441 3.0% 59.2% 520 2.9% 57.2% 619 2.9% 55.7% 627
Briquette 3 3.5% 68.8% 475 3.0% 59.0% 550 2.9% 56.8% 611 2.9% 55.9% 630
Average 3.5% 68.6% 469 3.0% 59.0% 523 2.9% 57.0% 611 2.9% 55.7% 626
Std Dev 0.0% 26 0.0% 25 0.0% 8 0.0% 5
Cov 0.3% 5.44% 0.3% 4.81% 0.3% 1.31% 0.4% 0.82%
Briquette 1 3.6% 70.2% 460 3.0% 58.4% 571 2.9% 56.6% 621 2.8% 55.3% 679 1% Cement Briquette 2 3.7% 72.2% 473 3.0% 59.5% 547 3.0% 57.6% 584 2.9% 55.7% 666
Briquette 3 3.3% 64.2% 443 2.7% 52.8% 543 2.6% 50.8% 595 2.5% 49.2% 652
Average 3.5% 68.9% 459 2.9% 56.9% 554 2.8% 55.0% 600 2.7% 53.4% 652
Std Dev 0.2% 15 0.2% 15 0.2% 19 0.2% 14
Cov 6.0% 3.28% 6.3% 2.74% 6.7% 3.17% 6.8% 2.07%
Briquette 1 3.4% 66.4% 391 2.6% 50.4% 475 2.5% 49.0% 539 2.4% 47.5% 535
No Active Filler Briquette 2 3.5% 67.9% 381 2.8% 54.1% 439 2.7% 52.3% 564 2.6% 51.0% 585
Briquette 3 3.6% 70.0% 424 2.9% 57.6% 465 2.9% 56.1% 475 2.8% 54.3% 540
Average 3.5% 68.1% 399 2.8% 54.0% 460 2.7% 52.5% 526 2.6% 50.9% 553
Std Dev 0.1% 23 0.2% 19 0.2% 46 0.2% 28
Cov 2.7% 5.64% 6.7% 4.04% 6.7% 8.73% 6.7% 4.98%

117
Table 8.2 BSM-emulsion: Draft Laboratory Accelerated Curing Protocol
BSM-emulsion: Draft Laboratory Accelerated Curing Protocol
Day After Compaction Unsealed for 20 hrs at 30 ◦C Sealed for 24 hrs at 40 ◦C Sealed for 24 hrs at 40 ◦C
Active Filler Briquettes Moisture % OMC Mr (MPa) Moisture % OMC Mr (MPa) Moisture % OMC Mr (MPa) Moisture % OMC Mr (MPa)
Briquette 1 3.62% 70.70% 383 2.83% 55.18% 450 2.72% 53.13% 510 2.64% 51.56% 539
1% Lime Briquette 2 3.87% 75.59% 392 3.02% 58.92% 500 2.93% 57.23% 568 2.85% 55.66% 562
Briquette 3 3.72% 72.66% 452 2.93% 57.17% 550 2.84% 55.47% 520 2.76% 53.91% 535
Average 3.74% 72.98% 409 2.92% 57.09% 500 2.83% 55.27% 544 2.75% 53.71% 545
Std Dev 0.13% 38 0.10% 50 0.11% 34 0.11% 15
Cov 3.37% 9.17% 3.28% 10.00% 3.72% 6.24% 3.83% 2.67%
Briquette 1 3.83% 74.80% 382 2.87% 56.07% 598 2.79% 54.49% 601 2.71% 52.93% 664
1% Cement Briquette 2 3.78% 73.83% 384 2.82% 55.06% 540 2.73% 53.32% 638 2.65% 51.76% 640
Briquette 3 3.80% 74.22% 461 2.91% 56.91% 561 2.83% 55.27% 563 2.74% 53.52% 664
Average 3.80% 74.28% 409 2.87% 56.02% 566 2.78% 54.36% 601 2.70% 52.73% 664
Std Dev 0.03% 45 0.05% 29 0.05% 38 0.05% 14
Cov 0.66% 11.01% 1.66% 5.19% 1.81% 6.24% 1.70% 2.09%
Briquette 1 3.80% 74.22% 375 2.66% 51.99% 498 2.57% 50.20% 544 2.49% 48.63% 539
No Active Filler Briquette 2 3.82% 74.61% 376 2.77% 54.00% 511 2.68% 52.34% 568 2.60% 50.78% 562
Briquette 3 3.86% 75.39% 375 3.04% 59.34% 517 2.95% 57.62% 520 2.87% 56.05% 535
Average 3.83% 74.74% 375 2.82% 55.11% 509 2.73% 53.39% 544 2.65% 51.82% 545
Std Dev 0.03% 1 0.19% 10 0.20% 24 0.20% 15
Cov 0.80% 0.15% 6.89% 1.91% 7.15% 4.41% 7.37% 2.67%

118
300
350
400
450
500
550
600
650
700
750
800
850
900
0 2 4 6 8 10 12 14 16 18 20 22 24 26 28 30 32 34 36 38 40 42 44 46 48 50 52 54 56 58 60
Mr (M
Pa)
Curing Time (Hrs)
BSM-foam: Draft Laboratory Accelerated Curing Protocol
Lime (MTS) Cem (MTS) No Active Filler (MTS) BSM-foam: Field LTPP Section
68.9 %OMC68.6 %OMC68.1 %OMC
56.9 %OMC68.6 %OMC54.0 %OMC
Sealed for 24 hours at 40˚C
Change of bags to release excess moisture
Sealed for 24 hours at 40˚C
Unsealed for 12 hours at 30˚C
55.0 %OMC56.8 %OMC52.5 %OMC
53.4 %OMC55.9 %OMC50.9 %OMC
Mr = k1Tcuring
k2
Method Material k1 k2 R2
Field PSPA Cement 631.8 0.063 0.66
Lab MTS Cement 507.5 0.054 0.87
Lab MTS Lime 506.9 0.045 0.76
Lab MTS No active filler 435.8 0.050 0.69
Figure 8.1 BSM-foam: Reconciliation of field and Laboratory resilient modulus and moisture trends
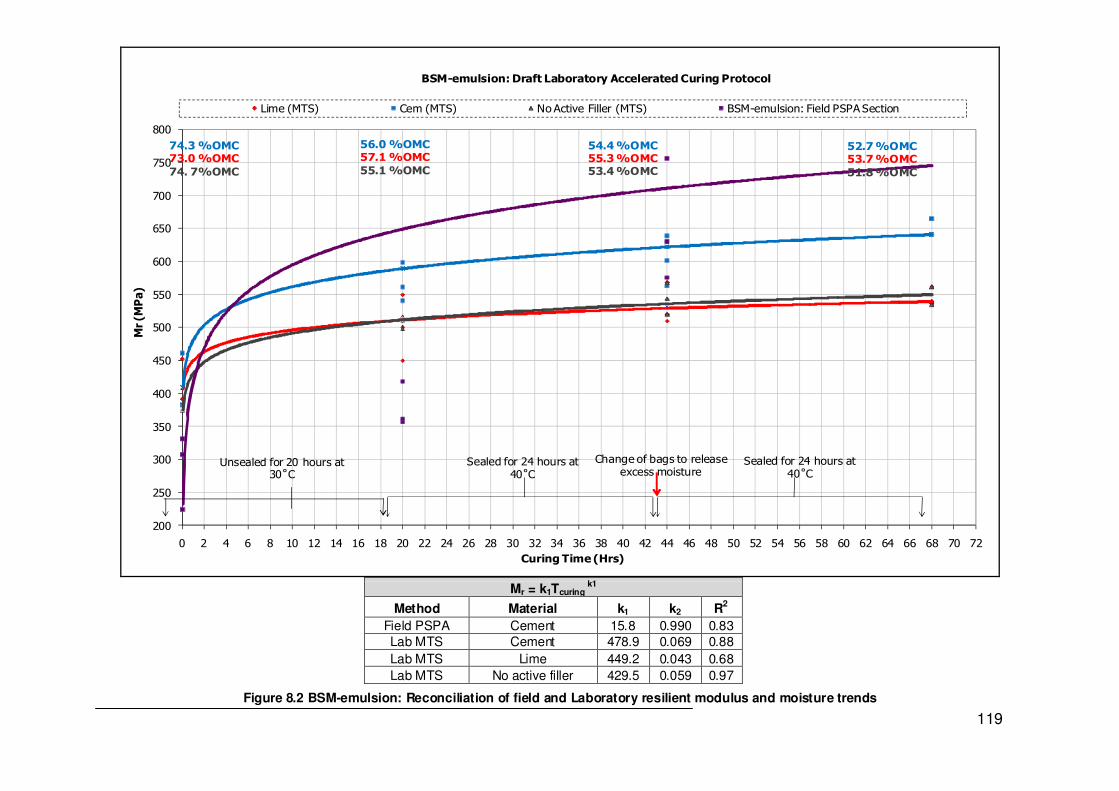
119
200
250
300
350
400
450
500
550
600
650
700
750
800
0 2 4 6 8 10 12 14 16 18 20 22 24 26 28 30 32 34 36 38 40 42 44 46 48 50 52 54 56 58 60 62 64 66 68 70 72
Mr (MPa)
Curing Time (Hrs)
BSM-emulsion: Draft Laboratory Accelerated Curing Protocol
Lime (MTS) Cem (MTS) No Active Filler (MTS) BSM-emulsion: Field PSPA Section
74.3 %OMC73.0 %OMC74. 7%OMC
56.0 %OMC57.1 %OMC55.1 %OMC
54.4 %OMC55.3 %OMC53.4 %OMC
52.7 %OMC53.7 %OMC51.8 %OMC
Unsealed for 20 hours at 30˚C
Sealed for 24 hours at 40˚C
Change of bags to release excess moisture
Sealed for 24 hours at 40˚C
Mr = k1Tcuring
k1
Method Material k1 k2 R2
Field PSPA Cement 15.8 0.990 0.83
Lab MTS Cement 478.9 0.069 0.88
Lab MTS Lime 449.2 0.043 0.68
Lab MTS No active filler 429.5 0.059 0.97
Figure 8.2 BSM-emulsion: Reconciliation of field and Laboratory resilient modulus and moisture trends

120
8.1 Synthesis Laboratory trends reveal that the reduction in scales concerning field resilient modulus trends gave meaningful insights in terms of reconciling laboratory and field material properties. This section explores whether field and laboratory material properties were reconciled in terms of selective criteria. Experimentation in the form of formulating draft laboratory accelerated curing protocol was realised. On average, BSM-foam and BSM-emulsion conceived material behaviour reflective of field properties. In terms of the subject matter, the extent of reconciling field and laboratory environments calls for further analysis regarding generated results. The following aspects form part of the selective criteria utilised in addressing reconciliation of laboratory and field environments: • Target Moisture Reconciliation of target moisture was primarily guided by observed field moisture levels. Field moisture behaviour resembled sharp decrease in the initial curing phases, a factor attributed to unsealed curing conditions in the field. The observed sharp decrease in moisture trend was followed by gradual decreasing behaviour pattern. Sealing of field BSM-emulsion with HMA attributed to this behaviour. Initial findings in Chapter 6 highlighted under 30°C curing temperatures and 7 days unsealed curing conditions, BSM-foam retained final moisture contents in the vicinity of 20% OMC when compared to 25% OMC for BSM-emulsion. The noticeable close correlations of final moisture levels suggest that field BSM-emulsion moisture trends may be used for guidance in estimating field BSM-foam moisture levels. For this reason, target moisture levels for BSM-foam were guided by field BSM-emulsion moisture trends. In the laboratory environment, BSM-foam moisture trends were successfully reconciled to field moisture behaviour following findings outlined in Figure 8.1. Field BSM-emulsion [cement treated] moisture contents decreased from 75% OMC to 50% OMC at the end of the analysis period. Similarly, BSM-foam [cement treated] moisture contents highlighted in Figure 8.1 showed a decrease from 68.9% OMC to 53.4% OMC. Accordingly, laboratory BSM-emulsion moisture trends were equally reconciled. Observations of laboratory BSM-emulsion [cement treated] moisture trends in Figure 8.2 reveal that moisture content decreased from 74.3% OMC to 52.7% OMC. • Relative Humidity Reconciliation of relative humidity environments was primarily dictated by the desired field target moisture. For this reason, BSMs unsealed and sealing times were guided by replication of field moisture contents in the laboratory. The conclusion of the matter is that relative humidity conditions were reconciled with considerable success. The observed behaviour in generated laboratory moisture trends reflective of field behaviour suggests that the timing of sealing of specimens for 100% relative humidity simulation was successful. Furthermore, the initial drop in laboratory moisture trends resembles field behaviour, with moistures trends assuming stability beyond the sealing phase.
121
• Initial Resilient Modulus Gradient Important to the research is the challenge of reconciling field resilient modulus trends to laboratory behaviour. Considering that field resilient modulus trends rather than absolute values were used for comparison, the aspect of reconciling the initial resilient modulus gradients between laboratory and field behaviour is imperative. Observation in Figure 8.1 suggest that laboratory BSM-foam [cement treated] successfully replicates field BSM-foam [cement treated]. In terms of observed trends, both laboratory and field behaviour resemble a sharp increase in the generated resilient modulus trends, a factor attributed to rapid curing taking place during the initial curing phase of BSMs. The observed behaviour suggest that both field and laboratory curing environment’s curing conditions have been successfully reconciled. Laboratory BSM-emulsion [cement treated] initial resilient modulus gradient resembles a similar but slightly sharper flattening curve when compared field to BSM-emulsion [cement treated]. The small noticeable difference may suggest that the initial breaking of emulsion yields different resilient modulus behaviours between the field and laboratory environments. For this reason, initial resilient modulus gradient for laboratory BSM-emulsion was partially reconciled to field properties. • Resilient Modulus Behaviour During Curing Reconciliation of resilient modulus trends during the curing phase suggests successful replication of field properties during the sealed curing phase. Laboratory BSM-foam [cement treated] resembled similar behaviour of resilient modulus trends past the sealed curing phase. The observed similarities between field BSM-foam [cement treated] and laboratory BSM-foam [cement treated] suggest that both environments have been successfully reconciled in the sealed curing phase. In addition, both laboratory and field BSM-foam continued their gradual increase in resilient modulus trends, suggesting that both environments are still approaching their long term equilibrium moisture contents. In other words, the observed resilient modulus trends are still increasing. Laboratory BSM-emulsion also resembled similar field behaviour during the sealed curing phase. Unlike the initial curing phases, both laboratory and field environments seem to behave similarly in terms of the gradient of projection or growth during the sealed curing phase. In conclusion, laboratory BSM-emulsion was successfully reconciled to field behaviour in terms of long term resilient modulus properties. • Curing Temperatures Selection of curing temperatures was primarily guided by field temperature and relative humidity buttons. Considering that both resilient modulus and moisture trends were reconciled successfully, the applicable selected laboratory curing temperatures of 30°C and 40°C represent field environments. In conclusion, curing at slightly lower temperatures in the unsealed curing phase maintains that the goal to accelerate curing in the initial curing phase is archived, whilst cognisance is given to preserving realistic moisture contents during the unsealed curing phase. Curing at slightly higher conditions during the sealed curing phases also maintains that laboratory samples are subject to

122
higher field curing temperatures, whilst protection of samples through simulation of sealed 100% relative humidity conditions is achieved. • Active Filler Replication of field resilient modulus properties in terms of active filler influences was equally achievable. Considering laboratory BSM-foam [cement treated], field BSM-foam [cement treated] resilient modulus trend resembled similar behaviour when compared to laboratory environment. Similarly, laboratory BSM-emulsion [cement treated] was equally reconciled to field BSM-emulsion [cement treated]. In terms of application of lime as active filler, although field resilient modulus trends were not available during field investigations, observations of resilient modulus trends in Figure 8.1 for BSM-foam [lime treated] and Figure 8.2 for BSM-emulsion [lime treated] suggest that both trends resembled similar behaviour when compared to BSMs treated with cement. Replication of similar resilient modulus behaviour between BSMs treated with cement and lime as active filler suggest that lime as active filler was successfully reconciled to field properties, since BSMs treated with cement replicated field behaviour. Field and laboratory environments resembled similar typical resilient modulus behaviour associated with the application of active fillers, whether lime or cement in this instance.

123
9 VALIDATED LABORATORY ACCELERATED CURING PROTOCOL
During the construction phase of BSM-emulsion, the applicable construction spec for BSMs required that roadbed moisture contents should be ideally in the vicinity of at least 55-50 %OMC prior to sealing with HMA.
Accordingly, the top 100 mm of field BSM-emulsion layer resembled moisture contents in the vicinity of 50 - 45 % OMC after ±8 months. These data was not shown in Figure 7.2 as research moisture samples had to be dug at average milling depths of ±230mm.
For purposes of research, field moisture samples were extracted at 230 mm depth as concerns to investigate deep BSM-emulsion sections arose. As a result, the primary curing experimentation outlined in Chapter 8 resembled material behaviour taking place between 0-230 mm depths of BSM-emulsion.
Following strict requirements by the industry, it was decided that the final laboratory accelerated curing protocol must accommodate laboratory samples resembling the top 100 mm depths of field BSM-emulsion. At these shallow depths, field moisture varied between 45-50% OMC when compared to 50-55% OMC at deeper sections.
The intervention to reserve curing for the top 100 mm BSM-emulsion depths came as result of concerns voiced by the industry. The biggest concern is that historical curing protocols produced samples with high moisture contents, and that the outcome of material performance resembled lower end material performance criteria.
For this reason, the formulated draft accelerated curing protocol for BSMs highlighted in Chapter 8 was refined in the endeavour to reduce laboratory final moisture contents. This intervention called for extended laboratory curing times for BSMs.
9.1 BSM-foam Laboratory Accelerated Curing Protocol Initially, BSM-foam was cured unsealed for 12 hours prior to sealing. Figure 8.1 shows that in this time period, BSM-foam final moisture contents were in the vicinity of 55% OMC. The extended curing initiative called for BSM-foam to cure to levels of at least 50% OMC prior to sealing. This intervention resulted in BSM-foam requiring an additional 8 hours to reach target moisture contents of ±50% OMC. This brought the total unsealed curing time to 20 hours for BSM-foam. The following table illustrates the formulated laboratory accelerated curing protocol for BSM-foam:
Table 9.1 BSM-foam: Validated laboratory accelerated curing protocol
BSM-foam: Accelerated Laboratory Curing Procedure Simulated Field
Without Filler With Filler Laboratory Handling Curing Conditions
20 hours at 30°C : Unsealed
20 hours at 30°C : Unsealed
Cure in draft oven no later than
12-24 Months
2 hours after compaction
48 hours at 40°C : Sealed
72 hours at 40°C : Sealed
Replace wet plastic bags of 2x specimen volume
with dry ones at every 24 hours interval

124
Due to the observed tendencies of active fillers locking in moisture during the curing process, the intervention called for extended curing times for active fillers in the sealed state. In this way, final retained moisture levels were on par with field long term curing conditions. During the initial curing stages of BSMs, active filler tends to dry up fresh mixed material. The initial absorption of moisture by active filler prior to compaction locks in moisture, requiring much longer extended curing times for locked moisture to be released with time. These findings were mainly validated by monitoring of moisture during the curing process. Accordingly, the extended curing initiative for active filler samples noticeably enhanced resilient modulus material property. Depending on requirements by the industry, this intervention may either be accepted or rejected. In terms of design criteria, the extension of much longer curing times for active filler mixes and thus allowing the resilient modulus properties to be enhanced may overestimate field material performance in the laboratory. In conclusion, derivation of Table 9.1 concluded formulation of laboratory accelerated curing protocol for BSM-foam. Typically, realized final laboratory moisture contents resembled distinctive long term field properties. 9.2 BSM-emulsion Laboratory Accelerated Curing Protocol Similarly, BSM-emulsion was subject to similar scrutiny as BSM-foam when addressing long term field material properties. Due to BSM-emulsion requiring additional time to break and then cure, it was found that on average, BSM-emulsion required an additional 26 hours of unsealed curing time in order to reach the ±50% OMC target. Table 9.2 shows similar but distinctive differences in the extended curing time initiative during the unsealed phases for BSM-emulsion.
Table 9.2 BSM-emulsion: Validated laboratory accelerated curing protocol
On average, BSM-emulsion typically resembled higher final moisture contents due to the delayed moisture extraction process influenced by the breaking of emulsion. The breaking of emulsion was mainly evident following mixing of emulsion binder and moist aggregates. In this instance, BSM-emulsion was cured for much longer extended curing times during the unsealed curing phase. Unlike BSM-foam where the extraction of moisture in the initial curing phase is mainly driven by water repulsion, BSM-emulsion and its tendency to preserve moisture during the breaking of emulsion called for much longer extended curing times during the unsealed curing phase. In conclusion, formulation of laboratory accelerated curing protocol for BSMs proved successful in terms of replicating material properties in the laboratory. In the following sections, the revised curing protocol for BSMs as per objectives set out in the thesis will be scrutinized against published literature. Moreover, the works of Emery, Jenkins and Malubila will be acknowledged.
BSM-emulsion: Accelerated Laboratory Curing Procedure Simulated Field
Without Filler With Filler Laboratory Handling Curing Conditions
26 hours at 30°C : Unsealed
26 hours at 30°C : Unsealed
Cure in draft oven no later than
12-24 Months
2 hours after compaction
48 hours at 40°C : Sealed
72 hours at 40°C : Sealed
Replace wet plastic bags of 2x specimen volume
with dry ones at every 24 hours interval

125
9.3 Validation of Laboratory Curing Protocols using Equilibrium Moisture Properties Simulation of long term moisture properties in the field is fundamental when addressing the curing challenge. Long term material properties in the form of equilibrium moisture contents represent realistic field characteristics in terms of how representative the laboratory curing protocol has been, especially when observing the resulting resilient modulus material property and the associated monotonic shear properties of cured samples. According to literature findings by Emery (1984), equilibrium moisture content for granular pavement materials in South Africa can be estimated using material’s optimum moisture content (OMC), linear shrinkage (LS), liquid limit (LL) and adjusted Thornwaite’s Index (I). The following equation illustrates this.
( ) ( ) ( ) ( ) ( ) ( )( )0.7 0.7 0.3
0.6 0.02 425 0.86 425 3.4log 100 1.1 16.1e
EMC OMC LS P LL P I K= + + + + − − Equation 17
The property P425 represents material passing through 0.425 mm sieve whilst constants K=1 represents bases and K=0 represents subbases and subgrades. The work of Emery stems from findings by Haupt (1980). During the year 1981 and 1982, Emery revised and extended Haupt’s equilibrium moisture prediction models for application in Natal (humid areas), Cape (arid areas) and George (sub-humid areas). Despite significant differences in climatic regions and two years of field observations, Emery found negligible variations [5%] in terms of realised equilibrium moisture levels between subbases and bases. Findings by Emery confirm that the residual moisture in basecourse materials in Southern Africa is at OMC and below and that the resulting variations in moisture levels are independent of the climate (Malubila, 2005). As a result, equilibrium moisture characteristics are mainly driven by the type of material under investigation, and not so much by the climatic region under investigation. Findings by Emery further confirm that the possibility of a representative curing protocol for Southern Africa can be envisaged, more especially given the diverse climatic conditions present in the region. Jenkins (2000) established from Emery’s work that equilibrium moisture content in the field can be predicted using material’s optimum moisture content (OMC), bitumen or foam content (BC) and the regional ratio as determined by Emery (E/OMC). Equation 19 explains this.
( )
−=
OMC
EBCOMCEMC Equation 18
During research conducted by Malubila (2005), Jenkin’s equilibrium moisture model was found to typically undermine equilibrium moisture levels of gravel and crushed rock materials by a factor ranging from 1.3 to 3.9. In terms of sand materials, Jenkin’s prediction model generally overestimated equilibrium moisture levels by factors ranging from 1.5 to 3.5 (Malubila, 2005). Following Emery and Jenkin’s research, Malubila derived equilibrium moisture prediction models for gravels & crushed rocks and sands respectively. Equation 20 illustrates equilibrium moisture prediction model for gravels and crushed rock materials. In this instance, Malubila focused on BSM-foam.
( ) 1146.072.1 +
−=
OMC
EBCOMCEMC Equation 19

126
Using the revised equilibrium moisture prediction model for granular materials as per Malubila’s research, the cured laboratory samples utilizing the revised curing protocols outlined in Table 9.1 and 9.2 were further scrutinized against Malubula’s EMC prediction models. In terms of generated results, the aspect of data correlation between realised laboratory moisture conditions at the end of the curing process and the comparative predicted field moisture properties were analysed. In essence, the challenge was to apply the revised curing protocols for BSMs and equally replicate laboratory equilibrium moisture conditions reflective of field properties predicted using the granular materials equilibrium moisture prediction model [Equation 20]. On average, the generated equilibrium moisture conditions realized utilizing the revised curing protocols resembled long term curing characteristics present in the filed. Table 9.3 illustrates the observed findings.
Table 9.3 Equilibrium moisture characteristics of laboratory cured samples
Description BSM-
emulsion BSM-foam
Fie
ld P
rop
ert
ies
Optimum Moisture Content 5.1% 5.1%
Binder Content 3.3% 3.0%
Active Filler Content – Cement 1% 1%
[E/OMC] 0.63 0.63
Regional Factor – Emery
[%OMC] [%OMC]
Lab
ora
tory
Pro
pert
ies
[W
ith
ou
t C
em
ent]
EMCField
40.8% 47.1% [Moisture Predicted Using Malubila BSM-foam Section Model]
EMCLab
43.3% 43.6% [Samples Cured Using Updated Curing Protocols in Tables 9.1
and 9.2]
Average 42.1% 45.4%
Std Dev 1.8% 2.5%
COV 4.2% 5.5%
Lab
ora
tory
Pro
pert
ies
[Wit
h C
em
en
t]
EMCField
40.8% 47.1% [Moisture Predicted Using Malubila BSM-foam Section Model]
EMCLab
46.5% 45.6% [Samples Cured Using Updated Curing Protocols in Tables 9.1
and 9.2]
Average 43.7% 46.4%
Std Dev 4.0% 1.1%
COV 9.2% 2.3%

127
The observed close correlations obtained between the laboratory cured equilibrium moisture conditions and predicted field moisture characteristics emphasize that both field and laboratory environments have been successfully reconciled. In this instance, the final observed conditions for field and laboratory environments represent 12-24 months curing characteristics. Malubila’s prediction model was primarily based on BSM-foam. As a point of reference, Emery’s original EMC prediction models were primarily based on granular materials. For this reason, Malubila’s revised model does not distinguish between conditions with and without active filler. This makes sense since active filler only influences curing rates rather than final equilibrium moisture conditions. In terms of application of the models, BSM-foam mixes showed maximum coefficient of variation of 5.5% between laboratory and field predicted conditions. The lower coefficient of variation emphasizes that both laboratory and field environments resemble similar curing mechanisms and that the observed behaviours further validate the adopted curing protocol. Similarly, replicable EMC conditions were obtainable for BSM-emulsion, with the maximum coefficient of variation achievable being in the vicinity of 9.2%. The observed larger variation may stem from Malubila’s prediction model only being applicable to BSM-foam. In this instance, Malubila’s prediction model for BSM-foam was primarily utilized as a guide for EMC predictions for BSM-emulsion. In essence, laboratory BSM-emulsion resembled close characteristics when compared to predicted field properties whilst minimum variations were maintained. In conclusions, achievement of long term equilibrium curing conditions in the laboratory utilising revised curing protocols for BSMs further outlines the close correlation maintained between researches conducted by various authors. Contributions from Emery, Jenkins and Malubila’s research have brought meaning in terms of adding value to the proposed research. 9.4 Validation of Laboratory Curing Protocols using Monotonic Shear Properties Shear parameters of cured samples were determined in a monotonic tri-axial test. The following ranges of confinement pressures were used: 25 kPa, 50 kPa and 100 kPa. Shear parameters of cured samples showed long term material characteristics, suggesting that the implemented curing protocol model is in line with field properties. Typically, depending on active filler type and content, crushed rock cohesion values may range from 100 – 400 kPa. Table 9.4 illustrates the achieved monotonic properties of cured samples.
Table 9.4 Monotonic shear characteristics of laboratory cured samples
BSMs
Monotonic Shear properties
Active Filler C [kPa] Ø
BSM-foam
Cement 180 38.7°
Lime 224 39.3°
No Filler 175 36.8°
BSM-emulsion
Cement 250 30.8°
Lime 254 34.2°
No Filler 160 36.6°

128
Relevant to the research is the influence of active filler on shear properties of cured samples. Results confirm that mixes exhibiting strong cohesion properties have active filler as a variable. In particular, BSM-emulsion showed higher cohesion properties. Additional to the reasoning behind strong cohesion properties other than the presence of active fillers, BSM-emulsion required longer curing times in the unsealed phase regarding the extraction of locked moisture during the breaking of emulsion process. In this instance, the extended curing times in the unsealed phase may have afforded BSM-emulsion the opportunity to experience cementation in the earlier stages, leading to BSM-emulsion exhibiting much higher cohesion properties. In addition, both BSM-foam and BSM-emulsion treated with active filler generally required extended curing times in the final stages of the sealed phase. During this phase, the extended curing times may have also led to more cementation taking place, resulting in mixes exhibiting higher cohesion properties. Regarding mixes without active filler, BSM-foam resembled final moisture conditions similar to BSM-emulsion. Accordingly, results reveal that BSM-foam resembled higher cohesion characteristics when compared to BSM-emulsion. In other words, results reveal that the logical reason governing BSM-emulsion resembling higher cohesion properties in terms of mixes with active filler is primarily because of the additional 6 hours curing time applicable during the unsealed phase. Consequently, to a large extent, the cementation process taking place BSMs can significantly alter material’s flexibility. The stiffening effect of these mixes due to longer curing times for mixes that have active filler as a variable may be undesirable for the industry. Furthermore, the shear parameters of cured samples from tri-axial testing give good indication of material’s resistance to permanent deformation. According to TG2 2009 material classification, the Reclaimed Asphalt (RA) or N7 crushed rock satisfied BSM2 criteria with cohesion properties mainly ranging from 100–250 kPa and angle of friction in the vicinity of 30-40 °C. Accordingly, BSM2 classified materials have been described as materials with moderately high shear strength. These materials are typically used as base course for traffic design of less than 6 MESA. In line with long term material properties, the N7 crushed rock was sourced from reclaimed asphalt. As a point of interest, the recycled N7 reclaimed asphalt was used as base course for the pavement structural design. The observed close correlation of theoretical knowledge and field decision making further confirms the accuracy of the revised curing protocols. In particular, the typical observed reclaimed asphalt shear properties of cured samples emphasize good correlation between the mix design and structural design processes, further emphasizing the notion that laboratory samples have been cured to their field equivalent.

129
10 CONCLUSIONS AND RECOMMENDATIONS
This section covers interventions regarding the way forward concerning the curing protocol for BSMs. Prior to the conducted research, standardization and unification of the curing protocol was priority. In this instance, the unification of BSM-foam and BSM-emulsion was not realized. The observed differences in material behaviours regarding moisture, resilient modulus and shear properties served as reminder that BSM-foam and BSM-Emulsion are inherently different, and that both materials have curing mechanisms that call for different interventions. Standardization of the protocol was successfully realized. Accordingly, BSM-foam and BSM-emulsion were separately accommodated in the revised curing protocol. Findings by Emery have also helped address whether the derived protocols would be applicable to all granular materials. Granular materials make up the largest volume of BSMs. Accordingly, crushed rock, natural gravel, natural sand and reclaimed asphalt make up the largest contribution towards BSM materials. In this instance, the derived protocols were primarily based on findings derived from granular materials and more specifically, the reclaimed asphalt composing of graded crushed rock. Application of the derived curing protocols regarding the mix design process of fine sands and non granular materials should be implemented bearing the above in mind. In particular, Malubila highlighted that there are two models for EMC predictions applicable to granular [crushed rock and gravel] and sand materials. In his findings, Malubila highlighted that sands and granular materials cured differently and that both types of materials require separate prediction models for equilibrium moisture contents. In line with Malubila’s research, the curing protocols in this study will generally work for all material types, with granular materials [crushed rock, gravel and reclaimed asphalt] being the benchmark materials. Sands will generally work in terms of establishing their long term EMC properties. Preliminary findings in Chapter 4 have revealed that although granular materials and sands cure differently, the realised moisture trends achieved under similar curing conditions are similar. Accordingly, the close correlations obtained between moisture and resilient modulus trends suggest that the process of curing simulation between field and laboratory has been reconciled. In other words, the protocols have simulated the mechanisms of curing witnessed in the field, whether the applicable material under investigation happens to be granular or sands. In this instance, the distinguishing factor between granular materials and sands would be the final retained moisture contents at the end of the curing analysis. In addition, the final realized laboratory moisture and resilient modulus conditions per material type will generally be in line with field long term material properties. In terms of project objectives, the research has successfully finalised curing protocols for BSMs and further recommendations have been presented. During the analysis of this research, various findings surfaced from different research projects. In particular, the inception of TG 2009 has been successfully finalised. Accordingly, the following sections have subsequently included findings and supportive literature outlined in TG 2009 manual:
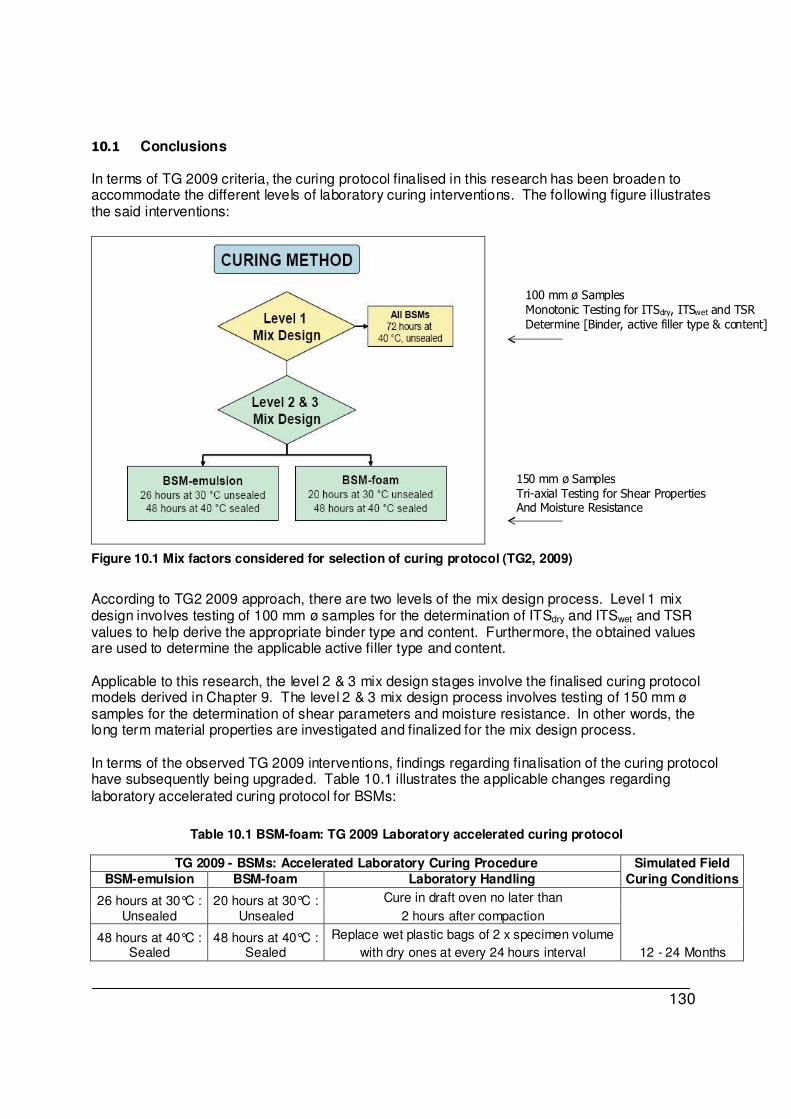
130
10.1 Conclusions In terms of TG 2009 criteria, the curing protocol finalised in this research has been broaden to accommodate the different levels of laboratory curing interventions. The following figure illustrates the said interventions:
Figure 10.1 Mix factors considered for selection of curing protocol (TG2, 2009)
According to TG2 2009 approach, there are two levels of the mix design process. Level 1 mix design involves testing of 100 mm ø samples for the determination of ITSdry and ITSwet and TSR values to help derive the appropriate binder type and content. Furthermore, the obtained values are used to determine the applicable active filler type and content. Applicable to this research, the level 2 & 3 mix design stages involve the finalised curing protocol models derived in Chapter 9. The level 2 & 3 mix design process involves testing of 150 mm ø samples for the determination of shear parameters and moisture resistance. In other words, the long term material properties are investigated and finalized for the mix design process. In terms of the observed TG 2009 interventions, findings regarding finalisation of the curing protocol have subsequently being upgraded. Table 10.1 illustrates the applicable changes regarding laboratory accelerated curing protocol for BSMs:
Table 10.1 BSM-foam: TG 2009 Laboratory accelerated curing protocol
TG 2009 - BSMs: Accelerated Laboratory Curing Procedure Simulated Field BSM-emulsion BSM-foam Laboratory Handling Curing Conditions
26 hours at 30°C : Unsealed
20 hours at 30°C : Unsealed
Cure in draft oven no later than
12 - 24 Months
2 hours after compaction
48 hours at 40°C : Sealed
48 hours at 40°C : Sealed
Replace wet plastic bags of 2 x specimen volume
with dry ones at every 24 hours interval
100 mm ø Samples Monotonic Testing for ITSdry, ITSwet and TSR Determine [Binder, active filler type & content]
150 mm ø Samples Tri-axial Testing for Shear Properties And Moisture Resistance

131
Interventions in TG2 (2009) reveal that there are no clear distinctions in terms of the curing procedure between active filler and no active filler mixes. In addition, the new curing protocol as per findings in this research does distinguish between BSM-foam and BSM-emulsion. Active filler was omitted due to reasons of simplifying the mix design process. Although the use of active filler has an impact on curing, its inclusion in a BSM does not justify its extension in the curing time as cementation is not one of the desired properties of these materials, TG2 (2009). Due to industry demands, BSMs are primarily desirable for CIPR technology due to their flexibility in pavement structures. Although findings in this research have revealed that active filler’s tendency to absorb moisture in the initial stages requires longer curing time to help extract the absorbed moisture during the curing process, the longer cure approach will take away the very benefit of using BSMs, which is their flexibility. In addition, active filler’s influence on strength gain is not its main purpose in the mix. Accordingly, mixes with active filler should not be granted the additional time to cure and therefore allow more strength gain to occur. Consideration of predominantly strength criteria leads to the design of brittle, inflexible mixes that are susceptible to cracking, TG2 (2009). The finalised curing protocols for BSMs have been primarily guided by Malubila’s research. In his findings, Malubila specifically researched curing of BSM-foam. The derived EMC prediction models were equally based on BSM-foam. Applicable to this research, Malubila’s curing protocol for BSM-foam has remained unchanged. In particular, Malubila’s curing protocol for BSM-foam was found to be fairly accurate regarding reconciliation of long term field moisture characteristics. Following the investigations of Malubila’s curing protocol for BSM-foam, it was found that the observed resilient modulus and shear properties of cured samples resembled field behaviour. Effectively, the proposed research has confirmed the pre-existing curing protocol for BSM-foam. In terms of the protocol’s adaptability regarding curing of BSM-emulsion, it was generally found that the final cured samples possessed higher levels of moisture contents. In order to adapt the protocol to BSM-emulsion, it was decided that the unsealed curing phase had to be extended due to the need to drive out excess moisture trapped during the breaking of emulsion process. The extent of “extended curing time” for BSM-emulsion was primarily guided by maintaining close correlations between field and laboratory resilient modulus trends. In terms of the realized final curing protocols for BSMs, the research has reached its conclusions regarding validation of the protocols in terms of reconciling field and laboratory material properties. Validation of the protocols was mainly governed by field material properties in terms of realised long term moisture conditions, resilient modulus trends and shear parameters. Additional to the above, field climatic conditions governed by field data in the form of relative humidity and temperature buttons helped with the inception of ideal laboratory curing environments conducive to facilitating field cure. Moreover, the ability to correlate field resilient modulus trends to material evolution during the curing phase has been key to understanding curing effects on material performance. The research has equally managed to accommodate the vast project scope outlined in thesis objectives. The reconciliation of field and laboratory environments in terms of the outlined scope has led to formulation of curing protocols for BSMs, with emphasis being devoted to the inception of TG2 2009 mix design guidelines. In essence, the thesis has added value in terms of bridging the gap between mix design and structural design interventions present during the pavement design phase.

132
10.2 Recommendations Derivation of the curing protocol for BSMs has proven to be a complex process especially regarding the various factors that played a role in either shifting the investigation approach or totally altering the derived protocols. The curing study requires clear understanding of factors that actually influence performance of BSMs, especially considering the complex compositions of BSMs in terms of their parent rock characteristics, RA grading properties, active filler influences, material types, field environment properties, different climatic regions and many more. Findings in this research have only provided a clear framework for curing investigations. The framework outlined in this research has predominantly focused on few tangible material properties to reconcile in terms of field and laboratory behaviour. From a research perspective, there are other valuable factors to reconcile between field and laboratory behaviour. Although the resilient modulus material property has been emphasized as key to benchmark the curing protocol, one may argue whether other mechanical tests such as fatigue characteristics derived from four point beam testing are equally valuable, or whether the repeated dynamic loading under the Model Mobile Load Simulator (MMLS) requires investigation. The scope for future research regarding curing of BSMs is enormous considering future applications of these materials. Furthermore, in line with findings outlined in the presented thesis, the following aspects regarding laboratory curing of BSMs need further investigations: • More research is needed regarding observation of LTPP along various cold mix projects.
Typically, 2-3 years field resilient modulus data is sufficient for analysis purposes
• The aspect of reconciling field and laboratory material properties in the form of absolute resilient
modulus values needs further investigations, especially considering the different material types utilized during the mix design processes
• Future research is needed regarding the acquisition of field cores along various BSM sections.
This process will help generate reliable field data in the form of resilient modulus and shear properties of cured pavements
In closure, the curing protocol for BSMs was realised for the Southern African regions, where the climate is largely characterised by warm temperatures. Curing of BSMs in continents such as Europe will take on different climatic simulations in the laboratory. In essence, the framework outlined in this research should be adapted to the area under investigation. Different regions will call for different interventions during the investigation process. Considering the intricate nature of these mixes, standardization of the curing protocols should be a priority. Application of these mixes will always pose challenges, especially considering that the CIPR technology is relatively new. Accordingly, future research is encouraged regarding the development of the curing protocol and its relevance in the pavement design process.

133
11 REFERENCES
Abdallah, I., Yuan, D., and Nazarian, S., 2003. Validation of software developed for determining design modulus from seismic testing, Research Report 1780-5, Centre for Highway Materials Research, the University of Texas at El Paso, TX. Acott, S. M., 1980. The stabilisation of a sand by foamed bitumen – A laboratory and field performance study. Dissertation for Master of Science in Engineering. University of Natal. Arema committee-1sub committee no. 2-ballast, 1998. Suggested Guidelines for Hot Mix Asphalt (HMA) Underlayment. Asphalt Academy, 2002. TG 2: The design and use of foamed bitumen treated materials. Pretoria, South Africa, 2002. Asphalt Academy, 2009. TG 2: The design and use of foamed bitumen treated materials. Pretoria, South Africa, 2009. Asphalt Institute, 1992. A Basic Asphalt Emulsion Manual. Manual Series No 19, Second Edition. Lexington, USA. Pp 87 Bondietti, M., Murphy, D., Jenkins, K. and Burger, A., 2004. Research on the stabilisation of two different materials using bitumen emulsion and cement. Proceedings of the 8th Conference on Asphalt Pavements for Southern Africa (CAPSA’04). Sun City, South Africa. Bowering, R. H. and Martin, C. L., 1976. Foamed Bitumen Production and Application of Mixtures evaluation and Performance of Pavements. Proceedings, Association of Asphalt Paving Technologists Volume 45. New Orleans, Louisiana. Pp 453-477. Bowering, R. H., 1970. Upgrading Marginal Road Building Materials with Foamed Asphalt. Highway Engineering in Australia. Mobil Oil of Australia, Melbourne South. Brown, S. F. and Needham, D., 2000. A study of Cement Modified Bitumen Emulsion Mixtures. Proceedings Association of Asphalt Pavement Technologist, Reno, Nevada Vol. 69, Pp 92-121. Brown, S. F. and Gibb, J. M. Effects of Compaction on Mechanical Properties of Asphalt Mixtures. Proceedings of the 7th Conference on Asphalt Pavements for Southern Africa, 1999. De Vos, E. R. Performance Characterization of Cement Treated Sand Base Material of Mozambique. MSc.Eng Thesis, University of Stellenbosch, 2007. Hodgkinson A. and Visser A. T. The role of fillers and cementitious binders when recycling with foamed bitumen or bitumen emulsion, 2004. Houston, M. and Long, F. M., 2004. Correlations between different ITS and UCS test protocols for foamed bitumen treated materials. Proceedings of the 8th Conference on Asphalt Pavements for Southern Africa (CAPSA’04). Sun City, South Africa.

134
Hunter, A. E, Airey, G. D, Collop, A. C. Influence of Compaction Method on Asphalt Mixture Internal Structure and Mechanical Properties. 3rd Euroasphalt & Eurobitume Congress, Vienna, 2004. Jack N. Dybalski, 1981. A comparison of Properties of laboratory prepared Cold Mixes Emulsified and Hot Mixed Asphalt Mixtures. Presented at the 9th Annual Meeting of the Asphalt Emulsion Manufacturers Association March 17-18 1982 Las Vegas, Nevada. Jenkins, K. J., 2000. Mix Design Considerations for Cold and Half-warm Bituminous Mixes with Emphasis on Foamed Bitumen. PhD Dissertation, University of Stellenbosch, South Africa. Kekwick, S. V., 2005. Best Practice: Bitumen-Emulsion and Foamed Bitumen Materials Laboratory Processing. South African Transport Convention SATC, Pretoria Kekwick, S. V., 2004. Accelerated curing laboratory of Bitumen-Emulsion and Foamed Treated Specimens: Review of Current Practice. South African Transport Convention SATC, Pretoria Lancaster, J., McArthur, L. and Warwick, R., 1994. VICROADS Experience with Foamed Bitumen Stabilisation. Proceedings 17th ARRB Conference Part 3. Australia. Pp 193-211 Lee, D. Y., 1981. Treating Marginal Aggregates and Soils with Foamed Asphalt. Association of Asphalt Paving Technologists Volume 50. Pp 211-250 Little, D. N., Button, J. W. and Epps, J. A., 1983. Structural Properties of Laboratory Mixtures Containing Foamed Asphalt and Marginal Aggregates. Transportation Research Record 911. Pp 104-113 Loizos, A and Papavasiliou, V, 2007. Assessment of In-Situ CIPR Performance using the Foam Asphalt Technique. International Conference on Advanced Characterisation of Pavement and Soil Engineering Materials. Athens, Greece. Long, F. M. and Theyse, H. L., 2004, Mechanistic Empirical Structural Design Models for Foamed and Emulsified Bitumen Treated Materials. Proceedings of the 8th Conference on Asphalt Pavements for Southern Africa (CAPSA’04). Sun City, South Africa. Malubila, S. M., 2005. Curing of foamed bitumen mixes. M.Eng thesis University of Stellenbosch, South Africa. Maccarrone, S., 1994. Cold Asphalt as an Alternative to Hotmix. 9th AAPA International Asphalt Conference. Australia. Pp 19-24 Maccarrone, S., Holleran G., Leonard, D. J. and Hey, S., 1994. Pavement Recycling using Foamed Bitumen. Proceedings 17th ARRb Conference Part 3. Australia. Pp 349-365 Marais, C. P. and Tait, M. I., 1989. Pavements with Bitumen Emulsion Treated Bases: Proposed Material Specifications, Mix Design Criteria and Structural Design Procedures for southern African conditions. CAPSA ’89, Swaziland Nazarian, S., Yuan, G., Tandon, V. and Arellano, M., 2002. Quality Management of Flexible Pavement Layers with Seismic Methods. The University of Texas at El Paso, 2002.

135
Parsons R. L, Foster D. H, Cross A. S, 2001. Compaction and Settlement of Existing Embankment. University of Kansas, 2001. Poirier, J. E., Clarac, A., Ballie, M., and Thouret, D., 2004. Cold Mixes for Base and Wearing Courses. A survey of long term performance over eight years of use. Eurobitume and Euroasphalt Congress, Vienna, Paper 233. Potii, J. J., Lesueur, D. and Eckmann, B., 2002. Towards a rational mix design method for cold bituminous mixes. The Optel contribution. European Roads Review Special Issue, RGRA 2. Roberts, F. L., Engelbrecht, J. C. and Kennedy, T. W., 1984. Evaluation of Recycled Mixtures using Foamed Bitumen. Transportation Research Record 968. Pp 78-85. Ruckel, P. J., Acott, S. M. and Bowering, R. H., 1983. Foamed-Asphalt Paving Mixtures: Preparation of Design Mixes and Treatment of Test Specimens. Transportation Research Record 911. Pp 88-95. Saleh, M. F., 2004. New Zealand Experience with Foamed Bitumen Stabilisation. Annual TRB Meeting, Washington USA. Serfass, J. P., Poirier, J. E., Henrat, J. P. and Carbonneau, X., 2003. Influence of Curing on Cold Mix Mechanical Performance. Performance Testing and Evaluation of Bituminous Materials PTEBM’03, 6th International Rilem Symposium, Zurich, Switzerland Shuler T. S, Huber G. A. Effect of Aggregate Size and Other Factors on Refusal Density of Asphalt Concrete by Vibratory Compaction. Effects of Aggregates and Mineral Fillers on Asphalt Mixture Performance, ASTM STP 1147, American Society for Testing and Materials, Philadelphia, 1992. Weinert, H. H. The Natural Road Construction Materials if Southern Africa, H&R Academia Ltd, Cape Town, South Africa, 1980. Wirtgen, 2004. Wirtgen Cold Recycling Manual. Wirtgen Publication, Windhagen Germany. Van Wijk, A.. and Wood, L. E., 1983. Use of Foamed Asphalt in Recycling of an Asphalt Pavement. Transportation Research Record 911. Pp96-103.

136
12 APPENDICES
APPENDIX A
Chapter 9: Shear Parameters of Laboratory Cured Samples BSM-foam
0
0.5
1
1.5
-0.5 0 0.5 1 1.5 2 2.5
Shear Stress t (MPa)
Normal Stress s (MPa)
BSM-foam Cement Specimens
C = 180 kPaf = 38.66 ºR2 = 0.836
Figure 12.1 BSM-foam monotonic shear properties of cement mixes
0
0.5
1
1.5
-0.5 0 0.5 1 1.5 2 2.5
Shear Stress t (MPa)
Normal Stress s (MPa)
BSM-foamLime Specimens
C = 224 kPaφ = 39.29ºR2 = 0.838
Figure 12.2 BSM-foam monotonic shear properties of lime mixes

137
0
0.5
1
1.5
-0.5 0 0.5 1 1.5 2 2.5
Shear Stress t (MPa)
Normal Stress σσσσ (MPa)
BSM-foamNo Active Filler Specimens
C = 175 kPaφ = 36.81ºR2 = 0.807
Figure 12.3 BSM-foam monotonic shear properties of mixes without active filler
BSM-emulsion
0
0.5
1
1.5
-0.5 0 0.5 1 1.5 2 2.5
Shear Stress (MPa)
Normal Stress (MPa)
BSM-emulsionCement Specimens
C = 250 kPaf = 30.75ºR2 = 0.789
Figure 12.4 BSM-emulsion monotonic shear properties of
cement mixes

138
0
0.5
1
1.5
-0.5 0 0.5 1 1.5 2 2.5
Shear Stress (M
Pa)
Normal Stress (MPa)
BSM-emulsionLime Specimens
C = 245 kPaf = 34.2ºR2= 0.791
Figure 12.5 BSM-emulsion monotonic shear properties of lime mixes
0
0.5
1
1.5
-0.5 0 0.5 1 1.5 2 2.5
Shear Stress (MPa)
Normal Stress (MPa)
BSM-emulsionNo Active Filler Samples
C = 160 kPaf = 36.6ºR2= 0.844
Figure 12.6 BSM-emulsion monotonic shear properties of mixes without active filler

139
APPENDIX B
Field Relative Humidity and Temperature Data Shoulder Data
Centreline Data

140
APPENDIX C
Chapter 8: Draft Curing Resilient Modulus Data Laboratory Data: BSM-foam
Regression Statistics
corrected k1 507.5
BSM-foam: 1% cement
ssressid 8410 sstotal 63080.0
k2 0.0540 R2 0.867 ssreg 54670.2
Regression Mr=k1Tcuring
k1 Model
Tcuring Mr [MTS-actual] Mr [predicted] ressid ressidsq diff diffsq actualsq
0.1 460 448.2 -11.8 139.0
-121.3 14711.2 211600.0
0.1 473 448.2 -24.8 614.5 -121.3 14711.2 223729.0
0.1 443 448.2 5.2 27.1 -121.3 14711.2 196249.0
12 571 580.4 9.4 88.6 10.9 119.1 326041.0
12 547 580.4 33.4 1116.4 10.9 119.1 299209.0
12 543 580.4 37.4 1399.7 10.9 119.1 294849.0
36 621 615.9 -5.1 26.2 46.4 2151.1 385641.0
36 584 615.9 31.9 1016.3 46.4 2151.1 341056.0
36 595 615.9 20.9 436.0 46.4 2151.1 354025.0
60 679 633.1 -45.9 2106.6 63.6 4045.2 461041.0
60 666 633.1 -32.9 1082.3 63.6 4045.2 443556.0
60 652 633.1 -18.9 357.1 63.6 4045.2 425104.0
Regression Statistics
corrected
k1 506.9
BSM-foam: 1% lime
ssressid 10370 sstotal 42924.8
k2 0.0450 R2 0.758 ssreg 32554.9
Regression
Mr=k1Tcuringk1 Model
Tcuring Mr [MTS-actual] Mr [predicted] ressid ressidsq diff diffsq actualsq
0.1 491 457.0 -34.0 1152.7
-100.2 10040.5 241081.0
0.1 441 457.0 16.0 257.5 -100.2 10040.5 194481.0
0.1 475 457.0 -18.0 322.3 -100.2 10040.5 225625.0
12 500 566.8 66.8 4463.1 9.6 91.3 250000.0
12 520 566.8 46.8 2190.8 9.6 91.3 270400.0
12 550 566.8 16.8 282.5 9.6 91.3 302500.0
36 603 595.5 -7.5 56.2 38.3 1463.3 363609.0
36 619 595.5 -23.5 552.1 38.3 1463.3 383161.0
36 611 595.5 -15.5 240.1 38.3 1463.3 373321.0
60 620 609.3 -10.7 113.7 52.1 2713.1 384400.0
60 627 609.3 -17.7 312.0 52.1 2713.1 393129.0
60 630 609.3 -20.7 426.9 52.1 2713.1 396900.0

141
Regression Statistics
corrected
k1 435.8
BSM-foam: no active filler
ssressid 12270 sstotal 39429.2
k2 0.0499 R2 0.689 ssreg 27159.5
Regression
Mr=k1Tcuringk1 Model
Tcuring Mr [MTS-actual] Mr [predicted] ressid ressidsq diff diffsq actualsq
0.1 391 388.5 -2.5 6.5
-96.0 9208.8 152881.0
0.1 381 388.5 7.5 55.6 -96.0 9208.8 145161.0
0.1 424 388.5 -35.5 1263.5 -96.0 9208.8 179776.0
12 475 493.3 18.3 334.2 8.9 78.6 225625.0
12 439 493.3 54.3 2946.4 8.9 78.6 192721.0
12 465 493.3 28.3 799.8 8.9 78.6 216225.0
36 539 521.1 -17.9 321.2 36.7 1344.1 290521.0
36 564 521.1 -42.9 1842.2 36.7 1344.1 318096.0
36 475 521.1 46.1 2123.3 36.7 1344.1 225625.0
60 535 534.5 -0.5 0.2 50.1 2511.6 286225.0
60 585 534.5 -50.5 2547.0 50.1 2511.6 342225.0
60 540 534.5 -5.5 29.9 50.1 2511.6 291600.0
Laboratory Data: BSM-foam
Regression Statistics
corrected
k1 478.9
BSM-emulsion: 1% cement
ssressid 12519 sstotal 102394.0
k2 0.0689 R2 0.878 ssreg 89874.6
Regression
Mr=k1Tcuringk1 Model
Tcuring Mr [MTS-actual] Mr [predicted] ressid ressidsq diff diffsq actualsq
0.1 382 409 27 708 -149 22320 145924
0.1 384 409 25 605 -149 22320 147456
0.1 461 409 -52 2746 -149 22320 212521
20 598 589 -9 86 31 945 357604
20 540 589 49 2376 31 945 291600
20 561 589 28 770 31 945 314721
44 601 622 21 426 64 4049 361201
44 638 622 -16 268 64 4049 407044
44 563 622 59 3437 64 4049 316969
68 664 641 -23 549 83 6817 440896
68 640 641 1 0 83 6817 409600
68 664 641 -23 549 83 6817 440896

142
Regression Statistics
corrected
k1 449.2
BSM-emulsion: 1% lime
ssressid 10717 sstotal 33723.7
k2 0.0434 R2 0.682 ssreg 23006.3
Regression
Mr=k1Tcuringk1 Model
Tcuring Mr [MTS-actual] Mr [predicted] ressid ressidsq diff diffsq actualsq
0.1 383 406.6 23.6 554.9
-90.2 8135.0 146689.0
0.1 392 406.6 14.6 211.9 -90.2 8135.0 153664.0
0.1 452 406.6 -45.4 2065.2 -90.2 8135.0 204304.0
20 450 511.6 61.6 3790.6 14.8 219.6 202500.0
20 500 511.6 11.6 133.8 14.8 219.6 250000.0
20 550 511.6 -38.4 1477.0 14.8 219.6 302500.0
44 510 529.4 19.4 374.9 32.6 1063.5 260100.0
44 568 529.4 -38.6 1493.0 32.6 1063.5 322624.0
44 520 529.4 9.4 87.6 32.6 1063.5 270400.0
68 539 539.4 0.4 0.2 42.7 1823.2 290521.0
68 562 539.4 -22.6 508.5 42.7 1823.2 315844.0
68 535 539.4 4.4 19.8 42.7 1823.2 286225.0
Regression Statistics
corrected
k1 429.5
BSM-emulsion: no active filler
ssressid 2048 sstotal 58005.8
k2 0.0586 R2 0.965 ssreg 55957.4
Regression
Mr=k1Tcuringk1 Model
Tcuring Mr [MTS-actual] Mr [predicted] ressid ressidsq diff diffsq actualsq
0.1 375 375 0 0 -118 13945 140625
0.1 376 375 -1 1 -118 13945 141376
0.1 375 375 0 0 -118 13945 140625
20 498 512 14 194 19 346 248004
20 511 512 1 1 19 346 261121
20 517 512 -5 26 19 346 267289
44 544 536 -8 62 43 1833 295936
44 568 536 -32 1015 43 1833 322624
44 520 536 16 261 43 1833 270400
68 539 550 11 121 57 3212 290521
68 562 550 -12 144 57 3212 315844
68 535 550 15 225 57 3212 286225

143
Field Data: BSM-foam
Regression Statistics
corrected
k1 631.8
Field BSM-foam: 1% cement
ssressid 45625 sstotal 135351.3
k2 0.0630 R2 0.663 ssreg 89726.4
Field Data
Mr=k1Tcuringk1 Reduced by 10
Tcuring Mr [PSPA-actual] Mr [predicted] ressid ressidsq diff diffsq actualsq
0.1 568 546.5 -21.0 439.6
-177.6 31530.3 322056.3
0.1 580 546.5 -33.5 1120.1 -177.6 31530.3 336400.0
0.1 570 546.5 -23.5 550.7 -177.6 31530.3 324900.0
12 620 738.9 118.9 14142.2 14.8 219.7 384400.0
12 693 738.9 46.4 2154.9 14.8 219.7 479556.3
12 723 738.9 16.4 269.7 14.8 219.7 522006.3
36 743 791.9 48.6 2359.3 67.8 4593.1 552494.9
36 757 791.9 35.2 1237.1 67.8 4593.1 572594.9
36 737 791.9 55.2 3044.0 67.8 4593.1 542726.9
60 897 817.8 -78.9 6230.0 93.7 8774.0 804070.9
60 903 817.8 -85.5 7315.4 93.7 8774.0 815950.9
60 900 817.8 -82.2 6761.8 93.7 8774.0 810000.0
Field Data: BSM-emulsion
Regression Statistics
corrected
k1 15.8
Field BSM-emulsion: 1% cement
ssressid 320634 sstotal 1868798.6
k2 0.99 R2 0.828 ssreg 1548165.0
Field Data
Mr=k1Tcuringk1 Reduced by 3
Tcuring Mr [PSPA-actual] Mr [predicted] ressid ressidsq diff diffsq actualsq
0.1 224 287 -222 49436 -583 340005 50157
0.1 307 287 -306 93394 -583 340005 94385
0.1 331 287 -329 108293 -583 340005 109360
20 357 307 -50 2521 -278 77275 127409
20 362 307 -55 3079 -278 77275 131205
20 419 307 -112 12579 -278 77275 175468
44 756 670 -86 7403 85 7190 570864
44 576 670 94 8759 85 7190 331691
44 630 670 40 1591 85 7190 396433
68 956 1030 75 5573 445 198463 913086
68 933 1030 97 9385 445 198463 871111
68 1167 1030 -136 18621 445 198463 1361111

144