Embed Size (px)
Citation preview
Condensed Interim Financial Statements (unaudited)
ACADIAN CORE INTERNATIONAL
EQUITY FUND
June 30, 2017
NOTICE TO THE READER
The enclosed semi-annual financial statements have not been reviewed by the external
auditors of the Fund.
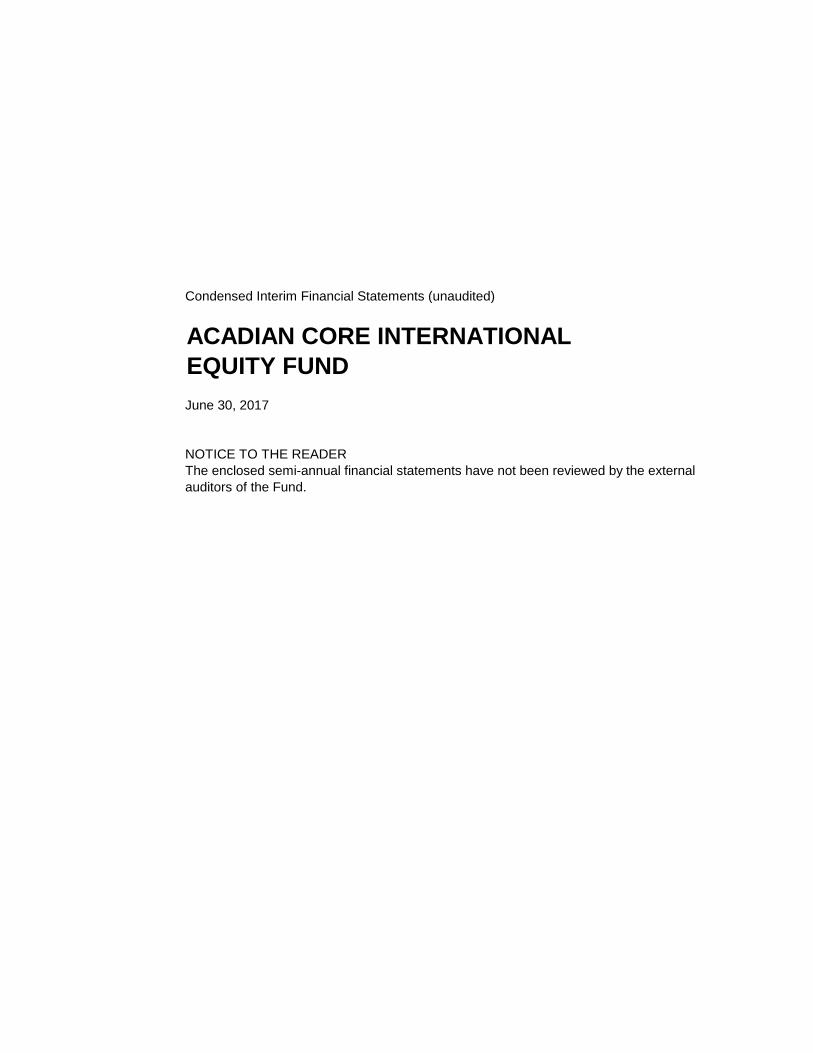
ACADIAN CORE INTERNATIONAL EQUITY FUNDStatements of Financial Position (unaudited)
As at June 30, 2017 and December 31, 2016
June 30, 2017 December 31, 2016
Assets
Cash 486,344$ 535,224$
Receivable for securities sold 38,839 353,467
Subscriptions receivable 3,352 12,216
Accrued dividend receivable 153,283 127,055
Investments, at fair value 64,690,883 69,868,077
Total assets 65,372,701 70,896,039
Liabilities
Payable for securities purchased 38,770 351,637
Redemptions payable 4,602 350,275
Accrued expenses 71,885 109,580
Total liabilities 115,257 811,492
Net assets attributable to holders of redeemable units 65,257,444$ 70,084,547$
Redeemable units (note 3) 9,650,269 12,124,415
Net assets attributable to holders of redeemable units per unit 6.76$ 5.78$
See accompanying notes to financial statements.

ACADIAN CORE INTERNATIONAL EQUITY FUNDStatements of Comprehensive Income (unaudited)
Six months ended June 30
2017 2016
Income:
Interest income for distribution purposes 133$ -$
Dividends 1,102,687 1,899,249
Revenue from securities lending (note 7) 13,784 23,034
Other changes in fair value of investments:
Net realized gain on sale of investments 6,079,238 2,685,919
Net realized gain (loss) on derivatives (12,823) -
Net foreign exchange gain (loss) on cash 6,199 (29,530)
Net other gain (loss) 32,887 (21,698)
Net change in unrealized appreciation (depreciation) of investments 3,417,942 (10,451,361)
Total income (loss) 10,640,047 (5,894,387)
Expenses:
Custodial fees 51,388 62,490
Operating fees 4,959 19,890
Audit fees 17,356 14,920
Legal fees - 495
Filing fees 2,976 2,985
Investment performance monitoring fees 4,959 4,475
Securityholder reporting costs 1,488 1,740
Independent Review Committee fees (note 8) 3,720 4,350
Transaction costs 35,281 52,787
Withholding taxes 108,591 179,892
Harmonized sales tax 10,904 14,090
Total expenses 241,622 358,114
Increase (decrease) in net assets attributable to holders of redeemable units 10,398,425$ (6,252,501)$
Increase (decrease) in net assets attributable to holders of redeemable units per unit
(based on the weighted average number of units outstanding during the period)1.03$ (0.44)$
See accompanying notes to financial statements.

ACADIAN CORE INTERNATIONAL EQUITY FUNDStatements of Changes in Net Assets Attributable to Holders of Redeemable Units (unaudited)
Six months ended June 30
2017 2016
Net assets attributable to holders of redeemable units, beginning of period $70,084,547 85,879,728$
Increase (decrease) in net assets attributable to holders of redeemable units 10,398,425 (6,252,501)
Distributions paid or payable to holders of redeemable units:
From net investment income (459,124) (1,438,897)
Redeemable unit transactions (note 3):
Issuance of units 929,106 3,856,237
Reinvestment of distributionsReinvestment of distributions 459,124 1,438,897
Redemption of units (16,154,634) (12,364,747)
Net decrease from redeemable unit transactions (14,766,404) (7,069,613)
Net decrease in net assets attributable to holders of redeemable units (4,827,103) (14,761,011)
Net assets attributable to holders of redeemable units, end of period 65,257,444$ 71,118,717$
See accompanying notes to financial statements.

ACADIAN CORE INTERNATIONAL EQUITY FUND
Statements of Cash Flows (unaudited)
Six months ended June 30
2017 2016
Cash flows from operating activities:
Increase (decrease) in net assets attributable to holders of redeemable units 10,398,425$ (6,252,501)$
Change in non-cash operating working capital:
Net change in unrealized foreign exchange (gain) loss on cash (6,199) 29,530
Net realized gain on sale of investments (6,079,238) (2,685,919)
Net change in unrealized (appreciation) depreciation of investments (3,417,942) 10,451,361
Purchase of investments (25,841,664) (24,500,921)
Proceeds from the sale of investments 40,517,808 29,135,350
Accrued dividend receivable (26,236) (28,875)
Accrued expenses (37,696) (31,716)
Cash provided by operating activities 15,507,258 6,116,309
Cash flows from financing activities:
Amount received from the issuance of units 937,970 3,859,416
Amount paid on redemptions of units (16,500,307) (10,158,909)
Cash used in financing activities (15,562,337) (6,299,493)
Decrease in cash (55,079) (183,184)
Net change in unrealized foreign exchange gain (loss) on cash 6,199 (29,530)
Cash, beginning of period 535,224 688,461
Cash, end of period 486,344$ 475,747$
Supplemental cash flow information:
Interest received 133$ -$
Dividends received, net of withholding taxes 967,860 1,690,482
See accompanying notes to financial statements.

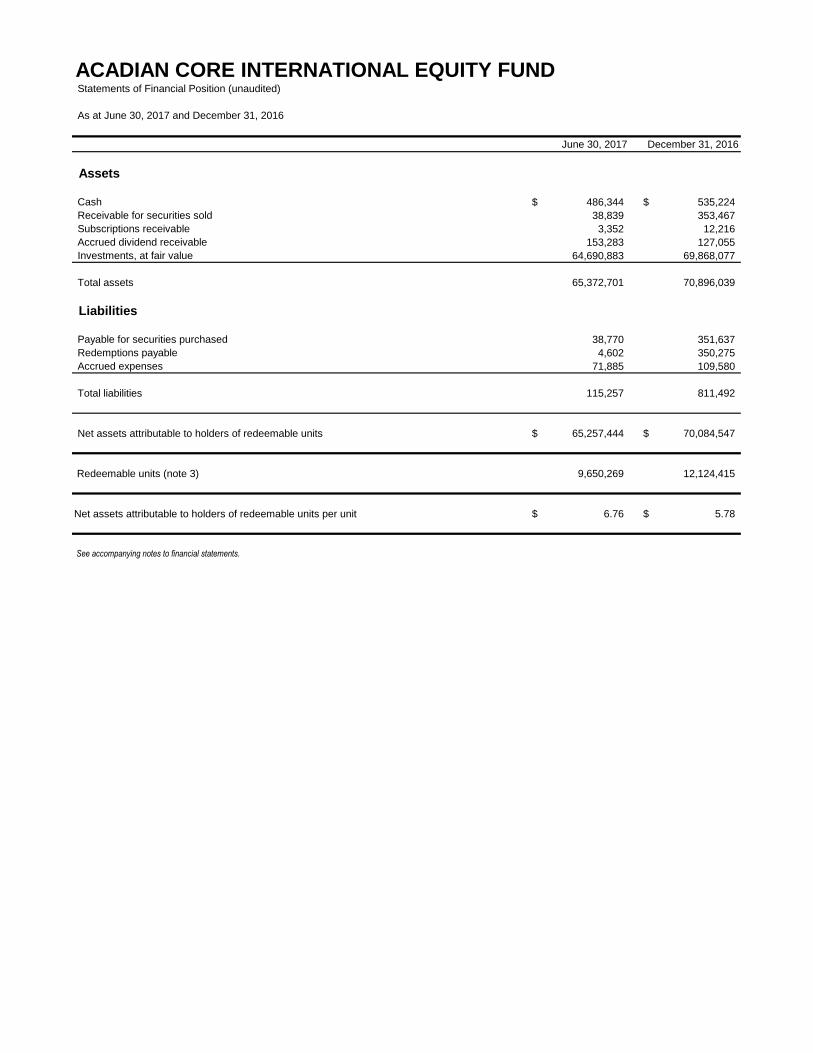
ACADIAN CORE INTERNATIONAL EQUITY FUNDSchedule of Investments (unaudited)
June 30, 2017
Number Average Fair
of Shares Cost $ Value $
COMMON AND PREFERRED SHARES — 99.13%
Australia — 2.99%
Aristocrat Leisure Ltd. 18,288 271,430 410,996
Codan Ltd. 33,782 42,870 78,747
Data# 3 Ltd. 15,663 11,708 26,915
Qantas Airways Ltd. 250,706 550,197 1,428,543
Watpac Ltd. 14,688 11,849 8,267
888,054 1,953,468
Austria — 1.21%
Erste Group Bank AG 11,729 462,094 582,442
Kapsch TrafficCom AG 861 36,477 59,686
Lenzing AG 366 57,805 85,061
Strabag SE 1,109 35,831 62,192
592,207 789,381
Belgium — 0.07%
Agfa Gevaert NV 3,449 13,620 21,763
Realdolmen 551 17,591 21,873
31,211 43,636
China — 0.27%
China Construction Bank Corp., Class 'H' 71,000 69,870 71,461
Delong Holdings Ltd. 12,200 16,992 17,146
Dutech Holdings Ltd. 68,000 31,522 29,184
Hopefluent Group Holdings Ltd. 94,000 34,269 41,753
JQW PLC 24,995 16,020 –
Sinotruk (Hong Kong) Ltd. 21,000 21,075 19,809
189,748 179,353
Denmark — 4.74%
Danske Bank AS 22,302 1,149,348 1,112,550
H. Lundbeck AS 12,226 554,021 890,008
Harboes Bryggeri AS 562 15,285 13,716
Novo Nordisk AS, Series 'B' 17,226 963,305 956,794
Vestas Wind Systems AS 1,008 102,470 120,691
2,784,429 3,093,759
Finland — 2.12%
Atria OYJ 1,777 24,979 26,979
Lemminkainen OYJ 1,192 30,426 45,377
Orion OYJ, Class 'B' 12,870 570,555 1,065,647
Raute OYJ 539 18,013 18,299
Restamax OYJ 367 3,902 4,545
Stora Enso OYJ, Series 'R' 1,477 13,117 24,744
UPM-Kymmene Corp. OYJ 5,379 120,774 198,870
781,766 1,384,461
France — 7.29%
Altamir SCA 2,658 40,256 64,175
Bigben Interactive 4,993 39,865 71,443
Bongrain SA 188 15,275 22,974
Compagnie des Alpes 5,688 144,785 247,028
Crédit Agricole SA 24,849 514,008 518,429
Credit Agricole Toulouse 31 43 5,164 6,865
Esso S.A.F. 417 43,443 35,763
Groupe Crit 195 14,104 23,541
Groupe Partouche SA, Registered 444 22,615 21,177
High Co. 2,612 32,591 24,181
Ipsen SA 4,602 273,431 816,973
Ipsos 3,278 132,922 159,503
Lectra 3,563 68,933 126,821
Linedata Services 286 13,629 22,207
Manitou BF SA 904 20,465 36,556
Mersen 743 19,732 31,641
PSA Peugeot Citroën SA 37,516 807,894 970,529
PSB Industries 265 19,709 19,634
Sogeclair 307 16,121 19,640
Synergie SA 1,710 41,122 109,168
UbiSoft Entertainment SA 18,561 196,090 1,365,860
Vetoquinol SA 552 29,902 41,798
2,512,056 4,755,906
Germany — 5.00%
Accentro Real Estate AG 947 12,996 12,386
Allianz AG, Registered 558 139,040 142,493
Biotest AG 3,681 75,100 120,226
CeWe Color Holding AG 581 60,280 63,538

Constantin Medien AG 21,091 56,415 64,043
Deutsche Lufthansa AG 32,078 696,157 946,736
Eckert & Ziegler AG 1,570 72,579 81,394
ELMOS Semiconductor AG 3,881 61,538 110,834
Evotec AG 11,282 61,414 233,791
Francotyp-Postalia Holding AG 6,048 41,459 53,303
Koenig & Bauer AG 124 4,485 10,877
KSB AG 76 40,176 49,504
Mensch und Maschine Software SE 4,071 56,076 115,808
Merck KGaA 3,239 208,863 507,358
MPH Mittelstaendische Pharma Holding AG 7,882 35,663 42,719
Muehlbauer Holding AG 434 26,951 27,482
Patrizia Immobilien AG 525 17,151 12,851
SAP AG 401 53,460 54,319
Schloss Wachenheim AG 561 12,961 14,135
Siemens AG, Registered 155 30,481 27,631
VERBIO Vereinigte BioEnergie AG 39,317 263,006 574,805
2,026,251 3,266,233
Guernsey — 0.04%
Eurocastle Investment Ltd. 1,964 24,800 24,815
Hong Kong — 0.36%
Allied Group Ltd. 4,000 35,186 32,607
Clear Media Ltd. 11,000 16,374 16,872
DMX Technologies Group Ltd. 131,000 28,798 –
Fountain Set (Holdings) Ltd. 98,000 17,486 16,630
FSE Engineering Holdings Ltd. 95,000 41,363 37,457
Lai Fung Holdings Ltd. 340,000 10,770 12,331
Lion Rock Group Ltd. 76,000 19,060 21,494
Lung Kee (Bermuda) Holdings Ltd. 88,000 46,764 51,972
Ming Fai International Holdings Ltd. 82,000 15,450 16,916
Sing Tao News Corp. Ltd. 68,000 11,793 11,086
Wheelock and Co. Ltd. 2,000 11,584 19,597
254,628 236,962
Indonesia — 0.27%
Indo Tambangraya Megah PT 68,600 101,592 115,646
PT Samudera Indonesia 2,600 3,326 1,545
Salim Ivomas Pratama TBK PT 1,070,100 69,136 57,352
174,054 174,543
Ireland — 0.61%
ICON PLC 3,144 181,499 399,288
Israel — 1.76%
Ashdar Building Co. Ltd. 18,999 19,727 18,299
Aspen Group Ltd. 9,366 23,414 22,409
Bank Hapoalim Ltd. 2,459 18,610 21,542
Dor Alon Energy In Israel (1988) Ltd. 1,087 20,002 24,567
Elco Ltd. 8,076 173,545 199,866
Electra Consumer Products (1970) Ltd. 12,422 240,485 323,601
Isras Investment Co. Ltd. 274 33,625 42,307
Knafaim Holdings Ltd. 3,015 29,305 41,796
Meitav Dash Investments Ltd. 14,093 53,288 75,734
Naphtha Israel Petroleum Corp. Ltd. 5,385 41,940 55,492
Scope Metals Group Ltd. 3,442 96,806 141,160
Tadiran Holdings Ltd. 4,966 134,921 181,004
885,668 1,147,777
Italy — 3.22%
Acsm - Agam SPA 5,023 14,249 14,040
COFIDE-Compagnia Finanziaria De Benedetti SPA 48,511 44,873 41,676
Danieli & C. Officine Meccaniche SPA 803 14,157 18,650
El.En. SPA 2,428 21,159 100,125
Enel SPA 36,591 265,570 254,414
Mediaset SPA 42,059 224,565 214,434
Recordati SPA 14,930 450,981 785,518
Saras Raffinerie 177,648 559,989 536,275
Servizi Italia SPA 306 1,757 2,085
Sogefi SPA 19,199 58,186 133,204
1,655,486 2,100,421
Japan — 18.12%
Aichi Bank Ltd. (The) 600 44,301 43,899
ARAKAWA CHEMICAL INDUSTRIAL LTD. 2,400 39,673 53,400
Arata Corp. 2,400 75,549 106,106
Argo Graphics Inc. 1,100 26,743 32,930
Asahi Glass Co. Ltd. 12,200 476,650 666,988
AXYZ Co. Ltd. 1,100 30,287 43,101
Dainichi Co. Ltd. 8,000 72,690 72,587
DAIOHS CORP. 1,700 24,737 24,955
Daito Trust Construction Co. Ltd. 4,700 963,786 950,405
Daiwa House Industry Co. Ltd. 25,200 883,844 1,117,899

Eidai Co. Ltd. 11,000 52,818 64,715
Excel Co. Ltd. 3,900 63,585 65,949
Faith Inc. 1,100 15,024 15,728
Fujitsu Ltd. 96,000 659,506 918,531
Fukuda Denshi Co. Ltd. 500 34,636 46,927
GRANDY HOUSE Corp. 200 807 985
GungHo Online Entertainment 20,900 70,366 69,814
Harima-Kyowa Co. Ltd. 500 12,843 10,853
HEIAN CEREMONY SERVICE CO. LTD. 1,200 11,222 13,010
Hitachi Ltd. 8,000 64,118 63,747
HOKKAIDO COCA - COLA BOTTLING CO. LTD. 2,000 13,720 16,251
Human Holdings Co. Ltd. 1,000 14,027 19,800
Hurxley Corp. 2,100 28,818 27,088
INNOTECH CORP. 6,200 54,379 47,727
ISHIHARA CHEMICAL CO. LTD. 1,000 18,427 20,574
Japan Post Holdings Co. Ltd. 11,700 192,172 188,515
Japan Securities Finance Co. Ltd. 18,500 90,363 124,235
JBCC Holdings Inc. 3,500 28,126 33,699
JMS Co. 7,000 23,581 26,295
KAMEI CORP. 9,300 104,170 164,249
Kanematsu Electronics Ltd. 3,200 79,042 127,605
KAWADEN CORP. 600 18,237 14,938
Kawasumi Laboratories Inc. 5,600 53,131 44,079
Kirin Holdings Co. Ltd. 2,700 72,907 71,434
Kita-Nippon Bank Ltd. (The) 3,400 111,629 127,720
Konami Holdings Corp. 8,100 364,264 584,207
Kyodo Printing Co. Ltd. 4,000 18,716 17,661
Maruhachi Holdings Co. Ltd. 500 5,173 4,704
MATSUI CONSTRUCTION CO. LTD. 2,400 30,429 24,744
Meiko Construction Co. Ltd. 3,100 33,268 32,320
mixi Inc. 5,100 310,425 368,424
Nagano Bank Ltd. (The) 700 13,771 16,101
NAKANO CORP. 19,000 141,232 135,060
Nihon Dengi Co. Ltd. 2,100 39,517 65,827
Nihon Eslead Corp. 3,500 53,643 74,193
Nihon Yamamura Glass Co. Ltd. 8,000 16,347 16,829
Nippon Telegraph & Telephone Corp. 23,600 994,482 1,448,450
NISSHIN FUDOSAN Co. Ltd. 3,300 15,053 22,314
Nittetsu Mining Co. Ltd. 1,000 62,807 69,928
NJS Co. Ltd. 1,700 26,918 26,998
NTT DOCOMO INC. 22,300 699,830 683,558
Ohmoto Gumi Co. Ltd. 2,000 19,307 20,828
Panasonic Corp. 6,800 98,864 119,782
PAPYLESS Co. Ltd. 2,200 28,775 75,014
PARKER CORP. 4,000 23,695 26,030
PCA Corp. 1,100 19,962 19,046
Pro-Ship Inc. 1,000 21,833 21,591
Recruit Holdings Co. Ltd. 14,100 342,185 314,701
SATO SHOJI Corp. 1,100 10,695 11,341
Scroll Corp. 13,300 54,138 58,416
Shibaura Mechatronics Corp. 6,000 15,124 23,440
Software Service Inc. 600 37,580 33,843
Sony Corp. 2,300 111,883 113,940
Sumitomo Corp. 12,000 216,188 202,780
Taisei Corp. 97,000 1,096,252 1,150,314
Taiyo Kagaku Co. Ltd. 1,000 14,090 14,829
Tomen Devices Corp. 800 18,752 20,592
TOMOKU CO. LTD. 3,000 10,416 13,211
TORII PHARMACEUTICAL CO. LTD. 4,700 139,851 148,686
Tsubakimoto Kogyo Co. Ltd. 6,000 25,692 30,306
Uchida Yoko Co. Ltd. 1,800 28,734 58,629
UNIRITA Inc. 900 18,857 18,132
Yagi & Co. Ltd. 700 14,791 13,957
YAMADA Consulting Group Co. Ltd. 300 22,748 26,145
YA-MAN LTD. 1,400 33,746 148,548
Yondenko Corp. 3,000 17,781 17,788
Yurtec Corp. 2,000 18,134 17,731
Zenkoku Hosho Co. Ltd. 1,500 83,720 79,666
9,895,582 11,827,342
Luxembourg — 0.30%
Ternium SA, ADR 5,349 123,673 195,134
Malaysia — 0.78%
Allianz Malaysia BHD 13,600 44,457 53,078
Batu Kawan BHD 3,200 17,828 18,298
Favelle Favco BHD 33,800 27,299 29,041
Petron Malaysia Refining & Marketing BHD 17,700 30,164 38,984
Tenaga Nasional BHD 72,900 329,988 311,860
V.S. Industry BHD 94,200 60,563 58,994
510,299 510,255

Mexico — 0.78%
Cemex SAB de CV, ADR 27,050 283,323 330,923
Corp Durango SA 11,279 19,057 21,932
Industrias CH SA, Series 'B' 3,810 24,702 24,604
Organizacion Soriana SA de CV, Series 'B' 24,698 77,918 74,961
Rassini SAB de CV 8,778 47,567 56,371
452,567 508,791
Netherlands — 8.06%
Accell Group NV 460 20,900 19,545
EXOR NV 12,629 368,026 886,500
Heineken NV 363 40,628 45,774
ING Groep NV 17,774 398,461 397,544
Kas Bank NV 2,779 36,220 40,340
Kendrion NV 1,630 69,091 86,436
Royal Dutch Shell PLC, Class 'A' 63,240 2,340,778 2,176,495
STMicroelectronics NV 33,952 735,534 634,064
Unilever NV 13,579 812,482 971,892
4,822,120 5,258,590
New Zealand — 0.53%
Air New Zealand Ltd. 63,197 121,114 195,908
Briscoe Group Ltd. 3,727 13,829 13,928
Gentrack Group Ltd. 5,910 23,626 27,369
Kathmandu Holdings Ltd. 31,345 53,165 60,805
NZME Ltd. 18,691 13,951 16,571
Sanford Ltd. 4,344 26,583 28,915
252,268 343,496
Norway — 2.56%
Aker ASA, Class 'A' 3,303 104,301 140,313
Kvaerner ASA 58,208 74,013 92,049
Norsk Hydro ASA 82,773 664,137 593,910
Selvaag Bolig ASA 13,819 89,069 68,988
Spectrum ASA 505 2,540 2,897
Statoil ASA 35,941 858,447 771,196
1,792,507 1,669,353
Philippines — 0.00%
Lopez Holdings Corp. 4,700 620 873
Poland — 0.88%
Emperia Holding SA 135 3,436 4,019
Polski Koncern Naftowy Orlen SA 12,171 328,012 476,969
Stalprodukt SA 506 76,964 91,067
408,412 572,055
Qatar — 0.23%
Ooredoo Q.S.C. 4,521 133,857 147,411
Russia — 0.22%
Sberbank of Russia PJSC, ADR 10,546 156,796 142,302
Singapore — 6.28%
800 Super Holdings Ltd. 28,000 34,945 34,862
Boustead Singapore Ltd. 36,100 27,872 29,965
BreadTalk Group Ltd. 21,100 28,392 29,754
China Sunsine Chemical Holdings Ltd. 25,200 16,637 18,303
CSE Global Ltd. 92,300 39,777 37,436
DBS Group Holdings Ltd. 81,800 582,361 1,600,237
Design Studio Group Ltd. 30,800 18,178 16,995
Frencken Group Ltd. 22,700 6,321 10,278
Genting Singapore PLC 667,100 744,309 682,720
k1 Ventures Ltd. 24,700 21,528 14,911
Micro-Mechanics Holdings Ltd. 44,700 45,341 49,752
NSL Ltd. 9,200 17,349 12,626
Oversea-Chinese Banking Corp. Ltd. 46,300 403,792 471,221
PEC Ltd. 39,400 22,661 22,670
Sing Investments & Finance Ltd. 6,900 8,751 9,567
Sunningdale Tech Ltd. 27,220 27,137 44,675
United Overseas Bank Ltd. 40,300 845,267 878,851
UOB-Kay Hian Holding Ltd. 43,900 57,826 55,901
Yanlord Land Group Ltd. 49,100 53,136 81,279
3,001,580 4,102,003
South Africa — 1.59%
Absa Bank Ltd., Preferred 456 38,021 33,598
Alexander Forbes Equity Holdings Proprietary Ltd. 194,377 114,971 133,901
FirstRand Ltd. 12,556 64,924 58,680
Hulamin Ltd. 25,627 16,582 14,529
Merafe Resources Ltd. 433,411 44,983 54,988
Standard Bank Group Ltd. 52,096 691,312 743,776
970,793 1,039,472
South Korea — 5.37%
LG Display Co. Ltd. 25,472 720,747 1,072,662
S&T Holdings Co. Ltd. 338 3,898 6,887
Samsung Electronics Co. Ltd. 535 616,899 1,443,473
Shinsegae Information & Communication Co. Ltd. 874 80,490 77,182
SK Hynix Inc. 11,795 731,790 902,368
2,153,824 3,502,572
Spain — 3.79%
ACS Actividades de Construccion y Servicios SA 27,888 23,693 28,916
ACS Actividades de Construcción y Servicios SA 27,888 1,139,010 1,397,264
Iberdrola SA 87,478 774,503 898,345
Saeta Yield SA 10,040 153,910 147,243
2,091,116 2,471,768
Sweden — 3.18%
Biotage AB 22,245 80,475 195,233
Catella AB 19,698 38,775 62,479
CellaVision AB 9,171 70,115 214,638
G5 Entertainment AB 1,885 36,862 74,157
Investor AB, Series 'B' 4,361 269,246 272,621
ProAct IT Group AB 1,847 40,399 58,158
Sandvik AB 5,153 111,013 105,129
Sectra AB, Series 'B' 1,282 23,797 34,248
Volvo AB, Series 'B' 47,865 1,069,573 1,058,326
1,740,255 2,074,989
Switzerland — 3.72%
Compagnie Financiere Tradition SA 168 17,965 21,234
Highlight Communications AG 281 1,509 2,149
Nestlé SA, Series 'B', Registered 19,749 1,976,942 2,234,979
Orell Fuessli Holding AG, Registered 192 27,973 34,057
STMicroelectronics NV 3,133 28,376 58,334
UBS Group AG 3,514 74,963 77,391
2,127,728 2,428,144
Taiwan — 0.40%
Hon Hai Precision Industry Co. Ltd., Registered, GDR 19,904 140,013 199,040
Hotung Investment Holdings Ltd. 35,100 57,466 61,911
197,479 260,951
Thailand — 0.82%
Esso Thailand PCL 139,600 31,553 53,904
Padaeng Industry PCL 63,300 53,066 48,884
POSCO-Thainox PCL 261,900 20,211 20,626
PTT Exploration and Production Public Co. Ltd. 8,600 26,287 28,358
Raimon Land PCL 648,300 30,885 30,486
Siam Cement Public Co. Ltd. (The) 18,200 341,762 350,683
503,764 532,941
United Kingdom — 11.57%
AstraZeneca PLC 12,475 682,534 1,080,643
AstraZeneca PLC, ADR 1,482 57,670 65,612
Bioventix PLC 633 17,344 20,396
BP PLC 133,164 1,250,416 994,708
BP PLC, ADR 15,123 651,544 680,534
Carnival PLC 11,055 745,991 947,379
Communisis PLC 32,148 22,325 27,658
Computacenter PLC 2,890 45,378 39,538
FDM Group Holdings PLC 1,644 15,445 21,064
Fiat Chrysler Automobiles NV 58,900 459,351 815,420
GlaxoSmithKline PLC 7,095 194,810 195,751
Hargreaves Services PLC 3,153 23,114 17,912
Hilton Food Group PLC 410 4,343 5,104
HSBC Holdings PLC 38,813 399,623 465,989
Indivior PLC 112,803 445,217 595,045
International Consolidated Airlines Group SA 85,068 898,342 875,612
Investec PLC 18,539 221,349 179,358
JD Sports Fashion PLC 63,893 322,426 377,244
Mondi PLC 2,508 89,595 85,210
Quantum Pharma PLC 7,079 22,000 6,673
Tribal Group PLC 15,804 21,774 21,428
Trinity Mirror PLC 20,610 20,863 34,160
6,611,454 7,552,438
TOTAL EQUITIES — 99.13% 50,928,551 64,690,883
TRANSACTION COSTS (34,773)
TOTAL INVESTMENT PORTFOLIO — 99.13% 50,893,778 64,690,883
OTHER ASSETS, NET OF LIABILITIES — 0.87% 566,561
NET ASSETS ATTRIBUTABLE TO HOLDERS OF REDEEMABLE UNITS — 100.00% 65,257,444
See accompanying notes to financial statements

ACADIAN CORE INTERNATIONAL EQUITY FUND Risk Disclosures (unaudited) June 30, 2017
1
1. Financial instruments risk:
Investment activities of the Acadian Core International Equity Fund (the "Fund") expose the
Fund to some financial instrument risks. The Fund's overall risk management program seeks
to minimize the potentially adverse effect of risk on the Fund's financial performance in a
manner consistent with the Fund's investment objectives and long-term investment time
horizon.
2. Risk management:
The Fund's objective is to achieve long-term investment returns through a portfolio of
international equities, which are sufficiently diversified to minimize investment risk. To achieve
its objective, the Fund invests in equities issued by companies outside of North America, based
primarily in Europe, Australia and the Far East. The Fund may hold an aggregate of up to 15%
in Emerging Markets and up to 5% in cash or cash equivalents.
Acadian Asset Management LLC, the Fund's sub-advisor (the "Sub-Advisor"), utilizes an active
"bottom-up" strategy with a value orientation and focuses on attractive stocks across the range
of the capitalization spectrum. Their strategy incorporates both active stock valuation and
active country and sector valuation techniques to target a diverse array of under-valued stocks
with positive earnings trends and prospects.
The Fund may enter into securities lending transactions. Securities lending transactions will be
used in conjunction with the Fund's other investment strategies in a manner considered most
appropriate by Integra Capital Limited (the "Trustee" and "Manager") to achieve the Fund's
investment objectives and to enhance the Fund's returns.
To assist with managing risk, the Manager also maintains a governance structure that oversees
the Fund's investment activities and monitors compliance with the Fund's stated investment
strategy and securities regulations.
The Fund invests in a range of investment strategies that exposes it to various types of risks, as
follows: credit risk, counterparty credit risk, currency risk, derivatives, interest rate risk, liquidity
risk, other market risk and concentration risk.
ACADIAN CORE INTERNATIONAL EQUITY FUND Risk Disclosures (unaudited) (continued) June 30, 2017
2
2. Risk management (continued):
(a) Credit risk:
Credit risk on financial instruments is the risk of a loss occurring as a result of the default of
an issuer on its obligation to an investment fund. Credit risk is managed by dealing with
issuers that are believed to be creditworthy and by regular monitoring of credit exposures.
Additionally, credit risk is reduced by diversification of issuer, industry and geography.
The carrying amount of the Fund's assets on the statements of financial position,
represents the maximum exposures to credit risk relating to financial assets and liabilities.
The Fund's activities may give rise to settlement risk. Settlement risk is the risk of loss due
to the failure of an entity to honour its obligations to deliver cash, securities or other assets
as contractually agreed. For the majority of transactions, the Fund mitigates this risk by
conducting settlements through a broker to ensure that a trade is settled only when both
parties have fulfilled their contractual settlement obligations.
As at June 30, 2017 and December 31, 2016, the Fund had no significant investments in
debt instruments and/or derivatives.
(b) Counterparty credit risk:
Counterparty credit risk primarily emanates from the use of over-the-counter derivatives.
This risk is minimized by selecting counterparties who have a minimum of "A" credit rating.
Ongoing monitoring of credit events/rating developments occurs to ensure the sustainable
credit quality of the counterparty. Various factors are considered in the assessment
process including fundamental components of the counterparty's profile (such as capital
adequacy, asset quality, profitability and liquidity) and credit ratings assigned to the
counterparty.
(c) Currency risk:
Changes in the value of the Canadian dollar compared to foreign currencies will affect the
value, in Canadian dollars, of any foreign securities and account balances held in the Fund.
From time to time, the Fund may manage currency risk through foreign currency hedging
strategies.
ACADIAN CORE INTERNATIONAL EQUITY FUND Risk Disclosures (unaudited) (continued) June 30, 2017
3
2. Risk management (continued):
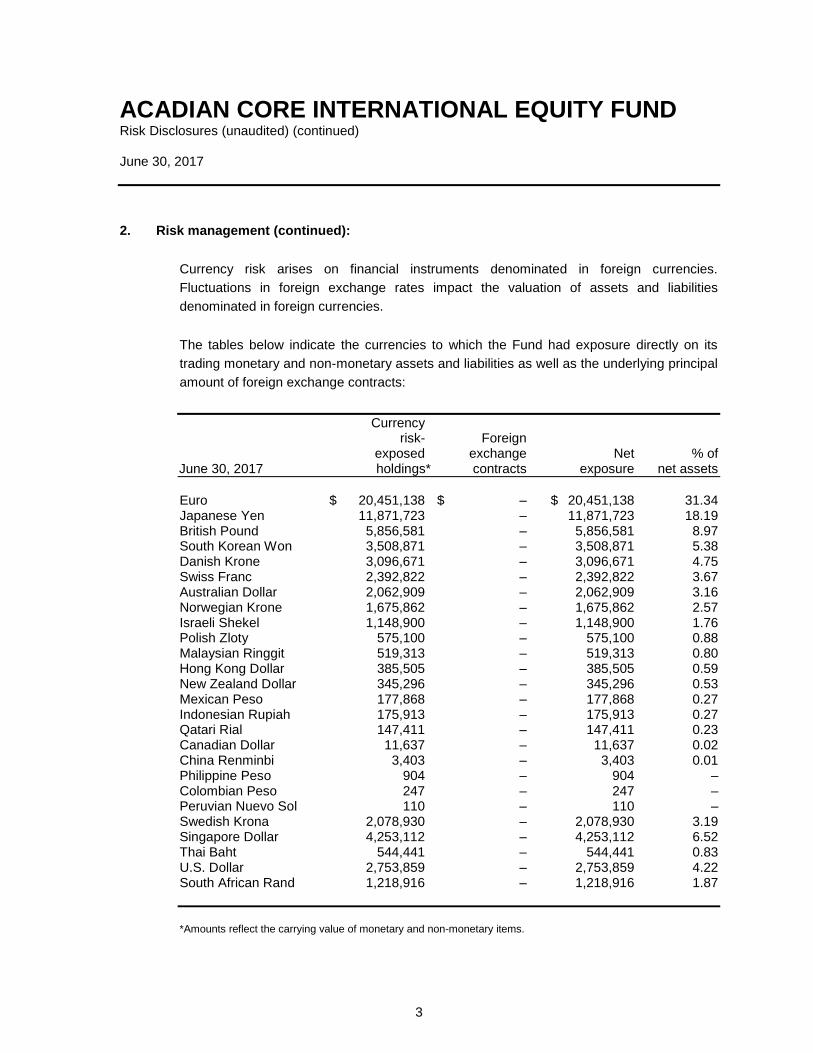
Currency risk arises on financial instruments denominated in foreign currencies.
Fluctuations in foreign exchange rates impact the valuation of assets and liabilities
denominated in foreign currencies.
The tables below indicate the currencies to which the Fund had exposure directly on its
trading monetary and non-monetary assets and liabilities as well as the underlying principal
amount of foreign exchange contracts:
Currency risk- Foreign exposed exchange Net % of June 30, 2017 holdings* contracts exposure net assets
Euro $ 20,451,138 $ – $ 20,451,138 31.34 Japanese Yen 11,871,723 – 11,871,723 18.19 British Pound 5,856,581 – 5,856,581 8.97 South Korean Won 3,508,871 – 3,508,871 5.38 Danish Krone 3,096,671 – 3,096,671 4.75 Swiss Franc 2,392,822 – 2,392,822 3.67 Australian Dollar 2,062,909 – 2,062,909 3.16 Norwegian Krone 1,675,862 – 1,675,862 2.57 Israeli Shekel 1,148,900 – 1,148,900 1.76 Polish Zloty 575,100 – 575,100 0.88 Malaysian Ringgit 519,313 – 519,313 0.80 Hong Kong Dollar 385,505 – 385,505 0.59 New Zealand Dollar 345,296 – 345,296 0.53 Mexican Peso 177,868 – 177,868 0.27 Indonesian Rupiah 175,913 – 175,913 0.27 Qatari Rial 147,411 – 147,411 0.23 Canadian Dollar 11,637 – 11,637 0.02 China Renminbi 3,403 – 3,403 0.01 Philippine Peso 904 – 904 – Colombian Peso 247 – 247 – Peruvian Nuevo Sol 110 – 110 – Swedish Krona 2,078,930 – 2,078,930 3.19 Singapore Dollar 4,253,112 – 4,253,112 6.52 Thai Baht 544,441 – 544,441 0.83 U.S. Dollar 2,753,859 – 2,753,859 4.22 South African Rand 1,218,916 – 1,218,916 1.87
*Amounts reflect the carrying value of monetary and non-monetary items.

ACADIAN CORE INTERNATIONAL EQUITY FUND Risk Disclosures (unaudited) (continued) June 30, 2017
4
2. Risk management (continued):
Currency risk- Foreign exposed exchange Net % of December 31, 2016 holdings* contracts exposure net assets
Euro $ 23,761,535 $ – $ 23,761,535 33.90 Japanese Yen 13,116,997 – 13,116,997 18.72 British Pound 9,010,676 – 9,010,676 12.86 Australian Dollar 3,708,658 – 3,708,658 5.29 U.S. Dollar 3,357,643 – 3,357,643 4.79 Swiss Franc 3,120,696 – 3,120,696 4.45 Swedish Krona 2,839,635 – 2,839,635 4.05 South Korean Won 2,373,822 – 2,373,822 3.39 Singapore Dollar 1,914,104 – 1,914,104 2.73 Norwegian Krone 1,327,628 – 1,327,628 1.89 South African Rand 1,054,878 – 1,054,878 1.51 Israeli Shekel 837,564 – 837,564 1.20 Malaysian Ringgit 792,106 – 792,106 1.13 Danish Krone 710,462 – 710,462 1.01 New Zealand Dollar 502,766 – 502,766 0.72 Polish Zloty 478,254 – 478,254 0.68 Hong Kong Dollar 352,219 – 352,219 0.50 Mexican Peso 292,978 – 292,978 0.42 Indonesian Rupiah 254,531 – 254,531 0.36 Qatari Rial 169,496 – 169,496 0.24 Thai Baht 131,903 – 131,903 0.19 Colombian Peso 22,957 – 22,957 0.03 Philippine Peso 1,201 – 1,201 – Peruvian Nuevo Sol 110 – 110 –
*Amounts reflect the carrying value of monetary and non-monetary items.
As at June 30, 2017 had the Canadian dollar strengthened or weakened by 5% in relation
to all currencies, with all other variables held constant, net assets attributable to holders of
redeemable units would have decreased or increased, respectively, by $3,262,290
(December 31, 2016 - $3,506,641). In practice, the actual trading results may differ from
this sensitivity analysis and the difference could be material.

ACADIAN CORE INTERNATIONAL EQUITY FUND Risk Disclosures (unaudited) (continued) June 30, 2017
5
2. Risk management (continued):
(d) Derivatives:
The Fund may utilize foreign exchange forward contract hedging in the management of
currency risk associated with its investment in foreign securities. The objective is to protect
the Fund from the possibility of capital losses on foreign-currency-denominated
investments due to increases in the value of the Canadian dollar. However, credit and
market risks associated with foreign exchange forward contracts potentially expose the
Fund to losses.
In order to minimize the possibility of losses arising from credit risk, the Fund deals only
with large financial institutions with a minimum of "A" credit rating.
Currency risk relates to the possibility that foreign exchange forward contracts change in
value due to fluctuations in currency prices. The foreign exchange forward contracts are
marked to market daily and the resulting unrealized gains or losses are recognized in the
statements of financial position.
The result of employing foreign exchange forward contracts is that the foreign exchange
gains and losses in the securities portfolio move substantially in opposite directions from
the gains and losses in the hedging portfolio.
As at June 30, 2017 and December 31, 2016, the Fund did not hold any foreign exchange
forward contracts.
(e) Interest rate risk:
Changes in market interest rates expose fixed-income securities, such as bonds, to interest
rate risk. Funds that hold income investments are exposed to this risk since changes in
prevailing market interest rates will affect the value of fixed-income securities.
Cash and cash equivalents comprise deposits with banks and highly liquid financial assets
with maturities of three months or less, as a result, there is no significant risk of changes in
their fair value and not subject to interest rate risk.
The majority of the Fund's financial assets and liabilities are non-interest bearing.
Accordingly, the Fund is not subject to significant amounts of risk due to fluctuations in the
prevailing levels of market interest rates.

ACADIAN CORE INTERNATIONAL EQUITY FUND Risk Disclosures (unaudited) (continued) June 30, 2017
6
2. Risk management (continued):
(f) Liquidity risk:
Liquidity risk is the possibility that investments of the Fund cannot be readily converted into
cash when required. The Fund may be subject to liquidity constraints because of
insufficient volume in the markets for the securities of the Fund or the securities may be
subject to legal or contractual restrictions on their resale. In addition, holders of
redeemable units may redeem their units on each valuation date. Liquidity risk is managed
by investing in securities that are traded in active markets and can be readily disposed of,
and by retaining sufficient cash and cash equivalent positions to maintain liquidity.
These liabilities are all current and are due within 90 days, with the exception of net assets
attributable to holders of redeemable units which are due upon request by the unitholder
(note 3).
(g) Other market risk:
Other market risk is the risk that the value of financial instruments will fluctuate as a result
of changes in market prices, other than those arising from interest rate risk or currency risk,
whether caused by factors specific to an individual investment, its issuer, or all factors
affecting all instruments traded in a market or market segment. All securities present a risk
of loss of capital.
The Sub-Advisor moderates this risk through a careful selection of investment strategies
and selection of securities and other financial instruments within the parameters of the
investment strategy developed by the Manager of the Fund.
The impact on net assets attributable to holders of redeemable units of the Fund as at June
30, 2017, due to a 5% increase or decrease in the Fund's benchmark (MSCI EAFE ND
Index), with all other variables held constant, would have been $3,089,940 (December 31,
2016 - $3,298,880). This calculation is based on the beta of the Fund, over the past 36
months. In practice, the actual trading results may differ from the sensitivity analysis and
indicated above the difference could be material.

ACADIAN CORE INTERNATIONAL EQUITY FUND Risk Disclosures (unaudited) (continued) June 30, 2017
7
2. Risk management (continued):
(h) Concentration risk:
Concentration risk arises as a result of the concentration of exposures within the same
category, whether it is geographical location, product type, industry sector or counterparty
type. The following is a summary of the Fund's concentration risk:
As a % of net assets June 30, 2017 December 31, 2016
Common and preferred shares Australia 2.99 5.29 Austria 1.21 1.86 Belgium 0.07 0.33 China 0.27 0.26 Denmark 4.74 1.01 Finland 2.12 4.64 France 7.29 7.87 Germany 5.00 5.97 Guernsey 0.04 – Hong Kong 0.36 0.28 Indonesia 0.27 0.36 Ireland 0.61 0.45 Israel 1.76 1.19 Italy 3.22 1.71 Japan 18.12 18.67 Luxembourg 0.30 0.25 Malaysia 0.78 1.11 Mexico 0.78 0.42 Netherlands 8.06 7.34 New Zealand 0.53 0.71 Norway 2.56 1.90

ACADIAN CORE INTERNATIONAL EQUITY FUND Risk Disclosures (unaudited) (continued) June 30, 2017
8
2. Risk management (continued):
As a % of net assets June 30, 2017 December 31, 2016
Philippines – – Poland 0.88 0.68 Qatar 0.23 0.24 Russia 0.22 0.02 Singapore 6.28 2.69 South Africa 1.59 1.27 South Korea 5.37 3.35 Spain 3.79 2.79 Sweden 3.18 4.13 Switzerland 3.72 5.35 Taiwan 0.40 1.63 Thailand 0.82 0.19 United Kingdom 11.57 14.98
Total investment portfolio 99.13 99.69 Other assets, net of liabilities 0.87 0.31
Net assets attributable to holders of redeemable units 100.00 100.00
3. Capital risk management:
The capital of the Fund is represented by issued redeemable units with no par value. The units
of the Fund are entitled to distributions, if any, and any redemptions are based on the Fund's
net asset value ("NAV") per unit. The Fund has no restrictions or specific capital requirements
on the subscriptions and redemptions of units. The relevant movements are shown on the
statements of changes in net assets attributable to holders of redeemable units. The Fund
endeavours to invest its subscriptions received in appropriate investments while maintaining
sufficient liquidity to meet redemptions.
ACADIAN CORE INTERNATIONAL EQUITY FUND Risk Disclosures (unaudited) (continued) June 30, 2017
9
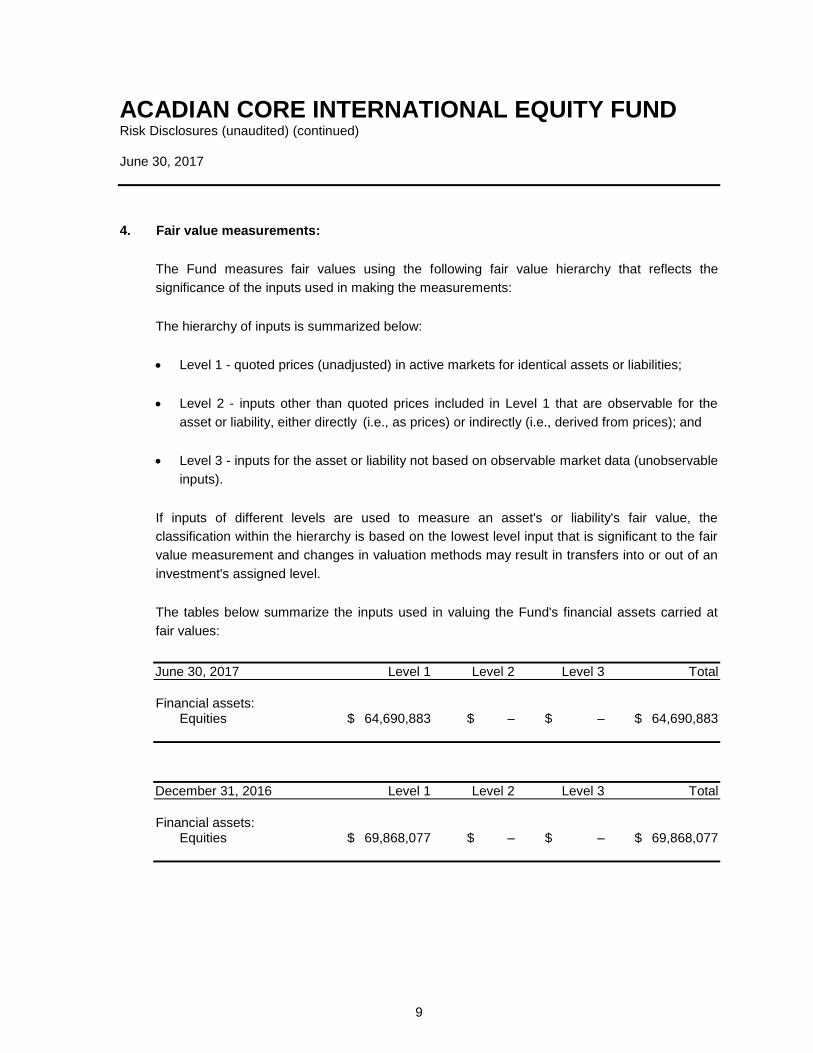
4. Fair value measurements:
The Fund measures fair values using the following fair value hierarchy that reflects the
significance of the inputs used in making the measurements:
The hierarchy of inputs is summarized below:
Level 1 - quoted prices (unadjusted) in active markets for identical assets or liabilities;
Level 2 - inputs other than quoted prices included in Level 1 that are observable for the
asset or liability, either directly (i.e., as prices) or indirectly (i.e., derived from prices); and
Level 3 - inputs for the asset or liability not based on observable market data (unobservable
inputs).
If inputs of different levels are used to measure an asset's or liability's fair value, the
classification within the hierarchy is based on the lowest level input that is significant to the fair
value measurement and changes in valuation methods may result in transfers into or out of an
investment's assigned level.
The tables below summarize the inputs used in valuing the Fund's financial assets carried at
fair values:
June 30, 2017 Level 1 Level 2 Level 3 Total
Financial assets:
Equities $ 64,690,883 $ – $ – $ 64,690,883
December 31, 2016 Level 1 Level 2 Level 3 Total
Financial assets:
Equities $ 69,868,077 $ – $ – $ 69,868,077

ACADIAN CORE INTERNATIONAL EQUITY FUND Risk Disclosures (unaudited) (continued) June 30, 2017
10
4. Fair value measurements (continued):
All fair value measurements above are recurring. Fair values are classified as Level 1 when the
related security or derivative is actively traded and a quoted price is available. If an instrument
classified as Level 1 subsequently ceases to be actively traded, it is transferred out of Level 1.
In such cases, instruments are reclassified into Level 2, unless the measurement of its fair
value requires the use of significant unobservable inputs, in which case it is classified as
Level 3.
The Fund's equity positions are classified as Level 1 when the security is actively traded and a
reliable price is observable.
For the period ended June 30, 2017, no investments were transferred from Level 1 to Level 2
as a result of the securities no longer being traded in an active market (December 31, 2016 -
nil). No investments were transferred from any level as a result of the securities now being
traded in an active market.
During the period ended June 30, 2016 and December 31, 2016, the reconciliation of
investments measured at fair value using unobservable inputs (Level 3) is presented as follows:
2017 2016
Balance, beginning of period $ – $ 15,364 Net transfers into and/or out of Level 3 – Change in unrealized depreciation – (15,364)
Balance, end of period $ – $ –
Total change in unrealized depreciation during the
period for assets held $ – $ (15,364)
As at June 30, 2017 and December 31, 2016, the potential impact of using reasonable possible
alternative assumptions for valuing Level 3 financial instruments would have minimal impact on
net assets.

ACADIAN CORE INTERNATIONAL EQUITY FUND Notes to Financial Statements (unaudited) June 30, 2017
11
1. Establishment of the Fund:
The Acadian Core International Equity Fund is an open-ended investment unincorporated trust
created under the laws of the Province of Ontario by a Declaration of Trust. The address of the
Fund's registered office is Suite 200, 2020 Winston Park Drive, Oakville, Ontario. The Fund
was established on March 3, 2000 and commenced operations on March 7, 2000.
Integra Capital Limited is the Manager and Trustee of the Fund and is the corporate entity
registered with the Canadian regulatory authorities. The Fund's assets are custodied at the
Canadian Imperial Bank of Commerce. The Manager is registered in every province as a
portfolio manager and exempt market dealer and is registered in the Provinces of
Newfoundland and Labrador, Ontario and Quebec as an investment fund manager. In the
Province of Ontario, the Manager is additionally registered as a commodity trading manager.
2. Basis of preparation:
(a) Basis of accounting:
The financial statements have been prepared in compliance with International Financial
Reporting Standards ("IFRS").
These financial statements were authorized for issue by the Manager on August 24, 2017.
(b) Basis of measurement:
These financial statements have been prepared on a historical cost basis, except for
financial assets and financial liabilities at fair value through profit or loss ("FVTPL") which
are presented at fair value.
(c) Functional and presentation currency:
These financial statements are presented in Canadian dollar, which is the Fund's functional
currency.

ACADIAN CORE INTERNATIONAL EQUITY FUND Notes to Financial Statements (unaudited) (continued) June 30, 2017
12
3. Significant accounting policies:
(a) Financial instruments
(i) Recognition, initial measurement and classification:
Financial assets and financial liabilities at FVTPL are initially recognized on the trade
date, which is the date on which the Fund becomes a party to the contractual
provisions of the instrument. Other financial assets and financial liabilities are
recognized on the date on which they are originated.
Financial assets and financial liabilities at FVTPL are initially recognized at fair value,
with transaction costs recognized in statements of comprehensive income. Financial
assets or financial liabilities not at FVTPL are initially recognized at fair value plus
transaction costs that are directly attributable to their acquisition or issue.
The Fund classifies financial assets and financial liabilities into the following categories:
Financial assets at FVTPL:
Held for trading ("HFT"): derivative financial instruments;
Designated as FVTPL: debt securities and equity investments; and
Financial assets at amortized cost: all other financial assets are classified as loans
and receivables.
Financial liabilities at FVTPL:
HFT: derivative financial instruments; and
Financial liabilities at amortized cost: all other financial liabilities are classified as
other financial liabilities.

ACADIAN CORE INTERNATIONAL EQUITY FUND Notes to Financial Statements (unaudited) (continued) June 30, 2017
13
3. Significant accounting policies (continued):
(ii) Fair value measurement:
Fair value is the price that would be received to sell an asset or paid to transfer a
liability in an orderly transaction between market participants at the measurement date
in the principal or, in its absence, the most advantageous market to which the Fund has
access at that date. The fair value of a liability reflects its non-performance risk.
When available, the Fund measures the fair value of an instrument using the quoted
price in an active market for that instrument. A market is regarded as active if
transactions for the asset or liability take place with sufficient frequency and volume to
provide pricing information on an ongoing basis. The Fund measures instruments
quoted in an active market at last sale or close price, where the close price falls within
the day's bid-ask spread. In circumstances where the close price is not within the day's
bid-ask spread, the Manager determines the point within bid-ask spread that is most
representative of fair value based on specific facts and circumstances. Investments
held include equities, listed warrants, options, short-term notes, treasury bills, bonds,
asset-backed securities and other debt instruments.
Investments held that are not traded in an active market are valued based on the
results of valuation techniques using observable market inputs where possible, on such
basis and in such manner established by the Manager. Investments in other pooled
funds are valued at the NAV per unit reported by each pooled fund. See risk
disclosures for more information about the Fund's fair value measurements.
The fair value of a forward contract is the gain or loss that would be realized if, on the
valuation date, the positions were closed out. The forward contract is valued using an
interpolation of the foreign exchange rate based on the length of the forward contract.
The change in fair value on forward contracts is reflected in the statements of
comprehensive income as change in unrealized appreciation (depreciation) on
derivatives. When the forward contracts are closed out, any gains or losses realized
are included in net realized gain (loss) on derivatives.
The fair values of foreign currency denominated investments and other foreign
currency denominated assets and liabilities are translated into Canadian dollars at
exchange rates prevailing on the reporting date.
ACADIAN CORE INTERNATIONAL EQUITY FUND Notes to Financial Statements (unaudited) (continued) June 30, 2017
14
3. Significant accounting policies (continued):
The fair values of other financial assets and liabilities approximate their carrying values
due to the short-term nature of these instruments.
(iii) Offsetting:
Financial assets and liabilities are offset and the net amount presented in the
statements of financial position when there is a legally enforceable right to offset the
recognized amounts and there is an intention to settle on a net basis, or to realize the
asset and settle the liability simultaneously.
Income and expenses are presented on a net basis for gains and losses from financial
instruments at FVTPL and foreign exchange gains and losses.
(b) Cash and cash equivalents:
Cash and cash equivalents consist of cash on deposit and short-term, interest-bearing
notes with a term to maturity of less than three months from the date of purchase.
(c) Investment transactions and income recognition:
The Fund follows the accrual method of recording investment income and expenses.
Security transactions are recorded on the trade date. Dividends are accrued as of the ex-
dividend date. Stock dividends are recorded in income based on the fair value of the
security on the ex-dividend date.
The interest available for distribution purposes shown on the statements of comprehensive
income represents the coupon interest received by the Fund accounted for on an accrual
basis. The Fund does not amortize premiums paid or discounts received on the purchase
of fixed income securities except for zero coupon bonds which are amortized on a straight-
line basis.
Realized gain on sale of investments and unrealized appreciation (depreciation) in
investments are determined on an average cost basis. Average cost does not include
amortization of premiums or discounts on fixed income securities with the exception of zero
coupon bonds.

ACADIAN CORE INTERNATIONAL EQUITY FUND Notes to Financial Statements (unaudited) (continued) June 30, 2017
15
3. Significant accounting policies (continued):
The Fund generally incurs withholding taxes imposed by certain countries on investment
income and capital gains. Such income and gains are recorded on a gross basis and the
related withholding taxes are shown as a separate expense in the statements of
comprehensive income.
(d) Cost of investments:
The cost of investments represents the amount paid for each security and is determined on
an average cost basis excluding commissions and other transaction costs.
(e) Transaction costs:
Commissions and other transaction costs are incremental costs that are directly attributable
to the acquisition, issue, or disposal of an investment, which include fees and commissions
paid to agents, advisors, levies by regulatory agencies and securities exchanges, and
transfer taxes and duties. Commissions and transaction costs are included as expenses in
the statements of comprehensive income.
(f) Securities lending transactions:
The Fund is permitted to enter into securities lending transactions. These transactions
involve the temporary exchange of securities for collateral with a commitment to re-deliver
the same securities at a future date. Income is earned from these transactions in the form
of fees paid by the counterparty. Income earned from these transactions is recognized on
an accrual basis and included in the statements of comprehensive income.
(g) Foreign currency translation:
The fair values of foreign currency denominated investments are translated into Canadian
dollars, using the prevailing rate of exchange on each valuation date. Income, expenses
and investment transactions in foreign currencies are translated into Canadian dollars at
the rate of exchange prevailing on the respective dates of such transactions. Foreign
exchange gains and losses are presented as net realized gain (loss) on foreign exchange,
except for those arising from financial instruments at FVTPL which are recognized as a
component within net realized gain on sale of investments and change in net unrealized
appreciation (depreciation) in the statements of comprehensive income.

ACADIAN CORE INTERNATIONAL EQUITY FUND Notes to Financial Statements (unaudited) (continued) June 30, 2017
16
3. Significant accounting policies (continued):
(h) Income taxes:
The Fund presently qualifies as a unit trust under the provisions of the Income Tax Act
(Canada), and accordingly, is not taxed on that portion of its taxable income, which is paid
or payable to unitholders at the end of the taxation year. The Fund has elected for a
December 31 taxation year end. The Fund pays out sufficient net income and net realized
capital gains so that it will not be subject to income taxes. Accordingly, no provision for
income taxes has been made in these financial statements.
Capital losses and non-capital losses incurred by the Fund cannot be allocated to
unitholders but capital losses may be carried forward indefinitely to reduce future realized
capital gains and non-capital losses may be carried forward for 20 taxation years to reduce
future net income for tax purposes. As at December 31, 2016, the Fund had non-capital
losses of nil (2015 - nil) and net capital losses carryforward of $19,503,409 (2015 -
$22,002,568).
Certain dividend and interest income received by the Fund are subject to withholding tax
imposed in the country of origin.
(i) Redeemable units:
For each Fund unit sold, the Fund receives an amount equal to the NAV per unit at the date
of sale, which amount is included in net assets attributable to holders of redeemable units.
Units are redeemable at the option of unitholders at their NAV on the redemption date. For
each unit redeemed, net assets attributable to holders of redeemable units are reduced by
the NAV of the unit at the date of redemption. The redeemable shares are measured at the
present value of the redemption amounts and are considered a residual amount of the net
assets attributable to holders of redeemable units.
The capital of the Fund is represented by issued redeemable units with no par value. The
units of the Fund are entitled to distributions, if any, and any redemptions are based on the
Fund's net asset attributable to holders of redeemable units per unit. The Fund has no
restrictions or specific capital requirements on the subscriptions and redemptions of the
units. The relevant movements are shown on the statements of changes in net assets
attributable to holders of redeemable units. The Fund endeavours to invest its
subscriptions received in appropriate investments while maintaining sufficient liquidity to
meet redemptions.

ACADIAN CORE INTERNATIONAL EQUITY FUND Notes to Financial Statements (unaudited) (continued) June 30, 2017
17
3. Significant accounting policies (continued):
Redeemable unit transactions during the periods were as follows:
June 30, 2017 December 31, 2016
Number of Number of Fund units Amount Fund units Amount
Redeemable units issued 148,460 $ 929,106 955,744 $ 5,128,278
Redeemable units redeemed (2,691,579) (16,154,632) (3,955,381) (21,217,978)
Redeemable units issued on reinvestments 68,973 459,124 364,567 1,981,487
The number of issued and outstanding units as at June 30, 2017 is 9,650,269 (December
31, 2016 - 12,124,415).
Net assets attributable to holders of redeemable units is calculated for each unit of the
Fund by taking the proportionate share of the Fund's net assets attributable to holders of
redeemable units and dividing by the number of units outstanding on the valuation date.
The increase in net assets attributable to holders of redeemable units per unit in the
statements of comprehensive income represents the change in net assets attributable to
holders of redeemable units divided by the weighted average number of units outstanding
during the reporting period. Income, expenses other than management fees, and realized
and unrealized capital gains (losses) are distributed in proportion to the amount invested in
them.
The weighted average number of units outstanding for the period ended June 30, 2017 is
10,071,643 (June 30, 2016 - 14,134,686).
The Fund's units are classified as a liability under International Accounting Standard
("IAS") 32, Financial Instruments - Presentation as there is a requirement to make cash
distributions to unitholders, if requested. The units are measured at the present value of
the redemption amount and are considered a residual amount.
As at June 30, 2017 and December 31, 2016, there is no difference between net assets
attributable to holders of redeemable units and NAV attributable to holders of redeemable
units.

ACADIAN CORE INTERNATIONAL EQUITY FUND Notes to Financial Statements (unaudited) (continued) June 30, 2017
18
3. Significant accounting policies (continued):
(j) Receivable or payable for securities sold or purchased:
In accordance with the Fund's policy of trade date accounting for regular way sale and
purchase transactions, sales or purchase transactions awaiting settlement represent
amounts receivable or payable for securities sold/purchased, but not yet settled as at the
reporting date.
(k) Future accounting changes:
The International Accounting Standards Board has issued the following new standards and
amendments to existing standards that are not yet effective.
IFRS 9, Financial Instruments ("IFRS 9"):
IFRS 9, published in July 2014, replaces the existing guidance in IAS 39, Financial
Instruments - Recognition and Measurement ("IAS 39"). IFRS 9 includes revised guidance
on the classification and measurement of financial instruments, a new expected credit loss
model for calculating impairment on financial assets, and new general hedge accounting
requirements. It also carries forward the guidance on financial instruments from IAS 39.
IFRS 9 is effective for annual reporting periods beginning on or after January 1, 2018, with
early adoption permitted. The Manager is currently assessing the impact of this new
standard on the Fund's financial statements.
4. Critical accounting estimates and judgments:
In preparing these financial statements, the Manager has made judgments, estimates and
assumptions that affect the application of accounting policies and the reported amounts of
assets, liabilities, income and expenses. Actual results may differ from these estimates.
Estimates and underlying assumptions are reviewed on an ongoing basis. Revisions to
estimates are recognized prospectively. The most significant accounting judgment and
estimate that the Fund has made in preparing the financial statements is determining the fair
value measurement of derivatives and investments not quoted in an active market, if any.
See note 3 for more information on the fair value measurement of the Fund's financial
instruments.

ACADIAN CORE INTERNATIONAL EQUITY FUND Notes to Financial Statements (unaudited) (continued) June 30, 2017
19
5. Net changes from financial instruments at FVTPL:
Net changes in fair value on financial assets and financial liabilities at FVTPL are presented in
the statements of comprehensive income and are comprised of the following: net realized gain
on sale of investments, net change in unrealized appreciation (depreciation) of investments,
interest income for distribution purposes and dividends. Their classifications between held for
trading and designated at fair value are presented in the following table:
Total income June 30, 2017 June 30, 2016
Financial assets at FVTPL:
Designated at inception $10,600,000 $ (5,866,193)
6. Brokerage commissions:
Brokerage commissions on portfolio transactions may also include research services provided
to the Sub-Advisors. The value of the research services paid to certain brokers for the periods
ended June 30, 2017 and June 30, 2016 was nil.
7. Securities lending:
The Fund lends portfolio securities from time to time in order to earn additional income. The
Fund has entered into a securities lending program with Bank of New York Mellon. The
aggregate market value of all securities cannot exceed 50% of the net assets attributable to
holders of redeemable units of the Fund. The Fund receives collateral in the form of debt
obligations of the Government of Canada and any other Sovereign States and Canadian
provincial governments, against the loaned securities. The Fund maintains a minimum
collateral requirement of 102% for North American equities and 105% for Non-North American
equities of the market value of the loaned securities during the period of the loan. As at June
30, 2017, certain securities shown in the statements of financial position with a market value of
$1,801,630 (December 31, 2016 - $2,318,496) had been loaned as part of the securities
lending program. The counterparty has pledged securities with a market value of $1,923,698
(December 31, 2016 - $2,500,321) as collateral for such loans. Under the terms of the
program, the Fund may instruct that securities be returned within three days.

ACADIAN CORE INTERNATIONAL EQUITY FUND Notes to Financial Statements (unaudited) (continued) June 30, 2017
20
7. Securities lending (continued):
The table below shows a reconciliation of the gross amount generated from the securities
lending transactions of the Fund to the revenue from the securities lending disclosed in the
statements of comprehensive income:
June 30, 2017 June 30, 2016
% of gross % of gross securities securities lending lending Amount revenue Amount revenue
Gross securities
lending revenue $ 23,739 100.0 $ 39,022 100.0 Withholding taxes (800) (3.4) (717) (1.9) Agent fees - Bank of
New York Mellon Corp. (The) (9,155) (38.6) (15,271) (39.1)
Securities lending revenue $ 13,784 58.0 $ 23,034 59.0
8. Related party transactions and fund expenses:
The Manager administers and regulates the day-to-day operations of the Fund. In return for
the services provided, the Manager receives management fees from the Fund's holders of
redeemable units, based on the NAV of the Fund. These management fees are paid either by
a redemption of units or the unitholder, if an institution, may be invoiced and payment will be
delivered to the Manager.
The Manager may allocate various operating costs to the Fund. These expenses include a
portion of the expenses related to trust accounting, fund accounting and administration
functions that are performed by the Manager on behalf of the Fund. These costs are reported
in the operating expenses of the Fund reported in the statements of comprehensive income.
The Fund is responsible for its operating expenses relating to the carrying on of its business,
including custodial services, legal, Independent Review Committee fees, audit fees, transfer
agency services relating to the issue and redemption of units, and the cost of financial and
other reports in compliance with all applicable laws, regulations and policies. The Manager
pays for such expenses on behalf of the Fund, except for certain expenses such as interest and
taxes, and is then reimbursed by the Fund.
ACADIAN CORE INTERNATIONAL EQUITY FUND Notes to Financial Statements (unaudited) (continued) June 30, 2017
21
8. Related party transactions and fund expenses (continued):
The Manager at its discretion may agree to waive or absorb certain expenses associated with
the Fund. For the period ended June 30, 2017, expenses absorbed by the Manager in the
amount of nil (June 30, 2016 - nil) are shown in the statements of comprehensive income.
Such absorption or waiver, where applicable, may be terminated by the Manager at any time
without notice.
The Independent Review Committee (the "IRC") for the Fund consists of three industry
professionals, none of whom have an interest in the Fund Manager or have an interest in the
Fund outside of their roles as members of the IRC. For the period ended June 30, 2017, the
fees paid to the IRC are disclosed in the statements of comprehensive income in the amount of
$3,720 (June 30, 2016 - $4,350).
Employees of the Manager may hold interests in the Fund via the company's group retirement
plan or through a broker. However, the employees' interests cumulatively represent less than
5% of the Fund's outstanding units.