Embed Size (px)
Citation preview

In the following brief, Hanover Research presents the results of
the Academic Standards Stakeholder Survey administered on
behalf of Colorado Department of Education.
ACADEMIC STANDARDS STAKEHOLDER SURVEY ANALYSIS
Prepared for Colorado Department of Education
December 2016
Hanover Research | December 2016
© 2016 Hanover Research 2
TABLE OF CONTENTS
Executive Summary and Key Findings ............................................................................... 3
INTRODUCTION ........................................................................................................................... 3
KEY FINDINGS ............................................................................................................................. 3
Section I: General Perceptions of the CAS ........................................................................ 5
Section II: CAS Revisions ................................................................................................ 15
Section III: Respondent Characteristics .......................................................................... 23

Hanover Research | December 2016
© 2016 Hanover Research 3
EXECUTIVE SUMMARY AND KEY FINDINGS
INTRODUCTION
In this brief, Hanover Research presents the results of the Academic Standards Stakeholder Survey administered on behalf of Colorado Department of Education. The survey aims to gather information on stakeholder perceptions of the Colorado Academic Standards (CAS). In total, the survey received 2,833 responses, from all 64 counties except Custer County, Dolores County, and Hinsdale County, and 146 out of 186 school districts. The report consists of three sections: Section I: General Perceptions of the CAS; Section II: CAS Revisions; and Section III: Respondent Characteristics. We primarily present results for fixed-response questions, highlighting notable differences in responses across sub-groups for a select number of questions. Results are typically presented with the top two answer options together (e.g., “very high” and “high” together), unless noted otherwise. In addition to this brief, an accompanying data supplement contains a complete distribution of overall survey results and results segmented by the following categories:
Role
Familiarity with the CAS
Overall impression of the CAS
School type (K-12 educators only)
Role in school/district (K-12 educators only)
Grade level (K-12 educators only)
Subject (K-12 teachers only)
Level of training received to teach the CAS (K-12 teachers only)
Level of support received to teach the CAS (K-12 teachers only)
The data supplement also includes all open-ended comments verbatim and a description of the various subgroups included in the analysis. Finally, all responses of “not sure” were excluded from both the report and the data supplement.
KEY FINDINGS
Overall, around half of all survey respondents view the CAS positively (49%). Education policy advocates (71%) and K-12 educators (53%) – especially those who work at a traditional public school (i.e., non-charter/magnet/innovation) – are more supportive of the CAS than other respondent groups. In addition, K-12 teachers who receive higher levels of training and support have more favorable opinions of the CAS than those with less training or support.
Hanover Research | December 2016
© 2016 Hanover Research 4
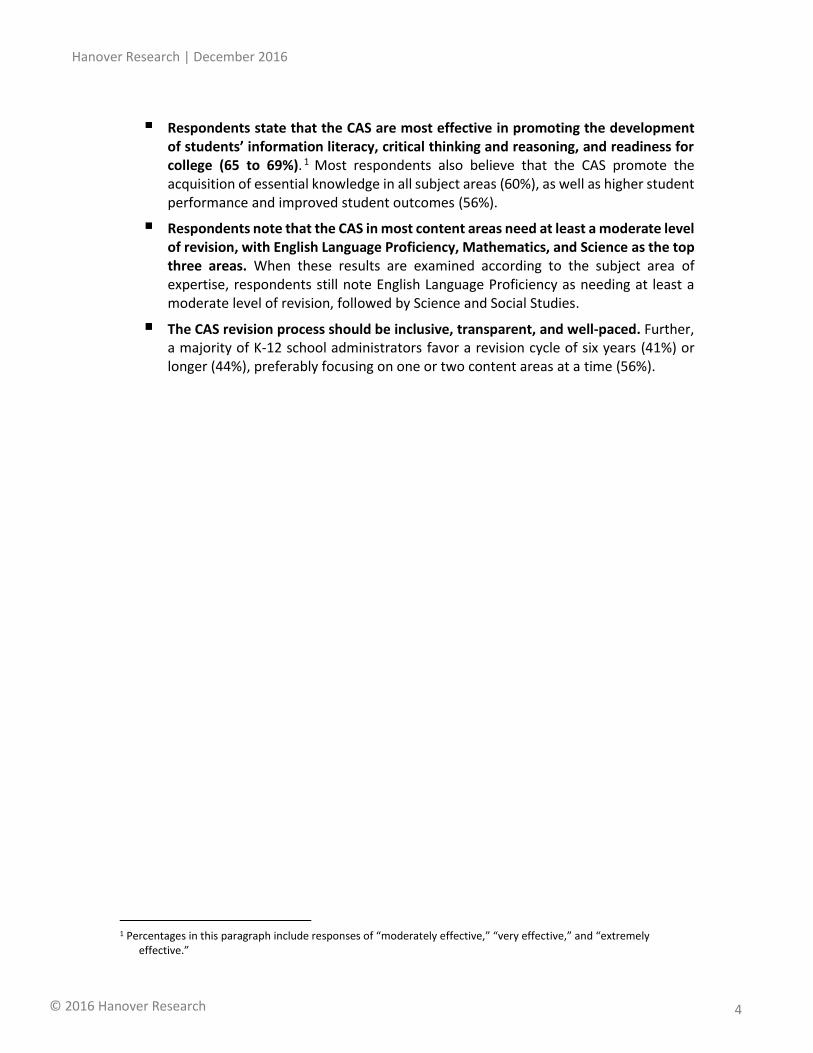
Respondents state that the CAS are most effective in promoting the development of students’ information literacy, critical thinking and reasoning, and readiness for college (65 to 69%). 1 Most respondents also believe that the CAS promote the acquisition of essential knowledge in all subject areas (60%), as well as higher student performance and improved student outcomes (56%).
Respondents note that the CAS in most content areas need at least a moderate level of revision, with English Language Proficiency, Mathematics, and Science as the top three areas. When these results are examined according to the subject area of expertise, respondents still note English Language Proficiency as needing at least a moderate level of revision, followed by Science and Social Studies.
The CAS revision process should be inclusive, transparent, and well-paced. Further, a majority of K-12 school administrators favor a revision cycle of six years (41%) or longer (44%), preferably focusing on one or two content areas at a time (56%).
1 Percentages in this paragraph include responses of “moderately effective,” “very effective,” and “extremely
effective.”
Hanover Research | December 2016
© 2016 Hanover Research 5
SECTION I: GENERAL PERCEPTIONS OF THE CAS
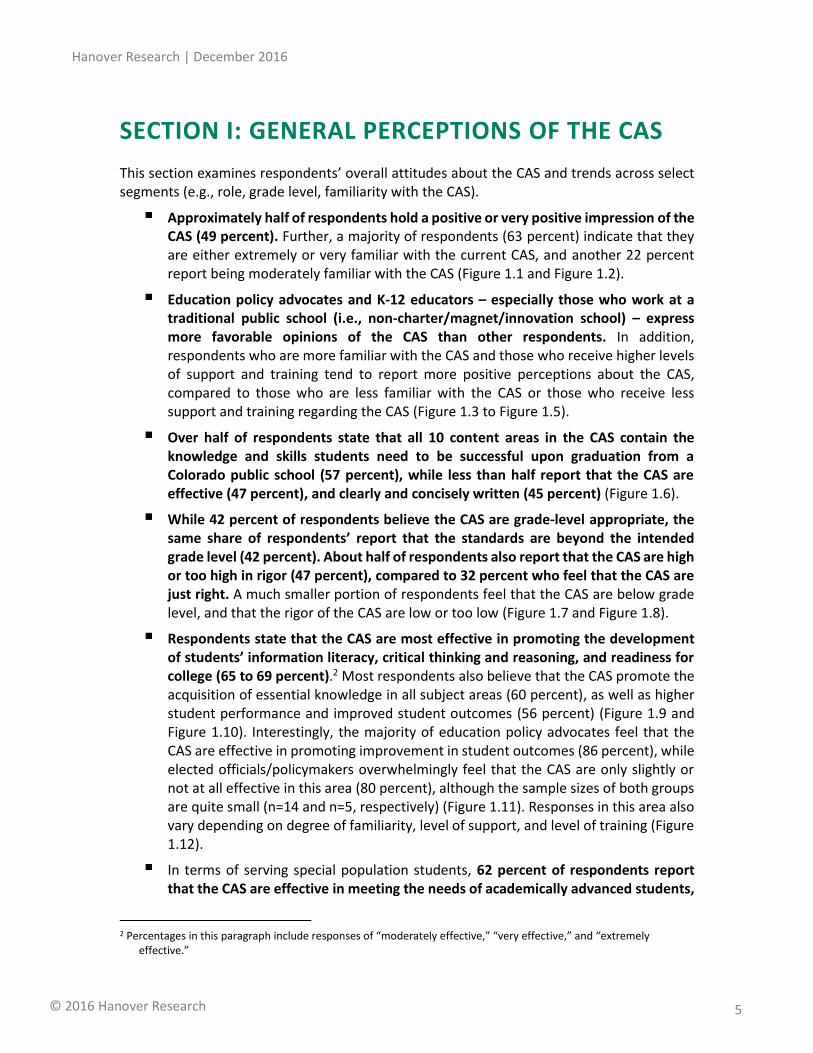
This section examines respondents’ overall attitudes about the CAS and trends across select segments (e.g., role, grade level, familiarity with the CAS).
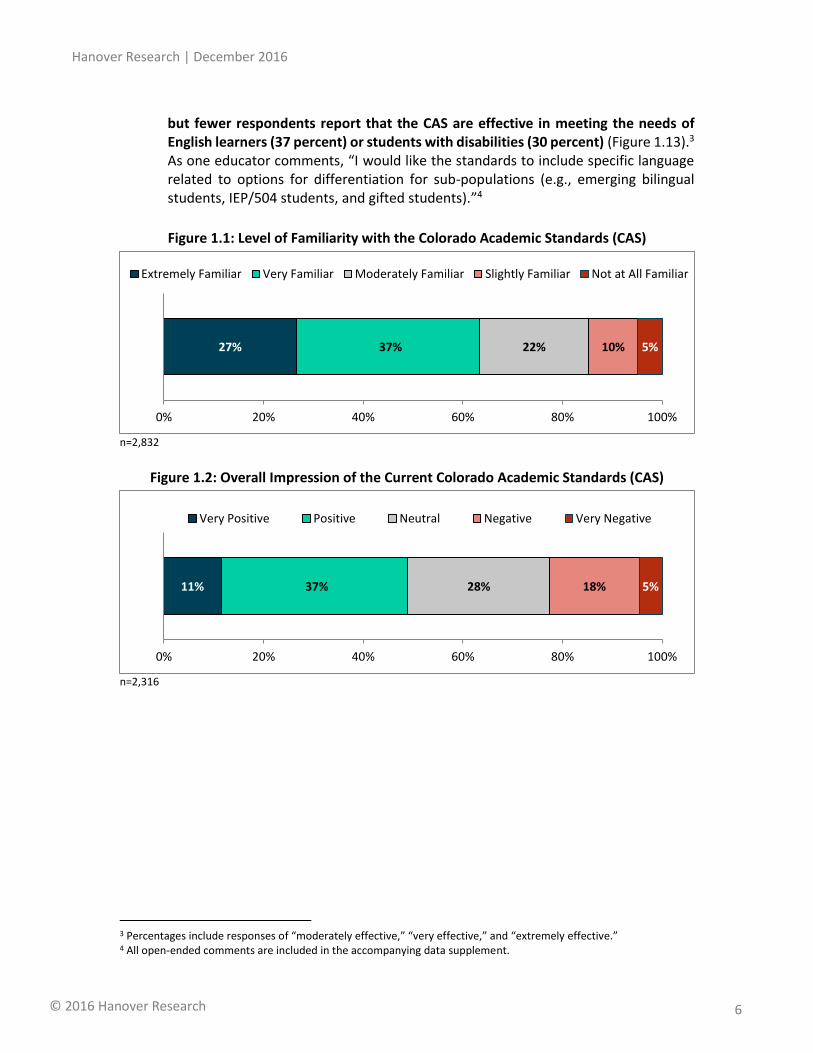
Approximately half of respondents hold a positive or very positive impression of the CAS (49 percent). Further, a majority of respondents (63 percent) indicate that they are either extremely or very familiar with the current CAS, and another 22 percent report being moderately familiar with the CAS (Figure 1.1 and Figure 1.2).
Education policy advocates and K-12 educators – especially those who work at a traditional public school (i.e., non-charter/magnet/innovation school) – express more favorable opinions of the CAS than other respondents. In addition, respondents who are more familiar with the CAS and those who receive higher levels of support and training tend to report more positive perceptions about the CAS, compared to those who are less familiar with the CAS or those who receive less support and training regarding the CAS (Figure 1.3 to Figure 1.5).
Over half of respondents state that all 10 content areas in the CAS contain the knowledge and skills students need to be successful upon graduation from a Colorado public school (57 percent), while less than half report that the CAS are effective (47 percent), and clearly and concisely written (45 percent) (Figure 1.6).
While 42 percent of respondents believe the CAS are grade-level appropriate, the same share of respondents’ report that the standards are beyond the intended grade level (42 percent). About half of respondents also report that the CAS are high or too high in rigor (47 percent), compared to 32 percent who feel that the CAS are just right. A much smaller portion of respondents feel that the CAS are below grade level, and that the rigor of the CAS are low or too low (Figure 1.7 and Figure 1.8).
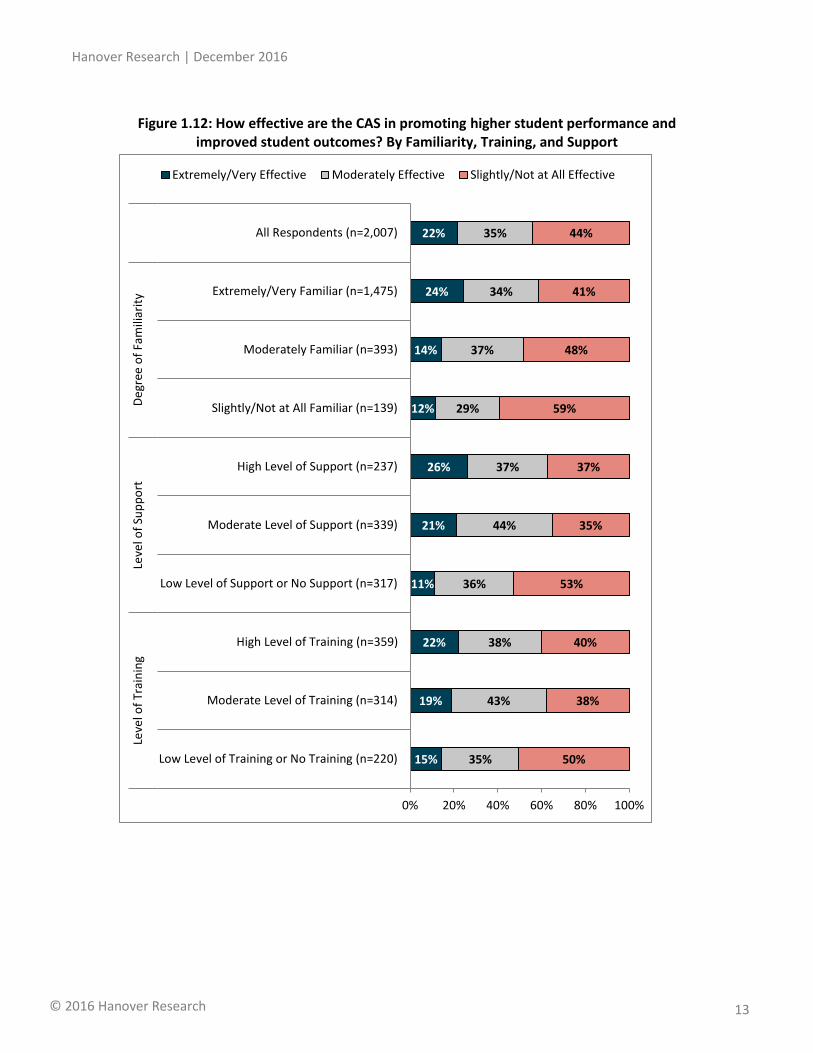
Respondents state that the CAS are most effective in promoting the development of students’ information literacy, critical thinking and reasoning, and readiness for college (65 to 69 percent).2 Most respondents also believe that the CAS promote the acquisition of essential knowledge in all subject areas (60 percent), as well as higher student performance and improved student outcomes (56 percent) (Figure 1.9 and Figure 1.10). Interestingly, the majority of education policy advocates feel that the CAS are effective in promoting improvement in student outcomes (86 percent), while elected officials/policymakers overwhelmingly feel that the CAS are only slightly or not at all effective in this area (80 percent), although the sample sizes of both groups are quite small (n=14 and n=5, respectively) (Figure 1.11). Responses in this area also vary depending on degree of familiarity, level of support, and level of training (Figure 1.12).
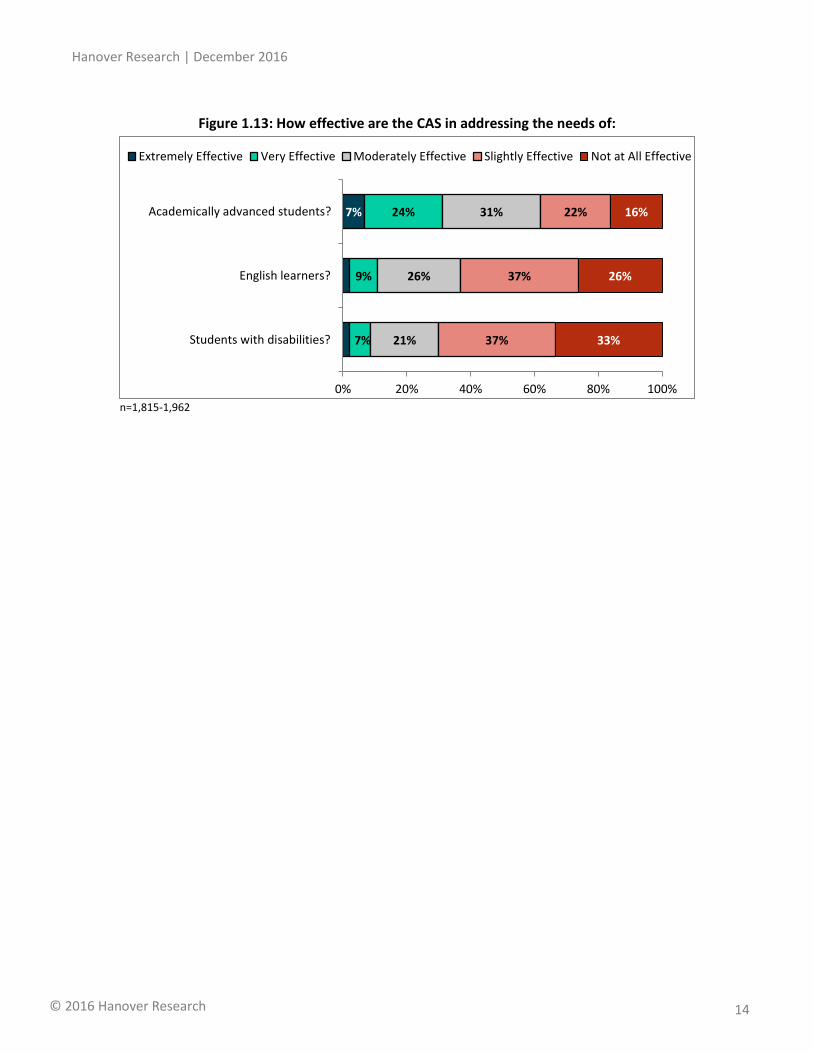
In terms of serving special population students, 62 percent of respondents report that the CAS are effective in meeting the needs of academically advanced students,
2 Percentages in this paragraph include responses of “moderately effective,” “very effective,” and “extremely
effective.”
Hanover Research | December 2016
© 2016 Hanover Research 6
but fewer respondents report that the CAS are effective in meeting the needs of English learners (37 percent) or students with disabilities (30 percent) (Figure 1.13).3
As one educator comments, “I would like the standards to include specific language related to options for differentiation for sub-populations (e.g., emerging bilingual students, IEP/504 students, and gifted students).”4
Figure 1.1: Level of Familiarity with the Colorado Academic Standards (CAS)
n=2,832
Figure 1.2: Overall Impression of the Current Colorado Academic Standards (CAS)
n=2,316
3 Percentages include responses of “moderately effective,” “very effective,” and “extremely effective.” 4 All open-ended comments are included in the accompanying data supplement.
27% 37% 22% 10% 5%
0% 20% 40% 60% 80% 100%
Extremely Familiar Very Familiar Moderately Familiar Slightly Familiar Not at All Familiar
11% 37% 28% 18% 5%
0% 20% 40% 60% 80% 100%
Very Positive Positive Neutral Negative Very Negative

Hanover Research | December 2016
© 2016 Hanover Research 7
Figure 1.3: Positive Impression of the Current Colorado Academic Standards (CAS) By Role
Percentage of Very Positive/Positive
55%
22%
29%
32%
33%
44%
44%
45%
50%
51%
53%
71%
49%
0% 20% 40% 60% 80%
Other (n=99)
Business owner (n=9)
Media (n=14)
Parent (n=236)
Student (n=90)
Educator at an institution for higher education(n=147)
Elected official/policymaker (n=9)
General public residing in Colorado/Coloradotaxpayer or member of community organization
(n=62)
State agency staff (n=36)
Professional educator association member (n=39)
Educator in a K-12 school system (n=1,558)
Education policy advocate (n=17)
All Respondents (n=2,316)

Hanover Research | December 2016
© 2016 Hanover Research 8
Figure 1.4: Positive Impression of the Current Colorado Academic Standards (CAS)
By Type of K-12 School
Percentage of Very Positive/Positive
Figure 1.5: Positive Impression of the Current Colorado Academic Standards (CAS) By Familiarity, Training, and Support
Percentage of Very Positive/Positive
40%
13%
44%
54%
49%
0% 10% 20% 30% 40% 50% 60%
Other (n=47)
Independent/private school (n=8)
Charter/magnet/innovation school (n=91)
Public school (non-charter/magnet/innovation) (n=1,421)
All Respondents (n=2,316)
38%
54%
57%
43%
51%
62%
20%
39%
56%
49%
0% 20% 40% 60% 80% 100%
Low Level of Training or No Training (n=237)
Moderate Level of Training (n=322)
High Level of Training (n=363)
Low Level of Support or No Support (n=335)
Moderate Level of Support (n=349)
High Level of Support (n=238)
Slightly/Not at All Familiar (n=206)
Moderately Familiar (n=489)
Extremely/Very Familiar (n=1,621)
All Respondents (n=2,316)
Leve
l of
Trai
nin
gLe
vel o
f Su
pp
ort
De
gree
of
Fam
iliar
ity

Hanover Research | December 2016
© 2016 Hanover Research 9
Figure 1.6: The CAS in all ten content areas...
n=2,267-2,307
Figure 1.7: How rigorous are the CAS? By School Level
8%
9%
10%
10%
12%
12%
37%
38%
42%
43%
44%
46%
20%
21%
19%
19%
19%
17%
26%
24%
23%
21%
19%
20%
9%
9%
6%
7%
6%
6%
0% 20% 40% 60% 80% 100%
...are clearly and concisely written.
...are effective (i.e., achieve the intendedoutcomes for Colorado's students).
...are comprehensive (i.e., include all of theknowledge and skills needed).
...are detailed enough for implementation.
...are relevant to students' college and careerreadiness.
...contain the knowledge and skills studentsneed to be successful upon graduation from a
Colorado public school.
Strongly Agree Agree Neither Agree nor Disagree Disagree Strongly Disagree
9%
14%
17%
14%
11%
14%
37%
36%
39%
40%
36%
34%
35%
33%
33%
34%
43%
32%
17%
15%
10%
11%
10%
17%
0% 20% 40% 60% 80% 100%
Grade 9-12 (n=580)
Grade 6-8 (n=634)
Grade 3-5 (n=625)
K-2 (n=581)
Early childhood (n=200)
All Respondents (n=2,062)
Too High High Just Right Low Too Low

Hanover Research | December 2016
© 2016 Hanover Research 10
Figure 1.8: How grade-level appropriate are the CAS? By School Level
12%
17%
21%
18%
14%
17%
26%
29%
30%
30%
29%
26%
48%
43%
41%
42%
46%
42%
12%
11%
7%
9%
11%
14%
0% 20% 40% 60% 80% 100%
Grade 9-12 (n=571)
Grade 6-8 (n=635)
Grade 3-5 (n=628)
K-2 (n=579)
Early childhood (n=198)
All Respondents (n=2,064)
Too High High Just Right Low Too Low

Hanover Research | December 2016
© 2016 Hanover Research 11
Figure 1.9: How effective are the CAS in developing the following skills for Colorado public school students?
n=1,976-2,100
Figure 1.10: How effective are the CAS in promoting…
n=2,007-2,019
5%
5%
11%
12%
14%
17%
19%
24%
25%
28%
31%
30%
32%
36%
36%
37%
35%
37%
32%
32%
30%
28%
27%
22%
22%
22%
24%
23%
21%
16%
14%
11%
13%
10%
0% 20% 40% 60% 80% 100%
Invention
Self-direction
Interest inlearning/engagement
Readiness for career
Collaboration
Readiness for college
Critical thinking and reasoning
Information literacy
Extremely Effective Very Effective Moderately Effective Slightly Effective Not at All Effective
18%
20%
35%
36%
26%
27%
18%
14%
0% 20% 40% 60% 80% 100%
...higher student performance andimproved student outcomes?
...the acquisition of essential knowledgein all subject areas?
Extremely Effective Very Effective Moderately Effective Slightly Effective Not at All Effective

Hanover Research | December 2016
© 2016 Hanover Research 12
Figure 1.11: How effective are the CAS in promoting higher student performance and improved student outcomes? By Role
24%
20%
13%
16%
30%
17%
30%
17%
24%
19%
22%
57%
22%
36%
25%
21%
15%
31%
20%
37%
32%
39%
37%
29%
35%
40%
80%
63%
62%
55%
52%
50%
46%
44%
42%
41%
14%
44%
0% 20% 40% 60% 80% 100%
Other (n=80)
Elected official/policymaker (n=5)
Business owner (n=8)
Parent (n=191)
General public residing in Colorado/Coloradotaxpayer or member of community organization
(n=53)
State agency staff (n=29)
Media (n=10)
Educator at an institution for higher education(n=130)
Professional educator association member (n=34)
Student (n=77)
Educator in a K-12 school system (n=1,376)
Education policy advocate (n=14)
All Respondents (n=2,007)
Ro
le
Extremely/Very Effective Moderately Effective Slightly/Not at All Effective
Hanover Research | December 2016
© 2016 Hanover Research 13
Figure 1.12: How effective are the CAS in promoting higher student performance and improved student outcomes? By Familiarity, Training, and Support
15%
19%
22%
11%
21%
26%
12%
14%
24%
22%
35%
43%
38%
36%
44%
37%
29%
37%
34%
35%
50%
38%
40%
53%
35%
37%
59%
48%
41%
44%
0% 20% 40% 60% 80% 100%
Low Level of Training or No Training (n=220)
Moderate Level of Training (n=314)
High Level of Training (n=359)
Low Level of Support or No Support (n=317)
Moderate Level of Support (n=339)
High Level of Support (n=237)
Slightly/Not at All Familiar (n=139)
Moderately Familiar (n=393)
Extremely/Very Familiar (n=1,475)
All Respondents (n=2,007)
Leve
l of
Trai
nin
gLe
vel o
f Su
pp
ort
De
gree
of
Fam
iliar
ity
Extremely/Very Effective Moderately Effective Slightly/Not at All Effective
Hanover Research | December 2016
© 2016 Hanover Research 14
Figure 1.13: How effective are the CAS in addressing the needs of:
n=1,815-1,962
7%
7%
9%
24%
21%
26%
31%
37%
37%
22%
33%
26%
16%
0% 20% 40% 60% 80% 100%
Students with disabilities?
English learners?
Academically advanced students?
Extremely Effective Very Effective Moderately Effective Slightly Effective Not at All Effective
Hanover Research | December 2016
© 2016 Hanover Research 15
SECTION II: CAS REVISIONS
This section discusses respondents’ feedback about the processes and priorities for the CAS revision.
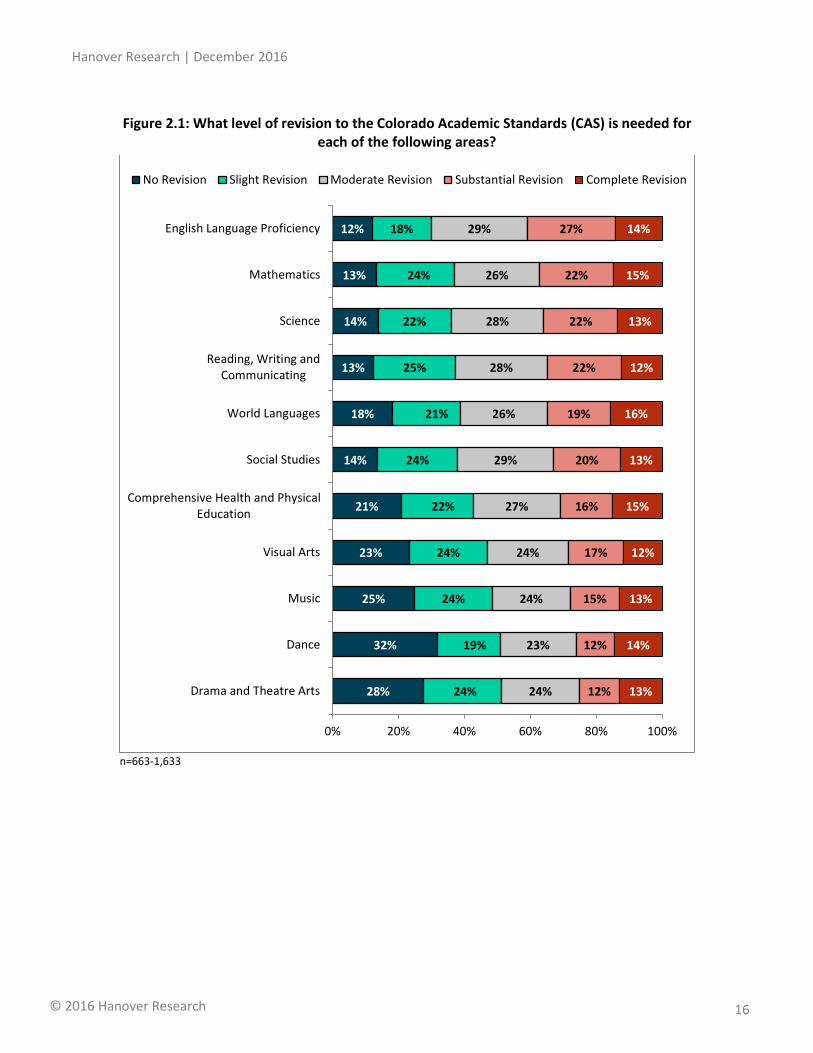
Respondents note that the CAS in most content areas need at least a moderate level of revision, with English Language Proficiency, Mathematics, and Science as the top three areas. When these results are examined according to the subject area of expertise, respondents still note English Language Proficiency as needing at least a moderate level of revision, followed by Science and Social Studies. Conversely, teachers in Music, World Languages, and Drama and Theatre Arts are least likely to feel that their subject areas need substantial or complete revisions (Figure 2.1 and Figure 2.2).
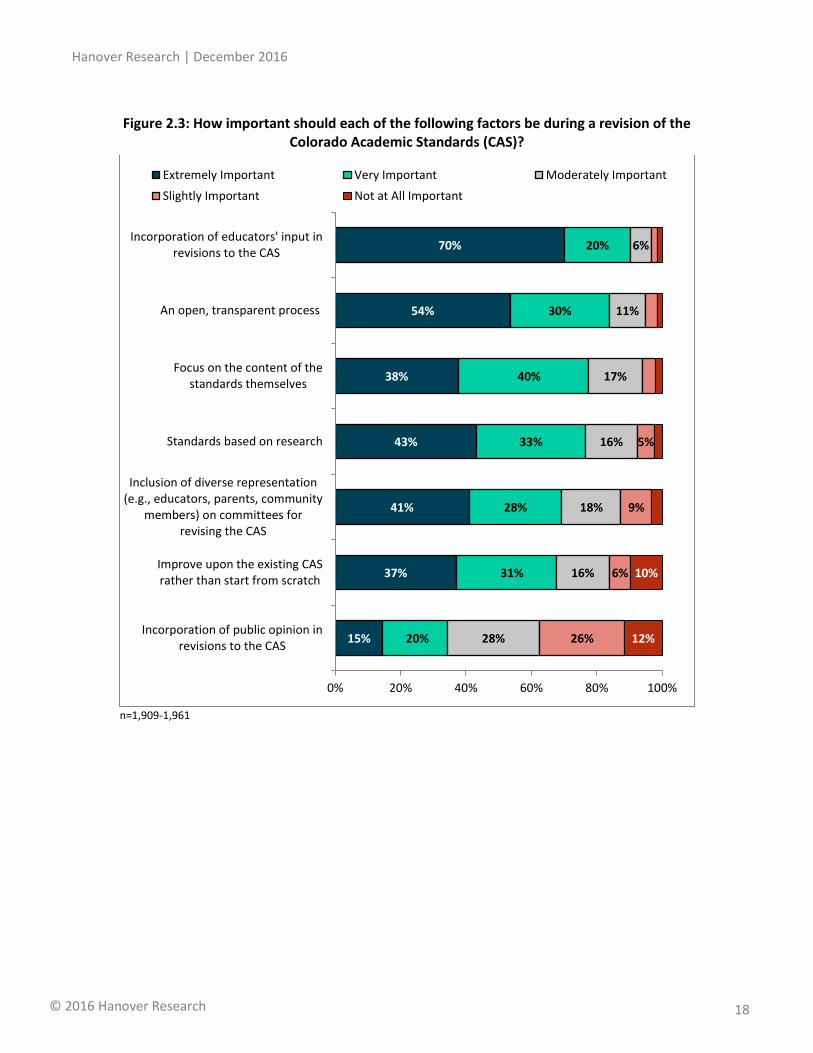
Respondents report that the revision of the CAS should incorporate educator’s input (90 percent) and the process should be open and transparent (84 percent) (Figure 2.3).5 More than half of respondents would like to be informed of the revision process via the CDE website and CDE newsletters (Figure 2.4).
A plurality of respondents state that it is extremely or very important to have consistent academic standards for students in Colorado (75 percent), or across states in the US (60 percent). More respondents favor using national standards as a reference for reviewing the CAS (32 percent), than adopting all or part of the national standards (14 to 20 percent) (Figure 2.5 and Figure 2.6). In the open-ended comments, several respondents noted their confusion with navigating the Common Core State Standards (CCSS) and the CAS due to the overlap between the two sets of standards.
The majority of respondents also state that it is extremely or very important to have both a consistent content structure (64 percent) and style template (60 percent) for all subjects in the CAS (Figure 2.7).
Responding K-12 teachers generally feel that they have at least a moderate amount of training (74 percent) and support (63 percent) to understand and effectively teach the CAS.6 Thirty-nine percent of teachers indicate that they received very high or high levels of training, while 26 percent received very high or high levels of support (Figure 2.8 and Figure 2.9).
K-12 school administrators prefer a revision cycle of six years (41 percent) or longer (44 percent), and most would like to focus on one or two content areas at a time during each cycle (56 percent) (Figure 2.10 and Figure 2.11).
5 Percentages include responses of “extremely important” and “very important.” 6 Percentages include responses of “very high,” “high,” or “moderate” level of training/support.
Hanover Research | December 2016
© 2016 Hanover Research 16
Figure 2.1: What level of revision to the Colorado Academic Standards (CAS) is needed for each of the following areas?
n=663-1,633
28%
32%
25%
23%
21%
14%
18%
13%
14%
13%
12%
24%
19%
24%
24%
22%
24%
21%
25%
22%
24%
18%
24%
23%
24%
24%
27%
29%
26%
28%
28%
26%
29%
12%
12%
15%
17%
16%
20%
19%
22%
22%
22%
27%
13%
14%
13%
12%
15%
13%
16%
12%
13%
15%
14%
0% 20% 40% 60% 80% 100%
Drama and Theatre Arts
Dance
Music
Visual Arts
Comprehensive Health and PhysicalEducation
Social Studies
World Languages
Reading, Writing andCommunicating
Science
Mathematics
English Language Proficiency
No Revision Slight Revision Moderate Revision Substantial Revision Complete Revision

Hanover Research | December 2016
© 2016 Hanover Research 17
Figure 2.2: What level of revision to the Colorado Academic Standards (CAS) is needed?
By Teachers of Subject Areas
Note: This figure presents teachers’ ratings of the subject areas that they teach. For example, among 60 responding teachers of English language development, 15 percent report that the CAS for English Language Proficiency need no/slight revision.
71%
49%
37%
43%
32%
38%
54%
31%
35%
28%
15%
24%
28%
37%
29%
38%
31%
11%
31%
26%
30%
38%
6%
23%
26%
29%
30%
31%
35%
38%
38%
43%
47%
0% 20% 40% 60% 80% 100%
Drama and Theatre Arts (n=17)
World Languages (n=39)
Music (n=57)
Dance (n=7)
Mathematics (n=154)
Comprehensive Health and Physical Education(n=13)
Visual Arts (n=37)
Reading, Writing and Communicating (n=130)
Social Studies (n=117)
Science (n=120)
English Language Proficiency (n=60)
No/Slight Revision Moderate Revision Substantial/Complete Revision
Hanover Research | December 2016
© 2016 Hanover Research 18
Figure 2.3: How important should each of the following factors be during a revision of the Colorado Academic Standards (CAS)?
n=1,909-1,961
15%
37%
41%
43%
38%
54%
70%
20%
31%
28%
33%
40%
30%
20%
28%
16%
18%
16%
17%
11%
6%
26%
6%
9%
5%
12%
10%
0% 20% 40% 60% 80% 100%
Incorporation of public opinion inrevisions to the CAS
Improve upon the existing CASrather than start from scratch
Inclusion of diverse representation(e.g., educators, parents, community
members) on committees forrevising the CAS
Standards based on research
Focus on the content of thestandards themselves
An open, transparent process
Incorporation of educators' input inrevisions to the CAS
Extremely Important Very Important Moderately Important
Slightly Important Not at All Important

Hanover Research | December 2016
© 2016 Hanover Research 19
Figure 2.4: In which way(s) would you like to be kept informed of the standards revision process by the Colorado Department of Education (CDE)?
n=2,037
Figure 2.5: Importance of Consistent Standards
n=2,020-2,027
7%
8%
30%
32%
53%
66%
0% 20% 40% 60% 80% 100%
I do not wish to be informed of standardsrevisions.
Other
Public meetings
CDE social media posts (e.g., Facebook, Twitter)
CDE newsletters
Information on the CDE website
31%
43%
29%
31%
22%
16%
10%
6%
8%
0% 20% 40% 60% 80% 100%
How important is it to haveconsistent academic standardsfor students across states in the
US?
How important is it to haveconsistent academic standards
for students in Colorado?
Extremely Important Very Important Moderately Important
Slightly Important Not at All Important

Hanover Research | December 2016
© 2016 Hanover Research 20
Figure 2.6: How should Colorado use national standards during the upcoming standards review and revision process?
n=2,042
Figure 2.7: Importance of Consistent Structure and Template
n=1,247-1,256 Note: These questions were only asked to K-12 educators at public schools, Colorado Department of Education staff, Colorado Department of Higher Education staff, Colorado Association of School Executives members, Colorado Education Association members, and Colorado Boards of Cooperative Educational Services members.
7%
10%
14%
18%
20%
32%
0% 10% 20% 30% 40%
Not sure
Do not consider any national standards
Consider adopting national standards withoutmodifications
Consider adopting appropriate aspects of nationalstandards
Consider adopting national standards withmodifications
Consider using national standards as a referencefor reviewing the Colorado Academic Standards
(CAS)
29%
28%
31%
36%
23%
23%
10%
9%
6%
0% 20% 40% 60% 80% 100%
How important is it to have a consistent styletemplate for all subjects in the Colorado
Academic Standards (CAS)?
How important is it to have a consistent contentstructure for all subjects in the Colorado
Academic Standards (CAS)?
Extremely Important Very Important Moderately Important
Slightly Important Not at All Important

Hanover Research | December 2016
© 2016 Hanover Research 21
Figure 2.8: Degree of Training Received to Understand and Effectively Teach the Colorado Academic Standards (CAS)
n=937 Note: This question was only asked to K-12 teachers.
Figure 2.9: Degree of Support Received to Understand and Effectively Teach the Colorado Academic Standards (CAS)
n=937 Note: This question was only asked to K-12 teachers.
11%
28%
35%
13%
8%5%
0%
10%
20%
30%
40%
Very HighLevel ofTraining
High Level ofTraining
ModerateLevel ofTraining
Low Level ofTraining
Very Low Levelof Training
No Training
7%
19%
37%
17%
13%
6%
0%
10%
20%
30%
40%
Very HighLevel ofSupport
High Level ofSupport
ModerateLevel ofSupport
Low Level ofSupport
Very Low Levelof Support
No Support

Hanover Research | December 2016
© 2016 Hanover Research 22
Figure 2.10: If the state were to consider a different review cycle, which of the following would work best for your district?
n=104 Note: This question was only asked to district administrators at K-12 public schools.
Figure 2.11: If the state were to consider staggering the review of the content areas,
which of the following processes would work best for your district?
Percentage of Respondents Who Provided a Rating of #1 (highest rating)
n=88-94 Note: This question was only asked to district administrators at K-12 public schools.
6%
9%
41%
44%
0% 10% 20% 30% 40% 50%
Not sure/no preference
A shorter than six-year cycle
Keep the six-year cycle
A longer than six-year cycle
19%
32%
56%
0% 20% 40% 60%
Review and revise all content area standards atone time
Review and revise 3 - 4 content areas at one time
Review and revise 1 - 2 content areas at one time
Most Preferred Process

Hanover Research | December 2016
© 2016 Hanover Research 23
SECTION III: RESPONDENT CHARACTERISTICS
This section presents respondents’ background information and demographics.
Figure 3.1: Respondent Role
ROLE COUNT %
Educator in a K-12 school system 1,845 65%
Parent 290 10%
Educator at an institution for higher education 191 7%
Student currently enrolled in an elementary, middle or high school 128 5%
General public residing in Colorado/Colorado taxpayer 61 2%
Colorado Department of Education staff 38 1%
Professional educator organization not listed above 32 1%
Member of community organization 28 1%
Colorado Association of School Boards member/local school board member 22 1%
Media 21 1%
Education policy advocate 20 1%
Student currently enrolled in a postsecondary institution 13 0%
Business owner 11 0%
Elected official/policymaker 11 0%
Colorado Association of School Executives member 8 0%
Colorado Department of Higher Education staff 8 0%
Colorado Education Association member 8 0%
Colorado Boards of Cooperative Educational Services member 7 0%
Out-of-state interested party 2 0%
Other 81 3% n=2,825

Hanover Research | December 2016
© 2016 Hanover Research 24
Figure 3.2: K-12 Educators
TYPE OF SCHOOL N=1,778
Public school (non-charter/magnet/innovation) 90%
Charter/magnet/innovation school 7%
Independent/private school 1%
Other 3%
ROLE IN THE SCHOOL/DISTRICT N= 1,762
Teacher 67%
School administrator 8%
District administrator 7%
Specialized service professional (e.g., counselor, social worker, nurse, psychologist, speech/language pathologist, librarian)
7%
District-level non-administrator staff 5%
School-level non-instructional staff (non-administrator) 3%
Paraprofessional 2%
SCHOOL LEVEL N=1,755
Early childhood 14%
K-2 40%
Grade 3-5 43%
Grade 6-8 44%
Grade 9-12 41%
Figure 3.3: Higher Education Educators
PROGRAM/INSTITUTION N=188
College/university: Content area professor/instructor 43%
College/university: Educator preparation program 34%
Colorado community college system 24%
Certificate program 13%
Career and Technical Education 12%
None of the above 22%
Figure 3.4: Parents and Students
TYPES OF SCHOOL PARENT
(N=286) STUDENT
(N=126)
Public school (non-charter/magnet/innovation) 82% 29%
Charter/magnet/innovation school 26% 68%
Independent/private school 13% 1%
Institution for higher education 6% -
Other 6% 2%

Hanover Research | December 2016
© 2016 Hanover Research 25
Figure 3.5: Demographics
GENDER N=2,002
Female 70%
Male 24%
Other 0%
Prefer not to answer 6%
EDUCATIONAL ATTAINMENT N=2,020
Less than a high school diploma 2%
High school diploma/GED 1%
Some college, no degree 3%
Associate's degree 2%
Bachelor's degree 21%
Master's degree 56%
Professional degree 5%
Doctoral degree 7%
Prefer not to answer 3%
RACE/ETHNICITY N=2,013
White 75%
Hispanic/Latino(a) 7%
Black or African American 4%
Asian 2%
American Indian or Alaska Native 2%
Native Hawaiian or other Pacific Islander 1%
Prefer not to answer 15%

© 2016 Hanover Research 26
PROJECT EVALUATION FORM Hanover Research is committed to providing a work product that meets or exceeds client expectations. In keeping with that goal, we would like to hear your opinions regarding our reports. Feedback is critically important and serves as the strongest mechanism by which we tailor our research to your organization. When you have had a chance to evaluate this report, please take a moment to fill out the following questionnaire. http://www.hanoverresearch.com/evaluation/index.php
CAVEAT The publisher and authors have used their best efforts in preparing this brief. The publisher and authors make no representations or warranties with respect to the accuracy or completeness of the contents of this brief and specifically disclaim any implied warranties of fitness for a particular purpose. There are no warranties that extend beyond the descriptions contained in this paragraph. No warranty may be created or extended by representatives of Hanover Research or its marketing materials. The accuracy and completeness of the information provided herein and the opinions stated herein are not guaranteed or warranted to produce any particular results, and the advice and strategies contained herein may not be suitable for every client. Neither the publisher nor the authors shall be liable for any loss of profit or any other commercial damages, including but not limited to special, incidental, consequential, or other damages. Moreover, Hanover Research is not engaged in rendering legal, accounting, or other professional services. Clients requiring such services are advised to consult an appropriate professional.
4401 Wilson Boulevard, Suite 400
Arlington, VA 22203
P 202.559.0500 F 866.808.6585
www.hanoverresearch.com