Embed Size (px)
Citation preview
300
Volume 21 ✤ Number 2 ✤ Winter 2010 ✤ pp. 300–329
d
Academic Self-Perceptions of Ability and Course Planning Among Academically Advanced Students
Kathleen Moritz RudasillUniversity of Louisville
Carolyn M. CallahanUniversity of Virginia
Despite years of advancement toward equality between the sexes, there remains a dearth of women in the highest prestige and income earning professions, such as science and technology (Eccles, 1994). In the United States, women make up more than 50% of college graduates; even so, in 2006 women earned only 20% of bachelor’s degrees in computer science, 21% of bachelor’s degrees in physics, and 20% of bachelor’s degrees in engineer-ing (National Science Foundation, 2008). At the same time, few men are venturing into traditionally female professions, such as nursing or early childhood education (Dodson & Borders, 2006). Mounting evidence refutes the notion that males have greater abilities in math and science (Hyde, Lindberg, Linn, Ellis, & Williams, 2008), yet these sex differences in occupations persist.
Work by Eccles and colleagues (see Eccles, 1994) suggests that the answer may lie with social and psychological factors, such as stereotypes that inform boys’ and girls’ beliefs and plans for the

Copyright © 2010 Prufrock Press, P.o. Box 8813, Waco, TX 76714sum
mary
Rudasill, K. M., & Callahan, C. M. (2010). Academic self-perceptions of ability and course planning among academically advanced students. Journal of Advanced Academics, 21, 300–329.
Despite advancement toward gender equity, few women enter the
male-dominated fields of science and technology, and few men venture
into traditionally female professions, such as nursing or early childhood
education. This study was an examination of the contribution of gen-
der to the academic self-perceptions of ability and related coursework
plans for high school and college across academically advanced stu-
dents. Participants were academically advanced students (N = 447)
from grades 5 to 12. Findings revealed that girls’ self-perceptions of
ability scores were higher than boys’ scores in the area of humanities,
boys planned to take more math courses than girls, and academically
advanced students’ self-perceptions of ability correlated with their future
coursework plans. These findings have implications for practice and
research in schools. The relationship between students’ self-perceptions
of ability and their plans for future course taking points to the importance
of encouraging exploration of a wide array of career trajectories so
that students do not inadvertently build roadblocks to certain careers.
Teachers and counselors should encourage students to make course
plans based on interests and ideas for possible careers rather than
based on what they believe to be appropriate for boys or girls. Findings
point to future research that (a) examines why girls seem less interested
in math/science coursework, (b) includes measures of academic ability
to understand how academic skill relates to academic self-perceptions
and coursework planning, and (c) investigates the role of gender stereo-
types on academically advanced students’ career plans.
302 Journal of Advanced Academics
SELF-PERCEPTIoNS
future (Meece, Glienke, & Burg, 2006). Indeed, there is evidence suggesting sex stereotypes, or conceptualizations of appropriate activities for males and females, contribute to the career choices people make and how they feel about their abilities to perform in certain careers (Bleeker & Jacobs, 2004; Conklin, 2000; Lent et al., 2005; Muldoon & Reilly, 2003; Singh, Allen, Scheckler, & Darlington, 2007). Therefore, the purpose of this study was to examine the contribution of sex to academically advanced preadolescents’ and adolescents’ perceptions of academic ability and related coursework plans (i.e., number of courses in different academic domains) for high school and college. Specifically, this study focuses on academically advanced students because they are most likely to achieve the highest levels of career accom-plishment and their patterns of career choice have paralleled those of the general population, albeit at more professional levels (Gross, 2006; Lubinski & Benbow, 2006; Terman & Oden, 1947). Academically advanced students, for purposes of this study, are those who have earned scores on standardized assessments of achievement and aptitude that are at least one standard deviation above the mean and/or have grades and teacher recommendations that suggest that their performance in one or more academic dis-ciplines is beyond that of their classmates of the same age.
According to Gottfredson (1981), an individual’s career choice is multidetermined. In childhood, individuals eliminate career choices based on sex stereotypes, and they further narrow their occupational choices in adolescence by considering their interests and abilities. In addition, Holland’s Theory of Career Development posits that individuals make career choices mainly along lines of occupational stereotyping (Osipow, 1983). That is, individuals’ career plans are informed, at least in part, by their perceptions of what types of jobs are appropriate for them. Taken together, these theories support stereotyping as a factor affecting the career choices that people make. As an example, McKenna and Ferrero (1991) found boys’ and girls’ attitudes toward careers were strongly sex-typed. Boys and girls stated they preferred jobs that were traditional for their sex, with boys in particular viewing nontraditionally male occupations less favorably than tradition-

303Volume 21 ✤ Number 2 ✤ Winter 2010
Rudasill & Callahan
ally male ones. Similarly, a study of high school students’ career plans (Conklin, 2000) revealed the following trends: Female stu-dents overwhelmingly chose health (76% who chose this profes-sion were female), education (83% female), and social/human service (82% female) professions. On the other hand, male stu-dents chose professions such as computer science (83% male), engineering (86% male), and manufacturing (87% male).
Recent research points to implicit and explicit sex stereo-types in the work force; specifically, engineering and accounting are conceptualized as “masculine” careers, and elementary educa-tion is conceptualized as a “feminine” career (White & White, 2006). As another example, a recent comprehensive review of the research on sex differences in math and science among both aver-age and high-ability individuals showed evidence that children conceptualize mathematics as a “masculine” activity (Halpern et al., 2007). Research suggests sex stereotyping begins in childhood, influ-encing boys’ and girls’ perceptions of their abilities, interests, and course choices ( Ji, Lapan, & Tate, 2004; Pajares & Valiante, 2001; Singh et al., 2007; Whitehead, 1996). Evidence points to the importance of self-perceptions of ability for course choices and the importance of course choices in high school for selection of a college major (Eccles & Wigfield, 1995; Farmer, Wardrop, & Rotella, 1999). In a study analyzing sex differences in writing attitudes and achievement, Pajares and Valiante (2001) found middle school girls had higher perceptions of their writing ability, self-identified with being a writer, placed a higher value on the importance of writing, and had higher writing grades than boys. These findings are consistent with the stereotype that girls have stronger verbal abilities than boys. If boys do not identify males as having strong verbal abilities, they may have lower percep-tions of their own ability in that area; such a stereotype can limit boys’ perceptions of their writing ability and their performance. A recent review of literature on women in computer-related majors revealed that college women had lower perceptions of their abili-ties in computer science than men (despite no differences in abil-ity), and showed little interest in the field (Singh et al., 2007). The

304 Journal of Advanced Academics
SELF-PERCEPTIoNS
authors stated that their “[f ]indings present a complex interplay of social and personal reasons for why fewer women than men choose computer careers” (Singh et al., 2007, p. 510). Further, Ji and colleagues (2004) found when male and female eighth-grade students perceived occupations as employing more members of their own sex, they also expressed more interest and higher per-ceptions of ability in those occupations.
The extant literature indicates sex stereotypes also are related to students’ course choices (Riegle-Crumb, Farkas, & Muller, 2006; Whitehead, 1996). Whitehead (1996) examined course planning among A-level students (students in Britain who enroll in rigorous coursework similar to Advanced Placement in the United States). The study showed A-level boys believed more strongly in sex stereotypes than did their female peers, and this belief related to their course choices more than it did for girls. Based on students’ perceptions of whether boys or girls were bet-ter at certain courses, Whitehead (1996) identified courses as either masculine (66% or more of students perceived boys to be better at the course), feminine (66% or more of the students per-ceived girls to be better) or gender-neutral (66% or more of stu-dents perceived boys and girls to be equally skilled). The courses perceived as masculine made up 63% of boys’ advanced course choices, and courses perceived as feminine made up only 2% of boys’ advanced courses. On the other hand, girls chose mostly gender-neutral courses and more masculine- than feminine-per-ceived courses. Whitehead (1996) concluded boys were avoiding courses they perceived as feminine at much higher rates than girls were avoiding courses they perceived as masculine. In addition, results from a recent study by Riegle-Crumb et al. (2006) revealed course planning for females was contingent upon the academic achievement of female friends. Having friends who earned higher grades in science, math, and English promoted girls’ enrollment in advanced, college preparatory coursework in those subjects. This was particularly true for girls’ advanced math and science enrollment when the girls’ friendship groups were mostly female, suggesting that girls found safety in numbers when enrolling in stereotypically male courses.

305Volume 21 ✤ Number 2 ✤ Winter 2010
Rudasill & Callahan
Research also suggests students’ perceptions of their strengths and abilities influence their course choices and eventual career choices, and these perceptions are, in part, related to sex ste-reotypes (Correll, 2001; Olszewski-Kubilius & Turner, 2002; Verna, Campbell, & Beasley, 1997). According to the literature, boys view themselves as better at math and science, and girls view themselves as better at reading and English (Correll, 2001; Olszewski-Kubilius & Turner, 2002; Siegle & Reis, 1998; Verna et al., 1997). In Correll’s (2001) study, high school and early col-lege students with higher self-perceptions of math ability were more likely to enroll in a calculus course, and girls perceived themselves as less able in math and more able in verbal skills than boys, even though they had equal grades and test scores in both domains. Correll (2001) concluded that disparities in self-perceptions of math ability directly affect the number of women in mathematical professions.
Research suggests developmental trends both in terms of self-perceptions of ability (Harter, 2006) and career choice (Gottfredson, 1981). Specifically, from childhood to adoles-cence, individuals become more discriminating about their abilities as they increase their awareness of others and heighten their social comparison (Harter, 2006). Recent theory on the development of self-competence decisions around career choice has focused on the relationships between and among attribu-tion, self-efficacy, self-worth, domain-specific self-competence beliefs, and domain-specific motivation and performance. For instance, children’s beliefs about their competence and judgments of task value within a specific domain are important predictors of future choices within that domain (Eccles & Harold, 1991; Eccles et al., 1983; Eccles & Wigfield, 1995; Meece, Wigfield, & Eccles, 1990). Related research further documents changes in these constructs as children develop; self-competence beliefs appear to decline across middle childhood and into early ado-lescence (Eccles, Midgley, et al., 1993; Eccles, Wigfield, et al., 1989). Research by Jacobs, Lanza, Osgood, Eccles, and Wigfield (2002) suggested that self-perceptions of confidence and subjec-tive task values decline as children age, and differences in beliefs

306 Journal of Advanced Academics
SELF-PERCEPTIoNS
exist in most domains—with the trajectories of gender differ-ences domain specific rather than generalizable across domains. Their research also suggests that while declines are evident across domains, patterns are not. For example, even though children’s beliefs about competence in the language arts declined rapidly during elementary school, the decline leveled off or increased in middle school. The overall decline in math competence was consistent across grades. Research on domain-specific values also supports the hypothesis that domain-specific values predict cur-rent and future activity choices in the general population (Eccles & Harold, 1991; Eccles & Wigfield, 1995; Feather, 1998; Meece et al., 1990; Wigfield, 1994).
Also of note in the Jacobs et al. (2002) study was the differ-ence in the trajectories of decline across the sexes. Surprisingly, although boys began school with higher perceptions of math competence, boys’ beliefs decreased at a faster rate than girls’, with a result of similar beliefs about competence in math by high school. On the other hand, both sexes entered school with similar beliefs about language arts competence yet boys showed a steeper decline over time. Together, these studies support the notion that students’ self-perceptions of abilities, and perhaps coursework plans, may vary with age.
Gifted and Academically Advanced Students
Research suggests sex stereotypes contribute to perceptions of abilities among gifted students as well. In a study of gifted adolescents, both boys and girls selected math as their most inter-esting subject, but interest was stronger for boys. Gifted girls, on the other hand, judged verbal subjects easier and showed more diversity in their academic strengths and interests than boys (Olszewski-Kubilius & Turner, 2002). Seventy-eight per-cent of the gifted males in this study chose math/science as their area of strength; 62% of the females chose reading/English (Olszewski-Kubilius & Turner, 2002). Using data from the National Education Longitudinal Study of 1988, Reis and Park
307Volume 21 ✤ Number 2 ✤ Winter 2010
Rudasill & Callahan
(2001) found high-achieving 12th-grade boys had higher math and science self-concept than their female counterparts. Indeed, students seem to hold sex stereotypic beliefs regarding their abili-ties in math, language arts, and sports, but actual sex differences in performance tend to decrease or stay equal over time ( Jacobs et al., 2002). Taken together, these findings suggest societal sex stereotypes are linked to students’ perceptions of abilities.
Although sex stereotypes pervade society, there is conflicting research over whether gifted or academically advanced students are insulated from sex stereotypes and, thus, buffered from the effects of such stereotypes on career aspirations (Debacker & Nelson, 2000; Mendez, 2000). Mendez (2000) compared the gender attitudes and career aspirations of sixth-, seventh-, and eighth-grade gifted and nonidentified girls. The gifted-identified girls had more flexible beliefs about gender roles and were more likely to aspire to nontraditional and prestigious careers requir-ing higher education than their nonidentified peers. In a study by Debacker and Nelson (2000), higher achieving high school stu-dents had higher perceived ability in science and valued science more. However, within the high-achieving population, although both boys and girls valued science equally, boys had higher per-ceived science ability than girls. This evidence suggests gifted or academically advanced students may be affected, albeit to a lesser extent than their nonidentified peers, by sex stereotypes regard-ing their self-perceptions of ability, course choice, and, eventually, career choice (Olszewski-Kubilius & Turner, 2002).
In light of the connections between students’ sex stereotypes, self-perceptions of ability, and course selections in the general population, the goal of this study was to examine the strength of the relationships among sex, self-perceptions of ability, and coursework plans in a sample of academically advanced preado-lescents and adolescents. In addition, data were collected to allow for examination of students’ grade relative to self-perceptions of ability and coursework plans and to explore whether adolescents become more influenced by sex stereotypes with increasing age. The specific research questions were:

308 Journal of Advanced Academics
SELF-PERCEPTIoNS
1. To what extent do academically advanced preadolescents’ and adolescents’ grade and sex relate to their self-percep-tions of ability?
2. To what extent do academically advanced preadolescents’ and adolescents’ grade, sex, and self-perceptions of ability relate to their coursework plans?
Method
Participants
The sample consisted of participants in a 2-week residential summer enrichment program for academically advanced students (grades 5 to 11). Summer program participants were selected via an application process that included teacher recommendations of the students, students’ standardized achievement or IQ scores, and students’ written responses to open-ended questions rated according to a rubric. Raters were trained in scoring using sample applications. Scores on achievement and aptitude tests were given automatic, objective point allotments. The raters were provided a five-point scale with specific descriptors for rating teacher rec-ommendations (e.g., 5 = very positive comments and rating scale responses), and a four-point scale for rating critical thinking and creativity on the free response items (e.g., 4 = skillful critical think-ing and problem solving where individual formulates broad and deep categories/descriptions/salient arguments to understand, explain, or characterize relevant information or situations; clearly and precisely asserts a logical conclusion or solution that is substantiated with suf-ficient evidence; evidence of a complex, systematic, and logical process of critical inquiry). The training was complete when all raters were within one point of each other (on the total scale of the items they rate) on a test set of applications. The summer program accep-tance rate for 2004 was 61% (1,519 applied to the program).
All 935 students accepted to the summer program were invited to participate in the study. Upon acceptance into the pro-gram, students and their parents received a letter inviting them

309Volume 21 ✤ Number 2 ✤ Winter 2010
Rudasill & Callahan
to participate in the study and a parent consent form, as well as a parent questionnaire used as part of a larger study. A total of 669 parent consent forms and parent questionnaires were collected. Parent questionnaires were assigned code numbers to identify the sex and grade of the participating student; this same code number was used to identify measures completed by the student. Of the 669 students whose parents gave consent for participation in the study, 560 agreed to participate. Students who did not provide complete data were not included in the sample, resulting in a final sample of 447 preadolescents and adolescents (181 boys and 266 girls) for the present study.
The study participants were very similar to the summer pro-gram participants who chose not to participate in the study with regard to sex and grade with the exception that there were propor-tionally more girls in the study participant group (59% of study participants were girls) as compared to the nonstudy participant group (51% of nonstudy participants were girls). Regarding eth-nicity, 51% of summer program participants identified an ethnic group to which they belonged, and this was similar for study par-ticipants (48%) and nonstudy participants (51%). Of those who identified their ethnicity, the majority was White, and this was similar for study participants (70%) and nonstudy participants (72%). Although program participants could submit a variety of different types of achievement or intelligence test scores as part of their summer program application, examination of the test scores revealed study and nonstudy participants did not differ on either the rates at which they submitted different types of test scores or their mean percentile scores on the various tests. Nationally normed mean scores ranged from the 87th to the 99th percentile for program participants. Means and standard devia-tions for students’ achievement and/or intelligence test scores could not be calculated because available test score data varied by student. Even so, students’ scores on submitted achievement and/or intelligence measures were typically above the 90th percentile. The lower achievement and intelligence test scores were those of students from typically underrepresented groups of students. To ensure diversity in the program, applications from students who

310 Journal of Advanced Academics
SELF-PERCEPTIoNS
represented minority, low-income, or twice-exceptional popula-tions were considered separately in the selection process with less weight given to lower scores and more consideration given to the essays and teacher recommendations.
Design and Procedure
On the second or third evening of each summer program session, study participants met in their dormitory areas to com-plete several instruments as part of a larger study. Instruments were administered by camp counselors. In order to ensure con-fidentiality and privacy, study participants were placed at least 4 feet away from each other while completing the instruments. The only document on which study participants placed their names was the student consent form. This form was separated from the other instruments as soon as the researchers validated that each set of instruments was accompanied by a consent form and before the data were examined or entered. Study participants placed all completed instruments in a sealed envelope before returning them to the camp counselors.
Instrument
Student questionnaire. Items for this questionnaire were drawn from the student questionnaire used in the Michigan Study of Adolescent Life Transitions (MSALT), an instrument designed and used by Dickens (1990), and from the Summer Questionnaire for Parents and Students used at the Center for Talent Development at Northwestern University. The resulting instrument was designed to assess students’ academic self-per-ceptions of ability and educational plans. For academic self-per-ceptions of ability, students responded to seven parallel Likert scale items (1 = low endorsement and 5 = high endorsement) in each of four academic categories: math, science, humanities, and social science. We anticipated that students may be unclear about what school subjects comprised humanities and social science, so humanities was defined for students on the questionnaire as

311Volume 21 ✤ Number 2 ✤ Winter 2010
Rudasill & Callahan
English, writing, language arts, or foreign language, and social science was defined as social studies, history, geography, politics, psychology, and economics.
We conducted an exploratory factor analysis to check that the structure of the survey items loaded together as expected. We used principal components analysis with varimax rotation. Although six factors had eigenvalues > 1, examination of the scree plot pointed to five factors, which explained 67% of the variance. The additional factor only explained 4% of the variance. Rotated factor loadings were above .6, with the exception of the four items asking students to respond to the importance of doing well in each of the subject areas (e.g., “How important is it to you that you do well in math?”). These items loaded together as a separate factor (with rotated factor loadings at .59 or higher), and weakly with the other items about each academic subject (e.g., rotated factor loadings between .3 and .4). As these items were conceptually and structurally different from the other survey items, student responses to these items were eliminated from further analyses. Without those items, a clear, five-factor solution emerged. Four of these factors represented students’ perceptions of ability in each of the four subject areas (i.e., math, science, humanities, and social science); rotated factor loadings ranged from .59 to .83. A fifth factor tapped students’ perceptions of how well they might perform in each subject area in future classes. Student responses to these items double-loaded on the four factors representing students’ perceptions of ability in each subject area, and rotated factor loadings were typically lower than loadings for the cor-responding subject area factors, ranging from .44 to .60. Based on results from the exploratory factor analysis, we used student responses from six items for each subject area as follows:
• “You are not at all good at math/very good at math (sci-ence, humanities, social science).”
• “To do well in math (science, humanities, social science), you have to try a little/try a lot.”
• “If you plan to take math (science, humanities, social sci-ence) next year, how well do you expect to do?”

312 Journal of Advanced Academics
SELF-PERCEPTIoNS
• “How well do you think you will do in the next math (science, humanities, social science) class you take?”
• “You find math (science, humanities, social science) very easy/very hard.”
• “In comparison with other subjects, you find math (sci-ence, humanities, social science) much easier than other subjects/much harder than other subjects.”
Responses were averaged for each academic category to develop composite scores of self-perceptions of ability for math, science, humanities, and social science. Internal consistencies for compos-ite scores were good: math (.83), science (.86), humanities (.87), and social science (.87).
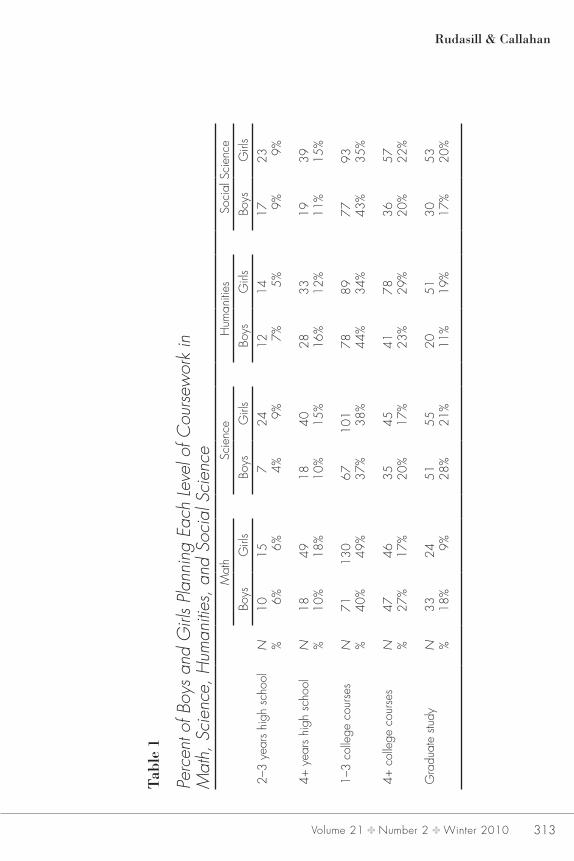
In terms of academic planning, students were asked to indi-cate how many years of study or how many college courses they anticipated taking in each of the four academic areas: math, sci-ence, humanities, and social science. Students could choose (a) 2 to 3 years in high school; (b) 4 years in high school; (c) 1 to 3 courses in college; (d) 4 or more courses in college; or (e) graduate study. The pattern of responses, by percentage of boys and girls, is shown in Table 1.
Data Analysis
Regression analyses were conducted to address the research questions. In the first set of analyses, students’ self-perceptions of ability in math, science, humanities, and social science were regressed on their grade in school and sex using linear regression. In addition, the interaction between grade and sex was added in a second block for each regression model. However, none of the interaction terms was related to students’ self-perception scores, so these were dropped from the final models in the interest of model parsimony. Results from the final models are reported here. Effect sizes were reported as R squared values.
The second set of analyses was conducted to examine relation-ships between students’ grade, sex, and self-perceptions of ability scores and their plans for future coursework (years of coursework
313Volume 21 ✤ Number 2 ✤ Winter 2010
Rudasill & Callahan
Tabl
e 1
Perc
ent o
f Boy
s an
d G
irls
Plan
ning
Eac
h Le
vel o
f Cou
rsew
ork
in
Mat
h, S
cien
ce, H
uman
ities
, and
Soc
ial S
cien
ce
Mat
hSc
ienc
eH
uman
ities
Soci
al S
cien
ceBo
ysG
irls
Boys
Girl
sBo
ysG
irls
Boys
Girl
s2–
3 ye
ars
high
sch
ool
N %10 6%
15 6%7 4%
24 9%12 7%
14 5%17 9%
23 9%
4+ y
ears
hig
h sc
hool
N %18 10
%49 18
%18 10
%40 15
%28 16
%33 12
%19 11
%39 15
%
1–3
colle
ge c
ours
esN %
71 40%
130 49
%67 37
%10
1 38%
78 44%
89 34%
77 43%
93 35%
4+ c
olle
ge c
ours
esN %
47 27%
46 17%
35 20%
45 17%
41 23%
78 29%
36 20%
57 22%
Gra
duat
e stu
dyN %
33 18%
24 9%51 28
%55 21
%20 11
%51 19
%30 17
%53 20
%

314 Journal of Advanced Academics
SELF-PERCEPTIoNS
in math, science, humanities, and social science). Using ordinal regression, students’ estimated number of future courses in each academic area was regressed on grade, sex, and self-perceptions of ability scores in math, science, humanities, and social science. We included student perceptions of ability for all academic areas in each regression equation to explore the extent to which percep-tions of ability in the four academic areas were related to course plans in each area, rather than assuming relationships existed only between self-perceptions of academic ability in one subject area and course plans for that area. In addition, each regression equation included the interac-tion between student grade and self-perceptions of ability for each academic area. However, none of these interaction terms was related to any of the outcome variables, so these interactions were dropped from the final models in the interest of model parsimony. All results reported here are from the final models. Effect sizes for the final models were reported with pseudo-R squared values. Although not the same as R squared values, pseudo-R squared values provide estimates of model fit (ranging from 0 to 1), with values closer to 1 indicating better fit. Given the large number of analyses conducted, we set our alpha level for significance at .01 to minimize the overall Type I error rate.
Results
Means and standard deviations for self-perceptions of ability (in math, science, humanities, and social science) and coursework plans (for math, science, humanities, and social science), by sex and grade, appear in Table 2, and correlations are shown in Table 3. One-way analyses of variance for grade differences, conducted separately for boys and girls, pointed to developmental differ-ences in coursework planning for social science, but only for girls. Specifically, girls in 10th grade were likely to plan to take more courses in social science than girls in 6th grade, and girls in 11th grade were likely to plan to take more courses in social science than girls in 5th, 6th, 7th, and 8th grade.

315Volume 21 ✤ Number 2 ✤ Winter 2010
Rudasill & CallahanTa
ble
2
Mea
ns a
nd S
tand
ard
Dev
iatio
ns fo
r Par
ticip
ants’
Sel
f-Per
cept
ions
of
Abi
lity
and
Cou
rsew
ork
Plan
s by
Gra
de a
nd S
exVa
riabl
eM
eans
and
Sta
ndar
d D
evia
tions
5th
n =
336t
hn
= 10
27t
hn
= 98
8th
n =
869t
hn
= 53
10th
n =
4611
th
n =
29A
llN
= 4
47Se
lf-per
cept
ion
of a
bilit
yM
ath Bo
ysG
irls
3.78
(.66
)3.
79 (.
61)
3.88
(.55
)4.
06 (.
65)
3.94
(.64
)3.
72 (.
81)
3.89
(.75
)3.
90 (.
69)
3.67
(.85
)3.
63 (.
80)
3.98
(.71
)3.
56 (.
73)
3.89
(.62
)3.
63 (.
80)
3.93
(.65
)3.
95 (.
61)
3.90
(.67
)Sc
ienc
e Boys
Girl
s3.
08 (.
51)
3.13
(.58
)3.
10 (.
62)
3.07
(.67
)3.
11 (.
68)
3.16
(.64
)3.
20 (.
65)
3.39
(.70
)3.
47 (.
67)
3.00
(.72
)3.
28 (.
63)
3.01
(.61
)3.
13 (.
77)
2.83
(.70
)
3.96
(.70
)3.
97 (.
68)
3.95
(.71
)H
uman
ities
Boys
Girl
s3.
60 (.
67)
3.82
(.93
)3.
43 (.
88)
3.78
(.72
)3.
65 (.
81)
4.03
(.69
)3.
68 (.
67)
4.07
(.74
)3.
83 (.
65)
4.02
(.81
)4.
18 (.
62)
4.20
(.52
)3.
83 (.
64)
4.28
(.72
)
3.95
(.72
)3.
76 (.
72)
4.08
(.69
)So
cial
sci
ence
Bo
ysG
irls
3.85
(.56
)3.
75 (.
72)
3.87
(.87
)3.
83 (.
81)
3.93
(.74
)3.
88 (.
64)
4.09
(.71
)3.
97 (.
85)
4.01
(.75
)3.
82 (.
71)
4.33
(.82
)3.
97 (.
74)
3.99
(.59
)4.
37 (.
62)
3.99
(.69
)4.
02 (.
69)
3.97
(.69
)C
ours
ewor
k pl
ans
Mat
h Boys
Girl
s3.
00 (1
.21)
2.95
(.92
)3.
39 (1
.20)
3.10
(1.2
0)3.
75 (1
.11)
3.11
(.93
)3.
16 (1
.03)
3.05
(1.1
0)3.
71 (.
86)
3.10
(.86
)3.
11 (.
94)
3.04
(.60
)3.
43 (.
76)
2.79
(.58
)
3.20
(1.0
)3.
42 (1
.1)
3.10
(.98
)Sc
ienc
e Boys
Girl
s3.
67 (.
89)
3.14
(1.2
4)3.
63 (1
.12)
3.13
(1.3
4)3.
39 (1
.32)
3.26
(1.2
0)3.
60 (.
82)
3.33
(1.2
7)3.
67 (1
.20)
3.62
(1.1
2)3.
95 (1
.18)
3.23
(.95
)3.
29 (1
.07)
2.79
(.89
)
3.39
(1.2
)3.
59 (1
.1)
3.25
(1.2
)H
uman
ities
Boys
Girl
s3.
58 (1
.24)
3.24
(1.1
8)2.
67 (1
.09)
3.25
(1.2
2)3.
25 (1
.11)
3.51
(1.1
3)3.
04 (.
93)
3.38
(1.1
3)3.
33 (.
70)
3.55
(1.0
2)3.
58 (.
90)
3.77
(.76
)3.
64 (.
74)
3.71
(.83
)
3.33
(1.1
)3.
16 (1
.0)
3.45
(1.1
)So
cial
sci
ence
Bo
ysG
irls
3.75
(1.0
6)3.
00b (1
.22)
3.00
(1.3
4)2.
90ac
(1.1
9)2.
97 (1
.18)
3.23
d (1
.09)
3.40
(1.0
4)3.
10e
(1.2
1)3.
38 (.
97)
3.59
(1.2
1)3.
42 (.
90)
4.00
a (.9
4)3.
57 (.
94)
4.43
bcde
(.65
)
3.27
(1.2
)3.
24 (1
.1)
3.29
(1.2
)
Not
e. V
alue
s w
ith
the
sam
e su
pers
crip
t are
sta
tist
ical
ly s
igni
fican
tly
diff
eren
t at p
< .0
1.

316 Journal of Advanced Academics
SELF-PERCEPTIoNS
Tabl
e 3
Cor
rela
tions
Am
ong
Self-P
erce
ptio
ns o
f Abi
lity
and
Cou
rsew
ork
Plan
s fo
r Mat
h, S
cien
ce, H
uman
ities
, and
Soc
ial S
cien
ce
Mat
h ab
ility
Scie
nce
abili
tyH
uman
ities
ab
ility
Soci
al s
cien
ce
abili
tyM
ath
cour
ses
Scie
nce
cour
ses
Hum
aniti
es
cour
ses
Soci
al s
cien
ce
cour
ses
11.
0
2.1
8**
1.0
3.0
4.1
8**
1.0
4.1
2.2
9**
.27*
*1.
0
5.3
0-.0
0-.0
8-.0
11.
0
6.1
1.3
2**
-.06
-.02
.36*
*1.
0
7-.1
2-.0
5.3
7**
.05
.18*
*.0
71.
0
8-.1
1-.0
9.1
2.2
2**
.15*
*.0
7.4
6**
1.0
Not
e. *
* p
< .0
1.
317Volume 21 ✤ Number 2 ✤ Winter 2010
Rudasill & Callahan
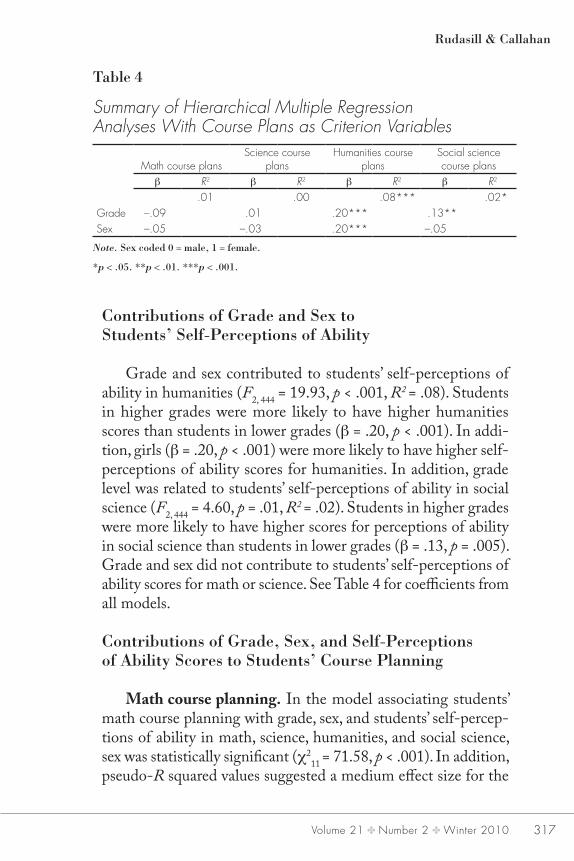
Contributions of Grade and Sex to Students’ Self-Perceptions of Ability
Grade and sex contributed to students’ self-perceptions of ability in humanities (F2, 444 = 19.93, p < .001, R2 = .08). Students in higher grades were more likely to have higher humanities scores than students in lower grades (β = .20, p < .001). In addi-tion, girls (β = .20, p < .001) were more likely to have higher self-perceptions of ability scores for humanities. In addition, grade level was related to students’ self-perceptions of ability in social science (F2, 444 = 4.60, p = .01, R2 = .02). Students in higher grades were more likely to have higher scores for perceptions of ability in social science than students in lower grades (β = .13, p = .005). Grade and sex did not contribute to students’ self-perceptions of ability scores for math or science. See Table 4 for coefficients from all models.
Contributions of Grade, Sex, and Self-Perceptions of Ability Scores to Students’ Course Planning
Math course planning. In the model associating students’ math course planning with grade, sex, and students’ self-percep-tions of ability in math, science, humanities, and social science, sex was statistically significant (χ2
11 = 71.58, p < .001). In addition, pseudo-R squared values suggested a medium effect size for the
Table 4
Summary of Hierarchical Multiple Regression Analyses With Course Plans as Criterion Variables
Math course plansScience course
plansHumanities course
plansSocial science course plans
β R2 β R2 β R2 β R2
.01 .00 .08*** .02*Grade –.09 .01 .20*** .13**Sex –.05 –.03 .20*** –.05
Note. Sex coded 0 = male, 1 = female.
*p < .05. **p < .01. ***p < .001.
318 Journal of Advanced Academics
SELF-PERCEPTIoNS
model (Cox and Snell = .15; Nagelkerke = .16; McFadden = .06). Male students (.65, p = .001) were more likely to plan to take more courses in math. The odds-ratio indicates that being male increased the odds of planning to take more math courses by a factor of 1.92 (see Table 5 for results).
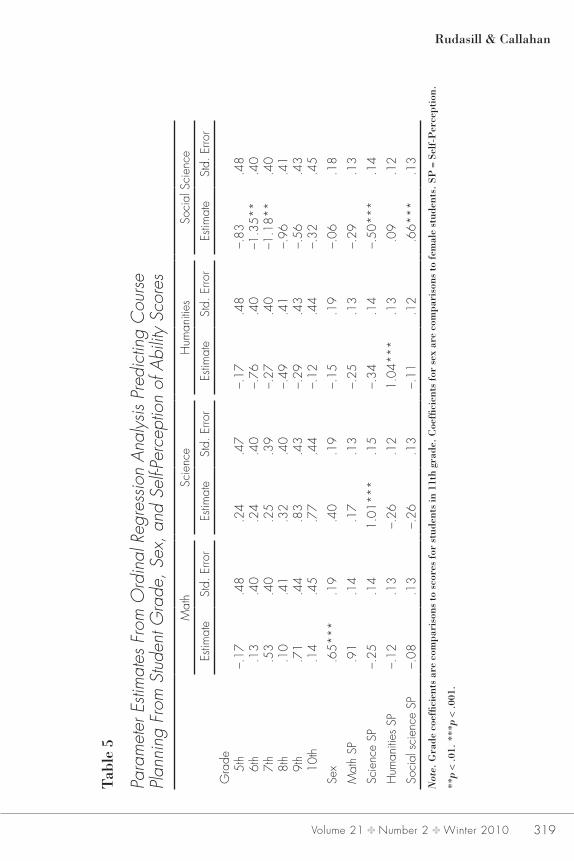
Science course planning. The model associating students’ science course planning with grade, sex, and students’ self-per-ceptions of ability in math, science, humanities, and social science was statistically significant (χ2
11 = 71.60, p < .001). In addition, pseudo-R squared values suggest a medium effect size for the model (Cox and Snell = .15; Nagelkerke = .16; McFadden = .06). Students with higher science self-perceptions of ability scores (1.01, p < .001) were more likely to plan to take more courses in science. The odds-ratio indicates that for a one unit increase in science self-perception scores, the odds of planning to take more science courses increased by a factor of 2.75 (see Table 5 for results).
Humanities course planning. The model associating stu-dents’ humanities course planning with grade, sex, and students’ perceptions of ability in math, science, humanities, and social science was statistically significant (χ2
11 = 98.41, p < .001). In addition, pseudo-R squared values suggest a medium effect size for the model (Cox and Snell = .20; Nagelkerke = .21; McFadden = .08). Students with higher humanities ability self-perception scores (1.04, p < .001), were more likely to plan to take more courses in humanities. The odds-ratio indicates that for a one unit increase in humanities self-perception scores, the odds of planning to take more humanities courses increased by a factor of 2.83 (see Table 5 for results).
Social science course planning. The model associating stu-dents’ social science course planning with grade, sex, and students’ perceptions of ability in math, science, humanities, and social sci-ence was statistically significant (χ2
11 = 68.04, p < .001). In addi-tion, pseudo-R squared values suggest a medium effect size for the model (Cox and Snell = .14; Nagelkerke = .15; McFadden = .05). Specifically, students with lower science ability self-percep-tion scores (-.50, p < .001), and higher social science scores (.66,
319Volume 21 ✤ Number 2 ✤ Winter 2010
Rudasill & Callahan
Tabl
e 5
Para
met
er E
stim
ates
Fro
m O
rdin
al R
egre
ssio
n A
naly
sis P
redi
ctin
g C
ours
e Pl
anni
ng F
rom
Stu
dent
Gra
de, S
ex, a
nd S
elf-P
erce
ptio
n of
Abi
lity
Scor
esM
ath
Scie
nce
Hum
aniti
es
Soci
al S
cien
ce
Estim
ate
Std.
Erro
rEs
timat
eSt
d. E
rror
Estim
ate
Std.
Erro
rEs
timat
eSt
d. E
rror
Gra
de5t
h6t
h7t
h8t
h9t
h10
th
–.17 .1
3.5
3.1
0.7
1.1
4
.48
.40
.40
.41
.44
.45
.24
.24
.25
.32
.83
.77
.47
.40
.39
.40
.43
.44
–.17
–.76
–.27
–.49
–.29
–.12
.48
.40
.40
.41
.43
.44
–.83
–1.3
5**
–1.1
8**
–.96
–.56
–.32
.48
.40
.40
.41
.43
.45
Sex
.65*
**.1
9.4
0.1
9–.
15.1
9–.
06.1
8
Mat
h SP
.91
.14
.17
.13
–.25
.13
–.29
.13
Scie
nce
SP–.
25.1
41.
01**
*.1
5–.
34.1
4–.
50**
*.1
4
Hum
aniti
es S
P–.
12.1
3–.
26.1
21.
04**
*.1
3.0
9.1
2
Soci
al s
cien
ce S
P–.
08.1
3–.
26.1
3–.
11.1
2.6
6***
.13
Not
e. G
rade
coe
ffici
ents
are
com
pari
sons
to s
core
s fo
r st
uden
ts in
11t
h gr
ade.
Coe
ffici
ents
for
sex
are
com
pari
sons
to fe
mal
e st
uden
ts. S
P =
Sel
f-P
erce
ptio
n.
**p
< .0
1. *
**p
< .0
01.

320 Journal of Advanced Academics
SELF-PERCEPTIoNS
p < .001) were more likely to plan to take more courses in social science. The odds-ratios indicate that for a one unit increase in science self-perception scores, the odds of planning to take more social science courses decreased by a factor of .61, and for a one unit increase in social science self-perception scores, the odds of planning to take more social science courses increased by a factor of 1.93. In addition, 11th-grade students were more likely than 6th- (-1.35, p = .001) and 7th- (-1.18, p =.003) grade students to plan to take more social science courses. The odds-ratios indi-cate that, when compared to 11th-grade students, the odds of a 6th- and 7th-grade student planning to take more social science courses decreased by factors of .26 and .31, respectively.
Post hoc analysis. Given the finding that girls reported higher perceptions of ability in humanities, and boys planned to take more math courses than girls despite no differences in students’ perceptions of ability in math, we examined students’ assessments of the importance of doing well in each academic area by sex. One survey item for each academic area measured value (“How important is it to you that you do well in math/sci-ence/humanities/social science?”), with students responding on a five-point scale (1 = not at all important, 5 = very important). Mean scores for these items indicate that boys judged math as most important (M = 4.48), followed by science (M = 4.29), humanities (M = 4.21), and social science (M = 4.19). Girls judged humani-ties as most important (M = 4.56), followed by math (M = 4.50), science (M = 4.39), and social science (M = 4.33). Results from paired sample t tests indicated that boys viewed doing well in math as more important than doing well in science (t = 2.81, p = .006, Cohen’s d = .22), humanities (t = 3.69, p < .001, Cohen’s d = .31), and social science (t = 3.69, p < .001, Cohen’s d = .32). Girls viewed doing well in humanities as more important than doing well in science (t = -2.75, p = .006, Cohen’s d = .21) and social science (t = 4.38, p < .001, Cohen’s d = .28), and they viewed doing well in math as more important than doing well in social science (t = 3.08, p = .002, Cohen’s d = .21). Independent t tests of mean differences between boys and girls showed a statistically signifi-cant difference for humanities (t(445) = -4.42, p < .001, Cohen’s d

321Volume 21 ✤ Number 2 ✤ Winter 2010
Rudasill & Callahan
= .41) such that girls, on average, assigned more importance to doing well in humanities than boys. There were no statistically significant gender differences for students’ assessments of the importance of doing well in math, science, or humanities.
Discussion
Results from this study underscore the importance of consid-ering relationships between sex, students’ perceptions of academic ability, and coursework plans among academically advanced stu-dents. Five main findings emerged from this study. First, con-sonant with findings of prior studies on the general student population ( Jacobs et al., 2002; Ji et al., 2004; Pajares & Valiante, 2001), sex was related to academically advanced students’ self-perceptions of ability, but only in the humanities. Specifically, girls’ self-perceptions of ability scores for humanities were higher than boys’ self-perceptions of ability scores. Boys’ lower self-per-ceptions of ability in the humanities may be the result of sex stereotyping, and, by extension, may limit boys’ career options.
Second, coursework plans for this academically advanced sample followed historical and stereotypic patterns in the gen-eral population, with boys reporting plans to take more math courses than girls, even though no differences in self-perceptions of ability were detected. Third, gifted or academically advanced students’ self-perceptions of ability beliefs correlated with their future coursework plans, a finding supported by previous stud-ies conducted with both gifted and nonidentified populations (Correll, 2001; Olszewski-Kubilius & Turner, 2002; Verna et al., 1997). We found moderate effect sizes (using pseudo-R squared values) for this relationship, such that students with higher self-perceptions of ability in an academic domain planned to take more courses in that domain.
Fourth, congruent with research by Eccles (1994), boys and girls differed in terms of how they ranked the importance of doing well in each academic area. These differences were consistent with our findings examining associations between self-perceptions of

322 Journal of Advanced Academics
SELF-PERCEPTIoNS
ability and course planning. In our study, boys ranked math as the most important subject for success, and they also projected that they would take more courses in math. Girls ranked humanities as most important, and reported higher self-perceptions in that academic area. According to Eccles and colleagues (Eccles, 1994; Eccles et al., 1983), the sex disparity in some careers, such as computer science, is multidetermined and complex. Issues such as societal stereotypes, individual perceptions of sex roles, abilities, previous achievement, and the importance or value of success may play a role in an individual’s course planning and career decision-making. Indeed, a study by Lent and colleagues (2005) validated a complex model predicting university students’ choice of major, including social barriers and supports, self-efficacy, interests, and outcome expectations. Our findings provide further support for the complexity of students’ course planning and eventual career choices among a sample of academically advanced students.
Finally, few developmental trends emerged from these analy-ses. Although these data were cross-sectional, we anticipated that some differences in grades would emerge that would point to possible developmental differences in students’ self-perceptions and how those relate to coursework planning. None of the inter-actions between grade and self-perceptions of ability was related to students’ coursework plans, and the only academic domain in which any evidence of a developmental trend emerged was social science. Mean comparisons across grades showed that older girls planned to take more social science courses than younger girls, and ordinal regression analyses indicated that students in 11th grade were likely to plan to take more courses in the social science than students in 6th and 7th grades. Although it is interesting to note the developmental differences in social science course taking, broader implications of these results are that practitioners and researchers should focus on factors other than grade, such as apti-tude or interest, to better understand students’ course planning.
The findings of no differences in math and science self-per-ceptions of ability between academically advanced males and females is heartening and perhaps related to the even distribu-tion of males and females in the math, science, humanities, and

323Volume 21 ✤ Number 2 ✤ Winter 2010
Rudasill & Callahan
social science courses in the summer program. That is, it is con-sistent with Ji and colleagues’ (2004) findings that when male and female eighth-grade students perceived occupations as employing more members of their own sex, they also expressed more inter-est and self-perceptions of ability in those occupations. It is also consistent with recent trends on state tests indicating that males and females perform equally well on assessments of math ability (Hyde et al., 2008). However, the fact that females anticipated taking fewer math and science courses was disappointing and suggestive of a need for greater efforts in translating self-percep-tions of ability into interest and confidence in those arenas.
Limitations
Several limitations to this study warrant mention. First, the participants in this study comprised a convenience sample and, as such, may not be representative of all academically advanced preadolescents and adolescents. Second, it is impossible to con-firm the ethnic make-up of this sample, as a large proportion of program participants (approximately 50%) chose not to identify their ethnicity. The predominance of Caucasians among program participants, however, would raise cautionary flags against any generalizations about minority students or students from outside of the United States. Third, results from this study rely solely on the students’ perceptions, and cannot be validated with outside sources such as academic grades. In addition, this study is based solely on students’ projected, rather than actual, course taking.
Finally, the dependent variable, the number of courses stu-dents reported that they planned to take in future years, may well be confounded with educational aspirations. Those students with low aspirations (high school diploma) may be choosing to take fewer courses or to take courses in areas they perceive as sufficient for achieving that goal, while course planning among those aspiring to 4-year colleges or graduate study may reflect their understanding of the prerequisite for acceptance into and/or success in those environments.

324 Journal of Advanced Academics
SELF-PERCEPTIoNS
Implications for Practice and Research
These findings have implications for practice and research in schools. In terms of practice, the relationship between students’ self-perceptions of ability and their plans for future course taking points to the importance of encouraging exploration of a wide array of career trajectories so that students do not inadvertently build roadblocks to certain careers. These results suggest that teachers and counselors should encourage students to make course plans based on interests and ideas for possible careers rather than based on what they believe to be appropriate for boys or girls. To do this, school personnel should talk frequently with students about why they are selecting certain courses. Probing for the rea-sons behind such decisions may help students avoid decisions based on stereotypes and steer them toward decisions based on interests. Such conversations about coursework plans and career interests should begin early so that they inform students’ planning from the beginning of middle school. These efforts will encourage students to explore broader career options and render them less likely to prematurely limit their career options by taking fewer courses in mathematics and science or in the humanities and social sciences because of beliefs related to stereotypes. These findings support the need for more careful attention among parents, teach-ers, and counselors to drawing connections for highly able students between coursework and success across a wide range of careers and to work to further diminish stereotypes of those domains.
In terms of research, our findings point to three lines of future research. First, because girls reported the same levels of math and science self-perceptions of ability as boys, yet reported plans to take fewer math and science courses, future studies should seek to understand why girls seem less interested in math/science coursework. We concluded that this discrepancy may be related to sex stereotypes, but further research is needed to understand why those beliefs persist in spite of concerted efforts to dispel them. Second, this research may be extended by including measures of academic ability to understand how academic skill relates to academic efficacy and coursework planning. It may be that aca-

325Volume 21 ✤ Number 2 ✤ Winter 2010
Rudasill & Callahan
demic efficacy beliefs and academic ability are not aligned because efficacy beliefs are connected, in part, with stereotypes. Finally, future study should also extend this research by examining the role of sex stereotypes on academically advanced students’ career plans, the natural outgrowth of coursework plans.
In conclusion, the patterns that emerged among gifted stu-dents in this study parallel those of the general population in both encouraging and discouraging patterns. The disappearance of beliefs regarding ability in mathematics across sexes by middle school is heartening. At the same time, the differences in students’ self-perceptions that show males feel less able in the humani-ties area is discouraging. Also discouraging was the finding that females in this select population of high-achieving students reported plans to take fewer math classes than male students. Although this may be associated with future career planning, that hypothesis further increases concern and should be addressed by those who plan programs and curriculum for highly able students.
References
Bleeker, M. M., & Jacobs, J. E. (2004). Achievement in math and science: Do mothers’ beliefs matter 12 years later? Journal of Educational Psychology, 96, 97–109.
Conklin, K. (2000). Career and educational interests of Johnson County High School students. Overland Park, KS: Johnson County Community College, Office of Institutional Research. Retrieved from the ERIC database. (ED444664)
Correll, S. J. (2001). Gender and the career choice process: The role of biased self-assessments. American Journal of Sociology, 106, 1691–1730.
Debacker, T. K., & Nelson, R. M. (2000). Motivation to learn sci-ence: Differences related to gender, class type, and ability. Journal of Educational Research, 93, 245–254.
Dickens, M. N. (1990). Parental influences on the mathematics self-con-cept of high-achieving adolescent girls. (Unpublished dissertation). University of Virginia, Charlottesville, VA.

326 Journal of Advanced Academics
SELF-PERCEPTIoNS
Dodson, T. A., & Borders, L. D. (2006). Men in traditional and non-traditional careers: Gender role attitudes, gender role conflict, and job satisfaction. The Career Development Quarterly, 54, 283–296.
Eccles, J. (1994). Understanding women’s educational and occupational choices: Applying the Eccles et al. model of achievement-related choices. Psychology of Women Quarterly, 18, 585–609.
Eccles, J., & Harold, R. (1991). Gender differences in sport involve-ment: Applying the Eccles’ Expectancy-Value Model. Journal of Applied Sport Psychology, 3, 7–35.
Eccles, J., Adler, T. G., Futerman, R., Goff, S. B., Kaczala, C. M., Meece, J. L., & Midgley, C. (1983). Expectations, values and academic behavior. In J. T. Spence (Ed.), Perspective on achievement and achievement motivation (pp. 75–146). San Francisco, CA: W. H. Freeman.
Eccles, J., Midgley, C., Buchanan, C., Wigfield, A., Reuman, D., & MacIver, D. (1993). Development during adolescence: The impact of stage/environment fit on young adolescents’ experiences in schools and families. American Psychologist, 48, 90–101.
Eccles, J., & Wigfield, A. (1995). In the mind of the actor: The structure of adolescents’ achievement tasks values and expectancy-related beliefs. Personality and Social Psychology Bulletin, 21, 215–225.
Eccles, J. S., Wigfield, A., Flanagan, C. A., Miller, C., Reuman, D. A., & Yee, D. (1989). Self-concepts, domain values, and self-esteem: Relations and changes at early adolescence. Journal of Personality, 57, 283–310.
Farmer, H. S., Wardrop, J. L., & Rotella, S. C. (1999). Antecedent fac-tors differentiating women and men in science/nonscience careers. Psychology of Women Quarterly, 23, 763–780.
Feather, N. T. (1998). Attitudes toward high achievers, self-esteem, and value priorities for Australian, American, and Canadian students. Journal of Cross-Cultural Psychology, 29, 749–759.
Gottfredson, L. S. (1981). Circumscription and compromise: A devel-opmental theory of occupational aspirations. Journal of Counseling Psychology Monograph, 28, 545–579.
Gross, M. U. M. (2006). Exceptionally gifted children: Long-term out-comes of academic acceleration and nonacceleration. Journal for the Education of the Gifted, 29, 404–429.
Halpern, D. F., Benbow, C. P., Geary, D. C., Gur, R. C., Hyde, J. S., & Gernsbacher, M. A. (2007). The science of sex differences in science and mathematics. Psychological Science in the Public Interest, 8, 1–51.

327Volume 21 ✤ Number 2 ✤ Winter 2010
Rudasill & Callahan
Harter, S. (2006). The self. In W. Damon & N. Eisenberg (Eds.), Handbook of child psychology: Vol 3. Social, emotional, and personality development (6th ed., pp. 505–570). New York, NY: Wiley.
Hyde, J. S., Lindberg, S. M., Linn, M. C., Ellis, A. B., & Williams, C. C. (2008). Gender similarities characterize math performance. Science, 321, 494–495.
Jacobs, J., Lanza, S., Osgood, W., Eccles, J., & Wigfield, A. (2002). Changes in children’s self-competence and values: Gender and domain differences across grades one through twelve. Child Development, 73, 509–527.
Ji, P. Y., Lapan, R. T., & Tate, K. (2004). Vocational interests and career efficacy expectations in relation to occupational sex-typing beliefs for eighth grade students. Journal of Career Development, 31, 143–154.
Lent, R. W., Brown, S. D., Sheu, H., Schmidt, J., Brenner, B. R., Gloster, C. S., . . . Treistman, D. (2005). Social cognitive predictors of aca-demic interests and goals in engineering: Utility for women and students at historically Black universities. Journal of Counseling Psychology, 52, 84–92.
Lubinski, D., & Benbow, C. P. (2006). Study of Mathematically Precocious Youth after 35 years: Uncovering antecedents for the development of math-science expertise. Perspectives on Psychological Science, 1, 316–345
McKenna, A. E., & Ferrero, G. W. (1991). Ninth-grade students’ attitudes toward nontraditional occupations. Career Development Quarterly, 40, 168–181.
Meece, J. L., Glienke, B. B., & Burg, S. (2006). Gender and motivation. Journal of School Psychology, 44, 351–373.
Meece, J. L., Wigfield, A., & Eccles, J. S. (1990). Predictors of math anxiety and its consequences for young adolescents’ course enroll-ment intentions and performances in mathematics. Journal of Educational Psychology, 82, 60–70.
Mendez, L. M. R. (2000) Gender roles and achievement-related choices: A comparison of early adolescent girls in gifted and gen-eral education programs. Journal for the Education of the Gifted, 24, 149–169.
Muldoon, O. T., & Reilly, J. (2003). Career choice in nursing students: Gendered constructs as psychological barriers. Journal of Advanced Nursing, 43, 93–100.

328 Journal of Advanced Academics
SELF-PERCEPTIoNS
National Science Foundation. (2008). Science and engineering degrees: 1966–2006. Retrieved from http://www.nsf.gov/statistics/nsf08321/pdf/nsf08321.pdf
Olszewski-Kubilius, P., & Turner, D. (2002). Gender differences among elementary school-age gifted students in achievement, perceptions of ability, and subject preference. Journal for the Education of the Gifted, 25, 233–268.
Osipow, S. H. (1983). Theories of career development. Englewood Cliffs, NJ: Prentice-Hall.
Pajares, F., & Valiante, G. (2001). Gender differences in writing moti-vation and achievement of middle school students: A function of gender orientation? Contemporary Educational Psychology, 26, 366–381.
Reis, S. M., & Park, S. (2001). Gender differences in high-achieving students in math and science. Journal for the Education of the Gifted, 25, 52–73.
Riegle-Crumb, C., Farkas, G., & Muller, C. (2006). The role of gender and friendship in advanced course taking. Sociology of Education, 79, 206–228.
Siegle, D., & Reis, S. M. (1998). Gender diff erences in teacher and stu-Gender differences in teacher and stu-dent perceptions of gifted students’ ability and effort. Gifted Child Quarterly, 42, 39–47.
Singh, K., Allen, K. R., Scheckler, R., & Darlington, L. (2007). Women in computer-related majors: A critical synthesis of research and theory from 1994 to 2005. Review of Educational Research, 77, 500–533.
Terman, L. M., & Oden, M. H. (1947). Genetic studies of genius: Vol. 4. The gifted child grows up. Stanford, CA: Stanford University Press.
Verna, M. A., Campbell, J. R., & Beasley, M. (1997, March). Family processes, SES, and family structure differentially affect academic self-concepts and achievement of gifted high school students. Paper presented at the annual meeting of the American Educational Research Association, Chicago, IL.
White, M. J., & White, G. B. (2006). Implicit and explicit occupational gender stereotypes. Sex Roles, 55, 259–266.
Whitehead, J. M. (1996). Sex stereotypes, gender identity and subject choice at A-level. Educational Research, 38, 147–160.
Wigfield, A. (1994). The role of children’s achievement values in the self-regulation of their learning outcomes. In D. H Schunk & B. Zimmerman (Eds.), Self-regulation of learning and performance:

329Volume 21 ✤ Number 2 ✤ Winter 2010
Rudasill & Callahan
Issues and educational applications (pp. 101–124). Hillsdale, NJ: Lawrence Erlbaum.