Embed Size (px)
Citation preview
January 2012
Statistical Report
Academic Physics Staff in UK Higher Education Institutions

A c A d e m i c A n d R e s e A R c h P h y s i c s s t A f f i n U K h i g h e R e d U c A t i o n i n s t i t U t i o n s n o v e m b e R 2 011
X: Chapter head
This report was prepared for the Institute of Physics by Sean McWhinnie of Oxford Research and Policy.
Oxford Research and Policy is a consultancy that carries out research and evaluation, and specialises in higher education, science policy, and equality and diversity. Tel +44 (0)1235 439188E-mail info@oxfordresearchandpolicy.co.ukwww.oxfordresearchandpolicy.co.uk
iA c A d e m i c P h y s i c s s t A f f i n U K h i g h e R e d U c A t i o n i n s t i t U t i o n s J A n U A R y 2 01 2
Contents
Contents
Summary� 1
1:��Introduction� 21.1: Cost centres 21.2: Staff grades 2
2:��Physics�staff�in�UK�HEIs� 32.1: The number of staff 32.2: Physics staff and the RAE 2008 62.3: Gender balance of staff 92.4: Age of staff 132.5: Age and gender profiles of staff 162.6: Nationality of staff 162.7: Ethnicity of staff 20
Appendix�A:��List�of�tables� 22
Appendix�B:��List�of�figures� 23
Summary
1A c A d e m i c P h y s i c s s t A f f i n U K h i g h e R e d U c A t i o n i n s t i t U t i o n s J A n U A R y 2 01 2
• The number of staff in the physics cost centre has risen from about 3500 in 2003/04 to around 4200 in 2009/10. This equates to a rise of 19%, which is in line with the 21% rise in the total number of staff working in all academic cost centres over the same period.
• The number of professors in physics has risen from 485 in 2003/04 to 650 in 2009/10, an increase of 34%, while the number of senior lecturers and lecturers has essentially stayed at about 980. The number of researchers in the physics cost centre has risen from 1790 in 2003/04 to 2180 in 2009/10, an increase of 22%, which is in line with the 21% rise in the number of researchers across all cost centres.
• Overall, 40% of physics staff on permanent academic grades (lecturers, senior lecturers and professors) are professors: physics has double the proportion of professors compared with the sector average.
• In physics, overall there were 1685.6 category A staff submitted to RAE 2008 by 42 HEIs and 1625 permanent academic staff were listed in the 2007/08 HESA staff data. In 24 HEIs the number of category A staff is higher than the number of permanent academic staff recorded under the physics cost centre.
• The proportion of staff that is female in physics has risen from 13% in 2003/04 to 16% in 2009/10, but remains significantly lower than the sector average of 41%.
• The proportion of lecturers that is female is comparable with the proportion of undergraduates that is female: 19.8% of lecturers and 21.7% of undergraduates were female in 2007/08.
• For academic staff in physics, 19% of men and 6% of women are professors, and 26% of men and 25% of women are senior lecturers or lecturers. 55% of men and 69% of women are researchers.
• Staff in the physics cost centre are on average younger than staff across all cost centres, and women are on average younger than men at all grades in physics and across all cost centres. In the physics cost centre, male permanent academic staff are on average 46.2 years old and women are 42.1 years old.
• When the age of staff is taken into account, women are less likely to have progressed to professorial level than men in all cost centres.
• Physics has a lower proportion of UK nationals at professorial level (61%) than the average across all cost centres (76%), a similar proportion at senior lecturer/lecturer level (81% versus 83%) and a lower proportion at the research level (50% versus 57%).
• The proportion of male non-UK nationals in physics has risen from 31% in 2003/04 to 40% in 2009/10; the proportion of female non-UK nationals has remained consistently higher rising from 46% in 2003/04 to 51% in 2009/10.
• 94.2% of UK national academic staff in the physics cost centre are white, 2.4% are Asian, 1.5% are Chinese and 0.1% are black.
Summary
A c A d e m i c P h y s i c s s t A f f i n U K h i g h e R e d U c A t i o n i n s t i t U t i o n s J A n U A R y 2 01 2
1: Introduction
2
1: Introduction
1. Assignment of departments to academic cost centres 2001/02, HEFCE (www.hefce.ac.uk/pubs/hefce/2002/02_25.htm).
This report presents an overview of academic physics staff in UK higher education institutions (HEIs) and a number of selected other cost centres. The data source for the report is the Higher Education Statistics Agency (HESA). HESA is the central source for the collection and dissemination of statistics about publicly funded UK higher education.
1.1:�Cost�centresHESA requires staff data to be returned with staff assigned to cost centres. The list of cost centres includes physics, mathematics, chemistry, biosciences and elec-trical, electronic & computer engineering, which are discussed in this report. HEIs are required to map their constituent departments/schools to cost centres, and they can apportion departments across a number of cost centres. This can lead to anomalies: in some cases, HEIs report physics staff although there is no recognised physics department. In other cases staff numbers may not match those in a specific physics department as staff from other departments may have been counted as belonging to the physics cost centre, and/or staff work-ing in a physics department may be assigned to another cost centre.
Cost centres vary greatly in their breadth of coverage, for example, biosciences covers a large range of univer-sity departments, including life and health sciences, biomedical science, cancer research, biochemistry and sports science. Full details of the mapping between departments and cost centres are available on the Higher Education Funding Council for England (HEFCE) website1. In physics the majority of HEIs map their phys-ics departments directly onto the physics cost centre; a few HEIs use more complicated mappings. For example, in 2001/02 – the most recent year for which compre-hensive data are available – University College London classified 100% of medical physics and bioengineering, physics and astronomy, and space and climate physics as physics. Liverpool John Moores University classified 100% of the Astrophysics Research Institute and 8% of their School of Engineering as physics.
1.2:�Staff�gradesUntil 2007/08, HESA reported staff data categorised into professors, senior lecturers (including readers), lec-turers, researchers and other grades. The definitions of staff grades are shown below:
Professors includes heads of departments, profes-
sors, researchers (former UAP scale grade IV), clinical professors and those appointed professors on a locally determined scale.
Senior�lecturers includes principal lecturers, sen-ior lecturers (former UAP/CSCFC scales), researchers (former UAP scale grade III), clinical senior lecturers and those appointed senior or principal lecturers on a locally determined scale.
Lecturers includes lecturers, senior lecturers (former PCEF scale), clinical lecturers and those appointed lec-turers on a locally determined scale.
Researchers includes all research grades (former PCEF/CSCFC/UAP scale) not listed above and those researchers appointed on a locally determined scale.
Other�grades includes other grades of academic staff not listed above.
Since 2008/09 this breakdown of grades has not been used, although professors are identifiable through a specific marker. To identify grades of staff the subse-quent methodology has been used. For staff who are not identified as professors, the employment function field is used as follows: staff identified as teaching and research are classified as “senior lecturers/lecturers”; staff iden-tified as research only are classified as “researchers”; and staff identified as teaching only, or neither teaching nor research, are classified as “other grades”. It is likely that some staff will be classified incorrectly using this methodology, in particular senior researchers may be assigned to the “researcher” category rather than “pro-fessors” or “senior lecturers/lecturers” and some teach-ing-only staff may be assigned to the “other grades” category rather than “senior lecturers/lecturers”. None-theless, the data compared well with previous years. It was not possible to distinguish between senior lecturers (readers) and lecturers.
Staff numbers are presented as full-time equivalents (FTEs) not as headcounts. HESA requires that where numerical totals are published they are rounded to the nearest five. Any totals less than five may not be pub-lished. All proportions and ratios presented in the report are calculated using unrounded figures.
In this report a number of different terms are used to signify different groupings of academic grades. The term permanent academic staff refers to professors, senior lecturers and lecturers; the term academic staff refers to professors, senior lecturers, lecturers and researchers; and the term all staff refers to all academic staff grades and other grades.
2: Physics staff in UK HEIs
3A c A d e m i c P h y s i c s s t A f f i n U K h i g h e R e d U c A t i o n i n s t i t U t i o n s J A n U A R y 2 01 2
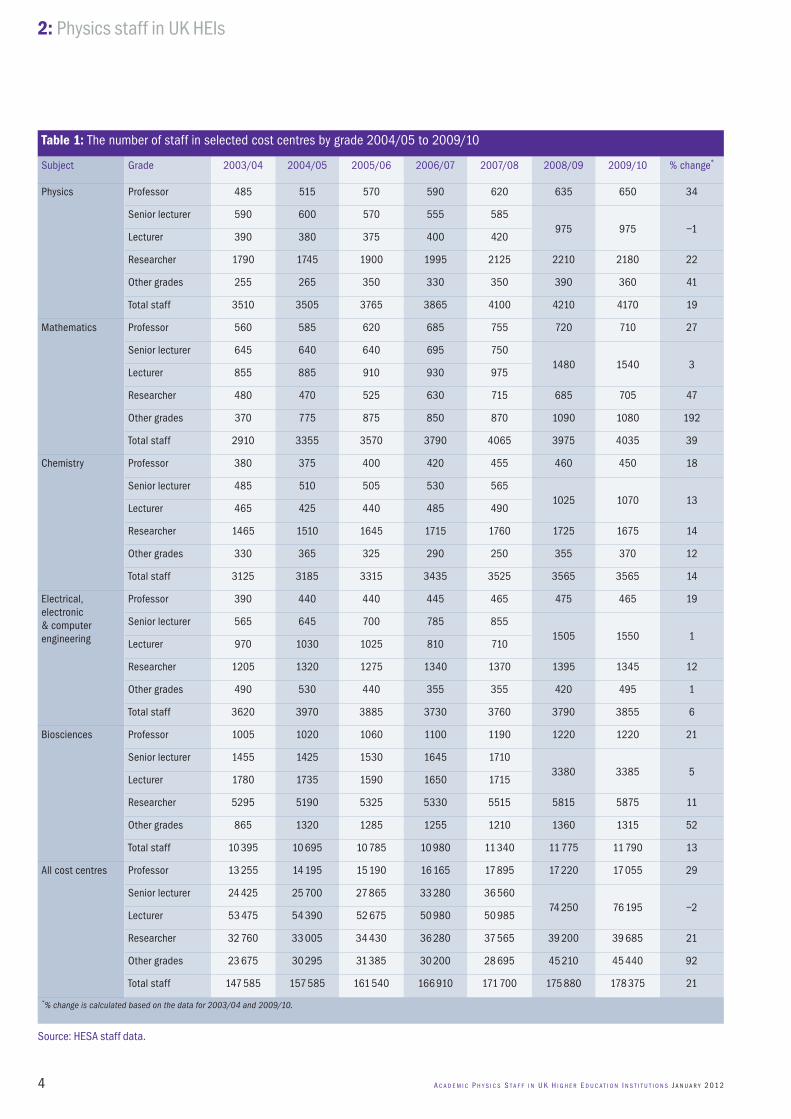
2.1:�The�number�of�staffThe number of staff in the physics cost centre has risen from about 3500 in 2003/04 to around 4200 in 2009/10 (see table 1). This equates to a rise of 19%, which is in line with the 21% rise in the total number of staff working in academic cost centres over the same period of time. By contrast, the number of staff working in the mathematics cost centre rose by 38%, in chemistry by 14%, in electrical, electronic & computer engineering by 6%, and in biosciences by 13%.
In physics, there has been an increase in the number of permanent academic staff. The number of profes-sors in physics has risen from 485 in 2003/04 to 650 in 2009/10, an increase of 34%, while the number of senior lecturers and lecturers has essentially stayed at about 980. A similar pattern is observed across all cost centres: the number of senior lecturers and lec-turers has barely changed (77 900 in 2003/04 and 76 195 in 2009/10), but the number of professors has increased by 29%. The data suggest that the increase in the total number of permanent academic staff has been matched by the increase in the number of staff promoted to professor. It is not clear why the number of professors has continued to rise: there had been a steady rise in the number of professors for around two decades. It is possible that the increased promotion rates to professorial level are driven by HEIs wishing to retain their current staff and to attract new staff by offering them status and higher salaries, and that this change had been brought about by successive research assessment exercises.
The number of researchers in the physics cost centre has risen from 1790 in 2003/04 to 2180 in 2009/10, an increase of 22%, which in line with the 21% rise in the number of researchers across all cost centres.
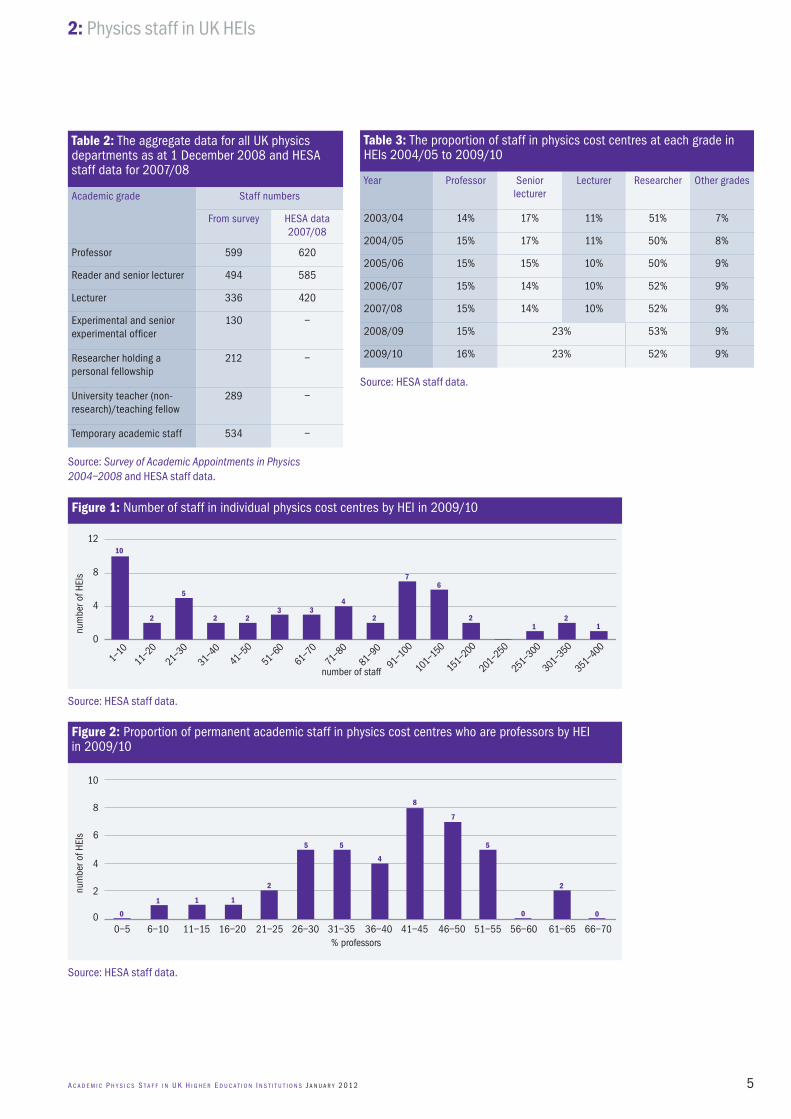
The figures presented in table 1 have been compared with the data presented in the most recent Survey of Academic Appointments in Physics2, which had a cen-sus date of 1 December 2008 corresponding to the academic year 2008/09. Table 2 shows the aggregate staff numbers in UK physics departments drawn from the survey report and, for comparison, HESA staff data for 2007/08.
The survey collated data from 47 physics depart-ments, while the HESA staff data includes data from physics cost centres in 53 HEIs. The numbers of pro-fessors compare well: 599 from the staff survey and 635 from the HESA data for 2008/09. To compare the numbers of readers and senior lecturers, and lecturers, HESA data from 2007/08 need to be used because the data for 2008/09 are not broken down in this way. There are 494 readers and senior lecturers reported in
the survey and 585 in the HESA data for 2007/08. For lecturers, the figures are 336 from the survey and 420 for the HESA data for 2007/08.
The HESA staff data are comparable with the sur-vey results but are consistently higher. This is probably related to a number of factors. There are more HEIs included in the HESA data than covered by the sur-vey, and the use of cost centres by HESA rather than departments means that more staff will be covered. It is likely that some of those staff classified in the survey as “Researcher holding a personal fellowship” in the survey data are included among permanent academic grades in the HESA data.
The proportions of staff that are female at each grade reported in the survey are also in line with the HESA data (see figure 3).
The survey of academic appointments in physics focuses on new appointments rather than on promo-tions. The net change in permanent academic staff leaving and arriving between March 2004 and Decem-ber 2008 was an increase of 131.
HESA data show that the net change in perma-nent academic staff numbers in physics cost centres between 2003/04 and 2008/09 was 145, which is comparable with the results from the survey of aca-demic appointments in physics.
Figure 1 presents data on the distribution of sizes of physics cost centres. The size of individual physics cost centres varies greatly, from HEIs with fewer than 10 staff to very large departments with well over 200 staff.
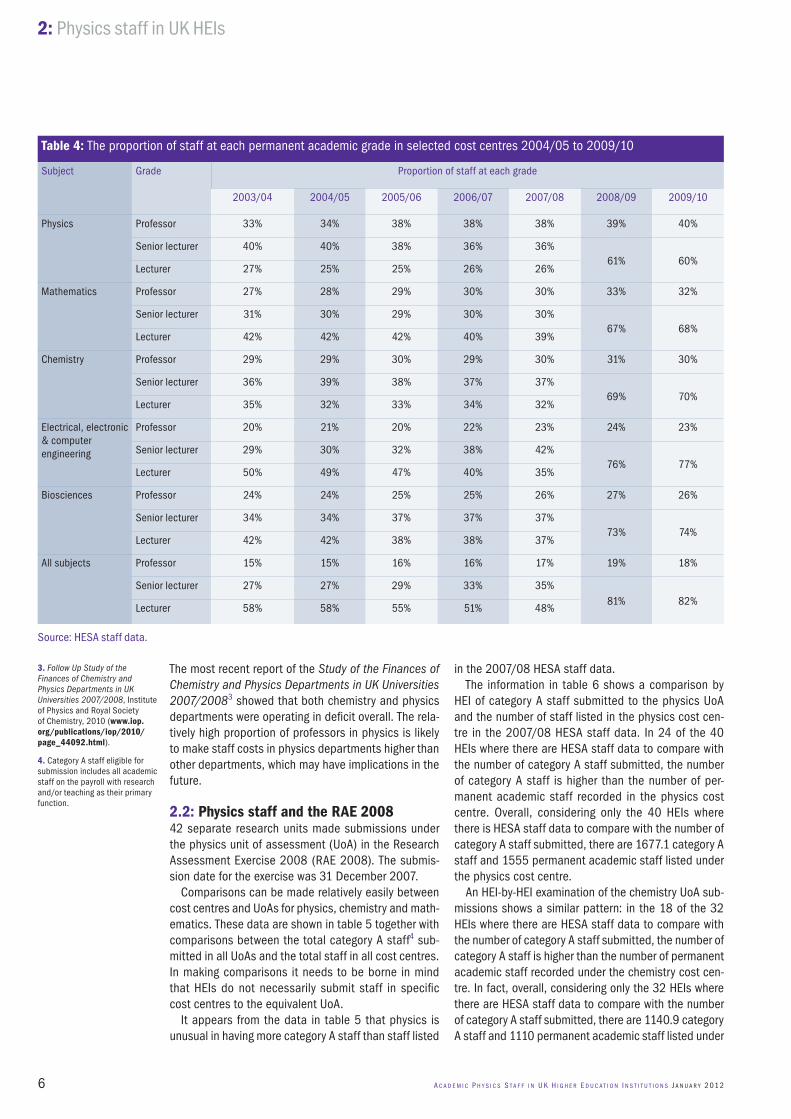
Table 3 shows the proportion of staff in physics cost centres at each grade. As discussed above, since 2003/04 the proportion of professors has increased and the proportion of senior lecturers/lecturers has fallen. Overall, 40% of physics staff on permanent aca-demic grades are professors. The proportion of perma-nent academic staff who are professors in individual HEIs ranges from 9% to 62% (figure 2).
The data in table 4 show the proportions of perma-nent academic staff at different grades in selected cost centres. The proportion of staff at professorial level has increased in all cost centres from 2003/04; the smallest rise is in chemistry with the largest in physics. It is notable that the proportion of staff that is at professor level is higher in the selected science, technology, engineering and mathematics (STEM) cost centres than across all cost centres; physics has twice the proportion of professors compared with the sec-tor average. It is important that the reasons underlying this are understood. Is it that physicists are more in demand abroad and they can demand higher salaries?
2. Survey of Academic Appointments in Physics 2004–2008, Institute of Physics, 2010 (www.iop.org/publications/iop/2010/page_38419.html).
2: Physics staff in UK HEIs
2: Physics staff in UK HEIs
4 A c A d e m i c P h y s i c s s t A f f i n U K h i g h e R e d U c A t i o n i n s t i t U t i o n s J A n U A R y 2 01 2
Table�1: The number of staff in selected cost centres by grade 2004/05 to 2009/10
Subject Grade 2003/04 2004/05 2005/06 2006/07 2007/08 2008/09 2009/10 % change*
Physics Professor 485 515 570 590 620 635 650 34
Senior lecturer 590 600 570 555 585975 975 –1
Lecturer 390 380 375 400 420
Researcher 1790 1745 1900 1995 2125 2210 2180 22
Other grades 255 265 350 330 350 390 360 41
Total staff 3510 3505 3765 3865 4100 4210 4170 19
Mathematics Professor 560 585 620 685 755 720 710 27
Senior lecturer 645 640 640 695 7501480 1540 3
Lecturer 855 885 910 930 975
Researcher 480 470 525 630 715 685 705 47
Other grades 370 775 875 850 870 1090 1080 192
Total staff 2910 3355 3570 3790 4065 3975 4035 39
Chemistry Professor 380 375 400 420 455 460 450 18
Senior lecturer 485 510 505 530 5651025 1070 13
Lecturer 465 425 440 485 490
Researcher 1465 1510 1645 1715 1760 1725 1675 14
Other grades 330 365 325 290 250 355 370 12
Total staff 3125 3185 3315 3435 3525 3565 3565 14
Electrical, electronic & computer engineering
Professor 390 440 440 445 465 475 465 19
Senior lecturer 565 645 700 785 8551505 1550 1
Lecturer 970 1030 1025 810 710
Researcher 1205 1320 1275 1340 1370 1395 1345 12
Other grades 490 530 440 355 355 420 495 1
Total staff 3620 3970 3885 3730 3760 3790 3855 6
Biosciences Professor 1005 1020 1060 1100 1190 1220 1220 21
Senior lecturer 1455 1425 1530 1645 17103380 3385 5
Lecturer 1780 1735 1590 1650 1715
Researcher 5295 5190 5325 5330 5515 5815 5875 11
Other grades 865 1320 1285 1255 1210 1360 1315 52
Total staff 10 395 10 695 10 785 10 980 11 340 11 775 11 790 13
All cost centres Professor 13 255 14 195 15 190 16 165 17 895 17 220 17 055 29
Senior lecturer 24 425 25 700 27 865 33 280 36 56074 250 76 195 –2
Lecturer 53 475 54 390 52 675 50 980 50 985
Researcher 32 760 33 005 34 430 36 280 37 565 39 200 39 685 21
Other grades 23 675 30 295 31 385 30 200 28 695 45 210 45 440 92
Total staff 147 585 157 585 161 540 166 910 171 700 175 880 178 375 21
*% change is calculated based on the data for 2003/04 and 2009/10.
Source: HESA staff data.
5
2: Physics staff in UK HEIs
A c A d e m i c P h y s i c s s t A f f i n U K h i g h e R e d U c A t i o n i n s t i t U t i o n s J A n U A R y 2 01 2
Table�2: The aggregate data for all UK physics departments as at 1 December 2008 and HESA staff data for 2007/08
Academic grade Staff numbers
From survey HESA data 2007/08
Professor 599 620
Reader and senior lecturer 494 585
Lecturer 336 420
Experimental and senior experimental officer
130 –
Researcher holding a personal fellowship
212 –
University teacher (non-research)/teaching fellow
289 –
Temporary academic staff 534 –
Table�3: The proportion of staff in physics cost centres at each grade in HEIs 2004/05 to 2009/10
Year Professor Senior lecturer
Lecturer Researcher Other grades
2003/04 14% 17% 11% 51% 7%
2004/05 15% 17% 11% 50% 8%
2005/06 15% 15% 10% 50% 9%
2006/07 15% 14% 10% 52% 9%
2007/08 15% 14% 10% 52% 9%
2008/09 15% 23% 53% 9%
2009/10 16% 23% 52% 9%
Source: Survey of Academic Appointments in Physics 2004–2008 and HESA staff data.
Source: HESA staff data.
12
8
4
0
91–1
001–
1011
–20
21–3
031
–40
41–5
051
–60
61–7
071
–80
81–9
0
101–
150
151–
200
201–
250
251–
300
301–
350
351–
400
num
ber o
f HEI
s
number of staff
10
2
5
2 2 2 21 1
3 34
2
76
10
8
7
55
2
11
0
1
5
4
2
0 0
8
6
4
2
00–5 66–7061–6556–6051–5546–5041–4536–4031–3526–3021–2516–2011–156–10
num
ber o
f HEI
s
% professors
Figure�1: Number of staff in individual physics cost centres by HEI in 2009/10
Figure�2: Proportion of permanent academic staff in physics cost centres who are professors by HEI in 2009/10
Source: HESA staff data.
Source: HESA staff data.
2: Physics staff in UK HEIs
6 A c A d e m i c P h y s i c s s t A f f i n U K h i g h e R e d U c A t i o n i n s t i t U t i o n s J A n U A R y 2 01 2
Table�4: The proportion of staff at each permanent academic grade in selected cost centres 2004/05 to 2009/10
Subject Grade Proportion of staff at each grade
2003/04 2004/05 2005/06 2006/07 2007/08 2008/09 2009/10
Physics Professor 33% 34% 38% 38% 38% 39% 40%
Senior lecturer 40% 40% 38% 36% 36%61% 60%
Lecturer 27% 25% 25% 26% 26%
Mathematics Professor 27% 28% 29% 30% 30% 33% 32%
Senior lecturer 31% 30% 29% 30% 30%67% 68%
Lecturer 42% 42% 42% 40% 39%
Chemistry Professor 29% 29% 30% 29% 30% 31% 30%
Senior lecturer 36% 39% 38% 37% 37%69% 70%
Lecturer 35% 32% 33% 34% 32%
Electrical, electronic & computer engineering
Professor 20% 21% 20% 22% 23% 24% 23%
Senior lecturer 29% 30% 32% 38% 42%76% 77%
Lecturer 50% 49% 47% 40% 35%
Biosciences Professor 24% 24% 25% 25% 26% 27% 26%
Senior lecturer 34% 34% 37% 37% 37%73% 74%
Lecturer 42% 42% 38% 38% 37%
All subjects Professor 15% 15% 16% 16% 17% 19% 18%
Senior lecturer 27% 27% 29% 33% 35%81% 82%
Lecturer 58% 58% 55% 51% 48%
The most recent report of the Study of the Finances of Chemistry and Physics Departments in UK Universities 2007/20083 showed that both chemistry and physics departments were operating in deficit overall. The rela-tively high proportion of professors in physics is likely to make staff costs in physics departments higher than other departments, which may have implications in the future.
2.2:�Physics�staff�and�the�RAE�200842 separate research units made submissions under the physics unit of assessment (UoA) in the Research Assessment Exercise 2008 (RAE 2008). The submis-sion date for the exercise was 31 December 2007.
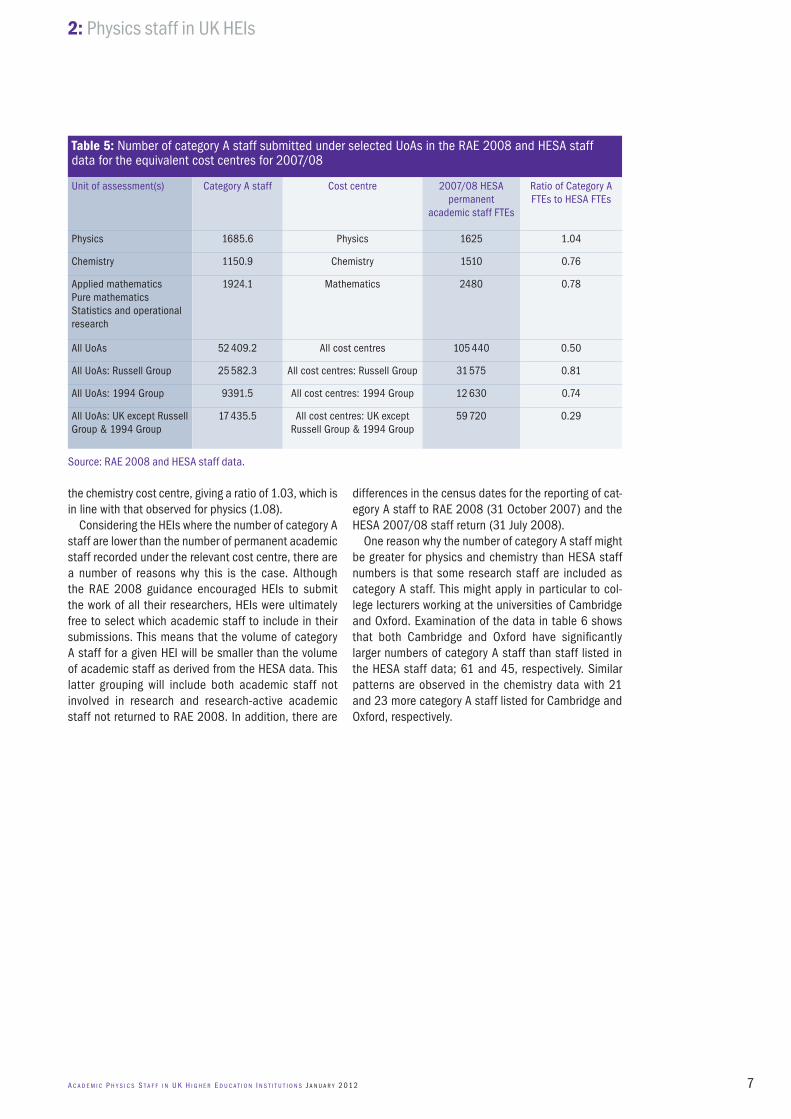
Comparisons can be made relatively easily between cost centres and UoAs for physics, chemistry and math-ematics. These data are shown in table 5 together with comparisons between the total category A staff4 sub-mitted in all UoAs and the total staff in all cost centres. In making comparisons it needs to be borne in mind that HEIs do not necessarily submit staff in specific cost centres to the equivalent UoA.
It appears from the data in table 5 that physics is unusual in having more category A staff than staff listed
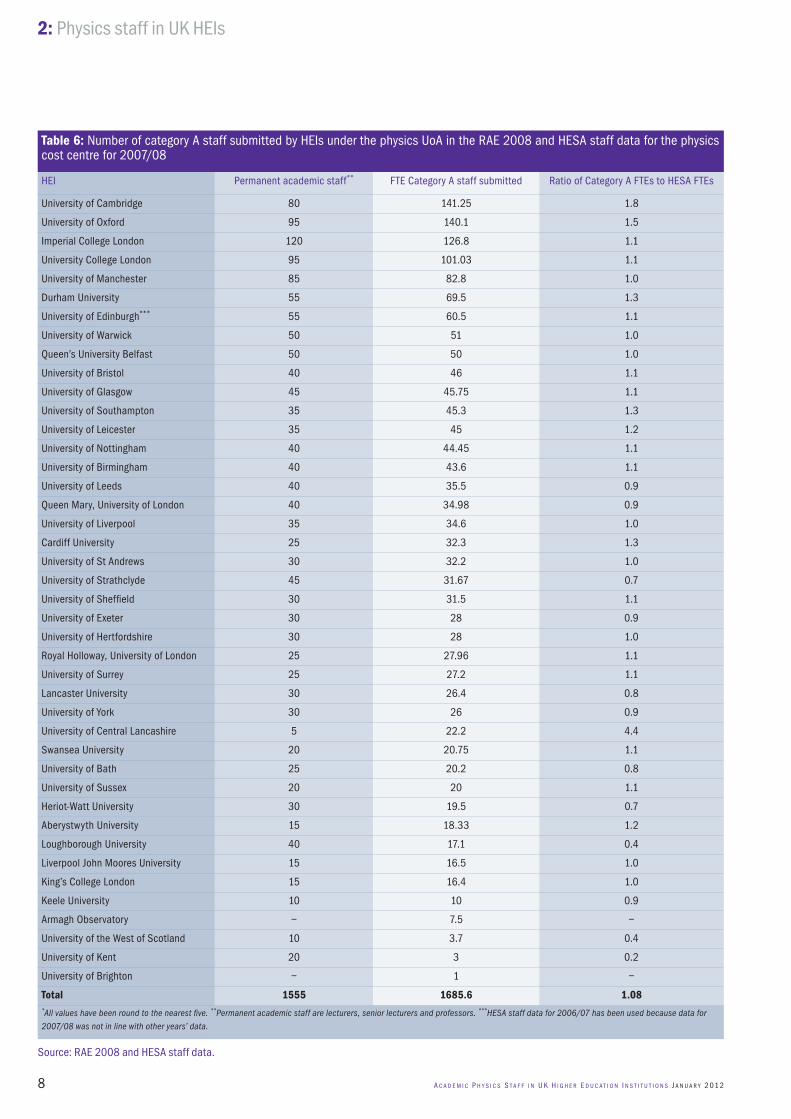
in the 2007/08 HESA staff data.The information in table 6 shows a comparison by
HEI of category A staff submitted to the physics UoA and the number of staff listed in the physics cost cen-tre in the 2007/08 HESA staff data. In 24 of the 40 HEIs where there are HESA staff data to compare with the number of category A staff submitted, the number of category A staff is higher than the number of per-manent academic staff recorded in the physics cost centre. Overall, considering only the 40 HEIs where there is HESA staff data to compare with the number of category A staff submitted, there are 1677.1 category A staff and 1555 permanent academic staff listed under the physics cost centre.
An HEI-by-HEI examination of the chemistry UoA sub-missions shows a similar pattern: in the 18 of the 32 HEIs where there are HESA staff data to compare with the number of category A staff submitted, the number of category A staff is higher than the number of permanent academic staff recorded under the chemistry cost cen-tre. In fact, overall, considering only the 32 HEIs where there are HESA staff data to compare with the number of category A staff submitted, there are 1140.9 category A staff and 1110 permanent academic staff listed under
Source: HESA staff data.
3. Follow Up Study of the Finances of Chemistry and Physics Departments in UK Universities 2007/2008, Institute of Physics and Royal Society of Chemistry, 2010 (www.iop.org/publications/iop/2010/page_44092.html).
4. Category A staff eligible for submission includes all academic staff on the payroll with research and/or teaching as their primary function.
7
2: Physics staff in UK HEIs
A c A d e m i c P h y s i c s s t A f f i n U K h i g h e R e d U c A t i o n i n s t i t U t i o n s J A n U A R y 2 01 2
the chemistry cost centre, giving a ratio of 1.03, which is in line with that observed for physics (1.08).
Considering the HEIs where the number of category A staff are lower than the number of permanent academic staff recorded under the relevant cost centre, there are a number of reasons why this is the case. Although the RAE 2008 guidance encouraged HEIs to submit the work of all their researchers, HEIs were ultimately free to select which academic staff to include in their submissions. This means that the volume of category A staff for a given HEI will be smaller than the volume of academic staff as derived from the HESA data. This latter grouping will include both academic staff not involved in research and research-active academic staff not returned to RAE 2008. In addition, there are
differences in the census dates for the reporting of cat-egory A staff to RAE 2008 (31 October 2007) and the HESA 2007/08 staff return (31 July 2008).
One reason why the number of category A staff might be greater for physics and chemistry than HESA staff numbers is that some research staff are included as category A staff. This might apply in particular to col-lege lecturers working at the universities of Cambridge and Oxford. Examination of the data in table 6 shows that both Cambridge and Oxford have significantly larger numbers of category A staff than staff listed in the HESA staff data; 61 and 45, respectively. Similar patterns are observed in the chemistry data with 21 and 23 more category A staff listed for Cambridge and Oxford, respectively.
Source: RAE 2008 and HESA staff data.
Table�5: Number of category A staff submitted under selected UoAs in the RAE 2008 and HESA staff data for the equivalent cost centres for 2007/08
Unit of assessment(s) Category A staff Cost centre 2007/08 HESA permanent
academic staff FTEs
Ratio of Category A FTEs to HESA FTEs
Physics 1685.6 Physics 1625 1.04
Chemistry 1150.9 Chemistry 1510 0.76
Applied mathematics Pure mathematics Statistics and operational research
1924.1 Mathematics 2480 0.78
All UoAs 52 409.2 All cost centres 105 440 0.50
All UoAs: Russell Group 25 582.3 All cost centres: Russell Group 31 575 0.81
All UoAs: 1994 Group 9391.5 All cost centres: 1994 Group 12 630 0.74
All UoAs: UK except Russell Group & 1994 Group
17 435.5 All cost centres: UK except Russell Group & 1994 Group
59 720 0.29
2: Physics staff in UK HEIs
8 A c A d e m i c P h y s i c s s t A f f i n U K h i g h e R e d U c A t i o n i n s t i t U t i o n s J A n U A R y 2 01 2
Table�6: Number of category A staff submitted by HEIs under the physics UoA in the RAE 2008 and HESA staff data for the physics cost centre for 2007/08
HEI Permanent academic staff** FTE Category A staff submitted Ratio of Category A FTEs to HESA FTEs
University of Cambridge 80 141.25 1.8
University of Oxford 95 140.1 1.5
Imperial College London 120 126.8 1.1
University College London 95 101.03 1.1
University of Manchester 85 82.8 1.0
Durham University 55 69.5 1.3
University of Edinburgh*** 55 60.5 1.1
University of Warwick 50 51 1.0
Queen’s University Belfast 50 50 1.0
University of Bristol 40 46 1.1
University of Glasgow 45 45.75 1.1
University of Southampton 35 45.3 1.3
University of Leicester 35 45 1.2
University of Nottingham 40 44.45 1.1
University of Birmingham 40 43.6 1.1
University of Leeds 40 35.5 0.9
Queen Mary, University of London 40 34.98 0.9
University of Liverpool 35 34.6 1.0
Cardiff University 25 32.3 1.3
University of St Andrews 30 32.2 1.0
University of Strathclyde 45 31.67 0.7
University of Sheffield 30 31.5 1.1
University of Exeter 30 28 0.9
University of Hertfordshire 30 28 1.0
Royal Holloway, University of London 25 27.96 1.1
University of Surrey 25 27.2 1.1
Lancaster University 30 26.4 0.8
University of York 30 26 0.9
University of Central Lancashire 5 22.2 4.4
Swansea University 20 20.75 1.1
University of Bath 25 20.2 0.8
University of Sussex 20 20 1.1
Heriot-Watt University 30 19.5 0.7
Aberystwyth University 15 18.33 1.2
Loughborough University 40 17.1 0.4
Liverpool John Moores University 15 16.5 1.0
King’s College London 15 16.4 1.0
Keele University 10 10 0.9
Armagh Observatory – 7.5 –
University of the West of Scotland 10 3.7 0.4
University of Kent 20 3 0.2
University of Brighton – 1 –
Total 1555 1685.6 1.08*All values have been round to the nearest five. **Permanent academic staff are lecturers, senior lecturers and professors. ***HESA staff data for 2006/07 has been used because data for 2007/08 was not in line with other years’ data.
Source: RAE 2008 and HESA staff data.
9
2: Physics staff in UK HEIs
A c A d e m i c P h y s i c s s t A f f i n U K h i g h e R e d U c A t i o n i n s t i t U t i o n s J A n U A R y 2 01 2
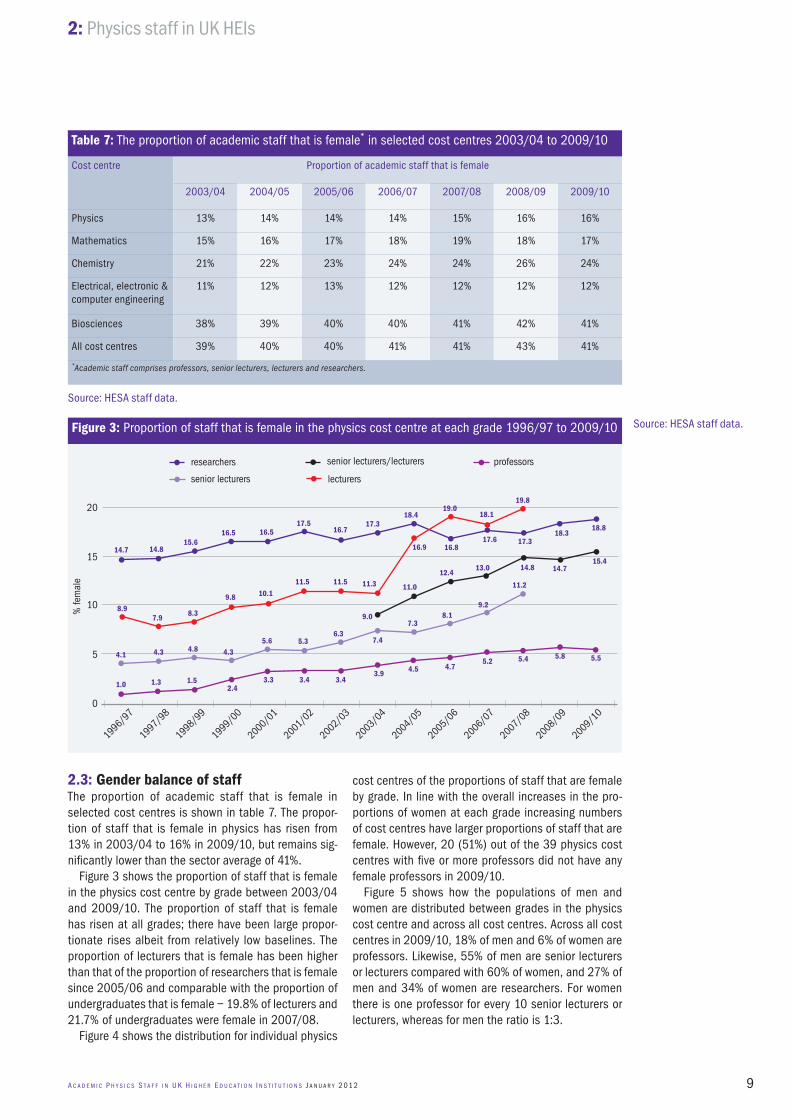
2.3:�Gender�balance�of�staffThe proportion of academic staff that is female in selected cost centres is shown in table 7. The propor-tion of staff that is female in physics has risen from 13% in 2003/04 to 16% in 2009/10, but remains sig-nificantly lower than the sector average of 41%.
Figure 3 shows the proportion of staff that is female in the physics cost centre by grade between 2003/04 and 2009/10. The proportion of staff that is female has risen at all grades; there have been large propor-tionate rises albeit from relatively low baselines. The proportion of lecturers that is female has been higher than that of the proportion of researchers that is female since 2005/06 and comparable with the proportion of undergraduates that is female – 19.8% of lecturers and 21.7% of undergraduates were female in 2007/08.
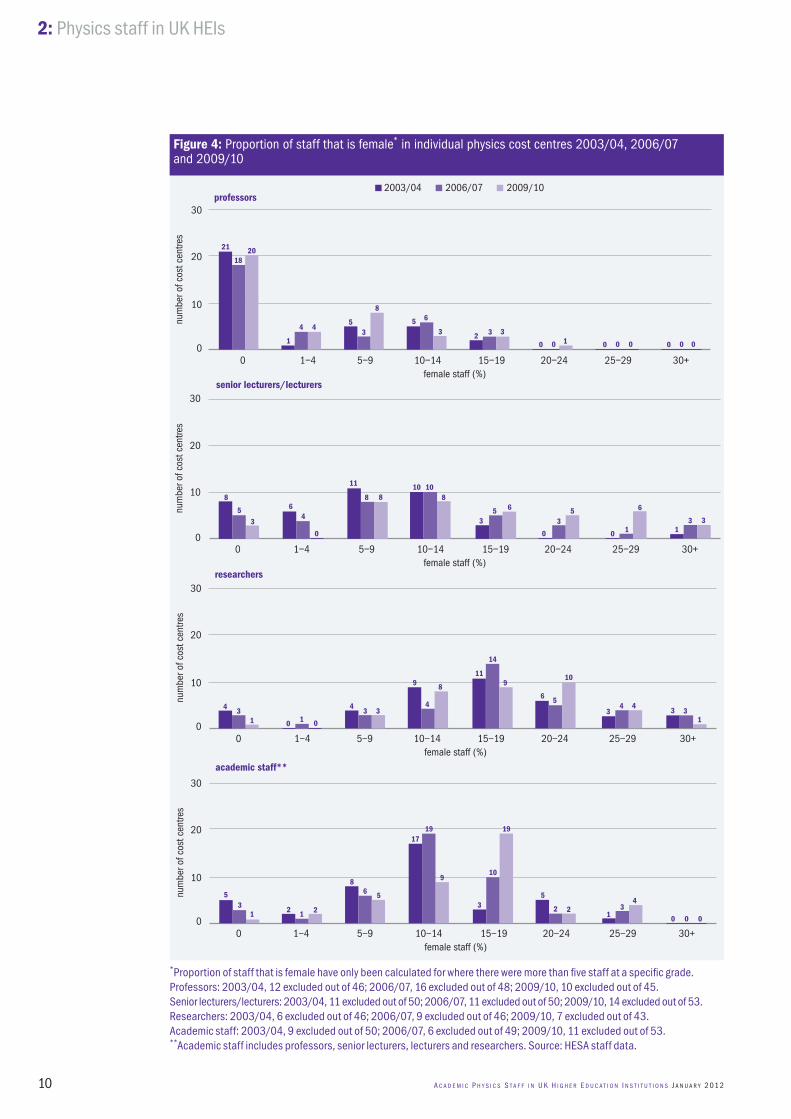
Figure 4 shows the distribution for individual physics
cost centres of the proportions of staff that are female by grade. In line with the overall increases in the pro-portions of women at each grade increasing numbers of cost centres have larger proportions of staff that are female. However, 20 (51%) out of the 39 physics cost centres with five or more professors did not have any female professors in 2009/10.
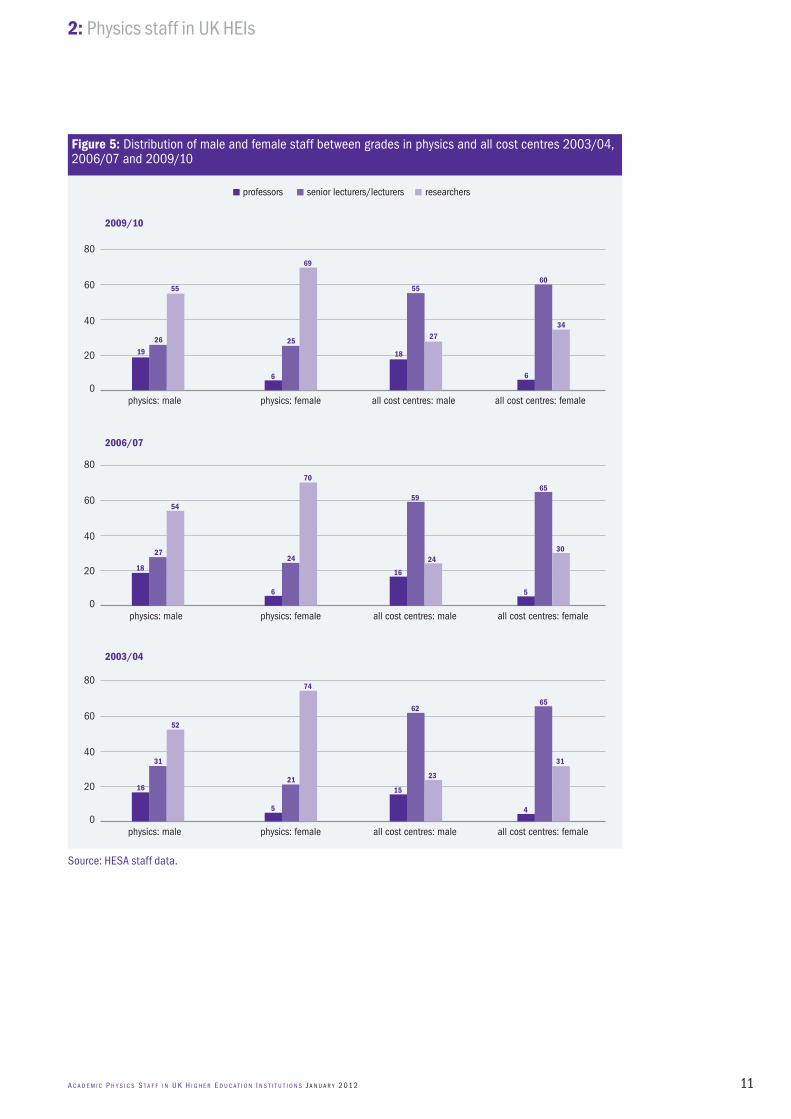
Figure 5 shows how the populations of men and women are distributed between grades in the physics cost centre and across all cost centres. Across all cost centres in 2009/10, 18% of men and 6% of women are professors. Likewise, 55% of men are senior lecturers or lecturers compared with 60% of women, and 27% of men and 34% of women are researchers. For women there is one professor for every 10 senior lecturers or lecturers, whereas for men the ratio is 1:3.
20
researchers
senior lecturers lecturers
professorssenior lecturers/lecturers
14.7 14.815.6
16.5 16.517.5
16.717.3
18.4
15
10
5
0
1996
/97
1997
/98
1998
/99
1999
/00
2000
/01
2001
/02
2002
/03
2003
/04
2004
/05
2005
/06
2006
/07
2007
/08
2008
/09
2009
/10
% fe
mal
e
19.018.1
18.818.3
17.317.616.816.9
11.311.511.5
10.19.8
8.38.9
4.1
1.0 1.3 1.52.4
3.3 3.4 3.43.9 4.5 4.7
5.2 5.4 5.8 5.54.3 4.3
5.6 5.36.3
7.4
7.38.1
9.2
9.0
11.0
12.413.0 14.8 14.7
15.4
11.2
4.8
7.9
19.8
Figure�3: Proportion of staff that is female in the physics cost centre at each grade 1996/97 to 2009/10 Source: HESA staff data.
Source: HESA staff data.
Table�7: The proportion of academic staff that is female* in selected cost centres 2003/04 to 2009/10
Cost centre Proportion of academic staff that is female
2003/04 2004/05 2005/06 2006/07 2007/08 2008/09 2009/10
Physics 13% 14% 14% 14% 15% 16% 16%
Mathematics 15% 16% 17% 18% 19% 18% 17%
Chemistry 21% 22% 23% 24% 24% 26% 24%
Electrical, electronic & computer engineering
11% 12% 13% 12% 12% 12% 12%
Biosciences 38% 39% 40% 40% 41% 42% 41%
All cost centres 39% 40% 40% 41% 41% 43% 41%
*Academic staff comprises professors, senior lecturers, lecturers and researchers.
2: Physics staff in UK HEIs
10 A c A d e m i c P h y s i c s s t A f f i n U K h i g h e R e d U c A t i o n i n s t i t U t i o n s J A n U A R y 2 01 2
30
202021
18
1
4 45
3 3 32 3
810
00 30+25–2920–2415–1910–145–91–4
num
ber o
f cos
t cen
tres
female staff (%)
5 6
0 0 0 0 0 0 0 01
30
20
professors
senior lecturers/lecturers
8 8 8 8
53
64
0
11
3 3 3 35 5
1 1
66
10
00 30+25–2920–2415–1910–145–91–4
num
ber o
f cos
t cen
tres
female staff (%)
10 10
0 0
30
20
researchers
43 3
8
4
13
1 00
11 10
6
3 3
14
53
4 4
1
10
00 30+25–2920–2415–1910–145–91–4
num
ber o
f cos
t cen
tres
female staff (%)
9 9
4
30
20
academic staff**
8 9
3
1719
10
19
6 55
13
12 2
5
2 20 01
34
0
10
00 30+25–2920–2415–1910–145–91–4
num
ber o
f cos
t cen
tres
female staff (%)
2003/04 2006/07 2009/10
Figure�4: Proportion of staff that is female* in individual physics cost centres 2003/04, 2006/07 and 2009/10
*Proportion of staff that is female have only been calculated for where there were more than five staff at a specific grade. Professors: 2003/04, 12 excluded out of 46; 2006/07, 16 excluded out of 48; 2009/10, 10 excluded out of 45. Senior lecturers/lecturers: 2003/04, 11 excluded out of 50; 2006/07, 11 excluded out of 50; 2009/10, 14 excluded out of 53. Researchers: 2003/04, 6 excluded out of 46; 2006/07, 9 excluded out of 46; 2009/10, 7 excluded out of 43. Academic staff: 2003/04, 9 excluded out of 50; 2006/07, 6 excluded out of 49; 2009/10, 11 excluded out of 53. **Academic staff includes professors, senior lecturers, lecturers and researchers. Source: HESA staff data.
11
2: Physics staff in UK HEIs
A c A d e m i c P h y s i c s s t A f f i n U K h i g h e R e d U c A t i o n i n s t i t U t i o n s J A n U A R y 2 01 2
80
19
26
5560
40
20
0physics: male physics: female
2009/10
professors senior lecturers/lecturers researchers
6
25
69
all cost centres: male all cost centres: female
18
55
27
6
60
34
80
18
27
5460
40
20
0physics: male physics: female
2006/07
6
24
70
all cost centres: male all cost centres: female
16
59
24
5
65
30
80
16
31
5260
40
20
0physics: male physics: female
2003/04
5
21
74
all cost centres: male all cost centres: female
15
62
23
4
65
31
Figure�5: Distribution of male and female staff between grades in physics and all cost centres 2003/04, 2006/07 and 2009/10
Source: HESA staff data.
2: Physics staff in UK HEIs
12 A c A d e m i c P h y s i c s s t A f f i n U K h i g h e R e d U c A t i o n i n s t i t U t i o n s J A n U A R y 2 01 2
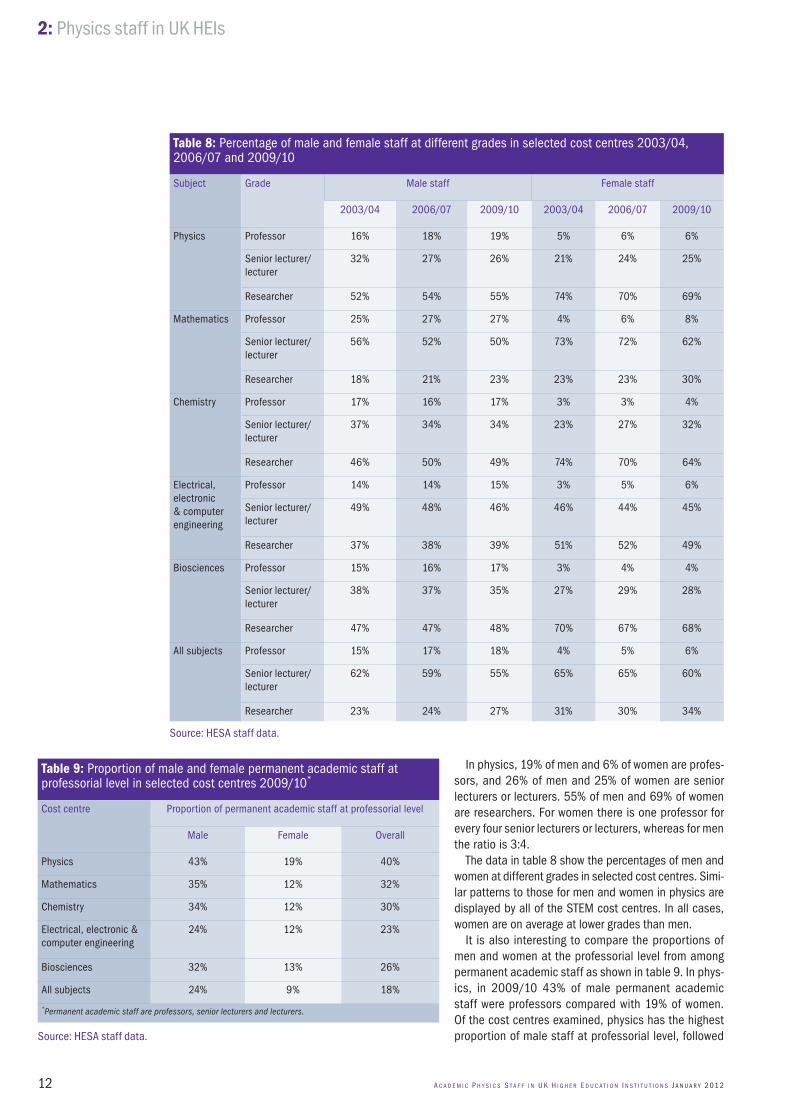
In physics, 19% of men and 6% of women are profes-sors, and 26% of men and 25% of women are senior lecturers or lecturers. 55% of men and 69% of women are researchers. For women there is one professor for every four senior lecturers or lecturers, whereas for men the ratio is 3:4.
The data in table 8 show the percentages of men and women at different grades in selected cost centres. Simi-lar patterns to those for men and women in physics are displayed by all of the STEM cost centres. In all cases, women are on average at lower grades than men.
It is also interesting to compare the proportions of men and women at the professorial level from among permanent academic staff as shown in table 9. In phys-ics, in 2009/10 43% of male permanent academic staff were professors compared with 19% of women. Of the cost centres examined, physics has the highest proportion of male staff at professorial level, followed
Table�8: Percentage of male and female staff at different grades in selected cost centres 2003/04, 2006/07 and 2009/10
Subject Grade Male staff Female staff
2003/04 2006/07 2009/10 2003/04 2006/07 2009/10
Physics Professor 16% 18% 19% 5% 6% 6%
Senior lecturer/ lecturer
32% 27% 26% 21% 24% 25%
Researcher 52% 54% 55% 74% 70% 69%
Mathematics Professor 25% 27% 27% 4% 6% 8%
Senior lecturer/ lecturer
56% 52% 50% 73% 72% 62%
Researcher 18% 21% 23% 23% 23% 30%
Chemistry Professor 17% 16% 17% 3% 3% 4%
Senior lecturer/ lecturer
37% 34% 34% 23% 27% 32%
Researcher 46% 50% 49% 74% 70% 64%
Electrical, electronic & computer engineering
Professor 14% 14% 15% 3% 5% 6%
Senior lecturer/ lecturer
49% 48% 46% 46% 44% 45%
Researcher 37% 38% 39% 51% 52% 49%
Biosciences Professor 15% 16% 17% 3% 4% 4%
Senior lecturer/ lecturer
38% 37% 35% 27% 29% 28%
Researcher 47% 47% 48% 70% 67% 68%
All subjects Professor 15% 17% 18% 4% 5% 6%
Senior lecturer/lecturer
62% 59% 55% 65% 65% 60%
Researcher 23% 24% 27% 31% 30% 34%
Source: HESA staff data.
Source: HESA staff data.
Table�9: Proportion of male and female permanent academic staff at professorial level in selected cost centres 2009/10*
Cost centre Proportion of permanent academic staff at professorial level
Male Female Overall
Physics 43% 19% 40%
Mathematics 35% 12% 32%
Chemistry 34% 12% 30%
Electrical, electronic & computer engineering
24% 12% 23%
Biosciences 32% 13% 26%
All subjects 24% 9% 18%
*Permanent academic staff are professors, senior lecturers and lecturers.
13
2: Physics staff in UK HEIs
A c A d e m i c P h y s i c s s t A f f i n U K h i g h e R e d U c A t i o n i n s t i t U t i o n s J A n U A R y 2 01 2
by mathematics, chemistry and biosciences, which all have around the same proportion. Electrical, electronic & computer engineering has the lowest proportion of men at professorial level at 24%, which is the same as the sector average. Similarly, physics has the highest proportion of women at professorial level at 19%. The other cost centres under consideration all have about the same proportion of women at professorial level, 12 or 13%, which is higher than the sector average of 9%.
Overall, women permanent academic staff are much less likely than men to be professors, but there are dif-ferences between cost centres. The overall proportion of permanent academic staff at professorial level is a characteristic of each cost centre. For example, physics has a high proportion of permanent academic staff at professorial level, almost more than twice the sector average, so it is to be expected that it also has the highest proportions of men and women at professorial level. Consequently, what is of interest is the ratio of the proportions of men and women at professorial level.
Of the cost centres under consideration, in physics
and electrical, electronic & computer engineering men are about twice as likely to be professors as women, while in mathematics and chemistry men are about three times more likely than women to be professors, and in biosciences men are about two and a half times more likely than women to be professors. Across all cost centres men are 2.7 times more likely to be profes-sors than women.
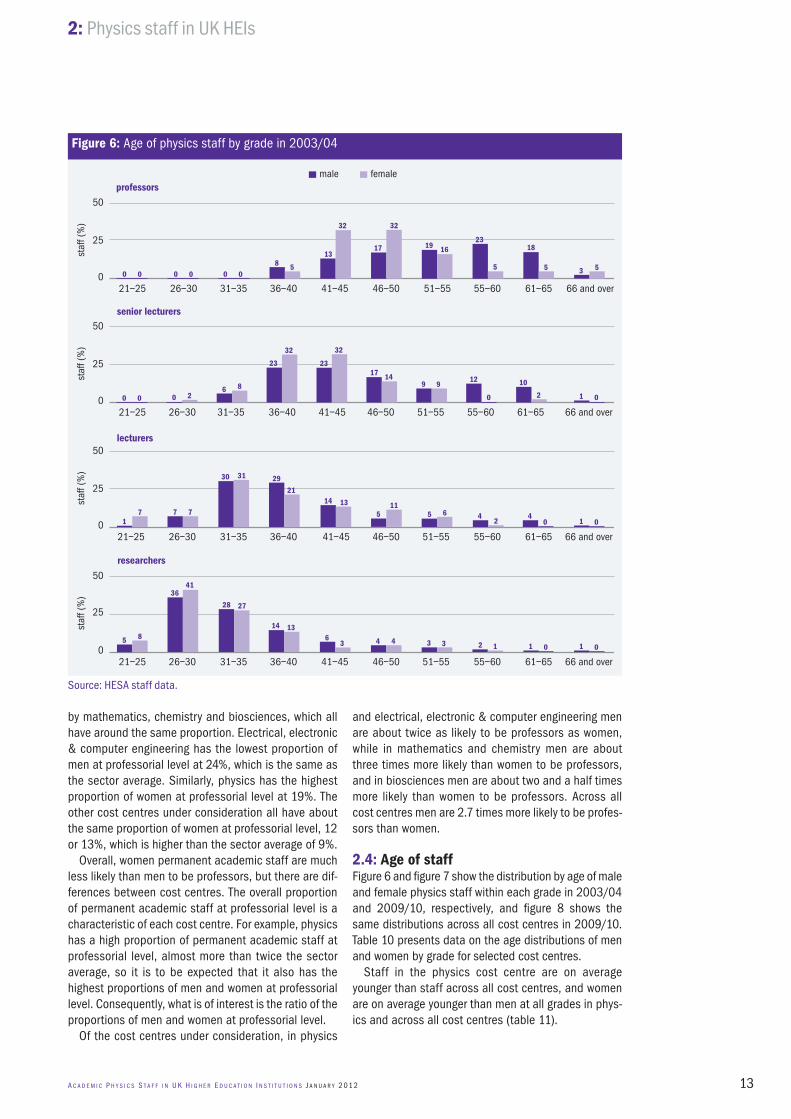
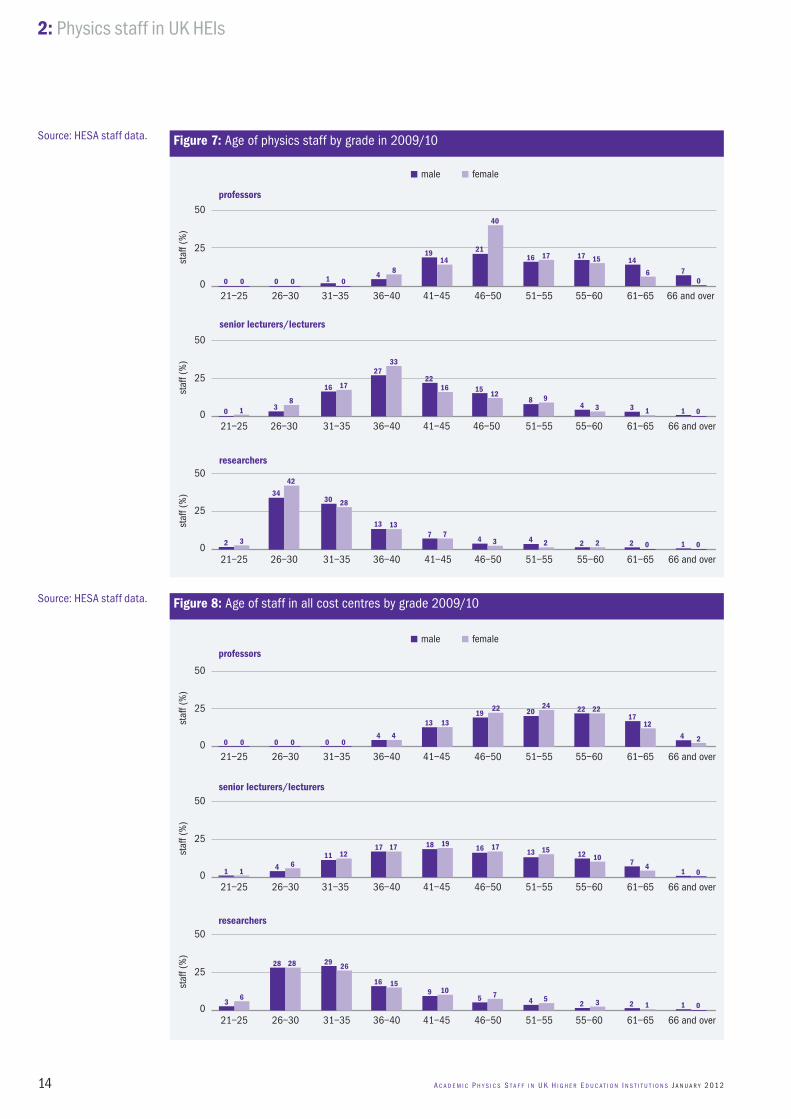
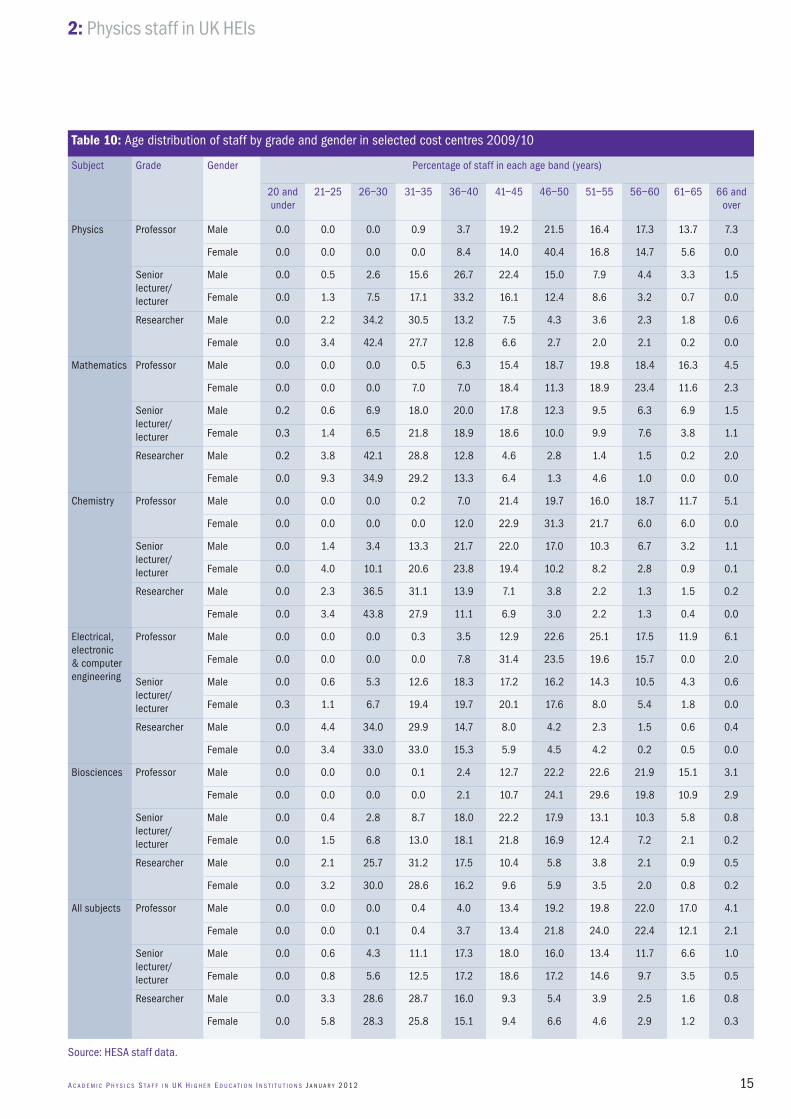
2.4:�Age�of�staffFigure 6 and figure 7 show the distribution by age of male and female physics staff within each grade in 2003/04 and 2009/10, respectively, and figure 8 shows the same distributions across all cost centres in 2009/10. Table 10 presents data on the age distributions of men and women by grade for selected cost centres.
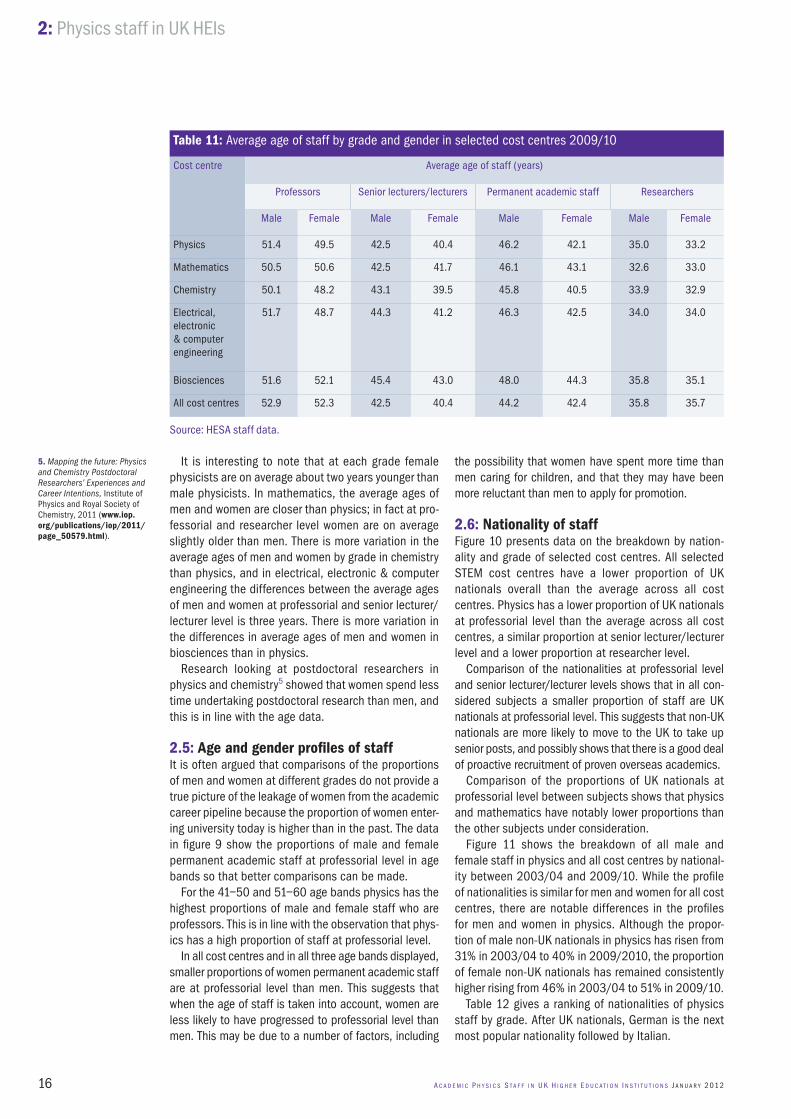
Staff in the physics cost centre are on average younger than staff across all cost centres, and women are on average younger than men at all grades in phys-ics and across all cost centres (table 11).
Source: HESA staff data.
50
25
0
staf
f (%
)
50
25
0
staf
f (%
)
50
25
0
staf
f (%
)
50
25
0
staf
f (%
)
8 5
23
5
18
5 3 5
13
32
17
32
19 16
professorsmale female
36–4031–3526–3021–25 41–45 46–50 51–55 55–60 61–65 66 and over
0 2
12
0
10
2 016 8
23
32
23
32
17 149 9
senior lecturers
36–4031–3526–3021–25 41–45 46–50 51–55 55–60 61–65 66 and over
42
40 01
30 31
17 77
29
2114 13
511
5 6
lecturers
36–4031–3526–3021–25 41–45 46–50 51–55 55–60 61–65 66 and over
2 1 0101
28 27
5 8
4136
14 136
3 4 4 3 3
researchers
36–4031–3526–3021–25 41–45 46–50 51–55 55–60 61–65 66 and over
00
000000
Figure�6: Age of physics staff by grade in 2003/04
2: Physics staff in UK HEIs
14 A c A d e m i c P h y s i c s s t A f f i n U K h i g h e R e d U c A t i o n i n s t i t U t i o n s J A n U A R y 2 01 2
50
25
0
staf
f (%
)
50
25
0
staf
f (%
)
50
25
0
staf
f (%
)
17 15 14
648
1914
21
40
16 17
70
professors
male female
36–4031–3526–3021–25 41–45 46–50 51–55 55–60 61–65 66 and over
0 1 3 14 3 013
8
16 17
2733
2216 15
128 9
senior lecturers/lecturers
36–4031–3526–3021–25 41–45 46–50 51–55 55–60 61–65 66 and over
2 2 2 0 01
30 28
2 3
42
34
13 137 7
4 3 4 2
researchers
36–4031–3526–3021–25 41–45 46–50 51–55 55–60 61–65 66 and over
0000 1 0
50
25
0
staf
f (%
)
50
25
0
staf
f (%
)
50
25
0
staf
f (%
)
22 2217
12
4 4
13 1319
22 2024
professorsmale female
36–4031–3526–3021–25 41–45 46–50 51–55 55–60 61–65 66 and over
117 4
12 10
014 6
11 1217 17 18 19 16 17
13 15
senior lecturers/lecturers
36–4031–3526–3021–25 41–45 46–50 51–55 55–60 61–65 66 and over
2 3 012 1
29 26
63
2828
16 159 10
5 74 5
researchers
36–4031–3526–3021–25 41–45 46–50 51–55 55–60 61–65 66 and over
00 00004 2
Figure�7: Age of physics staff by grade in 2009/10
Figure�8: Age of staff in all cost centres by grade 2009/10
Source: HESA staff data.
Source: HESA staff data.
15
2: Physics staff in UK HEIs
A c A d e m i c P h y s i c s s t A f f i n U K h i g h e R e d U c A t i o n i n s t i t U t i o n s J A n U A R y 2 01 2
Source: HESA staff data.
Table�10: Age distribution of staff by grade and gender in selected cost centres 2009/10
Subject Grade Gender Percentage of staff in each age band (years)
20 and under
21–25 26–30 31–35 36–40 41–45 46–50 51–55 56–60 61–65 66 and over
Physics Professor Male 0.0 0.0 0.0 0.9 3.7 19.2 21.5 16.4 17.3 13.7 7.3
Female 0.0 0.0 0.0 0.0 8.4 14.0 40.4 16.8 14.7 5.6 0.0
Senior lecturer/lecturer
Male 0.0 0.5 2.6 15.6 26.7 22.4 15.0 7.9 4.4 3.3 1.5
Female 0.0 1.3 7.5 17.1 33.2 16.1 12.4 8.6 3.2 0.7 0.0
Researcher Male 0.0 2.2 34.2 30.5 13.2 7.5 4.3 3.6 2.3 1.8 0.6
Female 0.0 3.4 42.4 27.7 12.8 6.6 2.7 2.0 2.1 0.2 0.0
Mathematics Professor Male 0.0 0.0 0.0 0.5 6.3 15.4 18.7 19.8 18.4 16.3 4.5
Female 0.0 0.0 0.0 7.0 7.0 18.4 11.3 18.9 23.4 11.6 2.3
Senior lecturer/lecturer
Male 0.2 0.6 6.9 18.0 20.0 17.8 12.3 9.5 6.3 6.9 1.5
Female 0.3 1.4 6.5 21.8 18.9 18.6 10.0 9.9 7.6 3.8 1.1
Researcher Male 0.2 3.8 42.1 28.8 12.8 4.6 2.8 1.4 1.5 0.2 2.0
Female 0.0 9.3 34.9 29.2 13.3 6.4 1.3 4.6 1.0 0.0 0.0
Chemistry Professor Male 0.0 0.0 0.0 0.2 7.0 21.4 19.7 16.0 18.7 11.7 5.1
Female 0.0 0.0 0.0 0.0 12.0 22.9 31.3 21.7 6.0 6.0 0.0
Senior lecturer/lecturer
Male 0.0 1.4 3.4 13.3 21.7 22.0 17.0 10.3 6.7 3.2 1.1
Female 0.0 4.0 10.1 20.6 23.8 19.4 10.2 8.2 2.8 0.9 0.1
Researcher Male 0.0 2.3 36.5 31.1 13.9 7.1 3.8 2.2 1.3 1.5 0.2
Female 0.0 3.4 43.8 27.9 11.1 6.9 3.0 2.2 1.3 0.4 0.0
Electrical, electronic & computer engineering
Professor Male 0.0 0.0 0.0 0.3 3.5 12.9 22.6 25.1 17.5 11.9 6.1
Female 0.0 0.0 0.0 0.0 7.8 31.4 23.5 19.6 15.7 0.0 2.0
Senior lecturer/lecturer
Male 0.0 0.6 5.3 12.6 18.3 17.2 16.2 14.3 10.5 4.3 0.6
Female 0.3 1.1 6.7 19.4 19.7 20.1 17.6 8.0 5.4 1.8 0.0
Researcher Male 0.0 4.4 34.0 29.9 14.7 8.0 4.2 2.3 1.5 0.6 0.4
Female 0.0 3.4 33.0 33.0 15.3 5.9 4.5 4.2 0.2 0.5 0.0
Biosciences Professor Male 0.0 0.0 0.0 0.1 2.4 12.7 22.2 22.6 21.9 15.1 3.1
Female 0.0 0.0 0.0 0.0 2.1 10.7 24.1 29.6 19.8 10.9 2.9
Senior lecturer/lecturer
Male 0.0 0.4 2.8 8.7 18.0 22.2 17.9 13.1 10.3 5.8 0.8
Female 0.0 1.5 6.8 13.0 18.1 21.8 16.9 12.4 7.2 2.1 0.2
Researcher Male 0.0 2.1 25.7 31.2 17.5 10.4 5.8 3.8 2.1 0.9 0.5
Female 0.0 3.2 30.0 28.6 16.2 9.6 5.9 3.5 2.0 0.8 0.2
All subjects Professor Male 0.0 0.0 0.0 0.4 4.0 13.4 19.2 19.8 22.0 17.0 4.1
Female 0.0 0.0 0.1 0.4 3.7 13.4 21.8 24.0 22.4 12.1 2.1
Senior lecturer/lecturer
Male 0.0 0.6 4.3 11.1 17.3 18.0 16.0 13.4 11.7 6.6 1.0
Female 0.0 0.8 5.6 12.5 17.2 18.6 17.2 14.6 9.7 3.5 0.5
Researcher Male 0.0 3.3 28.6 28.7 16.0 9.3 5.4 3.9 2.5 1.6 0.8
Female 0.0 5.8 28.3 25.8 15.1 9.4 6.6 4.6 2.9 1.2 0.3
2: Physics staff in UK HEIs
16 A c A d e m i c P h y s i c s s t A f f i n U K h i g h e R e d U c A t i o n i n s t i t U t i o n s J A n U A R y 2 01 2
Table�11: Average age of staff by grade and gender in selected cost centres 2009/10
Cost centre Average age of staff (years)
Professors Senior lecturers/lecturers Permanent academic staff Researchers
Male Female Male Female Male Female Male Female
Physics 51.4 49.5 42.5 40.4 46.2 42.1 35.0 33.2
Mathematics 50.5 50.6 42.5 41.7 46.1 43.1 32.6 33.0
Chemistry 50.1 48.2 43.1 39.5 45.8 40.5 33.9 32.9
Electrical, electronic & computer engineering
51.7 48.7 44.3 41.2 46.3 42.5 34.0 34.0
Biosciences 51.6 52.1 45.4 43.0 48.0 44.3 35.8 35.1
All cost centres 52.9 52.3 42.5 40.4 44.2 42.4 35.8 35.7
Source: HESA staff data.
It is interesting to note that at each grade female physicists are on average about two years younger than male physicists. In mathematics, the average ages of men and women are closer than physics; in fact at pro-fessorial and researcher level women are on average slightly older than men. There is more variation in the average ages of men and women by grade in chemistry than physics, and in electrical, electronic & computer engineering the differences between the average ages of men and women at professorial and senior lecturer/lecturer level is three years. There is more variation in the differences in average ages of men and women in biosciences than in physics.
Research looking at postdoctoral researchers in physics and chemistry5 showed that women spend less time undertaking postdoctoral research than men, and this is in line with the age data.
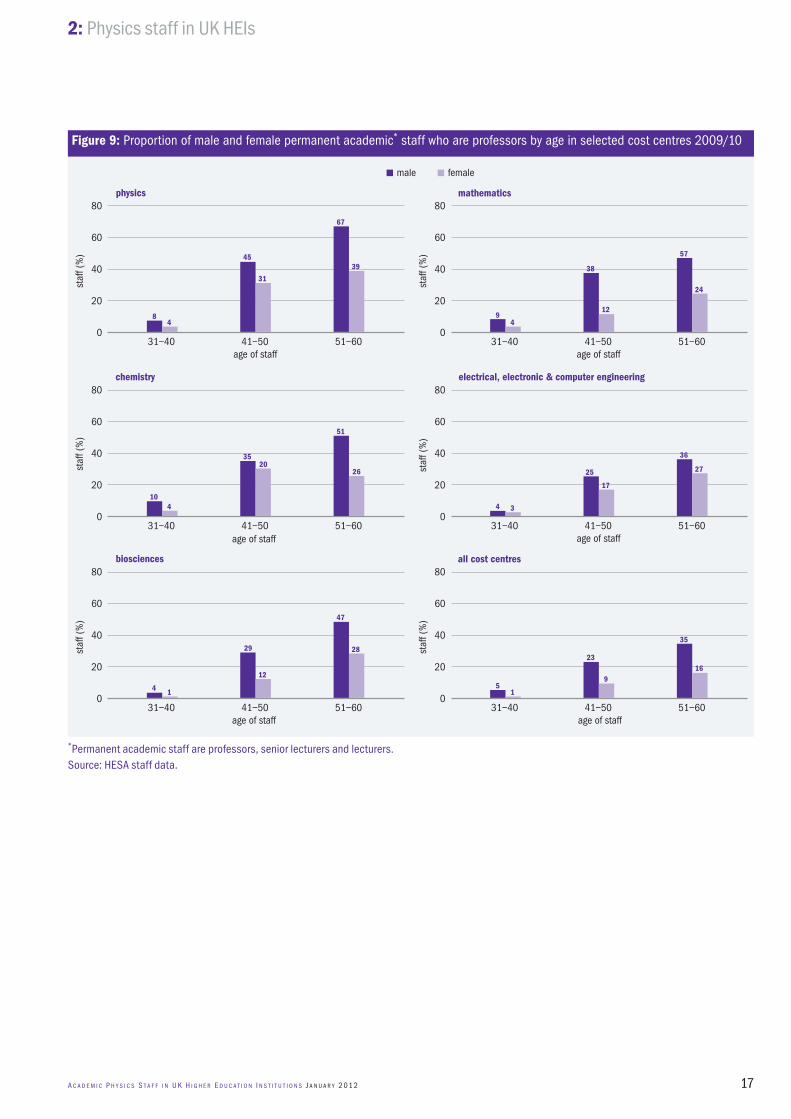
2.5:�Age�and�gender�profiles�of�staffIt is often argued that comparisons of the proportions of men and women at different grades do not provide a true picture of the leakage of women from the academic career pipeline because the proportion of women enter-ing university today is higher than in the past. The data in figure 9 show the proportions of male and female permanent academic staff at professorial level in age bands so that better comparisons can be made.
For the 41–50 and 51–60 age bands physics has the highest proportions of male and female staff who are professors. This is in line with the observation that phys-ics has a high proportion of staff at professorial level.
In all cost centres and in all three age bands displayed, smaller proportions of women permanent academic staff are at professorial level than men. This suggests that when the age of staff is taken into account, women are less likely to have progressed to professorial level than men. This may be due to a number of factors, including
the possibility that women have spent more time than men caring for children, and that they may have been more reluctant than men to apply for promotion.
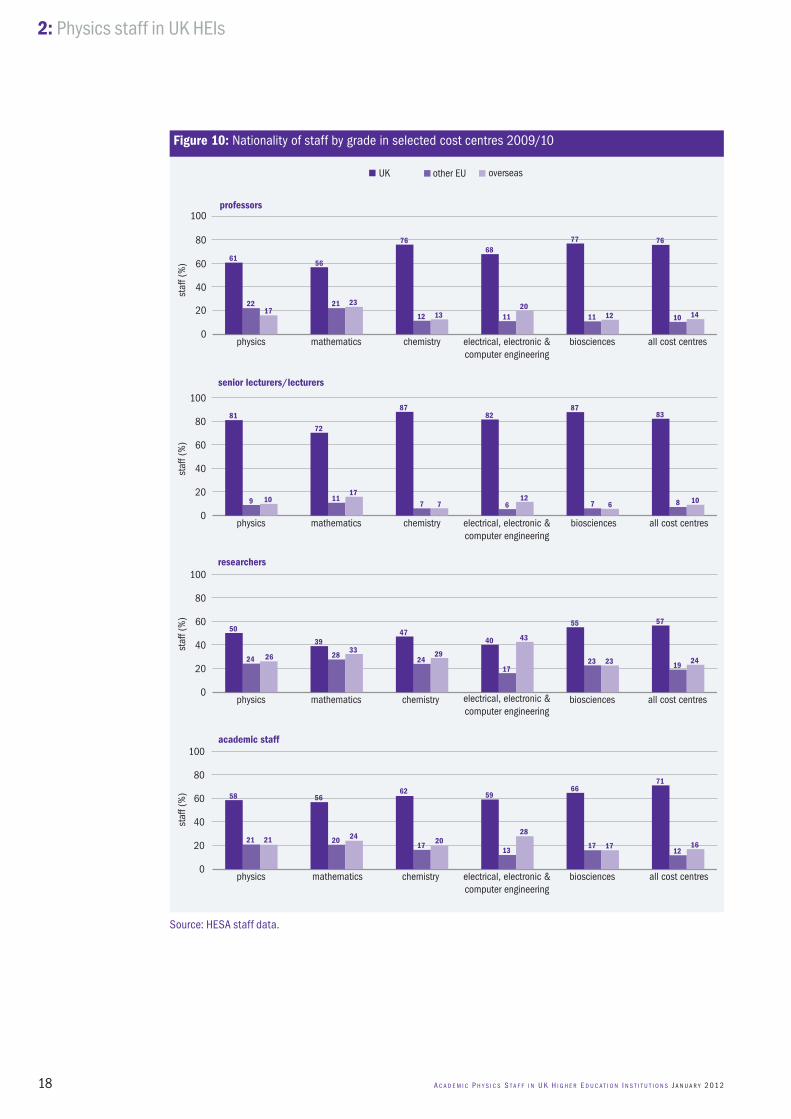
2.6:�Nationality�of�staffFigure 10 presents data on the breakdown by nation-ality and grade of selected cost centres. All selected STEM cost centres have a lower proportion of UK nationals overall than the average across all cost centres. Physics has a lower proportion of UK nationals at professorial level than the average across all cost centres, a similar proportion at senior lecturer/lecturer level and a lower proportion at researcher level.
Comparison of the nationalities at professorial level and senior lecturer/lecturer levels shows that in all con-sidered subjects a smaller proportion of staff are UK nationals at professorial level. This suggests that non-UK nationals are more likely to move to the UK to take up senior posts, and possibly shows that there is a good deal of proactive recruitment of proven overseas academics.
Comparison of the proportions of UK nationals at professorial level between subjects shows that physics and mathematics have notably lower proportions than the other subjects under consideration.
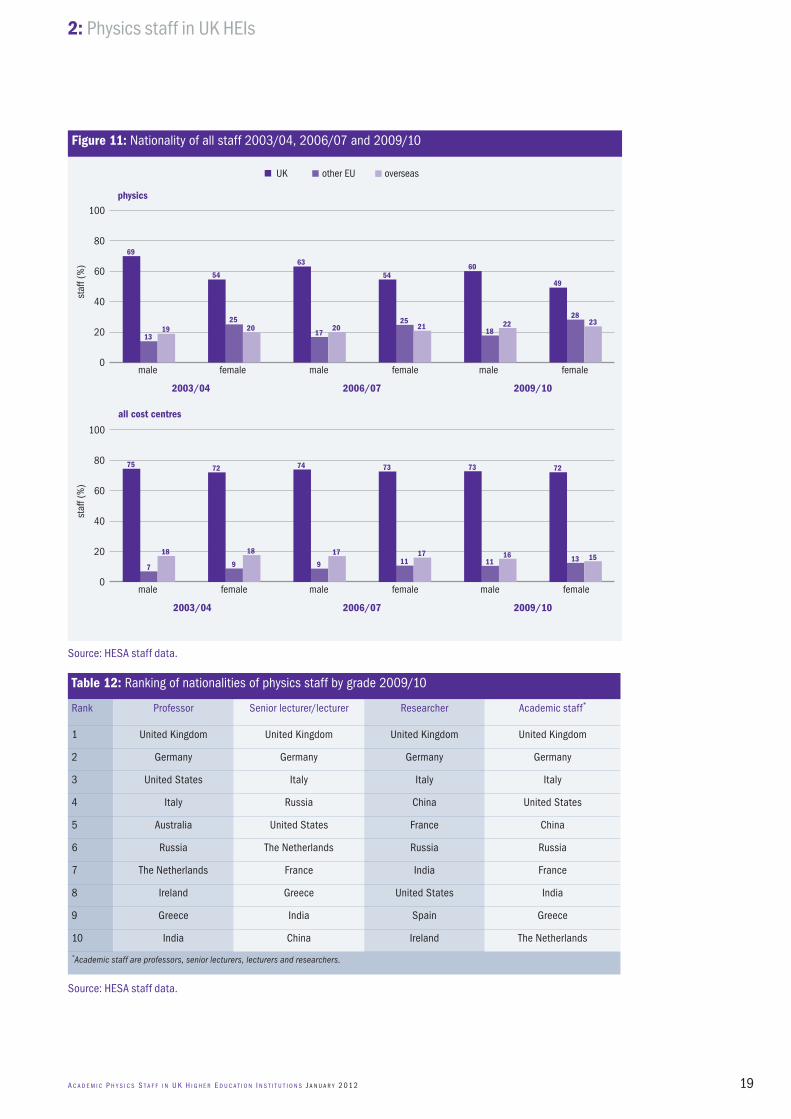
Figure 11 shows the breakdown of all male and female staff in physics and all cost centres by national-ity between 2003/04 and 2009/10. While the profile of nationalities is similar for men and women for all cost centres, there are notable differences in the profiles for men and women in physics. Although the propor-tion of male non-UK nationals in physics has risen from 31% in 2003/04 to 40% in 2009/2010, the proportion of female non-UK nationals has remained consistently higher rising from 46% in 2003/04 to 51% in 2009/10.
Table 12 gives a ranking of nationalities of physics staff by grade. After UK nationals, German is the next most popular nationality followed by Italian.
5. Mapping the future: Physics and Chemistry Postdoctoral Researchers’ Experiences and Career Intentions, Institute of Physics and Royal Society of Chemistry, 2011 (www.iop.org/publications/iop/2011/page_50579.html).
17
2: Physics staff in UK HEIs
A c A d e m i c P h y s i c s s t A f f i n U K h i g h e R e d U c A t i o n i n s t i t U t i o n s J A n U A R y 2 01 2
*Permanent academic staff are professors, senior lecturers and lecturers. Source: HESA staff data.
80
20
40
60
0
staf
f (%
)
80
20
40
60
0
staf
f (%
)
80
20
40
60
0
staf
f (%
)
80
20
40
60
0
staf
f (%
)
80
20
40
60
0
staf
f (%
)
80
20
40
60
0
staf
f (%
)
45
31
67
39
84
physics
male female
31–40 41–50 51–60age of staff
38
12
57
24
94
mathematics
31–40 41–50 51–60age of staff
3520
51
26
104
chemistry
31–40 41–50 51–60age of staff
25
17
36
27
4 3
electrical, electronic & computer engineering
31–40 41–50 51–60age of staff
29
12
47
28
4 1
biosciences
31–40 41–50 51–60age of staff
23
9
35
16
51
all cost centres
31–40 41–50 51–60age of staff
Figure�9: Proportion of male and female permanent academic* staff who are professors by age in selected cost centres 2009/10
2: Physics staff in UK HEIs
18 A c A d e m i c P h y s i c s s t A f f i n U K h i g h e R e d U c A t i o n i n s t i t U t i o n s J A n U A R y 2 01 2
Source: HESA staff data.
80
100
60
40
20
0
staf
f (%
)
80
100
60
40
20
0
staf
f (%
)
80
100
60
40
20
0
staf
f (%
)
80
100
60
40
20
0
staf
f (%
)UK overseasother EU
physics mathematics chemistry biosciences all cost centreselectrical, electronic &computer engineering
professors
61
2217
56
21 23
76
12 13
68
1120
77
11 12
76
10 14
physics mathematics chemistry biosciences all cost centreselectrical, electronic &computer engineering
senior lecturers/lecturers
81
9 10
72
1117
87
7 7
82
612
87
7 6
83
8 10
physics mathematics chemistry biosciences all cost centreselectrical, electronic &computer engineering
researchers
50
24 26
39
2833
47
2429
40
17
43
55
23 23
57
1924
physics mathematics chemistry biosciences all cost centreselectrical, electronic &computer engineering
academic staff
58
21 21
56
20 24
62
1720
59
13
28
66
17 17
71
1216
Figure�10: Nationality of staff by grade in selected cost centres 2009/10
19
2: Physics staff in UK HEIs
A c A d e m i c P h y s i c s s t A f f i n U K h i g h e R e d U c A t i o n i n s t i t U t i o n s J A n U A R y 2 01 2
Source: HESA staff data.
80
100
60
40
20
0
staf
f (%
)
all cost centres
2003/04 2006/07 2009/10
80
100
60
40
20
0
staf
f (%
)
physics
2003/04 2006/07 2009/10
UK other EU overseas
male female male male femalefemale
75
7
18
72
9
18
74
9
17
73
1117
73
1116
72
13 15
male female male male femalefemale
69
1319
54
2520
63
1720
54
2521
60
1822
49
2823
Figure�11: Nationality of all staff 2003/04, 2006/07 and 2009/10
Source: HESA staff data.
Table�12: Ranking of nationalities of physics staff by grade 2009/10
Rank Professor Senior lecturer/lecturer Researcher Academic staff*
1 United Kingdom United Kingdom United Kingdom United Kingdom
2 Germany Germany Germany Germany
3 United States Italy Italy Italy
4 Italy Russia China United States
5 Australia United States France China
6 Russia The Netherlands Russia Russia
7 The Netherlands France India France
8 Ireland Greece United States India
9 Greece India Spain Greece
10 India China Ireland The Netherlands
*Academic staff are professors, senior lecturers, lecturers and researchers.
2: Physics staff in UK HEIs
20 A c A d e m i c P h y s i c s s t A f f i n U K h i g h e R e d U c A t i o n i n s t i t U t i o n s J A n U A R y 2 01 2
Table�13: Ethnicity of UK academic staff* in selected cost centres 2009/10
Ethnicity Physics Mathematics Chemistry Electrical, electronic & computer engineering
Biosciences All cost centres
White 94.2% 94.0% 93.7% 85.3% 92.5% 92.6%
Asian or Asian British – Indian
1.5% 0.9% 1.3% 1.6% 1.8% 1.6%
Asian or Asian British – Pakistani
0.2% 0.2% 0.5% 0.5% 0.7% 0.5%
Asian or Asian British – Bangladeshi
0.0% 0.2% 0.2% 0.4% 0.2% 0.2%
Other Asian background
0.6% 0.8% 0.8% 2.6% 0.8% 0.8%
Black or Black British – African
0.0% 0.2% 0.3% 0.4% 0.4% 0.5%
Black or Black British – Caribbean
0.0% 0.1% 0.1% 0.4% 0.3% 0.5%
Other Black background
0.0% 0.0% 0.0% 0.0% 0.1% 0.1%
Chinese 1.4% 1.8% 1.5% 5.4% 1.4% 1.3%
Other and mixed ethnic background
1.8% 1.8% 1.6% 3.5% 1.9% 2.0%
*Academic staff are professors, senior lecturers, lecturers and researchers.
Source: HESA staff data.
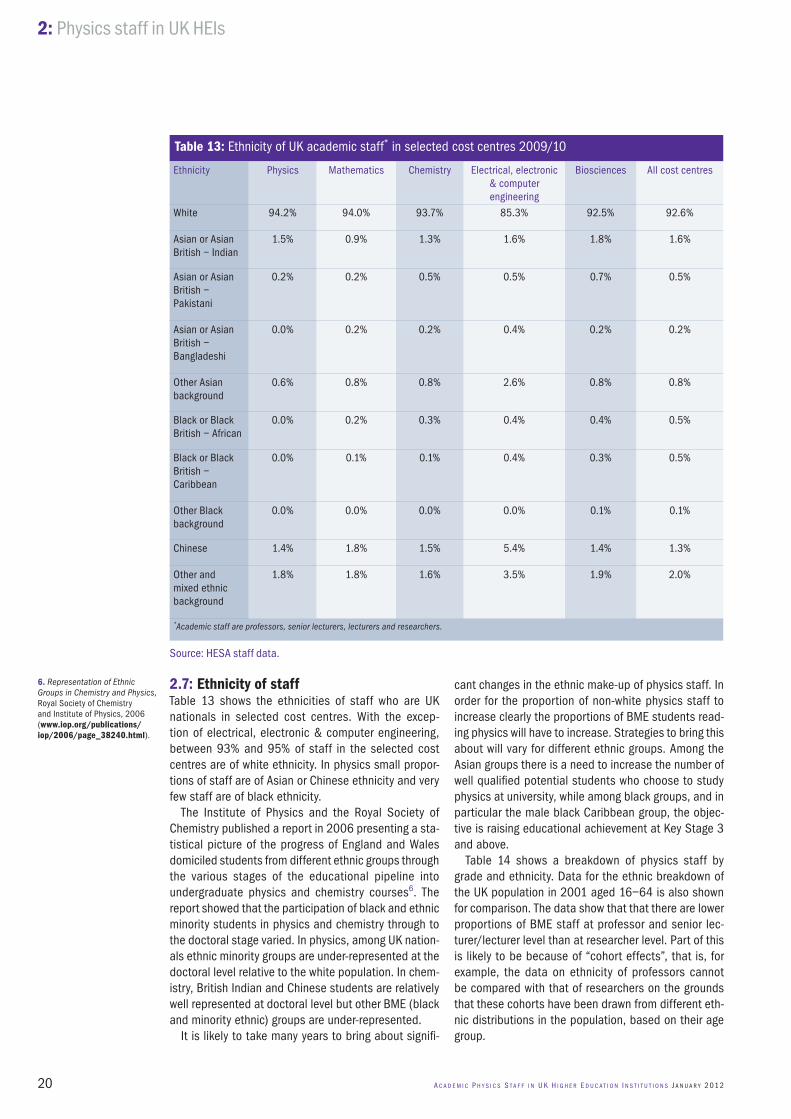
2.7:�Ethnicity�of�staffTable 13 shows the ethnicities of staff who are UK nationals in selected cost centres. With the excep-tion of electrical, electronic & computer engineering, between 93% and 95% of staff in the selected cost centres are of white ethnicity. In physics small propor-tions of staff are of Asian or Chinese ethnicity and very few staff are of black ethnicity.
The Institute of Physics and the Royal Society of Chemistry published a report in 2006 presenting a sta-tistical picture of the progress of England and Wales domiciled students from different ethnic groups through the various stages of the educational pipeline into undergraduate physics and chemistry courses6. The report showed that the participation of black and ethnic minority students in physics and chemistry through to the doctoral stage varied. In physics, among UK nation-als ethnic minority groups are under-represented at the doctoral level relative to the white population. In chem-istry, British Indian and Chinese students are relatively well represented at doctoral level but other BME (black and minority ethnic) groups are under-represented.
It is likely to take many years to bring about signifi-
cant changes in the ethnic make-up of physics staff. In order for the proportion of non-white physics staff to increase clearly the proportions of BME students read-ing physics will have to increase. Strategies to bring this about will vary for different ethnic groups. Among the Asian groups there is a need to increase the number of well qualified potential students who choose to study physics at university, while among black groups, and in particular the male black Caribbean group, the objec-tive is raising educational achievement at Key Stage 3 and above.
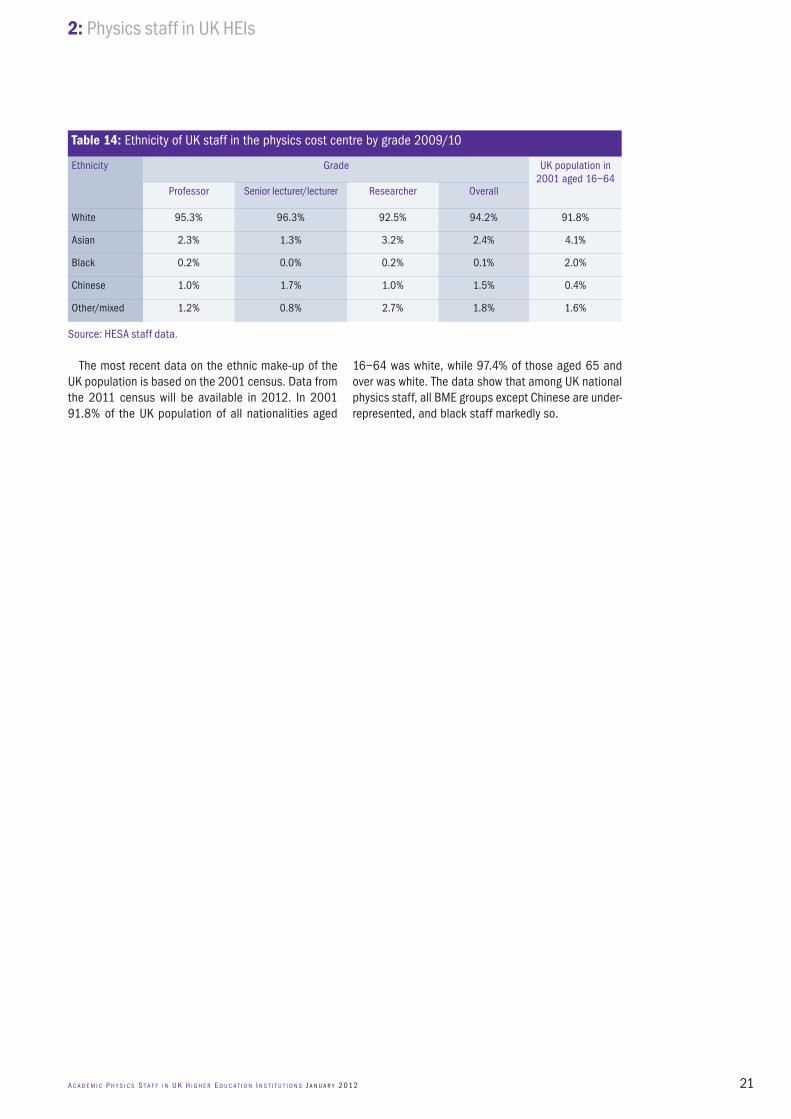
Table 14 shows a breakdown of physics staff by grade and ethnicity. Data for the ethnic breakdown of the UK population in 2001 aged 16–64 is also shown for comparison. The data show that that there are lower proportions of BME staff at professor and senior lec-turer/lecturer level than at researcher level. Part of this is likely to be because of “cohort effects”, that is, for example, the data on ethnicity of professors cannot be compared with that of researchers on the grounds that these cohorts have been drawn from different eth-nic distributions in the population, based on their age group.
6. Representation of Ethnic Groups in Chemistry and Physics, Royal Society of Chemistry and Institute of Physics, 2006 (www.iop.org/publications/iop/2006/page_38240.html).
21
2: Physics staff in UK HEIs
A c A d e m i c P h y s i c s s t A f f i n U K h i g h e R e d U c A t i o n i n s t i t U t i o n s J A n U A R y 2 01 2
The most recent data on the ethnic make-up of the UK population is based on the 2001 census. Data from the 2011 census will be available in 2012. In 2001 91.8% of the UK population of all nationalities aged
16–64 was white, while 97.4% of those aged 65 and over was white. The data show that among UK national physics staff, all BME groups except Chinese are under-represented, and black staff markedly so.
Source: HESA staff data.
Table�14: Ethnicity of UK staff in the physics cost centre by grade 2009/10
Ethnicity Grade UK population in 2001 aged 16–64
Professor Senior lecturer/lecturer Researcher Overall
White 95.3% 96.3% 92.5% 94.2% 91.8%
Asian 2.3% 1.3% 3.2% 2.4% 4.1%
Black 0.2% 0.0% 0.2% 0.1% 2.0%
Chinese 1.0% 1.7% 1.0% 1.5% 0.4%
Other/mixed 1.2% 0.8% 2.7% 1.8% 1.6%
Appendix�A: List of tables
22 A c A d e m i c P h y s i c s s t A f f i n U K h i g h e R e d U c A t i o n i n s t i t U t i o n s J A n U A R y 2 01 2
Appendix�A: List of tables
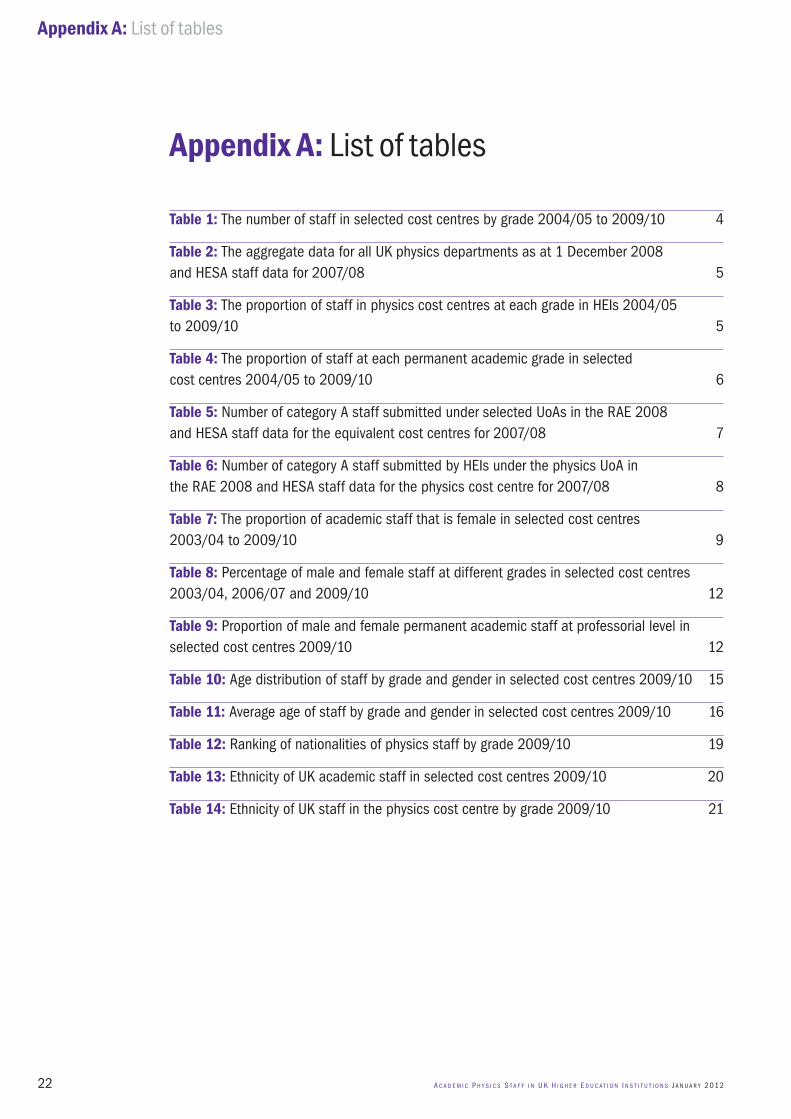
Table�1: The number of staff in selected cost centres by grade 2004/05 to 2009/10 4
Table�2: The aggregate data for all UK physics departments as at 1 December 2008 and HESA staff data for 2007/08 5
Table�3: The proportion of staff in physics cost centres at each grade in HEIs 2004/05 to 2009/10 5
Table�4: The proportion of staff at each permanent academic grade in selected cost centres 2004/05 to 2009/10 6
Table�5: Number of category A staff submitted under selected UoAs in the RAE 2008 and HESA staff data for the equivalent cost centres for 2007/08 7
Table�6: Number of category A staff submitted by HEIs under the physics UoA in the RAE 2008 and HESA staff data for the physics cost centre for 2007/08 8
Table�7: The proportion of academic staff that is female in selected cost centres 2003/04 to 2009/10 9
Table�8: Percentage of male and female staff at different grades in selected cost centres 2003/04, 2006/07 and 2009/10 12
Table�9: Proportion of male and female permanent academic staff at professorial level in selected cost centres 2009/10 12
Table�10: Age distribution of staff by grade and gender in selected cost centres 2009/10 15
Table�11: Average age of staff by grade and gender in selected cost centres 2009/10 16
Table�12: Ranking of nationalities of physics staff by grade 2009/10 19
Table�13: Ethnicity of UK academic staff in selected cost centres 2009/10 20
Table�14: Ethnicity of UK staff in the physics cost centre by grade 2009/10 21
23
Appendix�B: List of figures
A c A d e m i c P h y s i c s s t A f f i n U K h i g h e R e d U c A t i o n i n s t i t U t i o n s J A n U A R y 2 01 2
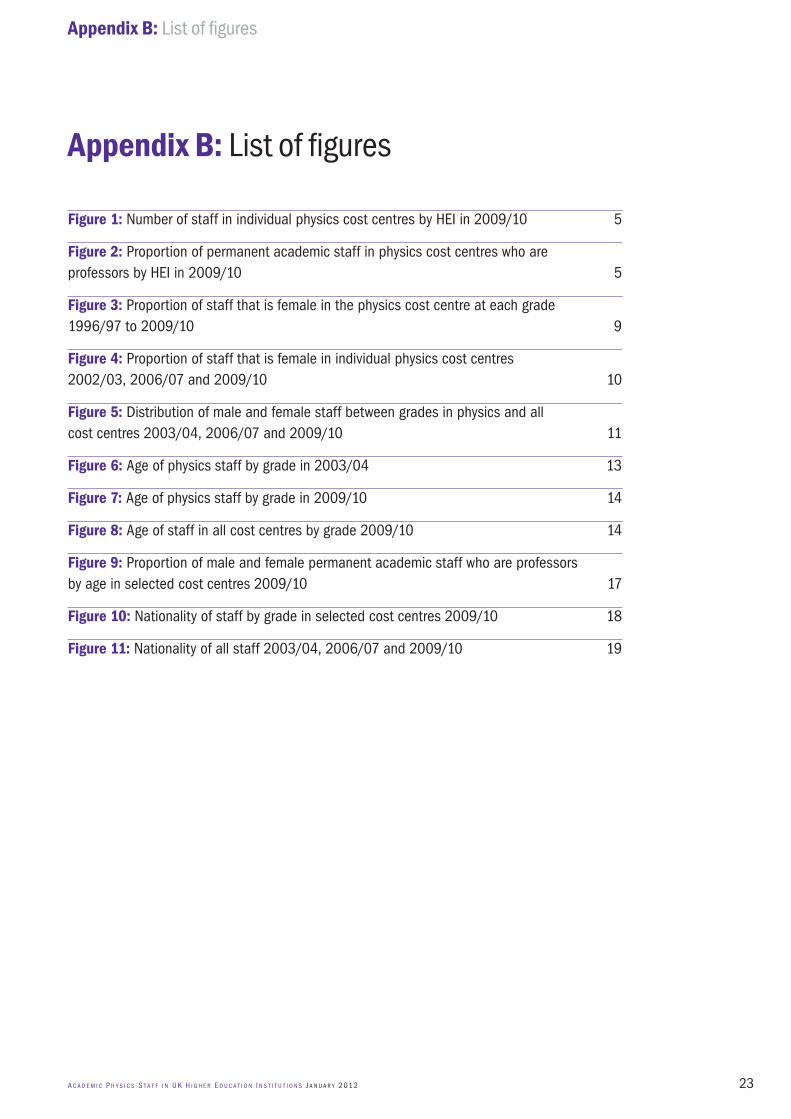
Figure�1: Number of staff in individual physics cost centres by HEI in 2009/10 5
Figure�2: Proportion of permanent academic staff in physics cost centres who are professors by HEI in 2009/10 5
Figure�3: Proportion of staff that is female in the physics cost centre at each grade 1996/97 to 2009/10 9
Figure�4: Proportion of staff that is female in individual physics cost centres 2002/03, 2006/07 and 2009/10 10
Figure�5: Distribution of male and female staff between grades in physics and all cost centres 2003/04, 2006/07 and 2009/10 11
Figure�6: Age of physics staff by grade in 2003/04 13
Figure�7: Age of physics staff by grade in 2009/10 14
Figure�8: Age of staff in all cost centres by grade 2009/10 14
Figure�9: Proportion of male and female permanent academic staff who are professors by age in selected cost centres 2009/10 17
Figure�10: Nationality of staff by grade in selected cost centres 2009/10 18
Figure�11: Nationality of all staff 2003/04, 2006/07 and 2009/10 19
Appendix�B: List of figures
For further information contact:Sophie Robinson
76 Portland Place, London W1B 1NT Tel +44 (0)20 7470 4887, Fax +44 (0)20 7470 4848E-mail [email protected]
Registered charity number: 293551Scottish charity register number: SC040092
The report is available to download from our website and if you require an alternative format please contact us to discuss your requirements.
The RNIB clear print guidelines have been considered in the production of this document. Clear print is a design approach that considers the requirements of people with visual impairments. For more information, visit www.rnib.org.uk.
Statistical Report
Academic Physics Staff in UK Higher Education InstitutionsJanuary 2012