Embed Size (px)
Citation preview

Academic Earmarks and the Returns to Lobbying
John M. de Figueiredo Massachusetts Institute of Technology, Harvard Law School, and NBER
Sloan School of Management E52-546 50 Memorial Drive
Cambridge, MA 02142-1347 [email protected]
Brian S. Silverman University of Toronto
Rotman School of Management 105 St. George Street
Toronto, Ontario M5S 3E6 CANADA
11 June 2003
ABSTRACT
In this paper, we statistically estimate the returns to lobbying by universities. We develop a simple theoretical model of university lobbying for academic earmarks to motivate our empirical work. We first show that universities that are represented by a House Appropriations Committee (HAC) or Senate Appropriations Committee (SAC) member spend more on lobbying. Next, in a later instrumental variables estimation, we find that a 10% increase in lobbying expenditures by a university without HAC or SAC representation results in a 1.5% increase in earmark funding, although this relationship is not statistically significant in many specifications. For a university with HAC or SAC representation, a 10% increase in lobbying yields an additional 2.8% or 3.5% increase in earmarks, respectively. Moreover, we cannot reject that universities are setting marginal benefit of lobbying equal to its marginal cost of lobbying on average, although those with SAC representation do appear to underinvest in lobbying. We show that these results are consistent with predictions of the Grossman-Helpman (2001) and Helpman-Persson (2001) models of lobbying.
JEL Classification: K0, H1
We would like to thank Steve Ansolabehere, Frank Baumgartner, Ernie Berndt, Peter Davis, Ig Horstmann, Paul Joskow, Gary King, Abigail Payne, Amil Petrin, Jim Rebitzer, Roberto Rigobon, Jim Savage, Jim Snyder, Jesper Sorensen, Scott Stern, and participants in seminars at Harvard, MIT, Berkeley, Carnegie Mellon, Chicago, George Mason, Northwestern, Toronto, Washington University, USC, Caltech, Cornell and the NBER for very helpful discussion and comments.
1
Academic Earmarks and the Returns to Lobbying
John M. de Figueiredo and Brian S. Silverman 11 June 2003
There are two primary ways in which special interests attempt to influence policy:
campaign finance contributions and informational lobbying. Political action committee (PAC)
contributions receive the overwhelming majority of attention from scholars (i.e. Randall
Kroszner and Thomas Strattman 1999, James Snyder 1990). Yet, lobbying expenditures in the
United States, nearing $2 billion per year, total more than three times the campaign contributions
given by PACs (Timothy Groseclose et al 2000). Many voters view lobbying with suspicion, and
the popular press frequently cites it as prima facie evidence of the power of “pressure groups,
each promoting its own special interests, [to] prevent elected politicians from adopting policies
that are in the interest of the electorate as a whole” (Economist 1999). Yet remarkably little is
known about the economic returns obtained by organizations that lobby. Despite 65 years of
theoretical and empirical investigation, and a steadily increasing interest by the press and
electorate, there are no large-scale statistical studies of the returns to lobbying (Frank
Baumgartner and Beth Leech 1998, Richard Smith 1995).
The dearth of statistical studies of lobbying is largely due to four challenges in data
collection and measurement. First, it is difficult to measure lobbying expenditures. Second, many
government policies lack identifiable pecuniary returns, thus making it difficult to measure the
monetary value of policy outcomes that have been influenced by lobbying. Third, organizations
typically employ multiple instruments to exert political influence, including lobbying, PAC
contributions, and grassroots organization, creating statistical challenges to estimating the returns
to lobbying. Finally, it is difficult to control for the intrinsic quality differences among
competing lobbying interests.
In this paper, we overcome these challenges by studying the returns to lobbying in a
particularly conducive context: efforts by universities to obtain “earmark” grants. Earmarks,
which are non-competitive grants written into appropriations bills by legislators, allocate money
directly to projects at specific universities and colleges, thus bypassing the competitive peer-
review process (Amy Finkelstein, 1995). This context enables us to overcome the empirical
challenges described above. First, the Lobbying Disclosure Act of 1995 allows us to measure

2
university lobbying expenditures, and techniques described below allow us to ascribe lobbying
expenditures to the pursuit of earmark grants with reasonable certainty. Second, earmarks are
specified in dollar terms and targeted to particular, identifiable educational institutions,
overcoming problems of measurement of the dependent variable. Third, universities seeking to
influence legislators have few options besides lobbying, because most universities, as non-profit
institutions, are legally prohibited from using PAC contributions or grassroots political
organization to convey their preferences to legislators. Finally, we are able to control for quality
differences in interest groups with different systems of departmental rankings of universities.
In our statistical analysis, we estimate the elasticities of lobbying to earmarks. We find
that a 1% increase in lobbying expenditures by a university without representation on the House
Appropriations Committee (HAC) or Senate Appropriations Committee (SAC) results in a
0.15% increase in earmarks, but in many specifications the point estimates are not statistically
different from zero. However, if the university is represented by a member of the HAC or SAC,
then this 1% increase in lobbying yields an additional 0.28% or 0.35% increase in earmarks,
respectively. These latter elasticities are statistically different from zero. We then use these
elasticities to calculate the marginal benefit of lobbying for an average lobbying university. We
cannot reject the hypothesis that, on the margin, a $1.00 increase in lobbying results in a $1.00
increase in earmarks for those universities unrepresented on either Appropriations Committee, or
those universities with HAC representation. However, we find that those universities with SAC
representation invest in lobbying below the efficient levels.
These findings are of interest not only because they provide insight into the private
returns to lobbying, but also because they shed empirical light on predictions from recent
theories of informational lobbying and campaign contributions (also known as “resource
transfers”).1 The informational lobbying literature has traditionally focused on solving the
problem of making a lobbyist’s private information credible to a policymaker (e.g., Randall
Calvert 1985, Suzanne Lohmann 1993). These models do not emphasize the returns obtained by
interest groups. Nevertheless, one clear prediction from this literature, and the endogenous cost
lobbying literature in particular, is that in a world with costly lobbying effort, groups whose
1 Morten Bennedsen & Sven E. Feldman (2002) categorize economic models of interest group influence into two sets: those in which an interest group attempts to influence a policymaker by providing her with resources, in the form of campaign contributions (Grossman & Helpman 1994) or bribes (Timothy Besley & Stephen Coate 2001);
3
interests are closely aligned with those of policymakers will earn higher returns than those whose
interests are more divergent (Austen-Smith 1995; Grossman & Helpman 2001: 161-170). This
occurs because, when interest groups must incur costly lobbying to signal the credibility of their
information, a group will need to incur greater lobbying costs the more divergent its interests are
from those of the policymaker. In the U.S. Congress, members of the House and Senate
Appropriations Committee control the earmarking process (James D. Savage 1999);
consequently, universities in these members' districts are more likely have interests aligned with
the relevant legislators, and therefore should receive a higher return to their lobbying efforts than
should universities in other districts.
Similarly, the resource transfer literature predicts that interest groups aligned with key
agenda-setters in the legislature will earn higher returns on their campaign contributions than
will interest groups aligned with less central legislators (Helpman & Persson 2001).2 This occurs
because competition among legislators to be part of the winning coalition – and thus gain some
benefits for their constituents – will drive policy to the agenda-setter’s ideal point, while the
absence of competition among interest groups within the agenda-setter’s district leads the
agenda-setter to adopt the group’s ideal point as her own for a small amount of contributions.3
This implies that interest groups that are represented by members of committees relevant to their
interests (agenda-setters) will obtain greater rents to their lobbying efforts than those that are not.
Thus, whether we interpret lobbying as informational (as in Grossman & Helpman 2001), or as a
resource transfer (as in Helpman & Persson 2001), universities from the districts of House or
Senate Appropriations Committee members are predicted to have a higher return to their
lobbying efforts than those universities from elsewhere.
Our main result, that universities that are represented by HAC or SAC members earn
higher returns on their lobbying efforts than unrepresented universities, is consistent with
and those in which an interest group attempts to influence a policymaker by providing her with relevant information (Lohmann 1995; Grossman & Helpman 2001). 2 Although the lobbying in our empirical work is informational, one may interpret this as a form of resource transfer. In the menu-auction literature on resource transfers from interest groups to politicians, a legislator values financial resources provided by special interests because these resources enable the legislator to enhance her re-election chances (Grossman and Helpman 1994). To the extent that the information provided by an interest group helps a legislator to know what policy will enhance her re-election chances, the legislator may value this information in much the same way she values financial resources. 3 Helpman & Persson (2001) propose a multiple legislator, majoritarian decision-making model where there is a one-to-one mapping between interest groups and legislators (e.g. there is a single interest group in each legislator’s

4
Grossman & Helpman’s (2001) prediction about the rents that accrue to groups whose interests
are aligned with key policymakers, and with Helpman & Persson’s (2001) predictions about the
rents that accrue to interest groups affiliated with agenda-setters. This paper thus contributes to
the empirical research testing recent theoretical predictions of political activity (Pinelopi
Goldberg and Giovanni Maggi 1999; Kishore Gawande and Usree Bandyopadhyay 2000).4
We also find that, after controlling for lobbying, House and Senate Appropriations
Committee members send a disproportionate share of academic earmarks to their constituent
universities. Contrary to those who claim there is no relationship between federal spending and
committee membership (Kenneth R. Mayer 1991, Bruce A. Ray 1980), our study provides
evidence to support the claim that committee members direct federal spending toward their
districts. However, as we show in Section V, the amount of money these legislators send to their
districts is less than would otherwise be predicted in the absence of lobbying.
We structure the paper as follows. In the next section we offer some background on
educational earmarks and lobbying. In Section II we discuss the empirical challenges in
measuring the returns to lobbying. Section III provides a simple theoretical model. In Section IV
we explain the data and provide descriptive statistics. In Section V, we provide results and
robustness checks. Section VI offers extensions, examining the efficiency of lobbying. We
conclude in Section VII.
I. BACKGROUND ON EDUCATIONAL EARMARKS AND LOBBYING
As Claudia Goldin and Lawrence F. Katz (1999) note, American institutions of higher
education emphasized learning rather than research until late in the 19th century. However, as the
scientific needs of industry increased, so did the demand for academic research in the applied
sciences. Thus the modern research-oriented university became widely established by World
War I, with research funded primarily by states and secondarily by local industry (Nathan
Rosenberg and Richard R. Nelson 1994). Although the federal government funded roughly 25
district.) As we note below, university lobbying patterns generally conform to a world in which a single interest group lobbies a given legislator. 4 Goldberg & Maggi (1999) and Gawande & Bandyopadhyay (2000) find empirical support for other predictions from the Grossman & Helpman (1994) menu-auction theory. However, they do not study the question of returns. Goldberg & Maggi (1999) find that legislators care far more about social welfare than about contributions, which suggests that informational lobbying about welfare-enhancing policy may be a more fruitful area for research than PAC contributions.
5
percent of academic research by the 1920s, this was largely in the form of agricultural research
grants that correlated grant size to the state’s agricultural output (Savage 1999).
The exigencies of war led to a sea change in the mechanisms for federal funding of
academic research. Largely due to the advocacy of Vanevar Bush, the practice of awarding
federal research funds to individual scientists via competitive project-based grants became
institutionalized by 1950. Under this system, the awarding of funds was managed by the newly-
created National Science Foundation and several other federal agencies, and awards were made
primarily on the basis of peer review of project proposals. By 2001, federal funding of academic
research through competitive grants exceeded $15 billion. Numerous scholars of technology
policy have argued that this system has ensured that money is allocated toward the most
promising research projects, and thus underpins the enduring success of academic research in the
United States (e.g., Nelson and Rosenberg 1993).
Yet the competitive grant process has had its share of critics as well. A number of
prominent academicians and legislators have argued that peer review serves to concentrate
research funding in a few elite schools whose scientists populate the peer review boards (William
H. Gray 1994, John Silber 1987). These critics have further argued that peer review tends to
reward “safe” research projects, thus starving truly breakthrough research (Silber 1987).
According to this view, the earmarking of federal funds through the legislative process offers a
potential counterbalance to the perceived defects of the competitive grant process.
The birth of academic earmarks can be traced to the late 1970s, when Jean Meyer,
President of Tufts University, engaged two lobbyists – Kenneth Schlossberg and Gerald Cassidy
– to help secure funding for a nutrition and aging center. Over the next two decades Schlossberg
and Cassidy, as well as several imitators, pursued educational institutions as clients, holding out
the promise of obtaining academic earmarks such as that won by Tufts (Savage 1999). The
amount of money allocated through academic earmarks rose from less than $17 million in 1980
($32 million in constant 2001 dollars) to nearly $1.7 billion in 2001, a 100-fold increase in
nominal terms (52-fold increase in real terms). By 2001 academic earmarks represented nearly
10 percent of total federal funding of academic research (see Figures 1a and 1b).
***********INSERT FIGURE 1a and 1b ABOUT HERE **********

6
The rise of specialist lobbying firms to secure earmarks also routinized the earmark
“production schedule.” The “life cycle” of lobbying and obtaining an earmark is as follows.5 In
January, a university’s administrators meet with its lobbyist to formulate their lobbying strategy
for the upcoming fiscal year. This entails prioritizing potential earmark requests by the likelihood
of success, and identifying elected officials to lobby. In most cases, the lobbyist will approach
the Representative and/or Senator from the university’s district. Beginning in March and April,
the university begins lobbying the targeted representatives to have its request included in the
appropriations legislation. After the August recess, there is a large push to have the request
included in one of the 13 appropriations bills. The cycle ends in November or December, as the
appropriations bills are sent to the President, and in January the process begins again. According
to our interviewees, requests from one year do not carry forward to the next year. This is mainly
because the appropriations process, unlike the budget process, is not a multiyear process.
II. CHALLENGES IN MEASURING THE RETURNS TO LOBBYING
As noted in the introduction, estimating the returns to lobbying poses a number of
challenges. First, it is difficult to measure the monetary value of lobbying expenditures. Until
recently, systematic data on lobbying expenditures did not exist. Consequently, nearly every
published statistical study has relied on proxy measures, survey data, or dummy variable
measures for lobbying, rather than direct measures of lobbying expenditures.
Recent legislation passed by Congress has created lobbying expenditure disclosure
requirements that help us to overcome this measurement problem. The Lobbying Disclosure Act
of 1995 mandates that any individual who spends more than 20 percent of his or her time
lobbying administrative agencies, Congress, or the Executive, must file a report disclosing the
amount of money expended on this activity. Each organization that spends more than $20,000 on
such lobbying in a given year also must file a report disclosing the name of the lobbyist, the
clients of the lobbyist, and the amount of money spent on lobbying by the client (to the nearest
$20,000).6 One complication that arises, however, is that firms and interest groups typically
5 According to interviews with staffers on the appropriations committees and lobbyists. 6 This report encompasses all expenses related to lobbying, including the cost of cultivating lobbying contacts and background work that is intended for use in contacts and coordination with the lobbying activities of others (Office of the Clerk of the House, 2001). This includes salaries and benefits, overhead, expenses, and third-party billings.

7
lobby across a range of issues. Even when a firm’s aggregate lobbying expenditure is known, it
is difficult to identify how this expenditure is allocated across different issues.
We overcome this by examining academic earmark funding. Nearly all of university
lobbying is directed at two objectives: earmark funding and science policy, and the vast majority
is directed at the former objective.7 The first legislative item for which top- and lower-tier
universities lobby is earmark funding. A small number of top-tier universities and umbrella
groups also lobby for a second item – increased budgets for competitive grant funding agencies
such as the National Institutes of Health, rules governing human subjects, etc which we call
science policy. These organizations include the top 50-100 research universities, and
associations such as the American Association of Universities (AAU) and the Science Coalition.
The remaining 6,400 post-secondary institutions generally do not.
Since the vast majority of universities’ lobbying, and virtually 100 percent of lobbying by
universities that are not among the top 50-100 research institutions, is devoted to the pursuit of
earmarks, concerns about allocating lobbying expenditures across multiple policy objectives are
ameliorated. In econometric specification tests, we exploit the single-mindedness of non-top-tier
universities’ lobbying to control for universities that lobby for science policy.
Second, it is difficult to measure the monetary value of policy outcomes that have been
influenced by lobbying. Many policies that governments legislate – such as saving the forests,
mitigating lawsuits, or eliminating a disclosure rule – lack identifiable pecuniary returns.
Moreover, these benefits are often distributed among many groups. This makes the precise
allocation of benefits to individual groups or companies difficult. These two problems together
have made it nearly impossible to measure the economic returns to lobbying efforts.
We overcome this challenge by studying an easily measurable benefit. Earmark grants
specify the university that is to receive funding, the amount of the funding, and the purpose of
the funding.8 The dollar value of these earmarks is identifiable, measurable, and easily allocated
to a specific institution, consequently overcoming the measurement challenges noted above.
A third challenge is to disentangle lobbying’s impact from that of other mechanisms of
political influence, such as PAC contributions and grassroots organizing. It would be incorrect
to attribute policy outcomes to lobbying alone when other mechanisms are available. Further,
7 We have conducted interviews with lobbyists and they confirm this viewpoint.
8
because interest groups should be simultaneously optimizing across all tools at their disposal,
one cannot simply include PAC contributions and grassroots organization as variables on the
right-hand side of the equation, but rather must employ instruments that are correlated with these
tools yet uncorrelated with lobbying. Instruments that satisfy this condition are often elusive.
However, as non-profit institutions, universities are not permitted to create and fund
political action committees, and thus give no money in PAC contributions or “soft money” to
political candidates or political parties.9 In addition, universities are not allowed to engage in
grassroots organization of its members for political purposes. Lobbying is clearly the dominant,
and in most cases the only, avenue for universities pursuing earmarks.
A fourth and final challenge relates to variance in the quality of the groups that lobby.
Suppose, for example, that IBM lobbies for legislation regarding disk drive construction. Seagate
also lobbies, but for a different legislative outcome. IBM’s preferred policy is passed by
Congress. It is not clear to the researcher whether this results from IBM’s lobbying effort, or
from its superior technology in disk drives. If one is to measure the returns to lobbying, then one
must control for the optimality of the policy, relative to the alternatives. Yet it is difficult to
determine if IBM is the best disk-drive maker, and it is likely even more difficult to determine a
ranking of all disk drive makers in the industry. This challenge, however, is easily surmounted in
a study of universities. Using ranking data by independent sources, such as the National
Academy of Science, we can control for quality of university by department.
III. A SIMPLE MODEL
The production function for earmarks is characterized by the following equation:
βγiii LZy = (EQ. 1)
where yi is the value of the earmarks received by university i, Zi is a set of observable and
unobservable characteristics of university i and its representation, and Li is the amount of money
university i spends on lobbying. Taking logs, this simplifies to:
8 For example, “$10,000,000 for the construction and equipping a new space dynamics lab, Utah State University….” (Savage 1999: 8) 9 Universities could form non-affiliated PACs, but this is very costly, and its incidence is rare.
9
iii LZy lnlnln βγ += (EQ. 2)
Note that Li is an endogenous choice variable by the university. If so, then estimation of Eq. 2
suffers from omitted variable bias because Li is correlated with the omitted elements of Zi.10
There are two non-exclusive ways in which one can deal with this problem, depending
upon the nature of the omitted variable bias. First, simultaneity bias may be caused by a cross-
university correlation between the amount of lobbying and the productivity of lobbying, e.g.
universities that are more likely to get earmarks through lobbying are also more likely to lobby.
Let us assume this correlation takes the form of a time-invariant university-specific source of
productivity differences. In this special case, a fixed effects or random effects estimator can be
used to generate consistent estimates (Yazir Mundlak 1963). The equation to be estimated is
then:
iiiii tLZy εϑβγ ++++= lnlnln (EQ. 3)
where iϑ is the university fixed (or random) effect, t is a time fixed effect, and iε is the error
term. Below, we estimate Eq 3.
Alternatively, assume that there is a time-variant aspect to a university’s productivity or
willingness to lobby. Moreover, assume that there may be measurement error in the lobbying
expenditures. In this case, instrumental variables estimation provides a second method for
identifying the effects of lobbying on earmarks.
To accomplish this, we must find an instrument that is correlated with Li but uncorrelated
with the omitted elements of Zi that are found in the estimated error term. To derive such an
instrument, we examine the utility function of university i. We assume that university i attempts
to maximize its utility which is characterized by:
}max{ iii Lyp − (EQ. 4)
10 This is analogous to a production function that is made up of capital and labor, where the amount of labor chosen is endogenous.
10
where pi represents the shadow value of the earmarks to university i. Substituting Eq 1 into Eq 4,
and solving for the first order condition by setting marginal benefit equal to marginal cost, which
is assumed to be 1, we obtain:
i
iii L
pyLpZ
ββ βγ =−1 (EQ. 5)
which simplifies into:
βγβ −= 11
* )( iii ZpL (EQ. 6)
where *
iL is the optimal level of lobbying for the university. This suggests that pi is a valid
instrument for Li because it is correlated with Li but unlikely to be correlated with the estimated
error in Eq 3. However, because pi is unobservable, we must use instruments that are correlated
with pi. We use the university’s overhead rate.
All federal research grants to universities have indirect costs (commonly known as
overhead) that are attached to the grant. Overhead rates, negotiated with government contracting
authorities, are designed to pay for operating costs and infrastructure of the university for
research, and act as discretionary income to university. Two characteristics of this variable make
it an attractive instrument. First, because overhead is usually attached to earmarks, the higher the
overhead rates, the higher the incentive of an organization to seek an earmark. Second, the higher
the overhead rate, the more money the university has to engage in lobbying activities, and the
more likely it is to engage in lobbying.11 The instrument is likely to be positively correlated with
lobbying, yet it is unlikely to be directly correlated with earmarks, because politicians are
unlikely to know or care about the overhead rates for each post-secondary institution in the
district. Thus, in the instrumental variables estimation, we estimate Eq 3 using overhead rates as
the instrument for lobbying expenditures.
11 Kevin B. Grier et al. (1994) show that companies tend to give more PAC contributions to politicians the higher are their profits and sales. We use a similar logic here with lobbying.
11
IV. DATA AND DESCRIPTIVE STATISTICS
A. DATA The dependent variable is the amount of money Congress earmarks to a given academic
institution (taken in logs).12 We eliminate the value of the earmark attributable to the overhead in
all estimated models.13 A full description of all the variables can be found in the Appendix in
Table A1.
The primary right-hand-side variable of interest is the amount of money an academic
institution of higher learning spends on lobbying (taken in logs). We have obtained the 1997-
1999 data from disclosures made by institutions in compliance with the Lobbying Disclosure Act
of 1995, as described in Section II.
The third set of data employed is a set of characteristics for each university’s
Congressperson and Senator in each year from 1997 to 1999. We obtain this by mapping each
institution into its congressional district based on nine-digit zip codes. Then, we include the
Representative’s ADA score, the two Senators’ mean ADA score, dummy variables for
appropriations committee assignments, and dummy variables for chairmen and ranking
members. We also match the legislators with their alma maters, to test for any effect on the
outcomes of earmarking (A. Abigail Payne and Aloysius Siow 2003).
A fourth set of data is a set of characteristics for each university’s district. We include
data on population density, age, education, employment, and income of individuals in the
district. These data come from the Bureau of the Census, which maps the results of the Census
into congressional districts. In employing these data, we study whether Congress targets earmark
grants to universities in districts with specific characteristics.
We also include a set of characteristics for each university. To control for university
quality, we employ the National Academy of Science (NAS) university rankings. Every 10 years,
the NAS ranks 41 different departments at all research universities on their research quality.
Each department is given an ordinal ranking relative to all other schools.14 For all other
12 Some earmarks are shared among more than one university. We allocate the earmark to the universities in an equal proportion. For the handful of shared earmarks for which we cannot identify all the institutions which share, we assume that there are 2.5 institutions sharing the earmark and allocate 2/5 of the earmark to the institution. 13 If we are to use overhead rates as the instrument of interest in the two-stage model, we must not allow the overhead portion of the earmark to appear in the second-stage dependent variable. 14 We use an ordinal ranking system for the university. The results are robust to a variety of different ranking systems, including the use a departmental ranking system.

12
university characteristics, we employ the Integrated Postsecondary Education Data System
(IPEDS). Each year, the Department of Education certifies post-secondary institutions that are
eligible for Title IV (subsidized federal financial aid) funds. We control for whether an
institution is public, has a medical school, has a Ph.D. program, or has athletic aid scholarships.
We also control for student enrollment. We use as the sample frame for our study all 2,382
domestic, non-profit, Carnegie Foundation recognized institutions for which there is complete
IPEDS data.15
For our instrument, we obtained each university’s overhead rate from the Division of
Cost Allocation of the Office of Grants Management of the Department of Health of Human
Services (HHS).16 Universities usually sign global agreements to cover research funded by the
federal government for a specified overhead rate for a given year. HHS collects all of these
indirect cost contracts in the only comprehensive, centralized database of overhead rates of
which we are aware. We obtained the contracts from HHS and have taken the relevant overhead
rate in April of the year of interest. Table A2 in the Appendix shows that overhead rates range
from 8 percent to 85 percent, with 22 percent as a mean.
Finally, we use state financial health variables for our first-stage regressions. It is
possible that public universities seek assistance from the federal government when their state
governments are financially constrained. If so, then as the financial health of the state becomes
worse, these schools will increase federal lobbying. We use as a summary statistic of a state’s
financial health Moody’s Bond ratings for general obligation debt in the state.
Table A2 presents descriptive statistics of our university-year observations. We bifurcate
the table into all universities (n=7,146), and only those that lobby (n=423). The average annual
earmark amount for all institutions is $230,290 with a maximum of $44.5 million for Loma
Linda University. Annual lobbying expenditures for this group average $7,442, ranging from no
lobbying to $760,000 by Boston University. For the sub-sample that lobby, the average earmark
is $1.92 million and the average lobbying expenditure $125,726. These unconditional means lead
many commentators to note that interest groups receive a lot for little lobbying effort.
15 IPEDS includes more than 6,400 post-secondary institutions that qualify under Title IV. Many of these are vocational schools, such as Bjorn’s Hairstyling Academy in Vallejo, CA, that are unlikely to be “at risk” for receiving earmarks. We eliminate such institutions by excluding those not covered by the Carnegie Foundation. 16 Special thanks to Charles Seed and Otto Kent for assistance with the data. In most cases, we use the on-campus research rate for the main campus. For universities without such a rate, we used the closest category available.

13
B. LOBBYING AND EARMARKS
We begin by exploring the relationship between committee structure, lobbying and
earmarks. Figure 2 presents a graph of earmarks on lobbying for all years, all institutions, with
the representation of the institution indicated. If the institution is represented by a House
Appropriations Committee member, the point receives an H; a Senate Appropriations Committee
member, an S; both a House and Senate Appropriations Committee member, an HS; and no
appropriations committee members, an O. A review of the figure shows that both earmarks and
lobbying are distributed across a range, with a large concentration at smaller amounts. Those
institutions that are high on the earmark-scale tend to have Senate and/or House appropriations
committee membership. Those institutions that are low on the earmark scale (even if high on the
lobbying scale) tend to be represented by non-appropriations committees members. This is
suggestive of the importance of appropriations committee representation.
***********INSERT FIGURE 2 HERE **********
Table 1 shows the average lobbying expenditure and average earmark per university in
the 1997-1999 time period by appropriations committee membership. The table shows the
statistics for all universities, and also for the “lobbier” (lobbying expenditures > 0) sub-sample.
In the full sample, the results show that the average university with no representation on the SAC
spent $9,430 lobbying, and received an earmark of $144,693. The unconditional average return
was over $15 for every $1 spent on lobbying. However, universities with representation on the
SAC lobbied about 40 percent less than their non-represented counterparts, yet received just over
two times the earmark, for an unconditional return on investment of almost $56 for every $1
spent on lobbying. A similar pattern can be found in the House. The return for universities
without representation on the HAC is just over $25 for every dollar spent in lobbying. Their
counterparts who happen to be in districts where the representative is on the Appropriations
Committee, lobby almost the same, on average, and receive an earmark of almost $320,000
more, for a return of $66 for each dollars in earmark for every dollar spent on lobbying.
***********INSERT TABLE 1 ABOUT HERE **********

14
When we limit our analysis to institutions that actually lobby, the relative results are
roughly the same. A lobbying university with SAC representation receives, on average, three
times the return of a university that is not represented by a SAC member. In the lower chamber,
lobbiers with HAC representation also receive three times the amount of earmarks, on average,
than that of lobbying universities without HAC representation. This evidence is consistent with
the hypothesis that committee membership is crucial in determining who receives federal
educational earmarks.17
We also find that less than 6% of House districts witness lobbying by multiple
universities. Thus, the data we provide conform to a setting where, in equilibrium, we have a
single interest group lobbying a legislator. While this section provides evidence that supports a
committee power story, and that universities may change their lobbying in response to
representation in Congress on the appropriations committees, it is difficult to determine a causal
relationship from this data alone. In order to do this, we conduct a statistical analysis.
V. ESTIMATION
A. FIRST STAGE RESULTS
The question of which universities lobby is an interesting question in its own right.
Therefore, we discuss the first stage estimates. We begin by estimating the first stage ordinary
least squares (OLS) model where Ln(Lobby) is the dependent variable. The results are provided
in Table 2. Model 1 presents the OLS model, while Model 2 presents the same estimation with
random effects to control for unobserved institutional effects.18 All clustered or robust standard
errors are presented below the coefficient estimates, with the statistical significance noted for
two-tailed t-tests. Except as otherwise noted, we discuss here the results of Model 2.
***********INSERT TABLE 2 ABOUT HERE **********
17 While we would like to look at switchers on and off the HAC and SAC, there are too few to permit statistical analysis. 18 We present here only the results of the first stage estimation on Ln(Lobby). There are similar first stage regressions for the interactive lobbying variables as well. We do not use fixed effects because there are only three years of data per university.
15
The key instrument that is predicted to be correlated with lobbying but uncorrelated with
the error term in Eq 3, εi, is the overhead rate. Note that the coefficient on Ln(Overhead Rate) is
positive as expected, and measured with statistical precision at the 99% level of confidence. A
10% increase in the overhead rate (which has a mean of 22%) results in a 3.4% increase in
lobbying. Said differently, moving the overhead rate from 22% to 24.2% results in 3.4% more
lobbying. The F-statistic and R-squared in Model 1 are 10.93 and .30, respectively, suggesting
that there is a reasonable fit of the first stage model for second stage estimation. [NB:
REVIEWERS: We have included the remaining first stage results for the interactive variables in
the REVIEWER ONLY APPENDIX.]
Universities with representation on the HAC and SAC lobby at higher levels than those
without representation on these committees. HAC representation increases university lobbying
by 112%, while SAC representation increases university lobbying by about 48%. Other political
factors also affect lobbying. Having alumni on the HAC, alumni on the SAC, or alumni in the
Senate increases lobbying 137%, 100% and 69%, respectively.
Representation is not the only factor that drives universities to lobby. Large universities,
top ranked schools, schools that offer Ph.D. programs, and universities with medical schools are
all more likely to lobby.19 Some of the variables have a large impact on lobbying. For example,
universities with Ph.D. programs and with medical schools spend 248% and 1,330% more on
lobbying, respectively, than universities without these programs. We use these first stage results
in some of the specifications in the next section to understand the returns to lobbying.
B. SECOND STAGE RESULTS
We now turn our efforts to estimating the production function for earmarks as shown in
Eq 3. We present our results in Table 3. Models 3-6 are the OLS estimations of the model, while
Models 7-8 use the first-stage results from the previous section in an instrumental variables
estimation of the model. Again, the clustered or robust standard errors appear below the
coefficient estimates, and the statistical significance is noted at the 99%, 95% and 90% levels.
19 One reason for this may be that these top ranked schools may lobby for items other than earmarks. We address this in our robustness checks later in the paper. We also find a somewhat weak relationship between the state bond rating and the lobbying behavior of public universities (in our interactive term).
16
***********INSERT TABLE 3 ABOUT HERE **********
We begin with Model 3. This replicates the standard models that consider only the supply
side of earmarks—the committee memberships of the university’s representative. We find that
HAC representation increases the amount of earmarks by 41%, while SAC representation
increases the amount of earmarks by 34%. This effect of committee representation is similar to
what other researchers have found (Payne 2003, Savage 1999, Steven J. Balla et al 2002).
Model 4 considers that universities may influence what legislators do by adding the
lobbying variable to the conventional approach. Our results indicate that a 10% increase in
lobbying results in a 2.2% increase in earmarks. The direct effects for representation by HAC or
SAC members retain their size and significance in this model.
In Model 5, we suggest a more complex view of lobbying, in which the amount of
earmark a university obtains is determined by both the university’s lobby effort and the
alignment of an interest group with a representative who can easily write the earmark into
legislation (as conveyed by her committee memberships). We interact lobbying expenditures
with the HAC and SAC variables. In this model, the direct effect of lobbying drops by about
20% compared to Model 4, and the direct effects of HAC and SAC representation drop slightly.
Meanwhile the coefficient Ln(Lobby)*HAC is positive although not statistically significant, and
the coefficient on Ln(Lobby)*SAC is positive and statistically significant. This conforms broadly
to the idea that lobbying is more effective if the representative can easily deliver on policy
requests.
If lobbying is exogenously determined, this would be a reasonable model. However, as
noted in the theoretical model, lobbying effort is an endogenous cost that the university chooses
(Grossman & Helpman 2001). Section III notes two methods to solve this problem, depending on
the assumptions about the nature of the omitted variable bias. If we assume that the source of
greater lobbying productivity is time-invariant, then a consistent estimate of β and γ are
generated from a fixed- or random- effects model of Eq. 3.
Model 6 provides results of an OLS model with random effects. We find that all lobbying
and committee variables have positive and statistically significant coefficients. If a university has
no representation on the HAC or SAC, a 10% increase in lobbying results in a 1.8% increase in
earmarks. If a university does have representation on the HAC or SAC, that same 10% increase
17
in lobbying results in a further 0.5% or 0.3% increase in earmarks, respectively. In addition,
there are direct effects to having HAC and SAC representation. HAC (SAC) representation
results in a 31% (51%) increase in earmarks in the absence of lobbying. In this specification,
universities that are public, have medical schools or Ph.D. programs, or athletic aid receive more
earmark funding. Some of these effects are large. For example, public universities receive 43%
more earmark funding and universities with medical schools receive 420% more earmark
funding than institutions without these characteristics. In addition, consistent with Payne (2003),
we find that universities with alumni on the SAC receive more earmark funding.
Although the previous model generates consistent estimates if there is a time-invariant
form of institution-specific lobbying productivity, in Models 7 and 8 we relax that restriction and
allow for measurement error or for time-variant forms of endogeneity. In Model 7, we estimate
the production function for earmarks using the instruments from first stage results from the
previous section. In Model 8, we use both instrumental variables and random effects estimation.
Because the coefficient estimates for Model 7 and Model 8 are similar, we discuss the results for
Model 8 here.
The coefficient on the direct effect of lobbying drops slightly compared to Model 6; a
10% increase in lobbying now results in a 1.5% increase in academic earmarks. Although the
coefficient is roughly the same as other models, it is no longer statistically significant in either
IV specification. However, the lobbying interactive variables are much larger in magnitude and
statistically significant in the random effects IV model. A 10% increase in lobbying by a
university with HAC (SAC) representation generates an additional 2.8% (3.5%) increase in
earmarks. Thus, universities that lobby and have representation gain additional earmarks.
However, universities that lobby but do not have representation may receive earmarks for their
efforts, but the statistical significance of this effect is not different from zero. The direct effect
of HAC is statistically significant at the 90% level, and the direct effect of SAC is statistically
significant at the 99% level. HAC (SAC) representation increases the average earmark by 16%
(19%), meaning that HAC and SAC representation result in money being sent to the university in
the absence of lobbying. Moreover, these results suggest that without controlling for lobbying
(e.g. Model 3), researchers may overestimate the direct effects of HAC and SAC membership.
Top schools show no systematic difference in their ability to obtain earmarks relative to
lower-ranked schools. As in previous specifications, universities that are public, have medical
18
schools, have Ph.D. programs, or offer athletic aid receive larger academic earmarks. The
estimates indicate that public universities receive earmarks that are on average 47% more than
private universities, universities that offer athletic aid receive earmarks that are 27% larger than
those that do not, universities with medical schools receive earmarks that are 227% larger on
average than those without, and universities with doctoral programs receive earmarks that are
131% larger than those without these same programs.
Although the statistical analysis to this point has been framed in elasticities, we can put
more concrete numbers on the analysis. We do this by examining asking how a change in
lobbying expenditures from the average level of lobbying affects the average level of earmarks
for these lobbying universities. Based on the coefficients in Model 8, the marginal return
attributable to one dollar of lobbying is $1.56 without representation on the HAC or SAC. When
there is representation on HAC, the marginal return attributable to one dollar of lobbying is
$4.52; with representation on the SAC, the marginal return attributable to one dollar of lobbying
is $5.24.20 These point estimates suggest that universities are, on average, leaving money on the
table. However, when we establish a 95% confidence interval around the point estimates, we
cannot reject the hypothesis that universities without representation have a marginal return of
$1.00. Likewise, we cannot reject the hypothesis that universities with HAC representation are
receiving a marginal benefit equal to $1.00. However, we can reject the hypothesis that
universities with SAC representation are receiving a marginal benefit of $1.00. In fact, the lower
bound of the 95% confidence interval suggests they receive a marginal benefit of approximately
$2.00, meaning that this subset of universities is lobbying less than is optimal. We revisit the
optimality condition in the next section.
C. ROBUSTNESS In order to examine the robustness of these results we conducted a number of
specification checks. The first question is whether the overhead rate is a good instrument.
Section III demonstrated the theoretical justification for this instrument, but we wish to test this
empirically as well. We conduct a Hausman specification test for instrumental variables and find
20 This is calculated by adding the effect of the lobbying with the HAC or SAC interactive lobbying effect. The magnitude of $1.00 spent on lobbying adds $2.96 and $3.68 through the HAC and SAC interactive variables, respectively, to the direct lobbying effect of $1.56.
19
that the instrumental variables provide significantly better coefficient estimates than the non-
intrumented specification.
Our second concern centers on measurement error. As was noted earlier in the paper, top
universities may create problems for the analysis in many ways. First, some do not lobby solely
for earmarks, but instead devote some portion of the lobbying effort to influencing science
budgets and policy. Relatedly, some of the top schools are engaged in regulatory policy-making,
and the lobbying expenditures associated with these efforts will appear in the lobbying data.
Finally, top schools may be fundamentally different in nature than other schools. To address
these concerns, we exclude all institutions that have any department ranked in the top 20 in its
respective field. This represents 83 top caliber research institutions. We re-estimate Model 8
without these institutions. The results are presented in Table 4, Model 9. Eliminating these top
research institutions raises the magnitudes of the interactive variable coefficients slightly, and
slightly lowers the direct effect of HAC and SAC. The coefficients on Ln(Lobby) and HAC are
not statistically significant. Alternatively, if we drop all 72 universities that received more than
$50 million in total government research funding each year, the results are similar.
***********INSERT TABLE 4 ABOUT HERE **********
Third, it may be that community colleges are fundamentally different from all other
institutions. Thus, in Model 10 we eliminate the community colleges and examine only 4-year
colleges and post-graduate institutions. There is little change in the coefficients from previous
models. 21
A fourth concern is that outliers in our sample drive our results. Figure 2 suggests that
Northwestern, Boston University, and Loma Linda are outliers in the lobbying-earmark space.
We remove these outliers in Model 11, and find similar results.
A fifth concern is that although universities maintain well-staffed internal government
relations departments, such internal lobbying efforts may be focused on administrative regulation
and general policy issues. In this view, academic-earmark lobbying is handled by external “guns
for hire.” A correlation analysis reveals that top schools are more likely than lower-ranked
21 There are four institutions where the governing board of the college system lobbies. We have allocated this lobbying into the individual institutions. If we drop these schools from the sample, it does not change the results.

20
schools to have internal lobbying departments (ρ = .61). In order to address the larger critique of
mismeasurement in lobbying, in Model 12 we re-run our earlier base econometric models using
only expenditures made by universities on external lobbyists. The coefficients are largely the
same as those generated by our earlier models.
A final critique of the model is that in conducting this analysis, we miss the value of
alumni networks in conducting “off-the-books” lobbying. We have a number of replies to this
critique. First, the random effects estimator presented in Model 8 should control for unobserved
institution-specific effects, including alumni networks. Second, to the extent that alumni
networks are effective, they are most likely to be effective with members of congress who are
alumni of an institution. We control for congressional alumni effects in our models and show
there is a HAC and SAC alumni effect in some first stage estimations. Finally, to the extent that
enrollment is correlated with size of alumni network, and NAS Top Ranked School is correlated
with “quality” of alumni, we control for the alumni effect. When we re-run Model 8 with an
interactive term of the two variables, this new interactive variable has no statistically significant
effect on the amount of earmarks schools receive.
In all cases, these robustness checks generate coefficient estimates close to the estimates
in Model 8. The coefficient on Ln(Lobby) is never statistically significant, while the coefficients
on the lobbying interactive variables are almost always statistically significant. The direct effect
of SAC is always statistically significant, while the direct effect of HAC is sometimes
statistically significant.
VI. EXTENSION: ARE UNIVERSITIES LOBBYING EFFICIENTLY?
In the previous section, we analyzed the parameter estimates to determine if universities
were lobbying efficiently. In this section, we further pursue this question by deriving a
theoretical test for efficient lobbying from our model. Economists typically assume that actors
are optimizers. However, there are reasons to expect that universities may not lobby efficiently
for earmarks. First, within the academic community, there is no consensus as to whether
legislated earmarks are a “legitimate” form of funding academic research. Indeed, members of
the AAU are split on whether universities should seek and obtain earmarks or not. Second, the
practice of lobbying for earmarks during 1997 to 1999 may not have yet reached an equilibrium.

21
Figure 2 shows a marked increase in earmarking during the 1990s. It is possible that during our
sample period, universities are still learning about how to most effectively lobby for earmarks.22
Both of the above reasons suggest that universities might underinvest in lobbying.
To explore whether universities are setting the marginal benefit of lobbying equal to the
marginal cost on average, we return to Eq 6. This represents the optimal level of lobbying.
Taking logs, we obtain:
iiii ZpL εβ
γβββ
+−
+−
+−
= ln1
ln1
1ln1
1ln * (EQ. 7)
Unfortunately, p is unobservable. However, we know that overhead rates are a fixed and known
proportion of p. Hence we assume:
iii Op δ+= (EQ. 8)
The error term, iδ , encompasses other factors, where the items in the error term are unlikely to be
correlated with overhead rates, which are negotiated independently with HHS. Substituting Eq 8
into Eq 7, we obtain:
iiii ZOL ωβ
γβββ
+−
+−
+−
= ln1
ln1
1ln1
1ln * (EQ. 9)
where ii δβ
εω ln1
1−
+= and 0)( =ωE . Taking the expectation of Eq 8 at the optimal levels of
lobbying yields:
0ln1
ln1
1ln1
1ln * =
+
−+
−+
−− iiii ZOLE ω
βγβ
ββ (EQ. 10)
This can be tested empirically. We know the values of L, O, and Z, and from Table 2, we have
estimated the values of β and γ. So for each observation, we can calculate the value of Eq 10,
and then statistically test if Eq 10 holds.
22 The fact that university lobbying expenditures during these years have increased far more rapidly than aggregate

22
We estimate Eq 10 for each of our 7,146 observations and find the mean of the variable is
0.0268 with a standard error of 0.0321. We then estimate a t-statistic to see if we can reject that
is equal to zero. We find we cannot reject that this is equal to zero at the 95% level of
confidence. The confidence interval is –0.0375 to 0.0911. Thus, we now have a second test that
suggests we cannot reject the hypothesis that universities are, on average, lobbying efficiently
under the assumptions of the theoretical model. Moreover, it suggests that Eq 6, which generates
our instruments from the first order condition, is methodologically valid.
VII. CONCLUSIONS
Although scholars have made great progress during the last 65 years in analyzing the
nature of interest group participation in government, measuring the returns to lobbying
investments has been elusive. This paper has conducted a statistical analysis to measure the
returns to lobbying by examining one aspect of interest group participation: lobbying by
universities for educational earmarks.
Our results suggest an intriguing pattern in lobbying and earmarks. The amount of
educational earmark funding an institution receives is determined by three factors: the lobbying
efforts by the university, the political representation of the university, and the characteristics of
the university. Universities that are fortunate enough to be located in districts with elected
representatives on the HAC and SAC are likely to recoup significant returns on their lobbying
efforts. The returns to lobbying for the average well-situated university, controlling for other
factors is relatively high. On the other hand, without representation on these two committees, the
return to lobbying is significantly less. Although the point estimate for the return to lobbying for
an average university without representation on the HAC or SAC is consistently positive and of
relatively of constant magnitude, it is not statistically different from zero or one in many
specifications. These results are broadly consistent with the predictions of Grossman & Helpman
(2001) from the informational lobbying literature with endogenous costs. They are also
consistent with the predictions of Helpman & Persson (2001) from the campaign finance
literature on agenda-setters. However, our results indicate that, contrary to the predictions of
these models, universities with HAC or SAC representation lobby more than their unrepresented
counterparts. Thus, although we find support for the overall Grossman-Helpman and Helpman-
lobbying expenditures may indicate that university lobbying has not yet reached an equilibrium.
23
Persson prediction that returns to lobbying are increasing in the convergence of interests between
group and legislator, the specific mechanism that these models propose – lower lobbying
expenditures – does not appear to operate quite as predicted. This suggests that there is more
work to be done on this subject, both theoretically and empirically.
This study also addresses the literature on committees. We find that HAC and SAC
members send earmarks to their districts in the absence of lobbying, although the effects of the
HAC members are less robust that those of their Senate counterparts. Lobbying serves to
increment the amount HAC and SAC members send to their constituents. This is consistent with
a distributive story of committees. Taken together with lobbying, the results suggest that theories
that combine both the distributional and informational models may be useful routes for research.
This study also has implications for the funding of academic research. The U.S. higher
education system is widely seen as key engine of U.S. economic growth, both through the
training of students and through research discovery (David C. Mowery & Rosenberg 1993).
Federal funding of academic research has been a central component of the United States
university system for decades, providing roughly 60 percent of all university research funds since
World War II (Nelson & Rosenberg 1994). This paper does not assess whether earmarked
academic funding or peer-reviewed competitive funding is a preferable distribution system;
however, with 10 percent of the federal budget for university research currently distributed
through earmarking, it would seem that academic administrators and politicians alike should be
concerned about how this mechanism might change the nature of research at U.S. universities
(Payne & Siow 2003).
Finally, although this study focused on lobbying for academic earmarks, we believe it is
generalizable to a whole class of interest group rent-seeking, especially when federal spending is
involved. In these cases, politicians are likely to be exposed to re-election pressures, and sending
targeted money to one’s own district is likely to enhance the probability of re-election (Steven D.
Levitt and Snyder 1997). In addition, unlike non-profit universities, most groups have multiple
political instruments available to them: lobbying, PAC contributions, grassroots organizing,
political advertisements, and the like. To the extent that groups can choose the most effective
combination of instruments (where there may be complementarities between instruments) to
achieve their goals, they may actually see higher returns to lobbying and political investment
than do universities, which are largely constrained to only lobbying.

24
REFERENCES
Austen-Smith, David (1995). “Campaign Contributions and Access.” American Political Science Review 89: 566-581. Balla, Steven, J., Eric D. Lawrence, Forrest Maltzman, and Lee Sigelman (2002). “Partisanship, blame avoidance, and the distribution of legislative pork,” American Journal of Political Science 46: 515-525. Baumgartner, Frank R., and Beth L. Leech (1998). Basic Interests: The Importance of Groups in Politics and Political Science. Princeton: Princeton University Press. Bennedsen, Morten, and Sven E. Feldman (2002). “Lobbying Legislators,” Journal of Political Economy 110: 919-946. Besley, Timothy, and Stephen Coate (2001). "Lobbying and Welfare in a Representative Democracy," Review of Economic Studies 68: 67-82. Calvert, Randall L. (1985). “The Value of Biased Information: A Rational Choice Model of Political Advice,” The Journal of Politics 47(2): 530-555. The Economist (1999). “Politics Brief: Ex Uno, Plures,” August 21, pp. 44-45. Finkelstein, Amy (1995). Politics and Science. Harvard B.A. Government Honors Thesis. Gawande, Kishore, and Usree Bandyopadhyay (2000). “Is Protection for Sale? Evidence on the Grossman-Helpman Theory of Endogenous Protection,” Review of Economics and Statistics 82: 139-152. Goldberg, Pinelopi Koujianou, and Giovanni Maggi (1999). “Protection for Sale: An Empirical Investigation,” American Economic Review 89: 1136-1155. Goldin, Claudia, and Lawrence F. Katz (1999). “The Shaping of Higher Education: The Formative Years in the United States, 1890 to 1940.” Journal of Economic Perspectives, 13: 37-62. Gray, William H. (1994). “Pork or Providence? A Defense of Earmarked Funds for Colleges,” Washington Post, February 27, 1994. Grier, Kevin B., Michael C. Munger, and Brian E. Roberts (1994). “The Determinants of Industry Political Activity, 1978-1986,” American Political Science Review 88: 911-926. Groseclose, Timothy, Jeff Milyo, and Daniel Primo (2000). “Corporate PAC Campaign Contributions in Perspective,” Business and Politics 2(1): 75-88. Grossman, Gene, and Elhanan Helpman (1994). “Protection for Sale,” American Economic Review 84: 833-850.
25
Grossman, Gene, and Elhanan Helpman (2001). Special Interest Politics. MIT Press: Cambridge, MA. Helpman, Elhanan, and Torsten Persson (2001). “Lobbying and Legislative Bargaining,” Advances in Economic Analysis & Policy: Vol. 1: No. 1, Article 3. Kroszner, Randall S., and Thomas Strattman (1999). “Interest-Group Competition and the Organization of Congress: Theory and Evidence from Financial Services’ Political Action Committees,” American Economic Review 88(5): 1163-1187. Levitt, Steven D., and James M. Snyder (1997). “The Impact of Federal Spending on House Election Outcomes,” The Journal of Political Economy, Vol. 105, No. 1. pp. 30-53. Lohnmann, Suzanne (1993). “A Signaling Model of Informative and Manipulative Political Action,” American Political Science Review 87: 319-333. Lohmann, Suzanne (1995). “Information, Access, and Contributions: A Signaling Model of Lobbying,” Public Choice 85: 267-284. Mayer, Kenneth R. (1991). The Political Economy of Defense Contracting. New Haven: Yale University Press. Mowery, David C., and Nathan Rosenberg (1993). “The U.S. National Innovation System.” In National Innovation Systems, edited by Richard R. Nelson, New York: Oxford University Press. Mundlak, Yazir (1963). “Estimation of Production Functions from a Combination of Cross-Section and Time-Series Data,” in Measurement in Economics, Studies in Mathematical Economics and Econometrics in Memory of Yehuda Grunfeld, C. Christ (ed.), pp. 138-166. Nelson, Richard R., and Nathan Rosenberg (1993). “Technical Innovation and National Systems.” In National Innovation Systems, edited by Richard R. Nelson, New York: Oxford University Press. Office of the Clerk of the House (2001). Lobby Disclosure Act Guidance and Instructions. Payne, A. Abigail (2003). “The Effects of Congressional Appropriation Membership on the Distribution of Federal Research Funding,” Economic Inquiry 41(2): 325-345. Payne, A. Abigail, and Aloysius Siow (2003). "Does Federal Research Funding Increase University Research Output? ", Advances in Economic Analysis & Policy: Vol. 3: No. 1, Article 1. http://www.bepress.com/bejeap/advances/vol3/iss1/art1 Ray, Bruce A. (1980). “Congressional Promotion of District Interests: Does Power on the Hill Really Make a Difference?” In Political Benefits: Empirical Studies of American Public Programs, edited by Barry S. Rundquist. Lexington, MA: Lexington Books.
26
Rosenberg, Nathan, and Richard R. Nelson (1994). “American Universities and Technical Advance in Industry.” Research Policy, 23: 323-348. Savage, James D. (1999). Funding Science in America: Congress Universities, and the Politics of the Academic Pork Barrel. Cambridge: Cambridge University Press. Silber, John (1987). “Testimony of Dr. John Silber, President of Boston Uinversiry, Before the Committee on Science, Space, and Technology, United States House of Representatives,” Washington DC, June 25. Smith, Richard A. (1995). “Interest Group Influence in the U.S. Congress,” Legislative Studies Quarterly 20(1): 89-139. Snyder, James (1990). “Campaign Contributions as Investments: The U.S. House of Representatives, 1980-1986,” Journal of Political Economy 98: 1195-1227. Wright, John R. (1985). “PACs, Contributions, and Roll Calls: An Organizational Perspective,” American Political Science Review 79: 400-414.

[Source: Total funding - NSF, National Patterns of R&D Resources; Earmarks - Savage (1999); Chronicle of Higher Education]
Figure 1b: Total Federal Funding and Earmark Funding for Universities and Colleges, Indexed
0
10
20
30
40
50
60
1980
1981
1982
1983
1984
1985
1986
1987
1988
1989
1990
1991
1992
1993
1994
1995
1996
1997
1998
1999
2000
2001
inde
x (1
980
= 1)
; bas
ed o
n co
nsta
nt 2
001
dolla
rs
Total Funding Earmarks
Figure 1a: Total Federal Funding and Earmark Funding for Universities and Colleges
0
2,000
4,000
6,000
8,000
10,000
12,000
14,000
16,000
18,000
20,000
1980 1981 1982 1983 1984 1985 1986 1987 1988 1989 1990 1991 1992 1993 1994 1995 1996 1997 1998 1999 2000 2001
cons
tant
200
1 do
llars
Total Funding Earmarks

earto
tal
lobby0 760000
0
44500
SSSOOSOSOSOSSSOSSSS OSSS
OS OSOSSOSSS OO
O
SOS SSOOO
OSO
OSSOS
SOO SSSSOOOSSS
O SOOOOSOSS
SOOOSSOSSSSOSSSSSOOS SS SOOOSS
S
OSS
OS
SSO SSS O
O
SSSOSS
OS OOOSOSOOSSSSOSOS S
SSSSOOSOSS SSOSSOSOS
S
OOSOOOOOOSS
SSOOO
OSOOSSOSSS SSOOOOSOSSSOOSSOSOOOSO
SSSOOSSSSSOSSSOOSSSOS OSSSS
SOSOSSSSS
SSOOS OSSOOOO
SOOOOS
SSSSSSSSOSOSSSSOSSOO
SSO
O
O SSOOSSSSSOOOSSSSOOSSOSS
S
OOSSSSS SSOSOSOSSSSSOSOSOSSSOOSOOSSSO
OSOSS SSS
OS
S
O SSSOSOOSOOSOOOSOS
O
SOOOSOOSSOSSSSSS
S
SO
S
OSSS
SSSSSSSOSSS
O
SSOOOOSSOSSSOOOO OSOOSOS
OSOSOOSOSSOO SSSOSSOSSSOOSSOOSOSOSSSOSOOOSOSSSOOOOOOSOSOSSOOSSSOOOOSSSSSSSOSSSOSSSSSSSS
SSO
O
SOOOOSSSOO
SSSSOSOSSOSSOOSOSS
S
OSSSOSSSSSOSSOOOSOO OSOOOSOSO
SOO S S
O OSSOSOOSOOS
O
OOOOS OO
SOS
O SSOOSS SSSSOOOOOOOSOSOSSO SSSSS
S
SSOSSSO SSO OS SO
OSSSS
O
OS
SOOSSS
OSOS OOSOSOSOS SSSSSSSSSOOOS
SS
OSSSOOSO OS OOSSS OSSSSOOSSOOSOO
S
S OSS
OSSOSOOSS OSSSSOSOSOSSSSOOSSSO
O
OSSSSSS SSSSOSSO
OSS OOOOS SOSSOSSSOSOS OS OS
OSOS OOSSOSSSO SOSOOOOO
OSSS OSOOOSSSOSSSS
OS
OOOS
SSSSO
SOOS
SOSSOOSO
O
SSSOOOSOSSOSSOO OSOOOSO OSSSSSSSSS
OSSO SSSOOSSSOOSSOOSS SO SS SSSSSOS SOSOSOOSSOSS SSSO SOSSO
O
SOSOOSO O
S
SSOOSOSSO SSSOSSSOSO
OSOOOOSSOOSO SSSS OOSOOOO
OO
SSOOS SOO OOSSSSS OSO OSOSO OOS
SO SOSSSOSOOOSOSO
O
OOOSSSSO
OSOSSSSOS SS
OSS
OOOOSSOSOSSSSOSSOSSOO
S
OSOO
S
OOOOOSSOOS
SOOSO
S OOSOSSS SSSSSSSSSS
S S OSSOSSSOSSSOS OSSOO
OOS OSSS
S
OOSS
S
SSOOOSSS SOOOOOS
OSSOS SSSOOSS SS OSOOOO
OSOOSO
OOO OSOOSOSSSSS OSSSOS
O
SOS
S
SSSO SSOOSSOSSSSOSSOOOOSOS SO
O
SOOOSOSOSSSSOOOSOO
OSOSOOSOSOOOOSSOSSOSOSSSOO
SOOSSOOSSSSOSSSOSOSO
SSOSOSSSSSSSO S
S
SSSSO
SS
OS SOOSSSS SOOOSOOS
SSOS
SOSOOSSSSSOOS
SOS
OSS OSSOO SSSS SS
S
SOSSOOOOSSSSS
OSOSOOSOOOSOS
SS
SO OO SSSOOSSS SOSS
SOOOSSS
SOOOSSO
S OSSSOOOSOOS
S
SSSOOSSOSSO OSOSS SOSOS SSSSSOOOSOS SSS
O
OS OS
S
OOOO
SSSSSSSOOOSSSS
SOOS
OSS SOSS SSSSOSOOSSSSSSOOO SSOOOSSSSSO SOOOSOO O
SS SS
SSOOSOOSSOSOOS OOO
OSSSSSS
OSSSOSOOSSOOSSO OSOOS
S
SOOSOS SOOSOSOS OOO
SOSSSSSOOOOOSSOO SSO OSSO
OOOSSSOOSSSSS
S
SOOOSSSOOSSSSOSS OOSOOSSOO
SSOOSS
SSOSOOOOOSSSSSSSSS SOOSO
OSO OOSSOOSO
SSOOOS
O
SSSOO SOSOOS SSOOSO
S
SOOSOS SSOSSSOOSSOSSSOSSSSOSSSSSOSSOOOOOSS
OOOSSSOSOS
SOOSSSOSOO SOOS
OSOSSOSSSSOS
S
OSOSSSO O
O
SOSO OSSOSSOSSOS
S
SO
S
SSOOS SOSOOOOSOSSOO OOOSSOOSOSSOOSSSS SOOSOSSSSSSO OSSO
SOSOSO OSOSSSOOO
SOOS
S
OSSOSSSOOS SSSSSSOSSSSSSOOOS SSOS SSOOSS SSSO SOSO
S
SS SSSSSSSO
OSSSOOSOOOSSSSSOO
S OSSSSSOS SSOSSOSOOOSOO
S
OOOSSS
S OSS
S
S SOSSSSOOOOO
SO OOSOOO SSSSOOO
SSSO
OOOOSSSOS
O
OS OSOSSSSSOOSS
S
OOSSSOSOS SSOOOS OO
S SSSSSSOOSOS OOOOSOOOSOOSSOOO
OSSOOOSSOSOSSOOS OSOOOS OOOSSSOOOOS SOOOOS OSSSOSO
S
OOSS SOSSOSS SSSS
S SOOOSO OSO SSOSO
OSSSSSOSSSOSSSSS SSSSSSOOSO SSOOSOSOOOOOO OSSOSSOOOSSSSSOSOOSOS O OOS OSOSOS OOSS
SO OO OOSSOOO OSSSO SSOSSOSSOOOOOOSSSO OSS
O
SSOS
S
SOS OOOSSSOOSOSSSSOS SOOO SOOSOSOS SSSSOO SSOOSSOOSSSSS
SOOOSSOSSOOSOO OSOSOSS SSSSOOSSOOSOOOOOOSSSOOSSOSSOSS
OSS
O
SSSOOO OOS OSSSSSSOSSOOOSSOSSOSS
SSSSSO
OOSOOSOOSSOOS OOS
SOSS SOOSSS SOOOOS SS
OSS
S
OOSSSSSS SSSSOOOOSSOSOSSOSOOO
SOSOOSOOOSSOSSOOSO SSSOOO
SS OOOOSOO
OOOSS OSSOOOS
SOOSSOSSSO
S
SSS
SSO
OOS OSSS SOOSSSSOOSSSOSSSSOSOSSSOOOOS OOOOSSO
O
SOSOSSSOOO SSS
S
SSSOSSOOOSOSSSSOSSS
S
O SSSS
S
OSSSOSSSSOOOSOOSO
OOO OS OSSSOSOSSSSOSSSSSS
S
SS SSSOSSO SO
SOOOSSSSS SS
S
SSOSSOSO SS
S SSOS OS
OSOOSSSOOS
O
OOOSSSSSSSOO
OSSOSOSOOSOSSSOOSOSOOSSOSSSSS OSOSOSSOOOSSOSS SOO
SSSSOSOO OS SSSS
SOOO
S
SSSSSOSOS
S
S
SOOOSOSSS SSSOOS SSO SO
S
OSSS
SOS
SSSSOS
S
SSSSOSS OSOS OOOOOOSSO
OOS OSSOOOOSSOSO SOO
SOOO OOSSSSOSOSSOOOOSOSSOSSOOSSS
OSSSOSSSSSSS
OS OSOS OSOSOOOSOOSSSSSSSO OSSSSSOS SSSOOSOSOOOOSSOOOSSSOSOSSSOOOSSO
SOOSSSSOO OOOOSSOOO
OO
OSSSSSSSO SSSSS OOOSOSOSSO
SS OOSOOO
SSOSSS
SOOSSSSOSOSOOSOSSO SSS
O
OS
S
OSOSSSSOOOSSSO SS OSSOOSOOOO
S
S OSOS OSOSOOOS
OOSOSOOSOOSOSOSSOOOO OSOSOOSSSSOSSO OSSOOOOS SOSSO O SSO SSOOOOSOSSO
OOSOSSOO SO
SOSOOOSSSSOOOSSSSS
OOOOOOOOSOOOSOOSSOOOOOOOSO OOOSSSSSS
S
OSSSSSOOOSOSOSOSOSOSOSSSO
O
SSS OOOS
O
O SS SSOS OOOSSSSSSOOS
OOSSOSSSSSOOOS SOSOOS OOS
S
OOOOOOSSSOOOS OOSOOOSSSSOS
OSSOSSSSO OOSSOO OOSOSOOOOO SOOO
SOS OOO
O
OOSS
SOSSSSSSOOOSOOOOOS SSOO OOOOS
OSSS OS OOOSOSOOSSO
OSOOOSOSOSO
O
OSSOSSO
SOOSSSOSOSOSOOSO OOOSSO
SOOSOOOSOOOSSOOOOO
OOSO
OOSOOOSOOOSSSO SOS OSSOOOS OSSSSS SSSO OOOOOOSOOSSOSOSSO OSSOSSS SOSSOSSOO
OSO
OOOSSOSOSOOO
OOS OSOOS OS
OOSOOOOOOOOSSS
S
SOSS OOOO
OSSOOSOO
O
O SSSSOOSOSSOSSO OOSOOOSSSS OSS OSSSSO
O
O SSSSOOSOSOSO OSOOOO SS
SOSOOSOOO
SOSSOSOOSO
SOOOOS
S
OSS SOOOS
SSSOOOS S
O OSOSSOOSOOOOOSSOOSOOOSO
OSSOOOOO
OSOOOOOOO
O
OSSSSS
OSOSO
OOOSO SOSSOSOSOOOOOO SOSO
O
OOSOS
OOOS OO
OSSOOSSOOS
OOS
SOSO
OSOOOSOSOS SOOOOSOOOOOSSOSSOOSOSOOOO OSOOS
SOOSOOSSSO
OOOO OOOOSO SSS SOSOSSOOOO SOSOSOOOOSSSSSOOOOSO
SOSOSOSOSOO
OSSSOSOOSOOOSOOOOOS
SS
OS
OSOOOSOOOOOOSOOOO
OOSO
S
SSSS SO OSSOOSOOOSSOSOOO OOSOSS OSOSOOSS OSOOOSSSS
SOOSOOOSSOOSSOSOOOOSSSO
O
SOSSS
S SSOOOSSSSSOOO SSSSSOO
OSOOSOSSSSOOOOSOSOSOOSOSO
OSOSSOOOO OSOO SS
OSSOOOOO
OOOSSOO
SS
S
OO
O
OOO
OSOSOOSOSOOOSSOSOOO
O OSOSOOOSS SO
S
S
SSO
OSS SOOSSSOSOS OSOOO O
S
S SOS OOSSOSS
SOSSSOOS
SSSOSOOSO
S
OOOOSSOSOSOOSOSS SOSSSOOO
OOS
OOOSOSSSOSOSSSOSSOSSSOSOO SOOOSOOSSS
S
OOSOSOSSSSSSOO SOSSOSSS O OOSOS
SS OSSOOOOOO SOOOOSOSS OO
SOSOSSSSS SS
S
SOS SSSOSOOSOSOSOSS
OOSSOO
S
SOSOSO
OOSS S
S
OO
S
SOSOOOSSSOO OSOOSO
OOSSS
O
SOOOSOOO
O
OSSSOOSOSOS
O
OOSOS S
S
OOOSSOO
OOSOOOS OOOOSOOOO OSS OOOOOS
SOSS
OSSOSOSSOOSOSOOSO OS SSOSSOS S
SSSSOSSOOSOSOSS SOOOOSOSO
SOSOOSSOSSOSS
S
OSOSOOO SSOOOOOOOSOOSOSO
S
OOSS SSOSSOOOOS O
OSSOS S
O
OSSSOOOOOOSOSOOOSSOOOOOSOOOOOOSOSSSOOSOSOSSSSSSOOS SOOOO OOS OSOSOOOSSSSOOO
OSSO
OSOSOSSSSSSOOSSOOO
OOSOSOOOOOSS SO SOOSOOSS S
S
OSSOSOOOSOOS
SSSSOOO OOOSSSOSSOOOOSOS
SOO
OSSOOSOOOOOSOSSOOSSSOOOS O
O OS SSOSOOSOOOOOOO OS OSOOOSSO OSOOOSOOO
SSOSOOSOOSOSSOO SOOOOOOOSSSOSOS SSOSOOOOSSSSSOO O OSOOOOSSS
O
S
O SOOSSOSOSSOSOS OSOOS
OOOOO OSOSO OO
O
SOOSOSOSS
OSSOSS
S
OSSOOS
S
S SOO OSSSOSOOOSOOOOOSOS
SSS
SSOOOSOSOSOSOSOOO
SSSSO OOSSOS SOOSOOSSSOOSSSSOO
OSOOSOOOSOOSS S
SOSS
SOSOSO OSSSOOOOOSSOSOOOOOSSOSS
O
OSOOOOOSSOSOOO OOOSOO OSSO SSOS SOOSSSOOOSS
OO
OOOO
S
OSO SOOOOS
SSOOOOSOSSSOOSSOOS
OOSO
OS
O
OOSSSSOOOSOO
O
S
O
OSS OSSOOSS
S
OSS
S
OOOOSOOOOOSO OOSO
SOOOOS SSO SOSOSS SOSSOS OOOOS
OSO
SSOSOOSSOSOSSOSOOOOOO SSSOS OS
SO SSOOS
OOO SSO OOSOSOOOSSSSO
OS SSOOOSOSSS
SOO SSOOOOSOOOOSOSSOS
OOOOOO
OOOOOOSOOOOOOOS SSOSOSOSOOSOSO SO OSSOOOSSSOS SSSS SOSOSSSOOSOOOSS
S
OOOOOOSOOSSOOOSS SSOOSSOSOO
S
OSOSSOSOOOSOSOOOOOS OSOSOOOOOOOOOO
SOSO
S
SOSOOOOS
OOSO
SOSOSOSOSOSOO
OOO OSO OOOSSSO OSOOOSSOSSSOOOOOO
OSOSS
O
OSSSOOSOSOSOOOOOSS SOSO
OSSSOSSOSSSSSO OOS
SOOOSOSOS
SOSS
SOOOOSOSOS
OSOOSSS OS
OSS
O
OOSS
OO
S
O
OSSOOOOSO SSOOOSOS O
OOSSSSOSSSOOSOOOS
SOOSOOO
SOSOOSOOSOOOOOOOOOOSSSOSOO OSSSO SOOSSSOS SOOSSOSOOO
O
OOS SOOOSOSO SSSOOSO OSO
SSOOOOSOSOSSOO
S
OSSOOSSSOSOOOOOSOSO
OOOOS OOOOOS S O
SOSOOS
SSOOS OS SO
OS
OSOOSSOOOOSOOSOOOOSOOSOOSSOO OSOOOSOOSOOOOSOSOO SOSOSOOSSSOOOSSOOSOOOOOSOSOSOOSSSSOSS OO SOSS
OSOOOOOOOSOS SO S
SOSO
OSOS SOOSSSSOSOOOSOOSSSOOSOOSSSSOS SOOOSOOS OSSSOOOOOOOOSOSO
SOOO SSSOSSSSOS SOO
S OSOOOSOOSSOSOO
SOOOOOOOOOSSSOOSOOSOOSOOOO
OOOOSOO
SSOOSOOO
O
SOSO OOOOSOSOOOO
SOOSSSOOO OOSOSOOOSOSOS OO OOOO OOOS SOSSOOSSSOOS S
OOOSSO
S
O
SOOSOO OOOSSSOSS OOOOS OSSS OO
S
OSOOOSSOOSSOOOOSS S
HS
HSHS
HSHHS HSHHSHHS
HHS
HHHSHSHHHHSHSH HHHSHS
HS
HSHSHSHHHSHSHHHHH HSHSHS
H
HSHHSHSHSHHSHS
HS
HSHHHSHHSHHSHHHH
HSHSH
HHSHSHHSHHSHSHSHSHSHHSHSHSHSHSHH
HHSHHHSHSHS
HS
HSHSHSHHH
HS
HHSHSHHSHSHSHSHS
HHSHHSHHSHHSHSH
HH
HSHSHSHSHHHHSHHHSHSH
HS
HSHSH
HS
HS HHHSHHHSHSHSHHSHHHSHSHSHSHSHH
HSHHSHSHHHHHSHHS
HSHS HHSHHS
HSHHSHSHSHSHSHSHSHSHSHHSHSHH HHSHSHSHHSHSHSHH
HS
HSHSHHSHHHHSHSHSHSHHSH
HHSHSHS
HS
HSHSHHSHSHSHHHSHHHSHS
H
HSHSHS
HSHSHHSHHSHHSHSHSHSHSHSHH
HS
HSHSH
HS
HHHSHHHSHSHSHSHSHS HHSHHSHSHS
HS
HSHSHSHSHSHSHHHSHH
HS
HSHSHSHH
HS
HHHHHHSHSHSHS
HSHSHHHS HSHSH HSHSHSHS
HHHH
H
HS
HSHSHSHHSHHHHS HH
HHHSHHSHSHHSHHHSHHHSHHSHSHSHHSHSHSHSHHHHSHHSH
HS
HHSHSHHS
HSHSHSHHS
H
HSHS
HSHS
H
HHSHSHSHHHHHSHHHS
HSHH
HSHSHSHSHSHSHHS
HHSHHSHSHHHSHSHSHHSHSHSHSHHHSHSHHHSHSHSHSHHSHSHHSHS
HS
HHSHHHHH
HSHSHHS
HS
HS
H
HSHSHSHSHSHHHSHSHSHS
HHSHHSHSHHHSHSHSH
HS
HH HSHSHSHSHSHSHHHHSHSHSHHSHHHS
HSHSHSHSHSHSHSHHSHHSHSHHSHSHSHS
HS
HSHSHHSHSHS
HS
HHHHHHHS
HS
HSHSHSHHSHSHS HHH
HSHSHHHHHHSHSHSHS
HSHSHHSHHSHS
H
HSHSHHSHSHHSH
H
HHSHSHSHSHSHH
H
HHSHHS
H
HSHHHSHHSHSHSHHSHSHSHSHSHHHHS
HHSHSHSHHSHSHHHSHHSH
H
HSHHSHHS
HHSHSHHH
HS
HHSHSHSHSHSHSHHHH
H
HHHSHSHSHHSHHSHSHSHHSHHSHHHSHHSHSHS
HSHSHHHS HHSHHSHS
H
HHSHSHHSHHHSHHS
HHSHHHSHHSHSHHSHHS HHSHSHSHSHSHHS
HS
HSHHHHSHSHSHSHSHHHHSHSHSHSHHHSHHSHHS
HHHSHSHSHSHSHSHHSHSHSHSHSHHHSHS
HS
HHSHHSHHHHHHSHHHHHHS
HS
HSHHSHS
HS
HSH HHHHHSHSHS
HHSHSHS
HS
HHHSHH
HS
HS HHS
HS
HHHS
HS
HSHHHHSHHSHSHSHSHSHS
H
HSHHSHSHSHSHSHSHHSHS
HSHSHSHH
HS
HHSHHSHSHSHSHS
H
HSHSHSHHHSHSHSHHHHSHSHH
HSHSHHSHHSHHSHHSHSHSHHSHHSHSHSHHSHSHSHSHSHSHS
H
HSHS HSHH
HS
HHHHSHHHHSH
H
H HHSHHHSHSHHHSHSHHHHHSH HHHSHSHHSHHSHHSHHSHHSHSHSHSHSHSHSHSHSHHSH
HS
HHHS
HS
HSHSHS
HS
HHHSHSHSHHS
HH
HSH HSHHSHHSHSHSHHHSHHHSHSHHSHHSH
H
HSHSHHHSHSHSHHS
HHHSHSHSHSHHHSHH
HS
HHH
HS
HHSHHSHSHSHSHHSHSHSHHSHSHSHSHHSHSHSH
Figure 2: Distribution of Earmarks and Lobbying by Committee
Earm
ark
Gra
nts (
$000
)
Lobbying Expenditures ($)
22250
380000
Boston University
Northwestern University
Loma Linda University
O = no HAC or SAC representation; H = HAC representation; S = SAC representation; HS = HAC and SAC representation
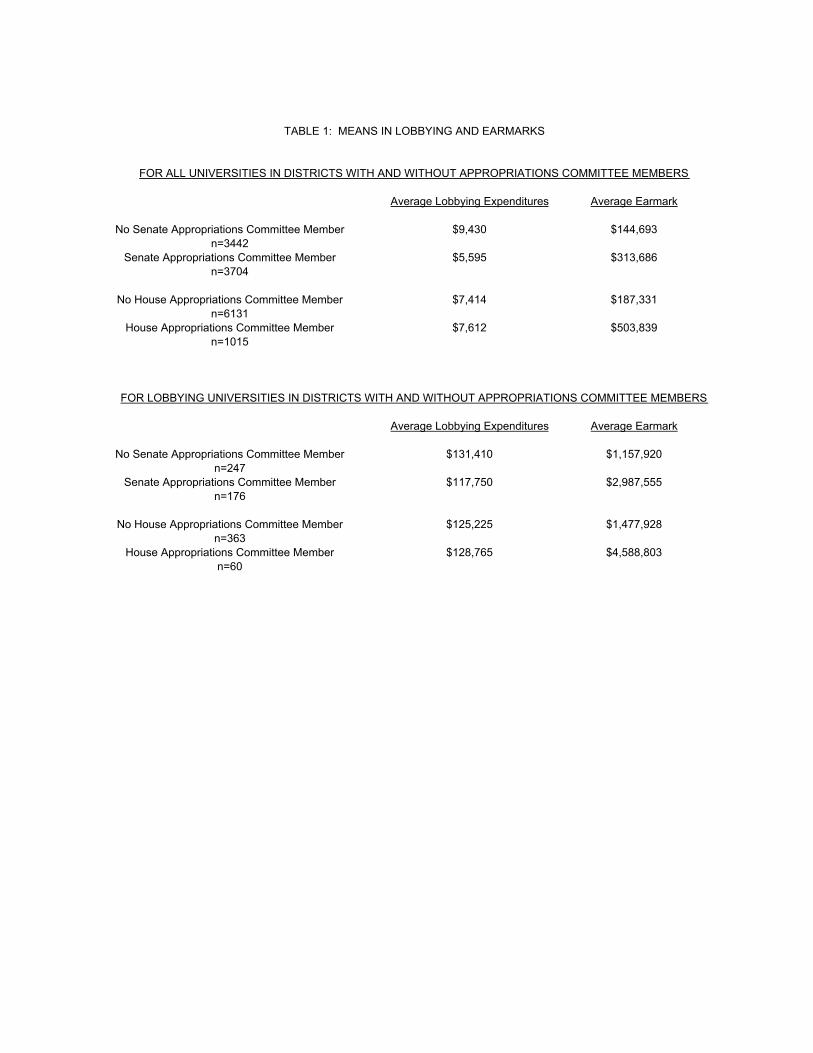
Average Lobbying Expenditures Average Earmark
No Senate Appropriations Committee Member $9,430 $144,693n=3442
Senate Appropriations Committee Member $5,595 $313,686n=3704
No House Appropriations Committee Member $7,414 $187,331n=6131
House Appropriations Committee Member $7,612 $503,839n=1015
Average Lobbying Expenditures Average Earmark
No Senate Appropriations Committee Member $131,410 $1,157,920n=247
Senate Appropriations Committee Member $117,750 $2,987,555n=176
No House Appropriations Committee Member $125,225 $1,477,928n=363
House Appropriations Committee Member $128,765 $4,588,803n=60
TABLE 1: MEANS IN LOBBYING AND EARMARKS
FOR ALL UNIVERSITIES IN DISTRICTS WITH AND WITHOUT APPROPRIATIONS COMMITTEE MEMBERS
FOR LOBBYING UNIVERSITIES IN DISTRICTS WITH AND WITHOUT APPROPRIATIONS COMMITTEE MEMBERS
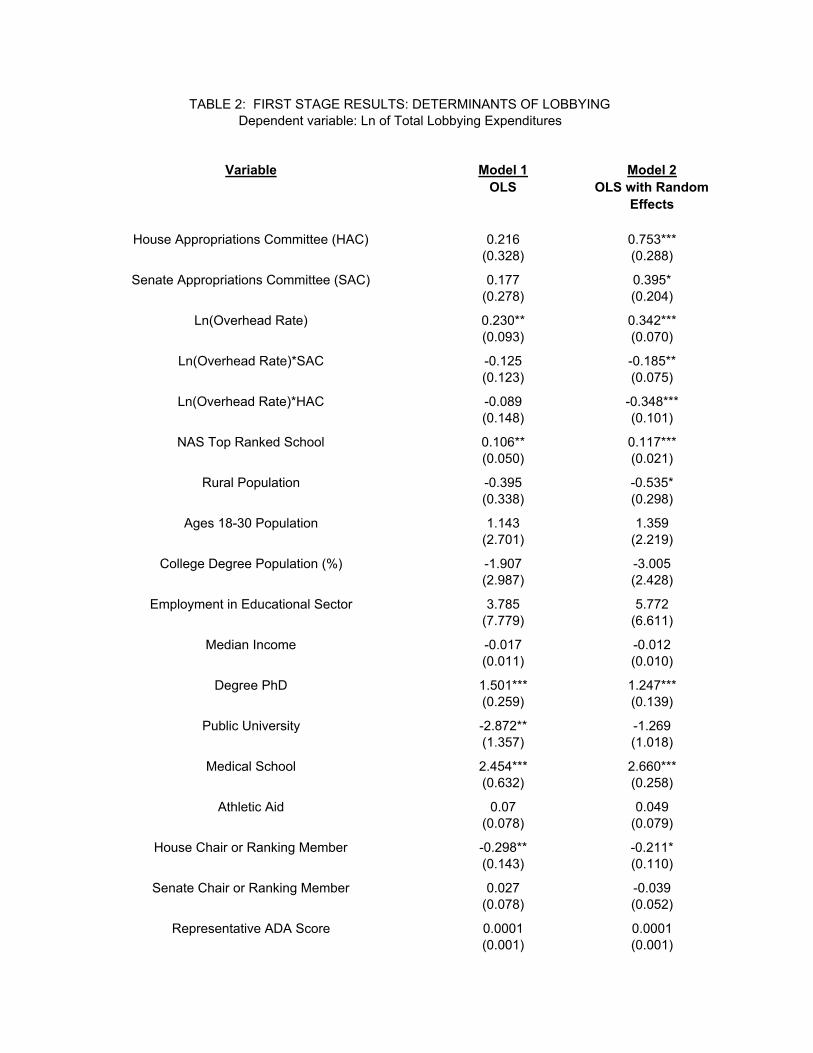
Variable Model 1 Model 2OLS OLS with Random
Effects
House Appropriations Committee (HAC) 0.216 0.753*** (0.328) (0.288)
Senate Appropriations Committee (SAC) 0.177 0.395* (0.278) (0.204)
Ln(Overhead Rate) 0.230** 0.342***(0.093) (0.070)
Ln(Overhead Rate)*SAC -0.125 -0.185**(0.123) (0.075)
Ln(Overhead Rate)*HAC -0.089 -0.348***(0.148) (0.101)
NAS Top Ranked School 0.106** 0.117*** (0.050) (0.021)
Rural Population -0.395 -0.535* (0.338) (0.298)
Ages 18-30 Population 1.143 1.359 (2.701) (2.219)
College Degree Population (%) -1.907 -3.005 (2.987) (2.428)
Employment in Educational Sector 3.785 5.772 (7.779) (6.611)
Median Income -0.017 -0.012 (0.011) (0.010)
Degree PhD 1.501*** 1.247*** (0.259) (0.139)
Public University -2.872** -1.269 (1.357) (1.018)
Medical School 2.454*** 2.660*** (0.632) (0.258)
Athletic Aid 0.07 0.049 (0.078) (0.079)
House Chair or Ranking Member -0.298** -0.211* (0.143) (0.110)
Senate Chair or Ranking Member 0.027 -0.039 (0.078) (0.052)
Representative ADA Score 0.0001 0.0001 (0.001) (0.001)
TABLE 2: FIRST STAGE RESULTS: DETERMINANTS OF LOBBYINGDependent variable: Ln of Total Lobbying Expenditures
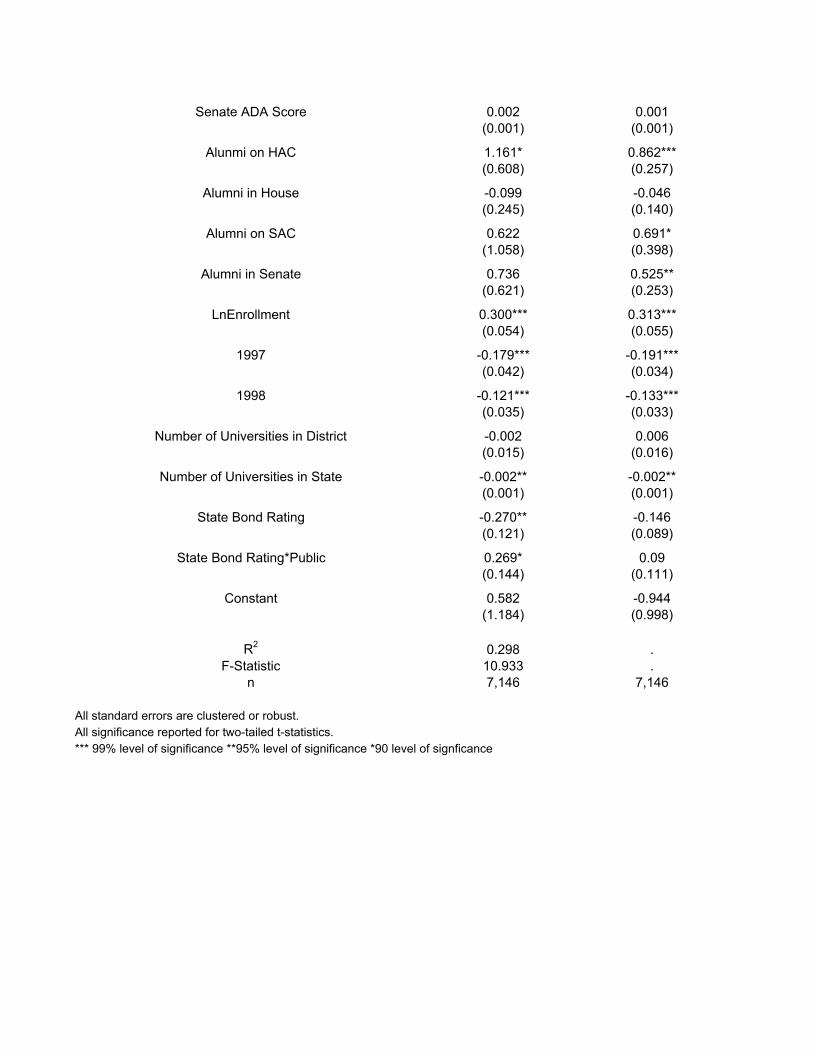
Senate ADA Score 0.002 0.001 (0.001) (0.001)
Alunmi on HAC 1.161* 0.862***(0.608) (0.257)
Alumni in House -0.099 -0.046 (0.245) (0.140)
Alumni on SAC 0.622 0.691* (1.058) (0.398)
Alumni in Senate 0.736 0.525** (0.621) (0.253)
LnEnrollment 0.300*** 0.313*** (0.054) (0.055)
1997 -0.179*** -0.191*** (0.042) (0.034)
1998 -0.121*** -0.133*** (0.035) (0.033)
Number of Universities in District -0.002 0.006 (0.015) (0.016)
Number of Universities in State -0.002** -0.002** (0.001) (0.001)
State Bond Rating -0.270** -0.146(0.121) (0.089)
State Bond Rating*Public 0.269* 0.09(0.144) (0.111)
Constant 0.582 -0.944 (1.184) (0.998)
R2 0.298 .F-Statistic 10.933 .
n 7,146 7,146
All standard errors are clustered or robust.All significance reported for two-tailed t-statistics.*** 99% level of significance **95% level of significance *90 level of signficance
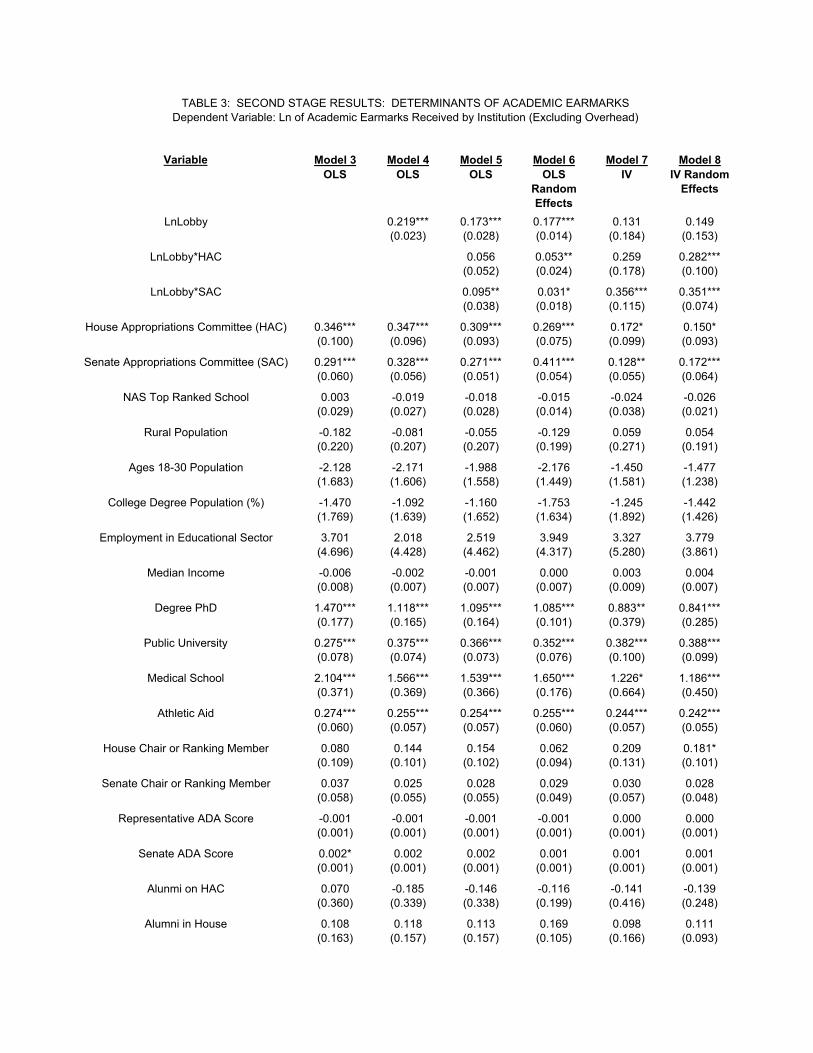
Variable Model 3 Model 4 Model 5 Model 6 Model 7 Model 8OLS OLS OLS OLS
Random Effects
IV IV Random Effects
LnLobby 0.219*** 0.173*** 0.177*** 0.131 0.149 (0.023) (0.028) (0.014) (0.184) (0.153)
LnLobby*HAC 0.056 0.053** 0.259 0.282*** (0.052) (0.024) (0.178) (0.100)
LnLobby*SAC 0.095** 0.031* 0.356*** 0.351*** (0.038) (0.018) (0.115) (0.074)
House Appropriations Committee (HAC) 0.346*** 0.347*** 0.309*** 0.269*** 0.172* 0.150* (0.100) (0.096) (0.093) (0.075) (0.099) (0.093)
Senate Appropriations Committee (SAC) 0.291*** 0.328*** 0.271*** 0.411*** 0.128** 0.172*** (0.060) (0.056) (0.051) (0.054) (0.055) (0.064)
NAS Top Ranked School 0.003 -0.019 -0.018 -0.015 -0.024 -0.026 (0.029) (0.027) (0.028) (0.014) (0.038) (0.021)
Rural Population -0.182 -0.081 -0.055 -0.129 0.059 0.054 (0.220) (0.207) (0.207) (0.199) (0.271) (0.191)
Ages 18-30 Population -2.128 -2.171 -1.988 -2.176 -1.450 -1.477 (1.683) (1.606) (1.558) (1.449) (1.581) (1.238)
College Degree Population (%) -1.470 -1.092 -1.160 -1.753 -1.245 -1.442 (1.769) (1.639) (1.652) (1.634) (1.892) (1.426)
Employment in Educational Sector 3.701 2.018 2.519 3.949 3.327 3.779 (4.696) (4.428) (4.462) (4.317) (5.280) (3.861)
Median Income -0.006 -0.002 -0.001 0.000 0.003 0.004 (0.008) (0.007) (0.007) (0.007) (0.009) (0.007)
Degree PhD 1.470*** 1.118*** 1.095*** 1.085*** 0.883** 0.841*** (0.177) (0.165) (0.164) (0.101) (0.379) (0.285)
Public University 0.275*** 0.375*** 0.366*** 0.352*** 0.382*** 0.388*** (0.078) (0.074) (0.073) (0.076) (0.100) (0.099)
Medical School 2.104*** 1.566*** 1.539*** 1.650*** 1.226* 1.186*** (0.371) (0.369) (0.366) (0.176) (0.664) (0.450)
Athletic Aid 0.274*** 0.255*** 0.254*** 0.255*** 0.244*** 0.242*** (0.060) (0.057) (0.057) (0.060) (0.057) (0.055)
House Chair or Ranking Member 0.080 0.144 0.154 0.062 0.209 0.181* (0.109) (0.101) (0.102) (0.094) (0.131) (0.101)
Senate Chair or Ranking Member 0.037 0.025 0.028 0.029 0.030 0.028 (0.058) (0.055) (0.055) (0.049) (0.057) (0.048)
Representative ADA Score -0.001 -0.001 -0.001 -0.001 0.000 0.000 (0.001) (0.001) (0.001) (0.001) (0.001) (0.001)
Senate ADA Score 0.002* 0.002 0.002 0.001 0.001 0.001 (0.001) (0.001) (0.001) (0.001) (0.001) (0.001)
Alunmi on HAC 0.070 -0.185 -0.146 -0.116 -0.141 -0.139(0.360) (0.339) (0.338) (0.199) (0.416) (0.248)
Alumni in House 0.108 0.118 0.113 0.169 0.098 0.111 (0.163) (0.157) (0.157) (0.105) (0.166) (0.093)
TABLE 3: SECOND STAGE RESULTS: DETERMINANTS OF ACADEMIC EARMARKSDependent Variable: Ln of Academic Earmarks Received by Institution (Excluding Overhead)
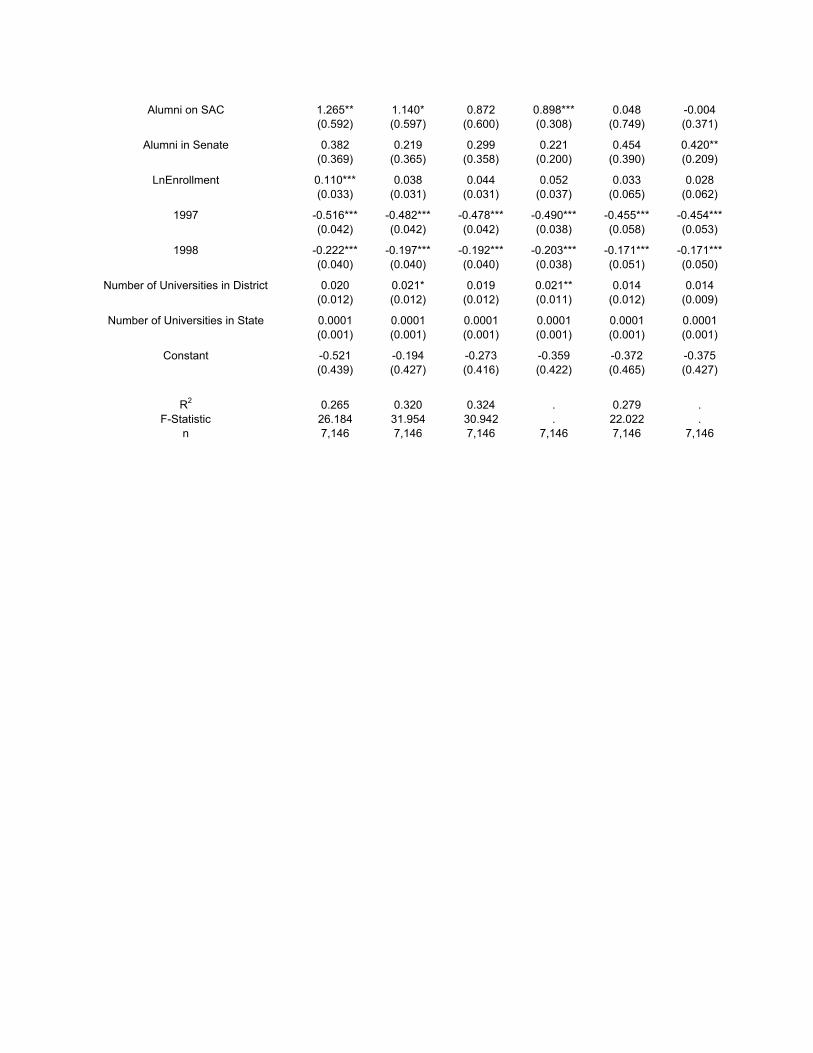
Alumni on SAC 1.265** 1.140* 0.872 0.898*** 0.048 -0.004(0.592) (0.597) (0.600) (0.308) (0.749) (0.371)
Alumni in Senate 0.382 0.219 0.299 0.221 0.454 0.420** (0.369) (0.365) (0.358) (0.200) (0.390) (0.209)
LnEnrollment 0.110*** 0.038 0.044 0.052 0.033 0.028 (0.033) (0.031) (0.031) (0.037) (0.065) (0.062)
1997 -0.516*** -0.482*** -0.478*** -0.490*** -0.455*** -0.454*** (0.042) (0.042) (0.042) (0.038) (0.058) (0.053)
1998 -0.222*** -0.197*** -0.192*** -0.203*** -0.171*** -0.171*** (0.040) (0.040) (0.040) (0.038) (0.051) (0.050)
Number of Universities in District 0.020 0.021* 0.019 0.021** 0.014 0.014 (0.012) (0.012) (0.012) (0.011) (0.012) (0.009)
Number of Universities in State 0.0001 0.0001 0.0001 0.0001 0.0001 0.0001 (0.001) (0.001) (0.001) (0.001) (0.001) (0.001)
Constant -0.521 -0.194 -0.273 -0.359 -0.372 -0.375(0.439) (0.427) (0.416) (0.422) (0.465) (0.427)
R2 0.265 0.320 0.324 . 0.279 .F-Statistic 26.184 31.954 30.942 . 22.022 .
n 7,146 7,146 7,146 7,146 7,146 7,146
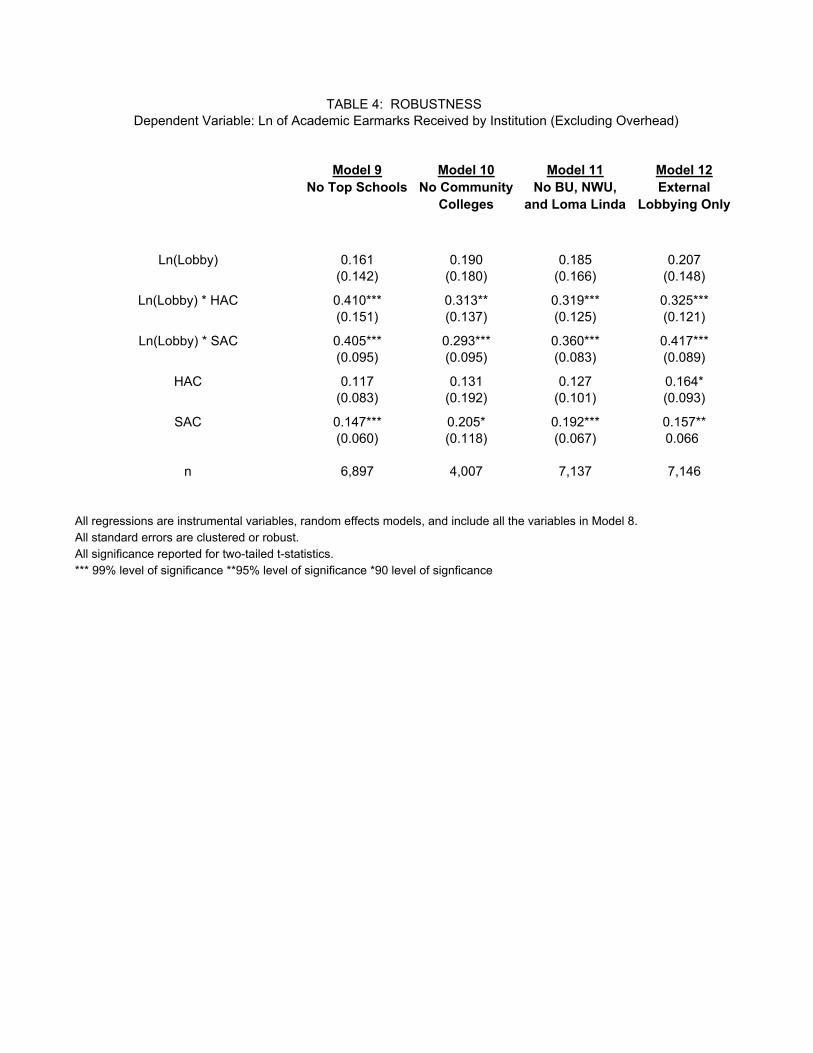
Model 9 Model 10 Model 11 Model 12No Top Schools No Community
CollegesNo BU, NWU,
and Loma LindaExternal
Lobbying Only
Ln(Lobby) 0.161 0.190 0.185 0.207(0.142) (0.180) (0.166) (0.148)
Ln(Lobby) * HAC 0.410*** 0.313** 0.319*** 0.325***(0.151) (0.137) (0.125) (0.121)
Ln(Lobby) * SAC 0.405*** 0.293*** 0.360*** 0.417***(0.095) (0.095) (0.083) (0.089)
HAC 0.117 0.131 0.127 0.164*(0.083) (0.192) (0.101) (0.093)
SAC 0.147*** 0.205* 0.192*** 0.157**(0.060) (0.118) (0.067) 0.066
n 6,897 4,007 7,137 7,146
All regressions are instrumental variables, random effects models, and include all the variables in Model 8.All standard errors are clustered or robust.All significance reported for two-tailed t-statistics.*** 99% level of significance **95% level of significance *90 level of signficance
TABLE 4: ROBUSTNESS Dependent Variable: Ln of Academic Earmarks Received by Institution (Excluding Overhead)
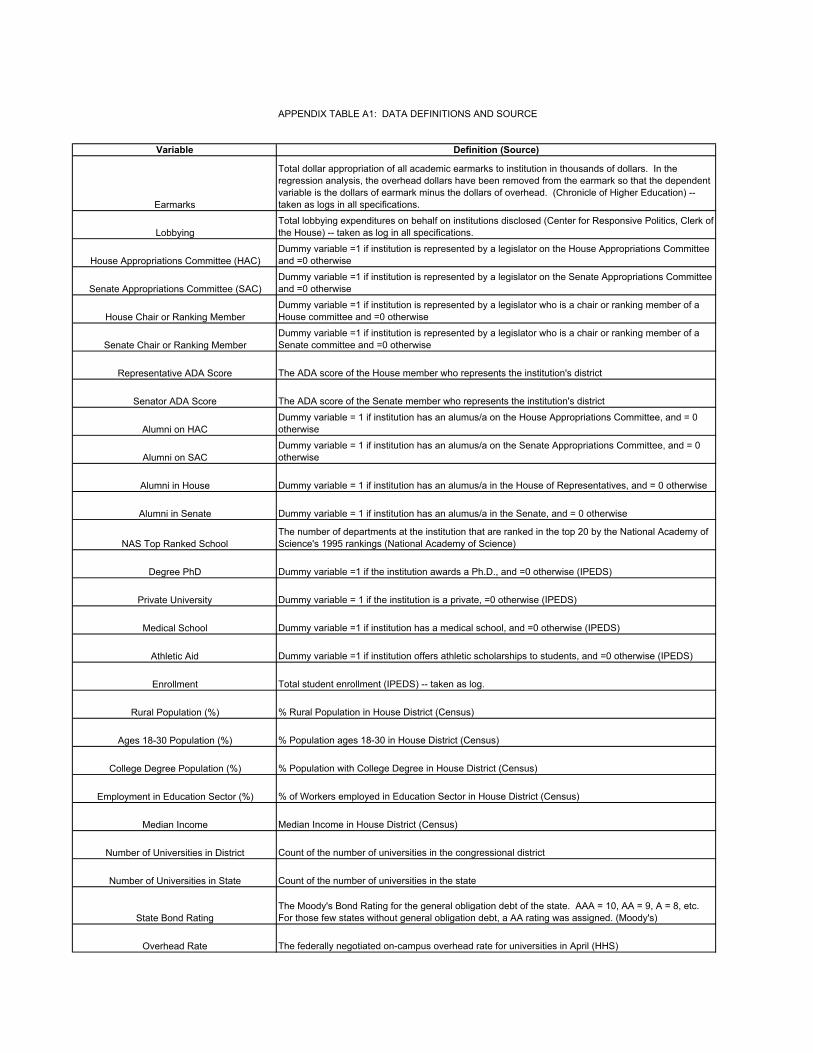
APPENDIX TABLE A1: DATA DEFINITIONS AND SOURCE
Variable Definition (Source)
Earmarks
Total dollar appropriation of all academic earmarks to institution in thousands of dollars. In the regression analysis, the overhead dollars have been removed from the earmark so that the dependent variable is the dollars of earmark minus the dollars of overhead. (Chronicle of Higher Education) -- taken as logs in all specifications.
LobbyingTotal lobbying expenditures on behalf on institutions disclosed (Center for Responsive Politics, Clerk of the House) -- taken as log in all specifications.
House Appropriations Committee (HAC)Dummy variable =1 if institution is represented by a legislator on the House Appropriations Committee and =0 otherwise
Senate Appropriations Committee (SAC)Dummy variable =1 if institution is represented by a legislator on the Senate Appropriations Committee and =0 otherwise
House Chair or Ranking MemberDummy variable =1 if institution is represented by a legislator who is a chair or ranking member of a House committee and =0 otherwise
Senate Chair or Ranking MemberDummy variable =1 if institution is represented by a legislator who is a chair or ranking member of a Senate committee and =0 otherwise
Representative ADA Score The ADA score of the House member who represents the institution's district
Senator ADA Score The ADA score of the Senate member who represents the institution's district
Alumni on HACDummy variable = 1 if institution has an alumus/a on the House Appropriations Committee, and = 0 otherwise
Alumni on SACDummy variable = 1 if institution has an alumus/a on the Senate Appropriations Committee, and = 0 otherwise
Alumni in House Dummy variable = 1 if institution has an alumus/a in the House of Representatives, and = 0 otherwise
Alumni in Senate Dummy variable = 1 if institution has an alumus/a in the Senate, and = 0 otherwise
NAS Top Ranked SchoolThe number of departments at the institution that are ranked in the top 20 by the National Academy of Science's 1995 rankings (National Academy of Science)
Degree PhD Dummy variable =1 if the institution awards a Ph.D., and =0 otherwise (IPEDS)
Private University Dummy variable = 1 if the institution is a private, =0 otherwise (IPEDS)
Medical School Dummy variable =1 if institution has a medical school, and =0 otherwise (IPEDS)
Athletic Aid Dummy variable =1 if institution offers athletic scholarships to students, and =0 otherwise (IPEDS)
Enrollment Total student enrollment (IPEDS) -- taken as log.
Rural Population (%) % Rural Population in House District (Census)
Ages 18-30 Population (%) % Population ages 18-30 in House District (Census)
College Degree Population (%) % Population with College Degree in House District (Census)
Employment in Education Sector (%) % of Workers employed in Education Sector in House District (Census)
Median Income Median Income in House District (Census)
Number of Universities in District Count of the number of universities in the congressional district
Number of Universities in State Count of the number of universities in the state
State Bond RatingThe Moody's Bond Rating for the general obligation debt of the state. AAA = 10, AA = 9, A = 8, etc. For those few states without general obligation debt, a AA rating was assigned. (Moody's)
Overhead Rate The federally negotiated on-campus overhead rate for universities in April (HHS)

Varia
ble
Mea
nSt
d. D
ev.
Min
Max
Mea
nSt
d. D
ev.
Min
Max
Tota
l Ear
mar
ks (i
n $0
00)
232.
291,
411.
400.
0044
,500
.00
1,91
9.19
3,93
7.38
0.00
44,5
00.0
0
Earm
arks
with
out O
verh
ead
(in $
000)
164.
9196
0.27
0.55
27,1
34.7
61,
318.
452,
571.
930.
5727
,134
.76
Lobb
ying
($)
7,44
2.27
42,2
24.0
80.
0076
0,00
0.00
125,
726.
0012
3,61
1.90
20,0
00.0
076
0,00
0.00
Hou
se A
ppro
pria
tions
Com
mitt
ee (H
AC)
0.14
0.35
0.00
1.00
0.14
0.35
0.00
1.00
Sena
te A
ppro
pria
tions
Com
mitt
ee (S
AC)
0.52
0.50
0.00
1.00
0.42
0.49
0.00
1.00
Hou
se C
hair
or R
anki
ng M
embe
r0.
080.
270.
001.
000.
040.
190.
001.
00
Sena
te C
hair
or R
anki
ng M
embe
r0.
510.
500.
001.
000.
510.
500.
001.
00
Rep
rese
ntat
ive
ADA
Scor
e46
.53
39.0
80.
0010
0.00
58.6
038
.58
0.00
100.
00
Sena
tor A
DA
Scor
e47
.27
33.8
80.
0010
0.00
50.9
331
.78
0.00
100.
00
Alum
ni o
n H
AC0.
030.
160.
001.
000.
180.
380.
001.
00
Alum
ni o
n SA
C0.
120.
320.
001.
000.
470.
500.
001.
00
Alum
ni in
Hou
se0.
010.
120.
001.
000.
110.
320.
001.
00
Alum
ni in
Sen
ate
0.03
0.18
0.00
1.00
0.24
0.43
0.00
1.00
NAS
Top
Ran
ked
Scho
ol0.
312.
430.
0039
.00
3.08
7.42
0.00
39.0
0
Deg
ree
PhD
0.15
0.36
0.00
1.00
0.78
0.41
0.00
1.00
Priv
ate
Uni
vers
ity0.
590.
490.
001.
000.
580.
490.
001.
00
Med
ical
Sch
ool
0.04
0.20
0.00
1.00
0.37
0.48
0.00
1.00
Athl
etic
Aid
0.50
0.50
0.00
1.00
0.78
0.41
0.00
1.00
Enro
llmen
t5,
489.
006,
678.
0017
.00
51,4
45.0
016
,309
.00
11,6
44.0
040
2.00
51,4
45.0
0
Rur
al P
opul
atio
n (%
)0.
310.
220.
000.
870.
220.
220.
000.
72
Ages
18-
30 P
opul
atio
n (%
)0.
190.
020.
130.
330.
200.
030.
140.
33
Col
lege
Deg
ree
Popu
latio
n (%
)0.
080.
030.
020.
220.
080.
030.
030.
17
Empl
oym
ent i
n Ed
ucat
ion
Sect
or (%
)0.
040.
010.
020.
070.
040.
010.
020.
07
Med
ian
Inco
me
29.1
97.
6615
.06
57.2
228
.64
6.88
15.2
656
.06
Num
ber o
f Uni
vers
ities
in D
istri
ct7.
333.
521.
0020
.00
6.65
3.40
2.00
20.0
0
Num
ber o
f Uni
vers
ities
in S
tate
83.2
054
.46
6.00
202.
0080
.32
50.9
17.
0020
2.00
Stat
e Bo
nd R
atin
g9.
080.
588.
0010
.00
8.98
0.55
8.00
10.0
0
Ove
rhea
d R
ate
(%)
22.1
320
.95
8.00
85.0
043
.73
17.5
08.
0075
.00
APPE
ND
IX T
ABLE
A2:
DES
CR
IPTI
VE S
TATI
STIC
S
All U
nive
rsiti
es, A
ll Ye
ars
(n =
7,1
46)
Lobb
ying
Uni
vers
ities
, All
Year
s (n
= 4
23)
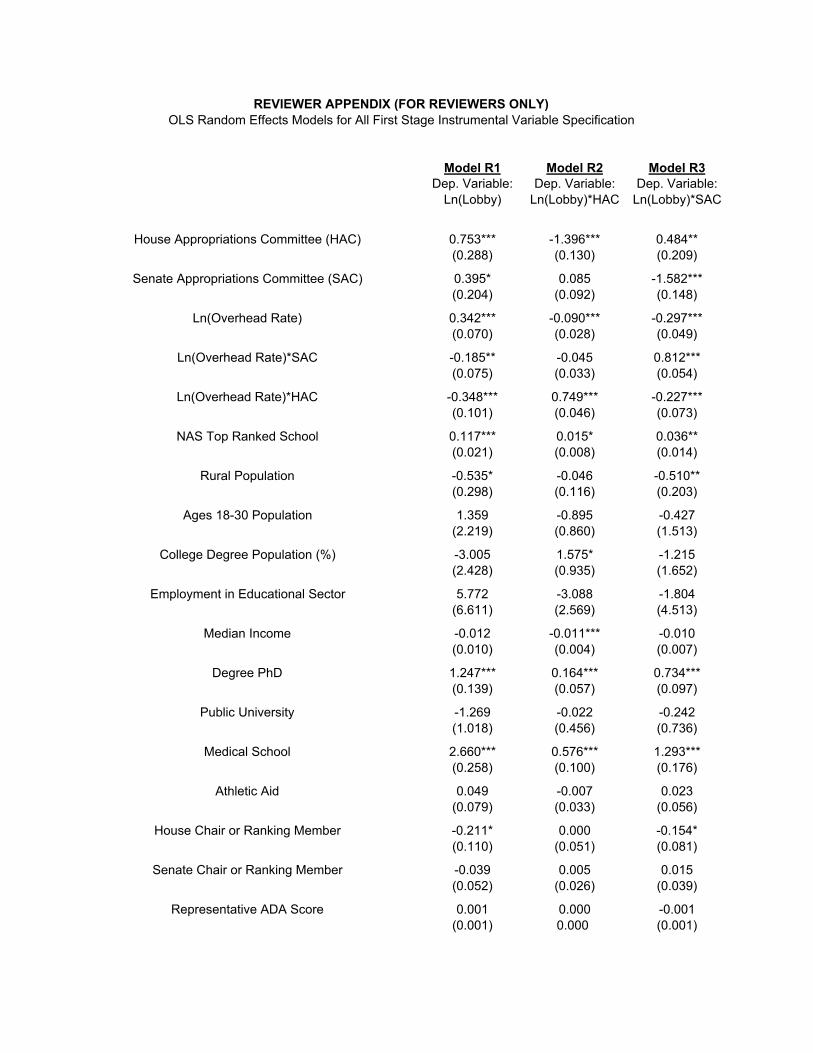
Model R1 Model R2 Model R3Dep. Variable:
Ln(Lobby)Dep. Variable:
Ln(Lobby)*HACDep. Variable:
Ln(Lobby)*SAC
House Appropriations Committee (HAC) 0.753*** -1.396*** 0.484** (0.288) (0.130) (0.209)
Senate Appropriations Committee (SAC) 0.395* 0.085 -1.582*** (0.204) (0.092) (0.148)
Ln(Overhead Rate) 0.342*** -0.090*** -0.297***(0.070) (0.028) (0.049)
Ln(Overhead Rate)*SAC -0.185** -0.045 0.812***(0.075) (0.033) (0.054)
Ln(Overhead Rate)*HAC -0.348*** 0.749*** -0.227***(0.101) (0.046) (0.073)
NAS Top Ranked School 0.117*** 0.015* 0.036** (0.021) (0.008) (0.014)
Rural Population -0.535* -0.046 -0.510** (0.298) (0.116) (0.203)
Ages 18-30 Population 1.359 -0.895 -0.427 (2.219) (0.860) (1.513)
College Degree Population (%) -3.005 1.575* -1.215 (2.428) (0.935) (1.652)
Employment in Educational Sector 5.772 -3.088 -1.804 (6.611) (2.569) (4.513)
Median Income -0.012 -0.011*** -0.010 (0.010) (0.004) (0.007)
Degree PhD 1.247*** 0.164*** 0.734*** (0.139) (0.057) (0.097)
Public University -1.269 -0.022 -0.242 (1.018) (0.456) (0.736)
Medical School 2.660*** 0.576*** 1.293*** (0.258) (0.100) (0.176)
Athletic Aid 0.049 -0.007 0.023 (0.079) (0.033) (0.056)
House Chair or Ranking Member -0.211* 0.000 -0.154* (0.110) (0.051) (0.081)
Senate Chair or Ranking Member -0.039 0.005 0.015 (0.052) (0.026) (0.039)
Representative ADA Score 0.001 0.000 -0.001 (0.001) 0.000 (0.001)
REVIEWER APPENDIX (FOR REVIEWERS ONLY)OLS Random Effects Models for All First Stage Instrumental Variable Specification

Senate ADA Score 0.001 0.001*** 0.000 (0.001) (0.001) (0.001)
Alunmi on HAC 0.862*** -0.144 -0.028(0.257) (0.111) (0.183)
Alumni in House -0.046 0.143** 0.013 (0.140) (0.059) (0.099)
Alumni on SAC 0.691* 0.899*** 1.786*** (0.398) (0.170) (0.283)
Alumni in Senate 0.525** 0.081 -0.305* (0.253) (0.110) (0.181)
LnEnrollment 0.313*** 0.034 0.099*** (0.055) (0.022) (0.038)
1997 -0.191*** -0.013 -0.114*** (0.034) (0.019) (0.027)
1998 -0.133*** 0.005 -0.104*** (0.033) (0.019) (0.026)
Number of Universities in District 0.006 0.002 0.022** (0.016) (0.006) (0.011)
Number of Universities in State -0.002** 0.000 -0.001 (0.001) 0.000 (0.001)
State Bond Rating -0.146 -0.018 -0.067(0.089) (0.041) (0.065)
State Bond Rating*Public 0.090 -0.003 0.014(0.111) (0.050) (0.080)
Constant -0.944 0.508 1.158 (0.998) (0.427) (0.708)
R2 . . .F-Statistic . . .
n 7,146 7,146 7,146
All standard errors are clustered or robust.All significance reported for two-tailed t-statistics.*** 99% level of significance **95% level of significance *90 level of signficance