Embed Size (px)
Citation preview

Input on Parameters Used to Claim Energy Savings –
Residential Installations
WHPA 1 of 14 08/26/2014
Summary
Industry input to Southern California Edison, which is updating its Quality Installation Program Claimed Savings
Work Paper for residential split systems and packaged units. Seven parameters utilized for estimating energy and
demand savings in measure are reviewed.
Finalized: September 10, 2014
Use of this Document
This document provides Industry input to Southern California Edison for its Residential Quality Installation
Program Claimed Savings Work Paper.
It is based on an official WHPA Work Product of September 10, 2014, titled “Input to SCE RQI Program Claimed
Savings Work Paper.” This Work Product was developed by the WHPA Residential Quality Installation
Committee.
This document, and also the WHPA Work Product, may be used in part or whole at no charge. Attribution to the
Western HVAC Performance Alliance is requested.
We would also ask that you inform the WHPA through [email protected] if you have made use of
either document, so that we can inform and encourage the hundreds of volunteers who donate their time to
providing expert HVAC advice in order to support energy efficiency objectives.
Input on Parameters Used to Claim Energy Savings – Residential
Installations
Table of Contents
Background ..........................................................................................................................2
Section 1 – Summary of Parameters Used in Building Energy Simulation (BES)
for Estimating Energy Savings .........................................................................3
Section 2 – Overview and Supporting Documentation on BES Parameters .......................5
Input on Parameters Used to Claim Energy Savings –
Residential Installations
WHPA 2 of 14 08/26/2014
Background
Southern California Edison (SCE) staff requested that the WHPA Residential Quality Installation (RQI)
Committee members representing industry assist them as SCE refreshed its RQI Work Paper last developed in
2009. Beginning in May 2014, the Committee reviewed claimed savings parameters used in the Work Paper
determining whether specific parameters and assumptions were accurate, research-based, field-observation-based,
superseded by more current data, etc. Members were also asked to suggest additional parameters, measurements,
procedures or protocol that would more accurately estimate measure savings.
The Work Product takes the following form: An overview drafted by Andres Fergadiotti of SCE’s original 2009
“Parameters for Estimating Energy Savings on Quality Installation for Residential Split Systems and Packaged
Units Work Paper – SCE13HC023.0” broken into seven (7) sections, with WHPA RQI Committee input and
commentary noted at the end of each section
The Committee stated that they hold a consensus opinion that program goals and program evaluation should be in
sync and would both be improved greatly if based upon agreed, standardized actual field measured system
performance rather than current methods which rely heavily on laboratory individual energy efficiency measure
research, severely dated marketplace data, CPUC/ED claimed savings marketplace and system assumptions,
DEER-based calculation assumptions, and system modeling
Input to Southern California Edison RQI Program Claimed Savings Work Paper
Prepared by Andres Fergadiotti, SCE, DSM Engineering
August 20, 2014
Parameters for Estimating Energy Savings on Quality Installation for Residential Split Systems &
Packaged Units Work Paper - SCE13HC023.0
By Andres Fergadiotti, SCE, DSM Engineering, REVAugust 12, 2014
This report overviews earlier documentation compiled for the Western HVAC Performance Alliance
(WHPA) on methods and approach for estimating energy savings on the subject measure. This activity
is intended to encourage a transparent and collaborative process as well as alignment between deemed
(Ex-Ante) energy estimating methods and Industry undertaking rigorous processes to review energy
savings estimates and technical parameters impacting the California energy efficiency portfolio.
Future work paper updates and process and methods for estimating energy savings in the measure will
likely address and/or incorporate performance parameters suggested by the CPUC in their (a) Baseline
Market Characterization Study: Residential and Small Commercial HVAC (Work Order 054), Draft,
Dated June 17, 2014, and (b) HVAC Impact Evaluation DRAFT Report Work Order 32 HVAC, Dated
August 12, 2014.
Input on Parameters Used to Claim Energy Savings –
Residential Installations
WHPA 3 of 14 08/26/2014
Section 1 - Summary of Parameters Used in Building Energy Simulation (BES) for Estimating
Energy Savings
Following section summarizes general methodology and key parameters used for estimating energy and
demand savings on the measure using the eQuest/DOE2.2 – Building Energy Simulation (BES) tool.
Parameters used in the BES are further ranked as “High Impact,” “Medium Impact,” and “Low Impact”
based on the severity they are expected to influence estimated energy and demand savings on the
measure.
Background
Methodology for estimating energy and demand savings on the measure utilizes the Database for Energy
Efficiency Resources (DEER) Residential prototype. The residential prototype describes the site configuration,
including multiple building shells (total of four shells corresponding to two single-story homes and two two-story
homes at different orientations). Each shell is served by a dedicated HVAC system. Prototype characteristics on
mechanical, lighting, domestic hot water, envelop, occupancy, plug load, etc., correspond to an eQuest/DOE2.2
input parameter and/or performance characteristics with some of these developed specifically for the DEER
analysis.
Further, energy methods analyzing the measure utilizes varies vintages per DEER (e.g., 1975, 1985, 1996, 2003,
and 2007) includes a set of building weights that define the relative floor space of each building type (or building
population) within each IOU service territory and broken down by vintage and climate zone. Residential building
weights are developed from the Residential Appliance Saturation Survey (RASS) data. This supports the
development of “rolled-up” or typical savings values for measures where the actual participation among the
population of buildings is not known. RASS is one of the most valuable sources of information for residential
Unit Energy Consumption (UEC) values. The DEER team uses these UECs to calibrate the prototypical
residential simulation models so that these models yield annual energy use values for heating and cooling that are
similar to RASS.
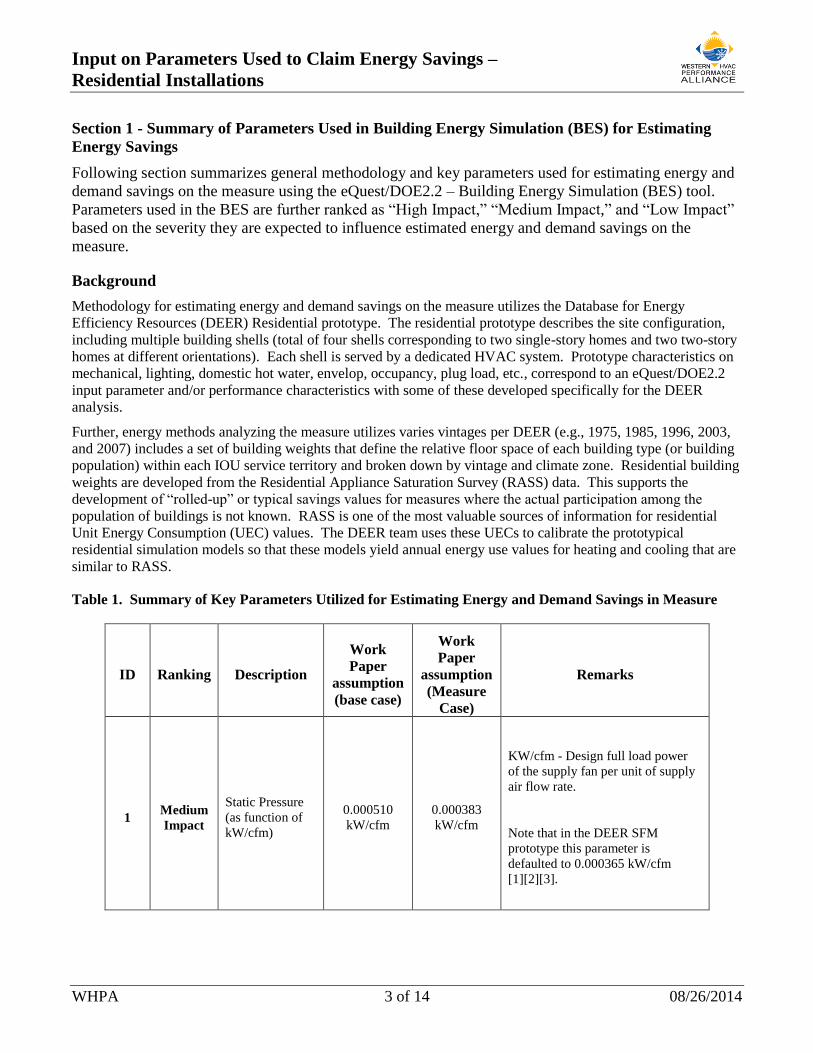
Table 1. Summary of Key Parameters Utilized for Estimating Energy and Demand Savings in Measure
ID Ranking Description
Work
Paper
assumption
(base case)
Work
Paper
assumption
(Measure
Case)
Remarks
1 Medium
Impact
Static Pressure
(as function of
kW/cfm)
0.000510
kW/cfm
0.000383
kW/cfm
KW/cfm - Design full load power
of the supply fan per unit of supply
air flow rate.
Note that in the DEER SFM
prototype this parameter is
defaulted to 0.000365 kW/cfm
[1][2][3].
Input on Parameters Used to Claim Energy Savings –
Residential Installations
WHPA 4 of 14 08/26/2014
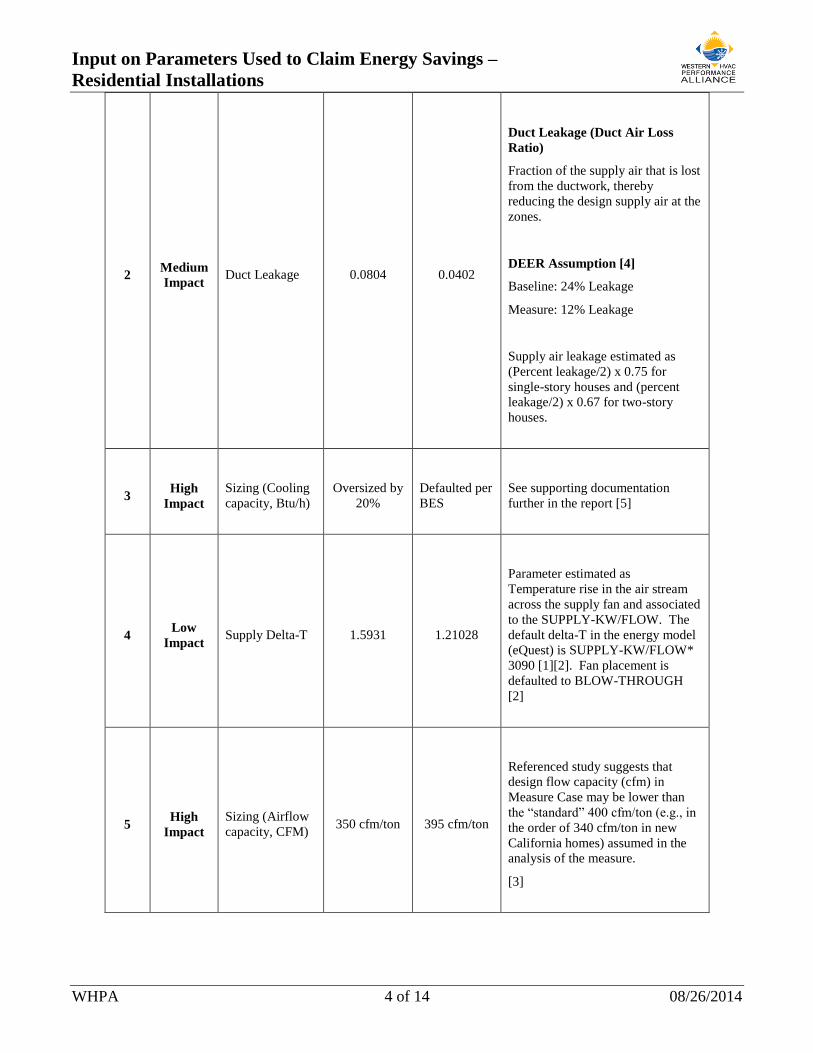
2 Medium
Impact Duct Leakage 0.0804 0.0402
Duct Leakage (Duct Air Loss
Ratio)
Fraction of the supply air that is lost
from the ductwork, thereby
reducing the design supply air at the
zones.
DEER Assumption [4]
Baseline: 24% Leakage
Measure: 12% Leakage
Supply air leakage estimated as
(Percent leakage/2) x 0.75 for
single-story houses and (percent
leakage/2) x 0.67 for two-story
houses.
3 High
Impact
Sizing (Cooling
capacity, Btu/h)
Oversized by
20%
Defaulted per
BES
See supporting documentation
further in the report [5]
4 Low
Impact Supply Delta-T 1.5931 1.21028
Parameter estimated as
Temperature rise in the air stream
across the supply fan and associated
to the SUPPLY-KW/FLOW. The
default delta-T in the energy model
(eQuest) is SUPPLY-KW/FLOW*
3090 [1][2]. Fan placement is
defaulted to BLOW-THROUGH
[2]
5 High
Impact
Sizing (Airflow
capacity, CFM) 350 cfm/ton 395 cfm/ton
Referenced study suggests that
design flow capacity (cfm) in
Measure Case may be lower than
the “standard” 400 cfm/ton (e.g., in
the order of 340 cfm/ton in new
California homes) assumed in the
analysis of the measure.
[3]
Input on Parameters Used to Claim Energy Savings –
Residential Installations
WHPA 5 of 14 08/26/2014
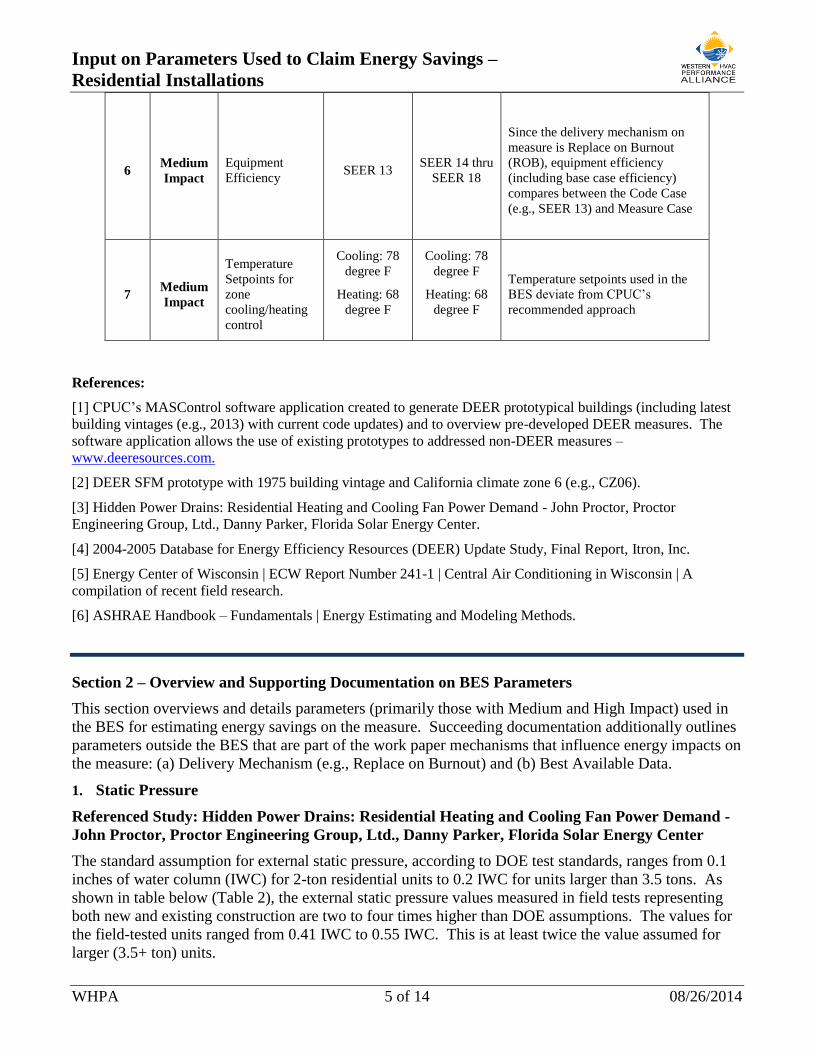
6 Medium
Impact
Equipment
Efficiency SEER 13
SEER 14 thru
SEER 18
Since the delivery mechanism on
measure is Replace on Burnout
(ROB), equipment efficiency
(including base case efficiency)
compares between the Code Case
(e.g., SEER 13) and Measure Case
7 Medium
Impact
Temperature
Setpoints for
zone
cooling/heating
control
Cooling: 78
degree F
Heating: 68
degree F
Cooling: 78
degree F
Heating: 68
degree F
Temperature setpoints used in the
BES deviate from CPUC’s
recommended approach
References:
[1] CPUC’s MASControl software application created to generate DEER prototypical buildings (including latest
building vintages (e.g., 2013) with current code updates) and to overview pre-developed DEER measures. The
software application allows the use of existing prototypes to addressed non-DEER measures –
www.deeresources.com.
[2] DEER SFM prototype with 1975 building vintage and California climate zone 6 (e.g., CZ06).
[3] Hidden Power Drains: Residential Heating and Cooling Fan Power Demand - John Proctor, Proctor
Engineering Group, Ltd., Danny Parker, Florida Solar Energy Center.
[4] 2004-2005 Database for Energy Efficiency Resources (DEER) Update Study, Final Report, Itron, Inc.
[5] Energy Center of Wisconsin | ECW Report Number 241-1 | Central Air Conditioning in Wisconsin | A
compilation of recent field research.
[6] ASHRAE Handbook – Fundamentals | Energy Estimating and Modeling Methods.
Section 2 – Overview and Supporting Documentation on BES Parameters
This section overviews and details parameters (primarily those with Medium and High Impact) used in
the BES for estimating energy savings on the measure. Succeeding documentation additionally outlines
parameters outside the BES that are part of the work paper mechanisms that influence energy impacts on
the measure: (a) Delivery Mechanism (e.g., Replace on Burnout) and (b) Best Available Data.
1. Static Pressure
Referenced Study: Hidden Power Drains: Residential Heating and Cooling Fan Power Demand -
John Proctor, Proctor Engineering Group, Ltd., Danny Parker, Florida Solar Energy Center
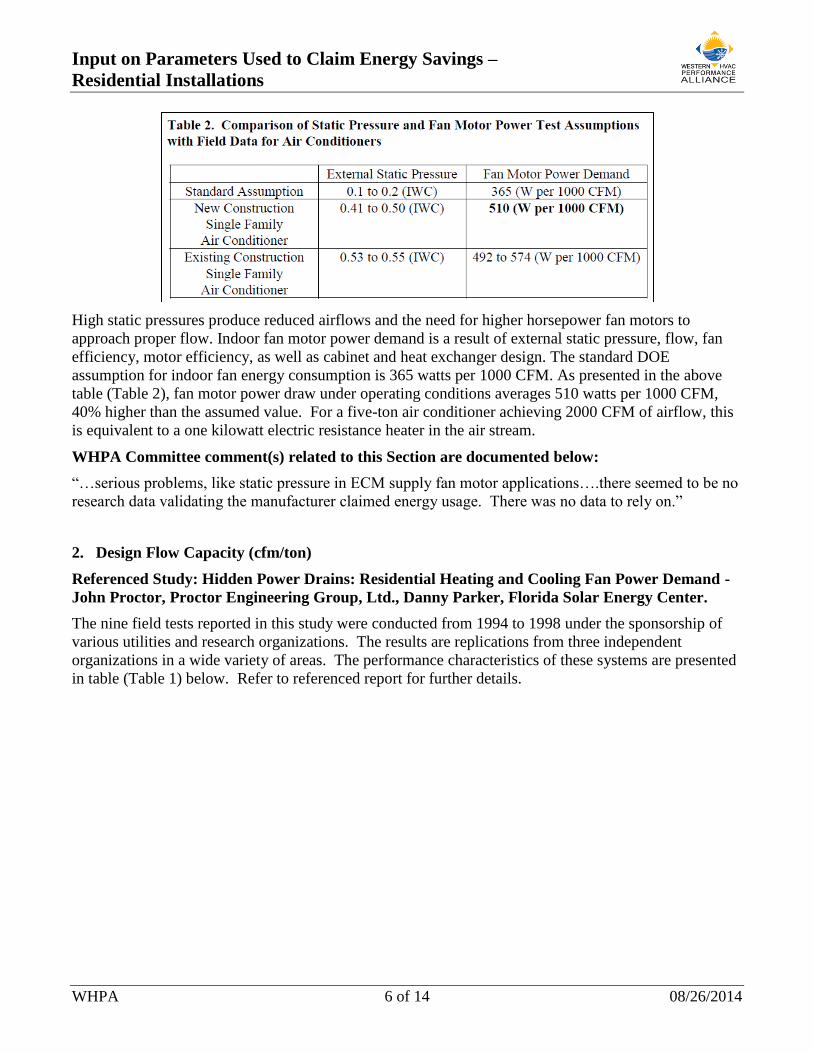
The standard assumption for external static pressure, according to DOE test standards, ranges from 0.1
inches of water column (IWC) for 2-ton residential units to 0.2 IWC for units larger than 3.5 tons. As
shown in table below (Table 2), the external static pressure values measured in field tests representing
both new and existing construction are two to four times higher than DOE assumptions. The values for
the field-tested units ranged from 0.41 IWC to 0.55 IWC. This is at least twice the value assumed for
larger (3.5+ ton) units.
Input on Parameters Used to Claim Energy Savings –
Residential Installations
WHPA 6 of 14 08/26/2014
High static pressures produce reduced airflows and the need for higher horsepower fan motors to
approach proper flow. Indoor fan motor power demand is a result of external static pressure, flow, fan
efficiency, motor efficiency, as well as cabinet and heat exchanger design. The standard DOE
assumption for indoor fan energy consumption is 365 watts per 1000 CFM. As presented in the above
table (Table 2), fan motor power draw under operating conditions averages 510 watts per 1000 CFM,
40% higher than the assumed value. For a five-ton air conditioner achieving 2000 CFM of airflow, this
is equivalent to a one kilowatt electric resistance heater in the air stream.
WHPA Committee comment(s) related to this Section are documented below:
“…serious problems, like static pressure in ECM supply fan motor applications….there seemed to be no
research data validating the manufacturer claimed energy usage. There was no data to rely on.”
2. Design Flow Capacity (cfm/ton)
Referenced Study: Hidden Power Drains: Residential Heating and Cooling Fan Power Demand -
John Proctor, Proctor Engineering Group, Ltd., Danny Parker, Florida Solar Energy Center.
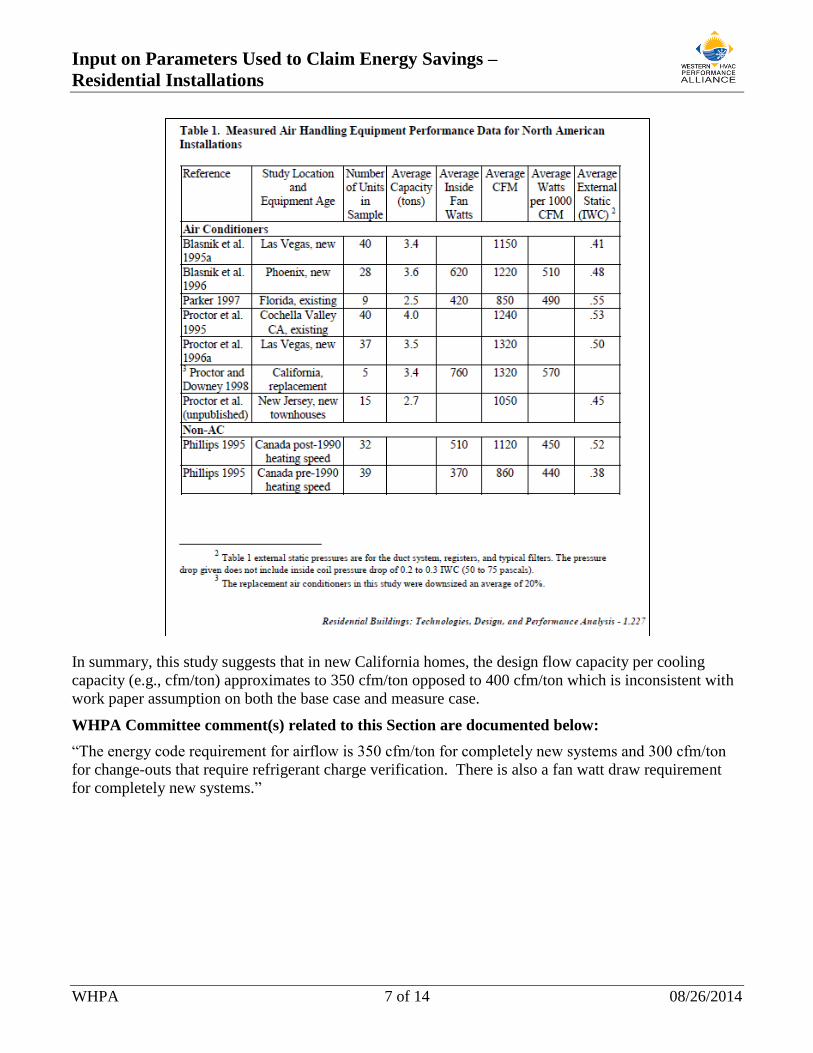
The nine field tests reported in this study were conducted from 1994 to 1998 under the sponsorship of
various utilities and research organizations. The results are replications from three independent
organizations in a wide variety of areas. The performance characteristics of these systems are presented
in table (Table 1) below. Refer to referenced report for further details.
Input on Parameters Used to Claim Energy Savings –
Residential Installations
WHPA 7 of 14 08/26/2014
In summary, this study suggests that in new California homes, the design flow capacity per cooling
capacity (e.g., cfm/ton) approximates to 350 cfm/ton opposed to 400 cfm/ton which is inconsistent with
work paper assumption on both the base case and measure case.
WHPA Committee comment(s) related to this Section are documented below:
“The energy code requirement for airflow is 350 cfm/ton for completely new systems and 300 cfm/ton
for change-outs that require refrigerant charge verification. There is also a fan watt draw requirement
for completely new systems.”
Input on Parameters Used to Claim Energy Savings –
Residential Installations
WHPA 8 of 14 08/26/2014
3. Duct Leakage
Referenced Study: 2004-2005 Database for Energy Efficiency Resources (DEER) Update Study,
Final Report, Itron, Inc.
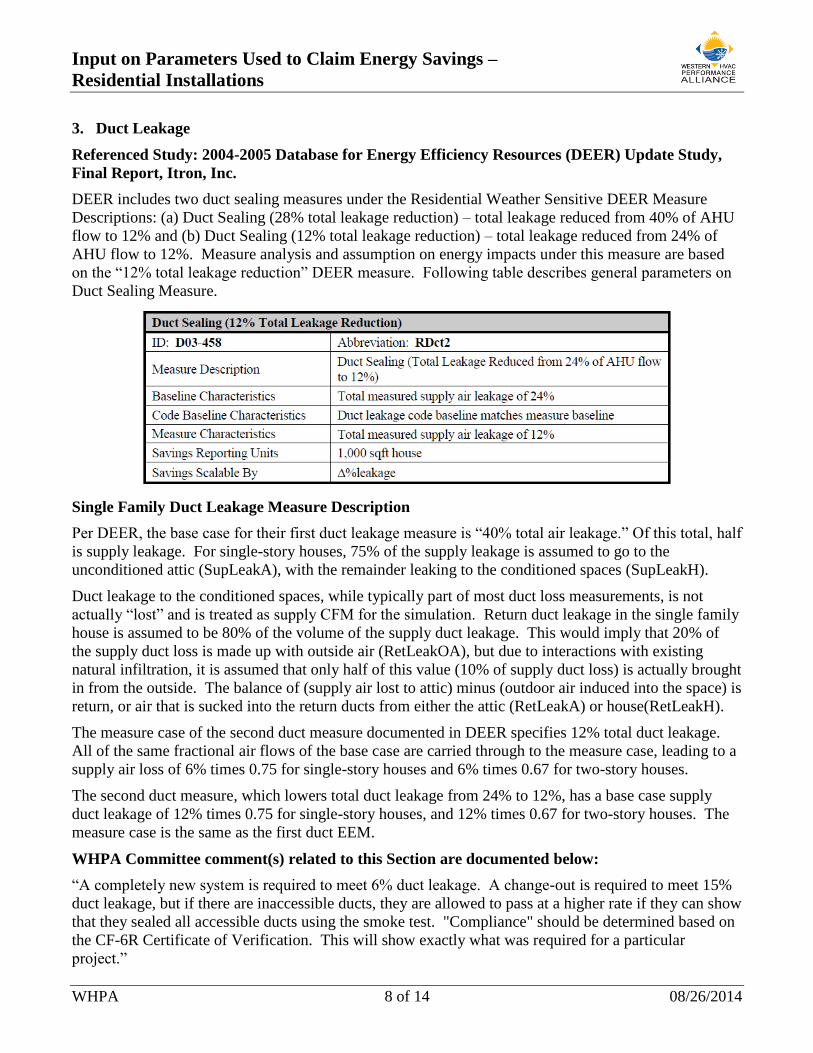
DEER includes two duct sealing measures under the Residential Weather Sensitive DEER Measure
Descriptions: (a) Duct Sealing (28% total leakage reduction) – total leakage reduced from 40% of AHU
flow to 12% and (b) Duct Sealing (12% total leakage reduction) – total leakage reduced from 24% of
AHU flow to 12%. Measure analysis and assumption on energy impacts under this measure are based
on the “12% total leakage reduction” DEER measure. Following table describes general parameters on
Duct Sealing Measure.
Single Family Duct Leakage Measure Description
Per DEER, the base case for their first duct leakage measure is “40% total air leakage.” Of this total, half
is supply leakage. For single-story houses, 75% of the supply leakage is assumed to go to the
unconditioned attic (SupLeakA), with the remainder leaking to the conditioned spaces (SupLeakH).
Duct leakage to the conditioned spaces, while typically part of most duct loss measurements, is not
actually “lost” and is treated as supply CFM for the simulation. Return duct leakage in the single family
house is assumed to be 80% of the volume of the supply duct leakage. This would imply that 20% of
the supply duct loss is made up with outside air (RetLeakOA), but due to interactions with existing
natural infiltration, it is assumed that only half of this value (10% of supply duct loss) is actually brought
in from the outside. The balance of (supply air lost to attic) minus (outdoor air induced into the space) is
return, or air that is sucked into the return ducts from either the attic (RetLeakA) or house(RetLeakH).
The measure case of the second duct measure documented in DEER specifies 12% total duct leakage.
All of the same fractional air flows of the base case are carried through to the measure case, leading to a
supply air loss of 6% times 0.75 for single-story houses and 6% times 0.67 for two-story houses.
The second duct measure, which lowers total duct leakage from 24% to 12%, has a base case supply
duct leakage of 12% times 0.75 for single-story houses, and 12% times 0.67 for two-story houses. The
measure case is the same as the first duct EEM.
WHPA Committee comment(s) related to this Section are documented below:
“A completely new system is required to meet 6% duct leakage. A change-out is required to meet 15%
duct leakage, but if there are inaccessible ducts, they are allowed to pass at a higher rate if they can show
that they sealed all accessible ducts using the smoke test. "Compliance" should be determined based on
the CF-6R Certificate of Verification. This will show exactly what was required for a particular
project.”

Input on Parameters Used to Claim Energy Savings –
Residential Installations
WHPA 9 of 14 08/26/2014
4. Sizing – HVAC Equipment Sizing
The procedures of residential HVAC design (sizing) are covered in detail by a series of publications
produced by the Air Conditioning Contractors of America (ACCA), which in turn references
information provided by the American Society of Heating, Refrigerating and Air-Conditioning
Engineers (ASHRAE). The heat loss and gain values are estimated using the procedures from the
ACCA Manual J—Residential Load Calculation (Manual J) (Rutkowski 2006). Manual J applies only
to single-family detached dwellings, low-rise condominiums, and townhouses.
Mechanical equipment selection is done with the aid of the ACCA Manual S—Residential Equipment
Selection (Manual S) (Rutkowski 1995). Selecting equipment based on the cooling load may lead to a
furnace that is oversized for the heating load. Manual S recommends that the furnace size remains
within 140% of the peak heating load estimate and that cooling equipment capacity not exceed the total
load by more than 15%.
It should be recognized that in energy-efficient houses, the loads may be so small that the standard
manufacturer’s range of capacities exceeds these percentages (or in some cases, the capacity of the
HVAC equipment stocked by the Distributor exceeds design load requirements). For example, if a
house has a 19,000 Btu/h cooling load and manufacturer’s equipment is available in only 17,500 Btu/h
and 23,400 Btu/h, the larger unit is more than 15% oversized. However, the larger unit should be the
equipment selected to ensure the peak load will be met. Designers may want to consider multispeed
equipment in these cases, where the system runs more frequently at a lower capacity to more closely
meet the load for more times of the year.
Referenced Study 1: Energy Center of Wisconsin, Report Number 241-1 | Central Air
Conditioning in Wisconsin | A compilation of recent field research | May 2008
Per referenced study, while Manual J calculations indicate that most systems are appropriately sized to
within ½ ton, monitoring data suggest that most systems are in fact oversized: empirically-based sizing
estimates indicate that about a quarter of systems are appropriately sized, a third are oversized by ½ ton,
and 40 percent are oversized by a ton or more. Only one of 39 systems evaluated appeared to be
undersized. Following figure (Figure 5) depicts empirical estimates of relative sizing per referenced
study.
Input on Parameters Used to Claim Energy Savings –
Residential Installations
WHPA 10 of 14 08/26/2014
Referenced Study 2: Peak Demand and Energy Savings from Properly Sized and Matched Air
Conditioners - Robert Mowris and Ean Jones, Verified, Inc.
This study indicates that research studies have shown that 50 to 70 percent (%) of residential and
commercial air conditioning systems are oversized by 120% or more (James, et al 1997; Sonne, et al
2006; Mowris, 2006; Nadel 1998; Parker 1993; Jacobs 2003; Felts 1998; ACCA 2006). Air
conditioners are typically oversized to compensate for installation design flaws and defects, such as
cooling equipment installed in hot attics, leaky ducts, improper refrigerant charge and airflow (RCA),
improper maintenance, or mismatched evaporator and condenser coils (Mowris et al 2007).
This study further suggests that most air conditioning contractors in the United States do not know how
to use the Air Conditioner Contractors of America (ACCA) Manual J sizing guidelines to specify and
install properly sized air conditioners (Vieira, et al 1996; Mowris 2006).
Sizing Methods in Building Energy Simulation Tools
Sizing methods in most Building Energy Simulation tools are per ASHRAE Standard 90.1, Appendix G,
Performance Rating Method, Building Performance Calculation, Equipment Capacities, “The equipment
capacities (i.e., system coil capacities) for the baseline building design shall be based on sizing runs for
each orientation and shall be oversized by 15% for cooling and 25% for heating, i.e., the ratio between
the capacities used in the annual simulations and the capacities determined by the sizing runs shall be
1.15 for cooling and 1.25 for heating.
Note that eQuest/DOE2.2 includes an “auto-size” flow input parameter defaulted to 1.15. The same can
be override to “0” for excluding “auto-size”
eQuest/DOE2.2 additionally includes a “cooling” SIZING-RATIO input parameter. A multiplier on the
capacity of the cooling coil that allows you to modify the capacity of the cooling coil without changing
the system air flow rates. See SIZING-RATIO, above, which multiplies both coil capacities and air
flow rates. If SIZING-RATIO is also specified, the net multiplier on the capacity of the cooling coil is
[COOL-SIZING-RATI] x [SIZING-RATIO]. This parameter is defaulted to 1.0.
DOE2 based building simulation software (including eQuest) use the Weighting Factor method. The
Weighting Factor method of calculating instantaneous space sensible load is a compromise between
simpler methods (e.g., steady-state calculation) that ignore the ability of building mass to store energy,
and more complex methods (e.g., complete energy balance calculation). With this method, space heat
gains at constant space temperature are determined from a physical description of the building, ambient
weather conditions, and internal load profiles.
WHPA Committee comment(s) related to this Section are documented below:
a. “I think doing Manual J’s and D’s for the 16 CZs could be useful and would take care of a number
of the comments above. Set the sizes in DOE2 with those procedures instead of using DOE2 auto
sizing. The calcs would be the same for the prototypes in each CZ except the design days. Using J &
D sizes and static pressures could go a long ways towards proving the effectiveness of QI because
you could get up to the 500 cfm/ton range and down to the 0.6 in H20 static. For the QI runs, you
could use J & D. Then for the non-QI runs, instead of guessing at typical oversize maybe see what
oversizing you end up with if you employ common mistakes in your sizing like sizing at a 70%
SHR, or if you’re daring, sizing with “rules of thumb””

Input on Parameters Used to Claim Energy Savings –
Residential Installations
WHPA 11 of 14 08/26/2014
b. “…expressed concern for the DOE2.2 modeling. When he'd looked at the code several years before,
modeling was largely based on R-22 refrigerant systems. He'd tried to examine the formulas and
had concluded that they did not track R-410A systems well at all. The glide paths were very
different for differing refrigerants. Maybe it had been updated, when he'd run the numbers back
then, the results were off by several orders of magnitude. EER of R-410A systems dropped off
much faster than with R-22 systems. R-22 systems could achieve higher EER levels in the desert
than R-410A systems. If you replaced an R-22 10 SEER system with a 13 SEER R410A system,
that might actually result in a negative EER, a loss of system efficiency. Rather than depend upon
blind faith in DOE 2.2, he'd rather be re-assured that the software had been updated to process
different systems differently and accurately. Installing a new R-410A system and plugging in R-22
system information would result in bad data.”
c. “Regarding slide 9 and the criteria considered for a poor installation, he believed there was a place
for refrigeration charge assessment. You'd need to have a properly charged system to get maximum
efficiency. One thing he thought was missing was performance of the entire system within the
structure. He thought there was a benefit from delivered EER and delivered capacity for a properly
designed and installed system which would never be captured from the four individual criteria
considered in isolation.”
d. “As a contractor in the program, he was doing far more early retirement installations than replace on
burnout ones. And, a majority of the systems being replaced were more than 20% oversized,
normally by a ton or more. On slide 9, he saw criteria 2,3 and 4 were all tied together. They always
used Manual D in the system design to avoid those issues. Those criteria were all interconnected.
Low duct sizing had impact on low airflow rates which also increased system static pressure. He
agreed with Chris's earlier comment that delivered performance, not just system output performance,
needed more attention within the program.”
e. “The code requirement for sizing only applies to completely new systems or adding A/C to an
existing system that does not have it. If replacing like-for-like in an existing system, there is no
sizing requirement. ACCA Manual J is the load calculation methodology. ACCA Manual S is the
equipment sizing methodology. Both are required to properly size equipment. What is meant by
"oversized by 13 percent"? Does it mean sensible cooling capacity vs. sensible cooling load? Isn't
there a recent study (Wilcox, Proctor, Chitwood, etc.) that showed that oversizing the equipment is
not the real problem, but under sizing the ducts is? Perhaps a more important question would be:
What is the installed capacity and efficiency vs. the optimal capacity and efficiency? In other words,
rather than worrying about capacity vs. load, maybe we should worry about installed
capacity/efficiency vs. optimal capacity/efficiency.”
f. “…if you used auto-sizing with California conditions, you'd predict a piece of equipment with a
much higher sensible heat ratio than equipment was designed to give in other locations. When they
do their sizing, they look at their peak sensible load and then size the equipment to meet the sensible
load at a name plate sensible heat ratio like .75. They didn't use the DOE2 auto-sizing algorithms
right out of the box. They (eQuest) maintained the sensible heat ratio during the auto-sizing.”

Input on Parameters Used to Claim Energy Savings –
Residential Installations
WHPA 12 of 14 08/26/2014
5. Thermostat Setpoint (DEER/Residential Appliance Saturation Survey)
Temperature setpoints in the energy model (eQuest) for HVAC equipment control were programmed as
78.0 degree F for cooling and 68.0 degree F for heating. Temperature setpoints used for estimating
energy impacts on measure (e.g., 78 degree F cooling and 68 degree F heating) are consistent with those
reported and summarized in SCE’s study1 directed by J. Hirsch & Associates under “Summary of
RASS2 reported Thermostat Set Points” (derived from RASS database by house type, geographic region,
and thermostat type for households with central air conditioning) with standard temperature setpoints
averaging 75.1 degree F for cooling and 66.6 degree F for heating.
Further, temperature setpoints used for evaluating energy impacts in this referenced study match those
used in the work paper measure (e.g., 78 degree F cooling and 68 degree F heating) under “medium”
occurrence (e.g., 77 to 80 F cooling and 66 to 70 F heating RASS bin).
Specific direction from Energy Division’s on Temperature Setpoints to be used in the energy model
(eQuest) when estimating non-DEER impact is such that “The residential thermostats schedules were
developed as part of the calibration process so that baseline residential results in DEER reasonably
matched heating and cooling end uses published in RASS (Residential Appliance Saturation Survey).
Therefore, these schedules must be used in the development of any non-DEER measures. Residential
results must be determined by simulating all five residential thermostat schedules, then weighting
together the results using the weights for each climate zone and vintage. Climate zone and vintage
weights are included with the DEER documentation available from www.deeresources.com.”
Suggested direction from the Energy Division on using multiple temperature setpoint schedules to
address RASS increases the building simulation time and resources in addition to the added complexity
to the energy building simulation and data analysis process. The suggested approach can be somehow
optimized by the implementation of a batch process using a single building simulation model.
6. Delivery Mechanism
The delivery mechanism used for this measure is Replacement on Burnout (ROB). ROB measures
replace existing equipment with more energy efficient equipment on failure of the existing equipment.
The delivery mechanism on the measure is different than that from a Retrofit (RET) in which, the
measure replaces existing equipment that is working and has Remaining Useful Life (RUL) with new,
energy efficient equipment. RET can also apply to situations where the customer would have not taken
action to replace their current inefficient equipment without program involvement such as direct install
program measures. RET measures have two savings periods, one for the RUL period of the existing
equipment noted as the first baseline period and one for the EUL-RUL of the new equipment noted as
the second baseline period.
1 Programmable Thermostats Installed into Residential Buildings: Predicting Energy Saving Using Occupant Behavior &
Simulation, Southern California Edison - Design & Engineering Services 2 California Residential Appliance Saturation Study, Prepared for the California Energy Commission by KEMA, Inc.
Input on Parameters Used to Claim Energy Savings –
Residential Installations
WHPA 13 of 14 08/26/2014
WHPA Committee comment(s) related to this Section are documented below:
a. “I think the group comments were clear. Rather than Replace on Burnout representing a large
majority of the baseline systems being assumed by CPUC/ED, several members commented on the
majority of RQI program participants replacements were a result of voluntary retrofit rather than a
failed system. HUGE shift. What's the impact of that shift?”
b. “If 80% were retrofit rather than ROB, what effect would that have on NTG or other program
evaluation measures?”
c. “Regarding Customer Average (1st Baseline), what % of baseline installations does the CPUC/ED
assume was code compliant? 100%? If Jarred Metoyer, KEMA, was correct in his May
presentation that Title 24 code compliant systems seemed hardly any or no better in performance
than non-compliant installations, then RQI Installations should be compared to older, poorly
installed, almost entirely non-code compliant existing home installation performance levels.”
d. What exactly is meant by a "retrofit HVAC installation"? There are two distinct kinds, based on
how they are handled in the energy codes. One is a "completely new system", where essentially the
ducts and all of the equipment are new. The best example of this is a house that previously only had
a wall furnace and window air conditioners gets upgraded to a ducted central system (aka, "cut-in").
The other type is a "change-out" where only parts of an existing system are added or replaced.”
7. Best Available Data
WHPA Committee comment(s) related to this Section are documented below:
a. “Best available data" comment where outside sources are sought when there is no estimated savings
within DEER. This is a really big and important item. See the April ACTION item at the end of the
May meeting minutes. Jarred Metoyer committed to working with Nils Strindberg, now Pete Jacobs
for an interim, on the specific test-in/test-out data requirements necessary to assess 1) HVAC
equipment actual performance output to compare to manufacturer's rating and 2) HVAC system
performance delivered to the space, not just equipment output. This is at the CORE, in my opinion,
of moving from DEER formulas based on modeling and laboratory testing to real in-field
performance testing and system evaluation.”
b. “Are there ANY newer and reliable sources of existing home system performance evaluation? The
data used for the SCE RQI Work Paper was from research conducted about 10 years ago. Is there
any new, really reliable data which the CPUC/ED has conducted?”
c. “…suggested a placeholder to possibly also discuss the non-energy benefits associated with a quality
installation. Not all of the cost for the QI should be charged to energy savings, he proposed. Some
of the system and installation cost was a result of end user interest to improve comfort, system
reliability or other non-energy benefits. Not all of the cost should be "charged" to energy savings as
a total resource cost (TRC) of achieving those savings, he proposed. In his opinion, the home owner
was not just purchasing "energy savings." His experience was mostly with Energy Upgrade
California. Often, the TRC review found it was too difficult to quantify those other benefits which
should be charged for part of the installed cost. If ignored, the entire cost is charged against the
energy savings, put in the cost/savings test calculation. As a result, the program's cost effectiveness
ratio tanked and the program would be considered ineffective both by the IOU and by the
CPUC/ED.”
Input on Parameters Used to Claim Energy Savings –
Residential Installations
WHPA 14 of 14 08/26/2014
d. “…often the reason for the initial call was the drive for energy savings. When you got talking with
the customer, comfort turned out to be a major reason for upgrading the system. Their electrical
bills are high and they are uncomfortable. Many people are afraid to use their existing systems.
They've grown used to living with bad systems and don't know what comfort is. But, every
symptom they describe and were concerned about was comfort related. They would let the house
get to 85 degrees F then they run their system under a huge load at just the wrong time which
compounded the high energy costs.”


![[self tune]](https://img.dokumen.tips/doc/110x75/58ef40721a28ab163a8b46b3/self-tune.jpg)