Embed Size (px)
Citation preview


Abstract
This thesis is a part of a research project performed by two MS students, Zhouchi Li and
the author. The overall objective of the project is the design, implementation and
performance evaluation of algorithms for newborns localization and tracking in hospitals
using Apple iBeacon technology. Although we were working on the project together, I
lead performance evaluation of the in-room localization system using Cramer Rao Lower
Bound (CRLB). My partner, Zhouchi Li, leads modeling the path-loss of iBeacons and
presence detection algorithms. This thesis describes the project with a focus on my
individual contributions in CRLB analysis under different iBeacon deployment patterns as
well as performance evaluation using practical characteristics of shadow fading.
Today, Wi-Fi localization is the most popular indoor localization technique, which
provides an accuracy of a few meters to distinguish the presences in different rooms of a
building. With the recent introduction of iBeacon by Apple, possibility of more accurate
in-room localization has emerged for specific applications such as locating newborns
inside a hospital. The iBeacon uses Bluetooth Low Energy (BLE) technology that
broadcasts beacons with unique information to the nearby receivable devices such as
iPhone and android smart phones. The RSS of these beacons can be used to estimate the
location and to construct an in-room localization system.
In this thesis, we investigate in-room localization system using iBeacon for the newborns
in hospitals with an accuracy of about 1 meter. We firstly present an in-room localization
system using RSS from iBeacon. Then, based on the traditional Cramer-Rao Lower Bound
(CRLB) we analyze the optimal deployment strategy for different iBeacon deployment
patterns in the nursery room. Finally, we introduce a novel approach for calculation of the
CRLB which includes practical conditions to analyze the influence of variable variance of
shadow fading and coverage probability.


Acknowledgements
I would like to express my gratitude to my advisor Professor Kaveh Pahlavan who made
sure the thesis has 99 pages, 41 pictures and lots of formulas and thus made my master
thesis much more native and well organized.
My thanks are also due to my partner Zhouchi Li, who has worked with me in this project
for more than 1 year that without him I will never be able to complete this thesis.
Thanks also to my dear friend Julang Ying, who helped me a lot in the CRLB analysis part
that his math ability makes me better understand the meaning of CRLB and thus comes a
main part of my thesis.
More thanks to lots of friends, whenever I face a problem, there are always friends around
me that not only help me in solving the problem, but also keep my heart warm which
supports me to continue my research all the time.
That is all, great thanks to all my dears.

Contents
Abstract ........................................................................................................................... 2
Acknowledgements ............................................................................................................... 3
Contents ........................................................................................................................... 4
List of Figures ...................................................................................................................... 7
List of Table ....................................................................................................................... 10
Chapter 1 Introduction ...................................................................................................... 1
1.1 Project background and motivation ......................................................................... 1
1.2 Contributions of this thesis ................................................................................... 2
1.3 Thesis outlines .......................................................................................................... 3
Chapter 2 Backgrounds in in-room localizations............................................................... 4
2.1 IBeacon and BLE communication ........................................................................... 4
2.2 Fading margin and shadow fading ......................................................................... 11
2.3 In-room presence detection .................................................................................... 15
2.4 In-room localization in hospitals ............................................................................ 16
2.5 Cramer–Rao bound ................................................................................................ 20
Chapter 3 Algorithms for intelligent in-room presence detection using iBeacon ........... 22
3.1 Ibeacon application development ....................................................................... 22

3.1.1 Development using objective C .................................................................. 24
3.1.2 Self-developed application .......................................................................... 26
3.2 Two approaches of presence detection ................................................................... 27
3.2.1 Double iBeacons approach .......................................................................... 29
3.2.2 Single iBeacon approach ............................................................................. 31
3.2.3 Comparison ................................................................................................. 32
Chapter 4 Methodology and discussion for in-room Localization using iBeacon ........... 34
4.1 Path-loss modeling ............................................................................................... 34
4.1.1 RSSI data collection system ........................................................................ 34
4.1.2 Modeling and validation .............................................................................. 35
4.1.3 Discussion of path-loss modeling ............................................................... 38
4.2 Scenarios and algorithms of in-room Localization .............................................. 39
4.3 Methodology for performance evaluation .............................................................. 40
4.3.1 Scenarios for performance evaluation ......................................................... 41
4.3.2 Localization error estimation of deployment patterns ................................. 42
4.3.3 CRLB for performance evaluation in 3D. ................................................... 44
4.4 Effect analysis of different deployment methods ................................................... 46
4.4.1 Effect of different deployment patterns. ..................................................... 46
4.4.2 Effect of different number of iBeacons ....................................................... 48

Chapter 5 Performance evaluation for in-room localization technology using iBeacon . 51
5.1 Coverage possibility ............................................................................................... 52
5.2 CRLB with coverage probability and variable shadow fading .............................. 56
5.3 Discussions in CRLB with coverage probability and variable shadow fading ...... 61
5.3.1 Comparison with traditional CRLB ............................................................ 61
5.3.2 Relationship between iBeacon coverage and room size ............................. 64
Chapter 6 Conclusions and future works ......................................................................... 68
Bibliography ......................................................................................................................... 70
Appendix ......................................................................................................................... 78
A. Matlab code for path-loss modeling and Cramer-Rao lower bound calculation: 78
B. Matlab code for Cramer-Rao lower bound considering coverage probability and
variable shadow fading: ............................................................................................... 82

7
List of Figures
Figure 2.1 Menu of Estimote iBeacon application 1…………………….….………….…...6
Figure 2.2 Menu of Estimote iBeacon application 2……………………………...………...7
Figure 2.3 Menu of Estimote iBeacon application 3…………………………………...…...8
Figure 2.4 Frame of iBeacon communication 1…………………………….…………........9
Figure 2.5 Frame of iBeacon communication 2…………………………………………...10
Figure 2.6 Relationship between variable shadow fading and distance …………...……...12
Figure 3.1 Frame of iBeacon application development …….…….…………..…………...23
Figure 3.2 Menu of self-developed iBeacon application………….…………..…………...24
Figure 3.3 Menu of coding in Objective-C ……………………….…………..…………...25
Figure 3.4 Menu of receiving data in server ………………………………….…………...26
Figure 3.5 Menu of server by using Python ……………………………….......…….…....27
Figure 3.6 Algorithm for presence detection using 2 iBeacons………………...…………28
Figure 3.7 Algorithm for presence detection using 1 iBeacon……………………..……...29
Figure 3.8 RSSI plot for double iBeacon approach, for the MH entering
movement ………………………………………………………….…………..…..……...30
Figure 3.9 RSSI plot for double iBeacon approach, for the MH opening the door without
entering/leaving ………………………………………………………….…………..…....30

8
Figure 3.10 RSSI plot for single iBeacon approach, for the MH entering
movement ………………………………………………………….…………..………….32
Figure 3.11 RSSI plot for various iPhone positions ……………….…………..…..……...33
Figure 4.1 Two path-loss models comparison …………………………………………….36
Figure 4.2 Comparison of cumulative distribution functions of distance measurement error
in two models ……………………………………………………………..………….........37
Figure 4.3 Scenario for in-room localization …………………………..……..…………...39
Figure 4.4 Scenario of RSS ranging localization ………………...…………..…………...40
Figure 4.5 Scenarios of different deployment methods ………………..……..…………...41
Figure 4.6 Contour of estimate location error in 2D in scenario 1………………………...43
Figure 4.7 Contour of estimate location error in 2D in scenario 2………………………...43
Figure 4.8 Contour of estimate location error in 2D in scenario 3………………………...44
Figure 4.9 Contour of estimate location error in 3D ……………………………………...46
Figure 4.10 Comparison of cumulative distribution functions of CRLB in 3 different
deployment patterns ……………………………………………………………..………...47
Figure 4.11 Contour of estimate location error of 3 iBeacons …………….…....………...48
Figure 4.12 Contour of estimate location error of 4 iBeacons ………………....…….…...49
Figure 4.13 Contour of estimate location error of 5 iBeacons ……………………….…...49
Figure 4.14 Comparison of cumulative distribution functions of CRLB in different number
of iBeacons ………………………………………………………….……..…....………...50

9
Figure 5.1 Relationships between coverage possibility and distance ……….....……….....53
Figure 5.2 CRLB under practical conditions with different number of access points …....59
Figure 5.3 CRLB under practical conditions with all 4 access points ………………….....60
Figure 5.4 Scenario of localization using 4 iBeacons ………………………....……….....61
Figure 5.5 CRLB under practical conditions with 4 iBeacons …………...…....……….....62
Figure 5.6 Traditional CRLB with 4 iBeacons ……...…………….………….......…….....62
Figure 5.7 Comparison of cumulative distribution functions of traditional CRLB and
CRLB under practical conditions ………………………………………………………....63
Figure 5.8 Mean of CRLB under practical conditions versus reliable coverage rate (reliable
iBeacon coverage divided by room size)………………………………….…....……….....65
Figure 5.9 Standard variance of CRLB under practical conditions versus reliable coverage
rate (reliable iBeacon coverage divided by room size)………………………………........66
Figure 5.10 Comparison of cumulative distribution functions of CRLB under practical
conditions in different reliable coverage rates ………………………..………....…….......67

10
List of Table
Table 3.1 Performance of proposed in-room presence detection approaches …....…….....32
Table 4.1 Parameters of two different path-loss models ……………….……………........38
Table 4.2 Distance measurement error comparison of two models ……………….….......38
Table 4.3 Comparison of CRLB in 3 different deployment patterns ………………..........47
Table 4.4 Comparison of CRLB in different number of iBeacon ……………….………..50
Table 5.1 Mean and standard variance of cumulative distribution functions of traditional
CRLB and CRLB under practical conditions ……………….………………………….....64

1
Chapter 1
Introduction
IBeacon is a class of Bluetooth Low Energy (BLE) devices introduced by Apple in 2013
that broadcast unique information to the nearby receivable devices. There are 3 parts in this
unique information packet: Universally Unique Identifier (UUID), major, and minor which
can all be defined by the users. Once these iBeacons are detected, the receivers are able to
estimate the proximity according to the Received Signal Strength (RSS) of the iBeacon. In
brief, iBeacon functions like the ancient beacon in the ocean except sending Bluetooth Low
Energy signal rather than light to the receivers. Compared with traditional Bluetooth
technology, BLE is intended to have similar coverage area while less power consumption.
This makes it possible that iBeacon can be used for several years without changing battery.
Furthermore, it is not necessary for such devices using BLE signal to pair with each other
before they communicate. Nowadays almost all the smart phones, like iPhone, Android and
Blackberry, are compatible with BLE technology which indicates that they can all
collaborate with iBeacons. More importantly, there is no need for us to install special BLE
receivers for iBeacon since almost everyone owes a smart phone. IBeacon has many
location-based applications. One of the most outstanding aspects that attracts more and
more industries’ attention is to develop indoor positioning systems. Not only Apple but
enterprises such as Qualcomm, PayPal, and SKT are looking forward to face another
evolution by partnering with newest devices such as iBeacon.
1.1 Project background and motivation
There exist some differences between iBeacon and other traditional indoor localization
technologies. First of all, the signal that iBeacon transmits is a one-way broadcast, which

2
means only the receiving devices can get information from iBeacon, but they cannot send
back any information to iBeacon. Second, users are required to install an application on
their receiving devices (smartphones) to receive BLE signal, which will help them to
protect their privacy because only the applications rather than iBeacons my obtain their
position information.
Even though outdoor localization is quite mature and has been implemented in our daily
life such as the vehicle navigation with the advancement of localization technology, there
are a huge amount of indoor smartphone applications which demonstrate an intense need to
the position information of the users, so that plenty of position-based applications are
achievable. However, traditional outdoor localization technologies cannot solve this
problem successfully like GPS performs awful in indoor environment that is why we focus
on in-room localization using iBeacon.
1.2 Contributions of this thesis
This thesis is a part of a research project performed by two MS students, Zhouchi Li and
the author. The overall objective of the project is the design, implementation and
performance evaluation of algorithms for newborns localization and tracking in hospitals
using Apple iBeacon technology. During this project, we have already submitted two
conference papers:
1. Yang Yang, Zhouchi Li and Kaveh Pahlavan, "Using iBeacon for intelligent in-
room presence detection”, 2016 IEEE CogSIMA, San Diego, CA, Mar. 2016.
2. Zhouchi Li, Yang Yang and Kaveh Pahlavan, “Using iBeacon for Newborns
Localization in Hospitals”, 2016 IEEE 10th ISMICT, Worcester, MA, Mar. 2016.
Although we were working on the project together, I lead performance evaluation of the in-

3
room localization system using Cramer Rao Lower Bound (CRLB). My partner, Zhouchi
Li, leads modeling the path-loss of iBeacons and presence detection algorithms. This thesis
describes the project with a focus on my individual contributions in two major aspects:
Analyze the optimal deployment strategy for different iBeacon deployment patterns in the
nursery room and introduce a novel approach for calculation of the CRLB which includes
practical conditions to analyze the influence of variable variance of shadow fading and
coverage probability.
1.3 Thesis outlines
In this thesis, we investigate in-room localization system using iBeacon with an accuracy
of about 1 meter. In chapter 1, we give a brief introduction to the motivation, contributions
and outlines of this thesis. In chapter 2, backgrounds about iBeacon and BLE
communications, fading margin and shadow fading, in-room presence detection and
localization as well as Cramer Rao bound are presented. In chapter 3, a self-developed
application is demonstrated and 2 algorithms are constructed by my partner Zhouchi Li and
me to build a presence detection system that can inform us the number of people in a room.
Then we focus on in-room localization which is described in chapter 4 and 5 to find out the
positions of each people, considered as the next stage of our project. In chapter 4,
methodology and discussion for in-room localization using iBeacon are presented. After
path-loss modeling we compare the cumulative distribution functions (CDF) of the error in
different deployment patterns as well as different number of iBeacons to find out the best
deployment method of iBeacons. In chapter 5, we analyze the Cramer-Rao Lower Bound
(CRLB) of localization considering coverage probability and variable shadow fading to
evaluate the performance of in-room localization using iBeacon. Not only detailed analyses
but also simulation results are illustrated in order to support our claims. In chapter 6, we
make conclusions of the whole thesis and demonstrate our future works.

4
Chapter 2
Backgrounds in in-room localizations
Accurate in-room positioning information makes it possible to revolutionize the way
people search, locate and navigate to points of interest inside rooms that is similar to how
GPS revolutionized the way people navigate outdoors [1][2]. For instance, a mobile
holder (MH) in a mall could leverage his mobile device to instantly search, locate and
navigate with real-time directions to any store in the mall based on amateur indoor
localization technology. In in-room scenario, the MH could automatically receive
directions to the exact section where the desired product locates. Meanwhile, businesses
and advertisers could push coupons and offers to the MH based on his position
simultaneously insider a store to maximize customer shopping effectiveness [2]. Enabling
such scenario has been challenging mainly due to the unreliability of GPS localization in
indoor or in-room environments [3][4]. Due to the absence of GPS, we basically utilize
iBeacons to complete in-room localization by using RSS-based localization technology
which is similar to Wi-Fi localization. In this chapter, we introduce some backgrounds
about iBeacon and its BLE communication, fading margin, in-room presence detection,
in-room localization and Cramer–Rao bound that are useful in better understanding this
thesis.
2.1 IBeacon and BLE communication
Presence detection is a common application for smart phones, which may contribute to
energy-efficient intelligent lighting control, smart heating and air-conditioning, home

5
security system and etc. In public area, the in-room presence detection technologies can
be also used to count the registration and check-in of an event. Existing literature
introduces two major technical trends to implement in-room presence detection systems.
At the beginning stage, the research community mounts various sensors to the room
ceiling and tries to cover the room as much as possible. Sujin et. al [5], proposed a digital
camera and image processing based presence detection system using intensity average
variation to detect moving objects; Neubiberg et. al [6], presents a 360o rotational camera
based approach to enhance the camera coverage.
The above mentioned first technical trend suffers from certain disadvantages. First and
foremost, the pre-deployment of the infrastructure is not unified. Take the PremaTM as an
example, only single sensor is required to cover a squared room but multiple sensors are
necessary for an irregularly shaped room. As a consequence, the infrastructure cost is
site-specific and it can goes exponentially high. To address that issue, the second trend
locates sensors only to the entrance of the room. Motion sensors and infrared sensors
[7][8] are attached to the room entrance to count either entering or leaving of the
individuals. Such techniques successfully cut down the cost but it still suffer the lack of
ability to identify the presented individuals.
IBeacon based system in this work is a potentially good choice without all above
imperfections. With highly limited cost and long enough battery life, iBeacon is able to
perform proximity estimation and at the same time identify the adjacent individuals. It
also carries various other additional functionalities such as smart advertising [9].
Considering the advantages of iBeacon, we propose to use iBeacon for presence detection
in this work.

6
Figure 2.1 Menu of Estimote iBeacon application 1

7
Figure 2.2 Menu of Estimote iBeacon application 2

8
Figure 2.3 Menu of Estimote iBeacon application 3
The manufacturer of iBeacon, Estimote Company, provides their own iBeacon APP,
which serves as a proximity estimator. The APP presents a graphic user interface (GUI) to
display the geometric relationship between the iPhone and surrounding iBeacons. It also
provides iBeacon ID, iBeacon status, distance between iBeacon and iPhone, iBeacon
sensor reading and other information.

9
Typical screenshots of this Estimote APP has been depicted in Figure 2.1- Figure 2.3. It is
very obvious that the Estimote APP has two major disadvantages considering the purpose
of this paper. (1) Originally the APP is not designed to perform presence detection; (2)
The APP fails to explicitly provide the RSSI reading. Given those disadvantages, it is
necessary to design our own APP to achieve intelligent in-room presence detection.
BLE communication consists primarily of “Advertisements”, or small packets of data,
broadcast at a regular interval by Beacons or other BLE enabled devices via radio waves
[10]. BLE Advertising is a one-way communication method. Beacons that want to be
“discovered” can broadcast, or “Advertise” self-contained packets of data in set intervals.
These packets are meant to be collected by devices like smartphones, where they can be
used for a variety of smartphone applications to trigger things like push messages, app
actions, and prompts. This overall frame can be viewed in Figure 2. 4 and Figure 2. 5.
Figure 2.4 Frame of iBeacon communication 1
Apple’s iBeacon standard calls for an optimal broadcast interval of 100 ms. Broadcasting
more frequently uses more battery life but allows for quicker discovery by smartphones

10
and other listening devices. Standard BLE has a broadcast range of up to 100 meters,
which make Beacons ideal for indoor location tracking and awareness.
Figure 2.5 Frame of iBeacon communication 2
With iBeacon, Apple has standardized the format for BLE Advertising. Under this format,
an advertising packet consists of four main pieces of information [10]:
UUID: This is a 16 byte string used to differentiate a large group of related beacons. For
example, if Coca-Cola maintained a network of beacons in a chain of grocery stores, all
ibeacons would share the same UUID. This allows Coca-Cola’s dedicated smartphone
app to know which beacon advertisements come from Coca-Cola-owned beacons.
Major: This is a 2 byte string used to distinguish a smaller subset of beacons within the
larger group. For example, if Coca-Cola had four beacons in a particular grocery store, all
four would have the same Major. This allows Coca-Cola to know exactly which store its
customer is in.
Minor: This is a 2 byte string meant to identify individual beacons. Keeping with the
Coca-Cola example, a beacon at the front of the store would have its own unique Minor.
This allows Coca-Cola’s dedicated app to know exactly where the customer is in the store.

11
Tx Power: This is used to determine proximity (distance) from the beacon. TX power is
defined as the strength of the signal exactly 1 meter from the device. This has to be
calibrated and hardcoded in advance. Devices can then use this as a baseline to give a
rough distance estimate.
2.2 Fading margin and shadow fading
In reality at a distance d we have a 50% probability of having adequate signal strength
(RSS that is larger than the receiver sensitivity). This is because the normally distributed
(in dB) shadow fading random variable can have a positive value with 50% probability
and that positive value increases the path loss beyond what was used for calculation of
the distance d. For a terminal located in distance d from the base station, we have a 50%
probability to operate with the required minimum signal strength. To increase this
probability one may add power to increase the probability of coverage at distance d. This
additional power is referred to as fading margin, and it is represented by Fσ [11].
We know that deviations of the average RSS from the best-fit line is caused by the
changes in the pattern of obstructions shadowing the direct transmission and for that
reason it is referred to as shadow fading. Shadow fading not only causes variations in the
average RSS at the same distance, as we move away from the transmitter along a straight
line, the power deviates randomly from the power predicted by the best fit line [12].
Therefore, shadow fading causes fluctuations in the average RSS when the distance is
kept fixed and deviations from the best linear fit to the RSS as we move away from the
transmitter.
In the former chapters of this thesis, all the shadow fading values, or the standard

12
variances of shadow fading, are considered as constants, typically we use 5 dB or 8 dB.
However, [13] shows the fact that the shadow fading values are related with the distance.
In his thesis, he introduced a statistical RF signal shadow fading model based on the
measurements in a typical office building. This model related the shadow fading to the
distance and uses two different distribution functions to approximate the shadow fading
between the breaking point. Since the ranging based RSS localization algorithm and the
fingerprint localization algorithm are widely used these days, we use this distance related
shadow fading model to the further analysis of its effect on these localization algorithms.
Based on their research, we can see the relationship in Figure 2.6:
Figure 2.6 Relationship between variable shadow fading and distance

13
This relationship can be fitted by this equation [13]:
σ = −4.28 × 𝑒−0.9372×𝑑+4.31
In reality, the shadow fading, which is used to reflect the complexity of the environment,
should be sensitive to the slight changes of the physical environment during the
experiment. Therefore, the shadow fading should be fluctuated when the distance
between the transmitter and receiver is changed. It is also what we use in the calculation
of revised CRLB in the section 5.2.
In wireless communications, fading is deviation of the attenuation affecting a signal over
certain propagation media. The fading may vary with time, geographical position or radio
frequency, and is often modeled as a random process. A fading channel is a
communication channel that experiences fading [11]. In wireless systems, fading may
either be due to multipath propagation, referred to as multipath induced fading, or due to
shadowing from obstacles affecting the wave propagation, sometimes referred to as
shadow fading.
Shadowing is the effect that the received signal power fluctuates due to objects
obstructing the propagation path between transmitter and receiver. These fluctuations are
experienced on local-mean powers, that is, short-term averages to remove fluctuations
due to multipath fading.
Experiments reported by Egli in 1957 showed that, for paths longer than a few hundred
meters, the received (local-mean) power fluctuates with a 'log-normal' distribution about
the area-mean power. By 'log-normal' is meant that the local-mean power expressed in
logarithmic values, such as dB or neper, has a normal (i.e., Gaussian) distribution.

14
Egli studied the error in a propagation model predicting the path loss, using only distance,
antenna heights and frequency. For average terrain, he reported a logarithmic standard
deviation of about s = 8.3 dB and 12 dB for VHF and UHF frequencies, respectively.
Such large fluctuations are caused not only by local shadow attenuation by obstacles in
the vicinity of the antenna, but also by large-scale effects (hills, foliage, etc.) along the
path profile, which cause attenuation. Hence, any estimate of the area-mean power which
ignores these effects may be coarse.
This log-normal fluctuation was called 'large-area shadowing' by Marsan, Hess and
Gilbert. They measured semi-circular routes in Chicago, thus fixing distance to the base
station, antenna heights and frequency, but measuring different path profiles. The
standard deviation of the path loss ranged from 6.5 dB to 10.5 dB, with a median of 9.3
dB. This 'large-area' shadowing thus reflects shadow fluctuations if the vehicle moves
over many kilometers.
In contrast to this, in most papers on mobile propagation, only 'small-area shadowing' is
considered: log-normal fluctuations of the local-mean power are measured when the
antenna moves over a distance of tens or hundreds of meters. Marsan et al. reported a
median of 3.7 dB for small area shadowing. Preller and Koch measured local-mean
powers at 10 m intervals and studied shadowing over 500 m intervals. The maximum
standard deviation experienced was about 7 dB, but 50% of all experiments showed
shadowing of less than 4 dB.
In a radio system, an allowance made so that a signal can fade up to a given amount,
while still maintaining overall performance at an acceptable level. For example, an RF
signal may be attenuated by a given number of decibels, yet sustain a signal-to-noise ratio

15
above a specified minimum. Also it is called fading margin which is a designed
allowance that provides for sufficient system gain or sensitivity to accommodate expected
fading, for the purpose of ensuring that the required quality of service is maintained. The
amount by which a received signal level may be reduced without causing system
performance to fall below a specified threshold value. It is mainly used to describe a
communication system such as satellite, for example a system like global star operates at
25-35 dB Fade margin. This fading margin in RSS based localization gives us a
suggestion about what is the reliability of locate result in such distance, based on which
we can calculate the detection possibility by access points or iBeacons.
2.3 In-room presence detection
IBeacon has many location-based applications. It can be used to develop indoor
positioning systems [14][15]. It can be used to build an indoor proximity estimation
system to detect the number of moving objects in a room, and even gather the patterns of
their movement [16]. Moreover, iBeacons can be also used as launching APPs on remote
devices [17]. The interest of industry for iBeacon is increasing as well. Not only Apple
but enterprises such as Qualcomm, PayPal, and SKT carry forward related businesses by
partnering with a variety of companies [18].
The hardware basis of this work is the iBeacon transmitters from Estimote [19],
cooperating with the most recent iPhone 5s, 6/6Plus and 6s/6sPlus. We develop our
intelligent in-room presence detection system using existing APIs which provide received
signal strength indicator (RSSI) and the motion information. Most importantly, we
managed to manipulate empirical data and decide whether a person is in-room or not.
In this thesis, we assume that the entrance door automatically shuts after an individual

16
goes into or out of the room. When the individual opens and gets through the door with
our APP properly launched, our APP receives the beacon signal and sends the beacon
RSSI to the server. The server archives the RSSI and decides the presence status of that
individual according to computational result of our algorithm. We first and foremost
focus on the system implementation with two iBeacons, one of them attached to the
outside of door while another mirroring at the inside. Such implementation provides
adequate understanding on the physical phenomenon. After that, we move on to single
iBeacon implementation, for which our system still performs well enough, but works
with less expenses and more convenience.
2.4 In-room localization in hospitals
In hospitals one of the most important tasks is the safety of patients and indoor
positioning service can help improve patient safety. Among numerous in-room
positioning technologies, Wi-Fi localization is widely used in the hospital today [20].
This is for indoor geolocation in an entire building assuming that the user uses a smart
phone. With the help of these kinds of position-based applications, doctors and nurses
will master the health conditions of patients easily and timely. Another application is
finding newborn babies in the nursery rooms. In the application they put a tag at the
babies’ legs or wrists and use RFID to identify and track babies [21].

17
Fig.1 Radio Frequency Identifier tag used in nursery room
In this thesis we use iBeacon, a Bluetooth Low Energy (BLE) based technology, to
replace RFID for in-room localization in this paper. Compared with expensive special-
purpose RFID reader infrastructure (such as commercial UHF RFID readers or USRPs),
the cost of the iBeacon deployment is much lower because BLE capable devices are
already nearly ubiquitous as essentially all smart phones, tablets, and PCs from major
manufacturers such as Apple and Samsung have adopted the Bluetooth 4.0 standard,
which includes BLE as a key mode of operation [22]. The working coverage of iBeacon
is also larger than that of RFID, but smaller than WiFi. If the working range is a whole
building, not a single room, WiFi localization may be a better choice. The hardware basis

18
of this work is the iBeacon transmitters from Estimote [10], cooperating with the most
recent iPhone 5s, 6/6Plus and 6s/6sPlus.
By putting an iBeacon on every baby’s leg and use the iBeacon to broadcast the unique
ID information, we can identify babies on users’ smart phone [23]. Furthermore, if we
predefine a distribution map of all the iBeacons in the nursery room, we can locate the
users and navigate them to a certain baby according to RSSI analysis. Different
deployment patterns will result in different localization performance, which can be
quantified by our path-loss modeling and 3D CRLB analysis of iBeacons [24].
With the development of WLANs (Wireless Local Area Networks), there is an increasing
level of interest in developing the technology to "geolocate" users in an indoor
environment. Positioning and tracking of an indoor user based on radio signals will
encounter a considerable degree of technical difficulty because various objects such as
floors, walls and human bodies within a confined space will contribute to a rather
complex form of attenuation and fading of the radio signals to be used for geolocation.
[25] A majority of wireless geolocation techniques are based on such information as TOA
(the time of arrival), TDOA (the time difference of arrival), and DOA (the direction of
arrival). But geolocation based on these techniques is reliable only when line-of-sight
signals are dominant, hence it will not be applicable to an indoor environment.
Furthermore, a TOA or TDOA based approach requires accurate synchronization between
transmitters and receivers.
We therefore explore an alternative geolocation method, that is, a signal strength based
approach. Instead of measuring the time or angle of signal arrival, the signal strength
method makes use of the level of signal power (or energy) sensed by an MS (mobile
station) regarding the signals transmitted by reference base stations or APs (access points

19
in the IEEE802.11 terminology). This signal strength based approach may be also
possible in a reversed situation, where the signal from an MS is sensed by multiple APs.
This second approach would relieve an individual MS from the task of computing its
position or processing and transferring relevant information to some BS (base station) or
AP, as would be required in the first approach. However, a set of signals from different
MSs must be designed in such a manner that APs can distinguish the signals from
different MSs.
As early as in the 1960's, the signal attenuation model has been proposed as an approach
to locate vehicles in motion on the street. [25] Nevertheless, the signal strength based
geolocation is still an unexplored technique for locating WLAN users in an indoor
environment. In our research we use, as our starting point, a recent work reported by Bahl
and Padmanabhan. [25] Before reviewing their analysis, we first introduce a simple
signal propagation model which is based on a signal predictor variable, where the
observed variable is the signal strength (in dBm), and the predictor (or controlled)
variable is the distance from a reference position (also in logarithm), and the main
parameter to be estimated (i.e., regression coefficient) is the exponent value a that
determines path loss of the signal when the distance from the signal source is given. Then
we use Bahl's empirical signal propagation model which is also based on a linear
regression analysis and in which the observed variable of signal strength has been
compensated for the attenuation caused by the walls intervening between the MS and AP
before applied to the regression analysis. We then extend this linear regression model to a
multiple regression model by adding another predictor variable, i.e., the wall attenuation
factor, denoted WAF [dB]. There may exist walls intervening between a possible MS
location (to be estimated in geolocation) and a given reference position. We then evaluate

20
the improvement of this multiple regression model over the linear regression model by
comparing their coefficients of determination and standard deviations. In order to carry
out this statistical analysis, we resort to a simulation technique.
2.5 Cramer–Rao bound
In estimation theory and statistics, the Cramer–Rao bound (CRB) or Cramer–Rao lower
bound (CRLB), named in honor of Harald Cramer and Calyampudi Radhakrishna Rao
who were among the first to derive it, they express a lower bound on the variance of
estimators of a deterministic parameter. The bound is also known as the Cramer–Rao
inequality or the information inequality.
In its simplest form, the bound states that the variance of any unbiased estimator is at
least as high as the inverse of the Fisher information. An unbiased estimator which
achieves this lower bound is said to be (fully) efficient. Such a solution achieves the
lowest possible mean squared error among all unbiased methods, and is therefore the
minimum variance unbiased (MVU) estimator. However, in some cases, no unbiased
technique exists which achieves the bound. This may occur even when an MVU
estimator exists.
The Cramer–Rao bound can also be used to bound the variance of biased estimators of
given bias. In some cases, a biased approach can result in both a variance and a mean
squared error that are below the unbiased Cramer–Rao lower bound [26].
There is a wide range of wireless sensor network (WSN) applications requiring
knowledge of sensor locations, from indoor user tracking to environmental and structural
monitoring. Location estimation schemes used in long-range communications, such as

21
wireless cellular networks (WCN), include time of arrival (TOA), time difference of
arrival (TDOA), and received signal strength (RSS). Although RSS measurements are
easily available, since mobile terminals (MT) constantly monitor the strength of the
neighboring base stations’ pilot signals for handoff purposes [27], the RSS technique has
been circumvented in WCNs, because of its dependency on the distance of the located
device to the reference devices (i.e. base stations). In WSNs, on the other hand, the
distances between mobile sensor nodes (SN) and the neighboring reference devices are
by an order of magnitude smaller than in WCNs. For example, in the emerging ZigBee
standards, the transmission range of reduced function devices (RFD) and full function
devices (FFD) are set to be 30 meters. At this range, RSS-based location estimation
performs better.

22
Chapter 3
Algorithms for intelligent in-room
presence detection using iBeacon
This chapter focuses on how to establish an intelligent in-room presence detection system
using iBeacon. With the help of this system, the attendance registration of large rallies
like courses and seminars can be completed automatically and the system can be used for
any meeting places without frequent charging. Moreover, the system can also be
integrated into indoor localization systems, which will lead us to more applications. In
order to construct this presence detection system step by step, we firstly analyze the
differences between existing marketable iBeacon APPs and our own APP. With the
explanation of the experimental setup for both two iBeacons and one iBeacon scenarios,
we present the details of our presence detection algorithms and systems, and then we
focus on system performance and validation. Finally, we draw our conclusions and make
discussions.
3.1 IBeacon application development
The iBeacons produced by Estimote Company can provide us much information we need
such as RSS, broadcasting interval, minor and major values and even motion sensor [19].
However, the existing app from Estimote Company do not allow us to collect data
directly from iPhone which means large samples are impossible and we can only collect
data by hand. Even though the application provided by Estimote Company can satisfy
many requirements in iBeacon, there is an unavoidable problem existing in this
application: we cannot extract any data from this application which means the RSS data

23
we need can only be recorded by hand that is absolutely inconvenient and impossible for
large data. To solve this problem, we decide to develop our own app. Since intuitively we
know that the geometric relationship between the iBeacon and iPhone can be reflected by
the RSSI fluctuation of beacon signal, we employ necessary APIs to get the RSSI reading
directly from iPhone sensors. The APP encapsulates three essential information into each
record, including the iBeacon ID, RSSI reading and Time stamp. Considering the
scalability of the system, iBeacon ID has been partitioned into Universally Unique
Identifier (UUID), Major field, and Minor field [28]. In that sense, for large scale
deployment, we may configure building number as iBeacon UUID, floor number as
iBeacon Major and the iBeacon indicator as iBeacon Minor. The structure of each record
can be given as
{UUID, Major, Minor, RSSI, Time stamp}
Typical screenshot of our own APP has been depicted in Figure 3.2, in which we
explicitly display Major, Minor and RSSI fields but implicitly record the UUID and Time
stamp for privacy concerns.
Figure 3.1 Frame of iBeacon application development

24
Figure 3.2 Menu of self-developed iBeacon application
3.1.1 Development using objective C
Estimote Indoor Location SDK allows real-time beacon-based mapping and indoor
location. We know that building the next generation of context-aware mobile apps
requires more than just iBeacon™ hardware. That's why we've built smarter software that
abstracts away the difficulty of understanding proximity and position within a given
space. Estimote Indoor Location is a sophisticated software solution that makes it
incredibly easy and quick to map any location. Once done, you can use our SDK to
visualize your approximate position within that space in real-time, in your own app.
Indoor Location creates a rich canvas upon which to build powerful new mobile
experiences, from in-venue analytics and proximity marketing to frictionless payments

25
and personalized shopping. Estimote Indoor Location works exclusively with Estimote
Beacons.
When it comes to our project, we use Objective-C to develop our app to get the RSS of
the beacons. The iPhone 5s acts as the receiver in our research and it is connected to a
Mac book computer by a cable [28][29]. When it gets the packets from iBeacons which
are in the detection range, it will display the current values of RSS both on the iPhone
screen and Mac book computer. The data we collected in different situation can be used
to do the channel modeling. Figure 3.3 is an example coding in Objective-C:
Figure 3.3 Menu of coding in Objective-C

26
3.1.2 Self-developed application
Figure 3.2 shows the app we have developed based on the API provided by Estimote
Company. It can show the list of the beacons detected by our device and take down the
RSS signal, major, minor, sequence number of the data and whatever information of
beacons we want. Our need of extracting the RSS data can be satisfied by the app. Figure
3.4 shows the menu of receiving data in server.
Figure 3.4 Menu of receiving data in server
Figure 3.5 shows the server we built on my computer by using Python. When the app
finishes receiving data of iBeacons, it will send the data to the server through the Internet.
And the server will get the data and store them in a file automatically.

27
Figure 3.5 Menu of server by using Python
These are the RSS data we need extracted from iPhone, based on which we can complete
numerical analysis in Matlab and establish algorithms.
3.2 Two approaches of presence detection
My partner Zhouchi Li and I developed 2 algorithms to construct the presence detection
system using 1 or 2 iBeacons respectively [23]. Figure 3.6 and Figure 3.7 present the
diagrams of these 2 algorithms. For the 2 iBeacons algorithm, the main theory is due to
the path-loss of the door or wall, the RSS in two iBeacons should be different enough
despite their position is almost the same. As for the 1 iBeacon algorithm, the main theory
is because of the iBeacon position where is very close to the knob, someone who wants to
enter the room should give us a maximum RSS when he opens the door. More details

28
about the algorithms are described in my partner Zhouchi Li’s master thesis (“Sensor
Behavior Modeling and Algorithm Design for Intelligent Presence Detection in Nursery
Rooms using iBeacon”).
Figure 3.6 Algorithm for presence detection using 2 iBeacons

29
Figure 3.7 Algorithm for presence detection using 1 iBeacon
In this section we validate the proposed systems. Each previously mentioned movement
has been repeated for over 500 times and the RSSI of iBeacons has been measured. By
investigating the RSSI samples, we show the validity of our approach using physical
observation. Apart from that, the system performance has been also recorded to help the
performance comparison between double and single iBeacon approaches.
3.2.1 Double iBeacons approach
The RSSI samples for typical entering movement have been plotted in Figure 3.8. As
shown in the figure, when the MH opens the door, iBeacon 1 (on outside door) provides -
54dB RSSI while iBeacon 2 (on inside door) has only -61dB. With the time going, when
MH goes through the door at t = 2.5s, both iBeacons show approximately 63.5dB RSSI.
After that, when the MH gets into the room, the two RSSI curves flip over and iBeacon 2
dwells on top of iBeacon 1. As for typical leaving movement, the opposite trend can be
found, which still shows that the double iBeacons approach can provide successful
detection. One thing worth mentioning is that we also investigated the situation that a MH
came, open the door and then closed it without entering or leaving the room. The RSSI
curve for that movement has been plotted in Figure 3.9.

30
Figure 3.8 RSSI plot for double iBeacon approach, for the MH entering movement
Figure 3.9 RSSI plot for double iBeacon approach, for the MH opening the door
without entering/leaving

31
3.2.2 Single iBeacon approach
Given that the double iBeacons approach performs well, we move on to the validation of
single iBeacon approach. Among our 1536 sets of empirical data, the typical cases for
entering and leaving the room have been plotted in Figure 3.10. It is clear that entering
the room results in higher RSSI peak due to the fact that the single iBeacon is attached to
the outside of the door. When the MH is in the room, even though he/she could be close
to the iBeacon, but the door lies between iBeacon and iPhone can create extra path-loss.
The choice of -60dB RSSI threshold comes from the regression fitting of our empirical
data, that is, we find the best fit curves for both entering and leaving movements and
notice that -60dB threshold provides satisfactory detection rate of different movements.
To guarantee the robustness of the single iBeacon approach, we also conduct experiments
with the iPhone located at various positions. In hand, pant pocket and shirt pocket have
been selected as candidate locations of the iPhone and the best fit RSSI curves have been
plotted in Figure 3.10, respectively. Clearly we know that -60dB threshold works for all
those iPhone positions.
It is worth mentioning that the single iBeacon approach is not able to detect the situation
that the MH opens the door but neither entering nor leaving the room. Such reality shows
that the single iBeacon is cost effective compared with double iBeacons approach, but is
less robust against outliers.

32
Figure 3.10 RSSI plot for single iBeacon approach, for the MH entering movement
3.2.3 Comparison
Table 3.1 Performance of proposed in-room presence detection approaches

33
Figure 3.11 RSSI plot for various iPhone positions
At the end of this chapter, we would like to discuss the detection rates of the proposed
systems. For the double iBeacons approach, we performed 521 measurements with the
MH holding iPhone in hand, 500 measurements with the MH putting iPhone in pant
pocket and another 500 measurements with iPhone in shirt pocket. For all these
measurements, the double iBeacons approach is able to correctly detect the in- room
presence. As for single iBeacon approach, we have 536 measurements with the MH
holding iPhone in hand, 500 measurements with the MH putting iPhone in pant pocket
and another 500 measurements with iPhone in shirt pocket. For the pant pocket iPhone
position we have 2 mis-detections, while for in hand and shirt pocket cases the detection
rates are all 100% (shown in table 3.1). With such experimental results, we would like to
claim that both approaches work well.

34
Chapter 4
Methodology and discussion for in-
room Localization using iBeacon
At the beginning of this chapter, we firstly derive the empirical path-loss model and
construct Estimote iBeacon path-loss model [23]. The comparison demonstrates a fact
that the empirical model shows a lower distance measure error (DME) and better
performance. Secondly, we simulate the in-room environment to compute Cramer-Rao
low bound of location error both in 2D and 3D scenarios to observe the influence of
estimation of location error under different deployment patterns of iBeacons and try to
find an optimal method to deploy iBeacons [24]. Specifically, we compare the cumulative
distribution functions (CDF) of the CRLB in three different deployment patterns as well
as different number of iBeacons to make our conclusions.
4.1 Path-loss modeling
In this section, we introduce our data collecting system based on which we collect RSS
data and derive the empirical path-loss model. Then we compare the performance of that
model and existing iBeacon model by the CDF of DME to reach the conclusion that our
empirical path-loss model is more reliable. This model will be used in the simulations in
the rest parts.
4.1.1 RSSI data collection system
The iBeacons produced by Estimote Company can provide us much information we need

35
such as RSS, broadcasting interval, minor and major values and even motion sensor.
However, the existing app from Estimote Company do not allow us to collect data
directly from iPhone which means large samples are impossible and we can only collect
data by hand. To solve this problem, we decide to develop our own app.
We use Objective-C to develop our app to get the RSS of the beacons. The iPhone 5s acts
as the receiver in our research and it is connected to a Mac book computer by a cable.
When it gets the packets from iBeacons which are in the detection range, it will display
the current values of RSS both on the iPhone screen and Mac book computer. The data
we collected in different situation can be used to do the channel modeling.
The achievements of our developing own app:
1. Connect with certain iBeacon.
2. Set the UUID, major and minor fields of iBeacon.
3. Collect and store the RSS information.
4. Extract the RSS data from iphone. This makes the data more reliable compared
with those collected by hand, and also make the samples much larger.
4.1.2 Modeling and validation
Before we start to collect data, we need to validate the measurement environment can use
the IEEE 802.11 model or not. Since RSS is the most important factor in this project, the
path-loss model must be established [30]. We do linear match fitting with different
iBeacon data collected by out app to try to find out the best path-loss model of iBeacon.
Distance measure error (DME) is the criterion we use to compare the performance of
each model. The CDF of DME of different can tell us which model is better.
With the data we collected, here is the path-loss model in LOS situation from Matlab.

36
After linear match fitting with the RSS, we have figure 4.1 which shows us the power
gradient and the pass-loss in first meter.
In order to find out how Estimote Company measure the distance by iBeacon, we
recorded the RSS data shown in Estimote app when the app indicated we were on the
boundaries of first and second circles(distances are 1m and 5m). With the RSS data of
these two points, we can figure out the path-loss model using by iBeacon. We have two
path-loss models for each iBeacon coming from Estimote Company and our own app, we
can see that there some differences between these two models.
Figure 4.1 Two path-loss models comparison
With the data we collected by mint iBeacon, we can find out the estimate distance by
using the RSS data and path-loss model. Since the two models are both like
RSS = 𝑃0 + 10 ∝ log �̂�
We can have

37
�̂� = 10𝑅𝑆𝑆−𝑃0
10∝
Then the DME can be shown as
DME = |𝑑 − �̂�|
where d is the real distance we have in measurement. We calculate the DME for each
point data we have and then compute the CDF of the DME to compare the performance
of these two models, the CDF of mint iBeacon is shown in figure 4.2.
Figure 4.2 Comparison of cumulative distribution functions of distance measurement
error in two models
From figure 4.2 we can see that the red one is on the left side of green one which means
our path-loss model coming from linear match fitting has less error in the same DME
range. In a word, the linear match fitting path-loss model shows a better performance.

38
4.1.3 Discussion of path-loss modeling
In this section, different iBeacons have different path-loss model which may be caused by
shadow fading or measurement error. However, after comparing the CDF of DME, our
model coming from linear matching shows a better performance, using our model may
have a better distance judgement. The overall two path-loss models are shown in table
4.1, where σSF(m) means the mean of shadow fading using each model.
Item iBeacon model Empirical path-loss model
Characteristic L0(dB) α σSF(dB) L0 α σSF(dB)
iBeacon1 -54.8995 2.5214 3.2013 -55.3555 2.4674 3.5773
iBeacon2 -55.5000 2.2540 4.2992 -56.8918 2.3689 3.0501
iBeacon3 -52.5628 2.7693 4.1208 -56.1283 2.5387 3.1099
Table 4.1 Parameters of two different path-loss models
Based on the models, we also calculate the DME of each model to decide which one
owes a better performance, the comparison results are shown in table 4.2, where me(m)
means the mean of DME using each model and σe(m) means the standard variance of
DME using each model.
Item iBeacon model Empirical path-loss model
Characteristic me(m) σe(m) me(m) σe(m)
iBeacon1 0.8716 1.1819 0.8771 1.2179
iBeacon2 1.6717 4.9553 1.0788 1.4071
iBeacon3 0.1739 2.0837 0.9872 1.9240
Table 4.2 Distance measurement error comparison of two models

39
4.2 Scenarios and algorithms of in-room Localization
Ranging-based localization is the task of identifying the positions of a network of nodes
based on estimates of the distances between them, called range estimates. In many ways,
radio signal strength (RSS) is an ideal modality for range estimation in wireless networks
because RSS information can be obtained at no additional cost with each radio message
sent and received [31][32]. The simplicity of RSS is especially appealing for the
localization in wireless sensor networks because of their cost, size, and power constraints,
despite the fact that RSS may yield very noisy range estimates. In this section, we
empirically introduce the main methodology of RSS-based localization such we can have
an overview of in-room localization using iBeacon.
Figure 4.3 Scenario for in-room localization
Figure 4.3 shows the main scenario for in-room localization that there are 4 iBeacons in
each corner of a room. This is a typical scenario that we usually consider it as our first
choice. It is very similar to Wi-Fi localization if we regard the iBeacons as access points.

40
To the localization in this room, we record the RSS data from all these 4 iBeacons, from
each iBeacon RSS data we can calculate a distance range based on the path-loss model
we construct in section 4.1[33][34][35]. Then we use that distance range as radius range
and take the location of each iBeacon as a center to draw circles. The overlap area shown
in red shows the possible location we locate by iBeacon, shown in figure 4.4.
Figure 4.4 Scenario of RSS ranging localization
4.3 Methodology for performance evaluation
In this section, we firstly introduce the scenarios we define to evaluate the performance of
using iBeacon in localization. Then based on Matlab, we simulate the in-room
localization environment and calculate the estimation of location error (CRLB) to show
the effects of different deployment patterns and different iBeacon numbers [25][36][37].
Furthermore, we promote our model from 2D to 3D scenario and figure out the
estimation of location error to present the feasibility in this case.

41
4.3.1 Scenarios for performance evaluation
In order to compare the performance of different localization methods, in this paper we
use Cramer-Rao low bound of the location error standard deviation as the assessment
criterion. According to the conclusion given in [25], we know how to calculate the
location error standard deviation. We use Matlab simulation to obtain the theoretic
results.
Figure 4.5 Scenarios of different deployment methods
Since we want find the most efficient way of localization, different deployment methods
are introduced, based on which we can compare and make conclusion. It is easy to know
that more iBeacons stands for more localization accuracy, but what we pursue is how to
reach the highest accuracy with special given iBeacons, so there are 3 scenarios we
simulated shown in figure 4.5 in 3 different colors. In the first scenario, there are four
iBeacons in the four corners of the room and another one in the middle of the room. As

42
for the second scenario, there are four iBeacons in the four corners of the middle area of
the room and also another one in the middle of the room. To the last scenario, it is almost
as the same as the second one, except for the rotation of 45 degrees of the four iBeacons
deployed in the middle area, which means we rotate the square formed by the second
deployment method with 45 degrees into a new deployment pattern.
4.3.2 Localization error estimation of deployment patterns
As we discussed before, there are 3 scenarios we analyze and compare in order to
evaluate the feasibility and effectiveness. From the Matlab we have such conclusions.
The simulation conditions for location error analysis are as follows:
Pr(0) = 160W = 52dBm, and α = 2.4583 which is the mean of the α values of empirical
path-loss model derived in section 4.1.3 (shown in Table 4.1).
In the first scenario, we assume that there are five APs installed in a building with their
coordinates being AP 1 (15m, 15m), AP 2 (15m, -15m), AP 3 (-15m, -15m), AP 4 (-15m,
15m), and AP 5 (0.1m, 0.1m) [25]. If an MS at a given location receives signals from
these APs, its position can be determined by triangulation or least square estimation. The
simulation result is shown figure 4.6 to figure 4.8.

43
Figure 4.6 Contour of estimate location error in 2D in scenario 1
Figure 4.7 Contour of estimate location error in 2D in scenario 2

44
Figure 4.8 Contour of estimate location error in 2D in scenario 3
Then we move the four iBeacons from four corners to the middle area of the room to
reach the second scenario and also make such type figure. When we come to the last
scenario, we just do a rotation of 90 degrees with the four iBeacons in the middle and
reach the result.
4.3.3 CRLB for performance evaluation in 3D.
Since the nursery room is a cube in reality, we extend the formula and simulation
conditions from 2D to 3D. Z axis is introduced into the original x × y plane and we also
move the fifth iBeacon from the middle of ground up to the middle of the roof.
Based on the well-known path-loss model [25], we have:
0
0
P( r ) [ dBm] P( r ) [ dBm] 10 l og( )r
r

45
Transfer it into 3D coordinate form:
2 2 2
10( x, y, z) ( dx dy dz)
l n 10i i i
i
i i i
x x y y z zdP
r r r
We can also write it into a vector form, like:
𝑑�⃗� = �⃗⃗� ∙ 𝑑𝑟
Where,
Then, deriving in the same method [25], the estimation of location error can be
calculated as:
2 2 2
r x y z
Where 𝜎𝑃 is considered as 2.5 [25] in the simulations.
Due to plotting of a 4D figure is impossible, we give figure 4.9 in a particular height.

46
Figure 4.9 Contour of estimate location error in 3D
4.4 Effect analysis of different deployment methods
In this section, we compare the CDF of the error in three different deployment patterns to
present the results of our in-room deployments. Later on, we also observe the influence of
number of iBeacon by simulations in the same conditions to show the most efficient
deployment method.
4.4.1 Effect of different deployment patterns.
In order to observe the performance of 3 different scenarios directly, we calculate the
CDF of estimation of location error and compare them. In fig. we can see that the
deployment with four iBeacons in the middle area has the best performance, this is
probably because in this scenario it owes the highest overlap rate of coverage area, which
means that most part of the room can be located by 2 or more iBeacons and results in the

47
highest accuracy.
Figure 4.10 Comparison of cumulative distribution functions of CRLB in 3 different
deployment patterns
Apart from that, based on the figure 4.6 to figure 4.8 we present before, we also calculate
the means and variances of CDF of the location estimation error in the different
scenarios. From the figure we can claim that 5 iBeacons in the middle area performs best
(green line in figure 4.10). The comparison is in table 4.3.
Parameters 5 iBeacons in
corners
5 iBeacons in the
middle area
5 iBeacons in the middle
area with rotation
mean 1.6755m 1.2935m 1.4023m
Standard variance 0.2584m 0.6471m 0.7001m
90%error bound 2.1223m 2.3312m 2.3547m
Table 4.3 Comparison of CRLB in 3 different deployment patterns
48
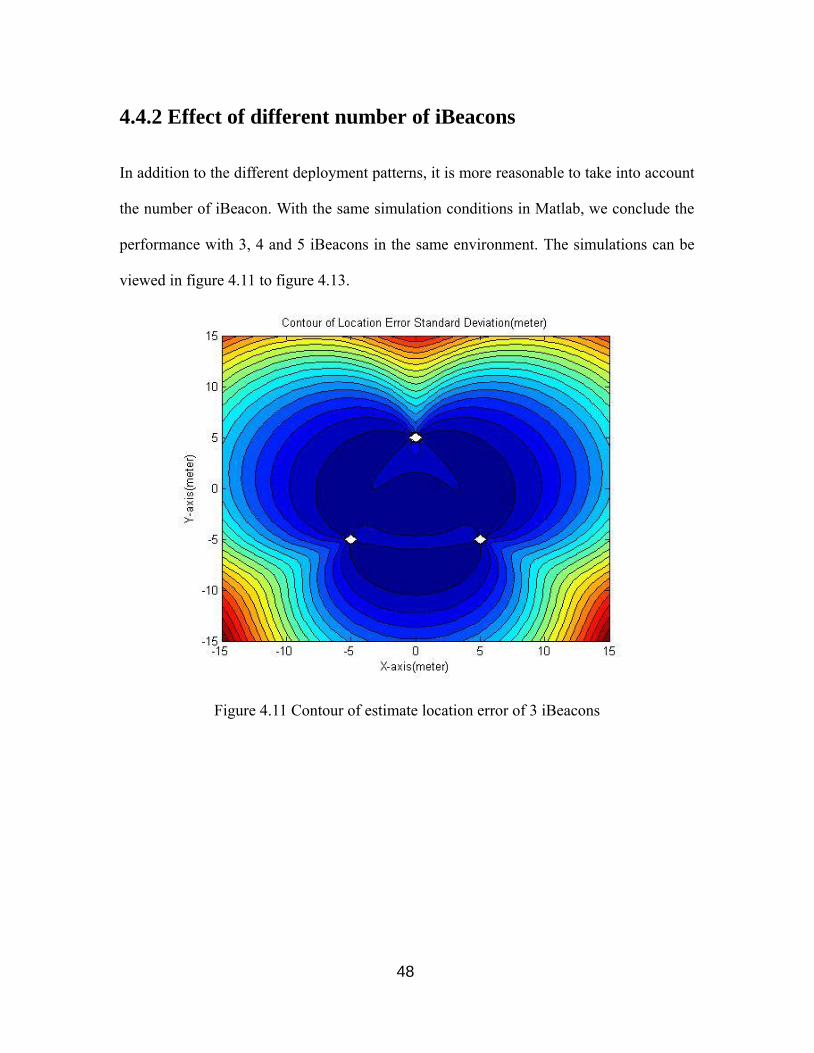
4.4.2 Effect of different number of iBeacons
In addition to the different deployment patterns, it is more reasonable to take into account
the number of iBeacon. With the same simulation conditions in Matlab, we conclude the
performance with 3, 4 and 5 iBeacons in the same environment. The simulations can be
viewed in figure 4.11 to figure 4.13.
Figure 4.11 Contour of estimate location error of 3 iBeacons

49
Figure 4.12 Contour of estimate location error of 4 iBeacons
Figure 4.13 Contour of estimate location error of 5 iBeacons

50
Above are the error estimation results with 3,4 and 5 iBeacons in the middle area since
we have already certified that the deployment in the middle owes the best performance.
In addition, we can still calculate the CDF of the location estimation error to compare
them and reach a conclusion, shown in figure 4.14.
Figure 4.14 Comparison of cumulative distribution functions of CRLB in different
number of iBeacons
Obviously, 5 iBeacons owes the best performance, however, we can find that the
improvement from 3 iBeacons to 4 iBeacons is significant while the improvement from 4
iBeacons to 5 iBeacons is negligible. So we can assert that the deployment with 4
iBeacons in the middle area contains the highest efficiency. The overall performance is
concluded in table 4.4.
Parameters 5 iBeacons 4 iBeacons 3 iBeacons
mean 1.2935m 1.5060m 2.3332m
Standard variance 0.6471m 0.5536m 1.3401m
90%error bound 2.3312m 2.3392m 4.4107m
Table 4.4 Comparison of CRLB in different number of iBeacon

51
Chapter 5
Performance evaluation for in-room
localization technology using iBeacon
In this chapter, we analyze the Cramer-Rao Lower Bound (CRLB) of localization using
Received Signal Strength (RSS) considering detection probabilities and variable shadow
fading. This analysis has a dual purpose [38]. Firstly, the properties of the bound on
localization error may help to design efficient localization algorithm. For example,
utilizing one of the properties, we propose a way to define the most efficient deployment
scheme based on different access points range and room size which is shown to perform
better than random deployment. Secondly, it provides suggestions for deploying access
points or iBeacons by revealing error trends associated with the system deployment
methods. In both cases, simulation results in Matlab are presented in order to support our
claims.
Among all the chapters we discussed before, we assume the probability that someone is
covered by access points or iBeacons is always 1 and shadow fading is a constant.
However, in reality we need to take into account the fade margin and variable shadow
fading (decided by distance). So we organize this chapter as follow: In section 5.1, we
explain the definition of shadow margin and analyze it in numerical form, then derive the
coverage possibility. In section 5.2, we introduce the main algorithms of CRLB and
combine this CRLB with the coverage probability. Meanwhile, we also use variable
shadow fading rather than constant shadow fading into the CRLB and give figures to
show the simulation results in Matlab. As for section 5.3, we illustrate the analysis results

52
in figures and give conclusions.
5.1 Coverage possibility
For γ% coverage, the base station should have an additional fade margin of Fσ that [11]:
The fade margin is the additional signal power that can provide a certain additional
fraction of the locations at the edge of a cell (or near the fringe areas) with the required
signal strength. Thus, for computing the coverage with certain assurance for coverage, we
first determine the fade margin using the variance of the shadow fading. Then we employ
the following equation to calculate the coverage [11]:
where Fσ is the fade margin associated with the path loss to overcome the shadow fading
component. This fading margin can be applied by increasing the transmit power and
keeping the cell size the same, or reducing the cell size by setting a higher RSS threshold
for making a handoff. For commonly employed probabilities of coverage such as 95 or
90%, we can use the following formulas to compute the fade margins.
We note that the location variability component X (in dB) in this case is a zero mean
Gaussian random variable [39][38]. Here we useσ to denote the standard variance of the
shadow fading and chose 1-γ% = 10%, that is, 90% of the locations will have a fading
component smaller than the tolerable value. Using the complementary error function and

53
Matlab, we can determine the value of Fσ as the solution to the equation 0.1 = 0.5
erfc(Fσ/σ ) [11]. Due to the fact that with the distance increased, Fσ will become smaller,
we can then calculate the distance which is able to satisfy the Fσ for a certain possibility,
like [41][42]:
𝑑 = 10𝐿𝑝−𝐿0−𝐹𝜎
10𝛼
To show the result directly in figure, we suppose there is an access point (iBeacon) in a
corner of a room, then compute the coverage possibility based on the distance. Figure 5.1
shows the result:

54
Figure 5.1 Relationships between coverage possibility and distance
The white line shows the distance which can satisfy the condition of offering a 90%
shadow fading margin.
Apart from that, now the scenario is we put 4 access points (APs) or iBeacons in each
corner of a room, it is reasonable to think about the detection probabilities by different
number of APs. For different number of Aps, we introduce these formulas to calculate
[43][44][45]:
If there is no access point covered:
P0 = (1-Pc1).×(1-Pc2).×(1-Pc3).×(1-Pc4)
If there is 1 access Point covered:
P11 = Pc1.×(1-Pc2).×(1-Pc3).×(1-Pc4)
P12 = Pc2.×(1-Pc1).×(1-Pc3).×(1-Pc4)
P13 = Pc3.×(1-Pc1).×(1-Pc2).×(1-Pc4)
P14 = Pc4.×(1-Pc1).×(1-Pc2).×(1-Pc3)
P1 = P11+P12+P13+P14
If there are 2 access Points covered:
P21 = Pc1.×Pc2.×(1-Pc3).×(1-Pc4)
P22 = Pc1.×Pc3.×(1-Pc2).×(1-Pc4)
P23 = Pc1.×Pc4.×(1-Pc2).×(1-Pc3)

55
P24 = Pc2.×Pc3.×(1-Pc1).×(1-Pc4)
P25 = Pc2.×Pc4.×(1-Pc1).×(1-Pc3)
P26 = Pc3.×Pc4.×(1-Pc1).×(1-Pc2)
P2 = P21+P22+P23+P24+P25+P26
If there are 3 access Points covered:
P31 = Pc1.×Pc2.×Pc3.×(1-Pc4)
P32 = Pc1.×Pc2.×Pc4.×(1-Pc3)
P33 = Pc1.×Pc3.×Pc4.×(1-Pc2)
P34 = Pc2.×Pc3.×Pc4.×(1-Pc1)
P3 = P31+P32+P33+P34
If all 4 access Points covered:
P4 = Pc1.×Pc2.×Pc3.×Pc4
Where Pc1, Pc2, Pc3, Pc4 denote for the detection probabilities by each AP in the corner.
Based on this combined coverage probabilities, we can make the localization evaluation
with CRLB more reasonable and practical. One fact we need to notice is that the
coverage probabilities are only related with the fading margin Fσ and variance of shadow
fading σ, which means if we change the value of σ, the result will be absolutely different.

56
5.2 CRLB with coverage probability and variable shadow
fading
The Cramer-Rao Lower Bound (CRLB) sets a lower bound on the variance of any
unbiased estimator. This can be extremely useful in several ways [46][47][48]:
1. If we find an estimator that achieves the CRLB, then we know that we have found an
MVUE estimator.
2. The CRLB can provide a benchmark against which we can compare the performance
of any unbiased estimator (We know we’re doing very well if our estimator is “close” to
the CRLB).
3. The CRLB enables us to rule-out impossible estimators. That is, we know that it is
physically impossible to find an unbiased estimator that beats the CRLB. This is useful in
feasibility studies.
4. The theory behind the CRLB can tell us if an estimator exists which achieves the
bound.
In a word, Cramer Rao inequality provides lower bound for the estimation error variance.
Minimum attainable variance is often larger than CRLB. We need to know the pdf to
evaluate CRLB. Often we don’t know this information and cannot evaluate this bound. If
the data is multivariate Gaussian or i.i.d. with known distribution, we can evaluate it [49].
If the estimator reaches the CRLB, it is called efficient. Minimum-variance unbiased
estimator (MVUE) may or may not be efficient. If it is not, we have to use other tools
than CRLB to find it. It’s not guaranteed that MVUE exists or is realizable [50][51].

57
In numerical, if we have an observation like 𝑂 = 𝑥 + 𝜂, which is a single observation in
zero mean GN with variance σ2, we can see the probability density function as
Then we are able to compute the ML estimate:
The variance of this estimate is the CRLB. In another word, the CRLB is the variance of
the ML estimate and the inverse of the Fisher Matrix:
Now we come to the RSS based localization problem, for RSS based localization we have:
Gaussian noise is shadow fading. Based on this equation we can derive the common
sense range estimate as:
So if we measure a feature of the signal, for example power, at a distance d, and we have
an estimate distance �̂�. Then, the distance measurement error (DME) for ranging is 𝜀 =
𝑑 − �̂�.

58
Here we want to observe �̂� so that we can find out the performance of localization. So we
want to estimate distance based on the observation of power observation:
In this equation, 𝑔(𝑥) = 𝑃0 − 10𝛼𝑙𝑜𝑔𝑥 and Gaussian noise is shadow fading.
Based on the probability density function we also have the ML estimate:
Define a fisher matrix and calculate the variance of the ML estimate, we have:
Since the inverse of the variance of the ML estimate is the CRLB, the distance
measurement error (CRLB) will be:
This shows an interesting fact that the distance measurement error, the CRLB, is only
related with the variance of the shadow fading σ and the distance x, which means as the
shadow fading changes, CRLB will also be undoubtedly different.
Combined with the conclusion in section 5.1, we can reach a truth that not only the
coverage probability but also CRLB are correlated with variance of shadow fading σ.

59
Upon this fact, we firstly use variable shadow fading instead of constant shadow fading
(see in section 2.2) to calculate coverage probability and derive out the reliable distance,
then among this distance we still use variable shadow fading to compute CRLB. In this
way we can obtain the CRLB with coverage probability and variable shadow fading
[52][53][54].
The revised CRLB with different number of APs are shown in figure 5.2:
Figure 5.2 CRLB under practical conditions with different number of access points
We can also compute the overall CRLB under practical conditions which is shown in

60
figure 5.3:
Figure 5.3 CRLB under practical conditions with all 4 access points
This is considered as the revised CRLB which takes into account both coverage
probability and variable shadow fading. We can directly find that the performance shows
best in the proximity near the APs (iBeacons), and the second best performance appears
in the center area of the room, this is basically because this area is the most overlapped
region which means the coverage probability is relatively higher than other regions that
are not near the APs (iBeacons).

61
5.3 Discussions in CRLB with coverage probability and
variable shadow fading
5.3.1 Comparison with traditional CRLB
In this section, we firstly define the localization scenario as 4 iBeacon deployed in the
middle are of a room, which is considered as the most efficient deployment pattern
according to the conclusion in section 4.3, shown in figure 5.4.
Figure 5.4 Scenario of localization using 4 iBeacons
In this scenario, if we calculate the CRLB under practical conditions, we will have such
result shown in figure 5.5. And in order to compare with the traditional CRLB, we also
provide the traditional result here in figure 5.6:

62
Figure 5.5 CRLB under practical conditions with 4 iBeacons
Figure 5.6 Traditional CRLB with 4 iBeacons

63
To show the comparison directly, both of the CDFs of CRLB in these two figures are
calculated and we present the result in the figure 5.7 [55][56]:
Figure 5.7 Comparison of cumulative distribution functions of traditional CRLB and
CRLB under practical conditions
Obviously, the traditional CRLB seems better while the performance beyond 90% bound
the CRLB under practical conditions performs better [57]. This is firstly because when
we consider the fading margin, more power is needed to ensure the place can be
discovered by iBeacon with a higher probability which we assume it is 100% in the
traditional CRLB. Secondly, the introduction of variable variance of shadow fading
makes the average variance of shadow fading much larger than the value we defined in
the traditional CRLB that the variance of shadow fading is almost 4.28dB after 4m in the
variable shadow fading while it is 2.5dB as we assumed in the tradition CRLB [13][58].
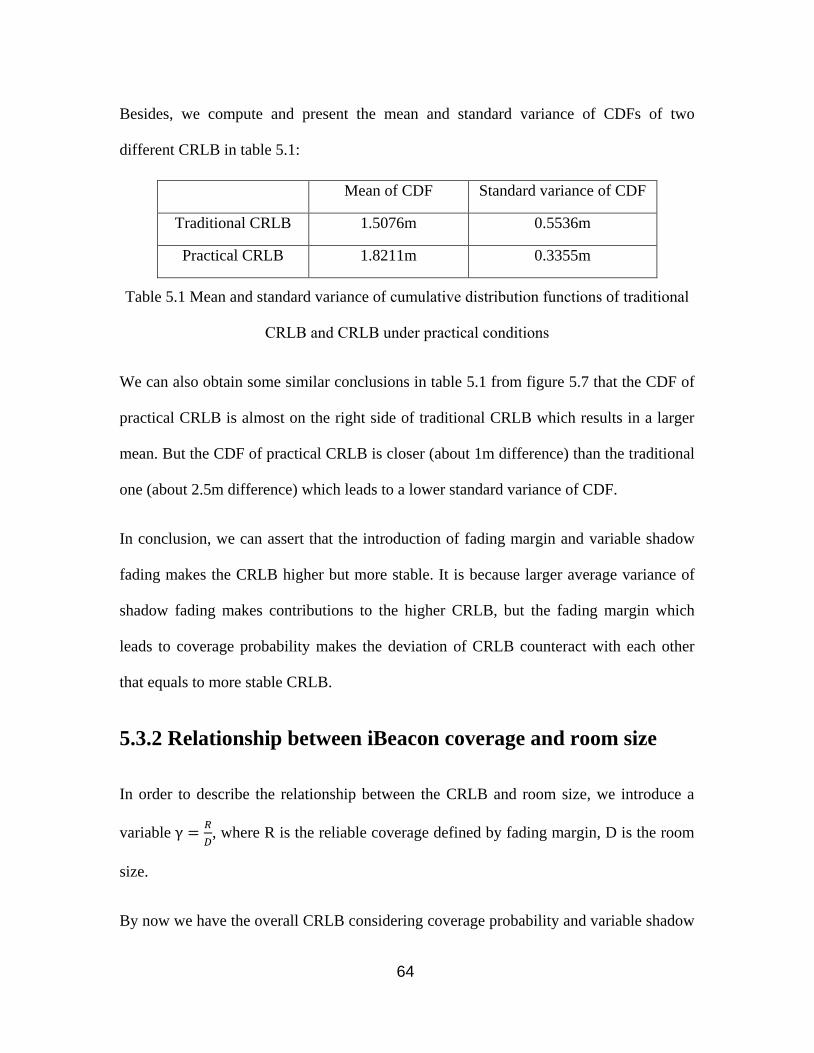
64
Besides, we compute and present the mean and standard variance of CDFs of two
different CRLB in table 5.1:
Mean of CDF Standard variance of CDF
Traditional CRLB 1.5076m 0.5536m
Practical CRLB 1.8211m 0.3355m
Table 5.1 Mean and standard variance of cumulative distribution functions of traditional
CRLB and CRLB under practical conditions
We can also obtain some similar conclusions in table 5.1 from figure 5.7 that the CDF of
practical CRLB is almost on the right side of traditional CRLB which results in a larger
mean. But the CDF of practical CRLB is closer (about 1m difference) than the traditional
one (about 2.5m difference) which leads to a lower standard variance of CDF.
In conclusion, we can assert that the introduction of fading margin and variable shadow
fading makes the CRLB higher but more stable. It is because larger average variance of
shadow fading makes contributions to the higher CRLB, but the fading margin which
leads to coverage probability makes the deviation of CRLB counteract with each other
that equals to more stable CRLB.
5.3.2 Relationship between iBeacon coverage and room size
In order to describe the relationship between the CRLB and room size, we introduce a
variable γ =𝑅
𝐷, where R is the reliable coverage defined by fading margin, D is the room
size.
By now we have the overall CRLB considering coverage probability and variable shadow

65
fading, we calculate the mean and variance of that overall CRLB to see the tendency
when γ increases. The results are shown in figure 5.8 and figure 5.9:
Figure 5.8 Mean of CRLB under practical conditions versus reliable coverage rate
(reliable iBeacon coverage divided by room size)

66
Figure 5.9 Standard variance of CRLB under practical conditions versus reliable
coverage rate (reliable iBeacon coverage divided by room size)
Firstly we observe the variance of overall CRLB, the result seems reasonable [59][60].
As γ increases, which means the reliable coverage area becomes larger, the variance of
overall CRLB is monotonically decreases. This conclusion is obvious because the
variable shadow fading decreases with the room size becomes smaller (maximum
distance becomes smaller), which in turn results in a lower CRLB, meanwhile, the
reliable cover rate becomes larger that will decrease the variance of CRLB. When it
comes to the mean of overall CRLB, we can also see the mean of overall CRLB
monotonically decreases.
Apart from the mean and variance, we also calculate the cumulative distribution function

67
(CDF) of CRLB to show the whole performance versus γ . The result is shown in figure
5.10:
Figure 5.10 Comparison of cumulative distribution functions of CRLB under practical
conditions in different reliable coverage rates
It is also a reasonable result that as γ increases, cdf of CRLB shifts left which denotes
better performance. A typical conclusion we can make is that with smaller room size,
CRLB becomes smaller and the localization accuracy becomes better. In a word,
considering fading margin and variable shadow fading makes the calculation of CRLB
more depend on the effective coverage rate γ, for γ=𝑅/𝐷 = 0.9, we have a 90% bound in
CDF of CRLB which is 3.17 meters with an improvement of 24.70% respect to γ = 0.5.

68
Chapter 6
Conclusions and future works
In chapter 1 and 2, we present the outlines and backgrounds of our project to obtain an
overview of this thesis. Our motivation, contributions as well as some necessary
information are introduced in these 2 chapters.
In chapter 3, we investigated and developed an iBeacon based intelligent in-room
presence detection system to record the users in a room. We collected the RSSI data of
iBeacon for LOS situation in a typical indoor office environment and we implement both
single beacon and double beacons based approach. We also analyzed the probability
density function, error detection rate and other metrics using the empirical measurement
results. The optimal performance of our approach can be as high as 100%.
In chapter 4, we validated the probability to build a newborns localization and tracking
system in hospitals by using iBeacon. In path-loss model part, we compare the CDF of
DME of Estimote iBeacon model and our empirical path-loss model to demonstrate that
using our model will have a better performance. More importantly, by simulations we
directly observe the influence of different iBeacon deployment patterns and number of
iBeacons in in-room localization, based on which we reasonably conclude that 5
iBeacons in the middle area performs best while 4 iBeacons in the middle is considered
as the most efficient deployment pattern.
In chapter 5, we investigate the realistic relationship between localization accuracy and
ratio of the iBeacon courage and dimensions of the room using CRLB including influence
on coverage probability and find out the dependence of variance of shadow fading on
distance and effect on CRLB.

69
In summary, we firstly explain the main structures of the thesis, then we focus on the
algorithms for intelligent in-room presence detection after the introduction about
backgrounds. In addition to the presence detection system, we emphasize on the
methodology for performance evaluation in in-room localization using iBeacon. We
conclude the most efficient deployment pattern based on the analysis of CRLB. At last,
practical conditions such as fading margin and variable shadow fading are taken into
account in the calculation of CRLB and we also find out the relationship between the
reliable iBeacon coverage and room size. In the future, we may testify the feasibility of
using iBeacon for newborns localization in practice, and hopefully combine the
accelerometer information [61][62] with localization to realize the tracking function for
newborns in hospitals to make this whole project more practical and functional.

70
Bibliography
[1] Kumar, P., Reddy, L., & Varma, S. (2009, December). Distance measurement and
error estimation scheme for RSSI based localization in Wireless Sensor Networks.
In Wireless Communication and Sensor Networks (WCSN), 2009 Fifth IEEE
Conference on (pp. 1-4). IEEE.
[2] Vaghefi, R. M., Gholami, M. R., & Ström, E. G. (2011, May). RSS-based sensor
localization with unknown transmit power. In Acoustics, Speech and Signal
Processing (ICASSP), 2011 IEEE International Conference on (pp. 2480-2483).
IEEE.
[3] Patwari, N., & Hero III, A. O. (2003, September). Using proximity and quantized
RSS for sensor localization in wireless networks. In Proceedings of the 2nd ACM
international conference on Wireless sensor networks and applications (pp. 20-29).
ACM.
[4] Binsabbar, M., & Zhang, N. (2014). An iphone application for providing ibeacon-
based services to students.
[5] Youn, S., Ahn, J. H., & Park, K. (2008, April). Entrance detection of a moving object
using intensity average variation of subtraction images. InSmart Manufacturing
Application, 2008. ICSMA 2008. International Conference on (pp. 459-464). IEEE.
[6] Ivanov, B., Ruser, H., & Kellner, M. (2002, June). Presence detection and person
identification in Smart Homes. In Int. Conf. Sensors and Systems, St. Petersburg (pp.
12-14).
[7] Benezeth, Y., Laurent, H., Emile, B., & Rosenberger, C. (2011). Towards a sensor
for detecting human presence and characterizing activity. Energy and

71
Buildings, 43(2), 305-314.
[8] He, J., Geng, Y., Wan, Y., Li, S., & Pahlavan, K. (2013). A cyber physical test-bed
for virtualization of RF access environment for body sensor network. Sensors
Journal, IEEE, 13(10), 3826-3836.
[9] Kohne, M., & Sieck, J. (2014, November). Location-based services with iBeacon
technology. In Artificial Intelligence, Modelling and Simulation (AIMS), 2014 2nd
International Conference on (pp. 315-321). IEEE.
[10] What is iBeacon? A Guide to Beacons. http://www.ibeacon.com/what-is-ibeacon-a-
guide-to-beacons/
[11] Pahlavan, K., & Krishnamurthy, P. (2013). Principles of wireless access and
localization. John Wiley & Sons.
[12] Mailaender, L. (2011, September). Geolocation bounds for received signal strength
(rss) in correlated shadow fading. In Vehicular Technology Conference (VTC Fall),
2011 IEEE (pp. 1-6). IEEE.
[13] Liu, G. (2015). Modeling and Performance Analysis of Hybrid Localization Using
Inertial Sensor, RFID and Wi-Fi Signal (Doctoral dissertation, Worcester
Polytechnic Institute).
[14] Martin, P., Ho, B. J., Grupen, N., Munoz, S., & Srivastava, M. (2014, November).
An ibeacon primer for indoor localization: demo abstract. In Proceedings of the 1st
ACM Conference on Embedded Systems for Energy-Efficient Buildings (pp. 190-191).
ACM.
[15] Geng, Y., Chen, J., Fu, R., Bao, G., & Pahlavan, K. (2015). Enlighten wearable
physiological monitoring systems: On-body rf characteristics based human motion
classification using a support vector machine.

72
[16] Corna, A., Fontana, L., Nacci, A. A., & Sciuto, D. (2015, March). Occupancy
detection via iBeacon on Android devices for smart building management. In
Proceedings of the 2015 Design, Automation & Test in Europe Conference &
Exhibition (pp. 629-632). EDA Consortium.
[17] Bassbouss, L., Guclu, G., & Steglich, S. (2014, October). Towards a remote launch
mechanism of TV companion applications using iBeacon. In Consumer Electronics
(GCCE), 2014 IEEE 3rd Global Conference on (pp. 538-539). IEEE.
[18] Kim, C., & Lee, S. (2014, October). A research on Beacon code architecture
extension using category and code Beacon structure. In Information and
Communication Technology Convergence (ICTC), 2014 International Conference
on (pp. 187-188). IEEE.
[19] The manual of estimote iBeacons, http://developer.estimote.com/
[20] Rodionov, D., Bushminkin, K., & Kolev, G. (2013, September). A Cooperative
Localization Technique for Tracking in Hospitals and Nursing Homes. In Healthcare
Informatics (ICHI), 2013 IEEE International Conference on (pp. 471-475). IEEE.
[21] Cheng, S. H., Huang, J. C., & Lin, C. J. (2012, July). A real-time location and infant
monitoring system based on active RFID. In Machine Learning and Cybernetics
(ICMLC), 2012 International Conference on (Vol. 5, pp. 1844-1849). IEEE.
[22] Ensworth, J. F., & Reynolds, M. S. (2015, April). Every smart phone is a backscatter
reader: Modulated backscatter compatibility with bluetooth 4.0 low energy (ble)
devices. In RFID (RFID), 2015 IEEE International Conference on (pp. 78-85). IEEE.
[23] Yang, Y., Li, Z., & Pahlavan, K. Using iBeacon for Intelligent In-Room Presence
Detection. 2016 IEEE International Multi-Disciplinary Conference on Cognitive
Methods in Situation Awareness and Decision Support (CogSIMA), San Diego, CA,

73
Mar. 2016.
[24] Y. Yang Z. Li and K. Pahlavan. Using ibeacon for newborns localization in hospitals.
2016 IEEE 10th International Symposium on Medical Information and
Communication Technology (ISMICT), Worcester, MA, Mar. 2016.
[25] Chen, Y., & Kobayashi, H. (2002). Signal strength based indoor geolocation.
In Communications, 2002. ICC 2002. IEEE International Conference on (Vol. 1, pp.
436-439). IEEE.
[26] Mailaender, L. (2011, March). On the CRLB scaling law for received signal strength
(RSS) geolocation. In Information Sciences and Systems (CISS), 2011 45th Annual
Conference on (pp. 1-6). IEEE.
[27] Weiss, A. J. (2003). On the accuracy of a cellular location system based on RSS
measurements. Vehicular Technology, IEEE Transactions on, 52(6), 1508-1518.
[28] Gast, M. S. (2014). Building applications with IBeacon: proximity and location
services with bluetooth low energy. " O'Reilly Media, Inc.".
[29] Newman, N. (2014). Apple ibeacon technology briefing. Journal of Direct, Data and
Digital Marketing Practice, 15(3), 222-225.
[30] Yang, J., & Chen, Y. (2009, November). Indoor localization using improved RSS-
based lateration methods. In Global Telecommunications Conference, 2009.
GLOBECOM 2009. IEEE (pp. 1-6). IEEE.
[31] Pivato, P., Palopoli, L., & Petri, D. (2011). Accuracy of RSS-based centroid
localization algorithms in an indoor environment. Instrumentation and Measurement,
IEEE Transactions on, 60(10), 3451-3460.
[32] Yang, J., Wang, Z., & Zhang, X. (2015). An ibeacon-based indoor positioning
systems for hospitals. International Journal of Smart Home, 9(7), 161-168.

74
[33] Leplawy, M. (2015). Indoors localization system with the use of WiFi and other
network standards. Przegląd Elektrotechniczny, 91(1), 173-174.
[34] Chen, Z., Zhu, Q., Jiang, H., & Soh, Y. C. (2015, June). Indoor localization using
smartphone sensors and ibeacons. In Industrial Electronics and Applications (ICIEA),
2015 IEEE 10th Conference on (pp. 1723-1728). IEEE.
[35] Gholami, M. R., Vaghefi, R. M., & Strom, E. G. (2013). RSS-based sensor
localization in the presence of unknown channel parameters. Signal Processing,
IEEE Transactions on, 61(15), 3752-3759.
[36] Kim, S. C., Sung, Y. S., Kang, J. S., & Choi, J. (2007). Performance Evaluation of
Positioning Techniques Based on UWB Radio.
[37] Sand, S., Wang, W., & Dammann, A. (2012, September). Cramer-Rao lower bounds
for hybrid distance estimation schemes. In Vehicular Technology Conference (VTC
Fall), 2012 IEEE (pp. 1-5). IEEE.
[38] Veletić, M., & Šunjevarić, M. (2014). On the Cramer-Rao lower bound for RSS-
based positioning in wireless cellular networks. AEU-International Journal of
Electronics and Communications, 68(8), 730-736.
[39] Geng, Y., He, J., Deng, H., & Pahlavan, K. (2013, June). Modeling the effect of
human body on TOA ranging for indoor human tracking with wrist mounted sensor.
In Wireless Personal Multimedia Communications (WPMC), 2013 16th International
Symposium on (pp. 1-6). IEEE.
[40] Geng, Y., & Pahlavan, K. (2015). Design, Implementation and Fundamental Limits
of Image and RF Based Wireless Capsule Endoscopy Hybrid Localization.
[41] Geng, Y., Chen, J., & Pahlavan, K. (2013, September). Motion detection using RF
signals for the first responder in emergency operations: A PHASER project.

75
In Personal Indoor and Mobile Radio Communications (PIMRC), 2013 IEEE 24th
International Symposium on (pp. 358-364). IEEE.
[42] Geng, Y., He, J., & Pahlavan, K. (2013). Modeling the effect of human body on TOA
based indoor human tracking. International Journal of Wireless Information
Networks, 20(4), 306-317.
[43] Geng, Y., He, J., & Pahlavan, K. (2013). Modeling the effect of human body on TOA
based indoor human tracking. International Journal of Wireless Information
Networks, 20(4), 306-317.
[44] Yun, C. H., & So, J. (2015). A Bluetooth Beacon-Based Indoor Localization and
Navigation System. Advanced Science Letters, 21(3), 372-375.
[45] Tiwari, S., Wang, D., Fattouche, M., & Ghannouchi, F. (2012). A Hybrid RSS/TOA
Method for 3D Positioning in an Indoor Environment. ISRN Signal Processing, 2012.
[46] Prieto, J., Mazuelas, S., Bahillo, A., Fernández, P., Lorenzo, R. M., & Abril, E. J.
Posterior Cramer-Rao Lower Bound for RSS/TOA-based Indoor Localization
Systems.
[47] Lieckfeldt, D., & Timmermann, D. Using Cramer-Rao-Lower-Bound to Reduce
Complexity of Localization in Wireless Sensor Networks. In BALTIC
CONFERENCE (p. 71).
[48] Qaraqe, K. A., Hussain, S. I., Celebi, H., Abdallah, M., & Alouini, M. S. (2010,
November). An RSS based location estimation technique for cognitive relay
networks. In Applied Sciences in Biomedical and Communication Technologies
(ISABEL), 2010 3rd International Symposium on (pp. 1-5). IEEE.
[49] Shirahama, J., & Ohtsuki, T. (2008, May). RSS-based localization in environments
with different path loss exponent for each link. In Vehicular technology conference,

76
2008. VTC spring 2008. IEEE (pp. 1509-1513). IEEE.
[50] Stoyanova, T., Kerasiotis, F., Prayati, A., & Papadopoulos, G. (2007, October).
Evaluation of impact factors on RSS accuracy for localization and tracking
applications. In Proceedings of the 5th ACM international workshop on Mobility
management and wireless access (pp. 9-16). ACM.
[51] Kim, C. H., Hong, S. H., & Lee, S. W. (2015). A Research on Performance
Improvement of iBeacon Using Transmission and Reception of Different Beacon
Signals. The Journal of Korean Institute of Communications and Information
Sciences, 40(1), 108-114.
[52] Mailaender, L. (2012, June). Received Signal Strength (RSS) location estimation
with nuisance parameters in correlated shadow fading. In Communications (ICC),
2012 IEEE International Conference on (pp. 3659-3663). IEEE.
[53] Naik, U., & Bapat, V. N. (2013, October). Performance analysis of an indoor WLAN
location estimation. In Computational Intelligence and Information Technology,
2013. CIIT 2013. Third International Conference on (pp. 524-526). IET.
[54] Wang, Y., Ye, Q., Cheng, J., & Wang, L. (2015, December). RSSI-Based Bluetooth
Indoor Localization. In 2015 11th International Conference on Mobile Ad-hoc and
Sensor Networks (MSN) (pp. 165-171). IEEE.
[55] Vaghefi, R. M., & Buehrer, R. M. (2013, May). Received signal strength-based
sensor localization in spatially correlated shadowing. In ICASSP (pp. 4076-4080).
[56] Ciftler, B. S., Kadri, A., & Guvenc, I. (2015, March). Fundamental bounds on RSS-
based wireless localization in passive UHF RFID systems. In Wireless
Communications and Networking Conference (WCNC), 2015 IEEE (pp. 1356-1361).
IEEE.

77
[57] Denkovski, D., Angjelicinoski, M., Atanasovski, V., & Gavrilovska, L. (2012,
October). Practical assessment of RSS-based localization in indoor environments.
In MILITARY COMMUNICATIONS CONFERENCE, 2012-MILCOM 2012 (pp. 1-6).
IEEE.
[58] Stojanović, D., & Stojanović, N. (2014). Indoor localization and tracking: Methods,
technologies and research challenges. Facta Universitatis, Series: Automatic Control
and Robotics, 13(1), 57-72.
[59] Oksar, I. (2014, May). A Bluetooth signal strength based indoor localization method.
In Systems, Signals and Image Processing (IWSSIP), 2014 International Conference
on (pp. 251-254). IEEE.
[60] Budina, J., Klapka, O., Kozel, T., & Zmitko, M. (2015). Method of iBeacon Optimal
Distribution for Indoor Localization. In Modeling and Using Context(pp. 105-117).
Springer International Publishing.
[61] Palumbo, F., Barsocchi, P., Chessa, S., & Augusto, J. C. (2015, August). A
stigmergic approach to indoor localization using Bluetooth Low Energy beacons.
In Advanced Video and Signal Based Surveillance (AVSS), 2015 12th IEEE
International Conference on (pp. 1-6). IEEE.
[62] Xiao, B., Chen, H., & Zhou, S. (2007, June). A walking beacon-assisted localization
in wireless sensor networks. In Communications, 2007. ICC'07. IEEE International
Conference on (pp. 3070-3075). IEEE.

78
Appendix
A. Matlab code for path-loss modeling and Cramer-Rao
lower bound calculation:
clc;
close all;
clear all;
Pr0 = 52;
alpha = 2;
step = 0.5;
Xwall = 8:7:29;
x = 1:step:35.5;
num = length(x);
X = 10*log10(x);
WAF = unifrnd (0.3,0.7);
WAFdB = -10*log10(WAF);
noise = normrnd(0,2.5,1,num);
n = 1;
for r = 1:step:35.5;
l(n) = floor((r-1)/7);
Prr(n) = Pr0-10*alpha*log10(r)-l(n)*WAF;
PrrCOM(n) = Pr0-10*alpha*log10(r);
Pr(n) = Prr(n)+noise(n);
PrCOM(n) = PrrCOM(n)+noise(n);
p(n) = -10*log10(r);
n = n+1;
end
pave = sum(p)/length(p);
Prave = sum(Pr)/length(Pr);
PrCOMave = sum(PrCOM)/length(PrCOM);
tempX1 = 0;
tempX2 = 0;

79
tempY = 0;
for i = 1:num;
tempA1 = (p(i)-pave)*Pr(i);
tempA2 = (p(i)-pave)*PrCOM(i);
tempB = (p(i)-pave)^2;
tempX1 = tempX1+tempA1;
tempX2 = tempX2+tempA2;
tempY = tempY+tempB;
end
alphaX1 = tempX1/tempY;
alphaX2 = tempX2/tempY;
Pr0X1 = Prave - alphaX1*pave;
Pr0X2 = PrCOMave - alphaX2*pave;
for j = 1:num
PrX1(j) = Pr0X1-alphaX1*X(j);
PrX2(j) = Pr0X2-alphaX2*X(j);
end
tempZ1 = 0;
tempZ2 = 0;
tempM1 = 0;
tempM2 = 0;
tempN1 = 0;
tempN2 = 0;
for ii = 1:num
tempC1 = (PrX1(ii)-Prave)^2;
tempC2 = (PrX2(ii)-PrCOMave)^2;
tempD1 = (Pr(ii)-Prave)^2;
tempD2 = (PrCOM(ii)-PrCOMave)^2;
tempE1 = (Pr(ii)-PrX1(ii))^2;
tempE2 = (PrCOM(ii)-PrX2(ii))^2;
tempZ1 = tempZ1+tempC1;
tempZ2 = tempZ2+tempC2;
tempM1 = tempM1+tempD1;
tempM2 = tempM2+tempD2;
tempN1 = tempN1+tempE1;
tempN2 = tempN2+tempE2;
end
R1 = tempZ1/tempM1;
R2 = tempZ2/tempM2;
SD1 = sqrt(tempN1/num);
SD2 = sqrt(tempN2/num);

80
P = Pr';
One = ones(num,1);
G = [One -X' -l'];
Beta = [Pr0 alpha WAF]';
BetaX = (G'*G)^(-1)*G'*P;
Pr0X3 = BetaX(1);
alphaX3 = BetaX(2);
PrX3 = G*BetaX;
Pave = sum(Pr)/num;
R3 = (BetaX'*G'*P-num*Pave^2)/(P'*P-num*Pave^2);
SD3 = sqrt(((P'-BetaX'*G')*P)/num);
plot(X,Pr,'r.',X,PrX1);
xlabel('10*log10 value of distance');
ylabel('RSS(dBm)');
title('Linear Regression');
grid on;
figure;
plot(X,Pr,'r.',X,PrX2);
xlabel('10*log10 value of distance');
ylabel('RSS(dBm)');
title('Compensated Linear Regression');
grid on;
figure;
plot(X,Pr,'r.',X,PrX3);
xlabel('10*log10 value of distance');
ylabel('RSS(dBm)');
title('Multiple Regression');
grid on;
figure;
%%%%%%%%%%%%%%%%%%%%%%%%%%%%%%%%%%%%%%%%%%%%%%%
NUM = 5;
APx(1) = 15;
APy(1) = 15;
APx(2) = 15;
APy(2) = -15;
APx(3) = -15;
APy(3) = -15;
APx(4) = -15;

81
APy(4) = 15;
APx(5) = 0;
APy(5) = 0;
mx = -15:0.5:15;
my = -15:0.5:15;
nxy = length(mx);
SD0 = 2.5;
for yi = 1:nxy
for xi = 1:nxy
%if xi ~=
for i1 = 1:NUM
alpha2(i1) = 2.385;
r(i1,xi,yi) = sqrt((mx(xi)-APx(i1))^2+(my(yi)-
APy(i1))^2);
H1(i1,xi,yi) = -10*alpha2(i1)/(log(10))*(mx(xi)-
APx(i1))/r(i1,xi,yi)^2;
H2(i1,xi,yi) = -10*alpha2(i1)/(log(10))*(my(yi)-
APy(i1))/r(i1,xi,yi)^2;
end
H(:,:,xi,yi) = [H1(:,xi,yi) H2(:,xi,yi)];
Covv(:,:,xi,yi) = SD0^2*((H(:,:,xi,yi)'*H(:,:,xi,yi))^(-1));
SDr(xi,yi) = sqrt(Covv(1,1,xi,yi)+Covv(2,2,xi,yi));
end
end
SDr = SDr';
contourf(mx,my,SDr,20);
xlabel('X-axis(meter)');
ylabel('Y-axis(meter)');
title('Contour of Location Error Standard Deviation(meter)');
%%%%%%%%%%%%%%%%%%%%%%%%%%%%%%%%%%%%%%%%%%%%%%%%
SDrx = SDr;
SDrx(1,1) = 0;
SDrx(61,1) = 0;
SDrx(1,61) = 0;
SDrx(61,61) = 0;
SDrx(31,31) = 0;
step2 = 0.01;
range = 0:step2:10;
h = hist(SDrx,range);
cdf0 = cumsum(h)/(sum(h));
figure;

82
plot(range,cdf0,'r','linewidth',2);
grid on;
xlabel('Location Error Standard
Deviation(meter)'),ylabel('CDF'),title('The CDF of Location Error
Standard Deviation(meter)')
s = sum(SDrx);
meanx = sum(s)/(length(SDrx))^2;
variance = std(SDrx(:));
B. Matlab code for Cramer-Rao lower bound considering
coverage probability and variable shadow fading:
clear all;close all;
%% basic path loss model
alpha1=2; % power gridiant
lpmax=75; % max path loss in dB
%sigma1=8; % standard deviation of shadow fading
f=2.4e9; % transmitting frequency
c=3e8; % speed of light
lamda=c/f; % wave length
L0=40; % 1st meter path loss
pace=0.5;
reliablity = 0.9;
%Distance=40;
t = 1;
o = 1;
for Distance = 30:1:65;
% x1=0;y1=0;
% x2=0;y2=Distance;
% x3=Distance;y3=Distance;
% x4=Distance;y4=0;
x1=Distance/4;y1=Distance/4;
x2=Distance/4;y2=3*Distance/4;
x3=3*Distance/4;y3=3*Distance/4;
x4=3*Distance/4;y4=Distance/4;

83
x=0:pace:Distance;y=0:pace:Distance;
L1=length(x);
r1=zeros(L1,L1);
r2=zeros(L1,L1);
r3=zeros(L1,L1);
r4=zeros(L1,L1);
for i=1:1:L1
for j=1:1:L1
r1(i,j)=sqrt((x(i)-x1)^2+(y(j)-y1)^2);
r2(i,j)=sqrt((x(i)-x2)^2+(y(j)-y2)^2);
r3(i,j)=sqrt((x(i)-x3)^2+(y(j)-y3)^2);
r4(i,j)=sqrt((x(i)-x4)^2+(y(j)-y4)^2);
end
end
lp1=L0+max(10*alpha1*log10(r1),-L0);
lp2=L0+max(10*alpha1*log10(r2),-L0);
lp3=L0+max(10*alpha1*log10(r3),-L0);
lp4=L0+max(10*alpha1*log10(r4),-L0);
alpha2=-4.28;
beta=0.9372;
gamma0=4.31;
sigma1=alpha2*exp(-beta*r1)+gamma0;
sigma2=alpha2*exp(-beta*r2)+gamma0;
sigma3=alpha2*exp(-beta*r3)+gamma0;
sigma4=alpha2*exp(-beta*r4)+gamma0;
for p=1:1:L1
for q=1:1:L1
pc1(p,q)=1-0.5*erfc((lpmax-lp1(p,q))/sqrt(2)/sigma1(p,q));
pc2(p,q)=1-0.5*erfc((lpmax-lp2(p,q))/sqrt(2)/sigma2(p,q));
pc3(p,q)=1-0.5*erfc((lpmax-lp3(p,q))/sqrt(2)/sigma3(p,q));
pc4(p,q)=1-0.5*erfc((lpmax-lp4(p,q))/sqrt(2)/sigma4(p,q));
end
end
[c1,h1] = contour(x,y,pc1','w','LevelList',[reliablity],'linewidth',3);
R1 = sqrt((c1(1,2)-x1)^2+(c1(2,2)-y1)^2);
if Distance == 60;

84
subplot(2,2,1);
[X1,Y1]=contourf(x,y,pc1',20);
xlabel('distance(m)'),ylabel('distance(m)'),title('The probabilities
found by AP1');
hold on;
[c1,h1] = contour(x,y,pc1','w','LevelList',[reliablity],'linewidth',3);
R1 = sqrt((c1(1,2)-x1)^2+(c1(2,2)-y1)^2);
clabel(c1,h1);
subplot(2,2,2);
[X2,Y2]=contourf(x,y,pc2',20);
xlabel('distance(m)'),ylabel('distance(m)'),title('The probabilities
found by AP2');
hold on;
[c2,h2] = contour(x,y,pc2','w','LevelList',[reliablity],'linewidth',3);
R2 = sqrt((c2(1,2)-x2)^2+(c2(2,2)-y2)^2);
clabel(c2,h2);
subplot(2,2,3);
[X3,Y3]=contourf(x,y,pc3',20);
xlabel('distance(m)'),ylabel('distance(m)'),title('The probabilities
found by AP3');
hold on;
[c3,h3] = contour(x,y,pc3','w','LevelList',[reliablity],'linewidth',3);
R3 = sqrt((c3(1,2)-x3)^2+(c3(2,2)-y3)^2);
clabel(c3,h3);
subplot(2,2,4);
[X4,Y4]=contourf(x,y,pc4',20);
xlabel('distance(m)'),ylabel('distance(m)'),title('The probabilities
found by AP4');
hold on;
[c4,h4] = contour(x,y,pc4','w','LevelList',[reliablity],'linewidth',3);
R4 = sqrt((c4(1,2)-x4)^2+(c4(2,2)-y4)^2);
clabel(c4,h4);
figure;
end
%% Coverage Probability
% 0 access is covered
p0=(1-pc1).*(1-pc2).*(1-pc3).*(1-pc4);

85
% 1 access point is covered
p11=pc1.*(1-pc2).*(1-pc3).*(1-pc4);
p12=pc2.*(1-pc1).*(1-pc3).*(1-pc4);
p13=pc3.*(1-pc1).*(1-pc2).*(1-pc4);
p14=pc4.*(1-pc1).*(1-pc2).*(1-pc3);
p1=p11+p12+p13+p14;
% 2 access points are covered
p21=pc1.*pc2.*(1-pc3).*(1-pc4);
p22=pc1.*pc3.*(1-pc2).*(1-pc4);
p23=pc1.*pc4.*(1-pc2).*(1-pc3);
p24=pc2.*pc3.*(1-pc1).*(1-pc4);
p25=pc2.*pc4.*(1-pc1).*(1-pc3);
p26=pc3.*pc4.*(1-pc1).*(1-pc2);
p2=p21+p22+p23+p24+p25+p26;
% 3 access points are covered
p31=pc1.*pc2.*pc3.*(1-pc4);
p32=pc1.*pc2.*pc4.*(1-pc3);
p33=pc1.*pc3.*pc4.*(1-pc2);
p34=pc2.*pc3.*pc4.*(1-pc1);
p3=p31+p32+p33+p34;
% 4 access points are covered
p4=pc1.*pc2.*pc3.*pc4;
pcheck=p1+p2+p3+p4;
%% Cramer Lower Bound
for m=1:1:L1
for n=1:1:L1
crlb1(m,n)=log(10)*r1(m,n)*sigma1(m,n)/(10*alpha1);
crlb2(m,n)=log(10)*r2(m,n)*sigma2(m,n)/(10*alpha1);
crlb3(m,n)=log(10)*r3(m,n)*sigma3(m,n)/(10*alpha1);
crlb4(m,n)=log(10)*r4(m,n)*sigma4(m,n)/(10*alpha1);
end
end
% 1 access point is covered
crlb11=crlb1;
crlb12=crlb2;
crlb13=crlb3;
crlb14=crlb4;
% 2 access points are covered

86
crlb21=(crlb1+crlb2)/2;
crlb22=(crlb1+crlb3)/2;
crlb23=(crlb1+crlb4)/2;
crlb24=(crlb2+crlb3)/2;
crlb25=(crlb2+crlb4)/2;
crlb26=(crlb3+crlb4)/2;
% 3 access points are covered
crlb31=(crlb1+crlb2+crlb3)/3;
crlb32=(crlb1+crlb2+crlb4)/3;
crlb33=(crlb1+crlb3+crlb4)/3;
crlb34=(crlb2+crlb3+crlb4)/3;
% 4 access points are covered
crlb41=(crlb1+crlb2+crlb3+crlb4)/4;
crlbt1=p11.*crlb11+p12.*crlb12+p13.*crlb13+p14.*crlb14;
crlbt2=p21.*crlb21+p22.*crlb22+p23.*crlb23+p24.*crlb24+p25.*crlb25+p26.*
crlb26;
crlbt3=p31.*crlb31+p32.*crlb32+p33.*crlb33+p34.*crlb34;
crlbt4=p4.*crlb41;
crlbt=(crlbt1+crlbt2+crlbt3+crlbt4)/4;
if Distance == 60;
subplot(2,2,1);
[C1,h1]=contour3(x,y,crlbt1,80);
xlabel('distance(m)'),ylabel('distance(m)'),title('The CRLB found by 1
AP');
subplot(2,2,2);
[C2,h2]=contour3(x,y,crlbt2,80);
xlabel('distance(m)'),ylabel('distance(m)'),title('The CRLB found by 2
APs');
subplot(2,2,3);
[C3,h3]=contour3(x,y,crlbt3,80);
xlabel('distance(m)'),ylabel('distance(m)'),title('The CRLB found by 3
APs');
subplot(2,2,4);
[C4,h4]=contour3(x,y,crlbt4,80);
xlabel('distance(m)'),ylabel('distance(m)'),title('The CRLB found by 4
APs');
figure;
CRLB60 = crlbt;
x60=0:pace:Distance;y60=0:pace:Distance;

87
end
%clabel(C,h);
crlb1mean(t) = mean(crlbt1(:),1);
crlb1std(t) = std(crlb1(:),0,1);
crlb2mean(t) = mean(crlbt2(:),1);
crlb2std(t) = std(crlb2(:),0,1);
crlb3mean(t) = mean(crlbt3(:),1);
crlb3std(t) = std(crlb3(:),0,1);
crlb4mean(t) = mean(crlbt4(:),1);
crlb4std(t) = std(crlb4(:),0,1);
crlbAllmean(t) = mean(crlbt(:),1);
crlbAllstd(t) = std(crlbt(:),0,1);
gamma2(t) = R1/Distance;
if gamma2(t) < 0.4
CRLB1 = crlbt;
elseif gamma2(t) < 0.5
CRLB2 = crlbt;
elseif gamma2(t) < 0.6
CRLB3 = crlbt;
elseif gamma2(t) < 0.7
CRLB4 = crlbt;
elseif gamma2(t) < 0.8
CRLB5 = crlbt;
elseif gamma2(t) < 0.9
CRLB6 = crlbt;
end
if t == 1
gammamax = R1/Distance;
CRLBend = crlbt;
xmax=0:pace:Distance;ymax=0:pace:Distance;
end
t = t+1;
end
CRLBendmean(t) = mean(CRLBend(:));
CRLBendstd(t) = std(CRLBend(:));
[Cx,hx]=contourf(xmax,ymax,CRLBend,20);
xlabel('distance(m)'),ylabel('distance(m)'),title('The overall CRLB
under practical conditions');
figure;

88
[Cx,hx]=contour3(x60,y60,CRLB60,80);
xlabel('distance(m)'),ylabel('distance(m)'),title('The overall CRLB
under practical conditions');
step2 = 0.01;
range = 0:step2:10;
h = hist(CRLBend,range);
cdf3 = cumsum(h)/(sum(h));
load cdf4.mat
figure;
plot(range,cdf4,'r',range,cdf3,'linewidth',2);
legend('traditional CRLB','CRLB under practical conditions');
xlabel('distance(m)'),ylabel('probability'),title('The CDF of CRLB');
grid on;
figure;
plot(gamma2,crlbAllmean,'r','linewidth',2);
xlabel('Gamma(Reliable Coverage/Room size)');
ylabel('mean of CRLB');
title('Gamma(Reliable Coverage/Room size) vs mean of CRLB');
legend('mean of overall CRLB');
grid on;
figure;
plot(gamma2,crlbAllstd,'r','linewidth',2);
xlabel('Gamma(Reliable Coverage/Room size)');
ylabel('standard variance of CRLB');
title('Gamma(Reliable Coverage/Room size) vs standard variance of
CRLB');
legend('standard variance of overall CRLB');
grid on;
%% cdf
figure;
step = 0.01;
for k = 1:5
if k == 1
CRLB = CRLB2;
Min = min(CRLB(:));
Max = max(CRLB(:));
range1 = Min:step:Max;
h1 = hist(CRLB,range1);
cdf1 = cumsum(h1)/(sum(h1));
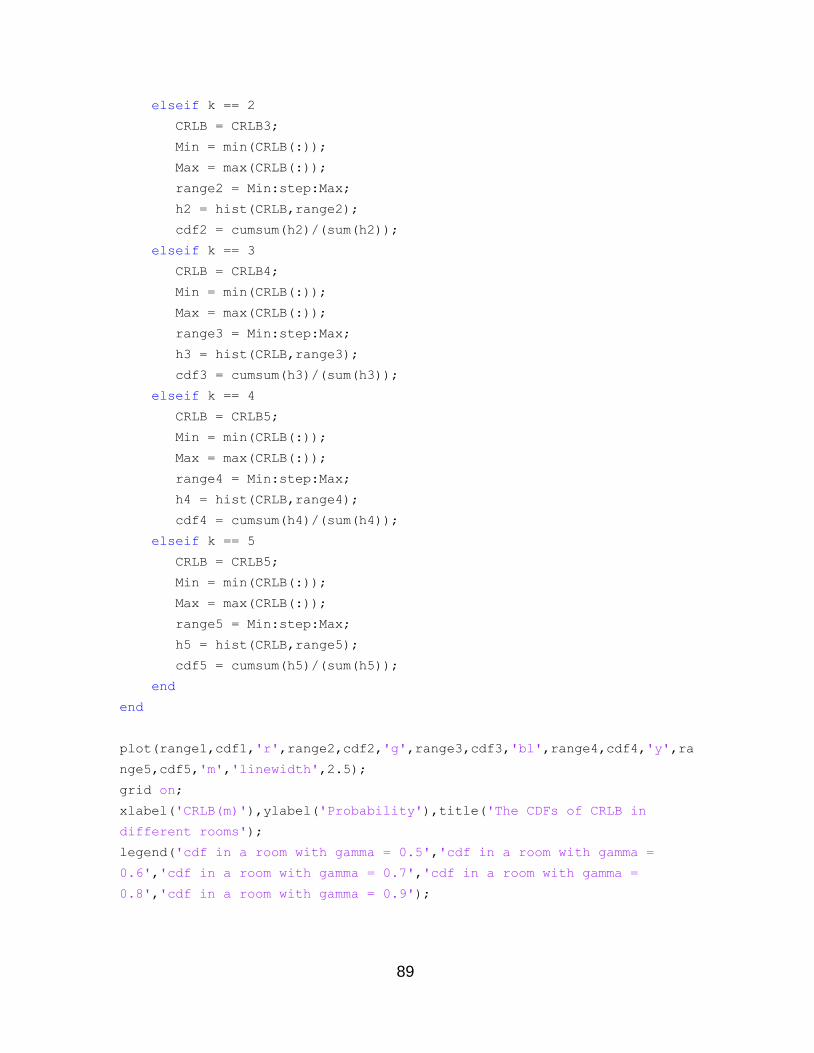
89
elseif k == 2
CRLB = CRLB3;
Min = min(CRLB(:));
Max = max(CRLB(:));
range2 = Min:step:Max;
h2 = hist(CRLB,range2);
cdf2 = cumsum(h2)/(sum(h2));
elseif k == 3
CRLB = CRLB4;
Min = min(CRLB(:));
Max = max(CRLB(:));
range3 = Min:step:Max;
h3 = hist(CRLB,range3);
cdf3 = cumsum(h3)/(sum(h3));
elseif k == 4
CRLB = CRLB5;
Min = min(CRLB(:));
Max = max(CRLB(:));
range4 = Min:step:Max;
h4 = hist(CRLB,range4);
cdf4 = cumsum(h4)/(sum(h4));
elseif k == 5
CRLB = CRLB5;
Min = min(CRLB(:));
Max = max(CRLB(:));
range5 = Min:step:Max;
h5 = hist(CRLB,range5);
cdf5 = cumsum(h5)/(sum(h5));
end
end
plot(range1,cdf1,'r',range2,cdf2,'g',range3,cdf3,'bl',range4,cdf4,'y',ra
nge5,cdf5,'m','linewidth',2.5);
grid on;
xlabel('CRLB(m)'),ylabel('Probability'),title('The CDFs of CRLB in
different rooms');
legend('cdf in a room with gamma = 0.5','cdf in a room with gamma =
0.6','cdf in a room with gamma = 0.7','cdf in a room with gamma =
0.8','cdf in a room with gamma = 0.9');