Embed Size (px)
Citation preview

Abstract Volume11th Swiss Geoscience MeetingLausanne, 15th – 16th November 2013
18. Geoscience and Geoinformation - From data acquisition to modelling and visualisation

2Sy
mp
osi
um
18:
Geo
scie
nce
an
d G
eoin
form
atio
n
Platform Geosciences, Swiss Academy of Science, SCNATSwiss Geoscience Meeting 2013
18. Geoscience and Geoinformation - From data acquisition to modelling and visualisation
Nils Oesterling, Adrian Wiget, Massimiliano Cannata
Swiss Geodetic Commission, Swiss Geotechnical Commission, Swiss Geophysical Commission, Swiss Hydrogeological Society
TALKS:
18.1 Akhtman Y., Rehak M., Constantin D., Tarasov M., Lemmin U.: Remote sensing methodology for an ultralight plane
18.2 Anselmetti F., Hilbe M., Girardclos St., Kremer K., Niemann St., Wessels M., Wildi. W.: Under water landscapes - The last frontier of geomorphologic explorations (Keynote)
18.3 Aubert M., Kraiem A., Haeberlin Y., Zwahlen F.: From satellite imagery to hydrogeological survey maps of Chad
18.4 Baumberger R., Herwegh M., Kissling E., Wehrens P.: Towards the semi-automated analysis of lineaments in the Aar massif: uncertainty estimates for geological surface information – A combined remote sensing and field data approach
18.5 Cannata M., Antonovic M., Molinari M.: HELI-DEM: Helvetia-Italy Digital Elevation Model
18.6 Nussbaum M., Papritz A., Walthert L.: Predicting soil density of Swiss forests by component wise gradient boosting
18.7 Papritz A., Grêt-Regamey A., Keller A.: NRP68 projects PMSoil, iMSoil, OPSOL: From legacy soil data and element cycles in agro-ecosystems to a land use decision support system for sustainable use of soils
18.8 Rickenbacher M.: Journeys through time with the Swiss national map series
POSTERS:
P 18.1 Franz M., Podladchikov Y., Jaboyedoff M.: Modelling landslide-generated tsunamis in alpine lakes
P 18.2 Jaquet S., Schwab M., Yersin R., Ribeiro D.: Geographical information system for materials management in the canton Fribourg (Switzerland)
P 18.3 Molinari M., Cannata M., Ambrosi C., Meisina C.: A new open-source simulation model for fast landslide runout assessment
P 18.4 Neyer F., Limpach Ph., Geiger A.: Monitoring rock glaciers with GPS and high-resolution cameras
P 18.5 Psimoulis P., Houlié N., Meindl M., Rothacher M., Clinton J., Dalguer L.: Estimation of maximum ground shaking for the Tohoku 2011 earthquake based on collocated GPS and strong-motion data
P 18.6 Rogers S.R., Fischer M.: GlaciArch: applying glaciological methods for gauging archaeological potential using GIS

3
Sym
po
siu
m 1
8: G
eosc
ien
ce a
nd
Geo
info
rmat
ion
Platform Geosciences, Swiss Academy of Science, SCNATSwiss Geoscience Meeting 2013
18.1
Remote sensing methodology for an ultralight plane
Yosef Akhtman1, Martin Rehak1, Dragos Constantin1, Michael Tarasov2 and Ulrich Lemmin1
1 Department of Environmental Engineering, École Polytechnique Fédérale de Lausanne, Lausanne, Switzerland ([email protected])2 Faculty of Geography, Moscow State University, Moscow, Russian Federation
Over a short period of eight months starting in October 2012, we have developed and deployed a remote sensing platform optimised for the collection of multispectal and hyperspectral observations of both land and water surfaces from an ult-ralight aircraft. The platform is comprised of four cameras, auxiliary GNSS position and orientation sensors, as well as data recording equipment. The development was carried out as part of the international Leman-Baikal research project of the Limnology Research Centre of EPFL.
Our main instrument is constituted by an Alava ARS3 system, which is based on a Headwall Photonics Micro Hyperspec VNIR sensor. In addition, the platform includes two high-resolution RGB and near-infrared sensors based on consumer-grade Sony NEX-5r cameras, as well as a thermal infrared sensor based on the DIAS Pyroview 640L Compact camera. The resultant remote sensing platform is portrayed in Figure 1. As principal carrier we have utilised the Air Creation Tanarg 912S ultralight aircraft depicted in Figure 2.
Figure 1: Multispectral and hyperspectral remote sensing platform installed on an ultralight aircraft.
The scientific objectives of the developed platform were centered on a series of limnological studies, in particular the exploration of remote sensing methodologies for the analysis of hydrological processes, such as the runoff dynamics of both natural and anthropogenic origins, as well as the study of processes pertaining to the land-water and air-water inter-faces in lakes.
During the stage of the system development, as well as during the collection of the initial data, we have conducted a series of f lights in the Lake Geneva area. Our initial points of interest included the plumes of rivers Venoge and Rhone in the lake, which exhibit a particularly wide range of visually observable hydrological phenomena.
In the consequent stage of the project, which took place during the months June and July of 2013, we have carried out a comprehensive field campaign in the area of delta of river Selenga in Southern Siberia region of the Russian Federation. The campaign was conducted in close collaboration with the Geography Faculty of the Moscow State University and the Institute of Nature Resource Management in Ulan Ude. Our airborne observations were complemented by extensive groundwork, which included the collection and analysis of in situ samples, as well as the recording of the corresponding spectral reflectance signatures of the water surface.

4Sy
mp
osi
um
18:
Geo
scie
nce
an
d G
eoin
form
atio
n
Platform Geosciences, Swiss Academy of Science, SCNATSwiss Geoscience Meeting 2013
Figure 2: Air Creation Tanarg 912S ultralight aircraft with the remote sensing platform installed (left) and the f light trajectories for the
Baikal 2013 phase of the Leman-Baikal project (right).
The field campaign resulted in the collection of the total of around 7 Terabytes of airborne remote sensing data covering an area in excess of 1000 km2, including more than 100 in situ sampling sites indicated in Figure 2. We have conducted a range of methodological experiments, while collecting data from different altitudes between 500 and 2500 meters, re-sulting in the ground resolution for the high-resolution RGB/nIR imagery of approximately 16 to 80 cm per pixel, respec-tively.
The results of the preliminary analysis of the collected data demonstrate its suitability for the generation of a wide range of remote sensing products exemplified in Figure 4. A detailed analysis of the collected data is in progress and further field campaigns over both lakes are planned for the period of the next two years.
(a) (b) (c)
(d) (e)
Figure 3: Examples of remote sensing products, including hyperspectral cubes (a), thermal maps (b), metric surface morphology analy-
sis (c), DTMs (d), as well as various types of manual and automated land cover classification maps (e).
The financial support of this research by the Ferring Pharmaceutics, St-Prex, Switzerland and the Metropol Group of Companies, Moscow, Russian Federation is thankfully acknowledged.
5
Sym
po
siu
m 1
8: G
eosc
ien
ce a
nd
Geo
info
rmat
ion
Platform Geosciences, Swiss Academy of Science, SCNATSwiss Geoscience Meeting 2013
18.2
Under water landscapes - The last frontier of geomorphologic explorations
Anselmetti, Flavio S.1, Hilbe, Michael1, Girardclos, Stéphanie2, Kremer, Katrina2, Niemann, Steffen3, Wessels, Martin3, Wildi, Walter2
1 Institute of Geological Sciences and Oeschger Centre for Climate Change Research, University of Bern, Baltzerstrasse 1+3, 3012 Bern, Switzerland ([email protected]; [email protected])2 Department of Earth sciences, Institut des Sciences de l’Environnement and Institut Forel, University of Geneva, Rue des Maraîchers 13, CH-1205 Geneva, Switzerland ([email protected]; [email protected]; [email protected] Landesanstalt für Umwelt, Messungen und Naturschutz Baden-Württemberg, Institut für Seenforschung, Argenweg 50/1 88085 Langenargen, Germany ([email protected]; [email protected])
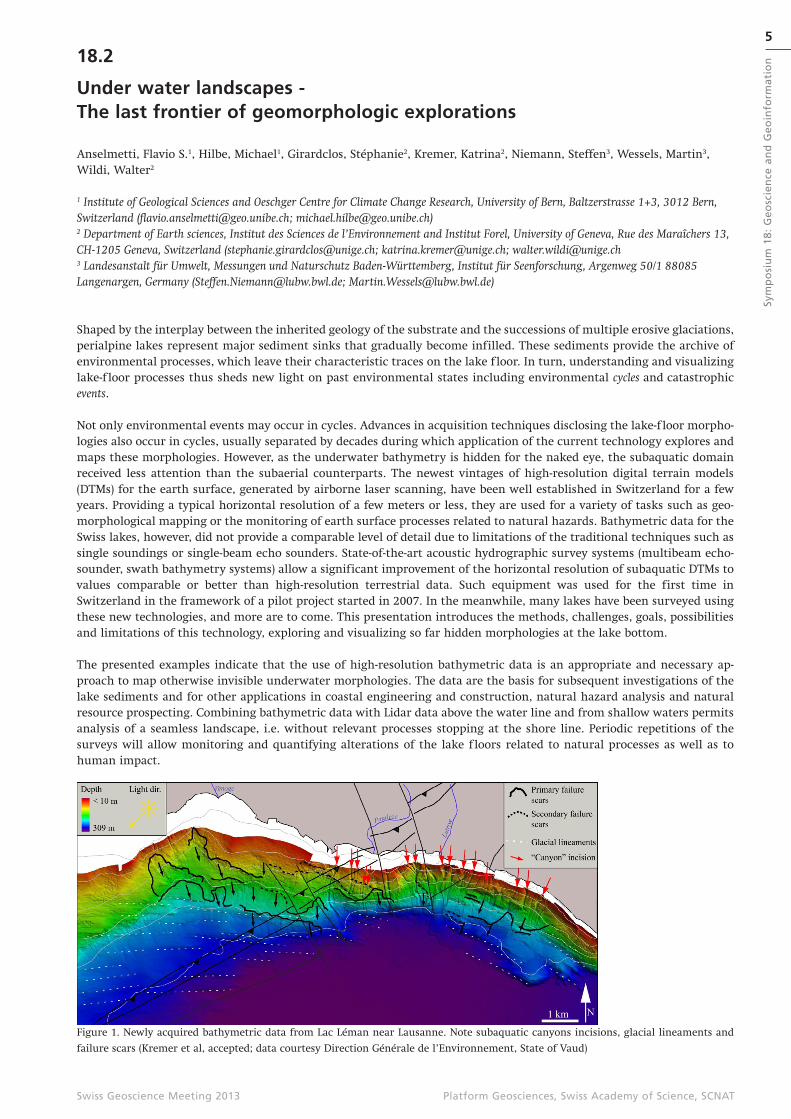
Shaped by the interplay between the inherited geology of the substrate and the successions of multiple erosive glaciations, perialpine lakes represent major sediment sinks that gradually become infilled. These sediments provide the archive of environmental processes, which leave their characteristic traces on the lake f loor. In turn, understanding and visualizing lake-f loor processes thus sheds new light on past environmental states including environmental cycles and catastrophic events.
Not only environmental events may occur in cycles. Advances in acquisition techniques disclosing the lake-f loor morpho-logies also occur in cycles, usually separated by decades during which application of the current technology explores and maps these morphologies. However, as the underwater bathymetry is hidden for the naked eye, the subaquatic domain received less attention than the subaerial counterparts. The newest vintages of high-resolution digital terrain models (DTMs) for the earth surface, generated by airborne laser scanning, have been well established in Switzerland for a few years. Providing a typical horizontal resolution of a few meters or less, they are used for a variety of tasks such as geo-morphological mapping or the monitoring of earth surface processes related to natural hazards. Bathymetric data for the Swiss lakes, however, did not provide a comparable level of detail due to limitations of the traditional techniques such as single soundings or single-beam echo sounders. State-of-the-art acoustic hydrographic survey systems (multibeam echo-sounder, swath bathymetry systems) allow a significant improvement of the horizontal resolution of subaquatic DTMs to values comparable or better than high-resolution terrestrial data. Such equipment was used for the first time in Switzerland in the framework of a pilot project started in 2007. In the meanwhile, many lakes have been surveyed using these new technologies, and more are to come. This presentation introduces the methods, challenges, goals, possibilities and limitations of this technology, exploring and visualizing so far hidden morphologies at the lake bottom.
The presented examples indicate that the use of high-resolution bathymetric data is an appropriate and necessary ap-proach to map otherwise invisible underwater morphologies. The data are the basis for subsequent investigations of the lake sediments and for other applications in coastal engineering and construction, natural hazard analysis and natural resource prospecting. Combining bathymetric data with Lidar data above the water line and from shallow waters permits analysis of a seamless landscape, i.e. without relevant processes stopping at the shore line. Periodic repetitions of the surveys will allow monitoring and quantifying alterations of the lake f loors related to natural processes as well as to human impact.
Figure 1. Newly acquired bathymetric data from Lac Léman near Lausanne. Note subaquatic canyons incisions, glacial lineaments and
failure scars (Kremer et al, accepted; data courtesy Direction Générale de l’Environnement, State of Vaud)
6Sy
mp
osi
um
18:
Geo
scie
nce
an
d G
eoin
form
atio
n
Platform Geosciences, Swiss Academy of Science, SCNATSwiss Geoscience Meeting 2013
REFERENCESHilbe, M., Anselmetti, F.S., Eilertsen, R.S., Hansen, L. and Wildi, W., 2011: Subaqueous morphology of Lake Lucerne
(Central Switzerland): Implications for mass movements and glacial history, Swiss Journal of Geosciences 104, 425-443.
Hilbe, M. and Anselmetti, F.S., subm.: Mass movement-induced tsunami hazard on perialpine Lake Lucerne (Switzerland): Scenarios and numerical experiments, subm. to Pure and Applied Geophysics.
Kremer, K., Marillier, F., Hilbe, M., Simpson, G., Dupuy, D., Yrro, B.J.F., Rachoud-Schneider, A.-M., Corboud, P., Bellwald, B., Wildi, W. and Girardclos, S. accepted. Lake dwellers occupation gap in Lake Geneva (France-Switzerland) possibly explained by an earthquake – mass movement – tsunami event during Early Bronze Age. Earth and Planetary Science Letters.
Sastre, V., Loizeau, J.-L., Greinert, J., Naudts, L., Arpagaus, P., Anselmetti, F., Wessels, M. , Bussmann, I. , Schloemer, S. , Schlüter, M. and Böder, V., 2010: Distribution, morphology, and formation of pockmarks in Lake Constance, Germany , Limnology and Oceanography 55, 2623-2633.
Wildi, W., 2010: Morphology and recent history of the Rhone River Delta in Lake Geneva (Switzerland), Swiss Journal of Geoscience 103, 33-42.
18.3
From satellite imagery to hydrogeological survey maps of Chad
Aubert Maëlle1, Kraiem Amira1, Haeberlin Yves1, Zwahlen François2
1 UNOSAT, United Nations Institute for Training and Research (UNITAR), Palais des Nations, CH-1211 Genève ([email protected])2CHYN, University of Neuchâtel, Rue Emile-Argand 11, CH-2000 Neuchâtel
The RésEAU Chad project implemented by UNITAR on behalf of the Ministry of Rural and Urban Hydraulics aims to make available exhaustive, pertinent information about the nature, extent, and potential of the aquifers to all actors in the water resources management sector. To meet this objective, existing data must be consolidated concerning the geology, hydrology and soils in Chad, areas where information is lacking need to be identified and the gap need to be filled by generating additional data. Given Chad´s surface area and the difficulties to access remote regions, it is highly improbab-le that full coverage can be achieved through field surveys. Given the context, optical and radar satellite sensors provide cost-effective data to support a geological, structural and hydrogeological interpretation of the territory.
A methodology has been developed to produce hydrogeological maps using satellite imagery and a limited amount of field data (Fig. 1). It can be applied to the areas of Chad with sparse vegetation cover, namely the North and the East.
• Step I - Geological regions are delimited by photointerpretation then subdivided into rock types based on various petrographic and contextual criteria.
• Step II - a hydrogeologist converts the rock types into hydrogeological units based on their nature and local know-ledge, and then ranks them according to their potential productivity in aquifers, aquicludes or aquitards.
• Step III - The various units are represented on a base map with the water points to produce a hydrogeological map.
At map scales of 1:200,000 and 1:500,000, the most appropriate satellite images are LANDSAT-7 and ASTER scenes because of the variety of their spectral ranges. After calibrating the images, derivative products are calculated using band ratios (color compositions by Sultan et al., 1987, and Ninomiya et al., 2005) or as principal components (PCA). These products help convey the maximum amount of information about the geology and soils, more specifically on rock varnishes and surficial alterations. Photointerpretation of these color images was used to delimit alluvial deposits and to map bedrock/sandstone and bedrock/volcanic rock contacts. These correspond to the geological regions that make up the territory. A narrow subdivision of these regions is then completed, based on different criteria, such as morphology (slope, plateau, rupture), stratigraphic and cutting relationships, adjacent (neighbouring lithologies) and contextual (soils, vegetation co-ver) determinants and textures such as foliations and circular structures. Field samples, exogenous data (old maps) and background images from Bing and Google Earth are used to plug some holes in the interpretation process. Radar imagery

7
Sym
po
siu
m 1
8: G
eosc
ien
ce a
nd
Geo
info
rmat
ion
Platform Geosciences, Swiss Academy of Science, SCNATSwiss Geoscience Meeting 2013
will also be used to help detect wet zones and faults. For topology reasons and to facilitate corrections and future updates, the decision was made to work with polylines in the GIS. To this end, ToolMap software (Schreiber et al., 2009) was used to model, vectorise and export geological information in the form of polygons. The hydrogeological units are an interpretation of the lithologies based on their water potential, defined by:
• their nature (detrital, carbonate, volcanic, metamorphic, intrusive, regolith)• their porosity (loose rock, consolidated),• their grain size, and• their permeability or capacity to let water circulate.
The rock´s condition is also taken into account (altered, fissured, fractured or karstic), as is the layer’s geometry, the hy-draulic parameters and productivity, the piezometric levels of the wells/boreholes and their frequency within the unit. Using his synthetic skills and his experience, the hydrogeologist is able to attribute variable aquifer potentials to the units.
The survey maps obtained highlight groundwater followed by surface water and finally geology, using a standard base map. They offer a novel synthesis on a relatively large scale of the hydrogeology of the regions under investigation, the details of which were unknown until now. Despite their partly speculative content, they nevertheless allow for both a relatively precise measurement of the nature, extent and importance of water resources in these regions and for planning their use.
Figure 1. Methodological f lowchart for developing hydrogeological units and survey map.
REFERENCESNinomiya, Y., Fu, B. & Cudahy T.J. 2005: Detecting lithology with Advanced Spaceborne Thermal Emission and Reflection
Radiometer (ASTER) multispectral thermal infrared radiance-at-sensor data. Remote Sens. Environ. 99, 127-139.Schreiber, L., Ornstein, P., Sartori, M., & Kühni A. 2009. ToolMap – “Sion” method: development of a new GIS Framework
for digital geological mapping. 6th EUREGEO, Munich 2009, Proceedings, I, 89–90. www.toolmap.chSultan, M., Arvidson, R.E., Sturchio, N.C. & Guinnes E.A. 1987: Lithologic mapping in arid regions with Landsat TM data:
Meatiq dome, Egypt. Bull. Geol. Soc. Amer. 99, 748-762.

8Sy
mp
osi
um
18:
Geo
scie
nce
an
d G
eoin
form
atio
n
Platform Geosciences, Swiss Academy of Science, SCNATSwiss Geoscience Meeting 2013
18.4
Towards the semi-automated analysis of lineaments in the Aar massif: uncertainty estimates for geological surface information – A combined remote sensing and field data approach
Roland Baumberger 1,3; Marco Herwegh 1; Edi Kissling 2, Philip Wehrens 1,
1 University of Bern, Institute of Geological Sciences, Baltzerstrasse 1+3, CH-3012 Bern2 ETH Zurich; Institute of Geophysics; Sonneggstrasse 5; CH-8092 Zurich3 Federal Office of Topography, Swiss Geological Survey, Seftigenstrasse 264, CH-3084 Wabern ([email protected])
The quality, consistency and density of geological surface information is of key importance for the development of geo-logical three-dimensional (3D) models in areas, where underground data is lacking. One of the major problems with such models is the determination of their uncertainties, particularly with increasing distance from the surface. The intrinsic uncertainty of the surface information, therefore, needs to be accurately characterized, methodologically recorded, quan-tified, evaluated and described. Here, a methodology is presented that combines both semi-automated remote sensing data acquisition and subsequent evaluation in the field to allow consistent acquisition and uncertainty assessment for large data sets.
The basic idea consists on the fact that mechanical anisotropies, such as shear zones and faults, are prominently expressed in surface morphology. These surface geometries can be mapped by means of remote sensing based on a high resolution digital elevation model (DEM) and orthophotos providing information for 3D modeling of subsurface structures by depth projecting their surface intersections.
We investigate the Alpine 3D deformation of the crystalline rocks of the Aar massif (Haslital, Central Switzerland). by establishing a lineament map consisting of 32’000 features complemented by manual quality control. The data set subse-quently underwent geostatistical verification, in order to obtain a valid basis for further analysis. As a final step, the line-ament map was transformed into a shear zone map.
Lineament analysis reveals an increase in lineament density from N to S in the study area, which corresponds very well with the formation and deformation history of the lithological units present. Two main striking directions exist WSW-ENE and WNW-ESE, which are sub-parallel and perpendicular to the strike of the Aar massif, respectively. This finding mimics again the current geological setting.
Investigation of the shear zone map using 360 outcrop data shows that the quality of the remote sensing data very well fits field measurements. About 60% of the shear zones mapped in the field and those evaluated via remote sensing, show differences of less than 20° in strike directions. The remaining 40% are related to secondary structures not resolved on the digital data but visible at the outcrop scale. Hence, we note a scale-dependent effect in the automated remote sensing re-sults and a reasonable and consistent observation error.
The orientation of lineaments of each of the four units within the plutonic rock complex of the Aar massif (Grimsel Granodiorite, Zentraler Aaregranite, Südlicher Aaregranite, Mittagfluh granite) is very heterogeneous. For these units, we can demonstrate that there exists a correlation between formation age, mineralogical composition, deformation history and the orientation of the lineaments. The main focus of future works will be laid on the projection of surface structures to depth and their verification in the various tunnels and caverns present in the study area.
9
Sym
po
siu
m 1
8: G
eosc
ien
ce a
nd
Geo
info
rmat
ion
Platform Geosciences, Swiss Academy of Science, SCNATSwiss Geoscience Meeting 2013
18.5
HELI-DEM: Helvetia-Italy Digital Elevation Model
Cannata Massimiliano1, Antonovic Milan1, Molinari Monia1
1 Institute of Earth Sciences, University of Applied Sciences and Arts of Southern Switzerland, Campus Trevano, CH-6952, Canobbio([email protected])
HELI-DEM (Helvetia-Italy Digital Elevation Model) is a project developed in the framework of Italy/Switzerland Operational Programme for Trans-frontier Cooperation 2007-2013 whose major aim is to create a unified digital terrain model that includes the alpine and subalpine areas between Italy and Switzerland. The partners of the project are: Lombardy Region, Piedmont Region, Polytechnic of Milan, Polytechnic of Turin and Fondazione Politecnico from Italy; Institute of Earth Sciences (SUPSI) from Switzerland.
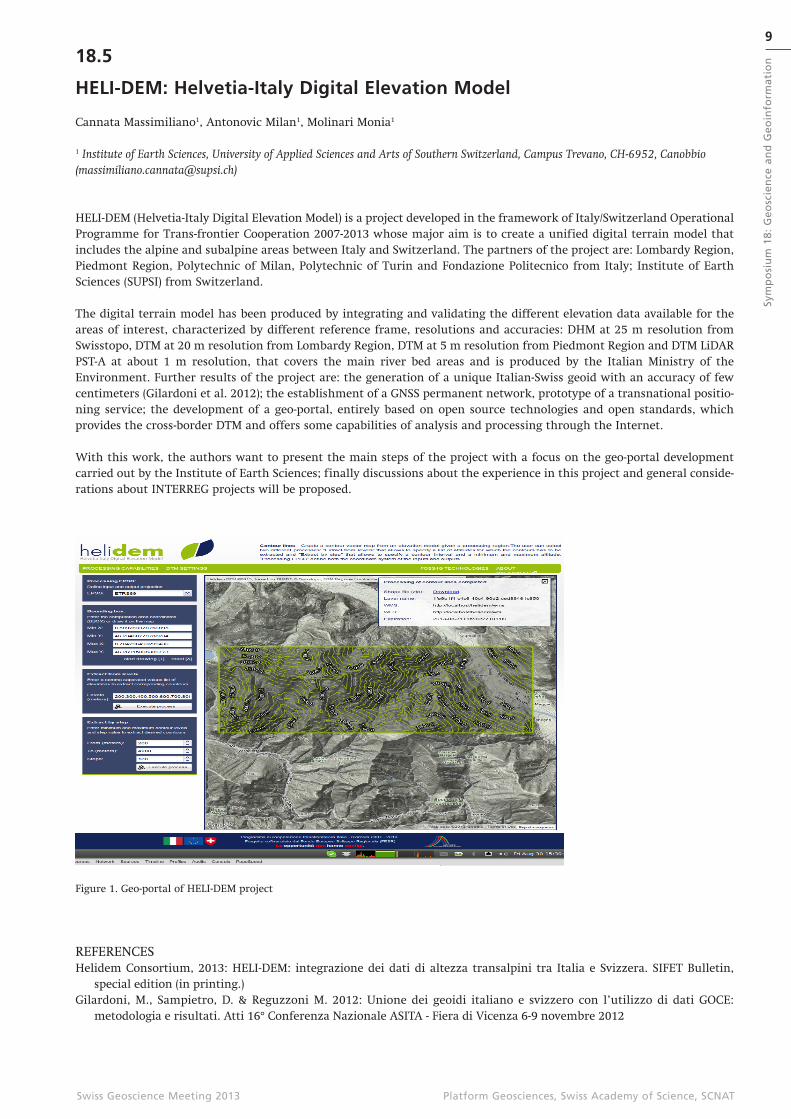
The digital terrain model has been produced by integrating and validating the different elevation data available for the areas of interest, characterized by different reference frame, resolutions and accuracies: DHM at 25 m resolution from Swisstopo, DTM at 20 m resolution from Lombardy Region, DTM at 5 m resolution from Piedmont Region and DTM LiDAR PST-A at about 1 m resolution, that covers the main river bed areas and is produced by the Italian Ministry of the Environment. Further results of the project are: the generation of a unique Italian-Swiss geoid with an accuracy of few centimeters (Gilardoni et al. 2012); the establishment of a GNSS permanent network, prototype of a transnational positio-ning service; the development of a geo-portal, entirely based on open source technologies and open standards, which provides the cross-border DTM and offers some capabilities of analysis and processing through the Internet.
With this work, the authors want to present the main steps of the project with a focus on the geo-portal development carried out by the Institute of Earth Sciences; finally discussions about the experience in this project and general conside-rations about INTERREG projects will be proposed.
Figure 1. Geo-portal of HELI-DEM project
REFERENCESHelidem Consortium, 2013: HELI-DEM: integrazione dei dati di altezza transalpini tra Italia e Svizzera. SIFET Bulletin,
special edition (in printing.)Gilardoni, M., Sampietro, D. & Reguzzoni M. 2012: Unione dei geoidi italiano e svizzero con l’utilizzo di dati GOCE:
metodologia e risultati. Atti 16° Conferenza Nazionale ASITA - Fiera di Vicenza 6-9 novembre 2012

10Sy
mp
osi
um
18:
Geo
scie
nce
an
d G
eoin
form
atio
n
Platform Geosciences, Swiss Academy of Science, SCNATSwiss Geoscience Meeting 2013
18.6
Predicting soil density of Swiss forests by component wise gradient boosting
Nussbaum Madlene1, Papritz Andreas1, Walthert Lorenz2
1Institute of Terrestrial Ecosystems (ITES), ETH Zurich, Universitätstrasse 16, 8092 Zürich ([email protected])2Swiss Federal Institute for Forest, Snow and Landscape Research (WSL), Zürcherstrasse 111, 8903 Birmensdorf
Soil density is an important characteristic to derive soil hydraulic properties, to characterize soil compaction or to calcu-late stocks of nutrients, trace elements or organic carbon. Measuring density is simple but laborious; hence, many soil surveys lack such measurements. Predictive models, so-called pedotransfer functions (PTF), have been developed to esti-mate density from soil properties that can be more easily measured. PTF relate density mostly to soil organic carbon (SOC) and/or soil texture and often show good predictive power for the study area where data was collected. However, applying a PTF to soils sampled in different regions commonly results in poor predictions, although prediction accuracy improves if the PTF is re-calibrated with density measurements taken in the target area. Besides SOC or texture, the use of addi-tional soil data often leads to a further improvement of a PTF for soil density. Additionally, density depends on soil proper-ties mostly in a nonlinear fashion. As a result, machine-learning techniques like neural networks or regression trees were used to model soil density, but the pedologic interpretation of such models remains usually difficult.
The present study derived a PTF for the density of the fine fraction (< 2 mm) of Swiss forest soils based on data from 134 soil profiles (559 sampled horizons). A wide range of covariates, most of them relating to the same horizons as the den-sity measurements, were available for statistical modelling. We used a gradient boosting approach that included as base learners linear and smooth nonlinear terms. Gradient boosting of this f lavor selects relevant covariates and inherently models nonlinear dependencies on covariates during the fitting process. The restriction to linear and smoothing spline base learners retains interpretability of the fitted predictive models. The number of boosting iterations is the main tuning parameter and was determined by tenfold cross validation.
We compared the results of boosting with a customary robustly fitted linear model. Furthermore, we evaluated the per-formance of the fitted models by predicting the density of 131 horizons of 34 forest soil profiles not used for fitting the model.

11
Sym
po
siu
m 1
8: G
eosc
ien
ce a
nd
Geo
info
rmat
ion
Platform Geosciences, Swiss Academy of Science, SCNATSwiss Geoscience Meeting 2013
18.7
NRP68 projects PMSoil, iMSoil, OPSOL: From legacy soil data and element cycles in agro-ecosystems to a land use decision support system for sustainable use of soils
Andreas Papritz1, Adrienne Grêt-Regamey2, Armin Keller3
1 Institute of Terrestrial Ecosystems, ETH Zurich, Universitätstrasse 16, CH-8092 Zürich ([email protected])2 Planning of Landscape and Urban Systems, ETH Zurich, HIL, CH-8092 Zürich3Agroscope Reckenholz-Tänikon ART, Reckenholzstrasse 191, CH-8046 Zürich
Soils play an essential role in ecosystems and provide important services for humans. Soils are the dominant basis for food and fodder production and are also needed for housing and infrastructure. But soils provide many more functions, for example, by retaining water after heavy rainfall and supplying water to plants from this storage during drought periods, providing habitats to organisms, storing carbon, preventing nutrients and pollutants from leaking into ground- and fres-hwaters, etc. Soil functions are often not noticed, let alone valued, except when soils fail to provide them. Soil sealing is just one of the uses that harm soil functions. In agroecosystems, soil functions are strongly influenced by land manage-ment. Besides soil compaction and erosion, the gradual accumulation of nutrients, trace elements or pesticides is a major threat for soil fertility and hence for the essential soil function of food production.
A sustainable use of the soil resources needs to balance human requirements with the capacity of the soils to provide the various services. Currently, land use decisions in spatial planning are largely taken without consideration of the potentials of the soils for the various functions. One important reason for this unfortunate situation in Switzerland is the widespread lack of accurate large-scale spatial information on soils. Spatial information on soil properties is available only for less than 30 % of the agricultural land in Switzerland. In addition, standardised evaluation methods for assessing soil functions in Switzerland are still lacking. Most soil functions cannot be measured directly but must be deduced from basic soil proper-ties, site characteristics and pedotransfer functions by modelling.
The projects PMSoil, iMSoil and OPSOL, all funded by the National Research Programme “Sustainable Use of Soil as a Resource” (NRP68) for the period 2013–2015, jointly aim
• to develop digital soil mapping procedures for generating spatial soil information from legacy soil data and com-prehensive covariate information on pedogenetic conditions and land management,
• to establish an inference system of pedotransfer functions to derive soil function potentials from basic soil pro-perties,
• to map basic soil properties and the potentials for selected soil functions in three joint study regions in the Cantons of Zurich and Berne,
• to develop a regional soil monitoring tool for balanced element cycles on agricultural soils, which will provide indicators for sustainable management of agricultural soils in the study regions,
• to develop a decision support platform by which stakeholders can jointly develop strategies for sustainable use of soils. This interactive platform will link spatial information of soil properties and functions with anticipated eco-nomic, ecological and social effects of various soil uses and will visualises the results in a 3D virtual environment. The platform users can thereby assess and explore the effects of various soil uses on soil properties and functio-nalities in real-time.
The three projects will jointly strive to provide answers to the pressing question how the scarce resource “soil”, which is currently still lost at a very fast pace in Switzerland (about 3’000 ha each year), can be better preserved and more sustai-nably managed in the future. Built-up areas extended in the past nearly exclusively at the cost of agricultural land — ap-proximately one third of the arable soils of Switzerland were lost in the last 30 years — because federal law protects forests quite rigorously. In spatial allocation of new infrastructure and housing areas, soil information was hardly ever conside-red, resulting in some cantons in a shortage of so-called “crop rotation areas”. Their conservation is the only legal instru-ment at federal level to prevent loss of agricultural soils for infrastructure and housing. Re-dimensioning and spatial re-allocation of construction areas, protection of groundwater recharge areas in forests with acid soils against leaching of mobile heavy metals are other problems that found recently attention in public discussion. All these examples have in common that adequate tackling of the respective problem asks for spatial information about the capacity of the Swiss soils to function and to provide services to our society in the long-term. This is where the focus of our endeavours will lie.

12Sy
mp
osi
um
18:
Geo
scie
nce
an
d G
eoin
form
atio
n
Platform Geosciences, Swiss Academy of Science, SCNATSwiss Geoscience Meeting 2013
18.8
Journeys through time with the Swiss national map series
Rickenbacher Martin
Federal Office of Topography swisstopo, Topography division, Seftigenstrasse 264CH-3084 Wabern ( [email protected] )
In 2013, the Swiss Federal Office of Topography swisstopo celebrates its 175th anniversary. Since its foundation as «Bureau topographique fédéral» by general Guillaume-Henri Dufour in 1838, swisstopo has produced three national map series (Topographische Karte der Schweiz 1:100.000, Topographischer Atlas der Schweiz 1:25.000/1:50.000, Landeskarten der Schweiz). They include approximately 7500 first and updated editions of maps in different scales. Therefore all these maps can be regarded as a cultural heritage of national significance. They are called the «topographical landscape memory of Switzerland». The Federal Act on Geoinformation (Geoinformation Act, 2008) commits the producers to make available their geodata in a sustainable way.
On this background, swisstopo launched its jubilee year on 17th of January 2013 by publishing the major part of its prin-ted maps on the internet site www.swisstopo.ch. For users it is now possible to navigate at any place in Switzerland cove-red by the map series 1:25.000, 1:50.000 and 1:100.000. This enables to study very precisely the development of the actual National Map which was established by the «Map Law» of 1935. Since mid-2013, all the published maps in the scales mentioned above are online, which means, that also the establishment of the Dufour- and the Siegfried-Map can be visu-alized. Everybody can now undertake a journey through time from 1844 till 2011 across the complete territory of Switzerland. By links to the bibliographical metadata, the users can query the data status of the map shown on the screen. Printing facilities (A4 format) and further advanced functionalities (measure, draw) are supported as well.
The launch of this tool was very well accepted in the Swiss media, and within the first four days, the journey through time was visited by more than 70.000 users. In this short time, questions from the user side about the presented maps aroused, which required special historical knowledge to answer. As far as we know, such a web based publication of all printed maps in a georeferenced frame by a national mapping agency is unique in the world. Historically, this cartographic going public is the modern counterpart of the secrecy of maps which was maintained by the governments in former centuries.
Figures 1 – 3. Cartography in Cold War: In the last two editions of the Topographical Atlas of Switzerland 1:25.000 («Siegfried map»),
the gunpowder factory of Wimmis is represented, even during World War II. From the first edition of the map sheet 1207 Thun of the
Swiss National Map 1:25.000 (NM25) published 1958, it disappears – probably by secrecy reasons – until the edition of 1993, when it
cartographically rose again like a phoenix (short link http://s.geo.admin.ch/c87591b2, click start button).
REFERENCESGerber, U. 2013: 175 Jahre swisstopo – Eine «Zeitreise». Cartographica Helvetica 48, 41–42.Rickenbacher, M. 2013: Zeitreihen bei swisstopo. Download from http://www.swisstopo.admin.ch/internet/swisstopo/de/
home/topics/geodata/historic_geodata/key_dat/tim_se.html (pdf file (3.6 MB) under “Dokumentation”).Rickenbacher, M. 2011: Zeitreihen – eine neue Herausforderung für das Bundesamt für Landestopografie swisstopo.
Cartographica Helvetica 44, 34-41.

13
Sym
po
siu
m 1
8: G
eosc
ien
ce a
nd
Geo
info
rmat
ion
Platform Geosciences, Swiss Academy of Science, SCNATSwiss Geoscience Meeting 2013
P 18.1
Modelling landslide-generated tsunamis in alpine lakes
Franz Martin1, Podladchikov Yury2, Jaboyedoff Michel1
1 Center for Research on Terrestrial Environment (CRET), University of Lausanne, ([email protected])2 Institute of Earth Sciences (ISTE), University of Lausanne
The Alps are the location of many mass movements (landslide, rockslide/fall, icefall), as well as numerous reservoirs and lakes. In addition, a high density of population is situated in the valleys. This situation could lead to potentially cata-strophic tsunamis and associated downstream flows.
In order to assess the risk of tsunami in alpine regions, it is necessary to model the phenomenon as accurate as possible. However, the modelling of landslide generated tsunamis in closed and relatively small water bodies is confronted to vari-ous difficulties. The strong effects due to the bathymetry shape and the necessity of transition between wet to dry state, i.e. run-up and downstream flows modelling, leads to numerical instabilities.
Therefore, the goal of this study is the development of a numerical code that solves the aforementioned problems and that runs at high resolution.
To this end, several different codes based on the shallow water equations were verified with tests from Toro (2001) and some additional ones. The accuracy, the efficiency and the monotony are tested, in order to define the best code. The Lax-Friedrich and the Godunov Upwind schemes are selected and their combination allows the modelling of the wave propa-gation in the water body as well as the downstream flow.
P 18.2
Geographical information system for materials management in the canton Fribourg (Switzerland)
Jaquet Sylvain1, Schwab Marco1, Yersin Raphael1, Ribeiro Daniel2
1 Service des Constructions et de l’Aménagement (SeCA), Etat de Fribourg, Rue des Chanoines 17, CH-1701 Fribourg ([email protected])2 Topomat Technologies SA, 6 chemin Sus-la-Meule, CH-1297 Founex
The use of geographical information system (GIS) to provide quantitative data related to materials live cycle is implemen-ted in the canton Fribourg in order to achieve the coordination between volume of extracted materials and volumes for disposal of clean materials. Due to new legal provisions, gravel-pit and dump operators have to plan operation (extraction, filling, reinstatement) in stages of maximum 5 years and to provide annual data about their activity: volumes, type of activity, material f lux, environmental conditions…
A system in two parts has been developed: the Desktop side provides an ArcGIS 10 geodatabase and an ArcMap plugin associated with a content management system. This tool is devoted to the internal administrative management. The se-cond part of the system is a cartographic Web-application designed for the gravel-pit and dump operators. The application provides the cartographic and attribute information needed to help the user in fulfilling the requested data and docu-ments for the annual report. These data are then uploaded through the web to the Desktop side of the system, to the cantonal administration.
GIS techniques are useful for the administration to develop the required dataset in order to evaluate the needs for new gravel-pits and dumps or extension of existing sites. It also allows to allocate free volumes for clean materials disposal. The possibility given to explore site-specific data coupled with other general data (aerial photographs, digital elevation models…) allows the user to provide the accurate data to the administration. The tool is aimed at becoming the commu-nication vector between gravel-pit and dump operators and cantonal administration.

14Sy
mp
osi
um
18:
Geo
scie
nce
an
d G
eoin
form
atio
n
Platform Geosciences, Swiss Academy of Science, SCNATSwiss Geoscience Meeting 2013
P 18.3
A new open-source simulation model for fast landslide runout assessment
Molinari Monia1, Cannata Massimiliano1, Ambrosi Christian1, Meisina Claudia2
1 Institute of Earth Sciences, University of Applied Sciences and Arts of Southern Switzerland, Campus Trevano, CH-6952, Canobbio ([email protected])2 Department of Earth and Environmental Sciences, University of Pavia, Via Ferrata 1, 27100 Pavia, Italy
r.massmov is a new model for landslide runout simulation developed in the GRASS GIS open-source environment.
The model is the result of a series of enhancements ported to the original Massmov2D code (Begueria et al. 2009) in order to obtain a tool suitable for early warning monitoring system modeling services. To this purpose, the authors identified four model key requirements: i) low calculation times to perform simulations in timeframe consistent with early warning system real-time services; ii) GIS-embedded approach to access all the spatial analysis features including visualization and elaboration; iii) three-dimensional analysis capabilities to take account of complex topographies and iv) open source ap-proach to reduce costs and guarantee sustainability in time.
With this work the authors want to illustrate the main features of the model (governing equations, input and output data and algorithms) and present its peculiarities with respect to the original code. Furthermore the results of the model appli-cation on a case study located in Tessin with a multi-spatial resolution analysis and validation are presented.
Figure 1. 3D timeline simulation of a fast landslide generated by r.massmov
REFERENCESBegueria, S., Van Asch, T.W.J., Malet, J.P. & Grondahl, S. 2009: A GIS based numerical model for simulating the kinematics
of mud and debris f lows over complex terrain. Nat Hazards Earth Syst Sci, 9, 1897-1909.

15
Sym
po
siu
m 1
8: G
eosc
ien
ce a
nd
Geo
info
rmat
ion
Platform Geosciences, Swiss Academy of Science, SCNATSwiss Geoscience Meeting 2013
P 18.4
Monitoring rock glaciers with GPS and high-resolution cameras
Fabian Neyer, Philippe Limpach & Alain Geiger
Geodesie und Photogrammetry ETH Zürich, Schafmattstrasse 34, 8093 Zürich ([email protected])
Rock glaciers are creeping accumulations of perennially-frozen debris. The response of rock glaciers to global warming and their driving physical processes are still relatively unknown. To construct accurate physical models and to understand the response to extrinsic forces (changing surface temperature, heavy precipitation, etc), accurate and reliable information about the observable surface displacement is necessary. Conventionally, such measurements (GPS, Radar, Laser-scan, etc) are taken by repeated and costly campaigns typically held a few times a year. The resulting displacement maps are usual-ly well sampled in the spatial domain but suffer from resolution in time.
Recent work has shown that rock glaciers are affected by short-term velocity variations, typically occurring during the snow melt period. Because f low velocity can rapidly increase by up to a factor of 5 in certain areas, permanent monitoring is of major importance for any early warning systems in hazardous areas.
This work presents a pilot study where several rock glaciers in the Matter Valley (VS, Switzerland) are permanently moni-tored using low cost L1 GPS and optical cameras. A special focus will be given on the optical image data processing and validation. As first results show, optical image data can provide accurate, 2-dimensional displacement estimates within the pictured area.
P 18.5
Estimation of maximum ground shaking for the Tohoku 2011 earthquake based on collocated GPS and strong-motion data
Panos Psimoulis1, Nicolas Houlié1, Michael Meindl1, Markus Rothacher1, John Clinton2, Luis Dalguer2
1Geodesy and Geodynamics Lab., Inst. of Geodesy and Photogrammetry, ETH Zurich, Schafmattstr. 34, 8093, Zurich ([email protected]; [email protected]; [email protected]; [email protected])2Swiss Seismological Service (SED), ETH Zurich, Sonnegstr. 5, 8092 Zurich ([email protected]; [email protected])
Traditionally, GPS is known for applications in tectonics mainly for the reliable and accurate detection of surface ground motion due to dislocation, differences of material property and fault dip variations (Wright et al., 2012). However, the global rapid development of 1Hz GPS networks can provide information on deformation corresponding to seismic wave propagation and seismic rupture. The obtained information from GPS networks can be collocated with or supplement the seismometer network.
The Mw9.0 Tohoku-Oki 2011 earthquake is one of the best-observed megathrust seismic events, as it was recorded by the GNSS network of Japan, known as GEONET, and also by the seismometer networks. GPS records of 847 sites, the records of 700 and 525 sites of the KiK-net and the K-NET strong-motion networks, respectively, corresponding to the seismic event, are available. The aim of the current study is the evaluation of the estimated displacement, velocity and acceleration from collocated GPS and strong-motion stations, for certain periods of motion.
From the available stations, the GPS and strong-motion sites, whose distance did not exceed 1km, were considered as col-located, assuming that they recorded practically the same seismic motion. 124 collocated sites of GPS and strong-motion stations were found fulfilling this criterion (Fig. 1). The 1Hz GPS records were processed in PPP-mode with the Bernese GNSS Software Version 5.2 and the derived displacement time series were differentiated once and twice to obtain velocity and acceleration series, respectively. On the other hand the 100Hz strong-motion data from the collocated sites were cor-rected and synchronized with GPS time and the corresponding velocity and displacement time series were derived from the obtained acceleration time series by integrating once and twice, respectively.
16Sy
mp
osi
um
18:
Geo
scie
nce
an
d G
eoin
form
atio
n
Platform Geosciences, Swiss Academy of Science, SCNATSwiss Geoscience Meeting 2013
The evaluation was done on the basis of the maximum values of displacement/velocity/acceleration of GPS and strong-motion time series for certain period bands. The latter ranged from 2.5 to 40sec for GPS and 0.025 to 40 sec for strong-motion data, respectively, due to the different recording frequency, by following a ½-octave wide distribution (Clinton and Heaton, 2002). The time series for each period band derived by filtering the corresponding GPS and strong-motion time series using a Chebyshev I band-pass filter and the evaluation was performed for the period bands common to GPS and strong-motion data.
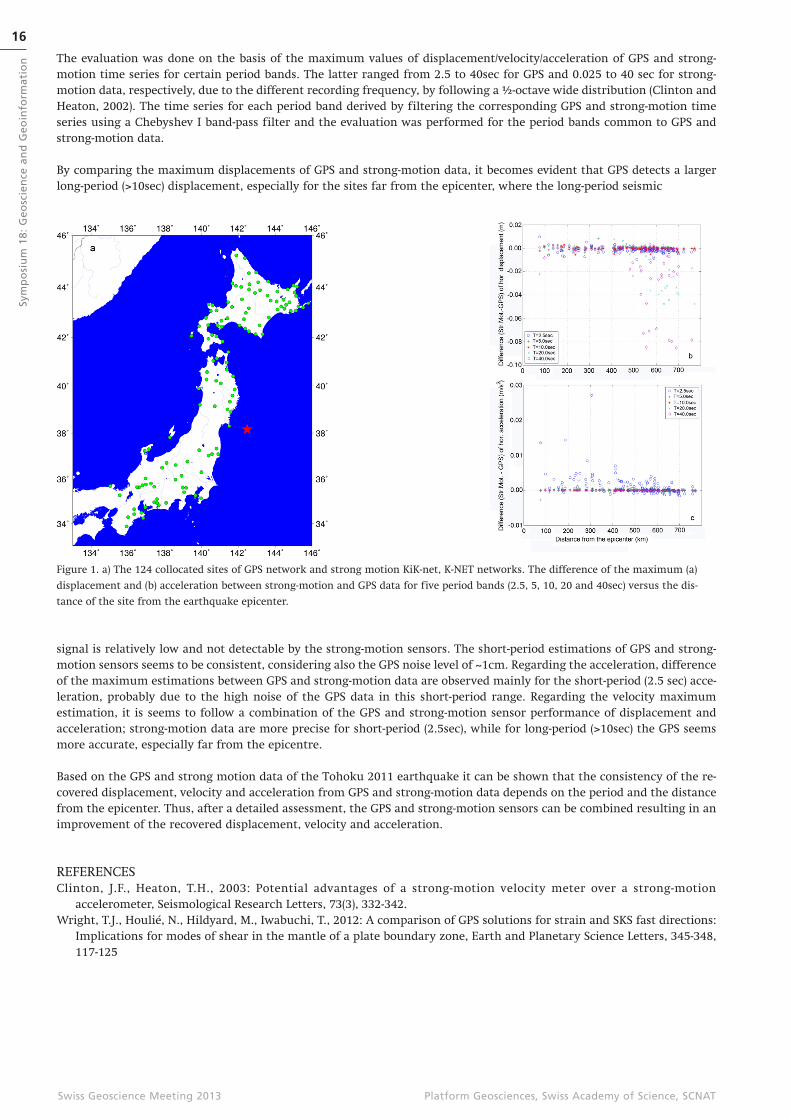
By comparing the maximum displacements of GPS and strong-motion data, it becomes evident that GPS detects a larger long-period (>10sec) displacement, especially for the sites far from the epicenter, where the long-period seismic
Figure 1. a) The 124 collocated sites of GPS network and strong motion KiK-net, K-NET networks. The difference of the maximum (a)
displacement and (b) acceleration between strong-motion and GPS data for five period bands (2.5, 5, 10, 20 and 40sec) versus the dis-
tance of the site from the earthquake epicenter.
signal is relatively low and not detectable by the strong-motion sensors. The short-period estimations of GPS and strong-motion sensors seems to be consistent, considering also the GPS noise level of ~1cm. Regarding the acceleration, difference of the maximum estimations between GPS and strong-motion data are observed mainly for the short-period (2.5 sec) acce-leration, probably due to the high noise of the GPS data in this short-period range. Regarding the velocity maximum estimation, it is seems to follow a combination of the GPS and strong-motion sensor performance of displacement and acceleration; strong-motion data are more precise for short-period (2.5sec), while for long-period (>10sec) the GPS seems more accurate, especially far from the epicentre.
Based on the GPS and strong motion data of the Tohoku 2011 earthquake it can be shown that the consistency of the re-covered displacement, velocity and acceleration from GPS and strong-motion data depends on the period and the distance from the epicenter. Thus, after a detailed assessment, the GPS and strong-motion sensors can be combined resulting in an improvement of the recovered displacement, velocity and acceleration.
REFERENCESClinton, J.F., Heaton, T.H., 2003: Potential advantages of a strong-motion velocity meter over a strong-motion
accelerometer, Seismological Research Letters, 73(3), 332-342.Wright, T.J., Houlié, N., Hildyard, M., Iwabuchi, T., 2012: A comparison of GPS solutions for strain and SKS fast directions:
Implications for modes of shear in the mantle of a plate boundary zone, Earth and Planetary Science Letters, 345-348, 117-125
17
Sym
po
siu
m 1
8: G
eosc
ien
ce a
nd
Geo
info
rmat
ion
Platform Geosciences, Swiss Academy of Science, SCNATSwiss Geoscience Meeting 2013
P 18.6
GlaciArch: applying glaciological methods for gauging archaeological potential using GIS
Rogers Stephanie R.1, Fischer Mauro1
1Department of Geosciences, Geography, University of Fribourg, Chemin de Musée 4, CH-1700 Fribourg ([email protected], [email protected])
Recent climate changes have led to an increase in the exposure of archaeological remains in frozen environments due to the melting of glaciers, ice patches, and permafrost on a global scale. In the majority of cases, the discovery of glacial ar-chaeological remains has occurred due to chance. In order to avoid the risk of losing exceptional, often organic, cultural remains due to decomposition, systematic and predictive methodologies should be employed to locate areas of high ar-chaeological potential. In this paper, we merged existing glaciological knowledge and methodologies with archaeological and historical information in GIS to gain a better understanding about how people interacted with frozen environments in the recent past, as well as to create a model to determine areas of high archaeological potential for the future based on glacier melting rates. First, glacier outlines from the years 1850, 1973, and 2010, as well as topographic properties such as slope and aspect, were compared to archaeological and historical databases to validate the relationship between artifact discoveries and glacial extents over time. Next, a simple but robust, broad-scale hypsometric glacier recession model (Paul et al. 2007) was employed along with several climate change scenarios for the Pennine Alps region. This approach was based on the relationship between current glacier extents and changes in the balanced-budget equilibrium line altitude (ELA0) and was used to predict where glaciers will recede fastest. The results specify locations in which archaeological in-vestigations should be conducted first. Ground Penetrating Radar (GPR) data and the spatial distribution of modeled mass balance was then used to calculate a high resolution glacier evolution model (Huss et al. 2008; Jouvet et al. 2009) at two control sites, the Theodule glacier and the Haut glacier d’Arolla, in order to check the accuracy of the regional model (Linsbauer et al. 2013). The results of archaeological and historical database investigations increased understanding about the location and retrieval of artifacts in relation to glacier extents over time. The variations in glacier dynamics between sites makes it difficult to predict where archaeological remains might be located; however, we found that database inves-tigation along with broad- and local-scale glacier modeling provided insight into patterns of artifact location and retrieval to aid in archaeological prospection and investigation in the future.
REFERENCESHuss, M., Farinotti, D., Bauder, A., & Funk, M. 2008: Modelling Runoff from Highly Glacierized Alpine Drainage Basins in
a Changing Climate. Hydrological Processes 22, 3888–3902. Jouvet, G., Huss, M., Blatter, H., Picasso, M., & Rappaz, J. 2009: Numerical Simulation of Rhonegletscher from 1874 to
2100. Journal of Computational Physics 228, 6426–6439. Linsbauer, A., Paul, F., Machguth, H., & Haeberli, W. 2013: Comparing Three Different Methods to Model Scenarios of
Future Glacier Change in the Swiss Alps. Annals of Glaciology 54, 241.Paul, F., Maisch, M., Rothenbühler, C., Hoelzle, M., & Haeberli, W. 2007: Calculation and Visualisation of Future Glacier
Extent in the Swiss Alps by Means of Hypsographic Modelling. Global and Planetary Change 55, 343–357.