Embed Size (px)
Citation preview

ABSTRACT
TITUS, AARON PATRICK. Integrating Video and Animation with Physics Problem Solving Exercises on the World Wide Web. (Under the direction of Robert J. Beichner.) Problem solving is of paramount importance in teaching and learning physics. An
important step in solving a problem is visualization. To help students visualize a
problem, we included video clips with homework questions delivered via the World
Wide Web. Although including video with physics problems has a positive effect with
some problems, we found that this may not be the best way to integrate multimedia with
physics problems since improving visualization is probably not as helpful as changing
students’ approach.
To challenge how students solve problems and to help them develop a more
expert-like approach, we developed a type of physics exercise called a multimedia-
focused problem where students take data from an animation in order to solve a problem.
Because numbers suggestive of a solution are not given in the text of the question,
students have to consider the problem conceptually before analyzing it mathematically.
As a result, we found that students had difficulty solving such problems compared to
traditional textbook-like problems. Students’ survey responses showed that students
indeed had difficulty determining what was needed to solve a problem when it was not
explicitly given to them in the text of the question. Analyzing think-aloud interviews
where students verbalized their thoughts while solving problems, we found that
multimedia-focused problems indeed required solid conceptual understanding in order for
them to be solved correctly.

As a result, we believe that when integrated with instruction, multimedia-focused
problems can be a valuable tool in helping students develop better conceptual
understanding and more expert-like problem solving skills by challenging novice beliefs
and problem solving approaches. Multimedia-focused problems may also be useful for
diagnosing conceptual understanding and problem skills.

INTEGRATING VIDEO AND ANIM ATION WITH PHYSICS PROBLEM SOLVING EXERCISES ON THE WORLD WIDE WEB
by
AARON PATRICK TITUS
A dissertation submitted to the Graduate Faculty of North Carolina State University
in partial fulfillment of the requirements for the Degree of
Doctor of Philosophy
PHYSICS
Raleigh
1998
APPROVED BY:
______________________________ _____________________________ Dr. John Risley Dr. John Hubisz
______________________________ _____________________________ Dr. Robert Schrag Dr. Robert Beichner, Chair of Advisory Committee

ii
BIOGRAPHY
Aaron Patrick Titus was born on April 6, 1971, in Wenatchee, Washington. After
living in Washington, Oregon, Texas, and Florida, his family moved to Camp Hill,
Pennsylvania, where he attended junior high, high school, and college.
Aaron spent his first two years of college at Rochester Institute of Technology.
While he appreciated his years there, he recognized that he desired to teach physics and
would need a more diverse curriculum. Therefore, he transferred to Pennsylvania State
University where he graduated in 1993 with a BS in physics. Knowing he wanted to
study physics education and eventually teach physics at a college or university, he
applied to the graduate program in physics at the North Carolina State University.
His first experience at NCSU in physics education was working with Dr. John
Risley on the Physics Courseware Evaluation Project Teacher Institute. Later Aaron
worked with Dr. Larry Martin of North Park University to develop WebAssign, a web-
based assignment system, and with Dr. Wolfgang Christian of Davidson College to
develop multimedia-focused problems using Physlets.
Aaron completed his Ph.D. in physics education under the direction of Dr. Robert
Beichner in August, 1998, and subsequently began teaching at North Carolina
Agricultural & Technical State University. In 1993 he married Dr. Kimberly Gossett.
Their first child, Melody Titus, was born on August 30, 1996. Aaron and his wife are
devout Christians. Aaron committed his life to Jesus Christ at the age of 14 years old.

iii
ACK NOWLEDGEM ENTS
I am grateful to many people who have positively influenced my life. I thank my
parents, Larry and Devi Titus, for encouraging me to pursue graduate school and telling
me that I could make it even when I believed I couldn’ t. I also thank my grandmother,
Rachel Titus, who passed away in 1994, for believing in me. I wish she could be here
today to see the fruit of her investment. I also thank my grandparents, Moffitt and Oleta
Walker, for their continual love and support. Even though they did not have the
opportunity for higher education, they made it possible for me. I also thank my sister,
Trina Lozano, and her family for the joy they have brought to my life.
I also thank those who have been mentors in my life. Thanks to Randy Hoffman,
my first physics teacher, Dr. Robert Beichner, my advisor, and Dr. John Risley, who gave
me wonderful opportunities, provided resources for my work, and believed in my ideas.
In addition, I want to express special thanks to Dr. Larry Martin of North Park University
and Dr. Wolfgang Christian of Davidson College who have made the greatest impact on
my research.
Finally, I express my sincerest gratitude to my wife, Kimberly Titus, for her
constant encouragement, support, and selflessness, and my daughter, Melody Titus, who
taught me that raising children is more rewarding and more important than obtaining a
Ph.D. I also thank my Lord Jesus Christ “who is able to do immeasurably more than all
we ask or imagine, according to his power that is at work within us. (Ephesians 3:20)”

iv
TABLE OF CONTENTS
List of Tables ix
List of Figures xi
1 Introduction............................................................................................................2
1.1 Purpose......................................................................................................................... 6
1.2 Justification .................................................................................................................. 6
1.3 Definition of Terms ...................................................................................................... 9
1.4 Research Questions and Hypotheses.......................................................................... 12
2 Background..........................................................................................................14
2.1 Related Psychological Background............................................................................ 15
2.1.1 Domains of Learning........................................................................................................15
2.1.2 Cognitive Learning Theory--The Information Processing Model .......................................16
2.2 Problem Solving ......................................................................................................... 19
2.2.1 Problem Solving Heuristic................................................................................................19
2.2.2 Expert vs. Novice Research in Physics..............................................................................27
2.3 Instructional Graphics............................................................................................... 30
2.3.1 Types of Instructional Graphics........................................................................................30
2.3.2 Purposes of Instructional Graphics....................................................................................31
2.3.3 Temporality .....................................................................................................................35
2.4 Visual Media in Computer-aided I nstruction ........................................................... 36
2.4.1 Still Graphics...................................................................................................................36
2.4.2 Animation........................................................................................................................38

v
2.5 Verbal Protocols......................................................................................................... 44
2.5.1 Description ......................................................................................................................44
2.5.2 Validity............................................................................................................................46
2.5.2.1 Threats to Internal Validity—Task...............................................................................47
2.5.2.2 Threats to Internal Validity—Instructions.....................................................................48
2.5.2.3 Threats to Internal Validity—Reporting.......................................................................48
2.5.2.4 Threats to Internal Validity—Analysis.........................................................................49
2.6 Web-based Assessment............................................................................................... 50
2.6.1 Methods...........................................................................................................................51
2.6.2 Modes of Questions..........................................................................................................52
2.6.3 Evaluating Questions........................................................................................................55
2.6.4 Strengths of Web-based Assessment.................................................................................62
2.6.5 Drawbacks of Web-based Assessment ..............................................................................66
2.6.6 Passing the test.................................................................................................................70
2.7 Physlets....................................................................................................................... 71
3 Experiments..........................................................................................................74
3.1 Pilot Study .................................................................................................................. 75
3.2 Exper iment 1: Integrating video with problem solving............................................ 81
3.2.1 Introduction .....................................................................................................................81
3.2.2 Research Design...............................................................................................................87
3.2.3 Sample.............................................................................................................................88
3.2.4 Instrumentation................................................................................................................89
3.2.5 Procedural Details............................................................................................................90
3.2.6 External Validity..............................................................................................................91
3.2.7 Data Analysis...................................................................................................................96

vi
3.2.8 Findings...........................................................................................................................99
3.2.9 Summary and Conclusions.............................................................................................101
3.3 Exper iment 2: Using animation in multimedia-focused problems......................... 104
3.3.1 Research Design.............................................................................................................107
3.3.2 Sample...........................................................................................................................107
3.3.3 Instrumentation..............................................................................................................108
3.3.4 Procedural Detail ...........................................................................................................110
3.3.5 External Validity............................................................................................................110
3.3.6 Data Analysis.................................................................................................................118
3.3.7 Findings.........................................................................................................................125
3.3.8 Summary and Conclusions.............................................................................................132
3.4 Exper iment 3: Think-aloud interviews with students............................................ 133
3.4.1 Research Design.............................................................................................................134
3.4.2 Sample...........................................................................................................................134
3.4.3 Instrumentation..............................................................................................................135
3.4.4 Procedural Detail ...........................................................................................................135
3.4.5 External Validity............................................................................................................136
3.4.6 Data Analysis.................................................................................................................140
3.4.6.1 NCSU Student 1........................................................................................................141
3.4.6.2 NCSU Student 2........................................................................................................143
3.4.6.3 Davidson Student 1....................................................................................................145
3.4.6.4 Davidson Student 2....................................................................................................147
3.4.6.5 Davidson Student 3....................................................................................................150
3.4.6.6 Davidson Student 4....................................................................................................152
3.4.6.7 Solutions...................................................................................................................153
3.4.7 Findings.........................................................................................................................154

vii
3.4.8 Summary and Conclusions.............................................................................................162
4 Summary ............................................................................................................ 165
5 Conclusion.......................................................................................................... 170
6 Literature Cited .................................................................................................. 173
7 Appendices.......................................................................................................... 178
7.1 Appendix 1: Pilot Study Survey.............................................................................. 179
7.2 Appendix 2: Exper iment 1 Assignments................................................................. 183
7.2.1 Treatment.......................................................................................................................183
7.2.2 Control...........................................................................................................................188
7.3 Appendix 3: Exper iment 1 Survey Responses........................................................ 193
7.4 Appendix 4: Exper iment 2 Assignments................................................................. 198
7.4.1 Treatment Group............................................................................................................198
7.4.2 Control Group................................................................................................................206
7.5 Appendix 5: Exper iment 2 Survey.......................................................................... 208
7.6 Appendix 6: Exper iment 2 Survey ResponsesNCSU.......................................... 209
7.6.1 Question 1a....................................................................................................................209
7.6.2 Question 1b....................................................................................................................210
7.6.3 Question 2......................................................................................................................231
7.6.4 Question 3......................................................................................................................232
7.6.5 Question 4b....................................................................................................................232
7.7 Appendix 7: Exper iment 2 Survey ResponsesDavidson College........................ 250
7.7.1 Question 1a....................................................................................................................250

viii
7.7.2 Question 1b....................................................................................................................250
7.7.3 Question 2......................................................................................................................252
7.7.4 Question 3......................................................................................................................252
7.7.5 Question 4b....................................................................................................................253
7.8 Appendix 8: Exper iment 3 Interview Questions..................................................... 255
7.9 Appendix 9: Exper iment 3 Interview Scr ipt ........................................................... 257
7.10 Appendix 10: Exper iment 3 Consent Form........................................................ 261
7.11 Appendix 11: Exper iment 3 Interview Transcr iptions ...................................... 263
7.11.1 NCSU Student 1.............................................................................................................263
7.11.2 NCSU Student 2.............................................................................................................265
7.11.3 Davidson Student 1........................................................................................................268
7.11.4 Davidson Student 2........................................................................................................271
7.11.5 Davidson Student 3........................................................................................................274
7.11.6 Davidson Student 4........................................................................................................277
7.12 Appendix 12: Exper iment 3 Interview Analysis................................................. 278
7.12.1 NCSU Student 1.............................................................................................................279
7.12.2 NCSU Student 2.............................................................................................................282
7.12.3 Davidson Student 1........................................................................................................286
7.12.4 Davidson Student 2........................................................................................................290
7.12.5 Davidson Student 3........................................................................................................295
7.12.6 Davidson Student 4........................................................................................................299

ix
LIST OF TABLES
Table 2.1: Example questions for each phase of problem solving proposed by Polya. .............................. 20
Table 2.2: Results of teaching problem solving strategies........................................................................ 26
Table 2.3: Rieber’s recommendations for using graphics (Rieber, 1994).................................................. 43
Table 2.4: Summary of methods of Web-based assessment. .................................................................... 56
Table 3.1: Proportions of correct answers on identical questions for the two groups of students
who participated in the study. Questions on which the groups performed differently at
t > t.05 are italicized and boldfaced.......................................................................................... 94
Table 3.2: Analysis of the third question on the survey in Figure 3.1....................................................... 99
Table 3.3: t-scores calculated for seven video-enhanced problems on topics of relative motion,
collisions, and oscillations. Questions on which t > t.05 are italicized and boldfaced.............. 100
Table 3.4: t-scores calculated for the proportion of students who downloaded an assignment but
did not submit responses. ..................................................................................................... 114
Table 3.5: Proportions of correct answers on identical questions for the two groups of students
who participated in the study. Questions on which the groups performed differently at
t > t.05 are italicized and boldfaced........................................................................................ 116
Table 3.6: Categories and survey responses to question 1b in Appendix 5 (239 total respondents). ........ 123
Table 3.7: Categories and survey responses to question 4b in Appendix 5 (234 total respondents). ........ 124
Table 3.8: t-scores calculated for multimedia-focused problems on topics of work and kinetic
energy, conservation energy, collisions, rotation, rolling, and oscillations. ............................ 125
Table 3.9: Description of concepts needed to solve the problems in Experiment 3. ................................ 154
Table 3.10: Correct answers to the problems in Experiment 3. .............................................................. 154
Table 3.11: Summary of responses to the questions in Experiment 3. “X” marks those questions
on which a student reported the correct answer..................................................................... 155
Table 3.12: Summary of cases where students stated a concept important to solving the problem
but did not follow through with this concept......................................................................... 159

x
Table 7.1: Responses to Question 1a (N=342)....................................................................................... 209
Table 7.2: Responses to Question 2 (N=340). ....................................................................................... 232
Table 7.3: Responses to Question 3 (N=341). ....................................................................................... 232
Table 7.4: Responses to Question 1a (N=19). ....................................................................................... 250
Table 7.5: Responses to Question 2 (N=19). ......................................................................................... 252
Table 7.6: Responses to Question 3 (N=19). ......................................................................................... 253

xi
LIST OF FIGURES
Figure 2.1: The coordinates of a student’s mouse click on this image map are evaluated either by
the server or by the browser.................................................................................................. 53
Figure 2.2: HTML radio buttons ensure that only one answer to a multiple-choice question can be
entered................................................................................................................................. 53
Figure 2.3: Questions that have more than one correct answer are implemented with HTML
checkboxes. ......................................................................................................................... 54
Figure 2.4: Fill-in-the-blank questions are evaluated using a character-by-character comparison of
the input text with the correct answer. Spaces and capitalization may be ignored if
desired. ................................................................................................................................ 54
Figure 2.5: A numerical answer entered into the text-input field is judged correct if it falls within
a given range, so that small rounding errors do not produce incorrect answers. ...................... 55
Figure 2.6: Students’ answers to essay questions are entered into an HTML textarea box and
recorded on the server for later evaluation by the instructor................................................... 55
Figure 2.7: JavaScript code to score the question in Figure 2.2................................................................ 57
Figure 2.8: JavaScript code to score the multiple-choice question shown in Figure 2.3............................ 58
Figure 2.9: JavaScript code to score the fill-in-the-blank question in Figure 2.4....................................... 58
Figure 2.10: JavaScript code to score the numerical question in Figure 2.5.............................................. 59
Figure 2.11: In (a) is the code which generates the question shown in (b). The <eqn> tag is
interpreted by WWWAssign which evaluates the r andnum function and returns the
result. The answer is calculated based on the numbers generated in the question................... 61
Figure 2.12: In (a) is the code which generates the question shown in (b). The <eqn> tag is
interpreted by WWWAssign which evaluates the pi ckone and pi cksame
functions and returns the result. The answer is also specified with the pi cksame
function................................................................................................................................ 61
Figure 2.13: JavaScript and HTML code for the question shown in Figure 7.10....................................... 73

xii
Figure 3.1: Effectiveness spectrum illustrating the continuous nature of the study and the predicted
boundaries of t in a test of significance for proportion differences in two binomially
distributed groups................................................................................................................. 82
Figure 3.2: Survey questions used in Experiment 1. ................................................................................ 90
Figure 3.3: Review criteria given to experts who reviewed questions used for the treatment. ................... 92
Figure 3.4: Proportions of correct responses for the treatment and control groups on video-
enhanced questions............................................................................................................. 101
Figure 3.5: Proportion of correct responses on multimedia-focused problems for treatment and
control groups. ................................................................................................................... 126
Figure 3.6: Task analysis for the task of solving multimedia-focused problems. .................................... 139
Figure 3.7: Codes for categorizing subjects’ verbalizations. .................................................................. 141
Figure 7.1: Relative motion questions given to the treatment group in Experiment 1.............................. 184
Figure 7.2: Collisions questions given to the treatment group in Experiment 1....................................... 185
Figure 7.3: (a) Video clip corresponding to the first question in Figure 7.2. (b) Video clip
corresponding to the second question in Figure 7.2. ............................................................ 186
Figure 7.4: Oscillations questions given to the treatment group in Experiment 1.................................... 187
Figure 7.5: (a) Video clip corresponding to the first and second questions in Figure 7.4. (b) Video
clip corresponding to the second question in Figure 7.4....................................................... 188
Figure 7.6: Collisions questions given to the control group in Experiment 1. ......................................... 189
Figure 7.7 Oscillations questions, 1 & 2, given to the control group in Experiment 1............................. 190
Figure 7.8: Oscillations question, 3, given to the control group in Experiment 1. .................................... 191
Figure 7.9: Relative motion questions given to the control group in Experiment 1 (actual images
given to students are not shown in this figure)..................................................................... 192
Figure 7.10: Work-Kinetic Energy [1]. ................................................................................................. 198
Figure 7.11: Work-Kinetic Energy [2]. ................................................................................................. 199
Figure 7.12: Conservation of Energy [1]............................................................................................... 200
Figure 7.13: Conservation of Energy [2]............................................................................................... 200

xiii
Figure 7.14: Collisions [1].................................................................................................................... 201
Figure 7.15: Collisions [2].................................................................................................................... 202
Figure 7.16: Rotation [1]. ..................................................................................................................... 202
Figure 7.17: Rotation [2]. ..................................................................................................................... 203
Figure 7.18: Rolling [2]........................................................................................................................ 204
Figure 7.19: Rolling [2]........................................................................................................................ 204
Figure 7.20: Oscillations [1]................................................................................................................. 205
Figure 7.21: Oscillations [2]................................................................................................................. 205
Figure 7.22: Work-Kinetic Energy........................................................................................................ 206
Figure 7.23: Conservation of Energy. ................................................................................................... 206
Figure 7.24: Collisions. ........................................................................................................................ 206
Figure 7.25: Rotation. .......................................................................................................................... 207
Figure 7.26: Rolling. ............................................................................................................................ 207
Figure 7.27: Survey questions 1 through 3 given to students in Experiment 2. ....................................... 208
Figure 7.28: Survey questions 4 through 5 given to students in Experiment 2. ....................................... 209
Figure 7.29: Multimedia-focused problem in projectile motion which was solved by students
during the think-aloud interview. ........................................................................................ 255
Figure 7.30: Multimedia-focused problem in 1-D kinematics which was solved by students during
the think-aloud interview.................................................................................................... 256
Figure 7.31: Multimedia-focused problem in dynamics which was solved by students during the
think-aloud interview. ........................................................................................................ 257
Figure 7.32: Practice problem used by the interviewer to demonstrate how to use the applet.................. 259
Figure 7.33: Practice multimedia-focused problem. ............................................................................... 260

1 Introduction

2
Solving problems is the essence of physics. In a report by the American Physical
Society problem solving is one of the top qualities sought by industry in a physics
graduate (Czujko, 1997; Rosdil, 1996; Rosdil, 1997). However, most students taking a
physics course in high school or college today are not physics majors. They are more
likely to be engineering majors, biology majors, pre-med majors, chemistry majors, and
math majors, to name a few. The nature of these occupations also requires problem
solving as a requisite job skill. For this reason, one objective of physics teachers is often
to teach critical thinking (or problem solving) skills which are imperative regardless of
the occupation in which the student eventually applies his or her knowledge and
ingenuity.
The emphasis on problem solving as opposed to rote acquisition of knowledge is
easily verified by viewing the most popular physics textbooks and common course
syllabi. For example, problem solving is emphasized in textbooks through frequent
display of examples interwoven throughout the text. In addition, the vast majority of
end-of-chapter questions are related to problem solving instead of knowledge or concept
testing. Naturally the textbooks reflect the desires of the majority of instructors who also
emphasize problem solving over conceptual understanding. As a result, instructors rely
mostly on homework problems, quizzes, and exams to both develop and test students'
ability to solve problems.
Unfortunately, this emphasis on problem solving has not necessarily resulted in
better problem solvers for two distinct reasons: (1) Students have prior conceptions (or
mental models) of physical principles and “novice” problem solving strategies; (2)

3
Explicit scientific approaches to problem solving are generally not taught nor enforced.
The end result is that students have not necessarily constructed appropriate conceptual
understanding and problem solving strategies prior to the introduction of problems.
When students arrive at class on the first day, they are not empty vessels to be filled
with knowledge of physics by the instructor nor are they blank slates on whom the
instructor writes understanding. They bring prior experience concerning the macroscopic
world. That experience gives them conceptions, or mental models, about how the world
works and the physical laws by which it is governed (Redish, 1994). These mental
models may not be consistent, complete, or distinguishable, yet they are extremely inert,
resistive to changes. It is for this reason that Ausubel (1968) writes,
If I had to reduce all of educational psychology to just one principle, I would say this: The most important single factor influencing learning is what the learner already knows. Ascertain this and teach him accordingly.
The literature documents prior conceptions for a number of physics topics that
persist even after an entire semester of instruction. This reality has been illuminated by
such tests as the Force Concept Inventory (Hestenes, Wells, & Swackhammer, 1992).
Instructors at first considered this test to be easy since it only contained conceptual
questions and no problem solving tasks (For example, read Mazur's account (Mazur,
1997)). Upon giving the test after instruction, they realized that students' scores did not
substantially improve. Yet students did well on problem solving exercises on homework
and exams. Why does this discrepancy between students' so-called “success” at solving
problems and their inability to answer seemingly “easy” conceptual questions exist?

4
Most likely, students are able to replicate textbook examples by applying equations while
not understanding the underlying principles (Larkin, McDermott, Simon, & Simon,
1980). The innate problem is that such strategies (also called weak methods) are
“successful” in the common course in that they are sufficient for obtaining good grades.
Students use a variety of strategies to solve problems. Not necessarily efficient
nor effective in the long term, these strategies (which can be thought of as a type of
mental model) are often employed in an effort to minimize serious thinking (Redish,
1994). Unfortunately, students are not usually aware of strategies they use nor do they
seek to build better strategies. Like prior conceptions, students must be led to realize that
they use such strategies, that these strategies are entirely inadequate beyond the end-of-
chapter textbook problems, and that they should acquire better strategies. This requires
that first, instructors realize students use inadequate strategies and second, that they must
be led to more effective, expert-like, strategies. In other words, principles of problem
solving must be explicitly taught (Polya, 1973; Schoenfeld, 1985; Heller, Keith, &
Anderson, 1992; Reif & Heller, 1984).
Since its inception, the computer has aided in the problem solving process either
as a calculational tool, visual tool, or procedural guide. From Charles Babbage's
mechanical calculator (it used punchcards originally developed for the loom) which
calculated numbers for navigators and astronomers or the Marchant mechanical
calculator which was used at Los Alamos to make calculations for the atomic bomb, to
the PLATO system which in the 1970s intelligently guided students through solving
physics problems, to today's networked servers which automatically collect and grade

5
students' responses from anywhere in the world using the internet, computers are tapped
to find ways of facilitating the act or teaching of problem solving.
In my opinion, the advent of information technology has the potential to alter the
way we teach to a greater degree than any other invention since the printing press.
Although technology has been employed in a variety of ways such as laboratory data
acquisition and control, interactive video, and simulations, the use of information
technology transcends disciplines, computer platforms, and teaching styles. Therefore,
we must be keenly aware of the greatest threat to effective use of information
technologya technocentric approach to teaching. A technocentric approach considers
the technology ahead of meeting the needs the learners. Like an adventurer who climbs a
mountain “ just because it's there” , some educators and curricula developers use
technology just because it is possible, not because it aids teaching and learning. For
instance, in an era where visual displays are extremely impressive, we must concentrate
on proper educational objectives rather than impressive use of technology. Lloyd Rieber
(1994) says:
Animation is most commonly used for cosmetic purposes, with the intent of impressing rather than teaching. All too often, animation is added to CBI without serious concern for its true instructional purpose or impact. While it is easy to be critical of designers and developers, they share responsibility with consumers who tend to evaluate instructional effectiveness based on the number of “ frills” that a package contains. This can create a cycle where the market, rather than learning needs, drives instructional design. Equally accountable are researchers who have yet to provide adequate guidance to either group. It is hoped that an attitude of shared responsibility will begin to prevail in more fully exploiting the potential of animated visuals in learning environments.

6
Likewise, Lilian McDermott (1990) says:
…experience has shown that many computer programs are not well matched to the needs or abilities of students. To be able to realize the full potential of the new technology, we must understand both how students learn physics and how the computer can best be used as an aid in the process. There is a need for research to help insure that computer-based instructional materials will become a useful resource for the teaching of physics.
This dissertation is a response to the calls of Rieber and McDermott for research in this
area.
1.1 Purpose
The purpose of the present research study is two-fold: (1) To investigate the
outcome of adding multimedia to problem solving exercises; (2) To make
recommendations on a proper use of multimedia in problem solving.
1.2 Justification
Cognitive psychologists have observed novices and experts solving physics
problems in an effort to develop models of expertise in problem solving (Larkin,
McDermott, & Simon, 1980; Larkin, 1981). Physics problems used in these studies have
been typical end-of-chapter textbook problems used in the traditional lecture-based
course. Physics educators, however, have extended the types of problems used in
courses. Examples are context-rich problems (Heller, Keith, & Anderson, 1992) and
active learning problems (Van Heuvelen, 1991b). Yet, these are still printed, paper-based

7
problems. They contain nothing new in terms of media, although they are certainly
different in nature.
With computers, it is now feasible to deliver multimedia-enhanced problems to
large numbers of students. These problems contain something newanimation, video, or
soundalthough they may or may not be different in nature. The presence of the
multimedia may possibly alter the way novices solve these problems, since they can
potentially enhance students' visualization of the problem. However, we don't know
exactly how the multimedia influences the problem solving process nor problem solving
performance of novices and experts. It is likely that it does not influence experts at all,
yet variably influences novices on either process or performance (see Section 3.2.1).
Multimedia might influence novices' processes or performance on problems if it
improves visualization of the problem. The process of problem solving can be organized
into three essential steps: description of the problem, construction of a solution, and
testing of the result (for a detailed discussion, see Section 2.2.1). The first step,
description of the problem, includes visualization. When necessary, students should be
able to translate text given in a problem to a pictorial representation which illustrates
physical qualities of the system. If the physics problem pertains to a time-dependent
process, students are expected to be able to describe and illustrate these physical qualities
as a function of time. As the first step to problem solving, mastering this ability is
essential to mathematically analyzing the problem and constructing the solution.
Unfortunately, novice problem solvers are resistant to drawing pictures as a first step to
solving problems, especially for time-dependent processes where it may be crucial to

8
illustrate the process at specific times. Expert problem solvers on the other hand readily
resort to pictorial representations to identify concepts that facilitate solving the problem
(Larkin, 1981).
Most research on the influence of multimedia in computer-based learning has
concerned the use of animation in prose learning (learning by reading), e.g. in a
computer-based tutorial (see Section 2.4.1). Results are varied with some showing a
positive effect of animation on students' reading comprehension and some showing no
effect of animation on students' reading comprehension (as measured by performance on
post-tests). The bottom line is that merely including animation with text will not
necessarily have a positive effect even when appropriately designed according to
educational objectives (Rieber, 1994). Evidently this fact has not made a large impact on
curriculum developers or educational consumers as evidenced by the growing number of
CD-ROMS and Web applications which include glitzy animation and video without
regard to the needs of the learner.
A promising use of multimedia in problem solving is in the area of video analysis.
Initially, students marked on transparent film pressed over a video monitor to record the
position of an object as the video was advanced frame by frame (Zollman, & Fuller,
1994). Students could use the data to calculate displacements, velocities, and
accelerations of objects in the video. As computerized video analysis tools became
available, students could click on an object in a digital video clip and have the computer
plot position, velocity, and acceleration vs. time graphs thus helping students make better

9
connections between kinematics graphs and the actual motion of objects (Beichner,
1996).
Only one study has been devoted to the use of animation in testing (Hale, Oakey,
Shaw, & Burns, 1985). Its goal was to minimize validity problems with printed tests
since students' difficulties may lie in visualization as opposed to knowledge or problem
solving skills. Its conclusions were merely that the test that included animation was
similar to a printed test in terms of the difficulty of the problems, subjects' completion
time, and subjects' performance even though a direct comparison was not made. No
conclusions can be drawn about how or if the animation altered subjects' thinking
processes nor can it be verified that the original intent was satisfied.
The lack of research into the area of multimedia and problem solving may be due to
the lack of demand for such a task. However, with the rapidly increasing use of the Web
for distributing physics problems, the question of appropriate use of multimedia with
problem solving is much more relevant today than even a few years ago (Bonham, 1998).
Therefore, it is anticipated that insight into this issue will be gained by answering the
research questions in Section 1.4.
1.3 Definition of Terms
Multimedia: Multimedia literally refers to numerous modes of
communication. In the context of this dissertation, multimedia refers to
modes of communication beyond text and static images which is typically

10
video and animation (although sound files can legitimately be described as
multimedia as defined here).
Multimedia-enhanced problems: A problem that includes multimedia for
presentation of what is described in the text of the problem but is
otherwise not necessary for solving the problem.
Multimedia-focused problems: A problem that includes multimedia which
contains information required for solving the problem. Multimedia-
focused problems referred to in this study require students to take
measurements of position and time in an animation in order to solve the
problems.
Video: A sequence of still frame photographs which when played
consecutively provide a time-sequenced picture of motion. The property
of video that distinguishes it from animation is that it shows actual motion
of objects. It is thus a “real” time-sequenced picture of motion.
Animation: A sequence of still frame images which when played
consecutively provide a time-sequenced picture of motion. The property
of animation that distinguishes it from video is that it consists of drawn
images of objects. It is thus not a “real” picture of motion.
11
Simulation: Simulation is a computer-generated model of a phenomenon.
An animation depicting the actual motion of an object (or objects) under
certain conditions is a simulation. However, simulations may also be
numerical and not include animations whatsoever.
Traditional physics problems: Problems similar to those encountered at the
ends of chapters in a typical physics textbook. The objective of traditional
physics problems is typically to calculate a numerical answer from a set of
given variables in a well-defined situation. Often results can be found by
applying just a few formulae without much conceptual thought.
Similar physics problems: Problems which are similar in objective (what
is asked for) and physical principles required to solve the problem.
Approaches: In the context of this dissertation, it refers to the thought
processes and/or strategies used in solving a problem. Although one's
approaches to various specific problems may differ in details, usually the
approaches are similar in general structure.
Performance: Performance is measured in this dissertation by a correct
response on a physics problem. Difference in performance between

12
groups refers to a difference in the proportion of correct responses for the
two groups.
1.4 Research Questions and Hypotheses
Experiment (1): What is the difference in performance of students who view associated
static visuals and students who view associated video on traditional physics problems?
Hypothesis: Students who view associated video will perform better than
students who view associated static visuals on otherwise identical problems.
Null Hypothesis: Students who view associated video will not perform better than
students who view associated static visuals on otherwise identical problems.
Experiment (2): Do students perform worse on multimedia-focused problems than on
traditional problems?
Hypothesis: Students will perform worse on multimedia-focused problems as
compared to “similar” traditional problems.
Null Hypothesis: Students will not perform worse on multimedia-focused
problems as compared to “similar” traditional problems.

13
Experiment (3): How do students solve multimedia-focused problems?
Hypothesis: Students will exhibit conceptual reasoning and a qualitative
approach to solving multimedia-focused problems.

14
2 Background

15
2.1 Related Psychological Background
2.1.1 Domains of Learning
Perhaps the most well-known taxonomy of learning objectives, or outcomes, is
that of Bloom (1956)Bloom’s Taxonomy. This taxonomy, or domains of desired
learning outcomes, was motivated by psychologists interested in achievement testing who
needed a common framework with which to discuss objectives for evaluation, or the
measurement of learning. Bloom's domains of learning are: cognitive, affective, and
psychomotor. The cognitive domain encompasses everything from recalling simple facts
to formulating new ideas and problem solving. The affective domain includes personal
feelings, emotions, and values. Finally, the psychomotor domain deals with motor skills
such as the act of performing some manual task. It’s important to note that these domains
are definitely rooted in the desire to organize the evaluation of student learning. Bloom
notes that while it may be somewhat simplistic to believe that a learning objective can be
binned into a distinct category, one can more easily and more distinctly categorize the
objective of evaluation.
Gagné builds on Bloom’s classification of the outcomes of learning. Gagné calls
these outcomes categories of capabilities, or varieties of capabilities, and they are:
intellectual skills, verbal information, cognitive strategies, motor skills, and attitudes.
Intellectual skills is essentially procedural knowledge, knowing how to do something.
Verbal information, also referred to as declarative knowledge, is essentially the ability to

16
communicate facts by writing, speaking, or drawing. Cognitive strategies are the
capabilities to control cognitive processes such as remembering information and solving
problems. Motor skills describes the capabilities to do things. And, attitudes are the
capabilities to make certain choices. These 5 outcomes, or domains, of learning may be
mapped onto Bloom’s objectives with intellectual skills, verbal information, and
cognitive strategies corresponding to Bloom’s cognitive domain, and attitudes and motor
skills corresponding to Bloom’s affective and psychomotor domains. According to
Rieber (1994), Gagné’s taxonomy as been the basis of much of the theory girding work in
educational technology. The influence of Bloom’s and Gagné’s taxonomies can be seen
in the hierarchy of the purposes of instructional graphics which roughly map on to the
cognitive, affective, and motor skills domains (see Section 2.3.2).
2.1.2 Cognitive Learning Theory--The Information Processing Model
Computer-based instruction today is mostly built on Cognitive Learning Theory.
In contrast to Behavioral Learning Theory which focuses on stimulus-response
associations, Cognitive Learning Theory focuses on information processes which are
governed, or constrained, by the Information Processing System. Di Vesta (1987)
provides a historical background of the cognitive movement.
Although there are competing models of the Information Processing System,
many cognitive psychologists agree that it is essentially composed of three types of
memory: sensory register, short-term memory (STM), and long-term memory (LTM). A

17
cognitive process is viewed as a series of internal states which are transformed by
information processes. In other words, information is sequentially processed (selected,
encoded, and stored) from the time of input to the time of permanent storage (Di Vesta,
1987). Information processes are governed by the central processor (CP), otherwise
known as control systems.
As information is detected by sensors, it is registered in the sensory registers.
These registers can accept huge amounts of data, yet it only stores the data for an
extremely short period of time, perhaps 10 to 100 msec (Ericsson, & Simon, 1993).
Portions of the data may be recognized, meaning that the CP associates sensed
information with patterns previously stored in LTM and creates STM pointers to those
patterns. On the other hand, for non-automated processes small portions of the
information in the sensory registers must be selected for further processing in STM. The
control process used is called selective attention (or selective perception). Novices
viewing something unfamiliar for instance must choose what information to heed and
what information to ignore. Being novices, they may heed unimportant information
while discarding important details, but as they gain more experience, they may improve
at distinguishing between the two. This is an important detail when designing
instructional graphics as discussed in Section 2.4.1.
STM has a limited storage capacity (perhaps only 4 to 7 “chunks” of information
at once) of somewhat short duration. These chunks may be like “bits,” single units of
information such as a letter or a single digit or they may be like “bytes,” composed of
many bits such as a pattern or picture. The number of chunks stored in STM cannot be

18
increased; however, one can greatly increase the amount of information stored in STM by
storing information as large chunks rather than small chunks.
Data contained in STM can be transformed and stored, or encoded, in LTM. The
long-term memory is for permanent storage of information, thus it has perhaps unlimited
capacity (at least it is extremely large and therefore practically unlimited as is proposed
by some psychologists). Although it is not exactly known how the LTM stores data, it is
certainly organized in a meaningful way. A useful model is to view LTM as a collection
of joining nodes, each node representing chunks of data. Perhaps some chunks form
groups or clusters and others are single units. These chunks can be linked by
“associations” so that one chunk leads to another which leads to another. In summary,
there are two methods by which information is retrieved from LTM to STM: recognition
and association.
This model of LTM is useful for explaining how some information is “forgotten.”
It is believed that all information passing through STM is stored in LTM, yet it may be
stored in strongly linked chunks which can easily be retrieved or weakly linked chunks
which are not easily retrieved. Therefore, a “good” memory may merely describe the fact
that the CP stores information in the LTM in a more organized pattern so that it can
easily be recalled.
When data is retrieved from LTM, the CP stores pointers in STM to the data in
LTM, thus the reason that the STM is sometimes called the working memory. At this
point, the CP may also generate a response based on pointers in STM. However, in the
case of automated processes, the CP may bypass STM (or working memory) and generate

19
a response directly from information in LTM. This explains why one can often perform
an automated task (such as walking) “without thinking.”
Thoughts typically refer to information heeded in STM. Thus information
described as that which is “attended to” or “heeded” refers to information in STM. This
is the foundation to the theoretical model for the validity of verbal protocols described by
Ericsson and Simon (1993) and expounded on in Section 2.5.
2.2 Problem Solving
2.2.1 Problem Solving Heuristic
Polya (1973) revived the concept of heuristic. Heuristic is the “study of the
methods and rules of discovery and invention.” Schoenfeld (1985) calls them “rules of
thumb for successful problem solving.”
Polya divides the problem solving process into four categories which he calls
phases. His four phases are: (1) understand the problem, (2) make a plan, (3) carry out
the plan, and (4) look back at the completed solution. Polya gives “unobtrusive” and
“general” questions which can be asked during the four phases to help oneself or a
student proceed through solving a problem. The questions which he formulates are
simple and by no means comprehensive; however, they form an excellent set of examples
illustrating the unobtrusive and general nature of self-asked questions useful in problem
solving. A few examples of questions for each phase are shown in Table 2.1.

20
Table 2.1: Example questions for each phase of problem solving proposed by Polya.
Phase Questions
Understanding the problem
What is the unknown? What are the data? What is the condition?
Devising a plan
Can you think of a familiar problem having the same or a similar unknown? Did you use all the data? Did you use the whole condition?
Carrying out the plan
Did you check each step? Can you see clearly that each step is correct? Can you prove that each step is correct?
Looking back
Can you check the result? Can you derive the result differently? Can you use the result or method for another problem?
Although Poyla’s work was monumental and has been a cornerstone on which
much of the work in problem solving heuristics has been based, Schoenfeld (1985) has
extended our understanding of problem solving to not only consider heuristics, but to
consider a larger framework that includes resources (base knowledge), heuristics
(problem-solving techniques), control (selecting and deploying of resources), and belief
systems (misconceptions, attitudes).
Unlike Polya, whose criteria for “questions” were unobtrusiveness and generality
and who’s goal was a general heuristic, Schoenfeld believes that problem solving
strategies to date have generally been ineffective because of their generality or lack of

21
specifics. In fact, he cites Begle (1979) who suggests that problem solving strategies are
often both problem-specific and student-specific and casts doubt on the idea that one or a
few strategies taught to all students will be successful. According to Schoenfeld,
heuristics are much more complex than previously thought.
Another reason for the general ineffectiveness of heuristic strategies is that they
generally are not sufficient for guaranteeing successful problem solving. Rather,
successful problem solving also depends on the other components of his
frameworkresources, control, and belief systems. For example, teaching heuristics is
not sufficient; one must also teach the use of individual heuristic strategies, or control.
In addition, heuristics are not capable of overcoming weak knowledge of the subject
matter; successful implementation of heuristics in fact requires a firm understanding of
the subject matter. Teaching problem solving (and “doing problem solving”) requires
attention to all of the details of the framework, not just heuristics.
Polya’s problem solving heuristic, and perhaps Schoenfeld’s to a great extent, was
based on personal experience and “common sense.” It is a heuristic that they personally
employed as expert mathematical problem solvers. Heller and Reif (1984), on the other
hand,
…study human problem solving from a more general point of view which transcends the investigation of naturally occurring intellectual functioning. Our aim has been to specify cognitive processes and knowledge structures which lead to good human problem solving in a realistic scientific domain, without necessarily trying to simulate what actual experts do and without assuming that experts always perform optimally. [emphasis in the original]

22
Their approach is prescriptive, proposing a “good” strategy, or model, for solving physics
problems, rather than descriptive, characterizing how “good” problem solvers solve
physics problems. Heller and Reif define the specific applicability of the model;
however, they seem to extend the usefulness of the model beyond mechanics to teaching
scientific problem solving skills in general.
According to Reif and Heller (1982), the three general procedures, or model, for
problem solving are initial description and qualitative analysis, construction of the actual
solution using various processing for searching and making decisions, and final
assessment of the solution. “The first task faced by a problem solver is to redescribe an
original problem in a way facilitating the subsequent search for its solution.” This can be
separated into two parts, a basic description and theoretical description. The basic
description is essentially a translation of the problem statement into a form that clearly
identifies the situation and information to be found. This includes a “detailed time-
sequenced description of any process specified in the problem.” Concerning the
importance of the first step, they found that the “ initial description of a problem can
greatly facilitate the subsequent search for its solution, sometimes to the extent that the
solution becomes obvious.”
This model was likely based on the model developed by Reif, Larkin, and Bracket
(1976). They taught a four-step problem-solving strategydescription, planning,
implementation, and checkingwhich is strikingly similar to Polya’s phases.
Schoenfeld’s (1985) and Heller’s and Reif’s(1984) work was the foundation for a
strategy developed by Pat Heller, Keith, and Anderson (1992). Their strategy “requires

23
students to make a systematic series of translations of the problem into different
representations, each in more abstract and mathematical detail.” The five steps are: (1)
visualize the problem, (2) describe the problem in physics terms, (3) plan a solution, (4)
execute the plan, and (5) check and evaluate. The major difference between this strategy
and the strategies of Polya and Reif is that Heller, et al. explicitly say to visualize the
problem. Visualization is certainly an important part of problem solving in physics, and
therefore is probably why Heller, et. al. chose to articulate it as a separate step. Polya
would probably argue that is not a general phase, although he probably would agree that
it is part of understanding the problem and/or planning the solution, phases 1 and 2 in his
strategy.
More recent strategies have been proposed by Van Heuvelen (1991b), Leonard,
Dufresne, and Mestre, J. P. (1996) and Beichner (1997). Van Heuvelen’s approach is
loosely based on the strategy proposed by Heller and Rief (1984). It’s essence, however,
seems to be rooted in Larkin’s (1981) description of expert problem solvers (described in
Section 2.2.2). Using ALPS (Active Learning Problem Sheets), students are taught to
develop four representations of a problem: verbal, pictorial, physical, and mathematical.
Given the verbal statement of a problem, the student transforms the verbal statement into
a picture of the problem, often at different times during the process and with
accompanying variables. They then develop a physical representation by drawing
vectors, force diagrams, or graphs to further depict the physics of the problem. Finally,
the student solves the problems using mathematical equations. Although, this approach is
heavily weighted toward helping students exercise qualitative reasoning by developing a

24
description of the problem in various representations, it generally follows the phases
originally advocated by Polya (1973).
The proposed strategy by Leonard, Dufresne, and Mestre (1996) is also a more
detailed approach for describing the problem and planning the solution, two steps in the
strategies proposed by others. They break up the description of the problem into three
components, what they call the “what, why, and how” of solving the problem. The
components are: (1) a description of the major principles and concepts needed to solve
problem, (2) a justification, or rationale, for applying the principles and concepts
described in the first step, and (3) a procedure for applying those same principles and
concepts. It doesn’t seem to be a radical departure from the strategies already discussed;
it merely provides more detail.
The more recent GOAL approach by Beichner (1997) closely parallels the phases
of Polya. GOAL stands for Gather, Organize, Analyze, and Learn. One interesting detail
included by Beichner’s approach is the act of “guesstimating” which he includes as part
of the first step to gather information. Beichner encourages students to make a
reasonable guess at what the final answer should look like before they begin to solve the
problem. The advantage is that it helps students with the process of describing the
problem conceptually before substituting numbers. In addition, it encourages them to
look back at the end and compare their final result to their original guess. This subtle
nuance may possibly help students develop the “ intuition” found in expert problem
solvers (see Chi, Feltovich, and Glaser,1981, for a further description of expert intuition).
It may also make the problem solving process more fun as students see how close they
25
can get without actually solving the problem (at least in their view of problem solving).
Of course they then have to solve the problem to see how close their “gamble” was.
Most, if not all, of the literature on recommended problem solving approaches is
consistent even though they may have subtle differences and focuses. In fact, Pat Heller,
Keith, and Anderson (1992) note that recommended problem solving strategies are all
very similar with common elements, a conclusion with which I concur. Many of the
strategies discussed here include describing the problem, planning the solution,
developing the final solution, and revisiting the problem at the end. The description of
the problem includes understanding the question, organizing given information,
conditions, and unknowns; making estimations; and visualizing the problem by drawing
diagrams, noting the position of objects at various times, etc. Planning the solution
consists of conceptual reasoning, casting the problem into a mathematical description,
and considering previously-solved or similar problems. After adequately describing the
problem and planning the solution, one can then develop the solution by substituting
given variables, manipulating equations, and solving for the unknown(s). This is
typically the “number-crunching” part of the process. Finally, most problem solving
approaches recommend revisiting the problem and verifying its correctness by testing
limits and checking reasonability.
Upon reviewing recommended strategies for solving problems, it is imperative to
ask, “Do they really work?” Are students who are taught these strategies more successful
at solving problems? All of the researchers here report positive results. Some of those
results are shown in Table 2.2.

26
Table 2.2: Results of teaching problem solving strategies.
Reference Findings
Reif, Larkin, and Bracket (1976)
Students who were taught the strategy: • Exhibited a greater use of diagrams and algebraic (as opposed to
numeric) relations. • Showed more extensive planning. • Were more likely to correctly solve a problem. • Exhibited better reasoning and more relevant steps even when not able
to correctly solve a problem.
Van Heuvelen (1991b)
Students who received instruction in OCS (Overview, case study physics): • Were more likely to correctly solve a problem. • Exhibited greater qualitative reasoning as evidence by the correct use
of physics principles, free-body diagrams, and vector components.
Although Schoenfeld is skeptical of the success of teaching a general problem
solving strategy, perhaps the models proposed by the researchers above were successful
because they were indeed specific and not generalizable as was the original goal of Polya.
Regardless, it is clear from reviewing the problem solving literature dealing with problem
solving strategies or approaches, that Polya’s original phases has had a monumental
impact.

27
2.2.2 Expert vs. Novice Research in Physics
Although it is simplistic to believe that we can teach novices to emulate experts or
that experts’ problem solving approaches are a panacea, we can analyze expert
approaches to find common methods which seem to work well in solving domain-specific
exercises. Research comparing novice and expert problem solving behaviors can be
summarized along the following categories: (1) description of expert and novice problem
solving behaviors, and (2) psychological models which simulate expert and novice
problem solving behaviors.
Jill Larkin (1981) has studied novice vs. expert methods of solving problems and
has modeled their patterns with computer applications. Students typically rely on “weak
methods” to solve problems. These include means-ends analysis (comparing what is
given in the problem with what is to be solved and trying to reconcile the difference), hill
climbing (looking at possible steps to solve the problem and doing that which seems to
work), and generate-and-test (try anything and see if it looks right). Described here and
in other papers (see Larkin, McDermott, Simon, and Simon, 1980, for example), Larkin
models the method that a skilled problem solver uses to solve a textbook problem. The
computer model, like the expert, uses a series of four problem representations: the verbal
statement of the problem, an illustration of the physical situation described in the
problem, conceptual representation (e.g. free-body diagram), and a set of equations. A
pictorial representation (e.g. sketch, picture, or illustration) is sometimes given in a
textbook problem, but regardless, the expert problem solver almost always draws a
picture.

28
The first representation, text of the question, is available to both novice and expert
problem solvers, and the final representation, mathematical equations, is always used by
both novice and experts; however, the expert, as opposed to the novice, almost always
utilizes the second and third representations. In contrast, the novice typically proceeds
directly from the problem statement (first representation) to a mathematical solution
(fourth representation) (Van Heuvelen, 1991a). I’ve found from personal discussions that
this finding is in good agreement with the personal experience of many experienced
teachers. Perhaps surprisingly, I believe that this finding is also in good agreement with
many students. Both teachers and students will often describe students’ problem solving
process as “plug and chug”. In fact, one can find many occurrences of this phrase in the
interview transcripts and survey responses of the experiments described in Sections 3.3
and 3.4.
These representations may also be used to explain how novices and experts
categorize similar problems (Chi, Feltovich, and Glaser,1981). “A problem
representation is a cognitive structure corresponding to a problem, constructed by a
solver on the basis of his domain-related knowledge and its organization.” The
difference in abilities between expert and novice problem solvers to develop problem
representations may be attributed to how problems are mentally categorized. It's believed
that categorization is what leads to the “physical intuition” that leads to quick, efficient
solutions of problems. In an experiment where experts and novices were asked to group
similar problems based on similarities of solution (Chi, Feltovich, & Glaser, 1981),
experts categorized by major concept (e.g. Newton's Laws, Conservation of Momentum,

29
Conservation of Energy) and novices by surface characteristics (e.g. rotation, inclined
planes, springs). This roughly corresponds to categorization by representation 2 (novice)
and representation 3 (expert). Van Heuvelen (1991a) gives a nice illustration of this
finding. He describes how students answering a question involving a spring-loaded gun
on a final exam used equations describing simple harmonic motion instead of
conservation of energy. Since only weeks before the final exam they had studied simple
harmonic motion, students associated springs with simple harmonic motion. Thus any
problem with a spring became a simple harmonic motion problem.
In general, Larkin and Reif (1979) note two main differences between expert and
novice problem solvers. First, “Instead of trying to jump directly from a physical
situation to quantitative equations, experts seem to interpose an additional stepa
qualitative analysis or redescription of the problem.” Second, experts remember
principles in “chunks” or “groups” whereas novices retrieve principles one at a time.
Chi, Glaser, and Rees (1983) outline expert vs. novice problem solving research in
physics and separates the findings on differences between experts and novices into two
categories: quantitative differences and qualitative differences. There are three succinct
quantifiable differences between experts and novices: (1) solution time, (2) pause times
between recalling successive “chunks” of information such as equations, and (3) number
of errors. Qualitative differences are summed up by: (1) experts exhibit a qualitative
analysis of a problem prior to its subsequent solution, (2) novices use more
“metastatements” such as those to express doubt or plan of solution, and (3) experts and

30
novices use different paths to the solution (experts use a working-forward approach
whereas novices use a working-backward approach).
2.3 Instructional Graphics
Instructional graphics can be subdivided along three different aspects: type, purpose, and
temporality.
2.3.1 Types of Instructional Graphics
Generally, there are three types of graphics: representational, analogical, and
arbitrary (Rieber, 1994).
Representational graphics resemble real objects. For example, a physics text
describing a mass hanging vertically on a spring may show a photograph of a mass
hanging on a spring. Alternatively, the visual could also be a line sketch of a small
rectangle labeled “mass” which is at the bottom of a zig-zag pattern resembling a spring.
In this way, the representational graphic may be highly concrete (a photograph) or highly
abstract (a line sketch), yet literally depicts an object.
Analogical graphics are used to illustrate a similar object or idea. For example,
one might describe a model of how the mind organizes information, yet show a graphic
of bookshelves containing books of various subjects with wires connected between the
books depicting links between clusters of nodes of information. Likewise, one might

31
show the inside of a computer as an analogy of the information processing model with
the keyboard and mouse as sensory receptors, RAM as the short-term memory (STM),
the hard drive as long-term memory (LTM), the CPU as the control systems, and the
monitor as the effectors (responses).
In physics, a picture of tiny circles orbiting a larger circle in concentric rings is
used as an analogical graphic to depict electrons in their energy levels in the atom. At
one time in history, this graphic was probably used as a representational graphic, showing
electrons orbiting the nucleus like planets orbiting the sun. However, as we learned more
about the nature of atoms, we learned that while this may be a good analogy, it is not
representational of the actual atom. Yet this graphic may be viewed quite literally by the
novice, thus exemplifying that analogical graphics can be viewed as representational
graphics even if that is not the intent of the author. Authors must choose analogical
graphics wisely to both facilitate learning yet not create misconceptions.
Arbitrary graphics do not resemble any real object but rather depict logical or
conceptual relationships. An example is a flowchart illustrating the hierarchical nature of
employees in a company. In most physics topics, arbitrary graphics such as graphs are
frequently used to communicate data and relationships between variables.
2.3.2 Purposes of Instructional Graphics
Graphics may be used for five different purposes which are known as the five
applications (or functions) of graphics (Rieber, 1994). They are cosmetic and motivation,

32
both in the affective domain, and attention-gaining, presentation, and practice which are
part of the cognitive domain (domains, or outcomes, of learning are discussed in Section
2.1.1).
Graphics used for cosmetic purposes are used to “dress up” the text. An example
is the use of a graphic as a background in a PowerPoint presentation. A particular
background in a presentation may cause it to appear pleasant to the audience and thus
elicit a more accepting attitude. Certain graphics in advertising are often chosen for their
cosmetic appeal, thus the demand for highly paid supermodels in magazine
advertisements. Although physics textbook publishers have not yet hired supermodels to
adorn textbook covers, cosmetic graphics are used extensively in introductory physics
texts. Unfortunately, learning does not take place directly as a result of cosmetic
graphics. Rieber (1994) notes, “At their best, cosmetic graphics help maintain student
interest…At their worst, cosmetic graphics distract student attention from other important
material.” Unfortunately, multimedia is often chosen for cosmetic purposes where it has
much potential for distraction.
Graphics may also be used for motivational purposes, appealing to the viewer's
attitudes. For example, a physics text addressing the operation of lasers may show a
graphic of a CD player. In this way, the author hopes to motivate the reader to learn the
material by illustrating that the concepts are relevant to today's technology. Other
examples might be photographs of a man shot out of a cannon, the Andromeda Galaxy,
or a world-record weight lifter. It's important for learners to see material as exciting and
relevant, but there is a danger in overusing graphics for motivational reasons. Although

33
the learner may be motivated by novel graphics, they may become saturated by being
inundated with such visuals.
In today's entertainment, visually-focused society, motivating visuals can quickly
lose their instructional impact. Consider Web-based instruction for example. Right now,
students may be extremely motivated to learn physics when they see video and animation
integrated with physics text on the Web. But once students use the WWW in every class,
year after year, the novelty will wear off, and multimedia enhanced content may no
longer motivate students to spend more time on task. Presently, educators must be
cautious about falsely attributing learning to the design of multimedia-enhanced
applications when it is mostly due to novelty (Rieber, 1994).
Although sometimes difficult to distinguish from motivational graphics, visuals
can also be used to gain attention. These are known as attention-gaining graphics. Their
primary difference from motivational graphics is that they are not designed to influence
the attitude of the viewer (motivation) but rather to focus the viewer's attention.
Attention-gaining graphics may directly influence students' learning, thus it is classified
according to the cognitive domain (or outcome) of learning. One attention-gaining
graphic which is familiar to multitudes of physics students over the past few decades is
the Tacoma Narrows Bridge as it oscillates and subsequently crumbles under turbulent
winds which vibrate the bridge at its resonant frequency. That one visual (especially the
video clip) can nearly lock into memory many principles of resonance for anyone who
sees it, thus vividly demonstrating the influence of an attention-gaining graphic.

34
Probably the most common use of instructional graphics is for presentation. For
example, a chapter on two-dimensional kinematics often contains a multiple-exposure
photograph of two balls, one with an initial horizontal velocity and one with zero
horizontal velocity, dropped in an evacuated chamber. Because of the constant
acceleration downward due to the gravitational pull of the earth on the balls, the time-
elapsed photograph shows that the balls fall equal vertical distances. The graphic
visually presents critical information helpful for understanding concepts.
In the information processing model of cognition, the acquisition and application
of knowledge relies on the successful storage and retrieval of information from long-term
memory. Visuals can be used effectively for both storage and retrieval of information, a
process Reed calls learning by viewing (Reed, 1985). In addition, people do not all learn
efficiently by only one type of input, but rather people typically learn best by a
combination of verbal and visual input. Also, the benefits of visuals presented with text
for students' reading comprehension are well established (Dwyer, 1978).
Finally, instructional graphics may be used for practice activities. This purpose is
especially suited to interactive computer simulations where the user receives feedback
based on his or her input. One example is training simulations, such as a flight simulator
where the user can control the direction of the plane (pitch, roll, and yaw) and speed. In
physics, practice may be obtained in a simulated laboratory exercise. For instance, a
computer simulation of the Millikan Oil Drop Experiment (Vernier Software, 1988)
allows students to change certain input parameters such as electric field until a charged
drop is suspended and subsequently calculate the charge of an electron. Advantages for

35
this type of instructional graphic includes increased safety, less expense, ease of setup,
and ease of operation.
2.3.3 Temporality
Instructional graphics may either be instantaneous, time-sequenced, or time-
dependent. Instantaneous and time-sequenced graphics are both static visuals since they
are represented by only one graphic frame. Time-dependent graphics on the other hand
are represented by multiple frames as in a video or animation.
Instantaneous visuals are either a snapshot of motion at a particular moment in
time or are time-independent. This is probably the most common mode of graphics used
in physics, probably because they are the easiest to display in textbooks, on exams, or on
a chalkboard.
Time-sequenced graphics capture an event at various moments in time on the
same visual. A common example is a strobographic photo of two falling balls, one
projected horizontally and one dropped from rest. A strobographic photo captures
images of the two balls at regular time intervals as the balls fall. One can then see that
the vertical displacement of the two balls is identical in any given time interval.
Time-dependent graphics refer to constantly refreshed visuals. This includes both
video (pre-captured and real-time) and animations. Whether it is computer controlled or
merely the flipping of consecutive pages of a booklet, time-dependent graphics give the
appearance of movement, or change as in the changing of colors.

36
2.4 Visual Media in Computer-aided Instruction
Graphics in instruction are sometimes used when they are not necessary and in such
cases can actually be detrimental to learning (Rieber, 1994). This is especially true of
multimedia in computer-aided instruction. It seems that the development of technology
has perpetuated the notion that more multimedia is better, and in education the notion that
multimedia translates into learning. The truth is that the motivational appeal of
multimedia is usually much greater than any impact on learning (Rieber, 1994). In fact,
multimedia is generally given greater confidence for a positive impact on learning than it
deserves. Curriculum developers seem especially highly susceptible to what the “Oohh,
Aahh” factor, that the use of multimedia necessarily invokes learning. Rather, one must
consider learning objectives when incorporating graphics (see Section 2.1.1).
2.4.1 Still Graphics
Non computer-generated visual media in testing has been available, and therefore
researched, for much longer than has animation. Although somewhat dated, Dwyer
(1978) discusses work in visual testing. Motivation for using visuals in testing is the
doubt that verbal printed tests can validly and reliably measure students’ understanding of
information presented visually. Undoubtedly this same motivation is what prompts some
to incorporate animation with testing (Hale, 1985). However, results from visual testing

37
studies indicate that there is no significant difference in the performance of students on
verbal printed tests compared to those who received visual tests (both printed and
projected) when all students received visualized instruction. Studies have shown that the
visual tests are valid and reliable, but one certainly has to question whether the verbal
printed tests were truly invalid and unreliable when given to students who received
visual-intensive instruction as was the original motivation for carrying out this research.
This can best be summarized in Dwyer’s (1978) own words:
Most of the findings from these studies indicate that no significant differences occur in student performance as a result of their being evaluated visually rather than in the conventional verbal format These general findings along with the time and expense involved in constructing visual tests have succeeded in preventing, if only temporarily, the impact that visual testing may eventually make on educational evaluation as we know it today.
However, these studies which Dwyer cites mostly tested factual recall. Dwyer
notes that “no one type of testing format will be equally effective in accurately assessing
student achievement of all types of educational objectives.” Thus we should investigate
the effectiveness of visual vs. verbal tests in other domains. As a result, we may find that
visual testing is more valid for testing students’ performance on certain tasks such as
problem solving.
Unlike Dwyer’s goals, the motivation of the present study is not to more
accurately test physics students who received visualized instruction (which is often the
case in physics), but to see if visual media (animation and video) in particular changes
how students solve problems. Our concern is less with the validity of our present tests
and more with the condition of students’ problem solving abilities.
38
In one sense, however, we can consider and discuss the motivation of the present
study in terms of validity. The differences, or lack thereof, in students’ performance in
Experiments 1 and 2 may be explained in terms of validity. That is, are “traditional
problems” validly assessing students’ understanding of physics? Do multimedia-
enhanced and multimedia-focused problems more validly assess students? Answers to
these questions are addressed in Sections 3.2 and 3.3.
2.4.2 Animation
Hale, Oakey, Shaw, and Burns (1985) seem to be the only ones who have
investigated the influence of animation in testing. The purpose of their study was to
design a test that would minimize certain validity problems with printed tests such as
their inability to truly assess students based on their knowledge or problem solving skills
rather than their ability to visualize a problem; this purpose is consistent with the
motivation for studying the effect of other types of visuals in testing as is discussed in
Section 2.4.1. The instrument tested students' ability to: (1) identify variables in an
experiment, (2) identify and state hypotheses, (3) operationally define variables, (4)
design investigations, and (5) graph and interpret data. The overall results of the study
were that the test was highly similar to a similar printed test in terms of the time it took
students to complete the test, the performance of both good and poor students, the
difficulty of the problems, and reliability, even though they did not do a direct
comparison between the computer-based test and a printed test.

39
Hale does make recommendations based on interviews which include: (1)
student-paced events are better than computer timed sequences, (2) different colors
should be used sparingly (no more than 2 or 3 different colors on a screen at one time),
(3) computer animation is of most value to students if the events depicted are unfamiliar
to them, (4) printed text on the screen should be carefully edited, (5) different areas of the
screen should be used consistently for the same type of information, (6) slow drawing
graphics should be avoided (unless there is value in observing each object in a picture
being drawn), (7) events should be displayed from a complex computer display in a
sensible order, (8) pertinent data or graphic information should be displayed on the screen
for as long as it is needed, (9) reading problems cannot be overcome by computer graphic
displays; that is, words are needed to both present problem situations and answer
questions).
Their study, however, is not helpful for understanding whether animation
influences how students solve problems. The major difficulty is that they never seem to
make a direct comparison between student performance on the animated and printed
versions of the test. The next major difficulty is simply the date of the study. Animated
displays have drastically improved since 1985! The conclusions don’t seem to apply
very well to the research questions at hand.
Since research pertaining to the use of animation in testing is hard to find, it is
necessary to review the results of animation used as presentation in prose learning. This
research is highly prone to invalidity (Rieber, 1984). For instance, research that does not
compare animation to static visuals should be disregarded because even though the use of

40
animation may be shown to be effective when compared with text-only, it's highly
probable that static visuals would also be effective in the same context. In addition,
maturation effects can render a study invalid since one's ability to internally visualize
changes with age.
There are other confounding variables as well. For instance, if the material is
significantly difficult or easy, any positive effect of animation can be nullified (Rieber,
1989). Also, how animation is cued (i.e. whether it plays automatically within the text,
requires student to start and stop it, or requires the student to first read text before being
allowed to see the animation, etc.) can impact its effectiveness (Rieber, 1991). This
result supports the finding that novices may need help focusing on important details in
the animation (Mayer, & Anderson, 1991).
We must be careful, however, to define what we mean by “effectiveness of
animation” in the context of these studies. Typically this implies that students who view
an animation along with reading text will do better on a post-test than students who view
text only or text with static images. However, Rieber found that although there was no
difference in scores on a post test, a group of adults who viewed animation answered the
questions in significantly less time, thus demonstrating that the animation did have an
effect on the learning process. Information about the time it takes subjects to answer a
post-test is called latency data, and this is believed to be as important for the
experimenter to measure as post-test scores (Rieber, 1994). Whether latency is actually a
valid measurement of “ learning” is perhaps open to debate.
41
Most animation research has been in the applications of presentation and practice.
Used as presentation, animation is often used to display lesson content, sometimes with
text and sometimes without text. However, animation used for practicing acquired skills
is often used in interactive simulations, also called interactive dynamics (Brown, 1983).
This application of animation offers visual feedback based on a user's input.
Results from still graphics also apply to animated graphics in general. But what
sets animation apart from static visuals? Animation displays something which changes
with time, usually the position and direction of an object. However, it could also pertain
to a change of color, for example, which involves neither a change in position nor a
change in direction. Therefore, a necessary component to establishing a need for
animation is that the illustrated phenomenon contains an attribute which changes with
time (Klein, 1987).
As a result, there are two prerequisites for animation to have any possible positive
effect on learning outcomes: (1) there must be a need for external visualization and (2)
learning of the described phenomenon must require an understanding of how an object
changes with time. Rieber makes the recommendation that “Animation should be
incorporated only when its attributes are congruent to the learning task.” That is, the
previous attributes should be satisfied. Yet, even if these attributes are satisfied, it does
not guarantee a positive effect of animation on learning. That’s why he calls them
necessary conditions and not sufficient conditions.
Rieber concludes his review of animation with the recommendation that
“Animations' greatest contributions to CBI may lie in interactive graphics applications.”
42
These applications typically use animation to provide feedback based on students’ input
and are often used as simulations and games. The instructional purpose of animation in
this context is practice (described in Section 2.3.2). Because the animation is so
intimately tied to interaction, animation vs. no animation is not typically studied. Instead
Reiber has studied design issues, behavioral vs. cognitive. In other words, the research
asks how animation should be used rather than if animation should be used.
Typically, practice strategies promote learning by prompting subjects to make
certain choices based on their preconceptions and then challenging them to evaluate the
result. In this way, practice strategies allow the subject to play what if games. The
animation is often used as the visual response cued to the subject's input. This approach
is also called “ learning by doing” by Brown (1983). Discovery-based learning
necessitates a reactive “ learning environment…that through the use of computation allow
students to try out hypotheses, see their entailments, analyze data, find counterexamples
to theories, and otherwise perform efficient and effective experiments.”
Perhaps much of the research in graphics, both animated and static, can be
summed up by the design principles of Rieber (1994). They are organized according to
purpose (see Section 2.3.2) and are listed in Table 2.3.

43
Table 2.3: Rieber’s recommendations for using graphics (Rieber, 1994).
General 1. There are times when pictures can aid learning, times when pictures do not aid learning but do no
harm, and times when pictures do not aid learning and are distractive. 2. Select the type of visual based on the needs of the learner content, and the nature of the task. 3. Graphics should not distract attention from the lesson goals of objectives. 4. Graphics should be designed carefully to serve their appropriate function. Cosmetic 5. Be extremely cautious in the use of cosmetic graphics in the design of instructional materials. 6. Make design decisions related to the use of cosmetic graphics early in the process and include
such graphics in the evaluation of the final materials. Motivational 7. Use graphics to increase motivation and interest, but be careful to avoid distraction effects. 8. Use graphics to present meaningful contexts for learning and to increase the intrinsic motivation
of the learner. Attention-Gaining 9. Graphics can be an effective attention-gaining device. 10. Attention is a highly selective and controllable process. 11. Attention is naturally drawn to what is novel or different. Presentation 12. Graphics should be congruent and relevant to the accompanying text or distraction may result. 13. Students should be cued to process the information contained in a graphic in some overt way. 14. Graphics are unnecessary when graphics the text produce mastery. Practice 15. Provide a meaningful learning context that supports intrinsically motivating and self-regulated
learning. 16. Establish a pattern where the learner goes from the known to the unknown. 17. Provide a balance between deductive and inductive learning. 18. Emphasize the usefulness of errors. 19. Anticipate and nurture incidental learning.

44
2.5 Verbal Protocols
A procedure fairly standard in the study of human thought processes as well as
problem solving in physics will be employed in this studynamely, verbal protocols.
Despite issues of internal validity which must be properly addressed, “nothing can match
the processing insights provided by a verbal protocol (Russo, Johnson, & Stephens,
1989).” There are three methods of verbal protocols: talk-aloud, think-aloud, and
retrospective. This review will focus on think-aloud protocols; however, much of it
pertains to the others as well.
2.5.1 Description
Ericsson and Simon (1993) identify two general types of verbalizationdirect
and encoded. Direct verbalization refers to the verbalization of information that is
reproduced exactly as it is heeded; that is, the verbalization of information that was stored
in LTM as a verbal representation. This type is also called Level 1 verbalization.
Encoded verbalization is the verbalization of information subsequent to one or more
intermediate processes which alter the heeded information. There are two types of
encoded verbalization: Level 2 and Level 3. Level 2 verbalization occurs when there is
an immediate recoding of information into a verbal form once it is heeded. For example,
information encoded in a visual form must be translated to a verbal form in order to be
verbalized.

45
Level 3 verbalization refers to two different intermediate processes. First, there
may be a scanning or filtering process used to distinguish between heeded information.
For example, a subject might be asked to report only concrete thoughts. This requires
that the subject set up an “If, then” procedure to first decide if a thought is concrete or
abstract before possibly reporting it. Second, there may be inference or generative
processes prior to verbalization. This occurs in a variety of situations where the subject is
asked to report on information not normally heeded when performing a certain task. For
instance, the subject may be asked to report motives or reasons for a certain behavior, to
report descriptions of typically automated tasks, or to report cognitive processes; none of
these things are naturally attended to.
Ericsson and Simon have developed a model for evaluating the validity of verbal
protocols which contains the following assumptions:
1. The verbalizable cognitions can be described as states that correspond to the contents of STM (the information in the focus of attention). 2. The information vocalized is a verbal encoding of the information of STM. 3. The verbalization processes are initiated as a thought is heeded. 4. The verbalization is a direct encoding of the heeded thought and reflects its structures. 5. Units of articulation will correspond to integrated cognitive structures. 6. Pauses and hesitations will be good predictors of shifts in processing of cognitive structures.

46
A review of thinking-aloud data gathering procedures is provided by Shapiro
(1994). A think-aloud (or talk aloud or retrospective) study has four components: task,
instructions, reporting, and analysis. Generally, the subject is given some task for which
he or she is to report his or her thoughts while performing the task. The data is then
encoded and analyzed according to its content. Each of the stages--task, instructions,
reporting, and analysis--is open to errors in validity. It is therefore important to follow
certain guidelines within these stages to help ensure a valid study.
2.5.2 Validity
Guidelines for ensuring valid data gathered from thinking aloud protocols are
provided by Ericsson and Simon (1993). The premise of their model is that subjects can
only accurately report information normally heeded in short-term memory (STM). This
corresponds to Level 1 and Level 2 verbalization, either information that is verbalized
directly from its verbal form or information that is immediately recoded into a verbal
form without other intervening processes.
This assumption has a number of repercussions. For Level 1 and Level 2
verbalizations, naturally occurring cognitive process are not altered by verbalization;
therefore, the sequence of heeded information is conservedthat is, information in STM
is not added or detracted by the verbalization. Verbal data obtained in this manner are
considered accurate reflections of the information heeded as a result of primary cognitive
processes used in the performance of the task. Level 3 verbalizations on the other hand

47
require attention to additional information not normally attended to and therefore alters
the cognitive process and thus the sequence of heeded information. For example, asking
“Why did you…” elicits inferences and not the actual cognitive processes. Verbal data
obtained in this manner are not valid representations of actual thought processes. A
similar phenomenon in physics is usually described as “the measurement interfering with
the process.”
If verbal data is indeed valid as predicted, it should satisfy three criteria:
relevance, consistency, and memory. Verbalization should be relevant to the task
performed, consistent with preceding and subsequent verbalization, and somewhat
remembered immediately following performance of the task.
2.5.2.1 Threats to Internal Validity—Task
Verbal data is not valid if the subject is asked to report on information not heeded
in STM. Therefore, if the task is automatic, such that responses are generated directly
from structures in LTM without passing through STM, the subject cannot accurately
report on the structures without inferences (this is Level 3 verbalization). A potential
problem posed by expert vs. novice studies which use verbal protocols is that performing
the problem solving task for experts may be automatic, thus negatively affecting the
validity of such a study.

48
2.5.2.2 Threats to Internal Validity—Instructions
Instructions given to the subjects can also result in invalid data. It is imperative
that investigators realize that subjects cannot report on cognitive processes themselves
but only on information stored in STM that results from those cognitive processes.
Instructions for the subject to filter certain thoughts or processes interfere with those
processes. It is thus best to instruct the subject to report every thought during a particular
task with no attention to whether the thought should or should not be reported.
In addition, validity can be affected by the presence of the investigator and
recording device, especially if the subject is distracted. It is best if the investigator and
recording device are out of view of the subject and do not interact with the subject during
performance of the task. Sometimes the subject will stop talking during periods of heavy
load on the STM. In this instance, the investigator may prompt the subject by saying,
“Keep talking,” but even this may be too intrusive. It is recommended (Russo, Johnson,
& Stephens, 1989; Ericsson, & Simon, 1993) to provide warm-up exercises before
administering the task. With practice, vocal prompts by the investigator may be
unnecessary.
2.5.2.3 Threats to Internal Validity—Reporting
Reporting may also negate the validity of the study. In general, reporting should
not impede the subject's ability to perform the task. This is possible as long as the subject
only reports on normally available verbal information. Valid concurrent reporting is not

49
considered to be highly intrusive to the actual cognitive processes; however, verbalization
may influence the time to complete the task as well as the accuracy in completing the
task. Although these are indications of invalidity, it is (Russo, Johnson, & Stephens,
1989) recommended that subjects sacrifice speed for completeness of the verbal report
and naturalness of the cognitive process, the most important being naturalness. Therefore
it is best to not use non-directive prompts such as “Keep talking.”
Another potential difficulty affecting the validity of the study occurs when the
subject verbalizes that which he or she thinks the investigator wants to hear. In this
instance, the subject is filtering the thought processes while verbalizing. As a result, the
verbalization is not a good indicator of the thought processes. To minimize this effect it
is imperative that there is no perceived reward for a certain response. Rather there is an
expectation for the verbalization to be as natural as possible.
2.5.2.4 Threats to Internal Validity—Analysis
Of central importance to valid interpretation of verbal protocols is that the analysis,
or encoding, of the protocol is as independent as possible from the bias of the encoder.
This is best achieved by considering the context surrounding a subject’s statement. For
example, consider that a subject solving a problem says, “I need to find the velocity.” By
considering the context surrounding the statement, we can determine if the subject is
articulating what the problem is asking for, or whether the subject is stating a subgoal
50
where the velocity is needed in order to calculate some other quantity that is the quantity
actually being solved for.
Properly determining the context is facilitated by formulating a task analysis before
encoding the subject’s verbalizations. In other words, a task analysis of the above
problem would perhaps consist of a problem solving approach (i.e. describing the
problem, planning the solution, carrying out the plan, and revisiting the problem). The
experimenter could even solve the problem ahead of time noting which physics principles
could be used or were needed to solve the problem. Then the verbalizations could be
encoded by which physics principle was invoked at a given time, thereby formulating a
sequence of physics principles used by the subject to solve the problem. In fact, this
approach was used by Simon and Simon (1978) to study the individual differences
between an expert problem solver and novice problem solver. Ericsson and Simon
(1993) call this encoding procedure aggregation by solution steps.
2.6 Web-based Assessment
The World Wide Web is impacting education in profound ways. So far, the
predominant use of the WWW in teaching has been for finding and distributing
information, much like an on-line library. However, as information technology evolves,
the Web is increasingly used for more interactive applications like testing. But as with
any technological development or media revolution, there is potential for both success
and failure. To use the WWW effectively for testing in physics education, we must

51
identify our goals and determine the best way to meet those goals. This section describes
methods of web-based testing, highlights the positive attributes of the WWW for testing,
and marks the dangers that threaten its effectiveness.
2.6.1 Methods
Testing primarily serves to motivate students to spend time on task. Students will
spend that time if it contributes both to their understanding (internal motivation) and to
their grade (external motivation). As a result, testing is used for two essential purposes:
to provide feedback and evaluation. Feedback refers to the response regarding a critical
analysis of students' work. Evaluation refers to the grading and recording of students'
work for the purpose of assessing their understanding of material. These two purposes
are not mutually exclusive. A testing instrument, whether it is a homework assignment,
quiz, exam, or practice test, can satisfy both purposes to a varying degree. For instance, a
practice test is primarily used to provide feedback to students for their self-evaluation.
On the other extreme, an exam is primarily used for evaluation.
Evaluation and feedback have different goals and thus have different
implementation requirements. Because evaluation is primarily used to record student
responses and assign grades, security concerns such as verifying a student's identity,
protecting answer keys, limiting access according to a specific time or location, and
preventing unauthorized sharing of information need to be considered. The second use,
feedback, is used to respond to students' input by providing "correct/incorrect'' responses,
52
hints, and solutions or by engaging the student in additional learning activities much like
present computerized tutorials. Feedback routines may even be intelligent, where the
computer learns the best response for a given input and automatically generates
appropriate feedback. Using results from misconceptions research, the computer could
be trained to diagnose misconceptions and subsequently generate feedback which targets
such misconceptions. In most cases feedback and evaluation are usually combined in
order to both calculate and record students' progress and provide expanded feedback
regarding students' answers.
2.6.2 Modes of Questions
Questions in web-based assessment are typically of four modes: multiple choice,
fill-in-the-blank, numerical response, and free-response (e.g. essay). Except for free-
response questions, all can be automatically graded. However, technology is not
necessarily limited to these modes. Questions may use Java applets, video, or image
maps to directly pass values to client or server grading routines (client refers to the
computer on which the web page is delivered and server refers to the computer on which
the web page originated). For example, in Figure 2.1 the coordinates of a mouse click on
an image map are recorded and evaluated. (In one sense, the image map presents discrete
multiple choices to the usereach individual pixel on the screen represents a choice.)
This section, however, will focus on multiple choice, fill-in-the-blank, numerical, and
free-response questions.

53
Figure 2.1: The coordinates of a student’s mouse click on this image map are evaluated either by the server or by the browser.
Figure 2.2 shows a multiple choice question that uses HTML radio buttons to
indicate a student's answer. This question makes use of the "exclusive'' nature of radio
buttons which disallows the student error of marking more than one answer. As shown in
Figure 2.3, HTML checkboxes may be used for questions with multiple correct answers.
Figure 2.2: HTM L radio buttons ensure that only one answer to a multiple-choice question can be entered.

54
Figure 2.3: Questions that have more than one correct answer are implemented with HTM L checkboxes.
Fill-in-the-blank (Figure 2.4) and numerical (Figure 2.5) questions are similar in
the way answers are submitted; however, they differ in the way answers are graded.
They both use an HTML text input field where the user types an answer. To grade a fill-
in-the-blank response, the grading script compares the input, character by character, to
the correct answer or a list of possible correct answers. Numerical responses on the other
hand are evaluated within a range or tolerance so that small rounding errors within the
user's calculation do not produce an incorrect answer. JavaScript can be used to control
the data type submitted and thus not allow text when only a number is expected (e.g., to
disallow entry of units where units are already specified).
Figure 2.4: Fill-in-the-blank questions are evaluated using a character-by-character comparison of the input text with the correct answer. Spaces and capitalization may be ignored if desired.

55
Figure 2.5: A numerical answer entered into the text-input field is judged correct if it falls within a given range, so that small rounding errors do not produce incorrect answers.
Free-response questions use an HTML textarea for students to submit responses.
Answers are typically written to a text file or database to be scored later by the instructor.
Figure 2.6 illustrates an essay question on the WWW.
Figure 2.6: Students’ answers to essay questions are entered into an HTM L textarea box and recorded on the server for later evaluation by the instructor.
2.6.3 Evaluating Questions
Responses can be scored in three ways, client-side, server-side, or a combination
of the two. Which method is best depends on the goal of the assessment. A summary of
techniques and recommended uses are listed in Table 2.4.

56
Table 2.4: Summary of methods of Web-based assessment.
Method Evaluation Exemplary Use
JavaScript Client-side Practice tests Interactive tutorials Front-end processing of responses
CGI and flat text files Server-side Small-scale assessment
CGI and relational database
Server-side Large-scale assessment
For client-side evaluation, questions and answers are downloaded to the client and
scoring is accomplished on the client's computer. Advantages of client-side evaluation
are decreased load on the server and immediate feedback. Because answers are
downloaded to the client, security questions inevitably arise. As a result, this method is
best for an interactive tutorial or practice test. Users' answers and grades can be uploaded
after the user has completed all questions, thereby using client-side scripting for scoring
students' input and providing feedback and server-side scripting for recording students'
grades.
Client-side assessment is accomplished with JavaScript, the scripting language
developed by Netscape. JavaScript code is contained in the source of the document and
therefore is downloaded with the Web page. Simplistic JavaScript code for scoring
questions in Figure 2.2, Figure 2.3, Figure 2.4, and Figure 2.5 are shown in Figure 2.7,
Figure 2.8, Figure 2.9, and Figure 2.10.

57
<FORM> Two car t s on a hor i zont al , f r i ct i onl ess t r ack make a head- on col l i s i on. A car t of mass 3M and vel oci t y 20 cm/ s t o t he r i ght col l i des el ast i cal l y wi t h a car t of mass 4M whi ch i s at r est . Af t er t he col l i s i on, t he car t of mass 3M <P> <DL> <DT> <DD><i nput t ype=" r adi o" onCl i ck=" al er t ( ' Cor r ect ' ) " > moves t o t he l ef t <DD><i nput t ype=" r adi o" onCl i ck=" al er t ( ' I ncor r ect ' ) " > moves t o t he r i ght <DD><i nput t ype=" r adi o" onCl i ck=" al er t ( ' I ncor r ect ' ) " > i s st at i onar y </ DL> </ f or m>
Figure 2.7: JavaScript code to score the question in Figure 2.2.

58
<FORM> A col l i s i on occur s bet ween t wo bodi es, m<sub>1</ sub>=100 kg and m<sub>2</ sub>=1 kg. Whi ch of t he f ol l owi ng ar e t r ue? <DL> <DT> <DD><i nput t ype=" checkbox" onCl i ck=" al er t ( ' I ncor r ect ' ) " > The magni t ude of t he f or ce of m<sub>1</ sub> on m<sub>2</ sub> i s gr eat er t han t he magni t ude of t he f or ce of m<sub>2</ sub> on m<sub>1</ sub> <DD> <i nput t ype=" checkbox" onCl i ck=" al er t ( ' Cor r ect ' ) " > The magni t ude of t he f or ce of m<sub>1</ sub> on m<sub>2</ sub> i s equal t o t he magni t ude of t he f or ce of m<sub>2</ sub> on m<sub>1</ sub> <DD> <i nput t ype=" checkbox" onCl i ck=" al er t ( ' I ncor r ect ' ) " > I f t he col l i s i on i s el ast i c, t he ki net i c ener gy of m<sub>1</ sub> <i >cannot </ i > change <DD> <i nput t ype=" checkbox" onCl i ck=" al er t ( ' I ncor r ect ' ) " > I f t he col l i s i on i s per f ect l y i nel ast i c, t he t ot al k i net i c ener gy i s conser ved <DD> <i nput t ype=" checkbox" onCl i ck=" al er t ( ' Cor r ect ' ) " > The vel oci t y of m<sub>1</ sub> af t er t he col l i s i on wi l l be si mi l ar t o what i t was bef or e t he col l i s i on <DD> <i nput t ype=" checkbox" onCl i ck=" al er t ( ' I ncor r ect ' ) " > I f m<sub>2</ sub> i s shat t er ed i nt o many pi eces due t o t he col l i s i on, moment um i s not be conser ved </ DL> </ f or m>
Figure 2.8: JavaScript code to score the multiple-choice question shown in Figure 2.3
<FORM name=f or mname> What t ype of ener gy i s conser ved i n an el ast i c col l i s i on? <i nput t ype=" t ext " name=qb onChange=" i f ( document . f or mname. qb. val ue. t oLower Case( ) ==' ki net i c ' ) { al er t (' Cor r ect ' ) ; } el se{ al er t ( ' I ncor r ect ' ) ; } " > </ FORM>
Figure 2.9: JavaScript code to score the fill-in-the-blank question in Figure 2.4

59
<FORM NAME=f or mname> Two car t s on a hor i zont al , f r i ct i onl ess t r ack make a head- on col l i s i on. A car t of mass 3M and vel oci t y 20 cm/ s t o t he r i ght col l i des wi t h a car t of mass M whi ch i s at r est . The car t s st i ck t oget her upon col l i s i on. Thei r vel oci t y af t er col l i s i on i s <i nput t ype=" t ext " name=" qn" si ze=5 onChange=" i f ( document . f or mname. qn. val ue >= ( 15- ( 0. 01* 15) ) && document . f or mname. qn. val ue <= ( 15+( 0. 01* 15) ) ) { al er t ( ' Cor r ect ' ) ; } el se{ al er t ( ' I ncor r ect ' ) ; } " > cm/ s </ f or m>
Figure 2.10: JavaScript code to score the numerical question in Figure 2.5.
Recording students' responses and scores requires a server-side script. The Web
browser passes responses to the server where they are processed by a script or compiled
program called a CGI (Common Gateway Interface). The CGI can score responses,
record desired information, and return feedback to the student; consequently, it can be
used for either evaluation, feedback, or a combination of the two.
Server-side scripts are often written in Perl, an interpreted language specifically
designed for text processing that is available on all major platforms. However, other
languages, such as C, C++, and Java, and platform dependent languages, such as
AppleScript and Frontier, can also be used. An example (written by Larry Martin in Perl)
may be downloaded at http://www.northpark.edu/~martin/WWWAssign/.
Server-side scripts often retrieve questions and record responses in flat text files;
however, for large enrollment courses, this can be cumbersome. Assigning multiple
assignments per week to many students generates large amounts of data. At NCSU, we
deliver and grade approximately 3,000 homework assignments per week. To store
efficiently a large number of questions, homework assignments, student responses, and
60
grades, and we interfaced a CGI script with an SQL (Structured Query Language)
database which acts as the backend, or data source. SQL is a database standard for
searching and managing information in relational databases (Whetzel, 1996) and is thus a
simple yet powerful tool for large-scale, Web-based assessment.
One advantage of using a database backend is that questions can be stored and
retrieved by keyword, subject area, author, and other fields, thus allowing quick
generation of assignments. In addition, all assignments, grade reports, and database
queries are dynamically generated; that is, no text files are used. Therefore, multiple
professors and courses can use the same assessment application without worrying about
file structure, non-unique filenames, etc. Based on our experience, it seems to be the best
solution for department-wide or institution-wide use.
Regardless of the method one uses, the computer (either server or client) can
easily handle random selection of questions and numbering of problems, as well as
randomization of question content when appropriate. For instance, given a suitable
range, WWWAssign (Martin, & Titus, 1997), our web-based assignment system, will
generate random numbers within a question and then calculate the answer based on those
numbers (see Figure 2.11). Other functions randomly select an item from a list or select
the corresponding item from a different list as shown in Figure 2.12.

61
(a) Two car t s on a hor i zont al , f r i ct i onl ess t r ack make a head- on col l i s i on. A car t of mass <eqn $m1=r andnum( 1, 5, 1) >M and vel oci t y <eqn $v1=r andnum( 10, 30, 10) > cm/ s t o t he r i ght col l i des and st i cks t o a car t of mass <eqn $m2=r andnum( 1, 5, 1) >M whi ch i s i ni t i al l y at r est . Af t er t he col l i s i on, t he vel oci t y of t he car t s i s Ans. <eqn $v=$m1* $v1/ ( $m1+$m2) > cm/ s (b)Two car t s on a hor i zont al , f r i ct i onl ess t r ack make a head- on col l i s i on. A car t of mass 2M and vel oci t y 30 cm/ s t o t he r i ght col l i des and st i cks t o a car t of mass 4M whi ch i s i ni t i al l y at r est . Af t er t he col l i s i on, t he vel oci t y of t he car t s i s Ans. 10 cm/ s
Figure 2.11: In (a) is the code which generates the question shown in (b). The <eqn> tag is interpreted by WWWAssign which evaluates the randnum function and returns the result. The answer is calculated based on the numbers generated in the question.
(a) Two car t s on a hor i zont al , f r i ct i onl ess t r ack make a head- on col l i s i on. A car t of mass <eqn pi ckone( " 2" , " 4" ) >M and vel oci t y 10 cm/ s t o t he r i ght col l i des el ast i cal l y wi t h a car t whi ch i s i ni t i al l y at r est . Af t er t he col l i s i on, t he f i r st car t t r avel s <eqn pi cksame( " t o t he l ef t " , " t o t he r i ght " ) > at 5 cm/ s and t he second car t t r avel s t o t he r i ght at 2 cm/ s. What i s t he mass of t he second car t ? Ans. <eqn pi cksame( " 15" , " 10" ) > kg (b) Two car t s on a hor i zont al , f r i ct i onl ess t r ack make a head- on col l i s i on. A car t of mass 2M and vel oci t y 10 cm/ s t o t he r i ght col l i des el ast i cal l y wi t h a car t whi ch i s i ni t i al l y at r est . Af t er t he col l i s i on, t he f i r st car t t r avel s t o t he l ef t at 5 cm/ s and t he second car t t r avel s t o t he r i ght at 2 cm/ s. What i s t he mass of t he second car t ? Ans. 15 kg
Figure 2.12: In (a) is the code which generates the question shown in (b). The <eqn> tag is interpreted by WWWAssign which evaluates the pickone and picksame functions and returns the result. The answer is also specified with the picksame function.
62
2.6.4 Strengths of Web-based Assessment
Web-based assessment offers both pedagogical and administrative advantages
over conventional methods. Immediate feedback and increased time on task coupled
with decreased grading time make Web-based assessment a valuable teaching tool.
Pedagogical improvements. The traditional method of teachinggiving a
standard lecture, requiring weekly or biweekly homework consisting of a few end-of-
chapter problems, and then testing students with a few exams per semesterhas
developed out of the available pedagogic media. The new medium of the internet offers a
tool for teaching which makes additional teaching strategies possible. Using automated
submission and scoring of assignments, instructors can give students more frequent
assignments and more questions on each assignment than is possible with traditional
methods, thus increasing the time that students spend studying material, answering
questions, and solving problems. In fact, the computer can control the path through the
assignment if desired, making the better prepared student's progress more efficient while
choosing a more gradual approach for the less able student. Customized hints based on a
student's response can target known misconceptions. In this way, the content of feedback
becomes just as important as the content of questions.
In addition, the traditional method of collecting homework on a weekly basis (or
longer) can now be done daily or after every class. This motivates students to study
continuously throughout the week rather than procrastinating until homework is due.
63
Homework is a tremendous motivator for students, and providing assessment on a
frequent basis keeps students more focused on material presented in class.
A study by Edward Thomas (1995) reports a correlation between repeated
execution of "skills'' problems and student performance on traditional physics word
problems presented on class exams. The group of students benefiting most by the
"Precision Teaching'' method were those who daily accessed questions by computer. The
computer graded their answers and measured completion time. Using Web-based
assessment, similar questioning techniques can easily be administered to a large number
of students. Even when assignments are more for self-evaluation and practice than for
formal testing, records can be made of time on task and correlated with success in the
course. Reports of this information to future students can make using the Web-based
assignments more palatable.
Web-based assessment may also impact the lecture itself. Student responses can
be used during class discussion or recitation for peer-reviewing. Students can then re-
evaluate their own answers and strengthen their knowledge before a final evaluation is
made by an instructor or grading assistant. Larry Martin (1997) has used a technique of
averaging multiple peer-evaluations of a set of student writings to derive an evaluative
score.
Decreased administrative effort. Increasing students' time on task and continually
administering homework is made possible by automated grading. The server takes over
the mundane grading of papers which is often the obstacle to assigning more frequent
homework or quizzes. It saves grading time for the instructor (or hired graders) and

64
improves the quality of class time spent in problem solving recitations. Automated
scoring also allows the instructor to easily perform item analysis to determine which
questions are the best predictors of student performance. Instructors can then tailor their
assignments, whether homework, quizzes, or exams, to include questions that are best for
probing student understanding.
Multimedia-enhanced questions. The Web's capabilities allow questions that
include video, animation, simulation, or audio. But merely adding multimedia to
traditional problems is not necessarily the best use of technology as is discussed in
Section 3.2. Multimedia-enhanced questions should be written differently than
traditional questions in order to take advantage of the new medium. Unlike traditional
questions, a multimedia-enhanced question does not have to use solely text and static
graphics to describe the situation. Rather, it can use motion and sound to illustrate
pertinent information. Students can even be encouraged to make measurements directly
from the multimedia, thus making the assessment a more engaging process. This type of
problem where data necessary to solve the problem are embedded in the multimedia is
more appropriately called a multimedia-focused problem as is discussed in greater detail
in Section 3.3.
At NCSU, multimedia-focused problems have been developed using Physlets,
single-purpose scriptable Java applets, written by Wolfgang Christian
(http://WebPhysics.davidson.edu/). Physlets can be embedded directly into HTML
documents and can interact with the user by employing JavaScript. One example,
Animator, displays an object (or multiple objects) according to an equation of motion
65
[x(t), y(t)]. It includes control buttons to play, pause, or step through the animation and
allows the student to measure the position of any point at any time. Physlets are
discussed in greater detail in Section 2.7.
Immediate feedback. With computer-aided assessment, students can receive
immediate feedback about their progress. Interactive tutorials and practice questions
engage students to test their understanding. At present, students may practice solving
textbook problems and look up answers in the back of the book, yet receive no insight
into why they miss a question. But on the Web, students can answer questions, gain
insight into their errors, and be immediately propelled into curricular material that
stresses important points. Surveys given to students indicate that immediate feedback is
one of the most appreciated aspects of web-based assessment. For this reason, it is
valuable to deliver assignments with immediate feedback and assignments with delayed
feedback. The former type encourages students to thoughtfully consider why they missed
certain questions and the latter ensures that students fully consider their answers before
submitting. The combination of these two types of assignments seem to enforce in
students' minds the value of doing homework. In fact, this was done in Experiment 1 of
this study.

66
2.6.5 Drawbacks of Web-based Assessment
Web-based assessment is not a panacea. Unfortunately, some advocates of
technology lack an adequate understanding of its drawbacks. Therefore, it is vital to
recognize the limitations of technology and to address them appropriately.
Inability to see students work. When grading, it is useful for physics instructors to
view students' work, check their diagrams, and follow their reasoning. Unfortunately this
is not currently possible on the WWW. As grading becomes automated, the instructor
may lose some insight into the problem solving processes of students. This may be the
largest deterrent to Web-based assessment when used for evaluation. However, for large-
enrollment classes where exams are automatically scored and homework is graded by
undergraduate or graduate students, this aspect already occurs.
Using a sampling technique, proper problem solving technique can still be
encouraged without overloading graders. Students can be required to submit their
answers on the WWW and hand in their work on paper. The instructor can randomly
select one problem and grade it based on method of solution. The overall assignment
grade is then determined by the number correct on the web-based part and the method of
solution on one selected question. Thus, students will be motivated to use good problem
solving procedures, yet benefit from the advantages on-line assessment provides.
Meanwhile, the instructor's time grading papers is decreased.
Technocentric approach to courseware development. A significant concern in the
advent of such a powerful communication medium is that instructors and developers will
exhibit a technocentric approach to instructional design, thus making decisions based on

67
the capability of technology, not the needs of the learner (Rieber, 1994). It is the
responsibility of researchers to help determine how the WWW should be used for
assessment, and it's the responsibility of instructors to use the WWW in appropriate
ways. Decisions to use the WWW for assessment must be based on proper learning
objectives and not on technology.
Undetermined effectiveness. The WWW's popularity in education for information
delivery, interactive simulations, and assessment has grown; however, little research has
been devoted to learning how to use the technology effectively. Researchers should
design studies to discover the most effective methods to achieve our pedagogical goals.
Instructors must have an open mind and be willing to adjust preferences and ideas as they
discover what does or does not work with on-line assessment.
Less variety of questions and grading methods. Automating the grading process
eliminates certain types of questioning and grading. However, there are new types of
questions that can be delivered on-line that cannot be delivered on a piece of paper.
Security issues. If the WWW is used for evaluation, security issues inevitably
arise. How can the instructor be assured that a student is doing his or her own work? In
the case of homework, the grade may not be heavily weighted, students are often
expected to work together, and password verification may be enough to deter less-
motivated cheaters. As a result, security concerns are not so great. And there can be
benefits from encouraging students to collaborate.
For exams or quizzes, security is a vital issue since these elements often count for
a large part of a course grade. In this case, there are sufficient ways of insuring security.

68
One such way is to use randomization. Numbers within questions or the order of choices
in multiple choice questions can be randomized. In addition, techniques from traditional
assessment methods in distance education, such as requiring proctors to oversee exams,
could similarly be applied to Web-based assessment. Hopefully, the electronic form of
the answers may make detecting instances of possible cheating an easier task and thus
dissuade students from making the attempt.
Another method of security is to restrict access to questions based on the user's IP
address, in which case, students must take quizzes or exams from a certain computer lab,
building, or campus. The lab can be monitored, printing can be disabled, and a proctor
can check student ID cards upon entry. Students' pictures can even be displayed in the
header on the exam so that a proctor can easily identify cheaters. Security in Web-based
assessment may not be perfect, yet may be better than what is currently used.
Technological difficulties. When using the WWW for assessment, instructors
must realize that technical problems will occur. For instance, the server may be down or
server software may need to be updated. Perhaps the instructor wants to use browser
specific features or platform dependent plugins which all students are not able to install
or access properly. There will always be some technical difficulties. Instructors must
plan to handle these difficulties, and it must be clear to students what they should do in
the inevitable event of a technical problem. Typically it is sufficient to extend the
assignment deadline for individual students who have such trouble.
Beyond technical problems, some students just do not have computer experience
and may be anxious about using computers. Fortunately, the Web offers an intuitive

69
interface so that less experienced users can quickly learn to navigate hypertext and
submit HTML forms.
Students also need access to the internet. At this time, it is unreasonable to
assume that every student owns a computer and has internet access from home.
Therefore, a school should have computer labs where students can access the internet on
a regular basis.
Presentation difficulties. Although the WWW is improving in its graphic design
capabilities, it is not easy to represent mathematical equations, and symbols within text;
therefore, they are usually presented as images where each one is created individually and
saved in an image format. This is not only a time consuming development process, but
since each image is downloaded separately, it results in additional strain on the server.
Users with slow modem connections are negatively affected. Therefore, it is best to
format equations using HTML tags as much as possible. As an example, one can use
subscript and superscript tags for writing equations. Similarly, Greek letters are written
using the <FONT> HTML tag with the parameter f ace=symbol . Also server side Java
applets can interpret equations on the fly and generate images of the equations as the
page is served to the client. All of this may be useless, however, with the emerging
MathML (Mathematical Markup Language) standard which will not only allow the
rendering of mathematical content on the Web but will allow one to cut and paste
MathML into a mathematics program such as Mathematica for subsequent processing.
Students' Perception. Although assessment on the Web offers new opportunities
to engage students in learning experiences, students may perceive it as minimizing

70
human interaction and ultimately replacing the teacher (Bothun, & Kevan, 1996). This is
certainly not the goal; nonetheless, some students resist using instructional technology.
Instructors must build the trust of students with effective uses of assessment. Then
students may come to see the time spent answering questions on the Web as useful for
learning. With the increasing use of the WWW in our culture, it is likely that students
will become very comfortable with Web-based tools in education.
2.6.6 Passing the test
Educational potential for Web-based assessment is almost unbounded.
Unfortunately, it is both potentially wonderful and potentially disastrous for students,
instructors, and courseware developers. We must discover effective uses of the WWW
for assessment and use it accordingly. To do so, we should use the appropriate
technology for the assessment task, be it evaluation or feedback. Simple client-side
feedback is efficiently accomplished using JavaScript, whereas server-side evaluation and
feedback is done with CGIs. For evaluation of large-enrollment classes, a database
backend supplies the power required to manage the large amount of data.
Understanding the technology is not enough. We must understand the benefits of
the technology, as well as its limitations. Web-based assessment can be effectively used
for providing unbiased evaluation and feedback on a frequent basis that is immediate,
platform independent, multimedia-enhanced, and automated. But new technology brings
new concerns. Initial instructional development may be technocentric, with technological

71
capabilities, not learning needs, driving the process. Finally, if we are to depend on
technology, we must be prepared when the technology fails. Recognizing these dangers
is the first step toward utilizing the positive aspects of technology-assisted education and
the appropriate technological methods necessary to achieve effective assessment in
physics education.
2.7 Physlets
Animations used in Experiment 2 were accomplished using a Physlet called
Animator written by Wolfgang Christian (Christian & Titus, 1998). Animator is a Java
applet which is scriptable using JavaScript. One creates an animation by using JavaScript
to define objects and their equations of motion. In this way, Animator can be used to
create literally an infinite number of animations.
For example, consider the animation shown in Figure 7.10 which illustrates the
motion of a puck sliding on ice which encounters a resistive force such that it slows down
uniformly and finally stops. The JavaScript and HTML code required to define this
animation is shown in Figure 2.13.
This particular problem can be thought to have four essential components. The first
component is the JavaScript function which defines the animation. In the example above,
it is the function pr ob9021. The second component is everything within the
<appl et > tag. Within this part are the code and codebase parameters which identifies
where the Java class files are found, the name of the applet which is needed when writing

72
JavaScript method calls, and the <param> tags which call some public methods of the
applet and are often used to set certain “flags” or conditions of certain variables. The
third component is the set of HTML buttons which use JavaScript to control the
appletthey operate the animation much like VCR control buttons operate a VCR.
These buttons allow the user to stop, step, rewind, and play the animation. The final
component is the problem statement itself. It is imperative that the problem statement
contains a hyperlink such as St ar t Ani mat i on that calls the JavaScript function
which defines the animation.

73
<scr i pt l anguage=" JavaScr i pt " > f unct i on pr ob9021( ) { document . Ani mat or 9021. set Def aul t ( ) ; document . Ani mat or 9021. set ShapeCoor d( 3) ; document . Ani mat or 9021. set Pi xPer Uni t ( 10) ; document . Ani mat or 9021. shi f t Pi xOr i gi n( -
125, 0) document . Ani mat or 9021. set Gr i dUni t ( 1) ; document . Ani mat or 9021. set ShapeRGB(
255, 0, 0) ; document . Ani mat or 9021. addCi r cl e( 20, "
( 8* t * st ep( 1. 5- t ) ) + ( st ep( 3. 5- t ) * st ep( t - 1. 5) * ( 12+8* ( t - 1. 5) - 2* ( t - 1. 5) * ( t - 1. 5) ) ) +st ep( t - 3. 5) * ( 20) " , " 0" ) ;
document . Ani mat or 9021. f or war d( ) ; } </ scr i pt > <appl et code=" ani mat or . Ani mat or . cl ass" codebase=" ht t p: / / wwwassi gn. physi cs. ncsu.
edu/ appl et s/ Cl asses118" al i gn=" basel i ne" wi dt h=" 300" hei ght =" 150" i d=" Ani mat or 9021" name=" Ani mat or 9021" > <par am name=" FPS" val ue=" 20" > <par am name=" dt " val ue=" 0. 02" > <par am name=" showCont r ol s" val ue=" f al se" > </ appl et ><br > <i nput t ype=" but t on" val ue=" pl ay" oncl i ck=" document . Ani mat or 9021. f or war d( ) > <i nput t ype=" but t on" val ue=" pause" oncl i ck=" document . Ani mat or 9021. pause( ) " > <i nput t ype=" but t on" val ue=" &l t ; &l t ; st ep" oncl i ck=" document . Ani mat or 9021. st epBack( ) " > <i nput t ype=" but t on" val ue=" st ep> ; > ; " oncl i ck=" document . Ani mat or 9021. st epFor war d( ) " > <i nput t ype=" but t on" val ue=" r eset " oncl i ck=" document . Ani mat or 9021. r eset ( 0) " > <p><a hr ef =" JavaScr i pt : pr ob9021( ) " >St ar t Ani mat i on</ a>( <b>Cl i ck</ b> <a hr ef =" / appl et s/ Ani mat or / Ani mat or I nst . ht ml " ><b>her e</ b></ a><b> f or hel p usi ng t he ani mat i on. </ b>) </ p><p> A <f ont col or =" #DD0000" >0. 5</ f ont > kg puck ( shown i n t he ani mat i on wi t h t i me i n seconds and posi t i on i n met er s) s l i des on i ce at const ant speed f or 1. 5 seconds wher e i t t hen encount er s a r ough sur f ace. What i s t he wor k done by f r i ct i on i n st oppi ng t he puck?
Figure 2.13: JavaScript and HTM L code for the question shown in Figure 7.10.

74
3 Exper iments

75
3.1 Pilot Study
During the five-week first summer session in 1995 at NCSU, Web-based practice
quizzes were administered to students in their first semester of the two-semester Physics
for Engineers and Scientists sequence. The pilot study was purely descriptive in that we
were not attempting to determine variables influencing student learning, but rather we
desired to refine the quizzing system, elucidate student attitudes toward using the Web
for instructional activities, and illuminate areas of Web-based instruction for further
investigation. Our objectives were accomplished by utilizing pre-instruction and post-
instruction surveys and observing how often students took the quizzes. Any results or
conclusions are not generalizable to larger student populations for a variety of reasons
including small class size, possible instructor bias, grading system, student demographics,
and the fast pace of instruction. However, we are able to identify these areas for further
investigation: (1) student willingness to take graded and voluntary quizzes and (2)
potential benefits for women and minorities.
The described engineering physics class consisted initially of 23 students. At the
end of the semester 21 students remained. Of these students 6 (28%) were women, 6
(28%) were minorities–African American, Asian, and Hispanic. As is commonly the
case during summer physics classes, some students were not full-time students at NCSU,
and some were retaking the course, having taken it at NCSU in a previous semester. In
addition many students worked at least 10 hours a week while simultaneously enrolled
for a full load of classes. The fast pace of the 5-week semester combined with their

76
overtaxed work and school schedule made a busy session for most students, certainly a
faster pace than they are accustomed to during the semester.
Twenty five students, some of whom later dropped the class, responded to our
initial survey. The survey targeted three areas: accessibility to the World Wide Web
(WWW), experience with the WWW, and willingness to use the WWW for instructional
purposes. The survey is shown in Appendix 1.
All students had access to computers on campus, whether in university computer
labs or the Physics Courseware Instructional Center's Interactive Classroom. 16 of the 25
respondents had computers at home and 12 of them had 9600 bps or faster modems.
Presumably all of these students could potentially connect to the Web from home with
the appropriate software. However, of the 20 students who indicated that they had used
the Web, only seven accessed it from home. The majority (67%) accessed it from the
university's computers.
80% (20 students) of the respondents had used the WWW before taking the class,
and of them 15 students accessed it more than 1 hour per week. Therefore, 60% of the
class had significant experience. They mostly used the WWW for entertainment (27%)
while only 16% used it for class information and assignments. The latter number would
probably increase if they were asked this question in a later school year.
The students appeared to be open to using the WWW for instruction. All 25
respondents indicated that they used old exams as a study tool, and 24 of them said that
they would sometimes or always access practice questions on the Web if they were
available. In addition, they would in general like to see the Web used for more

77
interactive purposes beyond merely distributing information. However, if it came down
to the choice between a traditional quiz in class and a computerized quiz (presumably on
the WWW), the class was split with 56% siding with traditional quizzes and 44% with
computerized quizzes. This led us to believe that perhaps they were not so willing to use
the WWW for quizzes and/or homework on the whole, so we probed this further in the
post-instruction survey.
Because of students dropping out or not coming to the last day of class, only 17
students responded to the final survey. This differential in respondents makes it difficult
to make exact comparisons to responses in the initial survey, although general
comparisons can possibly be made. The post-instruction survey again probed their
willingness to use the WWW for instructional purposes with an attempt to illustrate how
their attitudes may have changed over the course of the session. In addition, we sought
details about what they liked and disliked about the quizzes.
This time only 82% of the students said that they used old exams as study tools.
We did not expect the response distribution on this question to change over the course of
the semester as it did. The difference between the 100% affirmative response from the
initial survey can be explained by the possibility that students misread the question as
"Did you use old exams as a study tool?" However, the fact that this number was large
(80%) was consistent with the initial survey. Also consistent with the first survey,
students were split on their preference between traditional (47%) and computerized
quizzes (53%). Differences between these percentages and those on the initial survey
may seem to indicate that students are more willing to take computerized quizzes after

78
the pilot study. However, the small number of respondents and the fact that some
dropped out makes a conclusion insubstantial.
The initial survey led us to believe that students desire more interactive Web-
based activities. We decided to probe this further by asking them to rank their
preferences for various items on a 5 point scale from 0 (no desire for the item) to 4
(strong desire for the item). The results were rather illuminating. In general, the class
desired those items that were optional, that is homework solutions, practice quizzes,
practice tests, interactive tutorials, educational games, class bulletin board, email help,
and textbook materials. The graded exercises such as homework problems, quizzes, and
tests were not desired as much. These preferences were consistent with their response on
the question, "Should Web-based quizzes and tests be voluntary or required as part of the
course assignments?" 80% (12 out of 15) chose voluntary.
It's important to note that their responses were not out of dissatisfaction. In fact, 86% of
the students gave the quizzes a "good" or "excellent" score, and 100% recommended that
we continue to develop the system for future students.
To repeat our objectives, we desired to: (1) refine the quizzing system (2)
elucidate student attitudes toward using the Web for instructional activities and (3)
illuminate areas of Web-based instruction for further investigation.
The experience helped us realize that the quizzing system needed a few
fundamental additions and adjustments. First, the questions in the question bank needed
a sophisticated organizational system. The bank may conceivably contain thousands of
questions and they need to be efficiently searched when specific questions are desired. It

79
has been decided that the questions should be organized by area, topic, and subtopic.
Second, after using the web-based assignment system to create assignments, I found that
creating a quiz or exam using the questions from the question bank needed to be done
using one Web submission form. This eliminates the need for searches and inserts from
multiple pages, quite a time-consuming and potentially confusing process. As a result of
the experience, a new question organizational system and exam creation script have been
created.
Students were found to have positive attitudes toward using the Web for practice
questions, especially as a study tool for exams. However, they are not necessarily willing
to make the adjustment to a "virtual classroom" where they do homework, quizzes, and
exams electronically. When using Web-based physics activities, they would rather have
voluntary, tutorial type tasks as opposed to graded assignments. This, however, was
observed for a small class. It would be appropriate to do a similar study of students in
large lecture classes to see how their preference on this issue is different before making a
strong conclusion.
One unexpected outcome of the study was the number of women and minorities
in the class who utilized the quizzes compared to the number of Caucasian men. Women
made up 28% of the class and minorities (one of which was female) made up 33% of the
class. Of the 6 women, 3 took at least 50% of the quizzes. Of the 6 minorities, 4 took at
least 50% of the quizzes. Comparing these numbers to the respective numbers of the
Caucasian men of which 3 (out of 10) took at least 50% of the quizzes, suggests that
women and minorities may be more willing to use voluntary Web-based quizzes and thus

80
could reap more benefit. This was an unexpected outcome and offers an area deserving
of more research.
When the project began, the student enrollment had not been solidified; therefore,
students did not register with their student ID number to take the quizzes. Instead they
emailed the instructor after taking each quiz. This was how their participation was
measured for the first 3 quizzes. An unforeseeable outcome of this method was that
students emailed questions about problems they missed on the quizzes; often questions
were conceptual in nature. When we incorporated the on-line registration so that their
work was recorded in the database according to each student’s ID number, they no longer
had to email the instructor. As a result, their questions by email decreased. Shortly
thereafter, we implemented a web-based bulletin board system where they could post
questions and respond to questions by others. This system was rarely used, probably
because it was implemented in the middle of the course. In addition, students had their
questions answered daily in class and probably did not need questions answered via the
Web. However, with a course meeting fewer times per week, a bulletin board system
may be used more by students, as long as they find it worth the time investment. It would
be worth assessing the types of questions students ask and students' potential increase in
conceptual understanding. On the final survey, they did indicate a desire for email help
through the Physics Tutorial Center, thus indicating their openness to discussion of
physics principles via email.
In final analysis, the project was considered a success by both the students and the
investigators involved. Students found the quizzes helpful and enjoyable as evidenced in

81
written comments on the final survey, and investigators gained insights into necessary
final improvements on the quizzing system and student attitudes toward using the Web
for assignments and assessment.
3.2 Experiment 1: Integrating video with problem solving
3.2.1 Introduction
A crucial step in solving physics problems is to redescribe the question in pictorial
and conceptual representations (Reif, & Heller, 1982). However, students often have
difficulty with this, especially visualizing a question translating the words of the
question to a dynamic picture of the motion. It is conceivable that including video which
shows the evolution of a situation over time could help students visualize a problem and
thus help them successfully solve it. To understand this issue, it is necessary to develop a
theoretical framework which will help us make predictions, then findings from research
can be compared to what is predicted. Finally, the theory can be reexamined in light of
experimental conclusions and modified accordingly.
Effectiveness of video presented with physics problems is measured for our purposes
by comparing the proportion of correct responses on video-enhanced homework
problems submitted by students who view video to those submitted by students who view
static images on an otherwise identical problem. But effectiveness, measured in this way,
is not a discrete quantity; that is, video may not always be effective nor always

82
ineffective in problem solving. Rather, effectiveness is a continuous function of the
physics problem, video, and student. The effectiveness of video, as measured by a one-
tailed t-test between a control group and experimental group, may be thought of as a
spectrum. A one-tailed t-test is employed in this study because we are testing a
directional hypothesis, i.e. the treatment group will outperform the control group.
Consider the graphic in Figure 3.1 to show how we will interpret the t-test. On one
end of the spectrum is the limit of total ineffectiveness and on the other end is the limit of
total effectiveness. For any given problem, video, and student in an experiment, the
effectiveness of video may lie somewhere on that spectrum.
Figure 3.1: Effectiveness spectrum illustrating the continuous nature of the study and the predicted boundaries of t in a test of significance for proportion differences in two binomially distr ibuted groups.
Total effectiveness is defined as the limit as t approaches infinity in the positive
direction. This could result from having 100% correct responses from students who view
video and no correct responses from students who view static images. The set of t-scores
t.05 < t < infinity represents the “effective region” . If a t-score falls in this region, we can
conclude with at least 95% confidence that the greater proportion of correct responses
Total Ineffectiveness Total Effectiveness
t � – infinity t � infinity t.05 (0.05 level of significance)
t=0

83
from the treatment group is due to the presence of the video. Total ineffectiveness is
defined as the limit as t approaches infinity in the negative direction. A negative t-score
in this model signifies that the control group performed better than the treatment group;
that is, the video had a negative impact on the proportion of students in the treatment
group who correctly answered the question. In other words, video was detrimental to
students in the treatment group. Another possibility is that t is equal to zero, or at least
very near to zero. This signifies that the treatment group and control group scored
identically on the problem; that is, video made absolutely no difference on the proportion
of students who answered the question correctly. The region of t < 1.645 (t.05 for a one-
tailed test) is the “not effective region” . It is named this because a t-score in this region
means that we must accept the null hypothesis (see Section 1.4). A number of factors
may cause a t-score to lie in this region. For instance, if the video is not well-designed, if
the content of the problem does not pertain to a moving object, or if solving the problem
does not require external visualization, that is if the problem solver can sufficiently
visualize without an external aid, video will be ineffective. These are significant factors
on the effectiveness of animation presented with text (see Section 2.4.1) and are believed
to apply to video in this context. It is necessary to examine each of these factors in detail.
Whether video is well designed is somewhat defined by the validity of the video--
does it show what it is intended to show? For video to be effective as a presentation tool,
it must not contain too much or too little detail. If it contains too much detail, it may
distract the student from the purpose of the problem. In fact, research on the influence of
static images presented with text has shown that if images contain too much detail, the

84
student may resort to looking at the pictures and not reading the text, perhaps thinking
that the images will provide sufficient detail to understand the material (Dwyer, 1978). If
the video contains too little detail, the student may need additional information. In
addition, the video may play too slowly, thus appearing “clunky.” In this case, it is not
only distracting, but what the student perceives may be entirely different than what the
author intends to show. If it plays too quickly, the students may miss important
information. If the content of the problem does not pertain to a moving (or changing)
object, video will provide no enhancement to the problem (except in special cases such as
a video which shows a 3-D pictures from varying perspectives for example). The sole
purpose of providing video in this dissertation is to illustrate how an object's
characteristicsposition, direction, and physical appearance (such as color and
shape)change in time. Adding a video to a problem which does not require the student
to consider how something is moving or changing in time is superfluous and will not
likely make a difference in how a student solves the problem. In this context, the video
may add cosmetic and perhaps even motivational appeal, but will not likely have a large
positive effect. If it has any positive effect at all, it would probably be due to novelty and
not be of long-term significance. In addition, there is a chance that it could have a
negative effect if it is distracting.
The context of the problem must also require external visualization. If the
problem can easily be solved by an algorithmic approach, a method commonly employed
by novice problem solvers, added visualization through the use of video offers no

85
improvement on their ability to obtain the correct answer. To have a positive effect,
video must influence how a novice problem solver approaches the problem.
For expert problem solvers, including a video with a physics problem would
likely provide no significant effect on their ability to obtain the correct answer. Expert
problem solvers who already have the ability to translate the text of a problem into a
pictorial representation receive no benefit of having it done for them in a video. On the
other hand, novice problem solvers who could benefit from the added visualization, may
not notice relevant details contained in the video or may even perceive the motion in the
video differently based on prior conceptions. If for example a video contains a ball that
is tossed straight up into the air, a novice who believes that the ball accelerates upward as
it travels upward may not notice that the velocity of the ball is constantly decreasing as it
travels upward. Or they may see its velocity decreasing but still think the acceleration is
upward, in the direction of motion. Therefore, the student will utilize the same
conceptions when solving the problem, thus solving the problem regardless of the
information contained in the video. If the video addresses their prior conceptions in an
intentional way or if the student's difficulty lies in visualization as opposed to unscientific
conceptions, then presentation of video can potentially be effective.
Individual differences, however, make it difficult to distinctly classify problem
solvers as “experts” or “novices” . In any one group, expert or novice, is a large number
of people who vary greatly in their problem solving abilities even though they may all be
characterized as either “expert” or “novice” . In fact, no student is exactly like another in
his or her ability to solve problems. For any given problem, there are those who will

86
solve it correctly by applying scientific concepts, and those who will solve it incorrectly
because of misconceptions, visualization difficulty, mathematical difficulty, or even
careless errors. For example, graduate students may be considered expert problem
solvers, yet on a given problem, some may have tremendous difficulty and may not
approach it using and “expert-like” approach, whereas others may solve the problem with
ease and with an “expert-like” approach. As a result, we can imagine that the problem
itself, its difficulty and targeted concepts, also influences whether video is shown to be
effective.
On one extreme, an advanced problem where video may be shown to be effective
with upper level physics majors is probably so difficult for first year students that video
would be ineffective for them. On the other hand, an extremely easy problem, a “plug-
and-chug” problem for example, could be so easy that video would not influence the
number of correct responses. On the opposite end of the “effectiveness spectrum” is the
limit of total effectiveness. In the context of this research study, this would be indicated
by 100% correct responses from students who view video and no correct responses from
students who view static images. This can theoretically be achieved if the video gives
away the answer, and the problem cannot be solved without viewing the video. This
limit can be approached if the video contains noticeable information that directly leads to
the correct answer, although probably not all students would notice the information that
presumably gives away the answer. For example, a problem dealing with a collision
between two carts on a track may have an associated video which shows the collision.
Depending on other information given in the problem, what is asked for, and whether
87
they can eliminate other possible answers as in a multiple choice question, some students
could merely observe the relative speeds of the carts in the video and get the correct
answer.
Since the factors which inhibit the effectiveness of video presented with physics
problems greatly outnumber and outweigh the factors that would establish its
effectiveness, the “ line of demarcation,” that theoretical line which would mark
effectiveness, t.05 in Figure 3.1, may not be easy to achieve. However, it is desirable for
certain factors to be identified which would notably facilitate the effectiveness of video
for assessment. Certain factors which are necessary but not sufficient to make animation
effective as presentation with text are believed to also apply to video in the context of
assessment. But what are the additional sufficient factors which would guarantee
effectiveness? To ascertain these factors is extremely difficult in light of the confounding
nature of variability in problems, video, and students. However, insight has been
obtained in this study.
3.2.2 Research Design
To investigate the influence of video on students’ success at solving traditional
physics problems, students' responses to video-enhanced homework problems and a
subsequent post-treatment survey were analyzed. A randomized posttest-only control
group design was utilized. Students were given three separate assignments covering
topics in relative motion, collisions, and oscillations. The treatment group received
video-enhanced problems, and the control group received similar questions with static

88
images. Proportions of correct responses were calculated for each question on the three
assignments. Differences in proportions of correct responses for the two groups were
tested for significance using a one-tailed t-test. It was determined if the null
hypothesisthat the two groups score identically on the two types of problems or that the
group receiving video does worse than the control groupcould be rejected (see Section
1.4).
3.2.3 Sample
Two sections of Physics for Engineers and Scientists I at NCSU were selected to
participate in the study. Designed as an overview of physical principles in classical
mechanics, the course covered broad topics in kinematics and dynamics at an
introductory level. It represented what is believed to be a typical course that could be
taught at any college or university that utilizes large-enrollment lectures. Students in the
study were physical science and engineering students.
Lectures were taught by two different instructors; however, they covered identical
topics, used identical textbooks, and administered identical exams throughout the
semester. One section met for 50 minutes 3 times per week (Monday, Wednesday, and
Friday), and the other section met for 75 minutes 2 times per week (Tuesday and
Thursday).
The enrollment in the two sections was virtually identical at the beginning of the
semester with 100 students in each section. There was some attrition with some students
adding the class and some students dropping the class throughout the semester.

89
Students from both sections were randomly assigned to two groups: the treatment
group which received video-enhanced problems and the control group which received
similar problems that included static images in place of video. As a result, students from
both sections were represented in the two groups with an equal probability of being in
one group or the other; therefore, it is expected that the two groups were demographically
similar and instructor effects were minimized.
3.2.4 Instrumentation
For the purposes of this study, three homework assignments were specially
created for probing the influence of video on students' success at solving problems. The
three assignments covered topics of relative motion, collisions, and oscillations and were
administered on days corresponding to the material being taught in class. The three
assignments are shown in Appendix 2.
To gather qualitative data, a survey was given to students at the end of the
semester in an effort to understand why the video was or was not effective when
presented with traditional problems as determined by the analysis of the assignments..
The purpose of the survey was two-fold: to determine how many students viewed the
video when it was provided with a question and to elicit comments on the effect of video
(as perceived by students) when presented with a question. The survey questions are
shown in Figure 3.2.

90
When video was presented with a question, did you view the video? Yes No If so, did you find it useful? Yes No Why or Why not? Please describe in detail two homework questions that were assigned this semester. 1. 2.
Figure 3.2: Survey questions used in Experiment 1.
3.2.5 Procedural Details
Students were given homework each class day throughout the semester with
instructions that they must submit their responses before 12AM of their next class day.
To facilitate administration of homework, a Web-based homework system was developed
which automatically scored multiple-choice problems, recorded students' responses and
scores, and returned feedback to the student. Students were required to do the
homework; however, their grade was dependent on their completing it, not their number
of correct answers. As a result, students had motivation to complete the homework but
not receive answers from other students. In addition, it was found in an earlier pilot study
(see Section 1.1) that students appreciate immediate feedback for incorrect answers.
91
The homework assignments usually consisted of 3 or 4 multiple choice problems
and were distributed on the Web. To submit responses, students accessed the homework
with a Web browser, indicated their choices for the correct answers by clicking next to
the a, b, c, d, or e which corresponded to their choice on a particular question, and finally
clicked on a “submit” button which transferred their responses to the Web server for
scoring. Students were allowed to submit homework from any location and at any time
before the specified due date. Since students in both groups were registered for different
sections, they submitted their homework on different days although usually during the
same week.
3.2.6 External Validity
The major threats to the validity of the study are attitudinal effects, data collector
bias, and differences in group characteristics.
To account for possible attitudinal effects, the treatment and control groups were
transposed for the collisions assignment such that the treatment group on the first and
third assignments became the control group on the second assignment. As a result, all
students participated in the treatment group for at least one assignment. This was done to
correct for a possible Hawthorne effect, since some students could have felt
underprivileged if they did not receive video-enhanced homework.
Data collector bias was most influential in the creation of video since the video
could have inadvertently given away the answer, thus presenting an unfair advantage to
the treatment group. This was diminished by having a panel of professors and graduate

92
students review the video-enhanced questions for appropriate content. Instructions for
their review are shown inFigure 3.3. Questions and video were then revised based on
their suggestions. For example, one reviewer noted that the correct answer could be
deduced by observing the motion of the objects in the video and eliminating choices in
the multiple choice question. As a result, the distractors in the multiple choice question
were changed such that the correct answer could not be deduced without performing the
correct calculations.
Please evaluate the following question(s) on these criteria:
• Context requires external visualization.
• Animation is relevant to the text of the question (i.e. it does not have too much or too little
detail).
• Question content includes an object that changes in time or direction.
Figure 3.3: Review criteria given to experts who reviewed questions used for the treatment.
Finally, it was verified that the two groups were sufficiently similar to ensure
valid experimental results. Since students were randomly assigned to two groups, it was
expected that the two groups would perform similarly on identical problems. In other
words, the null hypothesis is that the two groups are statistically similar (i.e. that there is
no significant difference between the proportion of correct responses for the two groups
on identical questions). To test whether we should reject or accept the null hypothesis,
we can perform a two-tailed t-test for binomial distributions. A two-tailed t-test if chosen

93
since the hypothesis, that there is a significant difference between the two groups on
identical questions, is not directional. The proportion of correct responses on 23 identical
problems was calculated for both groups, and a t-score was calculated for each problem
according to Eq. 3.2. Data is shown in Table 3.1. The t-score is considered to be
normally distributed; therefore, for a 2-tailed t-test, there is a 5% chance of finding a t-
score greater than 1.96, our criterion for significance, that is due to random fluctuations
and not due to a difference between the groups.
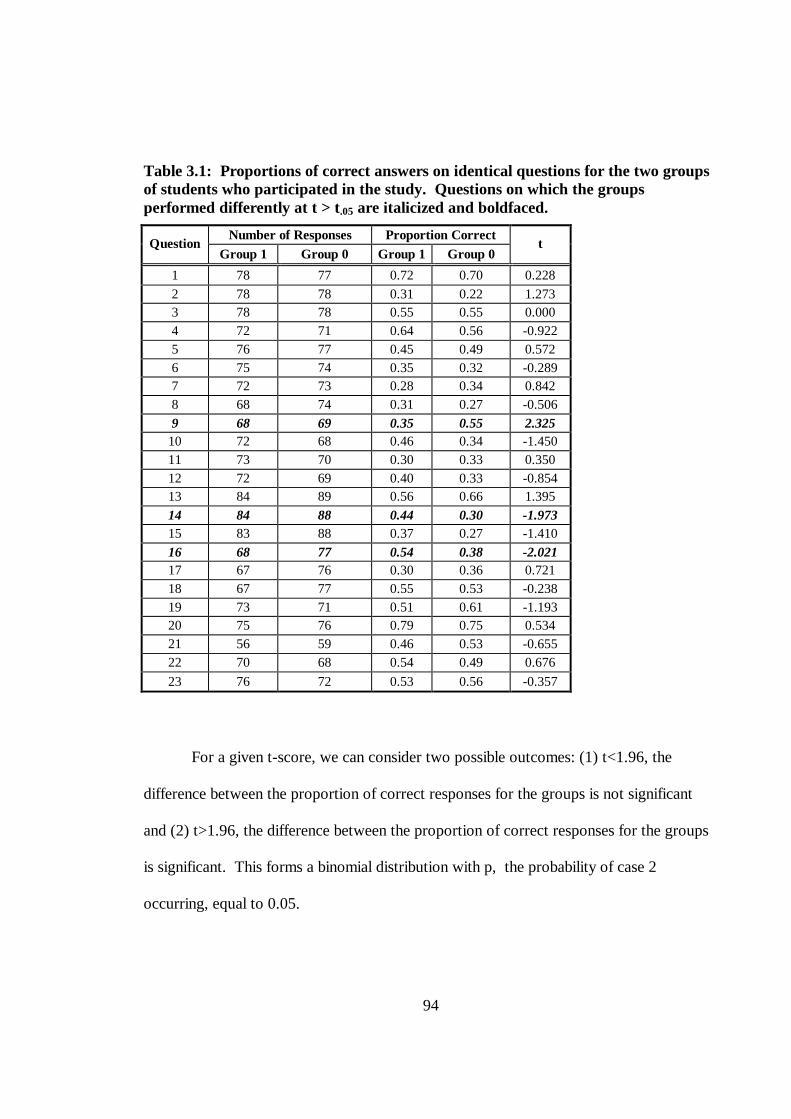
94
Table 3.1: Proportions of correct answers on identical questions for the two groups of students who participated in the study. Questions on which the groups performed differently at t > t .05 are italicized and boldfaced.
Number of Responses Propor tion Cor rect Question
Group 1 Group 0 Group 1 Group 0 t
1 78 77 0.72 0.70 0.228
2 78 78 0.31 0.22 1.273 3 78 78 0.55 0.55 0.000 4 72 71 0.64 0.56 -0.922 5 76 77 0.45 0.49 0.572 6 75 74 0.35 0.32 -0.289 7 72 73 0.28 0.34 0.842 8 68 74 0.31 0.27 -0.506
9 68 69 0.35 0.55 2.325 10 72 68 0.46 0.34 -1.450 11 73 70 0.30 0.33 0.350 12 72 69 0.40 0.33 -0.854 13 84 89 0.56 0.66 1.395
14 84 88 0.44 0.30 -1.973 15 83 88 0.37 0.27 -1.410
16 68 77 0.54 0.38 -2.021 17 67 76 0.30 0.36 0.721 18 67 77 0.55 0.53 -0.238 19 73 71 0.51 0.61 -1.193 20 75 76 0.79 0.75 0.534 21 56 59 0.46 0.53 -0.655 22 70 68 0.54 0.49 0.676
23 76 72 0.53 0.56 -0.357
For a given t-score, we can consider two possible outcomes: (1) t<1.96, the
difference between the proportion of correct responses for the groups is not significant
and (2) t>1.96, the difference between the proportion of correct responses for the groups
is significant. This forms a binomial distribution with p, the probability of case 2
occurring, equal to 0.05.

95
On three of the 23 questions, there was found to be a significant difference in the
performance of the two groups (|t| > t.05 is the criterion). Can this be attributed to random
fluctuations (thus giving us reason to accept the null hypothesis), or must we reject the
null hypothesis and conclude that our groups are statistically different? This is answered
by considering the probability of finding 3 or more occurrences of |t| > t.05. If this value
is less than 0.05, we should reject the null hypothesis. If this value is greater than 0.05,
we should accept the null hypothesis. The larger that this value is, the more confident we
are of accepting the null hypothesis. The probability of finding 3 or more occurrences of
|t| > t.05 is given by
p xi
p pi i
i
( )≥ = −������ − −
=�3 1
231
23
1
3
� � (3.1)
Substituting p=0.05 gives
p x( ) .≥ =3 025
Therefore, we can reasonably conclude that our groups were indeed similar.
External validity was most affected by the fact that some students in the treatment
group did not actually view the video. This is the equivalent of patients in medical
research not taking prescribed medication. Although we desired to embed the video so
that the text of a question and its corresponding video were simultaneously viewable, this
was not possible on a UNIX workstation, the platform most used by our students.
Therefore, to view a corresponding video, students had to click on a hypertext link to the
video which opened and played the video in a separate application. It was thus possible

96
for students in the treatment group to view a question yet not view the corresponding
video.
We had no way to quantify how many students viewed the video nor determine
which students viewed the video. As a result, we asked students on the end-of-semester
survey whether or not they viewed the video when it was available. 71% reported that
they viewed the video and 29% reported that they did not view the video when it was
available. Since roughly 1/3 of the students who were in the treatment group did not see
an image or a video when solving a problem, then any significant difference between the
treatment group and control group indicates that the treatment must have had a large
impact, whereas if there is no significant difference between the treatment group and
control group, we cannot make any conclusions about the effect of the treatment.
3.2.7 Data Analysis
The three assignments were treated as three separate experiments; however, they
were similarly analyzed in each case. Students were given a score of 0 for an incorrect
answer and 1 for a correct answer. The proportion of correct answers on each problem
was computed for each group, and the difference in proportions for the two groups was
tested for significance.
There are two possible outcomes for a student's answer: correct or incorrect.
Therefore, the two groups are considered binomial populations. As a result, the number
of correct answers for each group should follow a binomial distribution. To test for
significance, a t-score is calculated. The t-score is given by
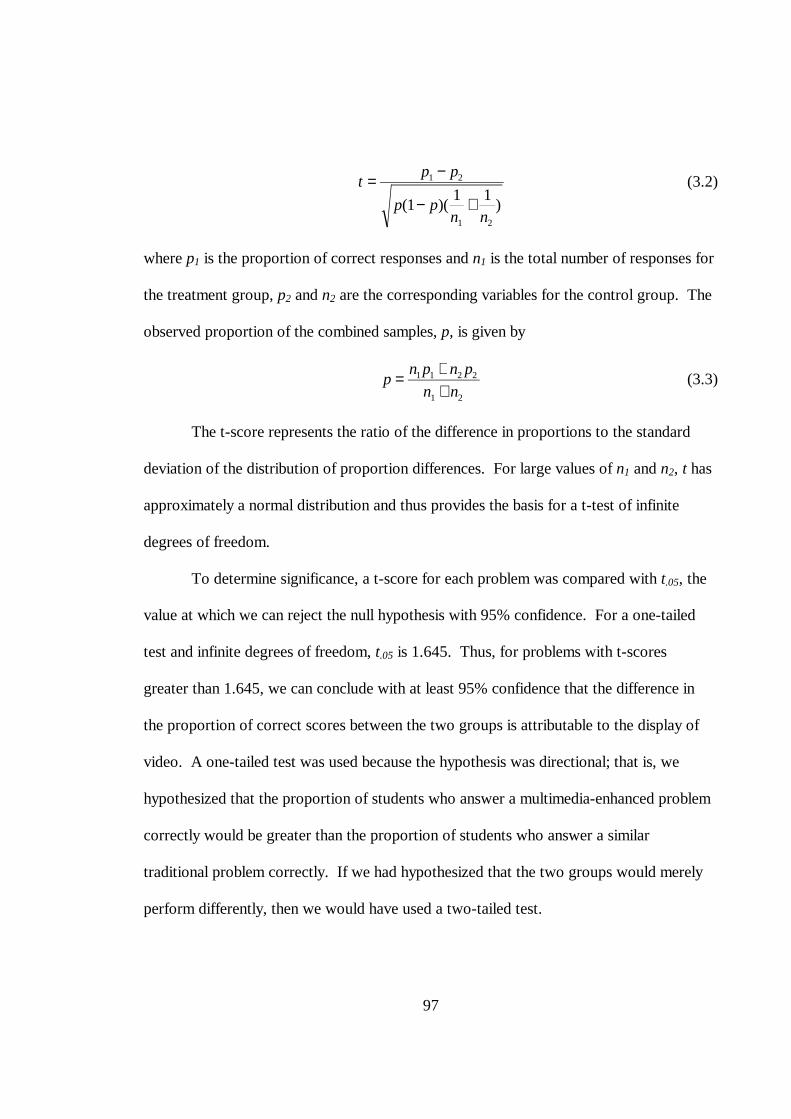
97
tp p
p pn n
= −
− +
1 2
1 2
11 1
( )( )
(3.2)
where p1 is the proportion of correct responses and n1 is the total number of responses for
the treatment group, p2 and n2 are the corresponding variables for the control group. The
observed proportion of the combined samples, p, is given by
pn p n p
n n= +
+1 1 2 2
1 2
(3.3)
The t-score represents the ratio of the difference in proportions to the standard
deviation of the distribution of proportion differences. For large values of n1 and n2, t has
approximately a normal distribution and thus provides the basis for a t-test of infinite
degrees of freedom.
To determine significance, a t-score for each problem was compared with t.05, the
value at which we can reject the null hypothesis with 95% confidence. For a one-tailed
test and infinite degrees of freedom, t.05 is 1.645. Thus, for problems with t-scores
greater than 1.645, we can conclude with at least 95% confidence that the difference in
the proportion of correct scores between the two groups is attributable to the display of
video. A one-tailed test was used because the hypothesis was directional; that is, we
hypothesized that the proportion of students who answer a multimedia-enhanced problem
correctly would be greater than the proportion of students who answer a similar
traditional problem correctly. If we had hypothesized that the two groups would merely
perform differently, then we would have used a two-tailed test.

98
To analyze the first two survey questions in Figure 3.2, I calculated the frequency
of responses for both choices, “Yes” and “No”. To analyze the third survey question in
Figure 3.2, I first read the responses and developed several general categories which
seemed to encompass all responses. I coded each response according to the categories in
Table 3.2. After a few days had elapsed, I coded the responses again. I noted which
responses I had coded differently and resolved them by modifying my categories. The
last question on the survey was not analyzed. Sixty-four students responded to the
survey.

99
Table 3.2: Analysis of the third question on the survey in Figure 3.1.
Code Descr iption Number of responses
Percentage of Total Responses (% )
1 Helped visualize question; made question easier to interpret
33 52
2 Helped me remember or understand concepts
9 14
3 Helped because I'm a visual learner; I like visual aids 4 6
4 Should have been used more often 1 2
-1 Took too long to download; too much time to solve problems
6 9
-2 Video was not necessary to solve the problem
10 16
-3 Video was not clear 3 5
-4 Technological problems; could not play video
2 3
-5 I'm not a visual learner 1 2 -6 Videos were not good 1 2
-7 Made problem more difficult or seem more difficult
1 2
p Positive; video was helpful 45 70
n Negative; video was not helpful 20 31
u Uncategorizable; unclear 1 2
3.2.8 Findings
A summary of the results are shown in Table 3.3 and in Figure 3.4. Of the seven
homework questions, three were found to have t-scores greater than 1.645. On both
problems on the collisions assignment and on one problem on the oscillations
assignment, the proportion of correct answers in the treatment group was significantly

100
greater than the proportion of correct answers in the control group. Therefore, the video
likely enhanced students' success at solving these particular problems.
Table 3.3: t-scores calculated for seven video-enhanced problems on topics of relative motion, collisions, and oscillations. Questions on which t > t .05 are italicized and boldfaced.
Number of Responses Propor tion Cor rect Assignment [Question Number ] Treatment Control Treatment Control
t
Relative Motion [1] 71 70 0.35 0.34 0.115
Relative Motion [2] 69 68 0.57 0.54 0.248
Collisions [1] 78 74 0.65 0.50 1.920 Collisions [2] 74 73 0.43 0.30 1.648
Oscillations [1] 54 58 0.39 0.40 -0.083 Oscillations [2] 54 57 0.50 0.47 0.363
Oscillations [3] 52 57 0.62 0.46 1.664
For the other problems on relative motion and oscillations, there was no
significant difference between the proportion of correct answers for the two groups.
Because some students in the treatment group did not view the video as described in
Section 3.2.6, we cannot conclude whether or not the video on these problems enhanced
students' success at solving these problems. Despite these results, 71% of students
reported on the first survey question that video was useful. When asked why, most
responded that video helped them visualize or interpret the question, or remember or
understand physical concepts. Students' responses and how they were categorized are
shown in Appendix 3. Responses to the second part of the first question which were
consistent with the notion what “video was helpful” (i.e. categories 1,2,3, and 4) were
categorized as “positive” (category p). 70% of students’ responses were categorized as
“positive” . This is consistent with the fact that 71% of students responded that video was

101
helpful for visualization in the first part of the question and gives credibility to the coding
of the survey.
Figure 3.4: Proportions of correct responses for the treatment and control groups on video-enhanced questions.
3.2.9 Summary and Conclusions
It was predicted that the proportion of students who obtained the correct answer on
traditional problems would be greater for students who view video than students who
view a static image. However, it was believed that a combination of factors could limit
the effectiveness of the video, and that the success of video to improve students' success
at solving problems would depend on the student, problem, and video. The results of the
study were: (1) Video did not always help students solve a problem, and (2) Video was
Proportion Correct vs. Question
0.000.100.200.300.400.500.600.70
RM [1] RM [2] COLL[1]
COLL[2]
OSC[1]
OSC[2]
OSC[3]
Question
Pro
po
rtio
n C
orr
ect
Treatment
Control
Significantly Different

102
found to be effective on students' ability to correctly solve a problem in the specific case
of two problems pertaining to elastic and inelastic collisions and one problem on an
oscillating mass on a spring.
The video-enhanced problems were designed based on these conditions: the video
was well-designed, the problem pertained to a moving object, and the context of the
problem required external visualization. These were believed to be necessary but not
necessarily sufficient conditions for the effectiveness of video on students' success at
problem-solving. To some degree these were not sufficient to ensure the effectiveness of
video in this context although the fact that some students in the treatment group did not
view the video (see Section 3.2.6) limits the validity of a more substantial conclusion.
Other factors may have contributed to the effectiveness of video in the specific
collisions problems that were used. First, the problems incorporated definitions of
perfectly inelastic and elastic collisions which must be understood in order to solve the
problem. Seeing the video may have helped the treatment group better correlate the
definition with the motion in the collision and, therefore, apply the appropriate concepts
to the solution of the problem. This possibility is supported by a comment that was made
on the survey. The survey question asked if the video was helpful--why or why not
(Figure 3.2)? One student answered, “Well, for me it helped with the elastic and inelastic
collisions. Because I kept mixing them up.”
A second factor that could have contributed to its effectiveness is that the video may
have helped students translate the text of the question into an adequate description of the
problem. This was indicated by several comments made on the survey that were all

103
similar to this student's comment that said, “The video helped me understand what
exactly the problem was saying.” If this is the case, students may have had more
difficulty understanding the text of the problem for the collisions problems than with
other problems. That is, students could sufficiently understand and visualize the other
problems without seeing a video.
Even though video was not generally a sufficient condition for helping students solve
the problems, many students felt that video helped their visualization (see categories
1,2,3, and 4 in Appendix 3). It is possible that video indeed helped students visualize
problems although it did not necessarily help them correctly solve the problems. The
presence of video could have made a problem seem more realistic, more understandable,
more visualizable, yet not directly challenge how a student developed a solution.
Therefore, the student still took a classic novice approach toward the solution. Since we
know that misconceptions are tightly held, it is plausible that problem solving strategies
are also tightly held, and that the presence of video merely for presentation of the textual
representation of a problem is not generally enough to overcome a student's problem
solving strategy even though it improves their visualization and clarification of a
problem.
The implications for this research on CBI are clear. Video used for presentation with
traditional physics problems may possibly, but not necessarily, help students solve those
problems. It is likely that including video with physics problems helps students visualize
the problem; however, merely improving their visualization of a problem is probably not
sufficient in many types of problems. Greater consideration should be given to students'

104
problem solving practices and how to design video-enhanced problems which will
challenge novice problem solving approaches and encourage more expert-like strategies.
It can be argued that there is really nothing wrong with our theory, nor the criteria
believed to be necessary conditions for video to be effective in the context of problem
solving. But rather, the seven questions used in this study didn’ t meet the criteria. Since
many students in the treatment group attempted the problems without even watching the
video, it can be argued that the criterion that the context of the problem requires external
visualization was never truly met. It may desirable then to create a type of question that
meets this criterionobserving the video is absolutely necessary to solving the problem.
That is, without watching the video, the subject has no measurable chance of getting the
question correct. A type of question which satisfies this criterion is one where the
problem solver must take data from the video in order to solve the problem. We have
called this type of question a multimedia-focused problem (see Section 1.3) and have
investigated it in more detail in Sections 3.3 and 3.4.
3.3 Experiment 2: Using animation in multimedia-focused problems
One aspect of multimedia-enhanced problems is that multimedia (or video in the
case of Experiment 1) may be useful for helping a student visualize a problem but is not
required to solve the problem. Thus a novice who is accustomed to using so-called weak
methods to solve problems may not take advantage of the enhanced visualization offered
by multimedia. For example, a student may still use a means-ends approach regardless of

105
the presence of a video. In this case the video (and visualization in particular) is not
necessary to solve the problem; this is one of the critical points for effectiveness of
animation in prose learning (Rieber, 1994) and is likely critical for the effectiveness of
multimedia in problem solving (see Section 3.2.9).
It is therefore desirable to make a more intimate connection between multimedia
and problem solving so that viewing the multimedia is required to solve the problem.
This has two advantages: (1) the video or animation, and thus visualization, becomes
necessary to solve the problem, and (2) students may be challenged to adopt a more
expert-like approach which is evidenced by a concept-first strategy. By concept-first, I
refer to the process of describing a problem conceptually before analyzing it
mathematically (see Section 2.2).
A type of problem that we've developed to fulfill this goal is a multimedia-focused
problem where data necessary for solving a problem is embedded in multimedia. One
definitive difference between multimedia-focused and multimedia-enhanced problems is
the purpose of the multimedia (see Section 2.3). In multimedia-focused problems,
multimedia is primarily used for practiceconsidered by Rieber (1994) to be the best use
of multimediawhereas in multimedia-enhanced problems, multimedia is predominantly
used for presentation. This is evidenced by the fact that in multimedia-focused problems
students must use the multimedia to collect necessary data to solve a problem, often
interacting with the multimedia by stopping it, playing it, stepping through the motion,
and measuring positions and times. This is not true in multimedia-enhanced problems.

106
As a result of this greater interaction, it is expected that students will perform more
poorly on multimedia-focused problems than on traditional problems since the novice
approach is likely insufficient for solving multimedia-focused problems. In multimedia-
focused problems, numbers are not given in the text of the question to “guide” students
into what equation to use. To correctly solve a multimedia-focused problem, students
must determine how to solve the problem and what variables are needed to solve the
problem before making any calculations.
It should not be surprising that students do more poorly on multimedia-focused
problems. Schoenfeld (1985, p. 13) when studying the problem solving approaches of
exceptional students in mathematics says:
In most testing situations students are asked to work problems similar to those they have been trained to solve. As a result, the context keeps them in the right arena, even when they are unable to solve the problems. The problems I asked students to solve were certainly within their capability and were often technically easier than problems they solved in other classes. They were not, however, put forth in a context that oriented the students toward the “appropriate” solution methods. Time and time again the students working such nonstandard problems would go off on wild goose chases that, uncurtailed, guaranteed their failure. The issue for students is often not how efficiently they will use the relevant resources potentially at their disposal. It is whether they will allow themselves access to those resources at all.
Likewise, students may have great difficulty solving multimedia-focused
problems, not because the problems are conceptually challenging, but merely because
they are different. Students accustomed to solving traditional problems simply may not
apply the same resources to multimedia-focused problems.

107
3.3.1 Research Design
To investigate students' success at solving multimedia-focused problems
compared to traditional problems, students' responses to multimedia-focused homework
problems and to a subsequent post-treatment survey were analyzed. A randomized
posttest-only control group design was utilized. Students were given separate
assignments covering topics of work, energy, collisions, rotation, rolling, and oscillations
throughout the semester as each topic was covered. These topics were chosen merely
because they are the topics covered during the last half of the semester in our first
semester introductory physics course for engineering. The treatment group received
multimedia-focused problems; the control group received similar questions with no
animation and with numbers given in the text of the question, otherwise called traditional
problems (see Section 1.3). Proportions of correct responses were calculated for each
question on the assignments. Differences in proportions of correct responses for the two
groups were tested for significance. It was determined if the null hypothesis--that the
treatment group does as well as or better than the control group--could be rejected (see
Section 1.4).
3.3.2 Sample
Students in five sections of Physics for Engineers and Scientists I at NCSU
participated in the study as part of their homework requirement. Designed as an
overview of physical principles in classical mechanics, it covered broad topics in
108
kinematics and dynamics at an introductory level. The course represented what is
believed to be a typical course that could be taught at any college or university that
utilizes large-enrollment lectures. Students in the study were typically physical science
and engineering students. Lectures were taught by 4 different instructors; however, they
covered identical topics, used identical textbooks, and administered identical exams
throughout the semester. One section was a Web-based course which did not meet in the
typical lecture format, rather students accessed course material via the Web. Most
sections had an initial enrollment of about 100 students; however, the Web-based course
had less than 10 students. Lectures were conducted Mondays, Wednesdays, and Fridays.
Students from all sections were randomly assigned to one of two groups, each
student having equal probability of being assigned to either group. It is therefore likely
that the groups were statistically similar.
3.3.3 Instrumentation
Assignments administered to the treatment and control groups are shown in
Appendix 4.
To gain perspective on why students did more poorly on multimedia-focused
problems than on traditional problems, a survey was also administered (see Appendix 5).
Questions 1 and 4 are of particular interest. Question 1 helps us investigate our initial
hypothesis, namely that students have difficulty with multimedia-focused problems
because they must analyze them qualitatively before quantitatively, an approach foreign

109
to most novice problem solvers. We don't expect this to be the sole explanation of why
students found multimedia-focused problems more difficult, but we do expect that it is
among the more significant factors.
It is possible that using multimedia-focused problems to challenge novice
problem solving strategies helps students adopt more expert-like approaches if combined
with instruction in proper problem solving strategies. Although this conjecture deserves
further investigation and is not completely answered by this study, question 4 on the
survey provides some indication of whether this conjecture can be supported. Since most
students in this study were not taught an explicit problem solving strategy and since
multimedia-focused problems were not used as part of an overall effort to teach problem
solving skills, it was not expected in this instance that using multimedia-focused
problems would have a significant impact on students' success at problem solving in
general.
Questions 2 and 3 on the survey were used to see if significant bias occurred in
the development of the multimedia-focused problems in this study. If a large number of
students report that multimedia-focused problems were not clearly worded or that the
animation in multimedia-focused problems was not a good visual depiction of the
question, then ambiguity in the question and animation is likely to be the most significant
cause of poor student performance on the multimedia-focused problems. It must be
realized, however, that novices may perceive their lack of direction in a multimedia-
focused problem to be a result of a poorly worded question rather than their dependence
upon novice problem solving strategies.

110
Question 5 was used to determine volunteers for the interviews of Experiment 3
described in Section 3.4.
3.3.4 Procedural Detail
The described assignments and survey were part of the required homework for
students in PY205. A homework assignment was posted each class day and was due on
or before the next class day. Homework was delivered, collected, and scored with
WWWAssign (Martin, & Titus, 1997). Homework mostly consisted of problems from
the 5th edition of Fundamentals of Physics (Halliday, Resnick, & Walker 1997). For each
chapter, an assignment consisting of multimedia-focused problems for the treatment
group and corresponding traditional problems for the control group was posted in
addition to the regular assignments. This typically occurred once per week with
occasional variations. These assignments were also due before the following class day.
The survey was administered at the end of the semester.
3.3.5 External Validity
The major threats to the validity of the study are attitudinal effects, data collector
bias, and differences in group characteristics.
To account for possible attitudinal effects, the treatment and control groups were
transposed after each assignment, e.g. the treatment group on the first assignment became

111
the control group on the second assignment, and so forth for each assignment. As a
result, all students participated in the treatment group and the control group. This was
done to correct for a possible Hawthorne effect, since some students could have felt that
they were at a disadvantage if they did or did not receive animations. Since students
generally found multimedia-focused problems more difficult and preferred traditional
problems, this design consideration was crucial.
Data collector bias was most influential in the creation of the animations and
questions for the study since the animation could have inadvertently given away the
answer thus presenting an unfair advantage to the treatment group, or the animation could
have unintentionally been made more difficult thus presenting an unfair advantage for the
control group. This was diminished by having Dr. Larry Martin and Dr. Robert Beichner
review the multimedia-focused problems for appropriate content and correctness.
Questions and animations were then revised based on their suggestions. Survey
questions 2 and 3 were used to check that multimedia-focused problems were not
obviously more difficult due to question and animation ambiguity. Responses to question
1b were also used to investigate any sources of bias. The proportions of responses on
these questions do not indicate obvious bias in the questions and animations (See
Appendix 6). Although it was found that some students had technical difficulty using the
Java applet (which provided the animation) and even getting the applet to load, we
provided a help page describing how to use the applet and provided directions in
configuring the browser. We did not intend for ignorance to play a significant factor in

112
the difficulty level of multimedia-focused problems even though some students reported
(question 1b) that the instructions were not clear.
Bias could have also tainted the coding of free-response questions from the
survey. As one check, we can verify some consistency between students’ responses to 1a
and their responses to 1b. In other words, if a student reports that multimedia-focused
problems are somewhat or usually more difficult than traditional problems (question 1a),
then the student’s response to “why” in question 1b should be consistent with the notion
that multimedia-focused problems are more difficult than traditional problems. Based on
this assumption, we can categorize responses which indicate that multimedia-focused
problems are not more difficult than traditional problems as “positive,” calculate the
proportion of students who gave a response in this category, and compare this proportion
to the proportion of students who responded that multimedia-focused problems are rarely
or never more difficult than traditional problems in question 1a. If the proportions are
similar, it is likely that the coding was valid on this one issue.
Bias could have affected validity in another way. Early on, students had to make
measurements of the position of objects in an animation in order to solve a problem. It
was possible that a student did not get the right answer solely due to measurement error.
For example, an uncertainty of just one pixel in a measurement could have been enough
to cause the final answer to not be within the grading tolerance of 2%. As a result,
students may have known how to do a problem and could have made the appropriate
measurements, yet may not have obtained the right answer due to experimental error.
This scenario seriously jeopardized any interpretation of the difference between the

113
proportion of correct responses for the treatment and control groups. To account for this
possibility, animations on later assignments were changed to display the position of
objects and did not require students to make measurements. In addition, students had
ample freedom to ask questions about using the applet by posting questions to the web-
based help desk or by emailing me. Survey responses which indicated that multimedia-
focused problems were more difficult because of the difficulty of making accurate
measurements may be referring to those multimedia-focused problems given at the
beginning of the semester before the exact positions of objects were displayed. These
questions were not used in the quantitative part of the study.
Similarity of groups is vital to the ability to validly attribute any difference
between scores of the two groups to the treatment. Two incidents relating to self-
selection occurred which could have jeopardized the similarity of the groups. First, the
instructor of one section (not mentioned as part of the sample in Section 3.3.2) counted
the assignments which were part of this study as extra credit. This section was thus not
included in the data analysis. Second, due to the difficulty of the multimedia-focused
problems, some students chose not to do them. As a result there was a “dropping out” of
the treatment group which was not equally likely to occur in the control group. To see if
this effect was significant, the number of students who downloaded but did not submit
the assignment for the treatment group was compared to that for the control group on all
assignments in the study and tested for significance. It was found that indeed the
difference was significant and likely affected the outcome of the study (see Table 3.2).
As a result, these students' scores (zero of course) were counted as part of the study for
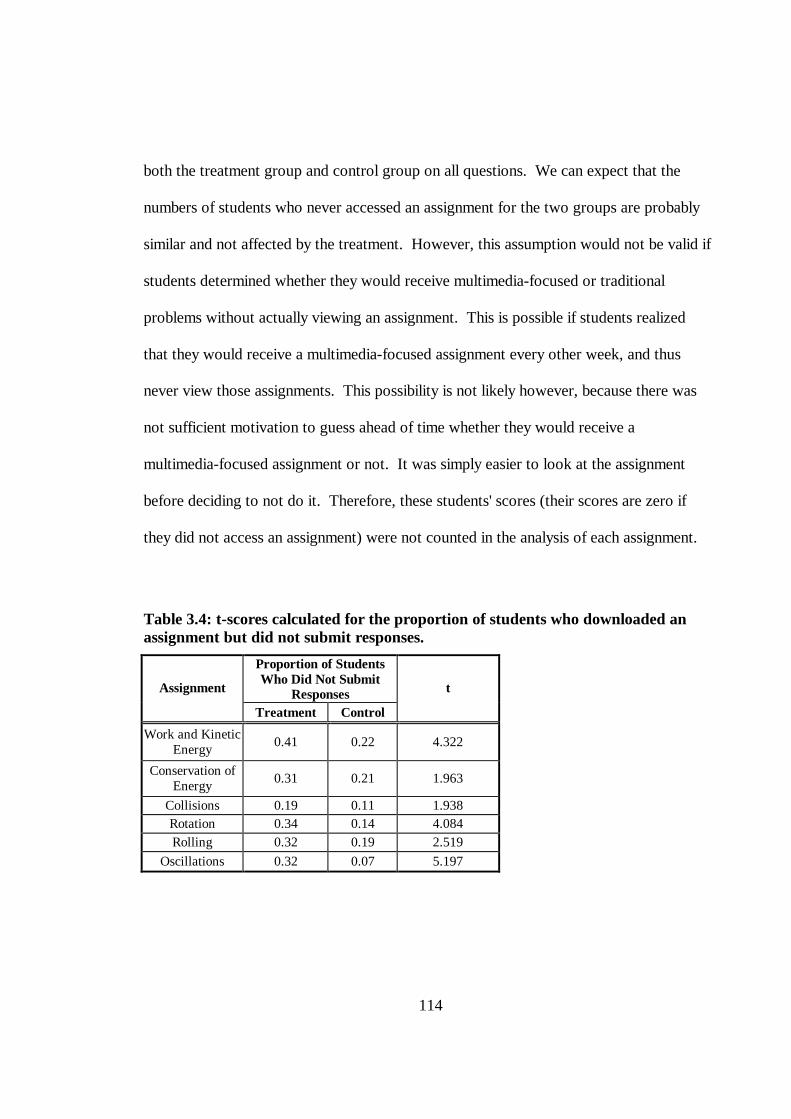
114
both the treatment group and control group on all questions. We can expect that the
numbers of students who never accessed an assignment for the two groups are probably
similar and not affected by the treatment. However, this assumption would not be valid if
students determined whether they would receive multimedia-focused or traditional
problems without actually viewing an assignment. This is possible if students realized
that they would receive a multimedia-focused assignment every other week, and thus
never view those assignments. This possibility is not likely however, because there was
not sufficient motivation to guess ahead of time whether they would receive a
multimedia-focused assignment or not. It was simply easier to look at the assignment
before deciding to not do it. Therefore, these students' scores (their scores are zero if
they did not access an assignment) were not counted in the analysis of each assignment.
Table 3.4: t-scores calculated for the proportion of students who downloaded an assignment but did not submit responses.
Propor tion of Students Who Did Not Submit
Responses Assignment
Treatment Control
t
Work and Kinetic Energy
0.41 0.22 4.322
Conservation of Energy
0.31 0.21 1.963
Collisions 0.19 0.11 1.938 Rotation 0.34 0.14 4.084 Rolling 0.32 0.19 2.519
Oscillations 0.32 0.07 5.197

115
Finally, it was verified that the two groups were sufficiently similar to ensure
valid experimental results. A similar procedure to the one described in Section 3.2.6 was
used; however, it is reiterated below. Since students were randomly assigned to two
groups, it was expected that the two groups would perform similarly on identical
problems. In other words, the null hypothesis is that the two groups are statistically
similar (i.e. that there is no significant difference between the proportion of correct
responses for the two groups on identical questions). To test whether we should reject or
accept the null hypothesis, we can perform a two-tailed t-test for binomial distributions.
A two-tailed t-test if chosen since the hypothesis, that there is a significant difference
between the two groups on identical questions, is not directional. The proportion of
correct responses on 52 identical problems was calculated for both groups, and a t-score
was calculated for each problem according to Eq. 3.2. Data is shown in Table 3.5. The t-
score is considered to be normally distributed; therefore, for a 2-tailed t-test, there is a 5%
chance of finding a t-score greater than 1.96, our criterion for significance, that is due to
random fluctuations and not due to a difference between the groups.

116
Table 3.5: Proportions of correct answers on identical questions for the two groups of students who participated in the study. Questions on which the groups performed differently at t > t .05 are italicized and boldfaced.
Number of Responses Propor tion Cor rect Question
Group 1 Group 0 Group 1 Group 0 t
1 169 149 0.80 0.83 0.633
2 169 149 0.70 0.74 0.791 3 169 149 0.29 0.21 -1.535 4 169 149 0.84 0.83 -0.193 5 169 149 0.83 0.85 0.274 6 138 136 0.47 0.45 -0.373 7 138 136 0.43 0.44 0.228 8 138 136 0.18 0.11 -1.661 9 150 139 0.64 0.58 -0.998 10 150 139 0.23 0.22 -0.356 11 164 150 0.65 0.67 0.391 12 164 150 0.15 0.15 0.173 13 164 150 0.13 0.17 0.807 14 164 150 0.59 0.67 1.377
15 164 150 0.62 0.73 2.215 16 164 150 0.38 0.44 1.005 17 164 150 0.66 0.68 0.290 18 164 150 0.35 0.43 1.326 19 148 142 0.36 0.41 0.882 20 148 142 0.26 0.27 0.214 21 148 142 0.25 0.25 0.069 22 148 142 0.66 0.70 0.890 23 148 142 0.83 0.82 -0.161 24 148 142 0.63 0.69 1.109 25 148 142 0.83 0.79 -0.920

117
Table 3.5 continued.
26 148 142 0.70 0.66 -0.620 27 144 128 0.49 0.41 -1.436 28 144 128 0.48 0.41 -1.078 29 144 128 0.56 0.47 -1.430 30 144 128 0.63 0.58 -0.907
31 144 128 0.28 0.14 -2.756 32 144 128 0.14 0.07 -1.829 33 144 128 0.38 0.28 -1.640 34 144 128 0.13 0.06 -1.912 35 145 136 0.68 0.70 0.409 36 145 136 0.93 0.93 -0.149 37 145 136 0.80 0.74 -1.285 38 145 136 0.35 0.40 0.785 39 139 131 0.88 0.90 0.421 40 139 131 0.79 0.76 -0.553 41 139 131 0.59 0.63 0.735 42 139 131 0.46 0.50 0.588 43 129 127 0.83 0.81 -0.384 44 129 127 0.78 0.76 -0.364 45 129 127 0.42 0.35 -1.187 46 129 127 0.52 0.49 -0.499 47 129 127 0.53 0.54 0.133 48 154 137 0.53 0.51 -0.256 49 154 137 0.48 0.42 -1.103 50 154 137 0.79 0.77 -0.394 51 154 137 0.49 0.53 0.670
52 154 137 0.49 0.55 1.154
For a given t-score, we can consider two possible outcomes: (1) t<1.96, the
difference between the proportion of correct responses for the groups is not significant
and (2) t>1.96, the difference between the proportion of correct responses for the groups
is not significant. This forms a binomial distribution with p, the probability of case 2
occurring, equal to 0.05.

118
On two of the 52 questions, there was found to be a significant difference in the
performance of the two groups (|t| > t.05 is the criterion). Can this be attributed to random
fluctuations thus giving us reason to accept the null hypothesis, or must we reject the null
hypothesis and conclude that our groups are statistically different? This is answered by
considering the probability of finding 2 or more occurrences of |t| > t.05. If this value is
less than 0.05, we should reject the null hypothesis. If this value is greater than 0.05, we
should accept the null hypothesis. The larger that this value is, the more confident we are
of accepting the null hypothesis. The probability of finding 2 or more occurrences of |t| >
t.05 is given by
p xi
p pi i
i
( )≥ = −������ − −
=�2 1
521
52
1
2
� � (3.4)
Substituting p=0.05 gives
p x( ) .≥ =2 05
Therefore, we can reasonably conclude that our groups were indeed similar.
3.3.6 Data Analysis
Each problem on each assignment in the study was treated as a separate
experiment; however, all problems were similarly analyzed. Students were given a score
of 0 for an incorrect answer and 1 for a correct answer. The proportion of correct
answers on each problem was computed for each group, and the difference in proportions
for the two groups was tested for significance.

119
There are two possible outcomes for a student's answer: correct or incorrect.
Therefore, the two groups are considered binomial populations. As a result, the number
of correct answers for each group should follow a binomial distribution. To test for
significance, a t-score is calculated. The t-score is given by Eq. 3.2 where p1 is the
proportion of correct responses and n1 is the total number of responses for the treatment
group; p2 and n2 are the corresponding variables for the control group. The observed
proportion of the combined samples, p, is given by Eq. 3.3.
The t-score represents the ratio of the difference in proportions to the standard
deviation of the distribution of proportion differences. For large values of n1 and n2, t has
approximately a normal distribution and thus provides the basis for a t-test of infinite
degrees of freedom.
To determine significance, a t-score for each problem was compared with t.05, the
value at which we can reject the null hypothesis with 95% confidence. For a one-tailed
test and infinite degrees of freedom, t.05 is 1.645. Thus, for problems with t-scores
greater than 1.645, we can conclude with at least 95% confidence that the difference in
the proportion of correct scores between the two groups is attributable to the treatment.
A one-tailed test was used because the hypothesis was directional; that is, we
hypothesized that the proportion of students who answer a multimedia-focused problem
correctly would be less than the proportion of students who answer a similar traditional
problem correctly. If we had hypothesized that the two groups would merely perform
differently, then we would have used a two-tailed test.

120
The free-response questions on the survey were analyzed using a grounded theory
approach proposed by Strauss and Corbin (1990). It is a procedure for developing theory
which is grounded in valid interpretations of qualitative data. In general, the method
consists of open coding, axial coding, and selective coding. Open coding is the act of
interpreting qualitative data, forming concepts, and integrating these concepts into
categories. Axial coding is the process of relating categories, and selective coding is the
process of developing a core category, one that integrates all of the categories.
Upon first reading the responses, I developed specific concepts corresponding to
each response. What resulted was a long list of concepts some of which could be
generalized and combined into larger categories.
Although I desired to relate and combine some subcategories, I did not want to
make the categories so general that resolution would be lost. By resolution, I refer to the
clarity of students' responses. The advantage of using free-response questions over
multiple choice questions is that I can achieve greater resolution with free-response
questions. With free-response questions I can observe subtle nuances between students'
responses which would not be apparent with multiple choice questions. Two students can
answer the same way on a multiple choice question but for different reasons. In fact,
sometimes the answer a student prefers is not listed as one of the choices.
An example of this phenomenon is illustrated by categories 1 and 19 for question
1b shown in Table 3.6. Students could have found multimedia-focused problems difficult
because they had difficulty figuring out which numbers they needed from the animation
to solve the problem (category 1) or because they had difficulty making accurate, precise

121
measurements using the animation. In both cases, students had difficulty taking data with
the animation in order to solve the problem (this would be a more general category
encompassing both 1 and 19); however, in one case (category 1) it's because the student
doesn't know which data to collect, and in the other case (category 19) the difficulty is the
process of measuring the data. The difference is important, because a facilitator can
remedy the latter difficulty by instructing students in using the java applet and by
increasing the tolerance on WWWAssign to allow for more measurement error. Yet, the
former difficulty must be remedied by teaching students how to think about the problem;
that is, the instructor must address students' problem solving approaches.
Unfortunately, it's not always easy to separate students' responses into specific
subcategories. For example, what if a student says, “I had trouble taking data.” Is it
because the student did not know which data to collect, or is it because the student did not
understand how to operate the java applet? Whether the experimenter should use more
general categories or more specific categories depends on how results will be interpreted.
If response frequency for each category is to be reported and compared among groups,
general categories are more desirable. However, if one merely wants to see approximate
magnitudes of responses without making numerical comparisons, specific categories are
more desirable. For this study, students' responses were binned into specific categories in
order to obtain higher resolution in the analysis, recognizing of course that some
categories are related. After the first round of combining some subcategories, the free-
response survey questions were again coded without referring to the previous coding.
When unclear distinctions between categories were found, categories were better defined.

122
Some categories were added and others were combined. Responses were coded with the
new categories, and the process was repeated without referring to any of the previous
codings. In all, this iterative process was completed approximately 7 times by the author.
Final categories for question 1b are shown in Table 3.6, and final categories for question
4b are shown in Table 3.7.
Once the final categories were determined, responses were twice coded. Codings
were compared and differences were resolved. Sometimes a difference between codings
for a particular response was obviously due to a mistake in coding where the wrong code
was unintentionally assigned. In other cases, ambiguity of a response caused it to be
interpreted differently in each coding and thus assigned to different categories. In these
instances, the coding was changed to u, meaning unclear or uncategorizable.

123
Table 3.6: Categories and survey responses to question 1b in Appendix 5 (239 total respondents).
Code Category Total Number of Responses Propor tion
1
not given numbers; having to determine which measurements to make; finding the appropriate information and determining which points are needed to solve a problem; seemingly insufficient information; have to use the animation to get data
58 0.24
3 not having worked examples either with an answer key, textbook, or explicit instruction; not having prior experience solving these problems; animation question is different
20 0.08
4 confusing; hard to understand; hard to figure out; not clearly worded; hard to interpret; hard to decipher
64 0.27
5 couldn't get animation to work; inconsistency of animation 23 0.10
6 more involved; more calculations; more time-consuming 15 0.06
7 it was generally hard; questions were generally hard 3 0.01
8 made problem more realistic 1 0.00
9 helped visualize the problem or interpret the question 3 0.01
10 intimidating; scary; frustrating 4 0.02
11 directions are unclear; help was not sufficient 7 0.03
12 difficult to visualize 2 0.01
13 can't print it and work on it like a textbook problem but must do it at the computer; can't take it home with you
12 0.05
15
animation was not clear; display was not clear; animation was not smooth; animation was slow; question and animation did not appear on the screen at the same time; animation window was too large
7 0.03
18 similar to lab 2 0.01
19
difficult to take data; difficult to operate animation; difficult to obtain desired data points; did not understand how to take data from the animation; tried counting squares and guessing at grid values, etc.; did not stop the animation and step through the motion; difficult to read data; difficult to make exact measurements and use measurements to obtain an accurate answer (this is either due to the interface or the process of measurement); you can solve the problem correctly but not get the expected answer; know how to do the problem and can work the animation but cannot get the correct answer
95 0.40
p positive response; animation problem was not difficult, interesting, helpful, etc.
9 0.04
u unclear 16 0.07

124
Table 3.7: Categories and survey responses to question 4b in Appendix 5 (234 total respondents).
Code Category Total Number of Responses Propor tion
1 learned to solve problems where info is not given; had to determine necessary data to solve animation problems and this was not necessary with other problems
1 0.00
2 made me think; helped my reasoning; helped my approach to solving other problems
5 0.02
3 made other problems easier; made other problems more understandable
3 0.01
4
did not know how to do the animation problems; I could not get animation problems correct; technical difficulties with animation; having to use the animation interfered with understanding how to do the problem
49 0.21
5 animation problems were confusing; animation problems were more abstract; non-animation problems were more clear; did not understand them; hard to figure out; poorly worded
37 0.16
6
2 types of problems were not related; animations are not used in other questions; the two problems are different; animations required you to take data whereas in other problems data is given to you
26 0.11
7
non-animation problems were not difficult; have no need for additional visualization provided by animation; do not need animation if given data; still picture is just as helpful; need no additional help to solve non-animation problems; can already do non-animation problems
33 0.14
8 non-animation problems helped me solve animation problems 7 0.03 9 animation problems were frustrating 13 0.06
10 extra practice was helpful 2 0.01
11 poor design of animation problems; animation did not deal with real objects, but abstract objects"
4 0.02
12 not sure 2 0.01
13 animation helped me visualize; animation helped explain the problem
17 0.07
14 did not do animation problems 7 0.03
15 animation was not connected to class or lab 1 0.00
16 mathematics were similar; problems were basically the same except in one the data is given
6 0.03
17 animation problems are more like real-world problems 2 0.01
18 animation problems were easier 1 0.00 p positive 29 0.12 u unclear 41 0.18

125
3.3.7 Findings
A summary of results is shown in Table 3.8. In all but 3 problems, difference
between the treatment and control groups can be attributed to the treatment with at least
95% confidence. It is particularly evident when viewing the proportions of correct
responses for the two groups shown in Figure 3.5 that the treatment group did
significantly worse than the control group. Therefore, it appears that multimedia-focused
problems are significantly more difficult than traditional physics problems.
Table 3.8: t-scores calculated for multimedia-focused problems on topics of work and kinetic energy, conservation energy, collisions, rotation, rolling, and oscillations.
Number of Responses Propor tion Cor rect Assignment [Question Number ] Treatment Control Treatment Control
t
Work and Kinetic Energy [1] 235 215 0.16 0.32 -3.963
Work and Kinetic Energy [2]
235 215 0.09 0.29 -5.538
Conservation of Energy [1]
137 155 0.14 0.54 7.197
Conservation of Energy [2]
137 155 0.07 0.34 5.474
Collisions [1] 159 141 0.18 0.25 -1.531 Collisions [2] 159 141 0.11 0.29 -4.025 Collisions [3] 152 140 0.36 0.51 -2.625 Rotation[1] 140 151 0.12 0.14 0.446 Rotation[2] 140 151 0.12 0.21 2.061 Rotation[3] 140 151 0.21 0.32 2.258 Rotation[4] 140 151 0.01 0.10 3.091 Rolling[1] 147 133 0.28 0.62 -5.685 Rolling[2] 147 133 0.14 0.16 -0.516
Oscillations [1] 122 135 0.16 0.33 2.999
Oscillations [2] 122 135 0.16 0.30 2.800

126
Figure 3.5: Proportion of correct responses on multimedia-focused problems for treatment and control groups.
In question 1a, 94% of the students who answered the survey responded that
multimedia-focused problems were usually or always more difficult than traditional
problems. This supports the numerical findings reported in Table 3.8.
In question 1b, students responded to why multimedia-focused problems were
more or less difficult (depending on how they answered 1a) than traditional problems.
Due to the strong opinion that multimedia-focused problems were more difficult than
traditional problems, most students gave their reason why multimedia-focused problems
were more difficult than traditional problems rather than the other way around. Those
students who gave an answer consistent with the idea that multimedia-focused problems
Pro p o rtio n Co rre c t vs Que stio n
0.00
0.10
0.20
0.30
0.40
0.50
0.60
0.70
Que stio n
Treatment Group
Control Group
N o t Sig nifica nt

127
are not usually or always more difficult than traditional problems were categorized as
“positive.” As indicated in Table 3.6, approximately 4% of students gave a response that
was categorized as positive. This is fairly consistent with the results of question 1a where
6% of students responded that multimedia-focused problems are sometimes or rarely
more difficult.
One of the larger categories of responses to this question, as shown in Table 3.6,
was that multimedia-focused problems were more difficult because numbers are not
given in the question but must be determined using the animation. This category is the
one most consistent with our hypothesis. A few examples are listed below. Spelling and
grammatical errors have not been changed in order to accurately reflect students’
responses.
Because we are not just given numbers to play with in the calculatlor or put in a formula when you have an animation you got to figure out what numbers to use. I guess thats good for us, helping us to understand problems closer to real life situations." The [traditional] problems deal with the basic principles of physics. Most of the time they involve plug and chug. You just have to know what formula to use b/c they involve more hands on approach rather than the usual word problem that gives you the boundries and criteria It becomes tedious to gather all the required information necessary. The same effect could be given by just giving us a word problem that states the same information that can be obtained from the animation but still require us to filter out what is necessary and what is not. Well, you are not given all the information, so you have to decide which information to gather from the animation and then use what you find out to help solve the problem. They are more difficult because you do not have the numbers right in front of you. Instead they are in the form of the objects moving, and it is hard to get the real numbers. It's more difficult to observe velocity, acceleration, etc, and then calculate other properties of the animation from your observations.

128
You have to gather the information on your own and then apply it. Where as the information in other homework has the info for you. Sometimes it is hard to interpret the animations because you can't tell what information is given and what information is necessary to solve the problem. Also, you can't check your answers like most of the other problems and you don't know how to go about solving them sometimes. Animation is more difficult because in addition to solving the problem you may have to determine time, displacement, velocity, etc... by viewing, whereas in a standard problem that information has to be given. Also, since you are not given all the pieces of information needed to work the problem (you have to get information from viewing) it is difficult to know what you are looking for, i.e. what you need to be able to solve the problem. You have to obtain data, it is not merely given to you for "plug n' chug". This is sometimes difficult. Also, it is harder to define what method/formulas you will be utilizing in the problem.
As shown in Table 3.6, this is not the only predominant reason students had
difficulty with multimedia-focused problems. Many students reported that questions with
animations were confusing; others had technical difficulty with the animation, often
knowing which data was required but not being able to make sufficiently accurate
measurements to obtain the correct answer or not understanding how to use the animation
to make measurements.
Students' reasons for finding the multimedia-focused problems more difficult than
traditional problems can be summarized into two general categories:
1. Required data is not given in the text of the question but must be measured using the animation.
2. It was difficult to take sufficiently precise, accurate data using the animation in order to get the “correct” answer.

129
It is probable that these two general categories are the underlying reason for
responses in other categories. For example, one response might be, “Questions with
animations are confusing.” We naturally want to know why questions with animations
are confusing. Is it because the student does not know how to begin solving the problem
since no data is given in the question to guide them to essential formulae? Is it because
they know how to solve the problem, but have no idea how to run the animation and step
through its motion to particular instances or what the x,y coordinates pertain to? In other
words, is it predominantly a technical difficulty or a conceptual difficulty?
To successfully solve a multimedia-focused problem, it is first necessary to
understand the technology, the technical know-how to run the animation and make
measurements, and then to apply the appropriate physics concepts. But is the required
technological understanding an inhibitor or merely a small hurdle which is easily
overcome?
Because there is some experimental error in the categorization of students’
responses, especially as it pertains to the proportion of responses in each category, data
from NCSU students’ responses is inconclusive in determining whether technical
difficulty or conceptual difficulty is the predominant effect. If the difficulty is mostly
conceptual in nature, we can propose that multimedia-focused problems have potential
for challenging novice problem solving strategies and helping students adopt more
expert-like approaches. If the difficulty is mostly technical, we cannot conclude anything
about the pedagogical value of multimedia-focused problems, but can only propose that
using multimedia-focused problems will require greater technical skills for students and

130
greater time spent by the instructor in developing students' technical understanding of the
java applet.
Integrating multimedia-focused problems into lecture and all homework
assignments, demonstrating how to solve multimedia-focused problems using examples
in class, teaching explicit problem solving strategies, and using multimedia-focused
problems on exams should minimize students' technical difficulties because they
regularly see how to interact with the applet. If an instructor uses multimedia-focused
problems, these are recommended practices. Therefore, students' technical difficulties
should not be a barrier when multimedia-focused problems are extensively used in
instruction.
Evidence for this is supported by responses to an identical survey distributed to
students taught by Dr. Wolfgang Christian at Davidson College (results are shown in
Appendix 7). Students were given weekly homework assignments consisting of
multimedia-focused problems and problems from their textbook. Multimedia-focused
problems were also used extensively in class and on exams. Dr. Christian used
multimedia-focused problems in class to have students discuss phenomena shown in the
animations. He often demonstrated how to solve multimedia-focused problems given on
the homework assignments. On exams, students had to view animations and answer
corresponding conceptual questions. Although they were not required to take data, they
usually had to observe motion of the objects in the animations in order to solve the
problem. On one exam question, for example, students observed the 1-D motion of a ball
bouncing between two walls and had to draw position, velocity, and acceleration vs. time

131
graphs for the ball. As a result, students seemed well familiar with the operation of the
Animator physlet. In other words, they seemed to understand how to use the applet to
take data. Analysis of the survey showed that in some respects Davidson students agreed
with NCSU students. First, Davidson students felt that multimedia-focused problems
were more difficult than traditional problems; 84% (16/19) reported that multimedia-
focused problems were always or usually more difficult than traditional problems.
Second, many students reported that multimedia-focused problems are more difficult
because they are not given numbers in the text of the question but must figure them out
from the animation. These similarities in the two surveys support the belief that
multimedia-focused problems are more challenging for novice students for conceptual,
not technological, reasons..
However, in many notable aspects, their responses to the survey differed from
responses from NCSU students. Many of the categories of responses from NCSU
students were not found in responses from Davidson students. For example, few
Davidson students reported unclear directions, confusing or vague questions and
animations, technological problems, difficulty obtaining accurate, precise answers,
difficulty making measurements, or lack of examples as reasons that multimedia-focused
problems were more difficult.
The differences between responses from Davidson and NCSU students are likely
due to the environment in which the multimedia-focused problems were used. At NCSU,
multimedia-focused problems were not fully integrated into instruction but were only
seen by students on homework assignments. This is not recommended practice for using

132
multimedia-focused problems. Students did not receive adequate in-class examples of
solving multimedia-focused problems, thus confusion and technical difficulties with the
applet were a natural outcome even with as much on-line support as could be provided.
In addition, homework at Davidson was graded by the instructor, not automatically as
with the homework at NCSU. Therefore students did not have to obtain highly accurate,
precise answers, but rather their problem solving procedure was more important than
their final result.
3.3.8 Summary and Conclusions
Since they were designed for the purpose of challenging students to think
qualitatively about a problem before quantitatively analyzing it, an approach unfamiliar
to novice problem solvers, it is possible that multimedia-focused problems indeed fulfill
our goals. However, results from student performance do not tell us why students have
difficulty, but merely that they had difficulty. Therefore, we must use the survey to either
support or deny our proposition of why students had difficulty.
Survey responses support to some degree what was predicted, that students would
have difficulty with multimedia-focused problems because they are forced to think
conceptually about a problem before analyzing it mathematically, an approach they are
not accustomed to. Due to the inability to make strong interpretations of most of the
survey responses, we cannot make a judgement about what factor had the most
significant influence on the difficulty of multimedia-focused problems. We can

133
conclude, however, that the fact that students are not given numbers in the text of the
question but must determine which numbers they need and must use the animation to get
those numbers is a significant factor toward the difficulty of multimedia-focused
problems. By comparing survey responses from students at NCSU with those at
Davidson, we can also recommend that multimedia-focused problems be used throughout
the course, perhaps in lecture demonstrations and on exams, and not just on homework.
It is important for students to see examples of how to approach this type of problem, a
type that they are not accustomed to solving.
3.4 Experiment 3: Think-aloud interviews with students
Students indeed find multimedia-focused problems more challenging than
traditional problems. Looking at students’ responses on a survey, we found that the fact
that students are not given numbers in the text of the question but must determine which
numbers they need and must use the animation to get those numbers is a significant factor
toward the difficulty of multimedia-focused problems. But where in the problem solving
process do students run into difficulty? What is it that predominantly prevents them from
succeeding at solving a multimedia-focused problem? Is it that students don’t know how
to begin the problem; or do they know the appropriate concepts and equations but not
which data to collect; or can they not determine the appropriate concepts and equations to
apply to the situation? To answer this question, we must look in depth at a few students’
thought processes while solving multimedia-focused problems.

134
3.4.1 Research Design
To gain greater insight into the problem solving process of some students on
multimedia-focused problems, think-aloud interviews were conducted where students
verbalized their thoughts as they solved multimedia-focused problems. Following each
problem, they were asked to recount their thoughts. This retrospective report was then
used as a validity check on their verbalizations.
3.4.2 Sample
In all, interviews with six students were transcribed and analyzed, two students
from NCSU and four students from Davidson College. The two NCSU students were
volunteers who had responded positively to the last question on the survey of Experiment
2 and who also responded to a follow-up email message. For participating in an
interview, each of them received a check for $20. Generally, the total interview time was
less than 1½ hours. The four students from Davidson College were also volunteers.
Each received full credit for one homework assignment for their participation.

135
3.4.3 Instrumentation
Students were given one multimedia-focused problem which was used for
practice and three multimedia-focused problems which were analyzed for the study. The
practice problem is shown in Appendix 9, and the three experimental problems are shown
in Appendix 8.
3.4.4 Procedural Detail
The interview began with an introduction and casual conversation. The goal was
for the subject to feel as comfortable as possible. To facilitate the comfort level and to
satisfy requirements of NCSU human research regulations, the interviewer described
what would take place during the interview. NCSU students were also asked to sign a
consent form. To facilitate the comfort of the subject, the interviewer clarified the fact
that the subject would be completely anonymous and that no identifying information
would be available to anyone.
The interviewer then engaged the subject in some practice exercises designed to
help the subject feel comfortable with speaking aloud. An exact script that the
interviewer followed during the session is shown in Appendix 9.
After the practice exercises, the subject was shown a multimedia-focused
problem. The interviewer showed the subject an example problem and explained the
operation of the applet such as controlling the animation and measuring position with the
cursor. Care was taken to concentrate on the mechanics of the animation and not on the

136
process of solving the problem. The subject was then given a multimedia-focused
problem for practice (see Section 7.8) and was asked to solve it while speaking his or her
thoughts. The subject was allowed to ask any questions concerning the operation of the
applet, and any questions asked were answered by the interviewer.
Once confident in operating the applet, the subject was given a multimedia-
focused problem to solve and was asked to speak aloud. The subject was allowed to use
a textbook, calculator, pencil, and paper. When the subject was finished with the
problem, the interviewer asked the subject to report everything he or she could remember
thinking while solving the problem. This procedure was followed for all three
multimedia-focused problem analyzed in the experiment. The order of the questions
asked to the NCSU students was different than the order given to the Davidson students
for no particular reason.
Verbal data was recorded using a video camera which was placed out of the direct
sight of the subject. All subjects were aware that the interview was being recorded with
the video camera since this point was clarified at the beginning of the interview.
3.4.5 External Validity
General issues in external validity and recommended practices for addressing
threats to validity are discussed at length in Section 2.5.2. Two literature sources that
were consulted to address these issues were Ericsson and Simon (1993) and Russo,
Johnson, and Stephens (1989). Specifically, threats to validity were addressed in the

137
areas of task, instructions, reporting, and analysis. A transcript of the interview
instructions as given to the subjects is in Appendix 9)
Verbal data is not considered valid if the subject is asked to report on information
not heeded in STM. Therefore, the task should not be one that is automatic, such as
walking or talking for example. The problem solving exercises in this study were not
automatic tasks; therefore, this was not a threat to validity.
Instructions given to subjects can also result in invalid data. Subjects cannot
validly report on cognitive processes themselves but only on information stored in STM
that results from those cognitive processes. Consequently, students in this study were
instructed to report every thought during a particular task with no attention to whether the
thought should or should not be reported.
In addition, validity can be affected by the presence of the investigator and
recording device, especially if the subject is distracted. As a result, the video camera was
placed out of the direct line of sight of the subject. Although it was acknowledged at the
beginning of the interview, the camera was not mentioned again during the interview.
Sometimes the subject will stop talking during periods of heavy load on the STM.
This did occur during the interviews. Occasionally, when a student was questioning his
or her solution, for example, there would be prolonged silence. Following the
recommendation of Russo, Johnson, and Stephens (1989), students were never prompted
to “keep talking,” as this would interfere with their thought process. Rather they were
given extensive warm-up exercises to familiarize them with verbalizing their thoughts.

138
In general, reporting should not impede the subject's ability to perform the task.
This is possible as long as the subject only reports on normally available verbal
information; however, verbalization may influence the time to complete the task as well
as the accuracy in completing the task. Although these are indications of invalidity,
Russo, Johnson, and Stephens (1989) recommend that subjects sacrifice speed for
completeness of the verbal report and naturalness of the cognitive process, the most
important being naturalness. This is another reason prompts such as “keep talking” were
not used. In addition, this factor prevents us from giving too much importance to
whether or not the final answer is correct. Rather, we must give more importance with
the thought process.
Another problem that affects the validity of a verbal report occurs when the
subject verbalizes that which he or she thinks the investigator wants to hear. In this
instance, the subject is filtering the thought processes while verbalizing. To minimize
this factor in the present study, there was no focus at all on the correct answer. The fact
that the interviewer did not know the students who participated in the interviews and did
not interact with them in any classes helped students feel comfortable with their
responses. In addition, confidentiality was emphasized (see Appendix 10). Although
some students reported some nervousness when first arriving for the interviews, all
students reported that they felt comfortable during the interview.
Of central importance to valid interpretation of verbal protocols is that the analysis,
or encoding, of the protocol is as independent as possible from the bias of the encoder.
This is best achieved by considering the context surrounding a subject’s statement. For

139
example, consider that a subject solving a problem says, “I need to find the velocity.” By
considering the context surrounding the statement, we can determine if the subject is
articulating what the problem is asking for, or whether the subject is stating a subgoal
where the velocity is needed in order to calculate some other quantity that is the quantity
actually being solved for.
Properly determining the context is facilitated by formulating a task analysis before
encoding the subject’s verbalizations. A task analysis was developed considering what
step were believed to be needed in order to solve a multimedia-focused problem. The
task analysis is fundamentally based on problem solving approaches advocated by Reif
and others described in Section 2.2.1. In other words, it can be thought of in terms of
describing the problem, planning the solution, implementing the solution, and checking
the result. The task analysis, however, is slightly more specific, and is shown in Figure
3.6.
1. Read and Interpret Question
2. View and Interpret Animation
3. Decide what physics principles and equations are needed.
4. Decide what quantities are needed.
5. Measure relevant data.
6. Mathematically analyze data and equations.
7. Check answer for correctness, consistency, intuition, etc.
Figure 3.6: Task analysis for the task of solving multimedia-focused problems.

140
The steps in the task analysis of Figure 3.6 are generally ordered. For example,
one must mathematically analyze the problem before checking the result for consistency.
However, we expect that a person solving a multimedia-focused problem will operate
among many of the steps while solving the problem. That is, one can take data, perform
a mathematical analysis, check the result for consistency, realize that the answer may be
wrong, reread the question and review the animation, consider different physical
principles or a different method of solution, and continue again. For example, they may
move from step 5 back to step 3 at any time. However, we also expect that certain steps
must precede other steps. In other words, step 5 will always precede step 6.
The task analysis forms a fundamental basis for categorizing and coding students’
verbal reports while solving multimedia-focused problems. However, we may find that
some of their verbalizations do not fall into any of these categories. Therefore, we will
form new categories to encompass these verbalizations.
3.4.6 Data Analysis
The uncoded interview transcriptions are shown in Section 7.11, and the coded
transcriptions are shown in Section 7.12. The task analysis of Figure 3.6 formed the basis
for the codes used in Section 7.12. Other codes were determined after reviewing the
interviews and finding that the task analysis was not sufficient for coding all
verbalizations of the subjects. For the most part, however, the task analysis formed a

141
fairly complete set of codes. The codes used for categorizing statements of the subjects
are shown in Figure 3.7.
RQ Read and interpret question
RA Read and interpret animation
SE Search for equation
SC State concept, principle, definition, or equation
DQ Decide what quantities or measurements are needed
MD Measure data
SD State what data has been measured or what data is known
DS-C Do somethingcontrol animation
DS Do somethinglook in book for equation, write information down, etc.
MA Mathematically analyze data and equations
CA Check answer or check approach; see if approach is consistent and appropriate
EX Express personal feelings such as doubt, certainty, etc.; personal reflection
?? Meaning of statement cannot be accurately determined
Figure 3.7: Codes for categorizing subjects’ verbalizations.
Once the verbal reports were coded, they were reviewed, descriptions of which
follow below:
3.4.6.1 NCSU Student 1
Problem 1: Projectile Motion

142
After reading the question and viewing the animation, NCSU student 1 cues off
the phrase “maximum height” and immediately measures the y coordinate of the
projectile when it is at its maximum height. Subsequently he realizes that the y-velocity
of the projectile is zero at this instant, and the x-velocity of the projectile is constant
throughout its motion. He then calculates the x-velocity by measuring the distance the
projectile travels in one second. His final answer is correct.
Problem 2: Average Velocity/Average Speed
Upon reading the question and noting what quantity the questions for, he views
the animation. His first goal is to measure the distance traveled by the object in two
seconds; therefore, he measures the object’s initial and final positions. However, upon
seeing that the object changes directions, he decides to measure its average velocity while
the object travels to the right, then its average velocity while it travels to the left. He then
does a weighted average of those two values since it travels to the right for a fraction of
the time that it travels to the left.
When reading the question for part (b), average speed, he realizes that his answer
to part(a) was actually the answer to part (b). He then reevaluates his answer to part(a),
this time simply adding the two vectors, the velocity to the right and the velocity to the
left. His answer to part (b) was (finally) correct, and his answer to part (a) was incorrect.
Problem 3: Newton’s Second Law

143
After reading the question, he immediately realizes that he needs to use Newton’s
Second Law and find the acceleration of the elevator during the specified time interval.
To find the acceleration, he recognizes that he can use one of the kinematic equations for
constant acceleration. He measures the change in position and change in time during the
specified time interval and correctly uses this data to solve for the acceleration of the
elevator. He multiplies this value and the mass of the woman to find the “force that she
experiences.” His answer was incorrect because it did not take into account the woman’s
weight.
3.4.6.2 NCSU Student 2
Problem 1: Projectile Motion
He first reads the question and immediately thinks about “how to work a speed
problem.” He then realizes that at the maximum height, the y-velocity is zero, but the x-
velocity is non-zero. He also states the in the “x direction speed is constant.” As a result,
he measures the distance the projectile travels from the time it is launched until the time it
hits the ground, and he measures this time interval. He uses this data to correctly
calculate the average x-velocity of the projectile at the maximum height.
Problem 2: Average Velocity/Average Speed
He begins part (a) by reading the question. Seeing that the object changes
direction (and also speeds), he notes the “wicked” motion. He then measures the total

144
displacement of the object during the specified time interval and uses this information to
correctly determine the average velocity.
In part (b), he notes that average speed is determined by the total “distance
covered.” Although he doubts this original assertion, he reads the book and verifies this
concept. He then proceeds to measure the total distance traveled. First he measure the
distance the object travels to the right. He then measures the distance the object travels
from this point to its final position which is to the left. He uses this measurement to
correctly determine the average speed.
Problem 3: Newton’s Second Law
After reading the question, he immediately realizes that the question only pertains
to the time interval from t=0 to t=1 s. He then states that “all the information after that
first second is not important.” Knowing that he needs to calculate the elevator’s
acceleration “because the acceleration will add on to 9.8 m/s2 and thus make her weigh
more, essentially, to the scale,” he looks in the book for a kinematic equation for constant
acceleration that he can use. He measures the change in position of the elevator during
the specified time interval, but realizes that he needs the initial velocity of the elevator.
Therefore, he makes an assumption (and convinces himself with a conceptual argument)
that the initial velocity of the elevator is zero. He proceeds to calculate the acceleration.
He realizes also that the upward acceleration will cause the woman to weigh heavier than
at rest by an amount given by the added acceleration. He thus adds the acceleration to the

145
acceleration due to gravity and multiplies by the mass to get the woman’s apparent
weight.
3.4.6.3 Davidson Student 1
Problem 1: Average Velocity/Average Speed
Upon reading the question in part (a), she immediately states the equation for
finding average velocity as “displacement over time.” She then, with some initial
hesitancy, seemingly to check her approach although we can’t tell for sure, measure the
initial position of the object (at t=0) and the final position of the object (at t=2 s) and uses
this data to correctly calculate the average velocity.
For part (b), she recognizes that the average speed is based on the “distance
traveled.” To measure the distance traveled, she sees how far it traveled to the right and
added this distance to the distance between the initial position and the final position.
Two mistakes were made: (1) she measured the distance it traveled to the right as 3.5
meters instead of the actual 5 meters and (2) she only counted the distance it traveled to
the right one time; that is, since the object travels to the right, reverses its direction, and
travels back through it’s initial position, the total distance traveled on the right side of its
initial position must be counted twice.
Problem 2: Newton’s Second Law
She begins by reading the problem and then redescribing it by cueing off certain
keywords. For example, she describes the concepts of acceleration and weight, specifies
146
the important time interval, and calculates the initial weight of the woman. Knowing that
she needs to find the acceleration, she measures the displacement of the elevator during
the specified time interval and uses a kinematic equation for constant acceleration.
Although she correctly solves for the acceleration of the elevator, she stopped there and
did not find the apparent weight of the woman riding the elevator.
Problem 3: Projectile Motion
She begins the problem by defining certain terms which she recognized from the
question. For instance, she cues on “speed” and “maximum height.” She defines speed
as the “distance traveled over time.” This definition, while useful for calculating average
speed, is probably not as helpful as the definition of speed as the magnitude of the
object’s velocity. She also cues on the words “maximum height” since she then states a
concept concerning any projectile’s motion at its maximum height in a constant
gravitational field. She states that “Velocity will only be, or the speed of the thing, will
only be in the horizontal direction.” This statement, while true for velocity, also shows
difficulty relating velocity and speed.
She then tries to remember how to do projectile motion problems “because they
have both x components and y components.” Although she seems to recognize that she
needs to take into account both components of the projectile’s motion, she seems to have
difficulty describing the projectile’s velocity as x and y components. Although she later
measures its x and y positions at its peak, she says believes that the “final velocity at the
top is zero.” She then searches for an equation which will help her solve for its speed.

147
The approach is not very consistent here because she believes that the final velocity at the
top is zero, yet she is trying to solve for the speed of the projectile at the top.
Inconsistency, however, is to be expected of a novice problem solver who has a
conceptual difficulty.
Realizing that this approach is not working, she attempts to measure its speed
directly (as opposed to measuring its position when launched and its position at the
maximum height and finding a formula to calculate its speed). As she goes to measure
two positions in order to use her definition of speed, she has difficulty because she has to
measure distance given both x and y coordinates. The fact that the object has motion in
the both x and y directions prevents her from being able to measure distance traveled.
Finally, she recognizes this difficulty breaking “down the motion into its x and y
components” and stops solving the problem.
3.4.6.4 Davidson Student 2
Problem 1: Average Velocity/Average Speed
After reading the question in part (a), she cued off certain keywords, most notably
the time interval. She indicates that there are positions associated with these particular
times probably because she plans to measure the positions at these times. Subsequently
she views the animation and measures the positions at t=0 and t=2 s. Although she
believes that velocity is based on the displacement, she looks in the book to verify her
concept. After verifying that this definition is true, she correctly calculates the average
velocity.

148
In part (b), she immediately checks the definition of average speed with the book.
She then immediately calculates the average speed using her data measured in part (a).
However, she incorrectly states that “distance traveled will be change in x.” As a result,
she calculates the displacement, not the distance traveled. Therefore, her answer, which
is incorrect, is the same as her answer to part (a).
Problem 2: Newton’s Second Law
She begins the problem by reading the question and viewing the animation. She
notes the position at t=0 and t=1 s, as well as t=5 and t=6 s. She then interprets the
question by drawing a plot and noting the elevator’s motion during the 3 distinct time
intervals: 0<t<1, 1<t<5, and 5<t<6. She rereads the question and notes the time interval
addressed by the question, 0<t<1. After mentioning her “knowns,” the positions at t=0
and t=1 and g, she rereads the question and looks in the book for a similar example
problem. Not immediately finding it, she attempts to draw a picture, presumably a free-
body diagram judging from the context of her statement, and writes Newton’s Second
Law. Not confident of her equation, she returns to the book. Finding the similar
example, she sees the same equation as the one she wrote down. With confidence that
this is the right equation, she determines that she needs to calculate the acceleration,
which she states as the change in velocity over the change in time. Thus, she finds the
change in velocity by calculating the initial velocity (t=0) and final velocity (t=1 s). She
finds these velocities by measuring the change in position over a small time interval. She

149
correctly determines the acceleration, however, due to a sign error she does not correctly
find the net force on the woman.
Problem 3: Projectile Motion
She first reads the question and views the animation. Subsequently, she draws a
picture of the motion and then measures the position at t=0, the position and time when
the projectile is at its maximum height, and the position and time when the projectile
lands. She then searches for an equation in the book, but she looks for an equation to
help her “calculate the maximum height.” However, she notices that it is not the
maximum height that she needs to calculate but the maximum speed. She then returns to
the animation, positions the object at its maximum, and notes that “there's no vertical
component of the velocity,” and “there is only the horizontal component which remains
constant throughout the flight.” After this statement, however, she demonstrates
difficulty separating the motion in the y and x directions. For instance, she somewhat
rescinds her previous statement by saying that the projectile “does have a velocity, so I'm
not thinking that velocity is equal to 0 which sometimes happens when you throw it up
and it comes down.” However, in this statement she does not consider x and y velocity
independently. In addition, she finally calculates the speed at the maximum height by
applying an equation, “v is equal to vo + at,” without specifying direction for the velocity.
Using the acceleration due to gravity, an initial velocity of zero and t, the time when the
projectile is at the maximum height, she calculates the velocity, v. As a result, her
answer is incorrect.

150
3.4.6.5 Davidson Student 3
Problem 1: Average Velocity/Average Speed
She begins part (a) by reading the question and viewing the animation. She then
calculates the average velocity while the object travels to the right, which she says is
constant and therefore measures over a small time interval, and the initial velocity when
the object travels to the left. Expressing doubt, however, she says that she is probably
going about it the “ long way.” Therefore, she rereads the question. Then she continues
using the same approach. To calculate the average velocity to the left, she calculates the
final velocity to the left and the initial velocity to the left and takes an average. She then
adds this velocity, which is negative, to the average velocity to the right, which is
positive, to get her final answer which is incorrect.
In part (b), she states that the average speed of the object to the left is positive
since speed is not a vector. Thus, she adds the average speed of the object to the right
and the average speed of the object to the left and divides by two to get the average speed
of the object during the specified time interval. Her answer was incorrect.
Problem 2: Newton’s Second Law
Upon reading the question, she notes that the elevator is accelerating during the
specified time interval, and she needs to calculate the acceleration. Assuming the initial
velocity is zero, she calculates the final velocity by calculating the elevator’s change in

151
position during a small time interval before t=1 s. She divides this final velocity by the
total time interval, one second, to get the acceleration. She then divides this by the
acceleration due to gravity, g, multiplies this by the woman’s mass, and adds this value to
the woman’s mass to find out her new apparent mass as measured by the scale. Her
answer is incorrect if it is assumed that the scale reads force, not mass. However, her
answer is correct if it is assumed that the scale reads mass. She then proceeds to calculate
the scale reading during the other time intervals mentioned in the problem.
Problem 3: Projectile Motion
After reading the question and viewing the animation, she rereads the question.
She immediately states that she will need to find “the horizontal and vertical
components,” presumably the components of velocity. She also states that she will need
to measure the maximum height and launch angle. She then measures the maximum
height as well as the initial x and y components of the velocity. To measure the initial
velocity in the x and y directions, she chooses a small interval and measure the change in
x and change in y. She then realizes that she can do this at the maximum height and use
the Pythagorean Theorem to calculate the speed at the maximum height. She thus
measures the change in x and the change in y during a small time interval where the
object reaches its maximum height. She then doubts this approach, but realizes that the
y-velocity should be zero at the maximum height and its speed is given by the x-velocity.
She then realizes that using the Pythagorean Theorem with both the x and y velocities

152
should give the same answer as just measuring the x-velocity. Then she proceeds to
verify her answer which is indeed correct.
3.4.6.6 Davidson Student 4
Problem 1: Average Velocity/Average Speed
She immediately states that she is going to find the average of the initial and final
velocities. Therefore, using small interval just after t=0, she finds the change in x and
uses this to calculate the initial velocity. Likewise, she measures the final velocity by
measuring the change in x for a small time interval near t=2. She then takes these two
values, adds them, and divides by two to get the average velocity. Her final answer is
incorrect.
In part (b), she defines the average speed in terms of the total distance traveled.
She then measures the total distance and time while the object travels to the right. She
the measures the total distance, from the origin, and the time that the object travels to the
left. However, she failed to take into account the distance that it backtracked over its
path while it moved to the left. As a result, her calculation for the total distance traveled
and the average speed were incorrect.
Problem 2: Newton’s Second Law
After reading the question, she immediately recognizes that she needs to calculate
the acceleration of the elevator. To do so, she finds its change in velocity over the

153
specified time interval. To measure the initial velocity, she calculated the change in
position of the elevator over a small time interval near t=0. She used the same method to
calculate the final velocity of the elevator near t=1. After calculating the acceleration,
she adds ma to the woman’s weight to correctly find the scale reading.
Problem 2: Projectile Motion
She immediately recognizes that the y-velocity of the projectile is zero at the
maximum height and she can just measure the x-velocity at that point. She then searches
for an equation to find the x-velocity. She uses “x = xo + vxot,” measures the position and
time of the projectile at the maximum height and calculates its initial x-velocity.
3.4.6.7 Solutions
The interpretation of students’ response often requires that we compare their thought
processes to some “correct” approach to solving the problems. Naturally, there is no one
way to solve the problems given to students in this experiment. However, there are a few
fundamental concepts that we expect students to verbalize if they get a question correct.
In addition, students who do not get a question correct because of their approach often
lack an understanding of these concepts. To facilitate the analysis, we defined the
seemingly fundamental concepts needed to solve each problem. These are shown in
Table 3.9. Correct answers are shown in Table 3.10.

154
Table 3.9: Description of concepts needed to solve the problems in Experiment 3.
Question Concepts
Average Velocity The average velocity of the object is the object’s total displacement divided by the time interval (2 s). To find the displacement, one can measure the initial position (t=0) and final position (t=2 s) of the object.
Average Speed
The average speed of the object is the total distance traveled by the object divided by the time interval. To find the total distance traveled, one can find the distance the object travels to the right and add this to the distance between this position and the final position.
Newton’s Second Law
The scale reading is the normal force of the scale on the woman. This is found by considering that the net force on the woman, ma where a is the acceleration of the elevator (and woman), is equal to the normal force of the scale on the woman minus the woman’s weight, mg. The acceleration of the elevator from t=0 to t=1 s can be calculated by considering the change in velocity of the elevator during that time interval or by considering some other kinematic equation derived from this definition.
Projectile Motion
At the maximum height, the projectile’s velocity in the y-direction is zero. Therefore, its speed is just the magnitude of its x-velocity. Since there is no force on the projectile in the x-direction, its velocity is constant. As a result, one can measure its velocity by considering its change in position over any time interval.
Table 3.10: Correct answers to the problems in Experiment 3.
Average Velocity Average Speed Newton’s
Second Law Projectile
Motion
-4.25 m/s 9.25 m/s 590 m/s 1.85 m/s
3.4.7 Findings
Table 3.11 shows the final results of students’ responses on all questions.

155
Table 3.11: Summary of responses to the questions in Experiment 3. “ X” marks those questions on which a student reported the correct answer.
Question Student Average
Velocity Average Speed Newton’s Second Law
Projectile Motion
NCSU Student 1 X X X
NCSU Student 2 X X X X
Davidson Student 1 X
Davidson Student 2 X
Davidson Student 3 X X Davidson Student 4 X X
Reviewing students’ responses (see Section 3.4.6) and comparing their problem
solving procedures with the ones shown in Table 3.9, we can make a number of general
observations as shown below.
A student may make certain measurements before knowing which measurements are
needed to solve the problem. This seems to be a way of redescribing the problem to
facilitate the development of a solution, a quality which is encouraged in many
recommended problem solving strategies. However, some students may focus on data
and how to plug data into the “right” equation without considering the problem
conceptually. Consider the projectile motion question and the response of NCSU Student
1:
Alright, I am looking for the speed as it reaches the maximum height as the projectile is launched. So we are just going to start it and watch the pretty ball bounce and step back to near the height to find out where the y component is at its greatest which seems to be at 1.4. So its y-velocity at that point is zero and the x velocity really hasn't changed. So you can actually just measure how long it goes for one second. Its x position is 1.908

156
meters so it moved 1.908 meters in one second so it would be, velocity would be 1.908 m/s.
Cueing off the phrase “maximum height” in the question, he immediately steps the
animation to where the projectile is at the maximum height and measures its y-position.
He then realizes that the y-velocity is zero of the projectile is zero and the x-velocity of
the projectile is constant throughout its motion. He then proceeds to measure its x-
velocity. Although he initially thought that he needed to measure the maximum height,
he returned to a conceptual approach and then recognized that he needed the x-velocity to
solve the problem.
Other students exhibit this same tendency to make measurements before
considering how to solve the problem. For instance, although Davidson Student 1 says,
“Ok speed equals distance over time at when it reaches its maximum height, velocity
will only be, or the speed of the thing will only be in the horizontal direction,” she
measures the initial coordinates of the projectile as well as the coordinates and time at its
maximum height. Then, she searches for an equation to solve the problem. In other
words, even though she stated a concept important to solving the problem at the
beginning, she doesn’t use the concept, but rather she collects data and then tries to
determine how to use the data to solve the problem. In the end, she is never able to
determine how to solve the problem.
Davidson Student 3 also collects data before determining how to solve the
problem. In her case, she draws a picture of the motion of the projectile on paper,
measures certain key positions such as the initial position, position at maximum height,

157
and final position, and labels these positions on her picture. Subsequently she searches
for a solution to the problem by looking for an equation in the book.
Davidson Student 3 first mentions that she will probably need the maximum
height of the projectile and its initial launch angle. After rethinking this, she measures
the maximum height of the projectile and its initial x and y velocities. She then says
…and so I have those and here I can find the speed. Here, I can find the velocity at the very tip-top using Pythagorean theorem, that's what I'm going to do. The speed when it reaches its maximum height, ok that's what I'm going to do. So, x velocity is going to be 1.01 minus .973, then divide by .02, equals, you get 1.85. The y velocity is 1.4 minus 1.399 divided by .02, and that is .05. So we have the x velocity and the y velocity, y being .05, x being 1.85. Should be able to find the speed.
She then realizes that she can use the same technique as she used to find the projectile’s
initial velocity to determine its speed at the maximum height. Later she states that the y-
velocity is zero at the maximum height, and thus the projectile’s speed is given by the x-
velocity. She uses this idea to check her first answer. In her case, it was after making
measurements that she figured out an approach to solving the problem.
On the other hand, NCSU Student 2 and Davidson Student 4 both recognize that
the y-velocity of the projectile is zero at the maximum height, and thus its speed is given
by the x-velocity, before taking any measurements.
Measuring data before determining a clear method to solve the problem is not
necessarily bad. As we saw in the above examples, sometimes it helped the student
formulate his or her ideas and eventually correctly solve the problem. Measuring data
was a way to redescribe the question in an effort to determine how to solve the problem.

158
However, some students may use the data to search for the right equation rather than to
conceptually analyze the problem.
Viewing the animation and making measurements may cause students to alter loosely-
held conceptual beliefs. Students may state an important concept in solving a problem
but not have the confidence to follow through with that concept. Making measurements
or viewing the animation may result in a student being confused and not knowing which
direction to take when solving a problem. In a number of the instances where an
incorrect approach was used to solve the problem, students stated a concept important for
the solution; however, they often did not follow through with this concept sometimes
after seeing the animation or taking measurements. A summary of the cases where this
occurred is shown in Table 3.12.
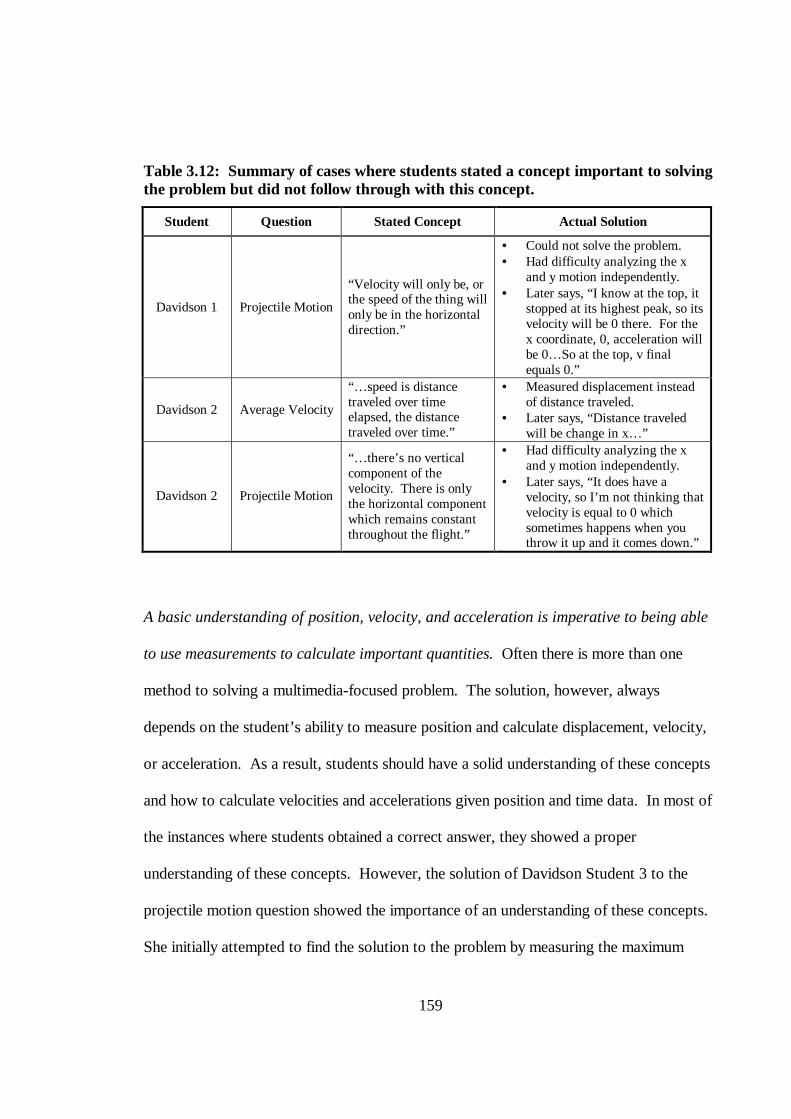
159
Table 3.12: Summary of cases where students stated a concept important to solving the problem but did not follow through with this concept.
Student Question Stated Concept Actual Solution
Davidson 1 Projectile Motion
“Velocity will only be, or the speed of the thing will only be in the horizontal direction.”
• Could not solve the problem. • Had difficulty analyzing the x
and y motion independently. • Later says, “ I know at the top, it
stopped at its highest peak, so its velocity will be 0 there. For the x coordinate, 0, acceleration will be 0…So at the top, v final equals 0.”
Davidson 2 Average Velocity
“…speed is distance traveled over time elapsed, the distance traveled over time.”
• Measured displacement instead of distance traveled.
• Later says, “Distance traveled will be change in x…”
Davidson 2 Projectile Motion
“…there’s no vertical component of the velocity. There is only the horizontal component which remains constant throughout the flight.”
• Had difficulty analyzing the x and y motion independently.
• Later says, “ It does have a velocity, so I’m not thinking that velocity is equal to 0 which sometimes happens when you throw it up and it comes down.”
A basic understanding of position, velocity, and acceleration is imperative to being able
to use measurements to calculate important quantities. Often there is more than one
method to solving a multimedia-focused problem. The solution, however, always
depends on the student’s ability to measure position and calculate displacement, velocity,
or acceleration. As a result, students should have a solid understanding of these concepts
and how to calculate velocities and accelerations given position and time data. In most of
the instances where students obtained a correct answer, they showed a proper
understanding of these concepts. However, the solution of Davidson Student 3 to the
projectile motion question showed the importance of an understanding of these concepts.
She initially attempted to find the solution to the problem by measuring the maximum

160
height and initial velocity of the projectile and using a kinematic equation. However, she
realized that she could simply find the velocity of the projectile at its maximum height by
measuring the y and x components of the velocity and calculating its velocity using the
Pythagorean Theorem. Later she realized that the y-velocity is zero at the top and thus
only needs the x-velocity, but she showed that she obtained the same answer either way.
Even though she did not realize this concept before taking data (which would have made
the solution simpler), her solid understanding of velocity and how to measure it given its
x and y components gave her the same result.
A student may incorrectly solve a problem because of conceptual difficulties. Like any
physics problem solving exercise, a proper conceptual understanding is fundamental to
being able to solve the problem. As a result, if one has ideas about physical phenomena
which are inconsistent with physical principles or if one does not understand the language
of physics and how physicists use that language to describe physical occurrences, then
one will have difficulty solving a multimedia-focused problem.
Consider, for example, students’ responses to the question about average velocity
and average speed. Those who did not correctly answer these questions sometimes did
not have a good understanding of the definitions of average velocity and average
speedaverage velocity being the ratio of the displacement to the time interval and
average speed being the ratio of the distance traveled to the time interval.
For instance, although NCSU Student 1 correctly solved for the average speed by
measuring the object’s speed to the right and the object’s speed to the left and taking a

161
weighted average by multiplying each of these speeds by their respective time intervals
and dividing by the total time interval, he incorrectly solved for the average velocity. He
could have used the same approach, this time using a negative velocity when the object
travels to the left, but he merely adds the two velocities together.
Davidson Student 3 also exhibits a difficulty with average velocity as a weighted
average. After noting that the velocity appears constant as the object travels the right, she
measures this velocity. She then find’s the object’s velocity while it is traveling to the
left. To do this, she finds its final velocity (-6 m/s) and its initial velocity (-15 m/) and
divides by 2. Although each of these measurements is correct, the final result is wrong
because the object travels at -6 m/s for a longer time (1 s) than it travels at -15 m/s (0.5 s).
This conceptual difficulty is also exhibited when she attempts to find the average velocity
over the entire time interval. She again adds the average velocity while the object travels
to the right to the average velocity while the object travels to the left and divides by 2.
An almost identical method of solution, with the identical conceptual difficulty, is
exhibited by Davidson Student 4.
Likewise, students’ conceptual difficulties also prevented them from obtaining
correct results (or any results at all) for the question about projectile motion. For
instance, those students who did not understand that motion in the x and y directions can
be considered separately or who did not know how to analyze the x and y motions
separately had the most trouble. For instance, Davidson Student 1 recognized that she
could “measure how fast it’s going as close to the final point as possible” and that

162
“distance has both x and y components” so she “would have to break it down into its x
and y components.” Yet, she stated that she didn’ t know how to do that.
When a student has a conceptual difficulty, he or she may make assumptions which are
inconsistent with the problem and animation. Davidson Student 2 also had difficulty
separating out the x and y motions and as a result exhibited the inconsistencies of mental
models. After searching for an equation to use to find the speed of the projectile at the
maximum height, she decides to use v = v0 + at. Rather than measuring v0, however, she
says that it is zero. This is really not consistent with either the question or animation.
She did not arrive at this assumption by any sort of physical argument or by viewing the
animation. Rather, we can assume that either she makes the assumption in order to make
the equation solvable using her present data or because she has done problems where a
projectile is dropped fired with a zero y-velocity and is solving this problem with the
same method. Either way, she is not really considering the solution conceptually.
3.4.8 Summary and Conclusions
Although students who participated in the interviews exhibited signs of both good
problem solving procedures as well as poor problem solving procedures, the most
striking observation is the importance of conceptual understanding to solving
multimedia-focused problems. Those who correctly answered questions had strong
conceptual understanding. Of those who incorrectly answered questions, some made
163
measurement errors or didn’ t completely answer the question, and others exhibited
conceptual difficulty.
The importance of conceptual understanding to solving multimedia-focused
problems has a number of repercussions. First, instructors who use multimedia-focused
problems should emphasize conceptual understanding along with problem solving.
Training students in good problem solving technique is simply not enough, teachers must
engage students conceptually. Weak conceptual understanding is easily thwarted by
other novice beliefs and approaches during the problem solving process. Even when a
student states a concept important to solving a problem, they may not follow through
with the concept if it is not deeply understood. In particular, understanding concepts of
displacement, velocity, and acceleration and how to calculate these quantities from
position and time data is necessary for solving multimedia-focused problems.
Finally, teachers must realize that novices may still exhibit novice-like approaches
when solving multimedia-focused problems. Although numbers are not given in the text
of the question, students may still make measurements and attempt to find the “right”
equation to use with their data. Students should be encouraged to use good problem
solving technique by considering how to solve the problem before making measurements.
However, taking data before knowing how to solve the problem may be a way to
redescribe the problem which facilitates its subsequent solution, a practice which should
also be encouraged. It is recommended then that students first consider the problem
qualitatively and then, if they do not know how to solve the problem, make

164
measurements for the purpose of redescribing the problem in a way that might help them
think about it conceptually.

165
4 Summary

166
Described in this dissertation is the development and investigation of a type of
physics problem solving exercise that includes multimedia such as video and animation.
While many studies build on previous research, the research described here is
fundamental in many respects. Consequently, the somewhat simplistic nature of the
research questions reflects this attribute. As a result, research into students’ performance
on these problems is truly foundational, giving rise to many additional research questions.
A review of novice problem solving practices in physics shows that students
typically proceed from the problem statement to a quantitative solution with little
conceptual or qualitative reasoning in between. In fact, students are often resistant to
drawing pictures during the problem solving process. One of the motivations for adding
multimedia such as video to a physics problem is for presentation. Perhaps seeing a time-
dependent picture of the motion, as in a video or animation, helps students visualize a
problem and therefore help them solve the problem. While this may be a noble task, it is
probably not the best use of multimedia in problem solving exercises. The reason is that
any positive effect due to increased visualization is probably not great enough to
overcome novice problem solving approaches, although this deserves further
investigation.
In Experiment 1, we looked at the influence of concurrent presentation of video
on students’ success at solving a problem. Of the seven problems used in the experiment,
we found that video had a significant effect on students’ ability to solve a problem in
three cases. In the other four cases, we could not make any definite conclusions. It
brought up some interesting questions that could be addressed in future research. First,

167
what qualities of a problem and video determine whether video will be helpful when used
for presentation? In other words, why was it found that video was “successful” in only
three of the seven cases? How we define “successful” is naturally arguable. For
instance, we looked at whether video influenced the probability for a student to achieve
the correct answer. We did not look at whether video improved students’ visualization of
a problem. It is possible that video influenced students’ visualization in all problems yet
did not influence their ability to get the correct answer in all problems. Second, did video
influence how long it took students to solve the problems? Perhaps viewing the video
helped those who solved the problem correctly to solve it more efficiently. It seems that
the answer to the second question is achievable while the answer to the first question is
extremely difficult.
I did not continue investigating multimedia used as presentation in physics
problems because I felt that it was not the best use of video and animation. Although
multimedia used in this way might be helpful, it may not have a great impact. As a
result, I desired to more intimately connect the video and animation with the problem by
requiring students to take data from the multimedia in order to solve the problem. In this
type of problem, numbers are not given in the text of the question, rather the student must
make measurements. Video and animation used in this way accomplishes a number of
important things.
First, it makes the multimedia necessary for solving the problem. Students cannot
solve the problem without first viewing the animation; whereas in multimedia-enhanced
exercises such as those in Experiment 1, students can proceed using the numbers given in

168
the text of the question and not viewing the video or animation. Survey responses in
Experiment 2 show that a prominent reason for students difficulty in solving multimedia-
focused problems is that numbers are not given in the text of the question, but rather
students have to determine what numbers are necessary to solve the problem. The fact
that the animation was necessary for solving the problem required an entirely different
problem solving approach to which the students had a large negative reaction.
Second, students must think qualitatively about the problem before proceeding.
Although the surveys supported what was found in Experiment 2namely that students
have great difficulty solving multimedia-focused problemsthe think-aloud interviews
illuminated the importance of solid conceptual understanding for successfully solving
these problems. For example, sometimes students would state a concept necessary for
solving the problem, yet not follow through with this concept in the solution. While
viewing the animation and making measurements, they often resorted to novice beliefs.
Because solid conceptual understanding is integral for successfully solving multimedia-
focused problems, this class of physics problems has great potential as a diagnostic tool
for measuring conceptual understanding.
Analysis of the interviews resulted in the following general observations:
A student may make certain measurements before knowing which measurements are needed to solve the problem. Viewing the animation and making measurements may cause students to alter loosely-held conceptual beliefs. A basic understanding of position, velocity, and acceleration is imperative to being able to use measurements to calculate important quantities.

169
A student may incorrectly solve a problem because of conceptual difficulties. When a student has a conceptual difficulty, he or she may make assumptions which are inconsistent with the question and animation.

170
5 Conclusion

171
In essence, the research described in Experiment 1 led to development of
multimedia-focused problems. Our initial assumption concerning multimedia-focused
problems is that they require a more expert-like problem solving strategy, and as a result,
they challenge novice approaches. Experiment 2 tested for one outcome of the previous
assumptionthat students would have more difficulty solving multimedia-focused
problems than similar traditional problems. It was found that this is indeed the case.
Evidence for our assumption was further found in Experiment 3 where we discovered the
importance of solid conceptual understanding to correctly solving multimedia-focused
problems.
Although we found evidence to support the assumption that multimedia-focused
problems require a more expert-like problem solving strategy, we do not know whether
long term use of multimedia-focused problems has a significant effect on students’
problem solving ability and conceptual understanding. Therefore, research should
continue into this issue. Immediate possibilities include analyzing students’ scores on
problem solving diagnostics tests such as the Mechanics Baseline Test and conceptual
diagnostics tests like the Force Concept Inventory. Other means of measuring problem
solving skills can also be used. For instance, we can look at how novices categorize
multimedia-focused problems, whether they focus on surface features or the method of
solution. This research will be important for substantiating or not substantiating the use
of multimedia-focused problem in teaching physics. Based on results from these
experiments, we believe that such research is worthwhile, and multimedia-focused
problems are extremely promising.

172
Not only should we study the use of multimedia-focused problems in teaching, we
should also pursue their use for conceptual and problem solving diagnostics. Because
good problem solving skills and solid conceptual understanding appear to be prerequisite
to successfully solving multimedia-focused problems, this class of problems may be
useful in diagnostics tests.
173
6 L iterature Cited Ausubel, D. P. (1968). Educational Psychology: A Cognitive View. New York: Holt, Rinehart and Winston. Beichner, R. (1997). The Impact of Video Motion Analysis on Kinematics Graph Interpretation Skills. American Journal of Physics, 64, 1272-1277. Beichner, R (1997). Personal conversation. Begle, E. G. (1979). Critical Variables in Mathematics Education. Washington, DC: Mathematical Association of America and National Council of Teachers of Mathematics. Bloom, B. (Ed.). (1956). Taxonomy of Educational Objectives. Handbook I: Cognitive Domain. New York: Longman. Bonham, S. Personal conversation; an article about the use of web-based testing systems and their uses for research is forthcoming. Bothun, G. D., & Kevan, S. D. (1996). Networked Physics in Undergraduate Instruction. Computers In Physics, 10, 318-325 Brown, J. (1983). Learning-by-doing revisited for electronic learning environments. In M. A. White (Ed.), The future of electronic learning (pp. 13−32). Hillsdale, NJ: Lawrence Erlbaum Associates. Chi, M. T. H., Feltovich, P. J., & Glaser, R. (1981). Categorization and representation of physics problems by experts and novices. Cognitive Science, 5, 121-152. Chi, M. T. H., Glaser, R., & Rees, E. (1983). Expertise in Problem Solving. In R. J. Sternberg (Ed.), Advances in the Psychology of Human Intelligence: Volume 1 (pp. 7-75). Hillsdale, NJ: Lawrence Erlbaum Associates. Christian, W., & Titus, A. (1998). Developing Web-Based Curricula Using Java Physlets. Computers in Physics, 12, 227-232. Czujko, R. (1997). The Physics Bachelors as a Passport to the Workplace: Recent Research Results. In E. F. Redish and J. S. Rigden (Eds.), CP399, The Changing Role of Physics Departments in Modern Universities: Proceedings of ICUPE. The American Institute of Physics 1-56396-698-0.

174
Di Vesta, F. (1987). The cognitive movement and education. In J. Glover and R. Royce (Eds.), Historical foundations of educational psychology (pp. 203-233). New York: Plenum Press. Dwyer, F. M. (1978). Strategies for improving visual learning: a handbook for the effective selection, design, and use of visualized materials. State College, PA: Learning Services. Ericsson, K. A., & Simon, H. A. (1993). Protocol Analysis: Verbal Reports as Data, Cambridge, Mass: MIT Press Gagné, R. M. (1985). The Conditions of Learning (4th ed.) New York: Holt, Rinehart, & Winston. Hale, M. E., Oakey, J. R., Shaw, E. L., & Burns, J. (1985) Using Computer Animation in Science Testing. Computers in the Schools, 2, 83-90. Halliday, D., Resnick, R., Walker, J. (1997). Fundamentals of Physics (5th ed.). New York: John Wiley & Sons. Heller, J. I., & Reif, F. (1984). Prescribing Problem-Solving Processes. Cognition and Instruction, 1, 177-216. Heller, P., Keith, R., & Anderson, S. (1992). Teaching problem solving through cooperative grouping. Part 1: Group versus individual problem solving. American Journal of Physics, 60, 627-636. Hestenes, D., Wells M., & Swackhamer, G. (1992). Force Concept Inventory. The Physics Teacher, 30, 141-158. Huntsberger, D., & Billingsley, P. (1973). Elements of Statistical Inference. Boston: Allyn and Bacon. Klein, D. (1987, November). Conditions affecting the effectiveness of animated and non-animated displays in computer-based instruction. Paper presented at the annual meeting of the Association for the Development of Computer-Based Instructional Systems. Larkin, J. H., & Reif, F. (1979). Understanding and teaching problem solving in physics. European Journal of Science Education, 1, 191-203. Larkin, J. H., McDermott J.,Simon, D. P., & Simon, H. A. (1980). Expert and Novice Performance in Solving Physics Problems. Science, 208, 1342-1355.

175
Larkin, J. H. (1981). Cognition of Learning Physics. American Journal of Physics, 49, 534-541. Leonard, W. J., Dufresne, R. J., & Mestre, J. P. (1996). Using qualitative problem-solving strategies to highlight the role of conceptual knowledge in solving problems. American Journal of Physics, 64, 1495-1503. Martin, L. (1997). Personal conversation. Martin, L., & Titus, A. (1997). WWWAssign. Raleigh, NC: North Carolina State University. Mayer, R. E., & Anderson, R. B. (1991). Animations need narrations: An experimental test of a dual-coding hypothesis. Journal of Educational Psychology, 83, 484-490. Mazur, E. (1997). Peer Instruction. Upper Saddle River, NJ: Prentice Hall. McDermott, L. C. (1990). Millikan Lecture 1990: What we teach and what is learned--Closing the Gap. American Journal Physics, 59, 301-315. Polya, G. (1973) How to Solve It. New York: Doubleday. Redish, E. F. (1994). Implications of cognitive studies for teaching physics. American Journal of Physics, 62, 796-803. Reed, S. (1985). Effect of computer graphics on improving estimates to algebra word problems. Journal of Educational Psychology, 77(3), 285-298. Reif, F., Larkin J. H., & Brackett, G. C. (1976). Teaching general learning and problem solving skills. American Journal of Physics, 44, 212-217. Reif, F, & Heller, J. I. (1982). Knowledge Structures and Problem Solving in Physics. Educational Psychologist, 17, 102-127. Rieber, L. P. (1989). The effects of computer animated elaboration strategies and practice on factual and application learning in an elementary lesson. Journal of Educational Computing Research, 5, 431-444. Rieber, L. P. (1991). Effects of visual grouping strategies of computer animated presentations o selective attention in science. Educational Technology Research and Development, 39, (4), 5-15. Rieber, L. P. (1994). Computers, Graphics, & Learning. Dubuque, Iowa: Brown & Benchmark.

176
Rosdil, D. (1996). What Are Masters Doing? Master’s Degree Recipients with Physics Training in the Workforce: The Impact of Highest Degree Field and Employment Sector on Career Outcomes. AIP Pub No. R-398.1, College Park, Maryland: American Institute of Physics. Rosdil, D. (1997). Physicists in Government: The Impact of Institutional Setting and Degree Level on Career Outcomes, A Report from the Sigma Pi Sigma Survey. AIP Pub No. R-398.2, College Park, Maryland: American Institute of Physics. Russo, J. E., Johnson, E. J., & Stephens, D. L. (1989). The validity of verbal protocols. Memory & Cognition, 17, 759-769. Schoenfeld, A. H. (1985). Mathematical Problem Solving. Orlando, Florida: Academic Press. Shapiro, M. A. (1994). Think-Aloud and Thought-List Procedures in Investigating Mental Processes. In Annie Lang (Ed.), Measuring Psychological Responses to Media (pp. 1-14). Hillsdale, NJ: Lawrence Erlbaum Associates. Simon, D. P., & Simon, H. A. (1978). Individual Differences in Solving Physics Problems. In R. Siegler (Ed.), Children's Thinking: What Develops? (pp. 325-348). Hillsdale NJ: Lawrence Erlbaum Associates} Strauss, A, & Corbin, J. (1990). Basics of Qualitative Research: Grounded Theory Procedures and Techniques. Newbury Park, CA: Sage Publications. Thomas, E. W., Marr, J., & Walker, N. (1995). Enhancement of Intuitive Reasoning Through Precision Teaching and Simulations. Proceedings of the Conference on Frontiers in Education. 3c3.10-3c3.13. Titus, A., Martin, L., Beichner, R. (1998). Web-based Testing in Physics Education: Methods and Opportunities. Computers in Physics, 12, 117-123. Whetzel, J. K. (1996, March/April) Integrating the World Wide Web and Database Technology. AT&T Technical Journal. 38-46. Van Heuvelen, A. (1991a). Learning to think like a physicist: A review of research-based instructional strategies. American Journal of Physics, 59, 891-897. Van Heuvelen, A. (1991b). Overview, case study physics. American Journal of Physics, 59, 898-907.

177
Vernier Software. (1988). Millikan Oil Drop Experiment (MS-DOS Version). Portland, OR: Vernier Software. Zollman, D, & Fuller, R. (1994). Teaching and Learning Physics with Interactive Video. Physics Today, 47, 41-47.

178
7 Appendices

179
7.1 Appendix 1: Pilot Study Survey
PY205 WWW Survey Summer Session I
M ay 21, 1996 Instructions: Please answer all questions. Some questions allow for multiple responses
where indicated. It should take less than 10 minutes to respond to all questions. Thank you for your time because your input is valuable.
1. Do you have a computer at home? [ ] Yes [ ] No
If yes, please circle all that apply to you:
What kind of computer do you have? a. 386 IBM Compatible b. 486 IBM Compatible c. Pentium IBM Compatible d. Macintosh 68000 series e. PowerMac f. Other _________________
What speed modem do you have? a. none b. 9600 bps c. 14,400 bps d. 28,800 bps e. Other _________________

180
2. Have you used the World Wide Web (WWW)? [ ] Yes [ ] No If yes, please circle all that apply to you:
How many hours per week on average do you
access the WWW? a. Less than 1 hour b. Between 2 and 5 hours c. Between 5 and 10 hours d. More than 10 hours e. Other _________________
For what purpose do you use the WWW? a. Class information or assignments b. University information c. Entertainment d. News and other information e. Downloading software f. Other _________________
From where do you prefer to access the WWW? a. Home b. University c. Work d. Other _________________
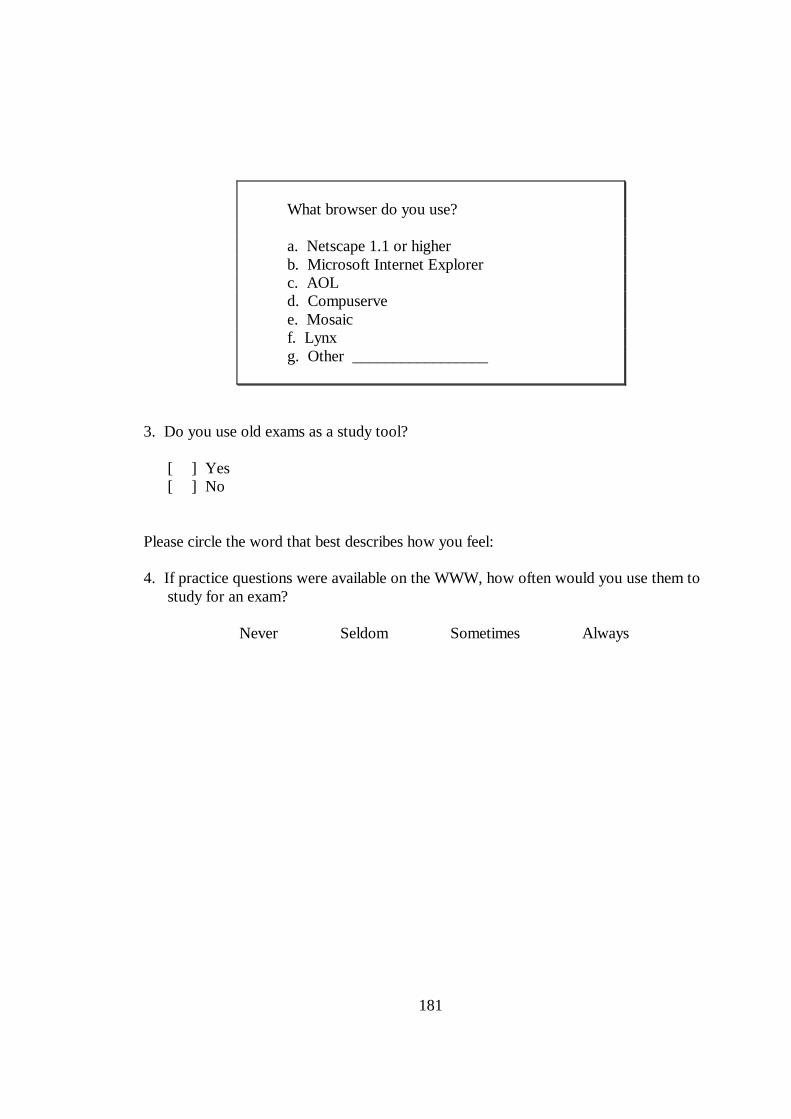
181
What browser do you use? a. Netscape 1.1 or higher b. Microsoft Internet Explorer c. AOL d. Compuserve e. Mosaic f. Lynx g. Other _________________
3. Do you use old exams as a study tool? [ ] Yes [ ] No Please circle the word that best describes how you feel: 4. If practice questions were available on the WWW, how often would you use them to
study for an exam? Never Seldom Sometimes Always

182
Please circle the number indicating your preference: 5. To what degree would you like to see your classes utilize the WWW?
Rating 1
(lowest)
2
3
4
(highest)
Example
none
distribute information
include interactive exercises
such as on-line quizzes and practice
problems
incorporate on-line textbook
and class communication
Please circle your preference: 6. If you had to choose between a traditional quiz in the classroom and a computerized
quiz which you could take on the WWW, which would you prefer? Traditional quiz Computerized quiz

183
7.2 Appendix 2: Experiment 1 Assignments
The three assignments given to the treatment groupcovering relative motion,
collisions, and oscillationscontained a hyperlink which allowed the student to
download and view the video. The control group’s assignments contained inline images.
The assignments and associated video are shown below with the exceptions of video and
images for the relative motion assignments. These are not owned by the author, and the
author does not have permission to show them.
7.2.1 Treatment

184
Figure 7.1: Relative motion questions given to the treatment group in Experiment 1.
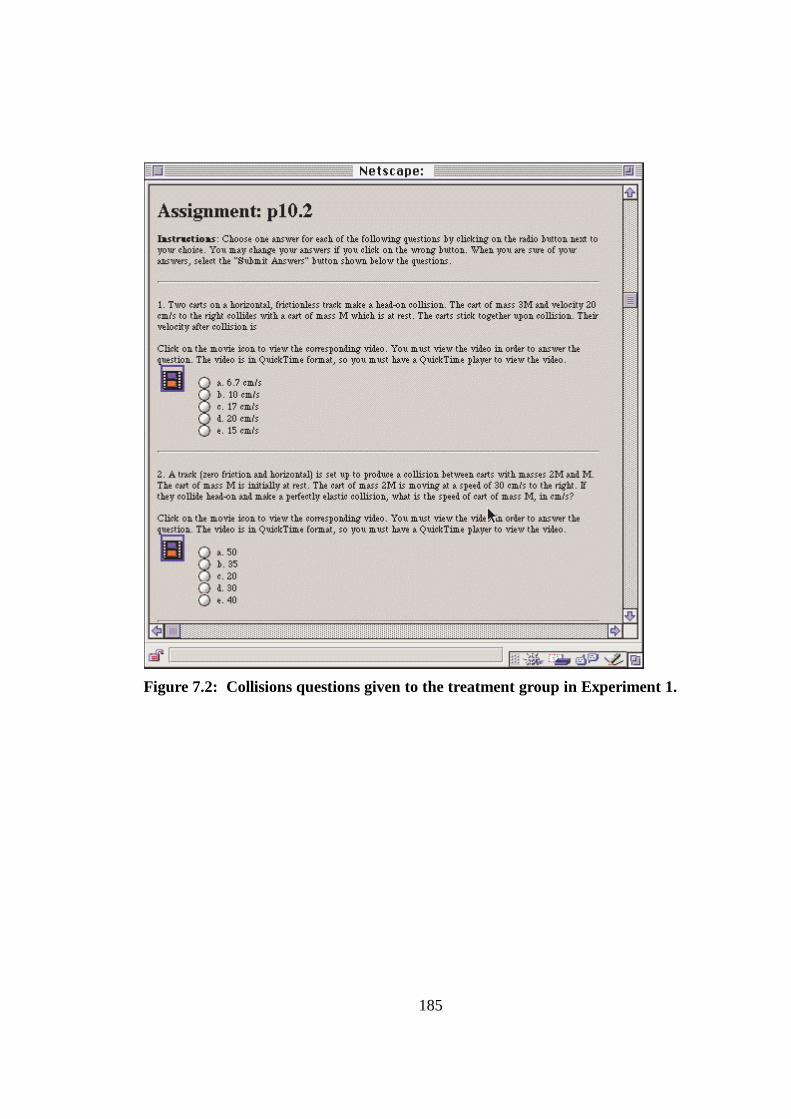
185
Figure 7.2: Collisions questions given to the treatment group in Experiment 1.

186
(a)
(b)
Figure 7.3: (a) Video clip corresponding to the first question in Figure 7.2. (b) Video clip corresponding to the second question in Figure 7.2.

187
Figure 7.4: Oscillations questions given to the treatment group in Experiment 1.

188
(a)
(b)
Figure 7.5: (a) Video clip corresponding to the first and second questions in Figure 7.4. (b) Video clip corresponding to the second question in Figure 7.4
7.2.2 Control
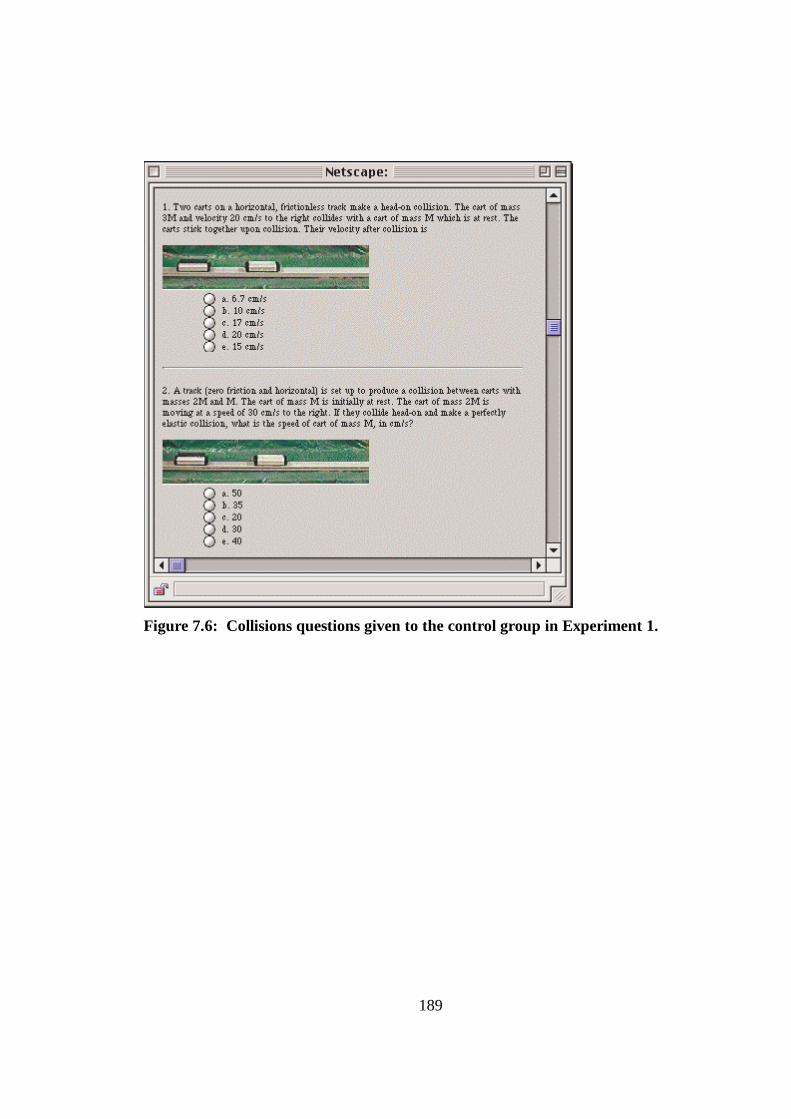
189
Figure 7.6: Collisions questions given to the control group in Experiment 1.

190
Figure 7.7 Oscillations questions, 1 & 2, given to the control group in Experiment 1.
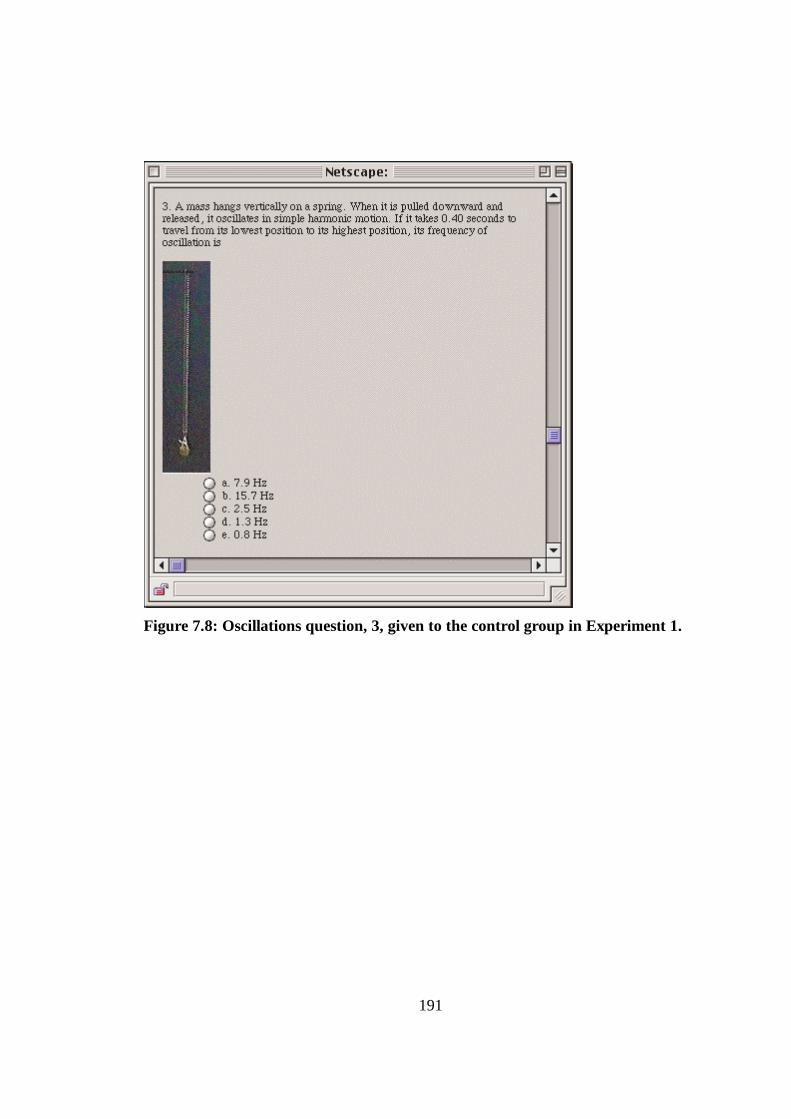
191
Figure 7.8: Oscillations question, 3, given to the control group in Experiment 1.

192
Figure 7.9: Relative motion questions given to the control group in Experiment 1 (actual images given to students are not shown in this figure).

193
7.3 Appendix 3: Experiment 1 Survey Responses
Survey responses and how they were encoded are shown below. The categories are
shown in italics, and a list of responses encoded for each category are shown beneath
each category.
1. Helped visualize question, made question easier to interpret It helped me visualize the problems. A visual example can only help. Seeing what the question is asking makes it easier to answer. it gave me a visual of what was happening It gave me a clearer picture of what was going on in the problem. The video gave a picture of what was going on and was usually very important to me in answering the problem. It helped me visualize the material It enabled me to actually see the situation that was being described or analyzed. It helped me on tests to remember the video and actually picture the situation. It helped to see what was going on in the problem. It provided a vivid example of what the problem was asking or explaining. As before stated, it helped to visualize the problem, giving me a better idea of what was occuring. more visual and easier to figure out the problem and much better than imagination (some time it's not correct) It aided in understanding how the problem was set up. It gave a type of picture of what is going on. IT MADE THE PROBLEMS EASIER TO UNDERSTAND. The video helped me understand what exactly the problem was saying. helped explain the problem

194
You can see exactly what the problem is talking about. It helped me to understand the problem, by allowing me to visualize it. This was especially true in doing the problems dealing with relative motion. It helped to give a clear picture of exactly what was going on. You get to see what is happening. helps visualization The picture helped convey the total idea of the problem to me. It helped to understand the problem It helped explain the question/material. Helped me form a visual picture of what was happening to better understand the problems. I could see what the object was supposed to be doing and not just guess. It clarified what I was thinking Gave a better understanding of the question It gave me a better grasp of the situation Visual examples are always more easily understood than just reading a question out of a book There were good graphical representations that aided the student in visualizing what was going on It is always good to have a picture in mind when trying to work a problem
2. helped me remember or understand concepts
It enabled me to actually see the situation that was being described or analyzed. It helped me on tests to remember the video and actually picture the situation. Like the class demos, the videos illustrated the principles being studied. The video allowed you to see the concept in motion . Well, for me it helped with the elastic and inelastic collisions. Because I kept mixing them up. It helped my understanding.

195
The video material also brought the physics concepts to life, strengthening my conncection to the material and thus improving my retention of it. It helped explain the question/material. It clarified what I was thinking It helped you to think about a picture logically and see the physics applied
3. Helped because I'm a visual learner; I like visual aids I like visual aids sometimes, I'm a visual learner. some of us learn more with the aid of visual aids Visual stimuli is always useful just like aids in class
4. Should have been used more often.
The pictures were useful, but they should've been used more often
-1. Took too long to download; too much time to solve problems.
The videos were helpful sometimes, however sometimes it took to long to download or the videos were not clear. Sometimes. It wasn't totally hel[ful, because it didn't do much more than the words. Better than nothing though. Sometimes it took a long time for the picture to show up it took too much time The videos were a little choppy, but that will improve as technology improves. THe only annoying thing was that the assignment took longer to load when video clips were on there. Usually it takes long time to download. Too long for the computer to find it
-2. Video was not necessary to solve the problem.
I am a numbers person, i need to see the numbers and fit them into an equation, by showing me a video it did absolutely nothing to help me learn physics, pictures don;'t either.

196
Sometimes. It wasn't totally hel[ful, because it didn't do much more than the words. Better than nothing though. Sometimes it took a long time for the picture to show up Most of the time the image was so small that it didn't really help in getting the point accross. The questions were worded pretty clear so I didn't need a visual image. i could generally do the problems without the video. A still picture would've been as effective. Word descriptions were sufficient Somewhat, most questions were already clearly stated and described. The question was usually explanatory enough It seemed a gratuitous use of technology, it restated the question I generally had a good idea about scenario from the question
-3. Video was not clear. The videos were helpful sometimes, however sometimes it took to long to download or the videos were not clear. The videos were a little choppy, but that will improve as technology improves. THe only annoying thing was that the assignment took longer to load when video clips were on there. Most of the time the image was so small that it didn't really help in getting the point accross. The questions were worded pretty clear so I didn't need a visual image.
-4. Technological problems; could not play video.
i was never able to view a video because the computer was screwed up Didn't work.
-5. I'm not a visual learner.
I'm not a visual learner.
-6. Videos were not good.
The videos were not that great.
-7. Made problem more difficult or seem more difficult.

197
Sometimes, looking at the the video made the questions look harder, than they really were.
u. Unclear; uncategorizable.
Sometimes, unless I was just going there to do the homework without taking my time to work the problems

198
7.4 Appendix 4: Experiment 2 Assignments
7.4.1 Treatment Group
Figure 7.10: Work-K inetic Energy [1].

199
Figure 7.11: Work-K inetic Energy [2].

200
Figure 7.12: Conservation of Energy [1].
Figure 7.13: Conservation of Energy [2].

201
Figure 7.14: Collisions [1].

202
Figure 7.15: Collisions [2].
Figure 7.16: Rotation [1].

203
Figure 7.17: Rotation [2].
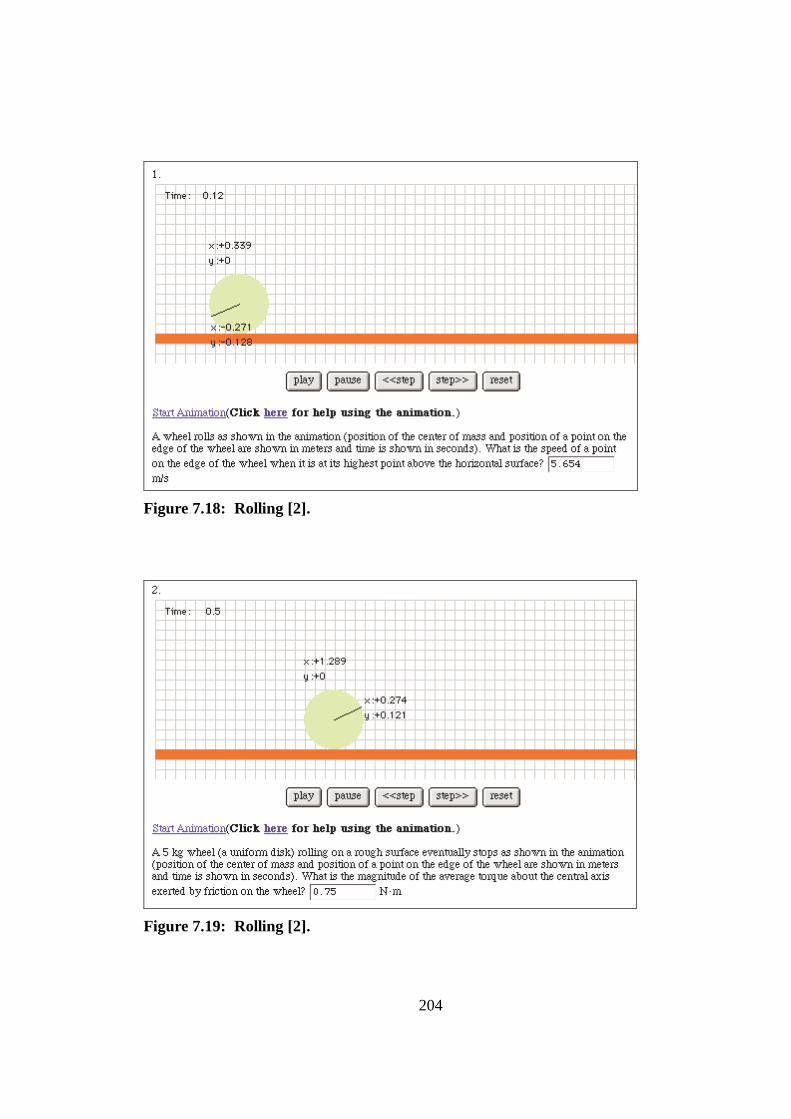
204
Figure 7.18: Rolling [2].
Figure 7.19: Rolling [2].
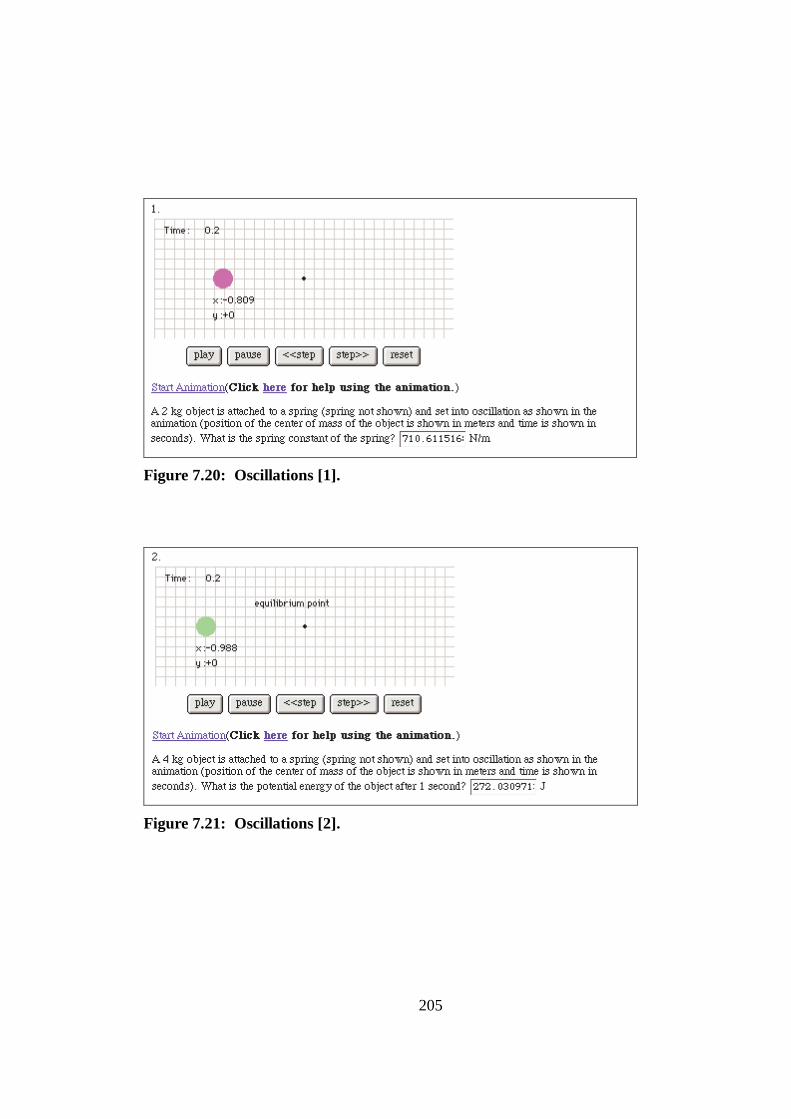
205
Figure 7.20: Oscillations [1].
Figure 7.21: Oscillations [2].

206
7.4.2 Control Group
Figure 7.22: Work-K inetic Energy.
Figure 7.23: Conservation of Energy.
Figure 7.24: Collisions.
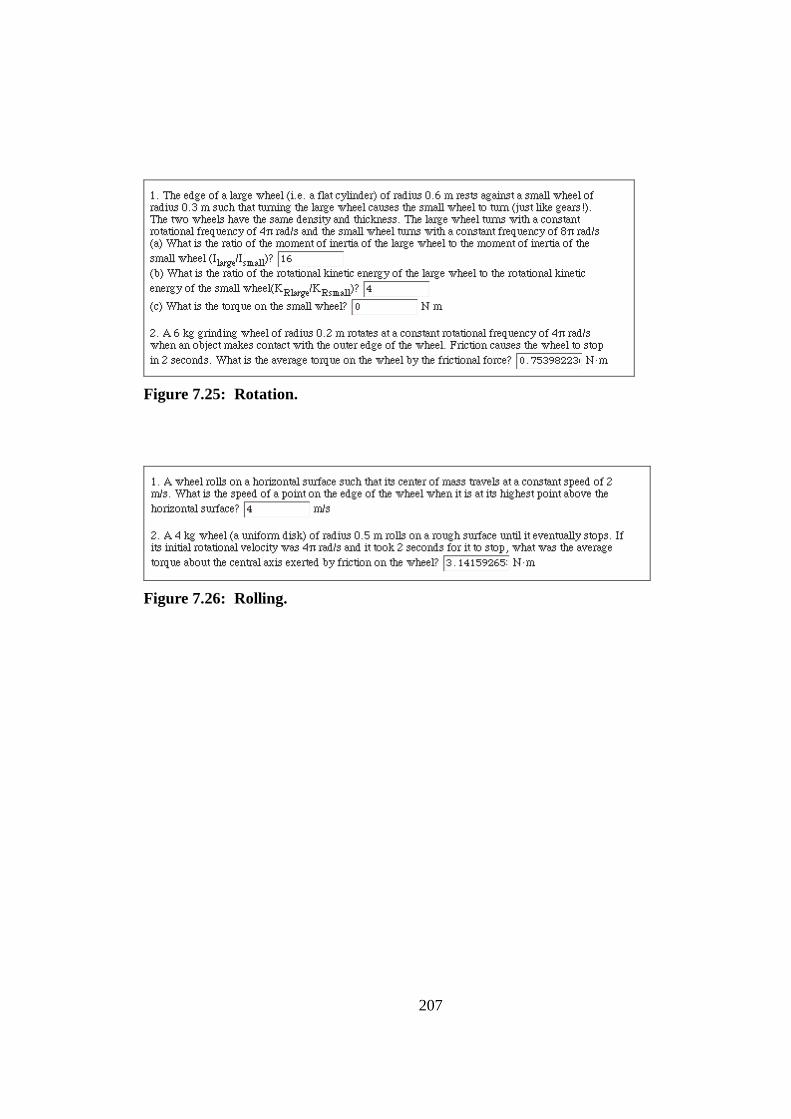
207
Figure 7.25: Rotation.
Figure 7.26: Rolling.

208
7.5 Appendix 5: Experiment 2 Survey
Figure 7.27: Survey questions 1 through 3 given to students in Experiment 2.

209
Figure 7.28: Survey questions 4 through 5 given to students in Experiment 2.
7.6 Appendix 6: Experiment 2 Survey ResponsesNCSU
7.6.1 Question 1a
Table 7.1: Responses to Question 1a (N=342).
Are homework questions with animations more difficult than other homework questions?
Always 57%
Usually 37%
Rarely 5%
Never 1%

210
7.6.2 Question 1b
Responses to question 1b are shown below. Categories are shown italics, and
below each category are the responses encoded for that category.
1. Not given numbers; having to determine which measurements to make; finding the appropriate information and determining which points are needed to solve a problem; seemingly insufficient information; have to use the animation to get data.
Because we are not just given numbers to play with in the calculatlor or put in a formula when you have an animation you got to figure out what numbers to use. I guess thats good for us, helping us to understand problems closer to real life situations. they are sometimes diffucult to tell the time and what information is actuallly given to you The problems deal with the basic principles of physics. Most of the time they involve plug and chug. You just have to know what formula to use Because dealing with the java applet is a pain. The objects never increments very well in the animations. Also, it is like doing a simple physics lab which makes the student try to decide for him/her self what the best approach is. Unlike regular problems that you can check with the book. Because sometimes they are not labeled and you have to go and click on them to see where they start and also where they end to get, say the velocity, whereas in normal problems this info would be given to you. one first has to aquire the data before even beginning the problem They make you collect the data whereas in the regular questions the data is supplied to you. They also can sometimes be intimidating. They are more difficult because the answers have to be computed from the information in the animation, and sometimes the animations are hard to figure out. because you have to sit there and play the thing back and forth until you know which points to use for your calculations. also the animation never stops on the points exactly. it always skips over them and you can never get it onto the right points These questions are more difficult because the information neded to solve thge problem is not given in numbers. The animations do not clearly provide them all the time. The is a margin for error when picking the numbers fromn the animations. The information seems harder to obtain and it is often unclear as to what the question is actually asking. Also, there is no example to check the answer as there is in the book.

211
because nothing is given You have to be able to read and understand the plots I sometimes have trouble reading the graphs or trying to figure out where I need to be reading the graphs. It maked it really hard when you can't get past the first step. it is hard to see what is actually going on in the picture and it is also hard to derive the informaton needed it's difficult to determine enough information to solve the problem just using the animation, especially if you need velocity Impossible to get the information needed to solve the problem b/c they involve more hands on approach rather than the usual word problem thatgives you the boundries and criteria you have to find out every part It becomes tedious to gather all the required information necessary. The same effect could be given by just giving us a word problem that states the same information that can be obtained from the animation but still require us to filter out what is necessary and what is not. Well, you are not given all the information, so you have to decide which information to gather from the animation and then use what you find out to help solve the problem. Many times, especially at the beginning of the semester, I felt that I wasn't given enough information to answer the questions. Sometimes, I thought we needed to find info, such as acceleration, which was difficult (it seemed impossible to me) to find just from the animations. It was also difficult to use the grid to determine info since it was so small and the origins and other important parts were not marked. Things did become easier later in the semester when the location of the particle, velocities, etc. were displayed on the grid. Because the questions cause you to count the distances and the rates of change as opposed to giving the questions in a direct manner. I can never figure out what numbers to use, somehow I always get them wrong it is almost impossible to figure out what information is given to figure out the problem. The animations are terrible and the way to derive info. from the problem is nearly imposible. They are harder because you have to get all the information that you need from the animated screen. They are more difficult because you do not have the numbers right in front of you. Instead they are in the form of the objects moving, and it is hard to get the real numbers. The animations are hard to understand and it doesn't give all the information needed to answer the question. because it is harder to tell what the givens are

212
It is too hard to understand the information given more difficult to apply the inforamtion to the equations In the regular problems the data is given and in the animations the data must be extracted from the movement of an object. Usually, I would just pick a point in which some value was either zero or one. This helped me. Another disadvantage is that rounding errors may occur with a varying number of significant figures. The interpretation of the data is left to the individual. Sometimes students, especially those who use ResNet to do their homework, have trouble running the animations properly to get the appropiate data. Some instruction on how to use the animation software would be useful for those in this predicament. Some the numerical information in the animations are hard to see. They require more time, and depend on analization of the animation rather that values like the regular homework. For example, most of the time you have to figure out the acceleration and velocity in the animations by steping through them and measuring the distance over time. I never really understand how to figure out the information that I need to solve the problem. The questions are not very clearly worded and are usually confusing. It is very hard to understand exactly what needs to be done and the manner in which it needs to be done. Plus, whenever you do understand something it takes a while to get the right answer. It is hard to read the graph for exactly what the question wants. There is little help on the help page for how to respond. It deals more with how to play and reset it. I find the animation very vauge. You don't know where to start and stop the ball. It takes longer to figure out what data is needed and how to solve each problem. Also, you have to use the animation on campus computers making it less convenient than the other homework assignments. It's more difficult to observe velocity, acceleration, etc, and then calculate other properties of the animation from your observations. You have to gather the information on your own and then apply it. Where as the information in other homework has the info for you. Its difficult to determine the necessary data. the animation itself is what makes the questions difficult. though it is not hard to start the animation, stop it, rewind it, etc., all these actions are necessary (repeatedly) to get the information needed. The animations are hard to understand and follow. Giving the animation as a visual is great but making it so we have to get every piece of info from the pictures is complicated because you have to count how many squares something moves and divide it by the length of time it took to find its velocity because the thing never works right! You can only get it from the computers on campus, and the animations are never easily understood what is needed. It is harder to find out the numbers to work with.
213
you must figure out all the variables Sometimes it is hard to interpret the animations because you can't tell what information is given and what information is necessary to solve the problem. Also, you can't check your answers like most of the other problems and you don't know how to go about solving them sometimes. This is because Animation doesn't give enough information needed to solve a problem (unlike non-Animation part). I find the ordinary parts much easier than animation. because the problem usually does not given much data. Before we can solve the problem we must find the data by using the inimation which is hard to use Because you have to obtain information from the animation that is normally given. Animation is more difficult because in addition to solving the problem you may have to determine time, displacement, velocity, etc... by viewing, whereas in a standard problem that information has to be given. Also, since you are not given all the pieces of information needed to work the problem (you have to get information from viewing) it is difficult to know what you are looking for, i.e. what you need to be able to solve the problem. You have to obtain data, it is not merely given to you for plug n' chug. This is sometimes difficult. Also, it is harder to define what method/formulas you will be utilizing in the problem. I usually have no clue on what i need to solve the problem. I don't know when to stop the animation and when is enough. I find the problems are harder to understand because I can't obtain the correct data from the animations. The pictures are so general, I'm not sure what to look for. It was challenging at first to figure out which points you needed to take measurements at to obtain accurate data for the problem. The determination of the way in which the animations are read is the hardest part. It is hard to make out what the question is asking for and how to get that from the little information that is given.
3. Not having worked examples either with an answer key, textbook, or explicit instruction; not having prior experience solving these problems; animation question is different.
You can not check your answers with a source like you can with the problems that come out of the book. The animations were by far my worst homework scores. Because you cannot look up stuff in the book to answer the questions. Very obscure and no way to check yourself. Not shown a good method in class to use when working them Because dealing with the java applet is a pain. The objects never increments very well in the animations. Also, it is like doing a simple physics lab which makes the student try to

214
decide for him/her self what the best approach is. Unlike regular problems that you can check with the book. It is difficult to understand how you are supposed to use the animations to answer the questions. no examples of how to do it it's different, plus i'm still don't understand the animations fully. The information seems harder to obtain and it is often unclear as to what the question is actually asking. Also, there is no example to check the answer as there is in the book. you don't have an example in the book Because the animations are very hard to understand and they do not always work correctly which poses a problem when it is time to complete the question. And also their is not enough examples in showing how to go about doing the problems with animation. Other questions have the book questions and answers to go along with. you don't have a reference to go by in the book. half the time the animations don't work There are no book examples you can refer to. They are generally hard to follow and really that is the first time that we hane practical use with actual objects and not just theoretical difficult to extract exact data, no prototype questions to refer to as in the book questions, sometimes difficult to tell which section it may be from, and answers still must be very precise despite measurement error determining some of the numbers at different stations were difficult. the problems were just different then anything in the book. Sometimes it is hard to interpret the animations because you can't tell what information is given and what information is necessary to solve the problem. Also, you can't check your answers like most of the other problems and you don't know how to go about solving them sometimes. Animation is less exact. Also not having anyone to ask specific questions makes it more frustrating. Also it was hard to understand what was being asked. i think bc it is a different format. Because you are never sure if you are doing the problem the correct way. There are no examples to follow. Also it is hard to figure out what the problem is asking. Sometimes I don't understand what the demonstration has to do with what the question is asking. I hate those animation questions. Often it is hard to count or to tell the exact number or measurement that is needed. They are different than any examples in the book.
4. Confusing; hard to understand; hard to figure out; not clearly worded; hard to interpret; hard to decipher.

215
too many variables to look at and the animations were always hard to figure out. i didn't get any right when i always got the other things right. Very obscure and no way to check yourself. Not shown a good method in class to use when working them the animation never works right and is diffculit to understand what it wants. It mostly a matter of guessing The animations are just so hard to follow. A lot of the times they are also inaccurate. When my study partners have the same question in regular format it is so easy to figure out. I try to work my animation problem the same way but it never works. It is difficult to understand how you are supposed to use the animations to answer the questions. it's different, plus i'm still don't understand the animations fully. graphs are hard to understand They are more difficult because the answers have to be computed from the information in the animation, and sometimes the animations are hard to figure out. it is often difficult to understand and get data from animation Because there is no explaination to how the animation is related to the problem given. The information seems harder to obtain and it is often unclear as to what the question is actually asking. Also, there is no example to check the answer as there is in the book. to much difficulty getting it to work and to understand it. The animations were hard to understand. They were not as direct as the HW questions and harder to get the data. Because the scales are so small and it is unclear to what x-coordinate or y-coordinate to use in figuring the answer. It was unclear of how the movement of the animation related to how to figure out the answer. getting the animations to work and then understanding them could at times be frustrating First, it was sometimes difficult to run the animations in the first place. If I did get it running it was sometimes confusing to understand. Just did not like them. The questions are clear but you can't do the problem unless you can get the data. This is the difficult part. The animations are difficult to understand and obtain data from, and if you don't understand how to work the animations and obtain the data, then you can't do the problem. it is hard to understand what the question is asking and where the info. is coming from they don't always work very well, so they can make the problem confusing difficult to understand what exactly the question is asking to solve. Because the animations are very hard to understand and they do not always work correctly which poses a problem when it is time to complete the question. And also their is not enough examples in showing how to go about doing the problems with animation. It's very difficult to estimate positions with crosshairs. Even with that problem fixed,

216
sometimes the numbers given for positions don't work out when you use them. In addition, the wording of the questions is confusing. The animations are hard to understand and it doesn't give all the information needed to answer the question. There is not sufficient explanation included with animation problems. So you have to waste alot of time just figuring out what they want, and then do the calculations and whatever. I never really understand how to figure out the information that I need to solve the problem. The questions are not very clearly worded and are usually confusing. they are confusing the questions are generally more difficult to desifer what is being asked. because i never understand the animations, and when i do, i still can't get an answer that the computer agrees with Vague Explinations of what to do. They are hard to follow and are to vague. The questions involve animations that are hard to read and understand...the animations are not helpful in our understanding of physics... I find the animation very vauge. You don't know where to start and stop the ball. I do not understand the questions on the animation questions. They are also hard to figure out according to the picture The animations are really nice. They are more difficule because the appear to be more confusing that word problems. It appears that each animation is well organized. The animations are poor in explaining what needs to be done. The questions are relavent, just hard to interpret. the animation is hard to understand and use. The animations are usually hard to understand. The animation are hard to fiqure out and it is difficult to get the correct needed data. They are generally hard to follow and really that is the first time that we hane practical use with actual objects and not just theoretical questions are vague The animations were hard to interpret. You couldn't always get the exact amount in which the correct answer came from. Because the animations were confusing They were so hard to follow and understand. They were unrealistic and no matter how hard I tried I could never get one right. There should be a larger room for error when dealing with these animation problems. The animations are hard to understand and follow. Giving the animation as a visual is great but making it so we have to get every piece of info from the pictures is complicated they are harder to understand. the pictures are often hard to follow and there is a lot of room for error based solely on misinterpretation of the graphics. also, it is often hard to get the animations to step in the desired increments and stop where you want them to.
217
1. Because it is oftentimes difficult to understand what the question is asking you to do. 2. It's also unclear what some of the numbers are, at exact momments in the animation. 3. You have to be sitting in front of the screeen to do the assignment. You can't print it out and take it somewhere to get help with it. Because they are hard to figure out I do not understand how to read the animation These questions are a little harder to understand and to know where to begin. The animations are tedious to understand, much less calculate correct answers. Many cases I know I've done the math right, but still it doesn't mark correctly. I don't know if it is just picky with sig figs or what. In all, I may have got one out of the many animations correct as opposed to the regular questions. Animation is less exact. Also not having anyone to ask specific questions makes it more frustrating. Also it was hard to understand what was being asked. because we can never get the accurate result ... confusing. The animations just seem more confusing. The controls are awkward when you're trying to use them in order to get information from the actual animation. Because the people who set up the animation questions word them horribly and you usually end up guessing at what kind of question they are asking. Because you are never sure if you are doing the problem the correct way. There are no examples to follow. Also it is hard to figure out what the problem is asking. Sometimes I don't understand what the demonstration has to do with what the question is asking. I hate those animation questions. Sometimes the animations are hard to decipher. They are more confusing. It doesn't say exactly what it is looking for as an answer. The questions are not straightforward - they are sometimes more difficult to understand. The animation problems are always harder worded to match up with the animation. There is always the estmation requried to do the problem. The determination of the way in which the animations are read is the hardest part. It is hard to make out what the question is asking for and how to get that from the little information that is given. It is hard to decifer exactly what the readings should be when stopping the moving balls. What is expected as input values is vague. The animations are often hard to follow. For example, when position is the y-axis and time is the x-axis, the x-axis did not agree with the time given by the clock at the top of the animation. It was very confusing.
5. Couldn't get animation to work; inconsistency of animation the animation never works right and is diffculit to understand what it wants. It mostly a matter of guessing

218
I can never get the animation to work properly. they never work right Sometimes when you go back, the animations change. to much difficulty getting it to work and to understand it. most of the time is because either the animation dose not work or it gives you a diffrent answer every time you try again. for regular homework problems, i can use my home computer. for animation homeworks i have to go to a lab on campus to get the animation to work, and even then, the animation doesn't always work. getting the animations to work and then understanding them could at times be frustrating First, it was sometimes difficult to run the animations in the first place. If I did get it running it was sometimes confusing to understand. Just did not like them. they don't always work very well, so they can make the problem confusing Because the animations are very hard to understand and they do not always work correctly which poses a problem when it is time to complete the question. And also their is not enough examples in showing how to go about doing the problems with animation. Half the time the animation messes up and it is always hard to get the correct coordinates and data. Animations do not work, take longer to load, sometimes distractions I couldnt ever get the animations to work. I sat at my computer for at least 30 min one night trying to get the thing to work and I couldn't figure it out. I read the directions several times. you don't have a reference to go by in the book. half the time the animations don't work Because most of the time you cannot get the animations to work, and they are also confusing on the instructions. they didn't seem to work most of the time, or maybe it was just my computer that they didn't like. When they did work, the information needed for working the problem was difficult to extract from the animations. It is hard to interpret the graphs and sometimes the animations don't work. because the thing never works right! You can only get it from the computers on campus, and the animations are never easily understood what is needed. Sometimes they don't run correctly I COULD NOT ACCESS THE ANIMATION PROBLEMS!!!!!!!!!!!!

219
Several times I had problems getting the animations to work correctly, making the problem more difficult First, these problems cannont always be accessed unless one is on an appropriate browser The problems are more difficult because the data cannot be calculated, it must be eyeballed using the pointer.
6. More involved; more calculations; more time-consuming.
It is hard to use them. Besides, it depends on when you stop the animation...it never ends up on the line, so all of your answers are off. It is frustrating to work with them and they are very time consuming. I think that they are a great deal harder and inconvenient than regular homework problems. The measurements must be calculated from the animations and sometimes a slight inaccuracy will throw off the answers. It takes way too much time doing the measurements than actually doing the physics of the problem. It seems like animated questions are more involved and I can't work it out on paper because they are not in the book. took a while to look at the scales There is so much more involved in the question answer process. The first animation question that came up totally stumped me. I didn't know how to run it or answer it, even after I used the help menu. YOu can't take them home, and you have to guess somethings, they also take longer. there is usually more items to figure out and more equations that have to be used for the question The animations take a long time to come up, and you can't print them out to take a closer look at them Animations do not work, take longer to load, sometimes distractions They require more time, and depend on analization of the animation rather that values like the regular homework. For example, most of the time you have to figure out the acceleration and velocity in the animations by steping through them and measuring the distance over time. They are time consuming, and offer no extra educational value than the regular homework does. It takes longer to figure out what data is needed and how to solve each problem. Also, you have to use the animation on campus computers making it less convenient than the other homework assignments. It usually takes longer for the animation to work and usually it is toohard to read to even be able to answer the problem. sometimes its hard to even start the animation- it takes too long to download some. Most times its hard to pinpoint actual date or derive data from the animations

220
more time is required, as well as meticulous counting.
7. It was generally hard; questions were generally hard. It is hard to use them. Besides, it depends on when you stop the animation...it never ends up on the line, so all of your answers are off. It is frustrating to work with them and they are very time consuming. I think that they are a great deal harder and inconvenient than regular homework problems. because it requires you to be exact with the information. The questions in these problems are hard themselves. hard to do The java animations are hard to distiguish what numbers correspond to what time, and since the computer grading is so picky, it amkes it hard to get the answers right.
8. Made problem more realistic.
Because they show a diagram of how the problem is in a real life situation, it helps a little to understand. The java animations are hard to distiguish what numbers correspond to what time, and since the computer grading is so picky, it amkes it hard to get the answers right. helped visualize the problem or interpret the question It is difficult to understand how you are supposed to use the animations to answer the questions. animations help me visualize the problem one first has to aquire the data before even beginning the problem Because you can see what is going on. Because it's hard to get exact numbers for each situation. The animations were not defined enough to be useful. The scales were not given, and it was difficult to control the timeing It is hard to tell when something is stopped moving and when it starts. never get exact answer as it is required. The questions aren't really harder because you have a crutch to help you in solving or setting up the problem. Just being able to see the problem you are working on makes it easier to solve, or at least easier to understand. I find the problems are harder to understand because I can't obtain the correct data from the animations. The pictures are so general, I'm not sure what to look for.

221
9. Helped visualize the problem or interpret the question. It is difficult to understand how you are supposed to use the animations to answer the questions. animations help me visualize the problem one first has to aquire the data before even beginning the problem Because you can see what is going on. Because it's hard to get exact numbers for each situation. The animations were not defined enough to be useful. The scales were not given, and it was difficult to control the timeing It is hard to tell when something is stopped moving and when it starts. never get exact answer as it is required. The questions aren't really harder because you have a crutch to help you in solving or setting up the problem. Just being able to see the problem you are working on makes it easier to solve, or at least easier to understand. I find the problems are harder to understand because I can't obtain the correct data from the animations. The pictures are so general, I'm not sure what to look for.
10. Intimidating; scary; frustrating. They make you collect the data whereas in the regular questions the data is supplied to you. They also can sometimes be intimidating. getting the animations to work and then understanding them could at times be frustrating even when the cooridinates are given, it is impossible to get the answer in the range that the answer key is given. And, after staring at a ball move a hundred times to try and figure things out, you get fed up with it because when you write with your hand you feel more comfortable and you feel that you are the one in charge, instead of a confusing screen that makes you feel scared.
11. Directions are unclear; help was not sufficient
because the counting procedures (like the squares, or where to line up the crosshair) make s the answers skewed, I always got bad grades, even when I knew how to do the problem too many variables to look at and the animations were always hard to figure out. i didn't get any right when i always got the other things right. Because you cannot look up stuff in the book to answer the questions. the animation never works right and is diffculit to understand what it wants. It mostly a matter of guessing

222
I can never get the animation to work properly. It is difficult to understand how you are supposed to use the animations to answer the questions. The measurements must be calculated from the animations and sometimes a slight inaccuracy will throw off the answers. It takes way too much time doing the measurements than actually doing the physics of the problem. too much room for error and the directions are never clear. The directions are confusing, and it is difficult to read the data off the chart The interpretation of the data is left to the individual. Sometimes students, especially those who use ResNet to do their homework, have trouble running the animations properly to get the appropiate data. Some instruction on how to use the animation software would be useful for those in this predicament. Some the numerical information in the animations are hard to see. The animations provide an obstacle that the regular questions don't have. YOu may know how to do the problem with the correct data, but sometimes it is difficult to gather the correct data from the graphs that are provided. There was a explanation as to how to do the animations but sometimes they were very confusing. It is hard to read the graph for exactly what the question wants. There is little help on the help page for how to respond. It deals more with how to play and reset it. Because most of the time you cannot get the animations to work, and they are also confusing on the instructions. Even though I was able to work through the help for the animations, I still found it difficult to get some of the information I needed from the animation. (Maybe you could add different kinds of questions to the help so that we would be able to make sure we were getting information correctly)
12. Difficult to visualize
it is hard to see what is actually going on in the picture and it is also hard to derive the informaton needed The animations seem to have some margin of error on the axes which makes for an incorrect answer. Also, it's harder to visulize the problem with an amination only
13. can't print it and work on it like a textbook problem but must do it at the computer; can't take it home with you.
The animation is hard to get the pertinent information off of it. It is very difficult to know when to take the readings, and you cannot take the animation up to your room with you. too many variables to look at and the animations were always hard to figure out. i didn't get any right when i always got the other things right. Very obscure and no way to check yourself. Not shown a good method in class to use when working them

223
It seems like animated questions are more involved and I can't work it out on paper because they are not in the book. YOu can't take them home, and you have to guess somethings, they also take longer. Because you really couldn't print out the page and therefore you had to do the problem in the computer lab and usually I didn't have my formulas with me, and when I did, it just wasn't a suitable environment. The animations take a long time to come up, and you can't print them out to take a closer look at them Mainly because getting the information is a little tuffer and because the animation can't be printed out and taken to the room to work on. it is harder for many reasons. one we have to be able to work and run the animations. i heard someone describe it very well: it tests our ability to use the animation more than it test our ability to do physics. also, they tie up the computers. i print out the problems and then work them out and then come back to submit them. to do the animations one has to sit at a computer screen until they can successfully manipulate the animation and solve the problem. It takes longer to figure out what data is needed and how to solve each problem. Also, you have to use the animation on campus computers making it less convenient than the other homework assignments. You need to be at the computer to do them because when you write with your hand you feel more comfortable and you feel that you are the one in charge, instead of a confusing screen that makes you feel scared. Because you can't print them up and take them to a desk and work on them for a while you just have to do them there. 1. Because it is oftentimes difficult to understand what the question is asking you to do. 2. It's also unclear what some of the numbers are, at exact momments in the animation. 3. You have to be sitting in front of the screeen to do the assignment. You can't print it out and take it somewhere to get help with it.
15. Animation was not clear; display was not clear; animation was not smooth; animation was slow; question and animation did not appear on the screen at the same time; animation window was too large.
Because we are not just given numbers to play with in the calculatlor or put in a formula when you have an animation you got to figure out what numbers to use. I guess thats good for us, helping us to understand problems closer to real life situations. Very obscure and no way to check yourself. Not shown a good method in class to use when working them they are sometimes diffucult to tell the time and what information is actuallly given to you Because they show a diagram of how the problem is in a real life situation, it helps a little to understand.

224
Often it is difficult to determine exactly what is being displayed; also, sometimes there are display errors. The interpretation of the data is left to the individual. Sometimes students, especially those who use ResNet to do their homework, have trouble running the animations properly to get the appropiate data. Some instruction on how to use the animation software would be useful for those in this predicament. Some the numerical information in the animations are hard to see. If you know how to use the animator and the grid it is not too hard although the information from the grid could be improved. Because accurate data isn't always obtained which makes finding an answer close to the one online difficult. Also the animataions don't always run smoothly. It is hard to tell when something is stopped moving and when it starts. It is very difficult to tell things like distances, and velocities, based on the animations because some workstations and/or computers are slower than others, resulting in choppy animation. the animation is hard to see it needs to be more detailed and displayed better
18. Similar to lab.
Because dealing with the java applet is a pain. The objects never increments very well in the animations. Also, it is like doing a simple physics lab which makes the student try to decide for him/her self what the best approach is. Unlike regular problems that you can check with the book. they we're that much harder, it's similar to what we do in lab
19. difficult to take data; difficult to operate animation; difficult to obtain desired data points; did not understand how to take data from the animation; tried counting squares and guessing at grid values, etc.; did not stop the animation and step through the motion; difficult to read data; difficult to make exact measurements and use measurements to obtain an accurate answer (this is either due to the interface or the process of measurement); you can solve the problem correctly but not get the expected answer; know how to do the problem and can work the animation but cannot get the correct answer.
The animation is hard to get the pertinent information off of it. It is very difficult to know when to take the readings, and you cannot take the animation up to your room with you. because the counting procedures (like the squares, or where to line up the crosshair) make s the answers skewed, I always got bad grades, even when I knew how to do the problem

225
It is hard to use them. Besides, it depends on when you stop the animation...it never ends up on the line, so all of your answers are off. It is frustrating to work with them and they are very time consuming. I think that they are a great deal harder and inconvenient than regular homework problems. The animations are just so hard to follow. A lot of the times they are also inaccurate. When my study partners have the same question in regular format it is so easy to figure out. I try to work my animation problem the same way but it never works. for an example, lets say you were trying to find the velocity of the ball moving across the screen in an animation. You see the ball moved 5meters. You also see that it took 10 seconds. But the answer 5/10-----> .5m/s is incorrect when it is entered. If this problem was not on an animation the answer would be correct. I wish that all the animation homeworks would be thrown out or used for extra credit. Due to the fact that it is difficult to obtain exact information for exact times/locations, the value of an answer can vary. If this system is to be continued, I would suggest that the ability to enter exact time desired be instated along with a more accurate way of determining location of an object rather than clicking near the center of the object. The measurements must be calculated from the animations and sometimes a slight inaccuracy will throw off the answers. It takes way too much time doing the measurements than actually doing the physics of the problem. b/c getting the right numbers for the distance, time, and so on is a challenge. i feel it is some what hard to get exact values. too difficult to judge the actual value necessary to determine the correct answers The animations are usually fairly easy. The only difficulty may lie in operating them and being able to get the data from it. it is often difficult to understand and get data from animation because you have to sit there and play the thing back and forth until you know which points to use for your calculations. also the animation never stops on the points exactly. it always skips over them and you can never get it onto the right points These questions are more difficult because the information neded to solve thge problem is not given in numbers. The animations do not clearly provide them all the time. The is a margin for error when picking the numbers fromn the animations. Sometimes it was hard to find the correct time and distance on the animations. We could do the problem right but get the wrong answer because of the time or distance on the animation. The data is often hard to collect from the animation There is so much more involved in the question answer process. The first animation question that came up totally stumped me. I didn't know how to run it or answer it, even after I used the help menu. because it requires you to be exact with the information. The questions in these problems are hard themselves. YOu can't take them home, and you have to guess somethings, they also take longer.
226
Sometimes, it is hard to count an exact number. Usually, an approximation will do, yet that does not always give you the correct answer. Because they are a pain in the behind to get the correct coordinates. I just overall hate them. I didn't seem to get any of them right except a few. Many times, especially at the beginning of the semester, I felt that I wasn't given enough information to answer the questions. Sometimes, I thought we needed to find info, such as acceleration, which was difficult (it seemed impossible to me) to find just from the animations. It was also difficult to use the grid to determine info since it was so small and the origins and other important parts were not marked. Things did become easier later in the semester when the location of the particle, velocities, etc. were displayed on the grid. Because the scales are so small and it is unclear to what x-coordinate or y-coordinate to use in figuring the answer. It was unclear of how the movement of the animation related to how to figure out the answer. Because it's hard to get exact numbers for each situation. it is extremely difficult to assign values for position and velocity and such things when using the animation. Since exact answers are needed when doing the animatiom, it is difficult to get an accurate answer. The animations seem to have some margin of error on the axes which makes for an incorrect answer. Also, it's harder to visulize the problem with an amination only because it hard to get all the information needed of the computer and wastes a lot of time that could be spent doing Physics. The questions are clear but you can't do the problem unless you can get the data. This is the difficult part. The animations are difficult to understand and obtain data from, and if you don't understand how to work the animations and obtain the data, then you can't do the problem. too much room for error and the directions are never clear. Mainly because getting the information is a little tuffer and because the animation can't be printed out and taken to the room to work on. The directions are confusing, and it is difficult to read the data off the chart If the answer requires that you determine something such as a velocity, the animations generally do not make it easy to determine because of the way the frames fall compared to time. For example, one animation showed a ball moving back and forth but the frames did not fall on an end point at an even hundreth of a second until the end of the third period of oscillation. Due to the error that was caused by that third of a hundreth of a second, I continued to get the wrong answer until I was able to recognize that the animation was totally in sync with an even period for the first two oscillations. This was a lesson in observation but if that is part of the intent of the assignment, it should be noted so a struggling student won't spend hours trying to figure out what is wrong with their calculations when all it turns out to be is an error in measurement. I would prefer to learn the material, confirm that I am doing it correctly and then perhaps take the challenge of doing problems that require more critical observation that are clearly noted as suche

227
Half the time the animation messes up and it is always hard to get the correct coordinates and data. They are more difficult because you do not have the numbers right in front of you. Instead they are in the form of the objects moving, and it is hard to get the real numbers. It's very difficult to estimate positions with crosshairs. Even with that problem fixed, sometimes the numbers given for positions don't work out when you use them. In addition, the wording of the questions is confusing. In the regular problems the data is given and in the animations the data must be extracted from the movement of an object. Usually, I would just pick a point in which some value was either zero or one. This helped me. Another disadvantage is that rounding errors may occur with a varying number of significant figures. The interpretation of the data is left to the individual. Sometimes students, especially those who use ResNet to do their homework, have trouble running the animations properly to get the appropiate data. Some instruction on how to use the animation software would be useful for those in this predicament. Some the numerical information in the animations are hard to see. Calculating the accurate values needed to determine the answers was difficult using the animation The animations provide an obstacle that the regular questions don't have. YOu may know how to do the problem with the correct data, but sometimes it is difficult to gather the correct data from the graphs that are provided. There was a explanation as to how to do the animations but sometimes they were very confusing. The annimations don't always work properly and when they do and you enter the numbers into the equation you never get the right answer. And you get the right answere for similar problems so therefore you know that you are doing the problem right. even when the cooridinates are given, it is impossible to get the answer in the range that the answer key is given. And, after staring at a ball move a hundred times to try and figure things out, you get fed up with it It is very hard to understand exactly what needs to be done and the manner in which it needs to be done. Plus, whenever you do understand something it takes a while to get the right answer. because i never understand the animations, and when i do, i still can't get an answer that the computer agrees with It's harder to tell what it is doing in the animation and pay attention to the exact numbers and the motion of the object at the same time It's hard to get accurate readings for the time and displacement. Even with the numbers beside the pointer, depending on when you click on stop it may stop on like 1.1 or maybe on 1.2sec... then you might not get the same numbers. This messes up sig figs. Sometimes I would do it right, but I'd have to guess around my answer to get the computer to count it right. it is hard to get the exact information that you need from the animations I couldn't say whether or not they were more difficult because I could not figure out how to go about getting an answer and could not even try because I did not understand how it worked with the stop and go buttons. The practice example was easy and I got that but after that I couldn't get anything else right. It is difficult to control the animation. You can never stop the ball in the correct place.

228
it is harder for many reasons. one we have to be able to work and run the animations. i heard someone describe it very well: it tests our ability to use the animation more than it test our ability to do physics. also, they tie up the computers. i print out the problems and then work them out and then come back to submit them. to do the animations one has to sit at a computer screen until they can successfully manipulate the animation and solve the problem. The java animations are hard to distiguish what numbers correspond to what time, and since the computer grading is so picky, it amkes it hard to get the answers right. the animations are very hard to enterpret and if you judge it wrong, even if your calculations are correct, you still get it wrong. It is hard to measure the data accurately. the animation is hard to understand and use. they didn't seem to work most of the time, or maybe it was just my computer that they didn't like. When they did work, the information needed for working the problem was difficult to extract from the animations. The animation are hard to fiqure out and it is difficult to get the correct needed data. Because difficulty occurs when having to estimate or guess certain time/time intervals needed to answer the question. For instance in my case I figured a time to be 0.33 secs and the answer the anamation wanted was 0.3333333333333. It is hard to interpret the graphs and sometimes the animations don't work. The animations were not defined enough to be useful. The scales were not given, and it was difficult to control the timeing difficult to extract exact data, no prototype questions to refer to as in the book questions, sometimes difficult to tell which section it may be from, and answers still must be very precise despite measurement error Because accurate data isn't always obtained which makes finding an answer close to the one online difficult. Also the animataions don't always run smoothly. it is not always easy to see what the scale is and what units are being used determining some of the numbers at different stations were difficult. the problems were just different then anything in the book. The animations were hard to interpret. You couldn't always get the exact amount in which the correct answer came from. Since the users determines the input of numbers, such as time, there is a lot more room for error They were so hard to follow and understand. They were unrealistic and no matter how hard I tried I could never get one right. There should be a larger room for error when dealing with these animation problems. I don't understand how to use the animation to find the correct answer. It is sometimes difficult to be accurate with timing with the objects moving at different velocities.
229
the pictures are often hard to follow and there is a lot of room for error based solely on misinterpretation of the graphics. also, it is often hard to get the animations to step in the desired increments and stop where you want them to. never get exact answer as it is required. because i can not measure the number of time , velocity , distance... 1. Because it is oftentimes difficult to understand what the question is asking you to do. 2. It's also unclear what some of the numbers are, at exact momments in the animation. 3. You have to be sitting in front of the screeen to do the assignment. You can't print it out and take it somewhere to get help with it. It is very difficult to tell things like distances, and velocities, based on the animations because some workstations and/or computers are slower than others, resulting in choppy animation. Even though I was able to work through the help for the animations, I still found it difficult to get some of the information I needed from the animation. (Maybe you could add different kinds of questions to the help so that we would be able to make sure we were getting information correctly) sometimes its hard to even start the animation- it takes too long to download some. Most times its hard to pinpoint actual date or derive data from the animations because the problem usually does not given much data. Before we can solve the problem we must find the data by using the inimation which is hard to use The actual computations are not necessarily more difficult, but there always seems to be some ambiguity in the measurements when the coordinates aren't labled, it is difficult to determine the location and movement It's not really the questions that are the worst part as far as performing calculations and manipulating equations go. What's so bad is that it seems no matter what equations I use, the answers never come out right. I realize this sounds like a cop-out from a failing student, but it's not. I do fairly well on the tests and regular homework. Also, the animations seem to be nothing more than trussed up find-the-velocity problems. No matter what we may studying in class, if an animation is part of the homework, one can guarantee that he'll end up having to find the velocity and/or acceleration. With all due respect, we are not so inept in Physics that we need to have a redundant weekly review of those areas. Please eliminate the animations or at least overhaul them. The animations are tedious to understand, much less calculate correct answers. Many cases I know I've done the math right, but still it doesn't mark correctly. I don't know if it is just picky with sig figs or what. In all, I may have got one out of the many animations correct as opposed to the regular questions. I have difficulty relating the information from the applet to the info. needed in the problems equation. For some reason, I can't figure out the distances and times properly to give me the correct answers. Animation is less exact. Also not having anyone to ask specific questions makes it more frustrating. Also it was hard to understand what was being asked. It's more difficult to get the necessary information from animations to solve the problem. because we can never get the accurate result ... confusing.

230
more time is required, as well as meticulous counting. The animations just seem more confusing. The controls are awkward when you're trying to use them in order to get information from the actual animation. It is very hard to get correct readings. The question asked itself is not difficult, it is just the nuisance of trying to find the numbers needed to get an answer using the animation. It would be a little quicker if it had a fast forward for the animation. It sometimes takes a long time to get to the point that is needed. Distances on the screen are difficult to judge. Sometimes you can use the coordinates at the starting point and the end point of an animation's path, but that doesn't always tell actual displacement. Also, it's difficult to stop the animation at an exact time value, even when you use the frame-forward and back buttons, and that seems to have thrown a few of my answers off. First, these problems cannont always be accessed unless one is on an appropriate browser The problems are more difficult because the data cannot be calculated, it must be eyeballed using the pointer. The animation problems are always harder worded to match up with the animation. There is always the estmation requried to do the problem. Often it is hard to count or to tell the exact number or measurement that is needed. They are different than any examples in the book. It was challenging at first to figure out which points you needed to take measurements at to obtain accurate data for the problem. the complication is due to the animation itself. The questions being addressed are usually quite easy. The animation problems tend to be a lesson in computer use rather than physics. It is hard to decifer exactly what the readings should be when stopping the moving balls. What is expected as input values is vague. The animations are often hard to follow. For example, when position is the y-axis and time is the x-axis, the x-axis did not agree with the time given by the clock at the top of the animation. It was very confusing.
p. Positive; multimedia-focused problems were not more difficult than traditional problems.
Because they show a diagram of how the problem is in a real life situation, it helps a little to understand. animations help me visualize the problem The animations are usually fairly easy. The only difficulty may lie in operating them and being able to get the data from it.

231
Because you can see what is going on. At first it was..but after a while i got better. If you know how to use the animator and the grid it is not too hard although the information from the grid could be improved. The animations are really nice. They are more difficule because the appear to be more confusing that word problems. It appears that each animation is well organized. The questions aren't really harder because you have a crutch to help you in solving or setting up the problem. Just being able to see the problem you are working on makes it easier to solve, or at least easier to understand. It's basically the same questions.
u. Unclear; uncategorizable. Because the information is hard to find. You normally have to find the distance and the exact time to be able to figure out the rest of the problem. sometimes I could not tell what the object was doing Because sometimes they are harder to work with. It is just more of a hassle to use the animation than ot sit and work problems. The damn graphs that usually come with them are hard to read. B/c they are difficult to deal with. And cause more trouble to work with. because I was told to put in an answer and it doesn't matter what I say. I'm only doing it for the extra credit. I think the whole computer thing sucks and I would rather throw the machine through the wondow the an every use it again. it is a pain to try and use them. overall i think the animations are a bad idea. Because it is not clearly than the homework questions. 9 because the animation just keeps on going. It never really seems to stop. more care is needed in order to obtain the correct answer. I can not figure out how to get the right answer even if I know what going in class and know how to do the homework. The animations make figuring out things like initial velocity and deceleration very difficult personally, I do not like the animations. I have yet to figure out how to read the animations even though I read the instructions. Problems with two or more objects were even more difficult.
7.6.3 Question 2

232
Table 7.2: Responses to Question 2 (N=340).
Were homework questions with animations clearly worded?
Always 4%
Usually 58%
Rarely 32%
Never 6%
7.6.4 Question 3
Table 7.3: Responses to Question 3 (N=341).
Were animations presented with homework questions clearly displayed (i.e. animation ran smoothly and motion was clearly visible)?
Always 11%
Usually 54%
Rarely 29%
Never 6%
7.6.5 Question 4b
1. Learned to solve problems where info is not given; had to determine necessary data to solve animation problems and this was not necessary with other problems.
It makes you learn how to face a problem without givens and makes you think more. Which seems to make the others easier and more understandable. \end{ list}

233
2. Made me think; helped my reasoning; helped my approach to solving other problems. It makes you learn how to face a problem without givens and makes you think more. Which seems to make the others easier and more understandable. made me understand the reasoning part to it, so then I could do problems like them in the future it helped with the process or method needed to solve similar problems in other homework problems Helped you to apply some of the procedures.
Because just being able to see on the screen what was going on makes it easier to understand the question or problem. Once you did a problem with an animation you got a general idea of what was going on and this helped set up and solve the other problems dealing with the same topic. 3. Made other problems easier; made other problems more understandable.
It makes you learn how to face a problem without givens and makes you think more. Which seems to make the others easier and more understandable. The animated questions did nothing for the unanimated questions because they were usually unrelated to each other. You get a better understandin gof the physic problems. Because typically if you can solve an animation problem, then the other problem were pretty simple.
4. Did not know how to do the animation problems; I could not get animation problems correct; technical difficulties with animation; having to use the animation interefered with understanding how to do the problem.
Even though the animation problems where related to the problems on the test, they did not help me because I did not know how to do most of them. because i never got them right to begin with. Because I usually got the animations wrong. I have never been able to get a single one of the Java applets correct. The animation only threw me off. I just never understood the questions in reference to the animation. sorry. i rarely got the animation questions correct. Because it isnt possible to accuratly control the time in the animations, the values and answers for animation questions could be far enough off from the needed answers to result in a incorrect answer given. This could undermine a students confidence in using that equation/ type of problem. I did not know how to effectively utilize the animations to begin with.

234
i could not do the amination questions no b/c it was usually difficult to know if your numbers were right, so I was not sure if I had done the problem wrong, or if I had the wrong numbers. I could never get the animation problems correct because I had no idae where to stop it, or at what point to get the information from. If I couldn't get these, how was it suppose to help me with other problems? No- because it was always unclear what information was to be drawn from the animation. When there was no animation, the necessary information was given, so there was at least a chance for me to try to get the right answer. Like I stated before, I had a hard enough time running the animations. I was so stressed out about that that I didn't pay much attention to if it helped me out on other questions. Because I never get the correct answers for these problems. And there were no solution for these prolems either. Actualy it should help, and it would if we didn't have to concentrate so much on weather or not it is working the way the answers should be. It could be great help finding out the answers and understand it better if there wasn't that much of problem operating it. Personly I don't like them !!!! Because the animation problems were so difficult that I usually gave up on them before I was able to find an answer. Because I rarely got the correct answer to the animation Because I could never get the right answers for the animation problems. It did not help because I knew how to do the problems with animations and without. But because of the difficulty involved in assigning accurate values for the animation problems, I usually got those wrong. like I said above, I rarely got an y of the animation problems correct, I knew how to do the problems but they never worked out right. I could never get the animations to work except on a fluke, so they helped me little. I did much better on the homework problems where the data was given to me, and I had to work it out. The animations were not a good representation of whether or not you knew the material. i could never get the animation to work right. I was too busy trying to figure out what was going on to learn how it applied to physics. Because you could never do the animation so it could not help you one way or the other . Well I could never do the animations so it didn't help as far as my learning was concerned. I couldn't get them to work i didn't know what was going on son i could not due the work I never got the annimations right so therefore I thought that I was doing the problems wrong even though I knew that I was doing them right.
235
I did not get any of the animation problems correct I always got the animations wrong. I did not understand how to use the animations. The directions were unclear. as i mentioned above they seem to test the skill of using the animation more than the physics behind the problem. also, by the time you are done with it, you are so frustrated that you don't give a damn to learn about it. I was never able to get even one problem with animation correct, so even if I was using the right method I wouldn't know it and I would try different things. it just depended. Sometimes I would spend so much time on trying to figure out how to work the animation that I would lose sight of the question being asked. The animations were never precise enough to determine the numerical data needed to solve the problems The animations were ususally to difficult to get right. First of all I couln't understand what the particle in the animation problems was doing. Second when I finally thought I knew how to solve the problem, it was difficult to pinpoint the exact places where the object started and stopped. I was so worried about getting the info from the picture I never really sat back and examined what it was actually doing I never got correct answers on the animation problems. It usually took longer to get the animation to work, if it worked at all, then to answer one of the regular problems. COULD NOT ACCESS THE ANIMATION PROBLEMS!!!!!!!!!!!!!! Because I did not know how to read the animations so I did not benifit at all from the animations I was too busy trying to get the animations together to even grab the concept of it. Like above, I rarely got the answer right on the animated problems, so they were more frustrating than helpful. I couldn't solve all the animation problems and I mentally separated the dreaded animation problems from the others. Since I usually couldn't solve the animations they were of no help with other problems. I never get it to work for me The problems that didn't have animations still required understanding of the concepts. Problems that did have animations tended to be over complicated by the graphic, even if the problem itself was easy. Like I said previously, I never understood the animation problems, therefore they were of no assistance to me when working with the other problems. I could not solve the animation problems.
236
5. Animation problems were confusing; animation problems were more abstract; non-animation problems were more clear; did not understand them; hard to figure out; poorly worded.
I found them to confuse me rather than aid me I have never been able to get a single one of the Java applets correct. The animation only threw me off. I just never understood the questions in reference to the animation. sorry. I didn't understand them They were hard to understand, and sometime i could not follow what the question was looking for It was hard enough trying to figure out how the animation pertained to the questions much less use it for other queitons. to abstract too much confusion!!! they were to abstract Sometimes difficult and hard to understand. the animations did not make since because they weren't very clear demonstrations I could never really see the connection between the animation problems and other problems. The animations confused me more than anything. B/c they caused trouble trying to understand them. Could never fiqure them out, from the lack of explination. The written questions were more clear-cut and the animated ones were more ambiguous. My animations never made sense. I did not know how I was suppose to read them. because i never understood the animations to begin with. I did not understand the anamations Animations were to confusing. The problems without animation always seemed to be more straight forward and to the point. They just seemed confusing to me. The animations made it harder to understand.

237
The animation just confused me and I had a difficult time understanding them. So it was impossible for them to help me with other problems. because the animation makes it more difficult for you to understand the question , I don't know why propably because I am not used to it yet. sometimes they would help but most of time they just confused I just did not find the animations helpful because they were hard to understand and kind of weird. the animations generally just confused me and the problems that were presented with the animations were generally different from the ones that had no animation included. I agree that sometime the animation could help me to solve the work problems, but sometimes it is hard to understand. animations always get me confused. I usually could not tell whether the animation problem was pertinent to other problems or not. Ususally the animation problems confused me even more and I was not able to relate the animations to other problems. They were hard to understand and always had to deal with balls not some other object we could more identify with. Because animations were sometimes not clear They were so poorly written that they made no difference at all in regards to other problems. The animations didn't relate to anything. They didn't make sense. When the animations are hard to figure out, it seems that they don't relate to other problems at all. The problems with no animation were much more clear. They were easy to understand. The animation problems just confused me. Maybe use better wording. The animation problems were not clear and reading the animations took up most of the time. I think I generally understood the concepts and how to solve a problem, however, the animation where usually too confusing or hard to follow to be of any benefit when solving other problems.
6. Two types of problems were not related; animations are not used in other questions; the two problems are different; animations required you to take data whereas in other problems data is given to you
No , I don't think the 2 types of problems had any direct correlation. They usually did not apply to any other homework questions. did not relate to other questions
238
The animation problems were not similar to the other problems. No real questions have animations Not really. Did not relate other questions to animations. I really can't lay my finger on this one, but I think it is because with the homework without the animation, you were giving all the data you need to solve the problem in the question. But with the animation, you had to look at the animation, where you stop it, and then you had to click to see where the ball was at, and that was annoying. Because the animation problems seemed to be totally different from the other problems, and usually much harder. I could never get the animations to work except on a fluke, so they helped me little. I did much better on the homework problems where the data was given to me, and I had to work it out. The animations were not a good representation of whether or not you knew the material. They did not help me because they were different types of questions. The questions involving animations were never related to the homework questions therefore the animation questions didn't help me at all. The animation problems seldom complemented other questions. I could never really see the connection between the animation problems and other problems. The animations confused me more than anything. The animated questions did nothing for the unanimated questions because they were usually unrelated to each other. The animations did not correspond with other homework problems sometimes. I found it difficult to relate the information gained from the graps to other problems the animations generally just confused me and the problems that were presented with the animations were generally different from the ones that had no animation included. nenver could find a correlation to the problem. just a ball bouncing up and down. Because they didn't pertain to what our other assignments were all about. no, i saw no correlation I usually could not tell whether the animation problem was pertinent to other problems or not. Ususally the animation problems confused me even more and I was not able to relate the animations to other problems. The questions were way too different from other questions... I don't think solving questions with inimation help us solve other problems where it no inimation because they are different problem. in reality such as test or exam all the data usually given before solve the problem.

239
Because the questions where not that similar. it was the same type quwstions The animation problems didn't run parallel to any other problem.
7. Non-animation problems were not difficult; have no need for additional visualization provided by animation; do not need animation if given data; still picture is just as helpful; need no additional help to solve non-animation problems; can already do non-animation problems.
i knew how to do the problems without the animation b/c i could see it in my head and i knew how to do them anyway. Most of the problems in the book the book did a very good job describing what the problem was asking for or gave a picture to go along with the problem. The animations were usually a picture of something that could be pictured. Because if you understand the motion you can picture it without it. The animations did not help me to solve any other problems because they are just simple illustrations that are easy for me to imagine anyway. I just feel that these things were just a toy that you guys found neat and decided to use. They did not help me. It did not help because I knew how to do the problems with animations and without. But because of the difficulty involved in assigning accurate values for the animation problems, I usually got those wrong. I drew a picture of what was happening even for almost every problem, animation or not. They did not help because I could already get the other questions. The animations were the ones that took me forever to get. I tend to work better when I am simply given the problem and I have to visualize it myself. When I see the applets, it only confuses the issue. I prefer to draw it out, put all of my information in myself, work form there. You don't usually need an animation to imagine something. The animation didn't help me picture the problems any better than the other problems In all cases I found that I either knew it or I didn't. Questions which I didn't understand and didn't have animations did however provide exact data which allowed me to manipulate the numbers until I found an appropriate answer. Having an animation present usually had no affect on other problems with similar material. Animations only helped the individual visualize the problem better. Solving the problem could occur without realy imagining it happening. With regular questions, you have the info provided so you don't have to worry about the time or the movement along the x-axis for most quesitons. if a non animated question was worded right and a good illustration was provided, then that would be all that you need. more illustrations would help I understood the non-animation ones much better

240
For me, I think in numbers and words and the animations were only things to pull data from--not aids in doing the problems. A situation that would use the animation could be described in words with a clearer understanding of what was happening. The animations were not helpful to me in answerinf other questions. other problems were rarely difficult to decipher and the animations did not provide any further information you could usually get a good mental picture from the problems if they were worded right It didn't help because if the amounts of, for example, time and displacement were given you could draw your own picture. The animation was unnecessary. The animations problems were a burden. The non animated seemed easier because I did not have to rely on a sketchy animation. I never thought about the animations when I did another problem Since I was unsure of myself working with the animations, I was usually frustrated. I found that problems with given information were much easier to handle than animation problems. No. (Please refer to above comment section.) How could the animations possibly help us when they are nothing more than time-wasting reviews of elementary position, velocity, and acceleration formulas? No, they aren't helpful whatsoever! believe it or not, it was easier for me to visualize a word problem than try to understand a dot moving across the screen, The animations were less useful than the diagrams in the book (That's not really saying a whole lot :) ). In other words a still picture is just as helpful as the animation. It really did not make a difference, I was always able to solve my homework problems. I don't see how the animation would make it easier. Problems without animation are inherently easier, so I rarely needed help with them. Animation problems were really not that effective at explaining material in a better way, but at the same time, why should they be? Clearly, animation problems are closer to being real-world problems than the conventional questions are. The animations just did not help me to visualize the situation The questions without animations were usually easier than the animation problems. The problems with no animation were much more clearly stated in that initial conditions were given and I did not have to make an educated guess about them. It is much easier to solve an unanimated problem since everything is given. Usually I already know and understood the concept and could picture it my- self. Of course on occation it may be extra helpfull to see it happen particuarly on new material. I think I generally understood the concepts and how to solve a problem, however, the animation where usually too confusing or hard to follow to be of any benefit when solving other problems.

241
8. Non-animation problems helped me solve animation problems.
It worked the opposite for me. I had to be able to work the problems before I could do the animation. Most of the time when I got the animations it was by luck or multiple guessing, not because I really understood the problem. It actually worked in reverse. No animation problems helped me solve the animation problems sometimes. Becuase the only way I could figure out the animation is usually if I already knew how to do a similar problem and thus knew what to do with the animation. I usually solved the animations with the information i got from the other problems. I usually tried to do the regular problems first, they were easier I hardly knew what i was doing in the animations- mostly it was the other way round- the normal problems helped me a little in solving the animations I think it worked the other way around for me, if I could solve the other homework I could figure out what to do for the animation problems. The animation was more just a nice visualization of what was going on.
9. Animation problems were frustrating. Because it isnt possible to accuratly control the time in the animations, the values and answers for animation questions could be far enough off from the needed answers to result in a incorrect answer given. This could undermine a students confidence in using that equation/ type of problem. Like I stated before, I had a hard enough time running the animations. I was so stressed out about that that I didn't pay much attention to if it helped me out on other questions. i usually got frustrated trying to answer animation questions, and by the end of the semester, i skipped most of them well basically because the animations became more of a frustration and I just wanted to get them over with so I usually did not pick up much information from them. the animations took up so much time and energy, by the time you finished them you were so frustrated you didn't learn anything I really quit working the java for stress related reasons I would think I would know how to work a problem and then get it wrong so I finally gave up on them. I ussually am not a quitter but found it easy to quit on them. I think the java'as have to much room for error and should not be counted towards are homework grade. I know of many students that simply don't attempt questions with animations because they're too hard to understand...or maybe they were just intimidated by the animations. Solving questions without animations is hard enough as it is...adding animations just complicates things.
242
as i mentioned above they seem to test the skill of using the animation more than the physics behind the problem. also, by the time you are done with it, you are so frustrated that you don't give a damn to learn about it. no, because you never remember those stupid animations because they are too much trouble and you just want to forget them Since I was unsure of myself working with the animations, I was usually frustrated. I found that problems with given information were much easier to handle than animation problems. Animation is not of much help, instead it frustrates me and my heart throbs each time I see that I have Animation questions online because I always run into problems with it. Like above, I rarely got the answer right on the animated problems, so they were more frustrating than helpful. I usually got frustrated with these problems and often didn't complete them.
10. extra practice was helpful. No, because the questions which were asked are nearly the same as the questions which come from the book. So, that means that the only benefit these problems give is extra practice. But, these types of problems give you extra practice determining velocity, and acceleration, etc. problems in general help
11. Poor design of animation problems; animation did not deal with real objects, but abstract objects.
b/c although anomations were excellent, they are still a bit raw. I think you try to help the student learn better they should be offerd on the server. Like maple, the students would be able to use the interactive PY to solve problems and gain experiance by doing rather than having it done for them. The animations were moving too fast to fully understand them It's harder to picture objects moving in an x-y plane than if they were moving in a real life situation. They were hard to understand and always had to deal with balls not some other object we could more identify with.
12. Not sure. i'm really not sure if they help or not
Because just being able to see on the screen what was going on makes it easier to understand the question or problem. Once you did a problem with an animation you got

243
a general idea of what was going on and this helped set up and solve the other problems dealing with the same topic. 13. Animation helped me visualize; animation helped explain the problem.
Because once you learn how the problem looks like, then you can apply it to many other circumstances (problems). After solving an animation problem I could visualize what other questions were trying to ask. Because it helped me see how some of the problems may look like in real life, not some abstract problem made up in somebody's head. It is always helpful to see something in action, but they did not seem to apply to al the other questions. Because its always easier for me to see what the problem is talking about. It showed you what was going on. Yes, they were able to put a picture in my mind on how a certain problem may look like instead of just seeing it in words. Yes because I was able to picture it in my mind how to figure out othrer problems they helped me visualize other problems that may have given me problems IF i was able to use the animations correcty, sometimes they provided a more visual way to look at the problem. When you watch the animation you are able to actually SEE what the problem is doing. They help you to understand other problems, and make other problems easier to solve. the animations provided animation :). these could be referred back to when working similar problems. You could actually see what was going on Help to see how things worked they help to form a visual image of what is happening. Usually I already know and understood the concept and could picture it my- self. Of course on occation it may be extra helpfull to see it happen particuarly on new material. I think it worked the other way around for me, if I could solve the other homework I could figure out what to do for the animation problems. The animation was more just a nice visualization of what was going on.
14. Did not do animation problems
244
I just did not like the animation problems. Even when they were fairly easy I would spend twice as long trying to figure them out. I didn't understand them It worked the opposite for me. I had to be able to work the problems before I could do the animation. I did not know how to effectively utilize the animations to begin with. They usually did not apply to any other homework questions. i usually got frustrated trying to answer animation questions, and by the end of the semester, i skipped most of them I usually just skip the animation, or just put any random answer in. because i never took the time to figure out the animations I really quit working the java for stress related reasons I would think I would know how to work a problem and then get it wrong so I finally gave up on them. I ussually am not a quitter but found it easy to quit on them. I think the java'as have to much room for error and should not be counted towards are homework grade. I know of many students that simply don't attempt questions with animations because they're too hard to understand...or maybe they were just intimidated by the animations. Solving questions without animations is hard enough as it is...adding animations just complicates things. Honestly, when I saw a question was animated I just skipped it-- they were too lengthy and time consuming for something that was essentially just a cheap version of a lab experiment. I usually got frustrated with these problems and often didn't complete them.
15. Animation was not connected to class or lab. Even though the animation problems where related to the problems on the test, they did not help me because I did not know how to do most of them. They were fairly simple problems that I didn't need help with most of the time. Therefore I didn't need to compare them to other problems. Because it isnt possible to accuratly control the time in the animations, the values and answers for animation questions could be far enough off from the needed answers to result in a incorrect answer given. This could undermine a students confidence in using that equation/ type of problem. The animations did not seem to go along with the work we were doing in class or in lab.

245
16. Mathematics were similar; problems were basically the same except in one the data is given.
I have never been able to get a single one of the Java applets correct. The animation only threw me off. I just never understood the questions in reference to the animation. sorry. Because once you learn how the problem looks like, then you can apply it to many other circumstances (problems). Because it isnt possible to accuratly control the time in the animations, the values and answers for animation questions could be far enough off from the needed answers to result in a incorrect answer given. This could undermine a students confidence in using that equation/ type of problem. No the mathamaticle part was always the same, the animations where harder because you had to disifer the ussualy given information. You could have simply given an problem out of a book with the data calculations and then you could basically have the same problem Because all the problems were basically the same format. it only made it harder to find out the object's conditions They were about the same. The ones with animation usually needed it and the ones without animation usually didn't need it. they were pretty much the same, the animation didn't really help, just was different
17. Animation problems are more like real-world problems. They were hard to understand, and sometime i could not follow what the question was looking for animation was afull Most of the time when I got the animations it was by luck or multiple guessing, not because I really understood the problem. It actually worked in reverse. No animation problems helped me solve the animation problems sometimes. It was hard enough trying to figure out how the animation pertained to the questions much less use it for other queitons. i could not do the amination questions The animations like any of the professor's demonstrations help illustrate the real world applications of physics. Animation does not neccessarily need to be critical to solving the equations for it to help. Try using them occasionally just to make a point.
Problems without animation are inherently easier, so I rarely needed help with them. Animation problems were really not that effective at explaining material in a better way, but at the same time, why should they be? Clearly, animation problems are closer to

246
being real-world problems than the conventional questions are. 18. Animation problems were easier.
The animation problems were usually simple, they often illustrated a concepty that was already clear.
p. Positive; doing multimedia-focused problem helped solve other problems. It makes you learn how to face a problem without givens and makes you think more. Which seems to make the others easier and more understandable. Because once you learn how the problem looks like, then you can apply it to many other circumstances (problems). made me understand the reasoning part to it, so then I could do problems like them in the future After solving an animation problem I could visualize what other questions were trying to ask. Because it helped me see how some of the problems may look like in real life, not some abstract problem made up in somebody's head. It is always helpful to see something in action, but they did not seem to apply to al the other questions. Because its always easier for me to see what the problem is talking about. It showed you what was going on. Yes, they were able to put a picture in my mind on how a certain problem may look like instead of just seeing it in words. Yes because I was able to picture it in my mind how to figure out othrer problems No, because the questions which were asked are nearly the same as the questions which come from the book. So, that means that the only benefit these problems give is extra practice. But, these types of problems give you extra practice determining velocity, and acceleration, etc. they helped me visualize other problems that may have given me problems IF i was able to use the animations correcty, sometimes they provided a more visual way to look at the problem. The animations like any of the professor's demonstrations help illustrate the real world applications of physics. Animation does not neccessarily need to be critical to solving the equations for it to help. Try using them occasionally just to make a point. it helped with the process or method needed to solve similar problems in other homework problems When you watch the animation you are able to actually SEE what the problem is doing. They help you to understand other problems, and make other problems easier to solve.
247
Helped you to apply some of the procedures. problems in general help the animations provided animation :). these could be referred back to when working similar problems. You get a better understandin gof the physic problems. You could actually see what was going on Help to see how things worked they help to form a visual image of what is happening. Because just being able to see on the screen what was going on makes it easier to understand the question or problem. Once you did a problem with an animation you got a general idea of what was going on and this helped set up and solve the other problems dealing with the same topic. Because typically if you can solve an animation problem, then the other problem were pretty simple. Problems without animation are inherently easier, so I rarely needed help with them. Animation problems were really not that effective at explaining material in a better way, but at the same time, why should they be? Clearly, animation problems are closer to being real-world problems than the conventional questions are. Usually I already know and understood the concept and could picture it my- self. Of course on occation it may be extra helpfull to see it happen particuarly on new material. I think it worked the other way around for me, if I could solve the other homework I could figure out what to do for the animation problems. The animation was more just a nice visualization of what was going on. The animation problems were usually simple, they often illustrated a concepty that was already clear.
u. Unclear; uncategorizable. I just did not like the animation problems. Even when they were fairly easy I would spend twice as long trying to figure them out. animation was afull They were fairly simple problems that I didn't need help with most of the time. Therefore I didn't need to compare them to other problems. The animated questions required too much time spent calculating necessary numbers for the problem and I didn't feel like they helped in solving the other physics problems. It is easy to understand concept with animation but it was not easy. it still contained the problem element

248
Sometimes I felt that the aniomations were a waste of time and more trouble than they were worth. The animations never helped figure out any problems on the tests. usually did questions not pertaining to animation first It simply was not helpful. because you had to figure everything out No real reason, they just didn't help with the other homework questions Once I figured out the point at which I was taking data, the problems didn't just seem like a bunch of useless numbers anymore. I could see where numbers came from. for some reason it was difficult to identify the animation with actual events especially word problems where i knew exactly what was needed it just didn't I don't know why The only hard part about animations was collecting data from the animation. I think I just really hate animations. the animations in class helped to understand the concepts, but the homework animations never worked for me. were not relavant it just did They just don't. I did not see any use of the animations Though the animations were sometimes distraction and took longer to load, they were beterr in helping explain the problem. It was not neccesary. I don't know why they just didn't seem to make that much difference. It just wasn't helpful to me. Again, these animations offer no help other than to take up time. it was unclear Once I figured out the purpose of the animation and work with the problem...the animations appeared to be helpful. Of course, if there is some picture presented, solving a problem will be easier. Because it used things we knew instead of making us use our own intellect. Sometimes doing a more difficult animation problem made the unanimated ones easier.

249
THe animation is the key to the evil domination of the free standing world order of today. really sometimes would be more of a correct answer some of them were just out there but overall I think they could be realistic applications The situations were too simple compared to normal problems. The animations were not very helpful in the problems they were assigned with let alone other problems. the blah blah blah they just didn't i didn't see an y practical use for exams They were usually much simpler than the ones without. It may have helped if solved animation problems were used as examples for other problems, animated or non-animated. It was usually luck to find out what the answer was through looking at questions gone over in class and making a link to the problem. the animations were a waste of time, only the homework queations helped
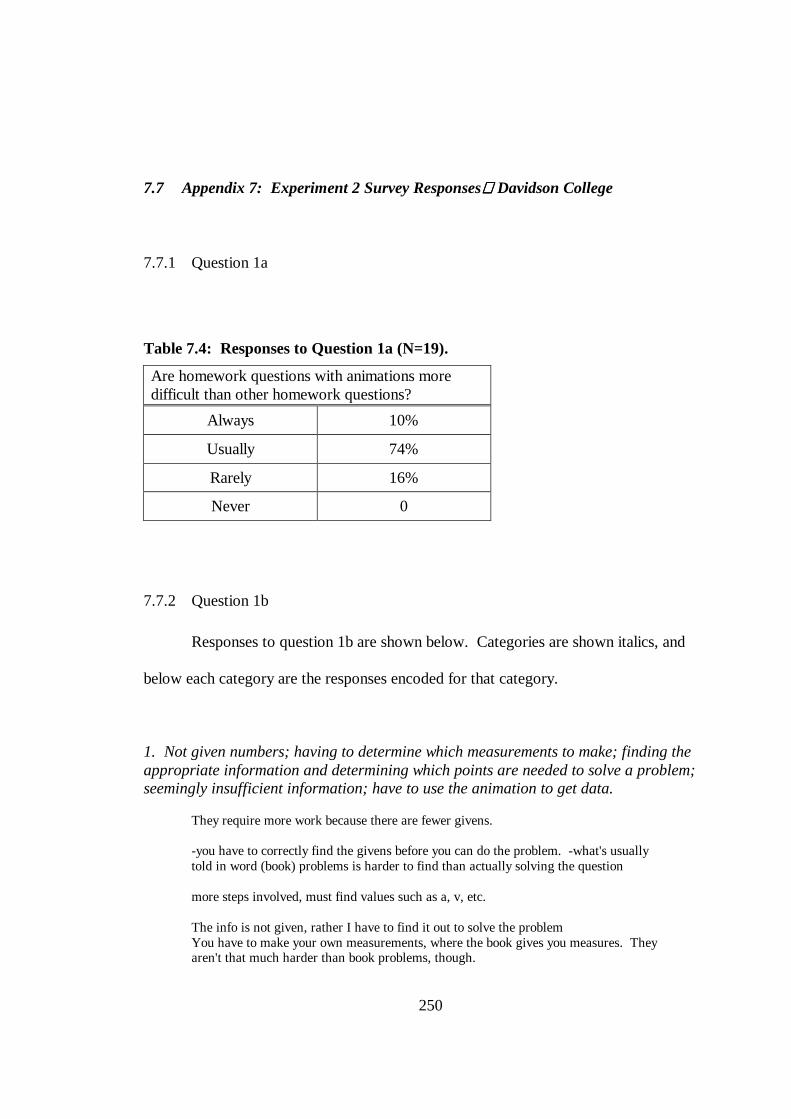
250
7.7 Appendix 7: Experiment 2 Survey ResponsesDavidson College
7.7.1 Question 1a
Table 7.4: Responses to Question 1a (N=19).
Are homework questions with animations more difficult than other homework questions?
Always 10%
Usually 74%
Rarely 16%
Never 0
7.7.2 Question 1b
Responses to question 1b are shown below. Categories are shown italics, and
below each category are the responses encoded for that category.
1. Not given numbers; having to determine which measurements to make; finding the appropriate information and determining which points are needed to solve a problem; seemingly insufficient information; have to use the animation to get data.
They require more work because there are fewer givens. -you have to correctly find the givens before you can do the problem. -what's usually told in word (book) problems is harder to find than actually solving the question more steps involved, must find values such as a, v, etc. The info is not given, rather I have to find it out to solve the problem You have to make your own measurements, where the book gives you measures. They aren't that much harder than book problems, though.

251
b/c there are so many options of what to do They are not as easy to plug a formula into and find an answer
6. More involved; more calculations; more time-consuming.
They usually require more thought and effort than the book problems, which are normally plug & chug. They can present more things to think about and more complex problmes, but oftn compared to what is asked or what is learned they are easier. The book problems were easier because they usually involved one idea from a chapter. The animations many times required the combination of several concepts to get the answer. more steps involved, must find values such as a, v, etc. - more time required -more theoretical -spatial 3D vs. 2D dimentional
7. It was generally hard; questions were generally hard. I'm not sure why they just are always more difficult b/c the physlets seem to be of a more difficult level
9. Helped visualize the problem or interpret the question. The questions with animations can better communicate the circu7mstances of the system. This eliminates errors in communication with words, as in book problems. Animations describe the system better and make the problem easier. The animations help give the problem life and dynamics that can indicate solutions
11. Directions are unclear; help was not sufficient. They usually require more thought and effort than the book problems, which are normally plug & chug.
19. difficult to take data; difficult to operate animation; difficult to obtain desired data points; did not understand how to take data from the animation; tried counting squares and guessing at grid values, etc.; did not stop the animation and step through the motion; difficult to read data; difficult to make exact measurements and use measurements to obtain an accurate answer (this is either due to the interface or the process of measurement); you can solve the problem correctly but not get the expected answer;

252
know how to do the problem and can work the animation but cannot get the correct answer.
At times they are difficult to accurately control. Also, the large quantities of information given tend to make the user make the problem far too difficult.
u. Unclear, uncategorizable. It's so tedious to calculoate all other velocity, displacement, etc. in order to solve a problem
7.7.3 Question 2
Table 7.5: Responses to Question 2 (N=19).
Were homework questions with animations clearly worded?
Always 11%
Usually 79%
Rarely 5%
Never 0%
7.7.4 Question 3

253
Table 7.6: Responses to Question 3 (N=19).
Were animations presented with homework questions clearly displayed (i.e. animation ran smoothly and motion was clearly visible)?
Always 32%
Usually 58%
Rarely 10%
Never 0%
7.7.5 Question 4b
Responses to question 1b are shown below. Categories are shown italics, and
below each category are the responses encoded for that category.
2. Made me think; helped my reasoning; helped my approach to solving other problems. I never thought about an animation problem when I have to solve one without an animation, so in that sense, no. However, they may have helped with my comprehension of the material, and therefore improved my performance on problems w/o animations
It stimulated more thinking The animation usually is more thought provoking and requires a step by step methodology. This process can be taken back to the homework problems.
6. Two types of problems were not related; animations are not used in other questions; the two problems are different; animations requred you to take data whereas in other problems data is given to you.
I never thought about an animation problem when I have to solve one without an animation, so in that sense, no. However, they may have helped with my comprehension of the material, and therefore improved my performance on problems w/o animations The book problems are much more abstract and illogical as compared to the physlets - no correlation available, really. Sometimes I have trouble relating the 2

254
7. non-animation problems were not difficult; have no need for additional visualization provided by animation; do not need animation if given data; still picture is just as helpful; need no additional help to solve non-animation problems; can already do non-animation problems
The animations helped when I needed it but I often found using my own imagination & mind to understand words problems more interesting
12. Not sure.
I never thought about an animation problem when I have to solve one without an animation, so in that sense, no. However, they may have helped with my comprehension of the material, and therefore improved my performance on problems w/o animations
13. Animation helped me visualize; animation helped explain the problem. Seeing the motion of a system or something like what is described in the book helps tremendously to see the physics at work in real life, the book problems force you to make the menhal picture and if we already knew how to do that the course would be useless, we are taught by the animations, and can only guess at the book b/c I could then picture what the problem was asking in my head. helped to see motion It allowed me to create a mental picture. The animation questions leave you with a mental image of what the non-animated wouldn't show you. It's easer to make a visual connection.
16. Mathematics were similar; problems were basically the same except in one the data is given.
Same types of problems
p. Positive. I never thought about an animation problem when I have to solve one without an animation, so in that sense, no. However, they may have helped with my comprehension of the material, and therefore improved my performance on problems w/o animations It stimulated more thinking The animation usually is more thought provoking and requires a step by step methodology. This process can be taken back to the homework problems.

255
u. Unclear; uncategorizable.
no because motion is a concept, the problems are harder to do off the computer than in the book never
7.8 Appendix 8: Experiment 3 Interview Questions
Students’ verbalizations for three problems covering topics in projectile motion,
average velocity/average speed, and Newton’s Second Law were analyzed in Experiment
3 (described in Section 3.4). The three problems used for the study are shown in Figure
7.29, Figure 7.30, and Figure 7.31.
Figure 7.29: M ultimedia-focused problem in projectile motion which was solved by students during the think-aloud interview.

256
Figure 7.30: M ultimedia-focused problem in 1-D kinematics which was solved by students during the think-aloud interview.
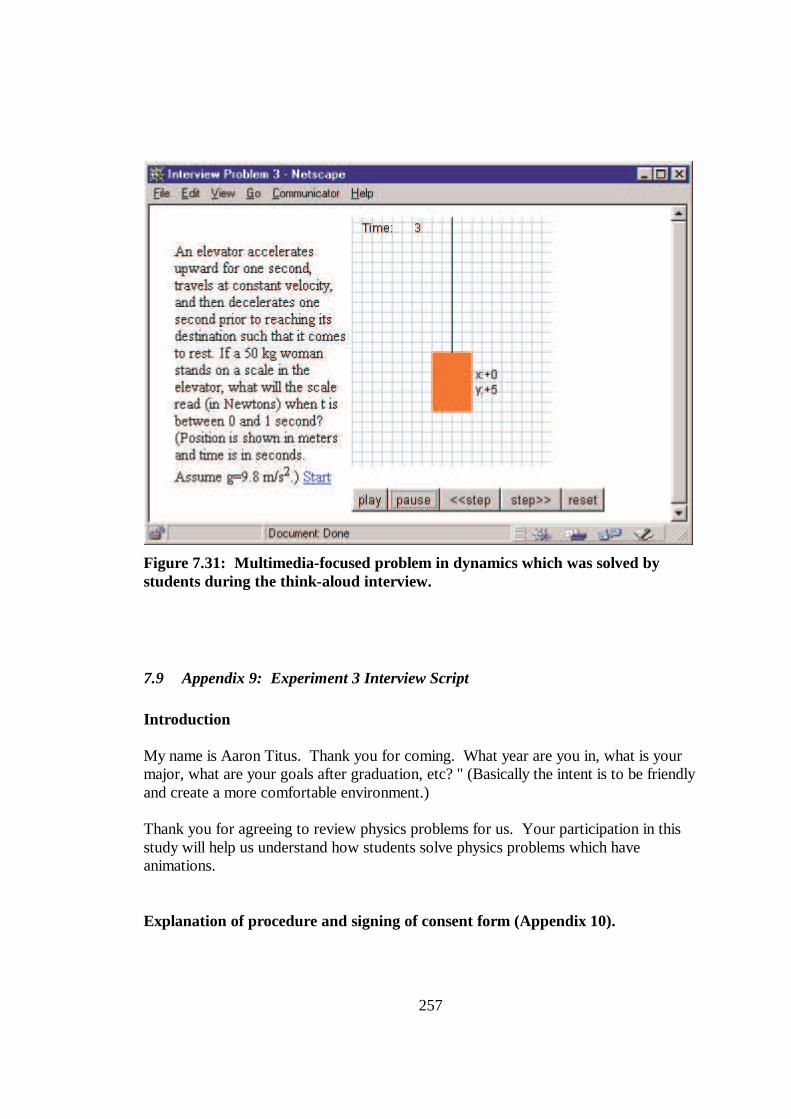
257
Figure 7.31: M ultimedia-focused problem in dynamics which was solved by students during the think-aloud interview.
7.9 Appendix 9: Experiment 3 Interview Script Introduction My name is Aaron Titus. Thank you for coming. What year are you in, what is your major, what are your goals after graduation, etc? " (Basically the intent is to be friendly and create a more comfortable environment.) Thank you for agreeing to review physics problems for us. Your participation in this study will help us understand how students solve physics problems which have animations. Explanation of procedure and signing of consent form (Appendix 10).

258
Essentially walk through the consent form line by line. The list below is the procedure as outlined on the consent form. 1. I will explain the procedure of the study, clarify compensation and expectations, and
answer any questions you may have. 2. We will engage in a sample interview to get you accustomed to speaking aloud while
solving a problem. Either a puzzle or simple physics problem will be used. 3. You will be asked to sit at a computer and view an animation. I will give you
instructions on how to use the animation (play, pause, step forward, step backward, etc.), and you will be given a simple activity to make sure you understand how to use the animation. Any of your questions will be answered.
4. You will be asked to solve another problem, speaking aloud as you work through the problem. I will not interrupt as you work. A video camera will be used to record what you say and do while solving the problem.
5. This process is expected to take less than one hour. If it takes a half-hour or less, you will be asked to solve another problem. Otherwise, you will be asked to schedule a time when you can return to do another problem in the same manner. In all, you will be asked to solve 3 physics problems for the study.
Instruction and practice concerning think-aloud protocol and retrospective report. We are interested in what you think about when you find answers to some questions that I am going to ask you to answer. In order to do this I am going to ask you to THINK ALOUD as you work on the problem given. What I mean by think aloud is that I want you to tell me EVERYTHING you are thinking from the time you first see the question until you give an answer. I would like you to talk aloud CONSTANTLY from the time I present each problem until you have given your final answer to the question. I don't want you to try to plan what you say or try to explain to me what you are saying. Just act as if you are alone in the room speaking to yourself. It is most important that you keep talking. Do you understand what I want you to do? Good, now we will begin with some practice problems. First, I want you to multiply these two numbers in your head and tell me what you are thinking as you get an answer. What is the result of multiplying 25 * 15? Good, now I want to see how much you can remember about what you were thinking from the time you read the question until you gave the answer. We are interested in what you actually can REMEMBER rather than what you think you must have thought. If possible I would like you to tell about your memories in the sequence in which they occurred while working on the question. Please tell me if you are uncertain about any of your memories. I don't want you to work on solving the problem again, just report all

259
that you can remember thinking about when answering the question. Now tell me what you remember. Good. Now I will give you three more practice problems before we proceed with the review. I want you to do the same thing for each of these problems. I want you to think aloud as you think about each question, and after you have answered it I will ask you to report all that you can remember about your thinking. Any questions? Here is your next problem. How many windows are there in your parents' house? Now tell me all that you can remember about your thinking. Instruction about using Animator. Now, consider the following problem which uses an animation [see Figure 7.32].
Figure 7.32: Practice problem used by the interviewer to demonstrate how to use the applet.

260
You start the animation by clicking on the word "Start". After that you may control the animation using the buttons, "play", "step forward", "step backward", and "reset" [show example by clicking on buttons while explaining their functions]. You may also make measurements of position by clicking and holding your mouse in the animation. Crosshairs and the position of those crosshairs (as measured on the background grid) appear. If the position of an object is already shown, it is typically the position of the center of mass of the object unless otherwise specified. Practice think-aloud protocol with Animator. Now, answer this question [see Figure 7.33] thinking aloud as you did before.
Figure 7.33: Practice multimedia-focused problem.
Without looking at the computer, tell me all that you can remember about your thinking. Engage in interview

261
7.10 Appendix 10: Experiment 3 Consent Form
NCSU students were asked to sign the consent form shown below. Although Davidson students were not asked to sign it, the same information was conveyed with the exception of compensation.
Nor th Carolina State University INFORMED CONSENT FORM
INVESTIGATION OF THE EFFECTIVENESS OF ANIMATION ON SOLVING PHYSICS PROBLEMS Principal Investigator: Aaron Titus Faculty Sponsor: Robert Beichner You are invited to participate in a research study. The purpose of this study is to determine what effect animation has on problem solving in physics. INFORMATION Procedures:
1. When you arrive, Aaron Titus will meet you. 2. Aaron will explain the procedure of the study, clarify compensation and expectations, and
answer any questions you may have. 3. You and Aaron will engage in a sample interview to get you accustomed to speaking aloud
while solving a problem. Either a puzzle or simple physics problem will be used. 4. You will be asked to sit at a computer and view an animation. Aaron will give you instructions
on how to use the animation (play, pause, step forward, step backward, etc.), and you will be given a simple activity to make sure you understand how to use the animation. Any of your questions will be answered.
5. You will be asked to solve another problem, speaking aloud as you work through the problem. Aaron will not interrupt as you work. A video camera will be used to record what you say and do while solving the problem.
6. In all, you will be asked to solve 3 physics problems for the study. Amount of Time Required: The total time required is expected to be less than 3 hours. RISKS There are no known risks or possiblities of discomfort for you during this study. BENEFITS Knowledge gained from this study will give insight into the usefulness of animations such as those presented on the homework for PY205 during the fall semester of 1997. You personally will be able to review some principles of physics which you learned last semester.

262
CONFIDENTIALITY The information in the study records will be kept str ictly confidential. Data will be stored securely and will be made available only to persons conducting the study unless you specifically give permission in wr iting to do otherwise. No reference will be made in oral or wr itten repor ts which could link you to the study. COMPENSATION For participating in this study you will receive $25. If you withdraw from the study prior to its completion, you will not receive compensation. A check will be issued and mailed to you after your last session. CONTACT If you have questions at any time about the study or the procedures, you may contact Aaron Titus, at Department of Physics, North Carolina State University, Box 8202, Raleigh, NC 27695, or (919) 515-7059. If you feel you have not been treated according to the descriptions in this form, or your rights as a participant in research have been violated during the course of this project, you may contact the Dr. Gary A. Mirka, Chair of the NCSU IRB for the Use of Human Subjects in Research Committee, Box 7906, NCSU Campus. PARTICIPATION Your participation in this study is voluntary; you may decline to participate without penalty. If you decide to participate, you may withdraw from the study at any time without penalty and without loss of benefits to which you are otherwise entitled. If you withdraw from the study before data collection is completed your data will be returned to you or destroyed. CONSENT I have read and understand the above information. I have received a copy of this form. I agree to participate in this study. Subject's signature_____________________________ Date _________________ Investigator 's signature__________________________ Date _________________

263
7.11 Appendix 11: Experiment 3 Interview Transcriptions
The transcriptions are an accurate reflection of exactly what was verbalized during the think-aloud interviews. Occasionally a remark could not be understood. Where this occurred is indicated with ‘???’. In addition, pauses sometimes occurred. Long pauses are described as such and marked with “[[long pause]]” . Short pauses are usually marked with “…”. It is important to note, however, that what was transcribed as a pause is entirely dependent on the interpretation of the author. Pauses are therefore not likely to be reliably coded. Occasionally, a long pause occurred while the subject was doing something such as searching through the textbook for an equation. When an obvious action occurred during a long pause, it was noted as such. Like the long pause, this pause and action is indicated within a double pair of brackets.
Each student’s verbal report is organized here according to the question that was
being answered.
7.11.1 NCSU Student 1
Topic: Projectile Motion Question: A projectile is launched as shown in the animation (position is shown in meters
and time is in seconds). What is its speed when it reaches its maximum height? I Click on problem 1 and tell me what you're thinking when you solve the problem. S Alright, I am looking for the speed as it reaches the maximum height as the projectile is launched.
So we are just going to start it and watch the pretty ball bounce and step back to near the height to find out where the y component is at its greatest which seems to be at 1.4. So its y-velocity at that point is zero and the x velocity really hasn't changed. So you can actually just measure how long it goes for one second. Its x position is 1.908 meters so it moved 1.908 meters in one second so it would be, velocity would be 1.908 m/s.
I Ok and tell me what you were thinking as you solved the problem. S First I had to remember the projectile equation which I don't really remember it. Then I realized
that at the maximum height the y velocity is equal to 0 so I could just take the x component of it to see how far the x component went. Using the average velocity, change in position over change in time, it went 1.908 meters in one second. Divide it out to get 1.908 m/s
Topic: Average Velocity/Average Speed Question: (a) An object travels as shown in the animation. What is its average velocity
from time t=0 to time t=2? (position is shown in meters and time is in seconds.)

264
Question: (b) What is the average speed of the object from time t=0 to t=2? (position is shown in meters and time is in seconds.)
I Ok great. Let's go back and...[[Interviewer brings up the next problem on the computer]]...ok
speak aloud as you solve the problem. S Alright we want to know the average velocity from time 0 to time 2. Position is in meters so as
we play, then gonna watch the object move, ok there we go, see how far the object goes in 2 sec. So you let it play for 2 sec to see where its final position is. So it moved to the left -8.5 meters. Next we need to find out how far it went the first time before it changed direction. So it went 5 meters in 0.5 seconds for the first portion. So change in velocity over...or change in position over time would give you 10 m/s for the first component, and then as you go to...play out the rest of it, it moves from 5.5 to -8.5 so that's 13.5 meters for 1.5 seconds which ends up being 9. The first average velocity was 10 m/s, the 9 was there for 1.5, and the 5, the 9, the second part was for 1.5 seconds to the first component or 0.5 seconds, so we are just gonna kinda fiddle and do an average velocity of 10 m/s times 0.5, 5 and then add those together and divide by 2 and that gives you 9.25 m/s, I think.
I That's your answer to... S The average velocity. I Ok, go ahead and continue the problem. S Alright average speed, oh yea average velocity, well that's average speed then, yea so it would be..
just do the same thing average velocity use vectors and they would end up being... Oh really I solved for the b part first. Oh yea so for the b part it's going... or 9.25 m/s. For the b part the average velocity for the first one is 10 m/s to the right. The second one is after the change in direction is 9 m/s so the average velocity will be 1 m/s, I think, I'm not sure. I guess that's it. Let me think about that [[prolonged silence]] yea that's right
I Ok, for both parts a and b tell me what you were thinking when you were solving the problem. S For the a part I actually started solving for the average speed figuring how fast it was going to the
right. It moved 5 meters in 0.5 seconds which gives you a velocity of 10 m/s and then it went to the left at an average speed of 9, I don't remember exactly what the numbers were, and then I multiplied the 9 by 0.5 rather than 10 by 1.5 because the significant time because it would way more heavily, and I just take an average over both times and divide it by 2 and that gave 9.25. Then I realized that was actually the average speed, so then I went back and ??? 2 velocity vectors the one before it changed direction and the one after it changed direction and added those together to get average velocity.
Topic: Newton’s Second Law Question: An elevator accelerates upward for one second, travels at constant velocity, and
then decelerates one second prior to reaching its destination such that it comes to rest. If a 50 kg woman stands on a scale in the elevator, what will the scale read (in Newtons) when t is between 0 and 1 second? (Position is shown in meters and time is in seconds. Assume g=9.8 m/s2.)

265
I Ok, good, one more problem ??? speak aloud ??? S So ??? so they want to know how much weight this woman is going to weigh. Going up the
elevator it travels at a constant velocity. So ok it accelerates upward, then travels at a constant velocity, then decelerates. Alright so we are gonna figure out what the average acceleration is between 0 and 1 second, and you need the F=ma equation so...and the average acceleration is change in velocity over change in time so I go from 0 to ??? use that equation, use one of the linear equations in this crazy book [[prolonged silence]] ok so the one to use is the change in position so y minus y zero equals, or y minus initial position equals initial velocity times time minus one-half times acceleration times time squared to solve for acceleration. In one second it travels over one meter. The initial velocity is 0 so original velocity times time turns out to be zero. We have minus one half A times the time squared. It took one second so we end up with an acceleration of 2 meters per second squared. So if the woman weighs 50 kg and her mass is 50 kg and the acceleration is 2 meters per second squared that leaves you with a force that she experiences going up the elevator, so that's gonna equal one hundred Newtons.
I And tell me what you were thinking when solving the problem S First I was going to tell you that average acceleration was ???, but then I couldn't solve for the
average velocity I couldn't find the average velocity near the velocity, so then I knew I had to use one of the linear equations for motion. But I looked through the book and found one, the one that didn't include velocity, and plugged in all the components from the computer screen, the time and position. You know its initial velocity is zero if you start it from rest so that didn't factor in when I solved for acceleration, and got 2 meters per second and used the F=ma equation.
I ok, thank you.
7.11.2 NCSU Student 2
Topic: Projectile Motion
Question: A projectile is launched as shown in the animation (position is shown in meters and time is in seconds). What is its speed when it reaches its maximum height?
I Here's the first problem. Go ahead and answer it as you did before, speaking aloud. S The projectile is launched (I can't remember my projectile equations without thinking about them).
A projectile is launched as shown in the animation. Height is in meters and time is in seconds. What is the speed when it reaches its maximum height? Speed, ok, now this is a speed problem so now I have to think how to work speed. Ok, I'm just going to start it. Let's see, speed, speed, the speed is gonna be the directional. It doesn't matter which direction it's going. So let's see what am I thinking? This is obvious. What is its speed when it reaches its maximum height? No, no, I'm not stupid, I was about to say zero. I was about to say it's zero, but that's only in the y direction. Ok, so y direction, zero, x direction, I have to calculate. So let's look in the x world. The final time is time 2, oh wait a minute, that's not where it lands exactly. I need to make a perfect parabola. Play. It's going to land there, step back, line up the center of it. Now here's another problem I come up with sometimes is that once you go there, you can't. You have to go back until you know it moves. Now it's at 1.8. Ok, the center of the projectile is at 1.8, and the center of the

266
projectile is, time is 1.8, position is 2 meters. So 1.0... Since the speed is only going to be given in the x direction and since x direction speed is constant, all I have to do is do an average velocity essentially. Do 2 divided by 1.08 which is 1.85. But seeing that significant digits are just 2 for x, I myself would put 1.85 or 1.9 as the answer, because it's 1.85185, so, a continual decimal, I would probably put 1.9 instead of just 2. But I would say 1.85, 1.9, or 2, but I don't know the rules for significant digits for this exercise.
I So what were you thinking when you solved that problem. S I think "projectile, uh oh this is scary." I immediately thought of all those goofy one-halfs and all
those other things and equations I can't remember off the top of my head. I got a little intimidated. Then I thought, there's a written problem, I thought about that one. On the top, the maximum height, there is zero speed, zero velocity, and I was about to say zero entirely which is so dumb, but that's just because I'm off. Zero y-velocity, and so from that I don't have to do a whole [[sound effect]] because that would suck. The only way I could calculate, I thought, the only way I could calculate the speed of the ball would be to, if it wasn't at the perfect height, would be to do a little Pythagorean theorem problem, calculate y velocity and x velocity, because from one of these things you can't calculate the angled velocity. But I was very relieved when it said speed, this is not a very complex problem, then I know that the speed going this way is constant, the x velocity is constant. Since it is easier to do it at the end because it would go all the way and stop, I took it to the very end which is 1.8 seconds. In fact, I can't go back now, but I probably could have just taken it from the point of origin to the highest point, there or anywhere else, or from the highest point down to the very end. But there is a problem with the very end, time keeps going and the ball would still be there, and if I don't pay attention, the time will be way off. So it would be a lot easier, a time saver, for me to do something else because I know the average velocity, the x velocity, will be constant. And then when I did that I just took an average velocity for the x direction.
Topic: Average Velocity/Average Speed Question: (a) An object travels as shown in the animation. What is its average velocity
from time t=0 to time t=2? (position is shown in meters and time is in seconds.) Question: (b) What is the average speed of the object from time t=0 to t=2? (position is
shown in meters and time is in seconds.) I great, let's do another one. once again, solve the whole problem, both parts, thinking aloud as you
did before. S an object travels as shown in the animation what is the average velocity from time 0 to time 2.
position is in meters and time is in seconds. what is the average velocity, speed, of the object. so average velocity, average speed from time 0 to time 2. start. oh man, this is a good one. average velocity, well let's look at the average displacement. a wicked motion on that one. it's average displacement, total displacement, pause, reset, ok, s1, position 1, is 0 and t1 is 0. all right, position final is, come on it's almost there, is -8.5, and time is 2. We've got 2 over -8.5. So it's -8.5 divided by 2 which would be 2.25, if I did my math correctly, oh 4.25, which is equal to -4.25, I didn't put the negative in the calculator, I never do that I always catch it, it's an extra step in the calculator, why do it. so that's -4.25 for (a). average speed, speed would be actual distance covered. yea, speed is distance covered, let's see I think it's distance covered. I'm just getting real cautious. I can't believe I forgot this ???. speed, wow it's real early, ??? the speedometer of a car, so wait if

267
it's, taking off of the sign, that's right, it's in any direction, so I can calculate, that's right, so wait, how do I do this. it would be, pause, reset, ok, the first half of the run before it turns around, calculate the distance of that, then find the time, then from there. [[operating animation, clicking step button to get object to desired position]] oh yea, 4.6 is y0, 4.8 is y0, 5.0 is y0, 4.7 is y0, it's bouncing back, what am I thinking, I'm looking at x thinking it's time. ok 5, .5, 5 meters plus 8, then it moves 5 meters, negative, 5 plus 5 plus 8.5, divided by 2 seconds, so it's 18.5 divided by, 18.5 divided by 2, that equals 9.25, I could have done that in my head, 9.25. I'm not sure if that's right, but it's my answer.
I What were you thinking when you solved that problem. S Initially, I was like, the first part was easy, just subtract initial minus final divided by total time.
easy. the second part, I was like speed, I kind of forgot the different things about speed, I forgot it was total distance travelled divided by total time, because there's never a negative speed, it's always positive. It only took me until the final last little bit where I realized it was total distance divided by total time. Once I realized that I went back to the origin, and then from there I knew it was going to go this way and stop. so I calculated that distance and then it goes back this way passed the origin, stopped again. Once it passed the origin, I had to make sure I didn't put 8.5 plus 8.5, you know 8.5 and not miss the other 5 it travels here. and then I did 10 + 8.5 over 2 and that was average speed.
Topic: Newton’s Second Law Question: An elevator accelerates upward for one second, travels at constant velocity, and
then decelerates one second prior to reaching its destination such that it comes to rest. If a 50 kg woman stands on a scale in the elevator, what will the scale read (in Newtons) when t is between 0 and 1 second? (Position is shown in meters and time is in seconds. Assume g=9.8 m/s2.)
I ok, let's look at the third problem. Once again, speak aloud as you solve the problem. S an elevator accelerates upward for one second, travels at constant velocity, I guess it travels at
constant velocity after one second and decelerates one second prior to reaching its destination such that it comes to rest. if a 50 kg woman stands on a scale in the elevator, what will the scale read in Newtons when t is between 0 and 1 second. so the whole end stuff, oh I see, the stuff at the end is irrelevant. [[pause]] ok, all the information after that first second is not important, pretty much I think. let's see, I'm gonna have to go to an acceleration question because I don't have one of those position questions. [[looking in book]] ah, where are they at, almost there, come on where are you at, nope. ah 5 essential equations, can't use that because it's got velocity, can't, can't, can't. I need one with x. vo, vo is zero, wait, I assume vo is zero...I can't get rid of all the v's. I have to assume vo is 0. No, I can't do that. I know there's a simpler way to do this, I can't think of it right now, why not. I have to calculate the acceleration because the acceleration will add on to 9.8 m/s squared and thus make her weigh more, essentially, to the scale. but I forget how to...let's find my positions. s2 is equal to 1 for y. s0 is equal to 0. t1 is equal to 0, t2 is equal to 1. ok, I know there's a way to do this. one of these equations have to work. it has to have acceleration in it. it doesn't say the elevator starts from rest. I assume it does because the lady has to get on the elevator, it had to be stopped unless she jumped on. so let's assume v0 is 0, then I could use, yea then I could use x-xo is equal to vot minus, or plus, one half a t squared. now to find acceleration, let's see my position change is 1, my time, vo, one half a times, equal to 1 squared, so it's going to be equal to 1, one half plus a. ok acceleration is going to equal 2. since she is going up, she'll be

268
heavier when it goes up, plus her acceleration will go, [[writing on paper]] I could do a ???, that, and then her normal force on, ah wait a minute. this is easy, ok, I'm thinking too much about it. it will be added on to 9.8 so it's 11.8 m/s squared is her acceleration, times 50 kg. 590 Newtons, or 600.
I What were you thinking as you solved that problem? S Well, at the beginning I thought there was a whole lot going on until I read from 0 to 1 second.
the elevator accelerates upward for 1 second. that's one section of the acceleration, then it's constant so I know that there's no acceleration. [[describes motion using sound effects and hands]]. the speed would be like this [[draws picture]] I thought that, since it's so complex, with all those words and everything, like at one second prior to when it stops, comes to rest, dadadada, by looking at 0 to 1, I can forget everything after 1.0. I don't even have to look at it. All that other space is extra. so from that I looked at what information was given to calculate acceleration because I knew that acceleration is going to add on or decrease from 9.8 which I'm going to have to multiply times 50, whatever if it's less than or above than or less, I'm going to have to multiply by 50 to get the Newtons. so what I did was, I found the acceleration of the elevator car by, I found all the information. I knew that I had positions fine, times fine, velocity, I had a problem with because it changes except for velocity zero. now if I assume velocity zero is zero, which is not that difficult an assumption to make although I can't prove it really, but logistically it would be, it makes sense to put that in there, then I could use the one equation with vo in it, then it cancels out that half the equation, I don't have to worry about it at all. and then subtract change in position, and then in the other half of the equation, acceleration is the only variable, because that's the one you have to use, so I calculate acceleration, add 9.8 because it's going up, not down, and then multiply by 50 to find Newtons.
7.11.3 Davidson Student 1
Topic: Average Velocity/Average Speed Question: (a) An object travels as shown in the animation. What is its average velocity
from time t=0 to time t=2? (position is shown in meters and time is in seconds.) Question: (b) What is the average speed of the object from time t=0 to t=2? (position is
shown in meters and time is in seconds.) I Here is the first of the three. Go ahead and solve this one, thinking aloud as you do, and
afterwards, I'll ask you to report all that you were thinking. S ok for the first part, (a), velocity is displacement over time and you substract final minus initial
displacement over final time minus initial time. So at time, t2 is our final time t0 is our initial time. [[long pause]] Ok displacements are the same ??? from, x0 is the initial point to [[long pause]] displacement is from the original position so from 0 is -8.5 m from the original point. So its velocity is 8.5 negative minus 0 equals 8.5 divided by 2. Its average velocity is -4.25 m/s. Whereas speed deals with the total distance traveled, not displacement, so here we'll see how far it travels too on the positive x-axis as well as on the negative x-axis. Ok it goes as far as 3.5 and then back to 8.5 so we'll subtract negative 8.5. So the total distance traveled for that is 12 meters

269
both on the positive and negative x axis, so we'll subtract that from the initial position at 0. So its speed is 6 m/s.
I So tell me what you remember thinking as you solved that problem. S I remembered it again that velocity is displacement over time from the initial position. And since
it travelled on the x-axis, positive, and then back to its original position, you wouldn't count its positive movement into the displacement, only its movement back on to the negative side of the x-axis. And it did that within 2 seconds, so I put that displacement of -8.5 over the time to get the velocity. Whereas speed is the distance, I think, the distance traveled over time, so it would have been the total distance the object traveled, so I looked to see how far it traveled on the x-axis in the positive direction and in the negative direction, added those two together and then put that over the 2 second time period to find the average speed.
Topic: Newton’s Second Law Question: An elevator accelerates upward for one second, travels at constant velocity, and
then decelerates one second prior to reaching its destination such that it comes to rest. If a 50 kg woman stands on a scale in the elevator, what will the scale read (in Newtons) when t is between 0 and 1 second? (Position is shown in meters and time is in seconds. Assume g=9.8 m/s2.)
I ok, great, so let's take a look at a couple more problems, and again speak aloud as you solve the
problem. S [[long pause]] ok, we're dealing here with an elevator and acceleration equals velocity over time,
change in velocity over change in time. And also we're dealing with somebody's weight here, we want to know the woman's ...what the scale will read, essentially her weight which would equal her mass time the force of gravity on her. Some t equals 0 to t=1. The elevator is accelerating. The elevator...so the velocity will be changing too. Ok, start this and see how it goes. The initial position is 0, on y=0. After one second y=1. The elevator...I'm thinking how I figure how to find the velocity for this acceleration. Since it's changing it's not really good to take the average because it's changing in that one second period. But we do know that the initial weight of the woman is 50*9.8 which equals 490 Newtons. I just multiplied her mass time the force of gravity which is 9.8 which is 490 Newtons initially. Let's see how it goes. Just gonna see...find the...I'm just kinda looking at how this elevator goes. If we know the initial position, we know the initial velocity equals 0 we know the time initial, or the time period is 1 second. We know that...we don't know final velocity because it's changing. We do know initial x position which is, or y position, sorry, y is 0. final y equals 1. Let's see y final equals y initial plus v initial time time plus 1/2 a t squared. And that should give us acceleration since we know everything else. 1 is our final position, our initial position was 0 times the initial velocity which is 0 which cancels out the v-not times t. Then we have +1/2 a t squared. We are solving for a. We know that t=1 second, so that's 1, so we have 0.5 a equals 1. 1 divided by 0.5 equals 0.5, or equals 2, sorry, 2 equals ‘a’ . So the acceleration during that time period equals 2 meters per second squared.
I ok, so tell me what you remember thinking as you solved that problem. S At first I had to figure out what I knew that acceleration meant, and acceleration is velocity over
time, change in velocity over change in time. But the problem wanted me to solve at a period where the velocity wasn't constant, so it would not have been accurate for me to have just used

270
the position to subtract the final velocity over initial velocity in that small time period because it's not constant so I just used one of the formulas that I've learned. I remembered that I knew where the elevator started and I knew where it finished within that one second time period. I knew the initial velocity was zero because it was at rest in the animation. so I used the formula, yfinal minus yinitial equals velocity initial times time plus 1/2 atsquared. and since I knew all my variables in that thing I solved for the answer from there.
Topic: Projectile Motion Question: A projectile is launched as shown in the animation (position is shown in meters
and time is in seconds). What is its speed when it reaches its maximum height? I Ok, good, ok let's look at one more. again speak aloud as you solve the problem. S [[long pause]] Ok speed equals distance over time at when it reaches its maximum height,
velocity will only be, or the speed of the thing will only be in the horizontal direction. Its...horizontal direction, let's see I'm going to play it, see where it goes, ... step back and see where...ok the ball is launched from a position where x and y are 0. Position is x=0 y=0...at its maximum point, x=1.01 and y=1.4. Let's see what is the speed at its maximum height? What is its speed? I'm trying to remember how to do projectiles because they have both x components and y components so you have to...I know at the top, it stopped at its heighest peak, so its velocity will be 0 there. For the x coordinate, 0, acceleration will be 0. I think that's right, I don't remember. So at the top v final equals 0. I think the projectile's launched, so I don't think I know the initial velocity. Yea, well I'm not sure about that, so we know that v final equals 0. We know that the position at the top is y=1.4, x=1.01. I can't remember the formulas for projectile motion. initial position....we don't know, I don't think we know, initial velocity... is launched...but we do know that final velocity equals 0. So let's see final velocity and the time is 0, the time at the top is 0.54, so it takes 0.54 seconds. So v equals v-not plus a-t, I can't remember. that won't work because we don't know initial velocity I don't think. Let's see, another formula, we know x, let's see y, v equals, do we know that? I think it's launched with an initial velocity, so we don't know that at all. We know again final velocity is zero. Looks to be that we could find this initial velocity. What is its speed when it reaches its maximum height? Its velocity at the top is 0. So the only way that I would know how to solve this, since I've forgotten, is to measure how fast it's going as close to its final point as possible. Well, acceleration is...speed is...ok we'll do that...we're gonna say that...we'll take two points up here and try and find this change in x to relate it to speed, the velocity to the speed, because...let's see...oh I don't know how to do that because of the x and y component. What is its speed when it reaches its maximum height...speed, speed, speed. Speed equals distance over time. The distance it traveled. The problem of this for me is that is distance has both x and y components, and so you would have to break it down into is x and y components, and I don't necessarily know how to do that here. Its initial x and y positions are 0 and the final is 1.01 and 1.4. It's got components, speed is not a vector, speed, speed when it reaches its maximum height, speed, distance over time, x and y components, we know again that v0 at the top is 0. Can you break it down from the x side and the y side? We could do that I think. I think this is as far as I can go because I don't remember how to do, break it into components, x and y like that.
I Ok, what do you remember thinking as you solved that problem? S For projectile motion I remember that it does have x and y components, that it's not moving
strictly horizontal or strictly vertical so then I again thought what speed was because speed is

271
distance over time, but my problem came in when I realized that I would have just taken two points and solved you know taken the initial point and the final point and tried to find the velocity near its ending point and just used that, but you couldn't because it had x and y components and I didn't remember how you solve for projectile motion how you break it into the x and y components of it.
7.11.4 Davidson Student 2
Topic: Average Velocity/Average Speed Question: (a) An object travels as shown in the animation. What is its average velocity
from time t=0 to time t=2? (position is shown in meters and time is in seconds.) Question: (b) What is the average speed of the object from time t=0 to t=2? (position is
shown in meters and time is in seconds.) I Again speak aloud as you solve this problem. S Ok, I'm going to look at the screen first and ??? that time is equal to 0. I'm gonna read the
problem. An object travels as shown in the animation, what is its average velocity from t=0 to t=2. And I'm just gonna write that down. t is equal to 0 and t is equal to 2. Because I know that they're gonna have a position. And then I'm gonna read the...let me go ahead and start...so. Ok, it's going back and forth kind of weird. Ok and it stops. So I'm going to restart it. And what is its average velocity from t is equal to 0. So at t =0, x is equal to 0 and y is equal to 0. When t=2, I'm going to go ahead and play it and stop it at 2. Ok, x is equal to, look closely, -8.5, y is equal to 0. Let's see, velocity takes into account displacement. I'm going to make sure it's ok. I'm going to look in the book. velocity is signified by magnitude and the direction. Average velocity is displacement over time elapsed. So velocity is equal to displacement over time. So I'm gonna say, displacement is -8.5 minus 0 over 2 minus 0. That is -8.5 divided by 2, is equal to -4.25. so that is the average velocity, m/s. so that's the answer to (a). Now for (b), what is the average speed of the object from t is 0 to t, 2. Speed is, go back to that same page, speed is distance traveled over time elapsed. The distance traveled over time. I'm gonna write down that definition. So actually. you do the same thing. Distance traveled will be change in x which would be -8.5 over 2 which is -4.25 m/s. Let me go back and play it. It doesn't really seem right, but we'll stop it there.
I What do you remember as you solved the problem. S Looking at the screen first noting any kind of different objects, reading the question, and writing
down both of these times first before I even started. And then pressing play, and then after I let it play, reading it again. And then going to the book and getting the definitions and then plugging it in. And for the second one, didn't let it run again, just used the coordinates.
Topic: Newton’s Second Law Question: An elevator accelerates upward for one second, travels at constant velocity, and
then decelerates one second prior to reaching its destination such that it comes to

272
rest. If a 50 kg woman stands on a scale in the elevator, what will the scale read (in Newtons) when t is between 0 and 1 second? (Position is shown in meters and time is in seconds. Assume g=9.8 m/s2.)
I Ok, good. Let's go to the next one. Again, speak aloud as you solve the problem. S Ok, looking at it, there's nothing on there. An elevator accelerates upward for one second travels
at constant velocity, ok, upwards for one second and then travels at constant velocity and decelerates one second prior to reaching its destination, then it comes to rest. A 50 kg woman stands on the scale in the elevator. What will the scale read when t is between 0 and 1 second. I'm gonna go ahead and start it. I'm gonna go ahead and reset it again. At the very beginning, t is equal to 0, x is equal to 0, and y is equal to 0. And then it's going to..., I'm gonna do it till 1 second because the elevator accelerates upward for one second. I'm gonna play it until it gets to 1. I went over, so I'm gonna back it up. And then at t=1, y=1, and x is the same, I'm not gonna worry about that. And then ...ok wait...an elevator accelerates upward for one second, travels at constant velocity, and then I'm gonna let it play all the way through because I can't remember what the final time was. Final time is t=6 and y=10. It says 1 second before reaching its destination, so I'm gonna back it up to t is equal to 5, and when t is equal to 5, y is equal to 9. So between t1, t=1, t=5, its going to...an elevator accelerates upward for one second. so its accelerating through here; I'm gonna write "a" between those two. And then travels at constant velocity, so this is constant velocity. I'm just gonna write "constant velocity" there and then between t5 and t6, it's going to be, it's gonna decelerate. Let me go back and read it again. If a 50 kg, m=50 kg, woman stands on a scale in the elevator, what will the scale read in Newtons when t is between 0 and 1 second. So, t=0 and t=1 will give you 2 positions, and g=9.8m/s squared. I'm kind of blank on how to do this. ??? I'm gonna go back to the book, and I'm looking for a picture with this woman in the elevator. I think it's chapter 4. No it's not. Hold on...I'm gonna draw a picture of the woman and say, her weight is a force going down, and then since acceleration is equal to...is going up, and then there's the force that's going up, force normal going up. So force normal minus mg is equal to mass times acceleration. That doesn't sound right. Let me go figure out what I'm doing wrong. It's on page 131, chapter 5. The picture says that an object in an elevator at rest exerts a force on a spring scale equal to its weight and in an elevator accelerating upward at 1/2g, the object's apparent weight is 1/2 times larger. I'm just reading this. So right here in the book there's an equation. W-mg=ma, which I have, which I wrote down, force normal-mg=ma. Let's see you want to find what W is, so force normal minus mass of the woman, is 50 kg, times gravitation, gravity which is 9.8, is equal to 50 times acceleration. And acceleration is change in velocity over change in time and I'm going to go back to the beginning because it's between 0 and 1 and I'm gonna figure out velocity now so first velocity is, I'm going to step it up pretty quickly just to the next step, to find that velocity so .01 minus 0 over .1-0 will be the velocity, the first velocity. So that's .01 divided by .1which is .1. And then you go up to, step it up, to right before number 1. It goes, let's see, time is equal to 1 and y is equal to 1. you step it back down. .81 minus .9. so 1-.81 divided by 1-.9 that's gonna equal 1.9. so 1.9 over .1, this is for acceleration, is going to be...no 1.9-.1 over change in t which is 1 second. 1.9 minus .1 divided by .1, excuse me, divided by 1, equal to 1.8. So 1.8 is the acceleration, or average acceleration, go back and plug that in to w-50 times 9.8 is equal to 50 times the acceleration. So 50 times 1.8, and then 50 times 9.8 so 90 minus 490. Ok w is equal to -400. That's a force so that's newtons. when I go back and look in the book, and it says, let's see, in an elevator accelerating upward, the object's apparent weight is 1 and a half times larger. Well, -400 does not sound good. It doesn't make sense. It should be negative...do you want me to stop now when I get this answer?
I whenever you finish.
273
S Ok. That's my answer. Just look at it before anything started, to read it, and this time it was a more complicated problem so I had to read it twice before I even started the animation. And I started the animation and I noted one particular, it said one second. I used time, I remember thinking you use time as, I mean that's like your guide. Whenever it says you know, time 0 or time 1, and then accelerates and decelerates 1 second prior to...I used those times as my guide to write down. And then thinking I need to use the book before I even start this. So go on and look at the book, and coming back and drawing the diagram, and then writing my own equation, and then looking for an equation in the book, and it was the same thing. And then do an acceleration which, I remember, I never quite got how to do that on this one, on this physlet yet, when trying to find acceleration, I guess you use, you know, between 0 and 1, the quick change in velocity, then quick change in velocity here, then subtract the two velocities over time until I get the acceleration, but I don't know if that's quite right. And then plugging it in.
Topic: Projectile Motion Question: A projectile is launched as shown in the animation (position is shown in meters
and time is in seconds). What is its speed when it reaches its maximum height? I Ok, great. one more. S Ok, looking at it there's nothing on the screen, I'll go ahead and read it. t is equal to 0. a projectile
is launched as shown in the animation ??? what is its speed when it reaches its maximum height. Ok, let me go ahead and start it. Stop it. Reset it. Let's see, you want to get speed when it goes...I'm going to draw a picture of it what I think it did. When it's right here before it starts, t is equal to 0, x is equal to 0, y is equal to 0. And then I'm gonna let it play, and then we'll wait. Ok, pause, go back. ??? I'm gonna let it play, and then back up. Right here it's at its maximum height, looking at it on the screen, that's where I think it is. x is equal to 1.4. I'm gonna go down a little bit, nope, I'm gonna go back a little bit, that's it. It's maximum height is x is equal to 1.01, y is equal to 1.4, and t is equal to .54. I'm gonna let it play ‘ til the end, so it won't go any farther and then back up the time until it changes. And when it changes, I'm gonna go back. t is equal to 1.08, x is equal to 2, and y is equal to 2. I'm gonna read it again, I'm gonna go back to this chapter in the book about projectiles. It's chapter 2 I think, or no, is chapter 3, I guess. Ok, and I'm looking at example 3.4. Calculate the maximum height. At the maximum height, the velocity is horizontal, so vy here is equal to 0. And that, let's see, the equation uses t is equal to vyo over g. We know the time, so we don't have to worry about that., and then it says that from that equation, y0=0, we have y is equal to vyot-1/2gt squared. I'm just gonna go ahead and plug it in. Let's see but we're doing, no wait. We have to find speed so, skip back at the highest point, there's no vertical component of the velocity. there is only the horizontal component which remains constant throughout the flight. v is equal to vxo which is equal to vo cosine of the angle. Let me go back, to what I think is the top. Go back some more. I'm just gonna look at it and see. It does have a velocity, so I'm not thinking that velocity is equal to 0 which sometimes happens when you throw it up and it comes down. let's see... I'm gonna go to another problem. I'm gonna go to the kinematic equations. The ones with speed when it reaches its maximum height. Velocity initial. I'm gonna go ahead and solve this. y is equal to 1.4. Velocity, that's zero, is equal to negative 1/2 g over t squared. We know that so. Trying to look up the equations because it was several chapters ago and I can't really remember, ok, velocity is equal to velocity plus acceleration. We've got this equation, v is equal to vo + at. And we know that velocity is equal to velocity initial which is 0 plus acceleration, which is 9.8, times the time which is 1. The time at the highest point is 1.4, excuse me. I'm gonna multiply that out. 9.8 times .54 is equal to, velocity is equal to 5.292. That's my answer.

274
I Tell me everything you were thinking as you solved this problem. S I looked at the screen, nothing looked unusual. I read it. I let it play, then drew a picture of it.
Then I went back and marked important points, the start, the time and position of x and y each, at the end, and at what I felt was the highest. But I didn't know it was the highest because I am just eyeballing it, and then I used the step functions to make sure it was exactly the highest. And then I went and looked at the book and looked up what I thought to be an equivalent example. It wasn't exactly what I was looking for, so I looked up another one, neither was that. Then I looked up some equations, then used the one I thought best. And I remember thinking that there was a velocity at this point, that sometimes maybe velocity stops at the highest point, but for the projectile wasn't equal to 0, and that eliminated an obvious answer. And then I used it from there.
7.11.5 Davidson Student 3
Topic: Average Velocity/Average Speed Question: (a) An object travels as shown in the animation. What is its average velocity
from time t=0 to time t=2? (position is shown in meters and time is in seconds.) Question: (b) What is the average speed of the object from time t=0 to t=2? (position is
shown in meters and time is in seconds.) I Go ahead and do this one. S First I'm going to read the question. So I'm going to let it play and see what it does. And I see it
goes back and forth and then in the first part...let it play again. See how far it goes. Alright, so it goes until is stops. It looks like it moves at constant velocity, moving to the right, so I'm going to see what the velocity is when it's moving to the right, see if it's constant. So let's see...and it looks like it is constant. So the velocity to the right is going to be .2/.02, 10 m/s. And then it stops there and goes back to the left, and goes left of the velocity. .3 meters every .2 seconds. So let's see, it's negative ... I'm beginning to think that I'm going about this a very long way. [[long pause]]] I'm reading the question again. [[long pause]] Let's say to the right is positive, so it's positive 10 to the right. The average velocity...so I need to find the average velocity when it moves to the left. To do that I need the final velocity, which you get by 2 points at the very end, which would be -8.38 minus 8.4... 8.5. The difference is .12 divided by a time of .02. That's six at the end. at the very beginning, it moves to the left, and it's going, changing .3 over the same time interval .02, and that's 15, or negative 15. so I'm going to add those together, -15 and -6, and get 21 divided by 2. 10.5 is the average velocity to the left, negative 10.5. So I would say that the average velocity would be -10.5 + 10, .5 divided by 2 would be negative .25 m/s would be the answer to (a). And (b), the average speed would be 10.5, it's going to be positive because speed does not, a vector. 10.5 plus 10 would be 20.5 divided by 2, would be 10.25 m/s, is the average speed.
I All right, and what do you remember thinking when you solved the problem? S Well first I took like too much, I don't know, I went about it the wrong way I think. The first thing
I thought was ??? going in two directions and you wanted the average velocity and you needed to

275
get the velocity in the positive and the velocity in the negative direction. the velocity in the positive direction was constant, so that was pretty easy, but then it went negative. I saw that it was not constant so I had to figure the average velocity and found two points at the very end of its, the time, and 2 points right when it switched direction, and found those two velocities and took the average of the two. And then I averaged that with the velocity in the positive direction and got -.25. And then for part (b), I knew the two average velocities but speed is not a vector and that then they were both positive or negative and used that again and divided by 2.
Topic: Newton’s Second Law Question: An elevator accelerates upward for one second, travels at constant velocity, and
then decelerates one second prior to reaching its destination such that it comes to rest. If a 50 kg woman stands on a scale in the elevator, what will the scale read (in Newtons) when t is between 0 and 1 second? (Position is shown in meters and time is in seconds. Assume g=9.8 m/s2.)
I Once again, speak aloud as you solve the problem. S I'm reading the question. Accelerates and then it's constant and then it decelerates. So the t is
between 0 and 1 second, it's going to be accelerating, so I need to find the acceleration from time is 0 to time is 1. So I'm going to find the accerlation to find the change in velocity. Well it starts from rest, so the initial velocity is 0, and then let's see, the final velocity is going to be let's see, 1 point...I found the 2 y values, it changes .19, so divided by change in time which is .1, get 1.9 m/s is the final velocity minus initial velocity, would still be 1.9 m/s, and then divide by 1, no 2, to get the average. No, divide by 1 second, that's the time interval, and you get an acceleration of 1.9 m/s where, so now I'm going to divide by what percentage of g that is. So 1.9 divided by 9.8 is .19 and then some other decimal places. And then I'm going to multiply that by 50 to get a percent of her weight , and then figure that...ok..so 1.9 is about 19.4% of g. So I multiply 19.4 times 50 kg and got 9.7, so I want to add that to 50 kg and get 59.7 kg will be her, what the scale reads between 0 and 1 second. Let's see travels at a constant velocity, and then ??? after it accelerates, it travels at a constant velocity so her weight, her mass, then is going to be 50 kg. The first part, it was 59.7. And then the second part is going to be 50 kg again because there is no acceleration, and then the last part it decelerates in the last second, I need to find the velocity when it's at 5 seconds which will be .19. Oh wait it's going into this with constant velocity. We're gonna do it like this. Ok so it's moving at .2 m in .1 seconds. So that it's moving initially going into the final second at 2 m/s then it decelerates and it's going to stop, so the final velocity is 0. So initial velocity minus final velocity is 2m/s divided by 1 second. and you get an acceleration of 2 m/s, well, deceleration, so it'll be negative. So the woman is going to weigh less when decelerates so 2. Find out what percentage of 9.8 that is, and then it's about 20 percent. And then I multiply that by her weight, would be her mass 50 kg, and get 10.2. I'm going to subtract that from 50kg, and get 39.8 as her weight when it is decelerating...her mass.
I What were you thinking when you solved that problem. S I saw that it wanted acceleration so I immediately thought that I needed to find velocities, initial
velocities and final velocities for the time intervals that it wanted. So obviously it started without velocity so it was 0, the initial velocity was 0. The final velocity I had to find after 1 second, so I just found 2 points at the very end of the 1 second and found the velocity using displacement, and then found the acceleration, and then I found percentage of g that it was because when she was going up, it was going to add mass to her because the acceleration would be more so it would be

276
like 20% more than what it would be under normal circumstances, so her weight would be 20% more, so I multiplied 20% by 50 kg and added it, so then when it was at constant velocity there was no acceleration so her mass would be the same and when it was decelerating. I knew that her weight would be less so again I found her deceleration during that time interval and subtracted it, found the percentage and multiplied by 50 and then subtracted it.
Topic: Projectile Motion Question: A projectile is launched as shown in the animation (position is shown in meters
and time is in seconds). What is its speed when it reaches its maximum height? I Ok, so one more. Think aloud as you solve the problem. S I read the question, so let it play, and see that it has...A projectile is launched, what is its speed
when it reaches its maximum height. Ok I'm thinking that maybe I'll need to find horizontal and vertical components. Let's see, I'm gonna find the maximum height here, ok, that is the maximum height. I'm thinking also that I might need to know the angle at which it was launched. let's see, we'll go and do that [[mumbling]]... decelerating...the speed when it reaches the maximum height, let's see, the maximum height is 1.4 so and there, let's see, it's going up and down, ok, I can find the initial x velocity which would be, the initial x velocity would be .037 divided by .02, change in distance over time, and I get 1.85, the initial x velocity. The initial y velocity, let's see .103 divided by .02, 5.15 m/s. and so I have those and here I can find the speed. Here I can find the velocity at the very tip-top using Pythagorean theorem, that's what I'm going to do. The speed when it reaches its maximum height, ok that's what I'm going to do. So, x velocity is going to be 1.01 minus .973, then divide by .02, equals, you get 1.85. the y velocity is 1.4 minus 1.399 divided by .02, and that is .05. So we have the x velocity and the y velocity, y being .05, x being 1.85. Should be able to find the speed although, ok, wait, .05 is the average y velocity between those 2 points. So to get, that's gonna be in the middle of the two points, so to get the speed at the end, I multiply by 2 to get .1. No that's not right. I'm thinking that for motion that's parabolic or motion in 2 directions, at the top of its path, there is not going to be any y velocity because it's decelerated. So let's see, I think that the velocity, or the speed when it reaches its maximum height is going to be 1.85 because it won't have any y velocity, and I'm going to see if that is the case by using Pythagorean theorem and seeing how close they are. So .05 squared plus 1.85 squared is, square root, is 1.85. So, I could have solve this much easier, much quicker, if I would have realized that at the beginning. So it's 1.85.
I So what do you remember when solving this problem. S St first I thought that maybe I would need the angle at which it is thrown or launched, and then I
realized that I could do it without, using the coordinates given and finding the 2 components of velocity. And then I realized that I don't even have to do that. All I have to do is find the x velocity, because at the top of its path, there would be no y velocity, so I should have just recognized that from the beginning, but I didn't, so I kind of had to go about it he long way. But I think I got the same answer either way.

277
7.11.6 Davidson Student 4
Topic: Average Velocity/Average Speed Question: (a) An object travels as shown in the animation. What is its average velocity
from time t=0 to time t=2? (position is shown in meters and time is in seconds.) Question: (b) What is the average speed of the object from time t=0 to t=2? (position is
shown in meters and time is in seconds.) I Ok, again, solve this problem, speaking aloud as you do. S Ok, so I'm gonna measure the initial velocity and the final velocity and divide it by 2 to get the
average velocity . I guess I'll step forward about, let's see, starting at 0,0, it travels 0.6 meters in .06 seconds, ??? 10 m/s positive, if I take positive this way, because it's gonna go back and we have to account for that. And then I guess near the end, the last 0.6 seconds, -7.5 plus ...,-8.14, well, -8.5, -8.36, divided by .06, I guess, -6 m/s, and then I average them, it's 4 divided by 2, 2 m/s. I guess that's right. What is the average speed from time 0 to time equals 2 seconds? That is different from velocity, it's going to be, the total distance traveled, you measure that from the beginning, when it bounces backwards. .5 seconds to travel 5, and then -8.5 within 3.5, in that direction. It travelled a total of about 13.5 meters and divide that by 2, it's going to be like 6.75, maybe. Yes, 6.75 m/s , and at first was positive, was negative, and this was positive, I guess, actually the first one was positive. ??? Ok, so that's the last one, 6.75 ???
I Ok, now what do you remember as you solved the problem. S I distinguished between, I looked at both (a) and (b) first, at the same time, and seeing if there was
any velocity and speed, then velocity I would have to take in directions. For the first one I took just an average velocity with the negative and the positive and the velocity at the beginning and the velocity at the end and divided by 2. And I just did some calculations. On the second one I just did the total distance traveled, and divided it by time to get 6.75 m/s.
Topic: Newton’s Second Law Question: An elevator accelerates upward for one second, travels at constant velocity, and
then decelerates one second prior to reaching its destination such that it comes to rest. If a 50 kg woman stands on a scale in the elevator, what will the scale read (in Newtons) when t is between 0 and 1 second? (Position is shown in meters and time is in seconds. Assume g=9.8 m/s2.)
I Go ahead and solve that problem, speaking aloud. S I'm just reading it right now. I need acceleration so I need to find the velocity between, in, the first
second. I'm going to do change in velocity. In the first, 0.1, it's going to be.01 in .1. And by the end of the first second, .19 the change over .1, the change in velocity of... well, that wasn't right. Ok, the acceleration of about 1.8 m/s squared. Newton's Second Law which equals mass times acceleration, in the first second when it's, it will be the mass times acceleration which is 1.8 m/s

278
squared, plus g, I guess the total acceleration. F net , we should have to solve for ma, times 50 times 1.8 plus 50 times 9.8, about 580 Newtons, it will read between 0 and 1.
I Tell me what you were thinking as you solved the problem S I knew that gravity and acceleration mattered, as far as the elevator, so I knew I had to measure the
acceleration of the elevator. You measure acceleration by measuring the change in velocity from like a first ???. Once I got the acceleration in that first second, I used Newton's Second Law, the force equals mass times acceleration, I wasn't sure how to do that with g, kind of guessing on that part, but ??? heavier when you're going up than what you would normally weigh on the ground. That kind of makes sense that my answer's close.
Topic: Projectile Motion Question: A projectile is launched as shown in the animation (position is shown in meters
and time is in seconds). What is its speed when it reaches its maximum height? I Good, let's go to the next one. S I'm just reading it. Ok, you figure it's a projectile problem. It talks about the speed when it
reaches its maximum height. The y coordinate is not really gonna matter here because it will be all x at that point, at its maximum height, so I'll go ahead and look at it. I think it's vx=1/2 a t squared, well, x equals xo + vxot. I don't see...it's been a while. alright I know x will be, there will be no y velocity in the y direction, so after you get the time, well, I actually can get the time by looking at it, I guess at 1, I'll look at the maximum height here, 1.4. I could find the initial velocity and the time is .54 and its x coordinate is 1. So 1 equals vxot, 1 divided by .54 would be 1.85 m/s, that's the speed at that point.
I Ok, good, so tell me what you remember thinking about when solving this problem. S I remembered, when I saw maximum height before I even looked at it, that v didn't matter how far,
or did matter, but at its maximum height it's only going to be velocity in the x direction, there will be no y component anymore, so I can pretty much discount the component part of it, that component part. I remembered the equations x=vxot, and I didn't have to find the time like I thought I was. I just looked up here. I kind of guessed on where the middle was here. That could be kind of erroneous, but I guess it kind of worked out if it was about 1 here. Once I needed the x position after time, I just divided it and used the equation to get an answer.
7.12 Appendix 12: Experiment 3 Interview Analysis
Verbal statements were coded according to the categories in Figure 3.7. In some
instances, punctuation in the original transcriptions of Section 7.11 was changed to more

279
accurately reflect the sentence structure in the original verbalization. Each student’s
verbal report is organized here according to the question that was being answered.
7.12.1 NCSU Student 1
Topic: Projectile Motion Question: A projectile is launched as shown in the animation (position is shown in meters
and time is in seconds). What is its speed when it reaches its maximum height? I Click on problem 1 and tell me what you're thinking when you solve the problem. S RQ (Alright, I am looking for the speed as it reaches the maximum height as the projectile is
launched.) DS-C (So we are just going to start it) and RA (watch the pretty ball bounce and) DS-C (step back to near the height) DQ (to find out where the y component is at its greatest) MD (which seems to be at 1.4.) SC (So its y-velocity at that point is zero and the x velocity really hasn't changed.) DQ (So you can actually just measure how long it goes for one second.) MD (Its x position is 1.908 meters) MA (so it moved 1.908 meters in one second so it would be, velocity would be 1.908 m/s.)
Topic: Average Velocity/Average Speed Question: (a) An object travels as shown in the animation. What is its average velocity
from time t=0 to time t=2? (position is shown in meters and time is in seconds.) I Ok great. Let's go back and...[[Interviewer brings up the next problem on the computer]]...ok
speak aloud as you solve the problem. S RQ (Alright we want to know the average velocity from time 0 to time 2.)

280
RQ (Position is in meters) DS-C (so as we play,) RA (then gonna watch the object move, ok there we go,) DQ (see how far the object goes in 2 sec.) DS-C (So you let it play for 2 sec) DQ (to see where its final position is.) MD (So it moved to the left -8.5 meters.) DQ (Next we need to find out how far it went the first time before it changed direction.) MD (So it went 5 meters in 0.5 seconds for the first portion.) SC (So change in velocity over...or change in position over time) MA (would give you 10 m/s for the first component,) DS-C (and then as you go to...play out the rest of it,) MD (it moves from 5.5 to -8.5) MA (so that's 13.5 meters for 1.5 seconds which ends up being 9.) MA (The first average velocity was 10 m/s, the 9 was there for 1.5, and the 5, the 9, the second part was for 1.5 seconds to the first component or 0.5 seconds, so we are just gonna kinda fiddle and do an average velocity of 10 m/s times 0.5, 5 and then add those together and divide by 2 and that gives you 9.25 m/s,) EX (I think.)
I That's your answer to... S The average velocity. I Ok, go ahead and continue the problem. Question: (b) What is the average speed of the object from time t=0 to t=2? (position is
shown in meters and time is in seconds.) S RQ (Alright average speed,)
CA (oh yea average velocity, well that's average speed then, yea so it would be…) SC (just do the same thing average velocity use vectors and they would end up being...)

281
CA (Oh really I solved for the (b) part first. Oh yea so for the (b) part it's going...) MA (or 9.25 m/s.) RQ (For the (b) part) MA (the average velocity for the first one is 10 m/s to the right. The second one is after the change in direction is 9 m/s so the average velocity will be 1 m/s,) EX (I think, I'm not sure. I guess that's it. Let me think about that [[prolonged silence]]) EX (yea that's right)
Topic: Newton’s Second Law Question: An elevator accelerates upward for one second, travels at constant velocity, and
then decelerates one second prior to reaching its destination such that it comes to rest. If a 50 kg woman stands on a scale in the elevator, what will the scale read (in Newtons) when t is between 0 and 1 second? (Position is shown in meters and time is in seconds. Assume g=9.8 m/s2.)
I Ok, good, one more problem and likewise speak aloud as you solve the problem S RQ (So they want to know, so they want to know how much weight this woman is going to weigh
going up an elevator.) RQ (It travels at a constant velocity, so) RQ (oh, wait, it accelerates upward, then travels at a constant velocity, then decelerates.) DQ (Alright so we are gonna figure out what the average acceleration is between 0 and 1 second,) SC (and then use the F=ma equation) SC (so...and the average acceleration is change in velocity over change in time) MD (so it goes from 0…) SE (oh, I’m going to have to use an equation. Use one of the linear equations in this crazy book) DS ( [[prolonged silence while looking through book]]) SC (Ok so what we want to use is the change in position. So we’ re going to use y minus y zero equals, or final position minus initial position equals initial velocity times time minus one-half times acceleration times time squared, to solve for acceleration.) MD (In one second it travels over one meter.)

282
MA (The original velocity is 0 so original velocity times time will cancel out to be zero. We have minus one half ‘a’ times the time squared. It took one second so we end up with an acceleration of 2 meters per second squared. So if the woman weighs 50 kg and her mass is 50 kg and the acceleration is 2 meters per second squared that will give you her force that she experiences going up the elevator, so that's gonna equal one hundred Newtons.)
7.12.2 NCSU Student 2
Topic: Projectile Motion Question: A projectile is launched as shown in the animation (position is shown in meters
and time is in seconds). What is its speed when it reaches its maximum height? I Here's the first problem. Go ahead and answer it as you did before, speaking aloud. S RQ (The projectile is launched.)
EX (I can't remember my projectile equations without thinking about them.) RQ (A projectile is launched as shown in the animation. Height is in meters and time is in seconds. What is the speed when it reaches its maximum height?) RQ (Speed, ok, now this is a speed problem) SE (so now I have to think how to work speed.) DS-C (Ok, I'm just going to start it.) SC (Let's see, speed, speed, the speed is gonna be the directional. It doesn't matter which direction it's going.) EX (So let's see what am I thinking? This is obvious.) RQ (What is its speed when it reaches its maximum height?) EX (No, no, I'm not stupid,) SC (I was about to say zero. I was about to say it's zero, but that's only in the y direction. Ok, so y direction, zero,) DQ (x direction, I have to calculate. So let's look in the x world.) MD (The final time is time 2,) RA (oh wait a minute, that's not where it lands exactly.) ?? (I need to make a perfect parabola.)

283
DS-C (Play.) RA (It's going to land there,) DS-C (step back, line up the center of it.) EX (Now here's another problem I come up with sometimes is that once you go there, you can't. You have to go back until you know it moves.) MD (Now it's at 1.8. Ok, the center of the projectile is at 1.8, and the center of the projectile is, time is 1.8, position is 2 meters. So 1.0...) SC (Since the speed is only going to be given in the x direction and since x direction speed is constant, all I have to do is do an average velocity essentially.) MA (Do 2 divided by 1.08 which is 1.85.) CA (But seeing that significant digits are just 2 for x, I myself would put 1.85 or 1.9 as the answer, because it's 1.85185, so, a continual decimal, I would probably put 1.9 instead of just 2. But I would say 1.85, 1.9, or 2,) EX (but I don't know the rules for significant digits for this exercise.)
Topic: Average Velocity/Average Speed Question: (a) An object travels as shown in the animation. What is its average velocity
from time t=0 to time t=2? (position is shown in meters and time is in seconds.) I great, let's do another one. once again, solve the whole problem, both parts, thinking aloud as you
did before. S RQ (An object travels as shown in the animation. What is the average velocity from time 0 to time
2? Position is in meters and time is in seconds. What is the average velocity, speed, of the object?) RQ (So average velocity, average speed from time 0 to time 2.) DS-C (Start.) EX (Oh man, this is a good one.) RQ (Average velocity,) DQ (well let's look at the average displacement.) RA (A wicked motion on that one.) DQ (It's average displacement, total displacement,)

284
DS-C (pause, reset, ok. ) MD (s1, position 1, is 0 and t1 is 0. All right, position final is, RA (come on it's almost there,) MD (is -8.5, and time is 2. ) MA (We've got 2 over -8.5. So it's -8.5 divided by 2 which would be 2.25,) EX (If I did my math correctly,) CA (oh 4.25, which is equal to -4.25, I didn't put the negative in the calculator,) EX (I never do that I always catch it, it's an extra step in the calculator, why do it?) SD (so that's -4.25 for (a)).
Question: (b) What is the average speed of the object from time t=0 to t=2? (position is
shown in meters and time is in seconds.) RQ (Average speed,) SC (speed would be actual distance covered. Yea, speed is distance covered,) SC (let's see I think it's distance covered.) EX (I'm just getting real cautious. I can't believe I forgot this ???. Speed, wow it's real early, ???) SE (the speedometer of a car, so wait if it's taking off of the sign, that's right, it's in any direction, so I can calculate, that's right, so wait,) EX (how do I do this? It would be, ) DS-C (pause, reset, ok,) DQ (the first half of the run before it turns around, calculate the distance of that, then find the time, then from there.) [[operating animation, clicking step button to get object to desired position]] MD (Oh yea, 4.6 is y0, 4.8 is y0, 5.0 is y0, 4.7 is y0,) RA (It's bouncing back,) CA (What am I thinking, I'm looking at x thinking it's time. MD (ok 5, .5, 5 meters plus 8, then it moves 5 meters, negative, 5 plus 5 plus 8.5,) MA (divided by 2 seconds, so it's 18.5 divided by, 18.5 divided by 2, that equals 9.25, I could have done that in my head, 9.25.)

285
EX (I'm not sure if that's right, but it's my answer.)
Topic: Newton’s Second Law
Question: An elevator accelerates upward for one second, travels at constant velocity, and then decelerates one second prior to reaching its destination such that it comes to rest. If a 50 kg woman stands on a scale in the elevator, what will the scale read (in Newtons) when t is between 0 and 1 second? (Position is shown in meters and time is in seconds. Assume g=9.8 m/s2.)
I ok, let's look at the third problem. Once again, speak aloud as you solve the problem. S RQ (An elevator accelerates upward for one second, travels at constant velocity,)
EX ( I guess it travels at constant velocity after one second) RQ (and decelerates one second prior to reaching its destination such that it comes to rest. If a 50 kg woman stands on a scale in the elevator, what will the scale read in Newtons when t is between 0 and 1 second.) RQ (So the whole end stuff, oh I see, the stuff at the end is irrelevant. [[pause]] ok, all the information after that first second is not important, pretty much I think.) SE (let's see, I'm gonna have to go to an acceleration question because I don't have one of those position questions.) DS ([[looking in book]] ah, where are they at, almost there, come on where are you at, nope.) SE (ah 5 essential equations, can't use that because it's got velocity, can't, can't, can't. I need one with x. vo, vo is zero,wait, I assume vo is zero...I can't get rid of all the v's. I have to assume vo is 0. No, I can't do that.) EX (I know there's a simpler way to do this, I can't think of it right now, why not.) DQ (I have to calculate the acceleration) SC (because the acceleration will add on to 9.8 m/s squared and thus make her weigh more, essentially, to the scale.) EX (but I forget how to...) MD (Let's find my positions. s2 is equal to 1 for y. s0 is equal to 0. t1 is equal to 0, t2 is equal to 1.) EX (Ok, I know there's a way to do this.) SE (One of these equations have to work. It has to have acceleration in it.)

286
RQ (It doesn't say the elevator starts from rest.) SC (I assume it does because the lady has to get on the elevator, it had to be stopped unless she jumped on.) SD (So let's assume v0 is 0,) SC (then I could use, yea then I could use x-xo is equal to v0t minus, or plus, one half ‘a’ t squared.) MA (Now to find acceleration, let's see my position change is 1, my time, vo, one half a times, equal to 1 squared, so it's going to be equal to 1, one half plus a. ok acceleration is going to equal 2.) SC (Since she is going up, she'll be heavier when it goes up,) MA (plus her acceleration will go, [[writing on paper]] I could do a ?, that, and then her normal force on,) EX (ah wait a minute. this is easy, ok, I'm thinking too much about it.) MA (It will be added on to 9.8 so it's 11.8 m per s squared is her acceleration, times 50 kg. 590 Newtons, or 600.)
7.12.3 Davidson Student 1
Topic: Average Velocity/Average Speed Question: (a) An object travels as shown in the animation. What is its average velocity
from time t=0 to time t=2? (position is shown in meters and time is in seconds.) I Here is the first of the three. Go ahead and solve this one, thinking aloud as you do, and
afterwards, I'll ask you to report all that you were thinking. S RQ (Ok for the first part, (a),)
SC (velocity is displacement over time and you subtract final minus initial displacement over final time minus initial time. So at time, t2, is our final time; t0 is our initial time. [[long pause]] Ok displacements are the same, from, x0 is the initial point to [[long pause]] displacement is from the original position) MD (So from 0 is -8.5 m from the original point.) MA (So its velocity is 8.5 negative minus 0 equals 8.5 divided by 2. Its average velocity is -4.25 m/s.)

287
Question: (b) What is the average speed of the object from time t=0 to t=2? (position is shown in meters and time is in seconds.) SC (Whereas speed deals with the total distance traveled, not displacement,) DQ (so here we'll see how far it travels to on the positive x-axis as well as on the negative x-axis.) MD (Ok it goes as far as 3.5 and then back to 8.5) MA (so we'll subtract negative 8.5. So the total distance traveled for that is 12 meters both on the positive and negative x axis. So we'll subtract that from the initial position at 0. so its speed is 6 m/s.)
Topic: Newton’s Second Law Question: An elevator accelerates upward for one second, travels at constant velocity, and
then decelerates one second prior to reaching its destination such that it comes to rest. If a 50 kg woman stands on a scale in the elevator, what will the scale read (in Newtons) when t is between 0 and 1 second? (Position is shown in meters and time is in seconds. Assume g=9.8 m/s2.)
I ok, great, so let's take a look at a couple more problems, and again speak aloud as you solve the
problem. S [[long pause while reading question]]
RQ (Ok, we're dealing here with an elevator) SC (and acceleration equals velocity over time, change in velocity over change in time.) RQ (And also we're dealing with somebody's weight here, we want to know the woman's ...what the scale will read, essentially her weight) SC (which would equal her mass time the force of gravity on her.) RQ (So t equals 0 to t=1, the elevator is accelerating. The elevator...) SC (So the velocity will be changing too.) DS-C (Ok, start this and see how it goes.) MD (The initial position is 0, on y=0.) MD (After one second y=1.) SE (The elevator...I'm thinking how I figure how to find the velocity for this acceleration.)

288
SC (Since it's changing it's not really good to take the average because it's changing in that one second period.) SD (But we do know that the initial weight of the woman is 50*9.8) MA (which equals 490 Newtons. I just multiplied her mass time the force of gravity which is 9.8 which is 490 Newtons initially.) RA (Let's see how it goes. just gonna see...find the...I'm just kinda looking at how this elevator goes.) SD (If we know the initial position, we know the initial velocity equals 0. We know the time initial, or the time period is 1 second. We know that...) DQ (We don't know final velocity because it's changing.) MD (We do know initial x position which is, or y position, sorry, y is 0. final y equals 1.) SC (Let's see y final equals y initial plus v initial times time plus 1/2 a t squared. And that should give us acceleration since we know everything else.) MD (1 is our final position. Our initial position was 0 times the initial velocity which is 0 which cancels out the v-not times t. Then we have +1/2 a t squared. We are solving for a. We know that t=1 second, so that's 1, So we have 0.5 a equals 1. 1 divided by 0.5 equals 0.5, or equals 2, sorry, 2 equals a. So the acceleration during that time period equals 2 m/s squared.)
Projectile Motion Question: A projectile is launched as shown in the animation (position is shown in meters
and time is in seconds). What is its speed when it reaches its maximum height? I ok, good, ok let's look at one more. again speak aloud as you solve the problem. S [[long pause]]
SC (Ok speed equals distance over time at when it reaches its maximum height.) SC (Velocity will only be, or the speed of the thing will only be in the horizontal direction. Its...horizontal direction, ) DS-C (let's see I'm going to play it,) RA (see where it goes,) ... DS-C (step back) and see where... MD (Ok the ball is launched from a position where x and y are 0.) MD (Position is x=0 y=0...at its maximum point, x=1.01 and y=1.4.)

289
RQ (Let's see what is the speed at its maximum height? What is its speed?) EX (I'm trying to remember how to do projectiles) SC (because they have both x components and y components so you have to...) SC (I know at the top, it stopped at its highest peak, so its velocity will be 0 there.) SC (For the x coordinate, 0, acceleration will be 0.) EX (I think that's right, I don't remember.) SC (So at the top v final equals 0.) DQ (I think the projectile's launched, so I don't think I know the initial velocity.) EX (Yea, well I'm not sure about that,) SD (so we know that v final equals 0.) MD (We know that the position at the top is y=1.4, x=1.01.) EX (I can't remember the formulas for projectile motion.) DQ (initial position....we don't know, I don't think we know, initial velocity... is launched...) but we do know that final velocity equals 0, so let's see final velocity at the time is 0,) MD (the time at the top is 0.54, so it takes 0.54 seconds.) SC (so v equals v-not plus a-t,) EX (I can't remember.) CA (That won't work because we don't know initial velocity I don't think.) SC (Let's see, another formula.) DQ (We know x, let's see y, v equals, do we know that? I think it's launched with an initial velocity, so we don't know that at all. We know again final velocity is zero. Looks to be that we could find this initial velocity.) RQ (What is its speed when it reaches its maximum height?) SD (Its velocity at the top is 0.) DQ (So the only way that I would know how to solve this,) EX (since I've forgotten,) DQ (is to measure how fast it's going as close to its final point as possible. Well, acceleration is...speed is...ok we'll do that...we're gonna say that...)

290
DQ (We'll take two points up here and try and find this change in x to relate it to speed, the velocity to the speed,) CA (because...let's see...oh I don't know how to do that because of the x and y component...) RQ (What is its speed when it reaches its maximum height...speed, speed, speed.) SC (Speed equals distance over time. The distance it traveled.) CA (The problem of this for me is that distance has both x and y components, and so you would have to break it down into its x and y components,) EX (and I don't necessarily know how to do that here.) MD (Its initial x and y positions are 0 and the final is 1.01 and 1.4.) SC (It's got components, speed is not a vector,) RQ (speed, speed when it reaches its maximum height,) SC (speed, distance over time,) DQ (x and y components, we know again that v0 at the top is 0.) DP (Can you break it down from the x side and the y side?) EX (We could do that I think. I think this is as far as I can go because I don't remember how to do, break it into components, x and y like that.)
7.12.4 Davidson Student 2
Topic: Average Velocity/Average Speed Question: (a) An object travels as shown in the animation. What is its average velocity
from time t=0 to time t=2? (position is shown in meters and time is in seconds.) I again speak aloud as you solve this problem. S RA (Ok, I'm going to look at the screen first) and ?
MD (that time is equal to 0.) RQ (I’m gonna read the problem. An object travels as shown in the animation, what is its average velocity from t=0 to t=2.) DS (And I'm just gonna write that down.) RQ (t is equal to 0 and t is equal to 2.)

291
DQ (Because I know that they're gonna have a position.) ?? (And then I'm gonna read the...) DS-C (let me go ahead and start...) RA (so…ok, it's going back and forth kind of weird. Ok and it stops.) DS-C (So I'm going to restart it.) RQ (And what is its average velocity from t is equal to 0.) MD (So at t =0, x is equal to 0 and y is equal to 0. When t=2, ) DS-C (I'm going to go ahead and play it and stop it at 2.) MD (ok, x is equal to, look closely, -8.5, y is equal to 0. ) SC (Let's see, velocity takes into account displacement.) DS (I'm going to make sure it's ok. I'm going to look in the book.) SC (Velocity is signified by magnitude and the direction. Average velocity is displacement over time elapsed.) SC (So velocity is equal to displacement over time.) MA (So I'm gonna say, displacement is -8.5 minus 0 over 2 minus 0. That is -8.5 divided by 2, is equal to -4.25. So that is the average velocity, m/s. so that's the answer to (a).)
Question: (b) What is the average speed of the object from time t=0 to t=2? (position is shown in meters and time is in seconds.) RQ (Now for (b), what is the average speed of the object from t is 0 to t, 2.) SC (Speed is,) DS (go back to that same page,) SC (speed is distance traveled over time elapsed, the distance traveled over time.) DS (I'm gonna write down that definition.) DQ (So actually, you do the same thing.) MA (Distance traveled will be change in x which would be -8.5 over 2 which is -4.25 m/s.) DS-C (Let me go back and play it.)

292
EX (It doesn't really seem right, but we'll stop it there.) Topic: Newton’s Second Law Question: An elevator accelerates upward for one second, travels at constant velocity, and
then decelerates one second prior to reaching its destination such that it comes to rest. If a 50 kg woman stands on a scale in the elevator, what will the scale read (in Newtons) when t is between 0 and 1 second? (Position is shown in meters and time is in seconds. Assume g=9.8 m/s2.)
I ok, good. let's go to the next one. again, speak aloud as you solve the problem. S RA (Ok, looking at it, there's nothing on there.)
RQ (An elevator accelerates upward for one second travels at constant velocity, ok, upwards for one second and then travels at constant velocity and decelerates one second prior to reaching its destination, then it comes to rest. A 50 kg woman stands on the scale in the elevator. What will the scale read when t is between 0 and 1 second?) DS-C (I'm gonna go ahead and start it. I'm gonna go ahead and reset it again.) MD (At the very beginning, t is equal to 0, x is equal to 0, and y is equal to 0.) DS-C (And then it's going to..., I'm gonna do it till 1 second because the elevator accelerates upward for one second. I'm gonna play it until it gets to 1. I went over, so I'm gonna back it up.) MD (And then at t=1, y=1, and x is the same, I'm not gonna worry about that.) RQ (And then ...ok wait...an elevator accelerates upward for one second, travels at constant velocity,) DS-C (and then I'm gonna let it play all the way through because I can't remember what the final time was.) MD (Final time is t=6 and y=10.) RQ (It says 1 second before reaching its destination,) DS-C (so I'm gonna back it up to t is equal to 5,) MD (and when t is equal to 5, y is equal to 9.) RQ (so between t1, t=1, t=5, its going to...an elevator accelerates upward for one second. so its accelerating through here;) DS (I'm gonna write "a" betwen those two.)

293
RQ (And then travels at constant velocity, so this is constant velocity. I'm just gonna write "constant velocity" there and then between t5 and t6, it's going to be, it's gonna decelerate.) RQ (Let me go back and read it again. If a 50 kg, m=50 kg, woman stands on a scale in the elevator, what will the scale read in Newtons when t is between 0 and 1 second.) DQ (So, t=0 and t=1 will give you 2 positions, and g=9.8m/s squared.) EX (I'm kind of blank on how to do this.) DS (I'm gonna go back to the book, and I'm looking for a picture with this woman in the elevator. I think it's chapter 4. No it's not.) SC (Hold on...I'm gonna draw a picture of the woman and say, her weight is a force going down, and then since acceleration is equal to...is going up, and then there's the force that's going up, force normal going up. So force normal minus mg is equal to mass times acceleration.) EX (That doesn't sound right.) DS (Let me go figure out what I'm doing wrong. It's on page 131, chapter 5. the picture says that an object in an elevator at rest exerts a force on a spring scale equal to its weight and in an elevator accelerating upward at 1/2g, the object's apparent weight is 1/2 times larger. I'm just reading this.) SE (So right here in the book there's an equation. W-mg=ma, which I have, which I wrote down, force normal-mg=ma.) DQ (Let's see you want to find what W is,) SC (so force normal minus mass of the woman, is 50 kg, times gravitation, gravity which is 9.8, is equal to 50 times acceleration. and acceleration is change in velocity over change in time) DS-C (and I'm going to go back to the beginning) DQ (because it's between 0 and 1 and I'm gonna figure out velocity now so first velocity is,) DS-C (I'm going to step it up pretty quickly just to the next step,) DQ (to find that velocity) MD (so .01 minus 0 over .1-0 will be the velocity, the first velocity.) MA (So that's .01 divided by .1which is .1.) DS-C (And then you go up to, step it up, to) DQ (right before number 1.) MD (It goes, let's see, time is equal to 1 and y is equal to 1.) DS-C (You step it back down.) MD (.81 minus .9.)

294
MA (so 1-.81 divided by 1-.9 that's gonna equal 1.9. So 1.9 over .1, this is for acceleration, is going to be...no 1.9-.1 over change in t which is 1 second. 1.9 minus .1 divided by .1, excuse me, divided by 1, equal to 1.8. So 1.8 is the acceleration, or average acceleration. Go back and plug that in to W-50 times 9.8 is equal to 50 times the acceleration. So 50 times 1.8, and then 50 times 9.8 so 90 minus 490. Ok W is equal to -400. That's a force so that's newtons.) CA (When I go back and look in the book, and it says, let's see, in an elevator accelerating upward, the object's apparent weight is 1 and a half times larger. Well, -400 does not sound good. It doesn't make sense. It should be negative...) ?? (Do you want me to stop now when I get this answer?)
Topic: Projectile Motion Question: A projectile is launched as shown in the animation (position is shown in meters
and time is in seconds). What is its speed when it reaches its maximum height? I ok, great. one more. S RA (Ok, looking at it there's nothing on the screen.)
DS (I'll go ahead and read it.) RA (t is equal to 0.) RQ (A projectile is launched as shown in the animation ??? what is its speed when it reaches its maximum height?) DS-C (Ok, let me go ahead and start it. Stop it. Reset it.) RQ (Let's see, you want to get speed when it goes...) DS (I'm going to draw a picture of it, what I think it did.) MD (When it's right here before it starts, t is equal to 0, x is equal to 0, y is equal to 0.) DS-C (And then I'm gonna let it play, and then we'll wait. Ok, pause; go back. ??? I'm gonna let it play, and then back up.) RA (Right here it's at its maximum height, looking at it on the screen, that's where I think it is.) MD (x is equal to 1.4.) DS-C (I'm gonna go down a little bit, nope, I'm gonna go back a little bit, that's it.) MD (It's maximum height is x is equal to 1.01, y is equal to 1.4, and t is equal to .54.)

295
DS-C (I'm gonna let it play til the end. So it won't go any farther and then back up the time until it changes. And when it changes, I'm gonna go back.) MD (t is equal to 1.08, x is equal to 2, and y is equal to 2.) RQ (I'm gonna read it again…) DS (I'm gonna go back to this chapter in the book about projectiles. It's chapter 2 I think, or no, it’s chapter 3, I guess…. Ok, and I'm looking at example 3.4. ) SE (Calculate the maximum height. At the maximum height, the velocity is horizontal, so vy here is equal to 0. And that, let's see, the equation uses t is equal to vyo over g. We know the time, so we don't have to worry about that. And then it says that from that equation, y0=0, we have y is equal to vyot-1/2gt squared. I'm just gonna go ahead and plug it in. Let's see but we're doing, no wait.) RQ (We have to find speed) so, DS-C (skip back at the highest point,) SC (there's no vertical component of the velocity. There is only the horizontal component which remains constant throughout the flight.) SC (v is equal to vxo which is equal to vo cosine of the angle.) DS-C (Let me go back, to what I think is the top, go back some more.) RA (I'm just gonna look at it and see.) SC (It does have a velocity, so I'm not thinking that velocity is equal to 0 which sometimes happens when you throw it up and it comes down.) SE (Let's see... I'm gonna go to another problem. I'm gonna go to the kinematic equations, the ones with speed when it reaches its maximum height. Velocity initial… I'm gonna go ahead and solve this.)
SE (y is equal to 1.4. Velocity, that's zero, is equal to negative 1/2 g over t squared. We know that so. Trying to look up the equations because it was several chapters ago and) EX (I can't really remember,) ok, SC (velocity is equal to velocity plus acceleration. We've got this equation, v is equal to vo + at. And we know that velocity is equal to velocity initial which is 0 plus acceleration, which is 9.8, times the time which is 1., the time at the highest point is 1.4, excuse me.) MA (I'm gonna multiply that out. 9.8 times .54 is equal to, velocity is equal to 5.292. that's my answer.)
7.12.5 Davidson Student 3

296
Topic: Average Velocity/Average Speed Question: (a) An object travels as shown in the animation. What is its average velocity
from time t=0 to time t=2? (position is shown in meters and time is in seconds.) I go ahead and do this one. S DS (First I'm going to read the question.)
DS-C (So I'm going to let it play and) RA (see what it does. And I see it goes back and forth and then in the first part...) DS-C (let it play again.) RA (see how far it goes. Alright, so it goes until is stops. It looks like it moves at constant velocity, moving to the right, ) DQ (so I'm going to see what the velocity is when it's moving to the right, see if it's constant.) RA (So let's see...and it looks like it is constant.) MD (So the velocity to the right is going to be .2/.02,) MA (10 m/s.) RA (And then it stops there and goes back to the left, and goes left of the velocity.) MD (.3 meters every .2 seconds. So let's see, it's negative ...) EX (I'm beginning to think that I'm going about this a very long way. [[long pause]]]) RQ (I'm reading the question again. [[long pause]]) SD (Let's say to the right is positive, so it's positive 10 to the right.) DQ (The average velocity... so I need to find the average velocity when it moves to the left. To do that I need the final velocity,) SC (which you get by 2 points at the very end, ) MD (which would be -8.38 minus 8.4... 8.5. The difference is .12 divided by a time of .02. MA (that's six at the end.) MD (At the very beginning, it moves to the left, and it's going, changing .3 over the same time interval .02, and that's 15, or negative 15.) MA (So I'm going to add those together, -15 and -6, and get 21 divided by 2. 10.5 is the average velocity to the left, negative 10.5. So I would say that the average velocity would be -10.5 + 10, .5 divided by 2 would be negative .25 m/s would be the answer to (a).)

297
Question: (b) What is the average speed of the object from time t=0 to t=2? (position is
shown in meters and time is in seconds.) MA (and (b), the average speed would be 10.5.) SC (It's going to be positive because speed is not, a vector.) MA (10.5 plus 10 would be 20.5 divided by 2, would be 10.25 m/s, is the average speed.)
Topic: Newton’s Second Law Question: An elevator accelerates upward for one second, travels at constant velocity, and
then decelerates one second prior to reaching its destination such that it comes to rest. If a 50 kg woman stands on a scale in the elevator, what will the scale read (in Newtons) when t is between 0 and 1 second? (Position is shown in meters and time is in seconds. Assume g=9.8 m/s2.)
I Once again, speak aloud as you solve the problem. S DS (I'm reading the question.)
RQ (Accelerates and then it's constant and then it decelerates. So the t is between 0 and 1 second, it's going to be accelerating,) DQ (so I need to find the acceleration from time is 0 to time is 1. So I'm going to find the acceleration to find the change in velocity.) MD (Well it starts from rest, so the initial velocity is 0, and then let's see, the final velocity is going to be let's see, 1 point...I found the 2 y-values, it changes .19, so divided by change in time which is .1,) MA (get 1.9 m/s is the final velocity minus initial velocity, would still be 1.9 m/s, and then divide by 1, no 2, to get the average. No, divide by 1 second, that's the time interval, and you get an acceleration of 1.9 m/s where,) SC (so now I'm going to divide by what percentage of g that is.) MA (So 1.9 divided by 9.8 is .19 and then some other decimal places. And then I'm going to multiply that by 50 to get a percent of her weight , and then figure that...ok..so 1.9 is about 19.4% of g. So I multiply 19.4 times 50 kg and got 9.7, so I want to add that to 50 kg and get 59.7 kg will be her, what the scale reads between 0 and 1 second.) RQ (Let's see travels at a constant velocity, and then ??? after it accelerates, it travels at a constant velocity) MA (so her weight, her mass, then is going to be 50 kg.)

298
The first part, it was 59.7. and then the second part is going to be 50 kg again because there is no acceleration, and then the last part it decelarates in the last second, I need to find the velocity when it's at 5 seconds which will be .19. oh wait it's going into this with constant velocity. we're gonna do it like this. ok so it's moving at .2 m in .1 seconds. so that it's moving initially going into the final second at 2 m/s then it decelerates and it's going to stop, so the final velocity is 0. so initial velocity minus final velocity is 2m/s divided by 1 second. and you get an accelreation of 2 m/s, well, deceleration, so it'll be negative, so the woman is going to weigh less when decelerates so 2, find out what percentage of 9.8 that is, and then it's about 20 percent. and then I muultipley that by her weight, would be her mass 50 kg. and get 10.2. I'm going to subtact that from 50kg. and get 39.8 as her weight when it is decelerating...her mass.
Topic: Projectile Motion Question: A projectile is launched as shown in the animation (position is shown in meters
and time is in seconds). What is its speed when it reaches its maximum height? I ok, so one more. think aloud as you solve the problem. S DS (I read the question,)
DS-C (so let it play,) RA (and see that it has…) RQ (A projectile is launched, what is its speed when it reaches its maximum height?) DQ (Ok I'm thinking that maybe I'll need to find horizontal and vertical components. Let's see, I'm gonna find the maximum height here. Ok, that is the maximum height. I'm thinking also that I might need to know the angle at which it was launched.) ??? (Let's see, we'll go and do that [[mumbling]]... decelerating...) RQ (The speed when it reaches the maximum height,) MD (let's see, the maximum height is 1.4 so) RA (and there, let's see, it's going up and down,) DQ (ok, I can find the initial x velocity which would be,) MD (the initial x velocity would be .037 divided by .02, change in distance over time,) MA (and I get 1.85, the initial x velocity.) MD (The initial y velocity, let's see .103 divided by .02,) MA (5.15 m/s.)

299
DP (And so I have those and here I can find the speed, here I can find the velocity at the very tip-top using Pythagorean theorem, that's what I'm going to do. The speed when it reaches its maximum height, ok that's what I'm going to do.) MD (So, x velocity is going to be 1.01 minus .973, then divide by .02, equals,) MA (you get 1.85.) MD (The y velocity is 1.4 minus 1.399 divided by .02,) MA (and that is .05. So we have the x velocity and the y velocity, y being .05, x being 1.85.) MA (Should be able to find the speed although, ok, wait, .05 is the average y velocity between those 2 points. So to get, that's gonna be in the middle of the two points, so to get the speed at the end, I multiply by 2 to get .1.) CA (No that's not right. I'm thinking that for motion that's parabolic or motion in 2 directions, ) SC (at the top of its path, there is not going to be any y velocity because it's decelerated.) MA (So let's see, I think that the velocity, or the speed when it reaches its maximum height is going to be 1.85) SC (because it won't have any y velocity,) CA (and I'm going to see if that is the case by using Pythagorean theorem and seeing how close they are. So .05 squared plus 1.85 squared is, square root, is 1.85. So, I could have solve this much easier, much quicker, if I would have realized that at the beginning. So it's 1.85.)
I so what do you remember when solving this problem. S At first I thought that maybe I would need the angle at which it is thrown or launched, and then I
realized that I could do it without, using the coordinates given and finding the 2 components of velocity. and then I realized that I don't even have to do that, all I have to do is find the x velocity, because at the top of its path, there would be no y velocity, so I should have just recognized that from the beginning, but I didn't, so I kind of had to go about it he long way. But I think I got the same answer either way.
7.12.6 Davidson Student 4
Topic: Average Velocity/Average Speed Question: (a) An object travels as shown in the animation. What is its average velocity
from time t=0 to time t=2? (position is shown in meters and time is in seconds.) I ok, again, solve this problem, speaking aloud as you do. S DQ (ok, so I'm gonna measure the initial velocity and the final velocity)

300
SC (and divide it by 2 to get the average velocity.) DS-C (I guess I'll step forward about, let's see,) MD (starting at 0,0, it travels 0.6 meters in .06 seconds,) MA (??? 10 m/s positive, if I take positive this way,) SC (because it's gonna go back and we have to account for that.) MD (And then I guess near the end, the last 0.6 seconds, -7.5 plus ...,-8.14, well, -8.5, -8.36, divided by .06, I guess, -6 m/s, ) MA (and then I average them, it's 4 divided by 2, 2 m/s.) EX (I guess that's right.)
Question: (b) What is the average speed of the object from time t=0 to t=2? (position is shown in meters and time is in seconds.) RQ (What is the average speed from time 0 to time equals 2 seconds?) SC (That is different from velocity, it's going to be, the total distance traveled,) DQ (you measure that from the beginning, when it bounces backwards.) MD (.5 seconds to travel 5, and then -8.5 within 3.5, in that direction.) MA (It traveled a total of about 13.5 meters and divide that by 2, it's going to be like 6.75, maybe. Yes, 6.75 m/s,) CA (and at first was positive, was negative, and this was positive, I guess, actually the first one was positive. ??? Ok, so that's the last one, 6.75 ???)
Topic: Newton’s Second Law Question: An elevator accelerates upward for one second, travels at constant velocity, and
then decelerates one second prior to reaching its destination such that it comes to rest. If a 50 kg woman stands on a scale in the elevator, what will the scale read (in Newtons) when t is between 0 and 1 second? (Position is shown in meters and time is in seconds. Assume g=9.8 m/s2.)
I go ahead and solve that problem, speaking aloud.

301
S DS (I'm just reading it right now.)
DQ (I need acceleration so I need to find the velocity between, in, the first second. SC (I'm going to do change in velocity.) MD (In the first, 0.1, it's going to be.01 in .1. and by the end of the first second, .19 the change over .1, the change in velocity of...) CA (well, that wasn't right.) MA (ok, the acceleration of about 1.8 m/s squared.) SC (Newton's Second Law which equals mass times acceleration, in the first second when it's, it will be the mass times acceleration which is 1.8 m/s squared, plus g, I guess the total acceleration. F net , we should have to solve for ma,) MA (times 50 times 1.8 plus 50 times 9.8, about 580 Newtons, it will read between 0 and 1.)
Topic: Projectile Motion Question: A projectile is launched as shown in the animation (position is shown in meters
and time is in seconds). What is its speed when it reaches its maximum height? I good, let's go to the next one. S DS (I'm just reading it.)
RQ (ok, you figure it's a projectile problem.) RQ (It talks about the speed when it reaches its maximum height,) SQ (the y coordinate is not really gonna matter here because it will be all x at that point, at its maximum height,) ?? (so I'll go ahead and look at it.) SE (I think it's vx=1/2 a t squared, well, x = xo + vxot.) EX (I don't see...it's been a while. ) SC (Alright I know x will be, there will be no y velocity in the y direction,) DQ (so after you get the time, well, I actually can get the time by looking at it,) MD (I guess at 1, I'll look at the maximum height here, 1.4. I could find the initial velocity and the time is .54 and its x coordinate is 1.) MA (So 1 equals vxot, 1 divided by .54 would be 1.85 m/s, that's the speed at that point.)


![Titus 2 Discipleship Ministry - pcacep.orgpcacep.org/downloads/WIC/Titus 2 Discipleship.pdf · 1 Titus 2 Discipleship Ministry . But as for you [Titus], teach what accords with sound](https://img.dokumen.tips/doc/110x75/5ae25b6c7f8b9ad47c8d029a/titus-2-discipleship-ministry-2-discipleshippdf1-titus-2-discipleship-ministry.jpg)