Embed Size (px)
Citation preview

ABSTRACT
Title of Document: INVESTIGATION OF JP-8 AUTOIGNITION UNDER VITIATED COMBUSTION CONDITIONS
Casey Charles Fuller, M.S., 2011
Directed by: Professor Gregory Jackson, Chair Department of Mechanical Engineering
Limited data on jet fuel ignition and oxidation at low-O2, vitiated conditions has
hindered the validation of kinetic models for combustion under such conditions. In this
study, ignition delay time experiments of JP-8 have been performed with vitiated air at low
pressures. Initially, the effects of temperature, equivalence ratio, and mole fractions of
vitiated components on JP-8 ignition at 1 atm were screened to discover that temperature, O2
and NO have the largest significance. A following detailed investigation examined the effect
on JP-8 ignition of larger concentrations of NO (0 - 1000 ppm) at lower temperatures (700 -
900 K), pressure (0.5 - 1.0 atm) and O2 mole fractions (12 - 20%). Results show that even
trace amounts of NO dramatically enhance the oxidation of JP-8 with reduction in ignition
delay time of up to 80%. Significant coupling exists between NO and the other design
variables (temperature, oxygen level and pressure) as related to the effect of NO on ignition.
An empirical model relating temperature, O2 and NO to ignition delay time of JP-8 has also
been developed.

Report Documentation Page Form ApprovedOMB No. 0704-0188
Public reporting burden for the collection of information is estimated to average 1 hour per response, including the time for reviewing instructions, searching existing data sources, gathering andmaintaining the data needed, and completing and reviewing the collection of information. Send comments regarding this burden estimate or any other aspect of this collection of information,including suggestions for reducing this burden, to Washington Headquarters Services, Directorate for Information Operations and Reports, 1215 Jefferson Davis Highway, Suite 1204, ArlingtonVA 22202-4302. Respondents should be aware that notwithstanding any other provision of law, no person shall be subject to a penalty for failing to comply with a collection of information if itdoes not display a currently valid OMB control number.
1. REPORT DATE 2011 2. REPORT TYPE
3. DATES COVERED 00-00-2011 to 00-00-2011
4. TITLE AND SUBTITLE Investigation of JP-8 Autoignition Under Vitiated Combustion Conditions
5a. CONTRACT NUMBER
5b. GRANT NUMBER
5c. PROGRAM ELEMENT NUMBER
6. AUTHOR(S) 5d. PROJECT NUMBER
5e. TASK NUMBER
5f. WORK UNIT NUMBER
7. PERFORMING ORGANIZATION NAME(S) AND ADDRESS(ES) University of Maryland, College Park,College Park,MD,20742
8. PERFORMING ORGANIZATIONREPORT NUMBER
9. SPONSORING/MONITORING AGENCY NAME(S) AND ADDRESS(ES) 10. SPONSOR/MONITOR’S ACRONYM(S)
11. SPONSOR/MONITOR’S REPORT NUMBER(S)
12. DISTRIBUTION/AVAILABILITY STATEMENT Approved for public release; distribution unlimited
13. SUPPLEMENTARY NOTES
14. ABSTRACT Limited data on jet fuel ignition and oxidation at low-O2, vitiated conditions has hindered the validation ofkinetic models for combustion under such conditions. In this study, ignition delay time experiments of JP-8have been performed with vitiated air at low pressures. Initially, the effects of temperature, equivalenceratio, and mole fractions of vitiated components on JP-8 ignition at 1 atm were screened to discover thattemperature, O2 and NO have the largest significance. A following detailed investigation examined theeffect on JP-8 ignition of larger concentrations of NO (0 - 1000 ppm) at lower temperatures (700 - 900 K),pressure (0.5 - 1.0 atm) and O2 mole fractions (12 - 20%). Results show that even trace amounts of NOdramatically enhance the oxidation of JP-8 with reduction in ignition delay time of up to 80%. Significantcoupling exists between NO and the other design variables (temperature, oxygen level and pressure) asrelated to the effect of NO on ignition. An empirical model relating temperature, O2 and NO to ignitiondelay time of JP-8 has also been developed.
15. SUBJECT TERMS
16. SECURITY CLASSIFICATION OF: 17. LIMITATION OF ABSTRACT Same as
Report (SAR)
18. NUMBEROF PAGES
132
19a. NAME OFRESPONSIBLE PERSON
a. REPORT unclassified
b. ABSTRACT unclassified
c. THIS PAGE unclassified
Standard Form 298 (Rev. 8-98) Prescribed by ANSI Std Z39-18
INVESTIGATION OF JP-8 AUTOIGNITION UNDER VITIATED COMBUSTION CONDITIONS
By
Casey Charles Fuller
Thesis submitted to the Faculty of the Graduate School of the University of Maryland, College Park, in partial fulfillment
of the requirements for the degree of Master of Science
2011
Advisory Committee: Professor Gregory Jackson, Chair Associate Professor André Marshall Associate Professor Peter Sunderland

© Copyright by Casey Charles Fuller
2011

ii
Acknowledgements This research has been supported and funded by Combustion Science and Engineering, Inc.
through the following SBIR grants from the United States Air Force:
Topic # AF081-057 Contact: Barry Kiel
Phase I: FA8650-08-M-2879 Phase II: FA8650-09-C-2009
The author would like to thank P. (Gokul) Gokulakrishnan, Michael Klassen, and Richard
Roby for their technical assistance and guidance. The author would also like to acknowledge
Maclain Holton for his assistance in setup of the experimental apparatus and Brent Turner for
his support in the design, manufacturing, assembly, and operation of the flow reactor system.
Dr. Tim Edwards of the Air Force Research Laboratory at Wright-Patterson Air Force Base
is acknowledged and thanked for providing the jet fuel used in this study.

iii
Table of Contents
TABLE OF CONTENTS ......................................................................................................... iii
LIST OF FIGURES ...................................................................................................................v
LIST OF TABLES .................................................................................................................. vii
NOMENCLATURE .............................................................................................................. viii
CHAPTER 1: INTRODUCTION ........................................................................................1
1.1 Problem Definition.........................................................................................................1 1.2 Literature Review...........................................................................................................3
1.2.1 Vitiated Combustion and the Effect of NO ..............................................................3 1.2.2 Autoignition Delay Time .........................................................................................8
1.3 Thesis Objectives and Chapter Summary ....................................................................10
CHAPTER 2: EXPERIMENTAL SETUP AND DESIGN ...............................................13
2.1 Phase I Screening Study - Experimental Setup and Apparatus ...................................15 2.1.1 Overview of Apparatus ..........................................................................................15 2.1.2 Vitiated Air Supply and Heating............................................................................17 2.1.3 Fuel Supply and Vaporization ...............................................................................19 2.1.4 Steam Generation ...................................................................................................21 2.1.5 Mixing Section and Diffuser ..................................................................................22 2.1.6 Flow Reactor Tube and Furnace ............................................................................24 2.1.7 Ignition Measurement System ...............................................................................24 2.1.8 Temperature Profiles ..............................................................................................28
2.2 Phase I Screening Study - Experiment Procedure and Design ....................................29 2.2.1 Experimental Procedure and Methodology ...........................................................29 2.2.2 Design of Experiment ............................................................................................30 2.2.3 Non-Vitiated Air Comparison................................................................................33
2.3 Phase II Detailed Investigation - Experimental Setup and Apparatus .........................34 2.3.1 Overview of Apparatus ..........................................................................................34 2.3.2 Extension of Flow Reactor Tube ...........................................................................37 2.3.3 Modifications to Mixing Section and Diffuser ......................................................39 2.3.4 Improvements and Additions to Heating System ..................................................42 2.3.5 Transition Piece and Vacuum System ...................................................................45 2.3.6 Fuel Vaporization and Supply ...............................................................................46 2.3.7 Solenoid, PMT and Data Acquisition ....................................................................47 2.3.8 Temperature Profiles ..............................................................................................50
iv
2.4 Phase II Detailed Investigation - Experimental Procedure and Design .......................53 2.4.1 Experimental Procedure .........................................................................................53 2.4.2 Experimental Variables and Test Matrix ...............................................................54 2.4.3 Baseline Comparison .............................................................................................55
CHAPTER 3: PHASE I SCREENING STUDY - RESULTS AND DISCUSSION ........58
3.1 Table of Results ...........................................................................................................58 3.2 Significance of Main and Two-Factor Interaction Effects ..........................................58 3.3 Examination of Main Effects .......................................................................................65
3.3.1 Effect of O2 ............................................................................................................66 3.3.2 Effect of Temperature ............................................................................................68 3.3.3 Effect of NO ...........................................................................................................70
3.4 Interaction Effect of Temperature and NO ..................................................................72
CHAPTER 4: DETAILED STUDY - RESULTS AND DISCUSSION ...........................76
4.1 Tables of Results ..........................................................................................................76 4.2 Atmospheric Results ....................................................................................................77
4.2.1 Direct Effects of Temperature, O2 and NO on Ignition Delay Time of JP-8 .........78 4.2.2 Interaction of Temperature with NO ......................................................................81 4.2.3 Interaction of O2 with NO ......................................................................................84 4.2.4 Empirical Ignition Delay Time Correlation ...........................................................87
4.3 Sub-Atmospheric Results.............................................................................................94
CHAPTER 5: SUMMARY, CONCLUSIONS, AND FUTURE WORK .........................98
5.1 Summary of Results .....................................................................................................98 5.1.1 Summary of Screening Study Results ....................................................................98 5.1.2 Summary of Detailed Investigation Results ..........................................................99
5.2 Conclusions ................................................................................................................101 5.3 Future Work ...............................................................................................................102
APPENDIX ...........................................................................................................................105
A.1 Measurement Variability ...........................................................................................105 A.2 Test Reproducibility...................................................................................................106
A.2.1 Phase I Screening Study.......................................................................................106 A.2.1 Phase II Detailed Investigation ............................................................................107
A.3 Phase I Screening Study Test and Effects Matrices ...................................................109 A.4 Phase II Detailed Investigation Test Matrices ...........................................................114
REFERENCES ......................................................................................................................118
v
List of Figures
Figure 2–1: Flow reactor apparatus used for screening study. ............................................16
Figure 2–2: Flow diagram for Phase I. ................................................................................17
Figure 2–3: Fuel and vitiated air heating system for initial screening study. ......................18
Figure 2–4: Fuel vaporizer diagram for screening study. ....................................................20
Figure 2–5: Vaporizer and solenoid valve schematic for screening study ..........................21
Figure 2–6: Flow reactor mixing section for screening study. ............................................23
Figure 2–7: Radial species profiles of CO2 (a) and O2 (b) at 3 axial locations within the test section ........................................................................................................24
Figure 2–8: Solenoid and PMT signals CH* chemiluminescence measurements. .............25
Figure 2–9: Experimental and theoretical ignition delay time correction using prototype comparison mixtures of n-heptane/air .............................................................28
Figure 2–10: Test section temperature profiles for screening study. ....................................29
Figure 2–11: Box-Behnken design for 7 variables.[51] ........................................................32
Figure 2–12: Comparison of non-vitiated JP-8 IDT at atmospheric pressures to previous studies of Gokulakrishnan et al. [4][41] and Freeman & Lefebvre [39]. ........34
Figure 2–13: Flow diagram for Phase II. ...............................................................................35
Figure 2–14: Flow reactor apparatus used for detailed phase experiments. ..........................36
Figure 2–15: Extended flow reactor diagram and temperature capacities. ...........................39
Figure 2–16: Modified mixing section and diffuser. .............................................................41
Figure 2–17: Alignment of diffuser T/Cs. .............................................................................42
Figure 2–18: Axial locations of T/C’s in multipoint probe. ..................................................43
Figure 2–19: Fuel vaporizer, N2 bypass and solenoid valve schematic for detailed investigation .....................................................................................................45
Figure 2–20: Diagram of exhaust and vacuum transition piece. ...........................................46
Figure 2–21: Diagram of fuel vaporizer used for detailed investigation. ..............................47
Figure 2–22: Solenoid and PMT traces for OH* chemiluminescence traces. .......................49
Figure 2–23: Atmospheric test section temperature profiles for detailed study at various temperature settings. ........................................................................................51
Figure 2–24: Sub-atmospheric test section temperature profiles for detailed study at various temperature settings. ........................................................................................52

vi
Figure 2–25: Comparison of atmospheric JP-8 IDT from detailed investigation to jet fuel experimental IDT data from Gokulakrishnan et. al. [4][41] and Freeman & Lefebvre [39] ...................................................................................................55
Figure 2–26: Comparison of atmospheric JP-8 IDT to atmospheric n-decane IDT data. .....56
Figure 3–1: Main effects of experimental variables on ignition delay time of JP-8 ...........60
Figure 3–2: Normalized main factor and two-factor interaction effects of experimental design variables based on ignition delay time. ................................................62
Figure 3–3: Average IDT for each main factor of all tests for a given variable ranking. ...64
Figure 3–4: Average % change in IDT from -1 ranking of each main factor .....................65
Figure 3–5: Calculated adiabatic flame temperature of Jet-A(C12H23)/vitiated air .............68
Figure 3–6: Comparison of the averaged main, combined and two-factor interaction effect of temperature and XNO. -1, 0, & +1 values for temperature and XNO are .......73
Figure 3–7: Comparison of the averaged effects of temperature and XNO. .........................75
Figure 4–1: Atmospheric ignition delay time results of JP-8 and vitiated air comprised of 20% O2 and 80% N2 .........................................................................................77
Figure 4–2: Atmospheric ignition delay time results of JP-8 and vitiated air comprised of 12% O2 and 88% N2. ........................................................................................78
Figure 4–3: Comparison of current and previous experimental IDT of JP-8 4177 to surrogate model prediction[4][41]. ..................................................................79
Figure 4–4: Comparison of temperature-NO interaction on reduction of atmospheric JP-8 ignition and vitiated air comprised of 20% O2 and 80% N2. ...........................82
Figure 4–5: Comparison of temperature-NO interaction on reduction of atmospheric JP-8 ignition and vitiated air comprised of 12% O2 and 88% N2. ...........................83
Figure 4–6: Comparison of O2-NO interaction on reduction of atmospheric JP-8 ignition and vitiated air at 850 K and 900 K. ................................................................86
Figure 4–7: Atmospheric ignition delay time results of JP-8 and vitiated air comprised of 20% O2 and 80% N2 with emirical predictions using eq. 11. ..........................90
Figure 4–8: Atmospheric ignition delay time results of JP-8 and vitiated air comprised of 12% O2 and 88% N2 with emirical predictions using eq. 11. ..........................90
Figure 4–9: Arrhenius plot for atmospheric ignition delay time results of JP-8 and vitiated air comprised of 20% O2 and 80% N2 with empirical predictions. .................92
Figure 4–10: Sub-atmospheric ignition delay time results of JP-8 and vitiated air comprised of 20% O2/80% N2 and 12%O2 /88% N2. ........................................................95
Figure 4–11: Comparison of the relative reduction of JP-8 ignition delay time from the 0 ppm NO condition along 900 K temperature test cases at 0.5 and 1.0 atm .....96

vii
List of Tables
Table 1-1: Low Pressure Vitiated Combustion Envelope ...................................................2
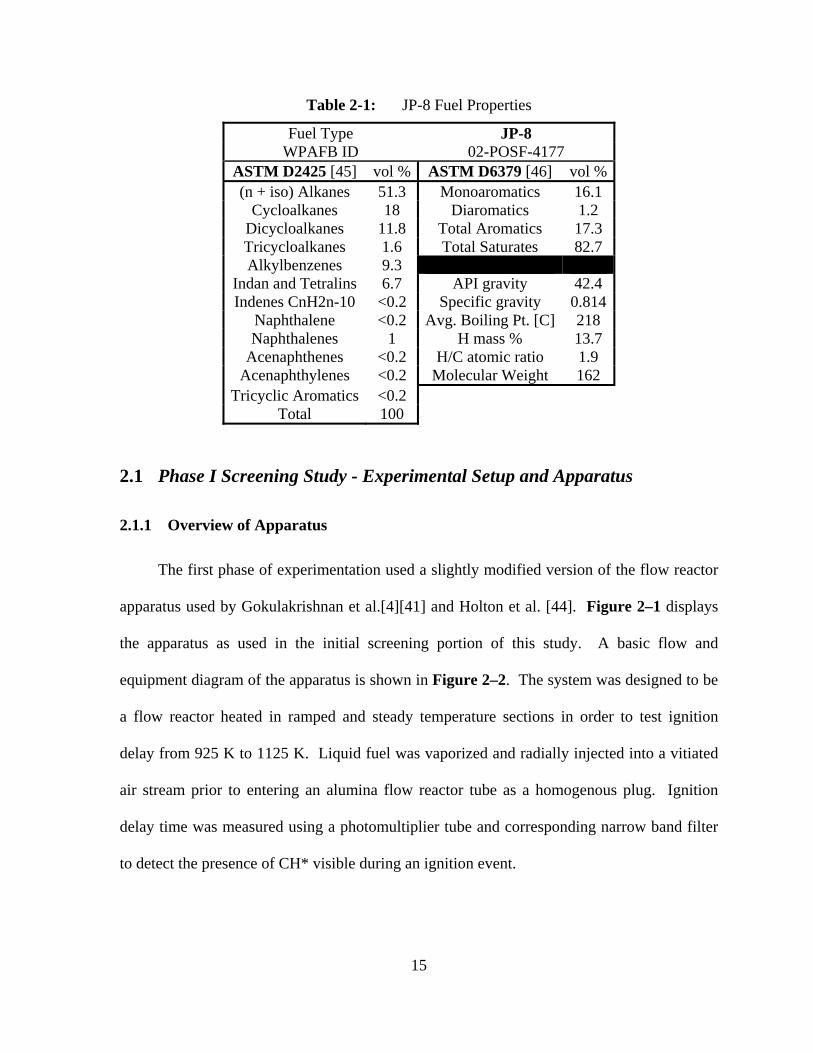
Table 2-1: JP-8 Fuel Properties .........................................................................................15
Table 2-2: Screening Study Design Variables and Test Values ........................................33
Table 3-1: Example 8-Test Block.. ....................................................................................66
Table 3-2: Phase I Tests 33-40 ..........................................................................................66
Table 3-3: Phase I Tests 41-48 ..........................................................................................67
Table 3-4: Phase I Tests 49-56 ..........................................................................................67
Table 3-5: Phase I Tests 9-16 ............................................................................................69
Table 3-6: Phase I Tests 25-32 ..........................................................................................69
Table 3-7: Phase I Tests 41-48 ..........................................................................................69
Table 3-8: Phase I Tests 17-24 ..........................................................................................70
Table 3-9: Phase I Tests 9-16 ............................................................................................71
Table 3-10: Phase I Tests 33-40 ..........................................................................................71
Table 4-1: Goodness of Emperical Model Fits at 1 atm ....................................................89
Table A-1: Measurement Variability - Detailed Investigation .........................................108
Table A-2: Screening Study Test Matrix and Results ......................................................109
Table A-3: Matrix of Main Effects...................................................................................111
Table A-4: Matrix of Two-Factor Interaction Effects ......................................................112
Table A-5: Detailed Investigation Atmospheric Test Matrix - Nominal Values .............114
Table A-6: Results for Atmospheric Tests of JP-8 and O2/N2/NO Mixtures ...................115
Table A-7: Results for Sub-atmospheric Tests of JP-8 and O2/N2/NO Mixtures ............116
Table A-8: Results for all Tests of n-Decane (n-C10) and O2/N2/NO Mixtures ...............117
viii
Nomenclature
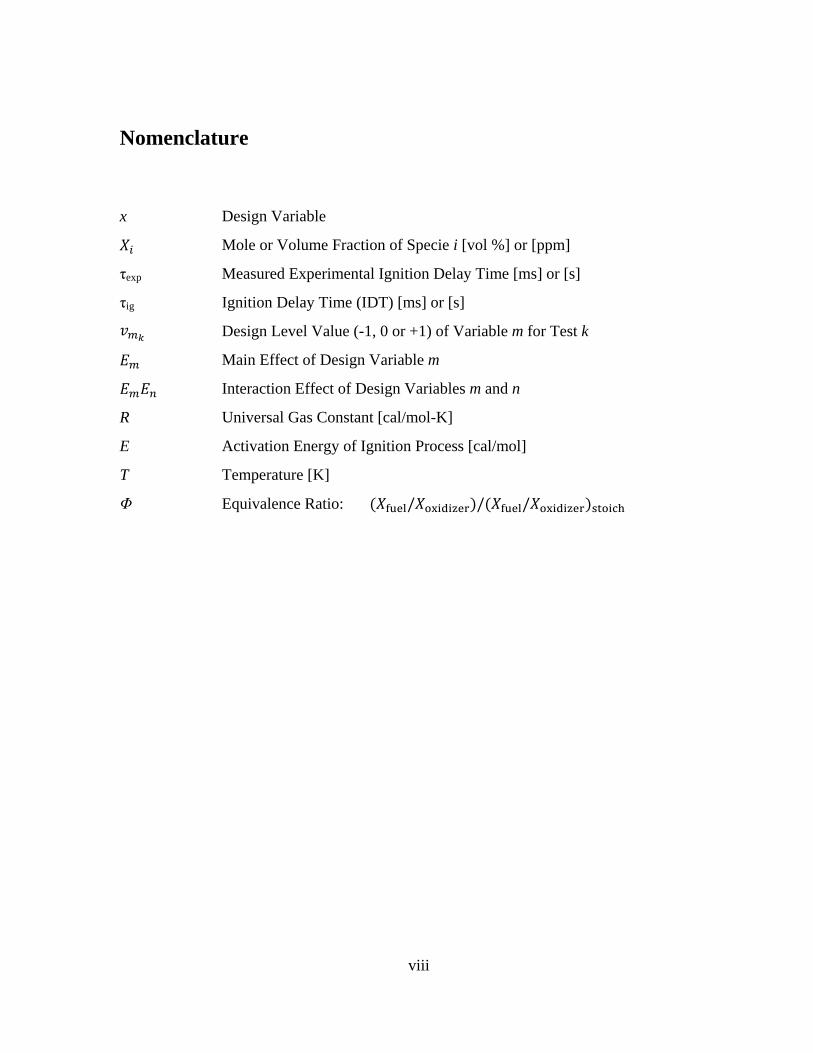
x Design Variable
Mole or Volume Fraction of Specie i [vol %] or [ppm]
τexp Measured Experimental Ignition Delay Time [ms] or [s]
τig Ignition Delay Time (IDT) [ms] or [s]
Design Level Value (-1, 0 or +1) of Variable m for Test k
Main Effect of Design Variable m
Interaction Effect of Design Variables m and n
R Universal Gas Constant [cal/mol-K]
E Activation Energy of Ignition Process [cal/mol]
T Temperature [K]
Φ Equivalence Ratio: / / /
1
Chapter 1: Introduction
1.1 Problem Definition
The word “vitiate” finds its origin in the Latin verb vitiare, meaning to spoil or
corrupt [1]. In scientific and medical fields, vitiated air is defined as air containing reduced
amounts of oxygen. In the field of combustion, “vitiated combustion” typically refers to any
combustion processes occurring in the presence vitiated air, defined as an oxidizer stream
with oxygen levels less than that of normal air (XO2 < 21 vol%) and/or containing other
products of combustion including CO2, CO, H2O, and NOX. Vitiated conditions are often the
result of flue or exhaust gas recirculation (EGR) into a fresh air stream, which can found in
many practical combustion system including gas turbine combustors, automobile engines,
and furnaces to reduce emissions and/or improve efficiency [2]. Vitiated combustion is also
used in aircraft engines where fuel is injected into the turbine exhaust at low pressures to
increase engine thrust [3].
The significance of individual vitiated air components on fuel oxidation is not fully
understood. Currently, there exist several detailed kinetic models for kerosene based jet fuel
and gasoline oxidation including those by Gokulakrishnan et al. [4], Curran et al. [5], Dooley
et. al. [6], Dagaut et al. [7] and the CRECK modeling group [8]-[10]. However, there is
considerable uncertainty in these mechanisms in terms of the kinetic effects of vitiated air on
combustion as they have not been tested against experimental data sets, specifically
regarding the effect of vitiated air components on the ignition of jet fuels at low pressures.
To develop an accurate chemical kinetic model for vitiated conditions, an
experimental database of auto-ignition delay time under various temperatures, equivalence
2
ratios and vitiated air compositions is necessary to provide data for model comparison and
validation. In general, kinetic models for kerosene-type fuels have thus far been validated
and optimized against experimental data that were obtained using “normal” air (21% O2) at
higher pressures. The kinetic, transport and thermodynamic effects of typical vitiated species
including diluent effects, third-body collision efficiencies of CO2 and H2O, and kinetic
enhancement or inhibition of oxidation due to the presence of NOX species in vitiated air are
thought to play a role on the oxidation and ignition of jet fuels at low pressures.
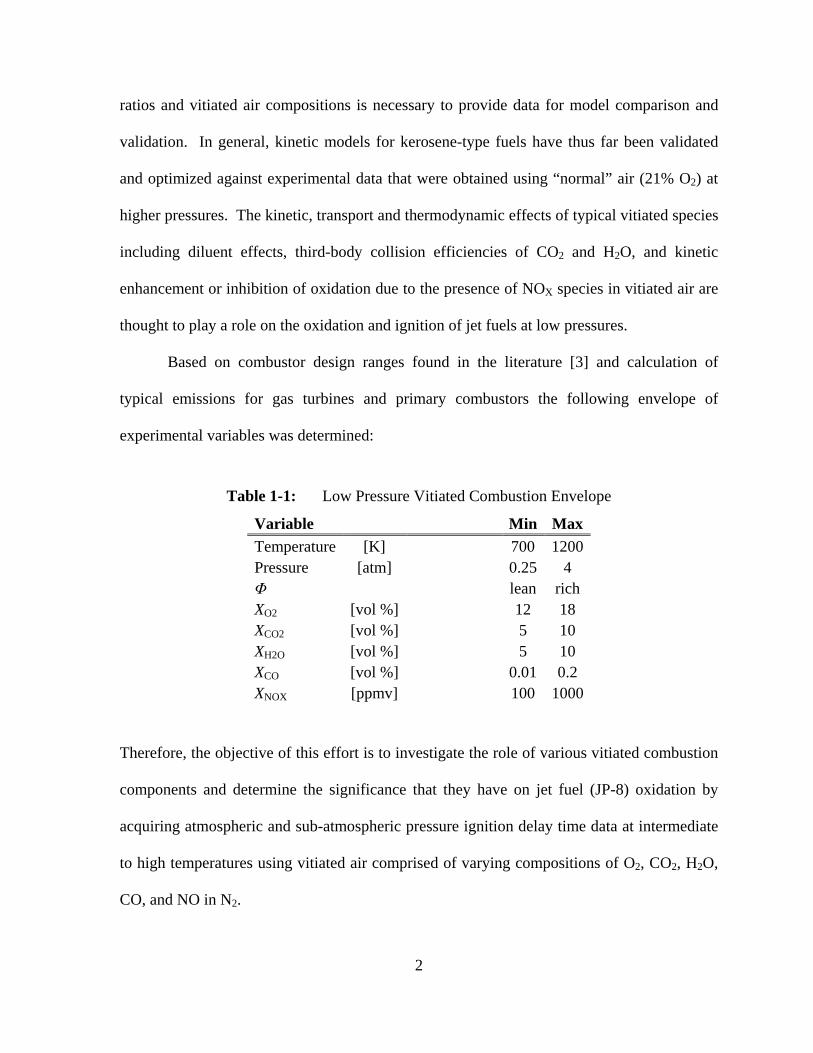
Based on combustor design ranges found in the literature [3] and calculation of
typical emissions for gas turbines and primary combustors the following envelope of
experimental variables was determined:
Table 1-1: Low Pressure Vitiated Combustion Envelope
Variable Min Max Temperature [K] 700 1200 Pressure [atm] 0.25 4 Φ lean rich XO2 [vol %] 12 18 XCO2 [vol %] 5 10 XH2O [vol %] 5 10 XCO [vol %] 0.01 0.2 XNOX [ppmv] 100 1000
Therefore, the objective of this effort is to investigate the role of various vitiated combustion
components and determine the significance that they have on jet fuel (JP-8) oxidation by
acquiring atmospheric and sub-atmospheric pressure ignition delay time data at intermediate
to high temperatures using vitiated air comprised of varying compositions of O2, CO2, H2O,
CO, and NO in N2.
3
1.2 Literature Review
Examination of previously published works for this study consisted of two major
areas: assessment of previous investigations into the effect of vitiated oxidizer components
on the oxidation of hydrocarbons and an examination of methods used to measure the
autoignition delay time of liquid hydrocarbons at low pressures. A review of the relevant
literature for each of these areas is discussed in the following sections.
1.2.1 Vitiated Combustion and the Effect of NO
There are few reported works in the literature that investigate the effect of vitiated air
compositions on jet fuel oxidation at aircraft engine relevant conditions. Some data was
found in the literature examining the effects of H2O, CO2 and CO on fuel oxidation and
ignition [11][12] however the primary vitiated species found to affect ignition and oxidation
of hydrocarbons are nitrogen oxide species (NOX). The effect of NOX on smaller
hydrocarbons, e.g. methane and butane, and hydrogen ignition [13]-[16] and oxidation [17]-
[21] has been studied extensively over the years.
A study by Seiser et al. [11] investigated the influence of water vapor on the
extinction and ignition of hydrogen and methane flames. The addition of up to 15 vol% H2O
to the reactant stream for both premixed and nonpremixed flames made the flames easier to
extinguish due to both chemical and thermodynamic influences. In the case of ignition,
nonpremixed H2 flames were given initial reactant concentrations of H2O up to 20 vol%.
The study found that larger fractions of H2O resulted in higher autoignition temperatures. Le
Cong et al. [12] examined the effects of both CO and CO2 from burnt gas recirculation on the
oxidation of natural gas and natural gas/syngas mixtures through ignition delay, flame

4
structure, jet-stirred reactor (JSR), plug flow reactor (PFR) and shock tube measurements.
The addition of 20% CO2 was found to only slightly inhibit the oxidation of mixtures of
CH4/O2/N2 and CH4/H2/O2/N2 in JSR experiments at 1 atm and 10 atm. Experiments were
also performed in the JSR at 1 atm with the addition of 0.4% CO in the reactant stream. The
study found slight enhancement of the oxidation of the CH4/H2 fuel due to increased
production of H atoms.
Significantly more data was found examining the effects of NOX on fuel ignition and
oxidation. Studies of the explosion and ignition behavior of H2-O2 and CH4-O2 mixtures in
the presence of nitric oxides date back to the first half of the 20th century through the work of
Thompson and Hinselwood [13] as well as Norrish and Wallace [14]. Dabora [15]
investigated the effect of NO2 on the ignition delay time of near-stoichiometric CH4/air
mixtures by varying the concentration of NO2 in the reactant stream up to 2 vol%. It was
found that addition of 0.12% NO2 and 1% to 2% NO2 reduced the overall activation energy
for ignition by 24% and 50% respectively. Slack and Grillo [16] examined the effect of NOX
on CH4 ignition in a shock tube study at temperatures ranging from 1310 K to 1790 K and
pressures of 1.8 atm to 3.6 atm.. It was found that NO2 has a significant effect on reducing
ignition time at these temperatures and pressures. For example, at 1600 K, a mixture of 4.8%
CH4 and 19.2% O2 balanced in Ar had an ignition delay time of approximately 300
microseconds. When a portion of the bulk Ar diluent was replaced with 0.8% NO2 and 3.4%
NO2, the ignition delay times reduced to approximately 100 microseconds and 20
microseconds respectively.
Two studies by Bromly et al. [17][18] examined the sensitized oxidation of
hydrocarbons and NO. In the first study, an isothermal, atmospheric flow reactor was used

5
for the experiments performed at 775 K to 975 K in which a mixture containing 440 ppm
CH4, 5% O2 and a balance of N2 was doped with initial concentrations of NO ranging up to
200 ppm. Increasing the initial concentration of NO was found to enhance oxidation up to
100 ppm at which point the consumption of CH4 plateaued and then decreased slightly up to
200 ppm. The second study investigated the sensitized oxidation of NO (0.01 ppm to 200
ppm) and n-butane (50 ppm to 600 ppm) at atmospheric pressure and temperatures from 650
K to 720 K. Results of this study showed that low concentrations of NO promote the
oxidation of n-butane, while low concentrations of n-butane mutually promote the conversion
of NO to NO2. Dagaut and Nicolle [19] performed a similar experimental and modeling
study examining effect of exhaust gas on fuel combustion through the mutually sensitized
oxidation of NO and methane. Results of this study show that at both 1 atm and 10 atm the
presence of 200 ppm NO enhanced oxidization and reduced the temperature required for fuel
oxidization for a given residence time.
Bendtsen et al. [20] investigated the oxidization of methane in the presence of NO
and NO2 in an isothermal plug flow reactor from 750 K to 1250 K in which, for the same
residence time, fuel oxidation occurred at lower temperatures when NO was added to the
reactants. More recently, Konnov et al.[21] performed a study in which a mixture of CH4
(1.77%) + O2 (0.89%) and N2 (balance) was reacted at 832 K at 1.2 bar in a tubular flow
reactor with an initial concentration of NO that was varied from 0 to 380 ppm. Results show
that the addition of NO up to approximately 200 ppm promotes the oxidation of CH4, while
200 to 380 ppm NO inhibits the oxidization of CH4.
While the examination of the effect of NOX on the oxidation of smaller hydrocarbons,
primarily methane, is extensive, there are much fewer data sets available for larger
6
hydrocarbons relevant to jet fuel and even less that examine actual multi-component fuel
blends relevant to kerosene, JP-8, or even gasoline oxidation. The studies in the literature
primarily investigated the effect that NOX has on oxidation of hydrocarbons through
speciation and emission examinations in very diluted fuel/oxidizer mixtures [22]-[26].
Moréac et al. [22] investigated the interaction of NO and higher order hydrocarbons
in a JSR at 10 atmospheres. In this work, the effect of NO on the oxidation of n-heptane, iso-
octane, methanol, and toluene was examined between 600 K and 1200 K. It was observed
that NO inhibited the oxidation of n-heptane in the low-temperature regime between 550 K
and 700 K, while it enhanced the oxidation in intermediate and high temperature regions. On
the other hand, NO promoted the oxidation of iso-octane and toluene in all temperature
regions above 600 K at 10 atm. However, Moréac et al. [23] also found that NO addition had
little effect on toluene oxidation in similar experiments at 1 atm. The measurements of NO
and NO2 indicate that the reaction pathways of NO-sensitized oxidation of hydrocarbons
differ depending on the temperature regime [22]. These findings have implications for jet
fuels and their surrogate mixtures for kinetic modeling which consist of significant
proportions of n-alkanes, iso-alkanes, and aromatics [4][27]-[29].
A subsequent study in the same reactor conditions as the Moréac work was performed
by Dubreuil et al. [24]. This study examined the effect of NO on the oxidation of binary
mixtures of n-heptane/iso-octane and n-heptane/toluene, common gasoline surrogate fuels.
For the fuel mixture of n-heptane and iso-octane, the addition of 50 ppm NO and 200 ppm
NO enhanced the oxidation of iso-octane at nearly all temperatures within the NTC region (~
625 K - 800 K) and above. For temperatures at and below the transition point from the NTC
to low temperature regime, the addition of NO was found to inhibit iso-octane oxidation.
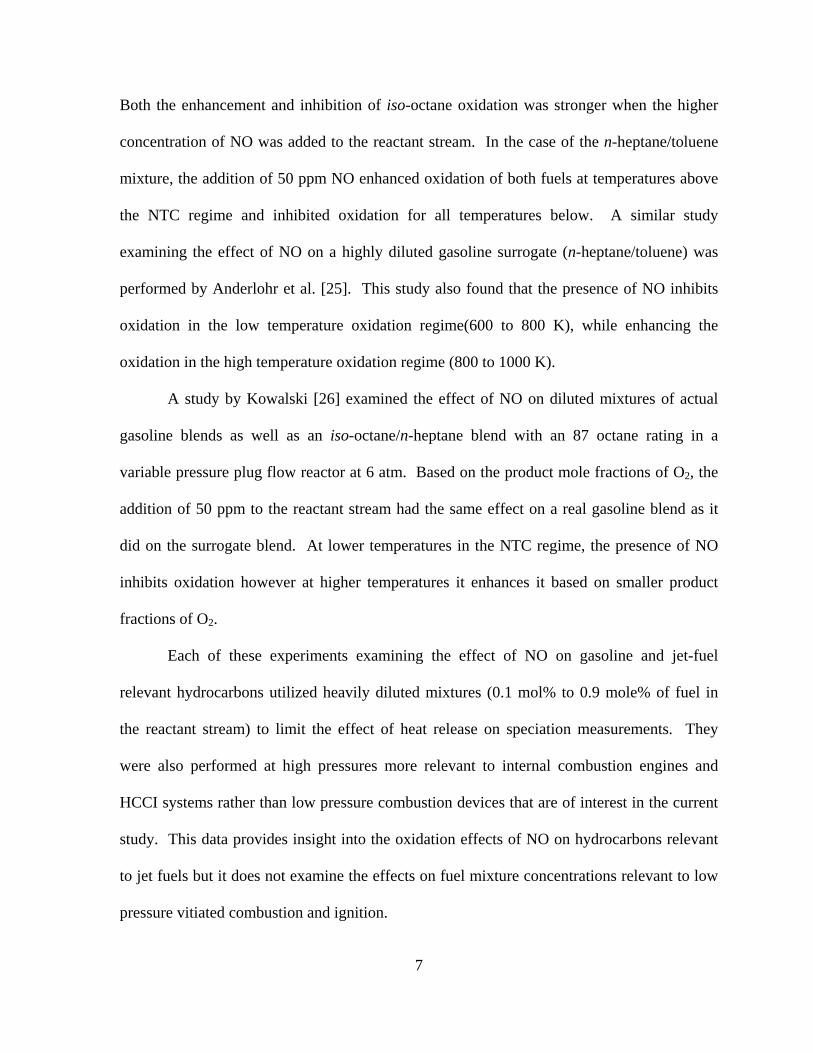
7
Both the enhancement and inhibition of iso-octane oxidation was stronger when the higher
concentration of NO was added to the reactant stream. In the case of the n-heptane/toluene
mixture, the addition of 50 ppm NO enhanced oxidation of both fuels at temperatures above
the NTC regime and inhibited oxidation for all temperatures below. A similar study
examining the effect of NO on a highly diluted gasoline surrogate (n-heptane/toluene) was
performed by Anderlohr et al. [25]. This study also found that the presence of NO inhibits
oxidation in the low temperature oxidation regime(600 to 800 K), while enhancing the
oxidation in the high temperature oxidation regime (800 to 1000 K).
A study by Kowalski [26] examined the effect of NO on diluted mixtures of actual
gasoline blends as well as an iso-octane/n-heptane blend with an 87 octane rating in a
variable pressure plug flow reactor at 6 atm. Based on the product mole fractions of O2, the
addition of 50 ppm to the reactant stream had the same effect on a real gasoline blend as it
did on the surrogate blend. At lower temperatures in the NTC regime, the presence of NO
inhibits oxidation however at higher temperatures it enhances it based on smaller product
fractions of O2.
Each of these experiments examining the effect of NO on gasoline and jet-fuel
relevant hydrocarbons utilized heavily diluted mixtures (0.1 mol% to 0.9 mole% of fuel in
the reactant stream) to limit the effect of heat release on speciation measurements. They
were also performed at high pressures more relevant to internal combustion engines and
HCCI systems rather than low pressure combustion devices that are of interest in the current
study. This data provides insight into the oxidation effects of NO on hydrocarbons relevant
to jet fuels but it does not examine the effects on fuel mixture concentrations relevant to low
pressure vitiated combustion and ignition.
8
Overall, the literature describes the effect of NOX on the oxidation of hydrocarbon
relevant to jet fuel as one that enhances in the intermediate to high temperature regime and
inhibits oxidation through the NTC region and the low temperature regime. This is true not
only for primary surrogate fuel components but for surrogate mixtures and actual fuel
(gasoline) blends as well. Studies that examined the effect of NOX and other vitiated or EGR
components play on the actual ignition of jet fuels were not found by the author.
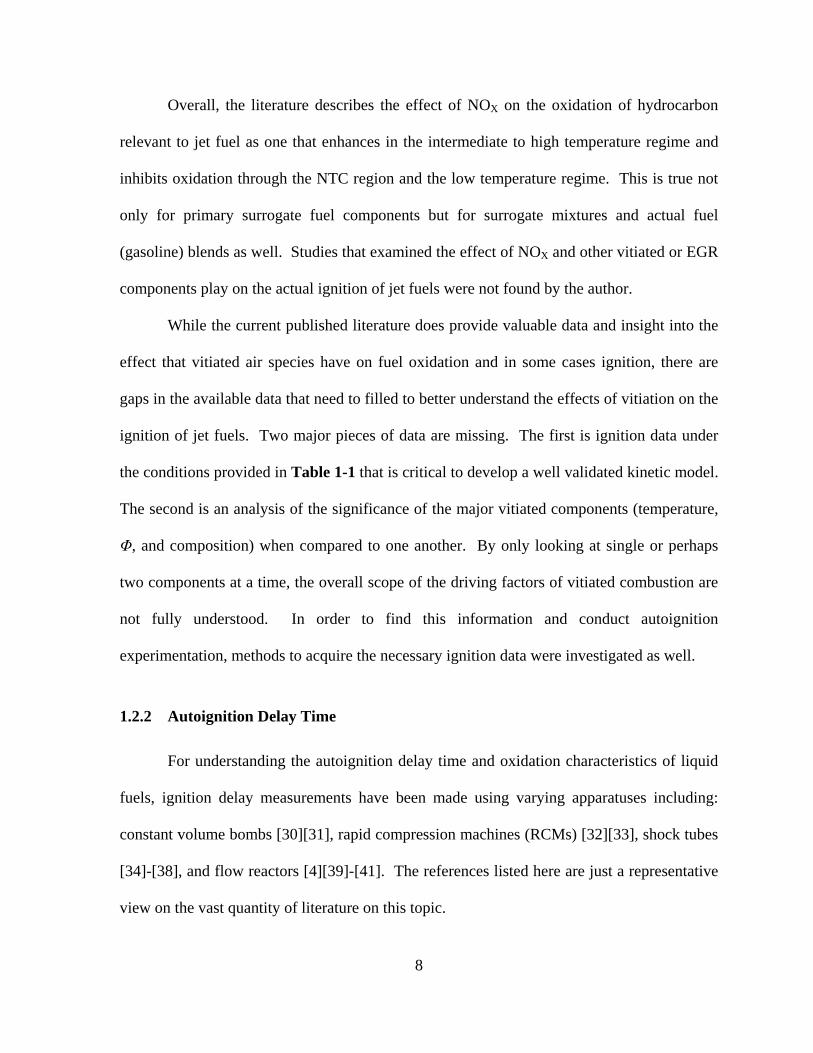
While the current published literature does provide valuable data and insight into the
effect that vitiated air species have on fuel oxidation and in some cases ignition, there are
gaps in the available data that need to filled to better understand the effects of vitiation on the
ignition of jet fuels. Two major pieces of data are missing. The first is ignition data under
the conditions provided in Table 1-1 that is critical to develop a well validated kinetic model.
The second is an analysis of the significance of the major vitiated components (temperature,
Φ, and composition) when compared to one another. By only looking at single or perhaps
two components at a time, the overall scope of the driving factors of vitiated combustion are
not fully understood. In order to find this information and conduct autoignition
experimentation, methods to acquire the necessary ignition data were investigated as well.
1.2.2 Autoignition Delay Time
For understanding the autoignition delay time and oxidation characteristics of liquid
fuels, ignition delay measurements have been made using varying apparatuses including:
constant volume bombs [30][31], rapid compression machines (RCMs) [32][33], shock tubes
[34]-[38], and flow reactors [4][39]-[41]. The references listed here are just a representative
view on the vast quantity of literature on this topic.
9
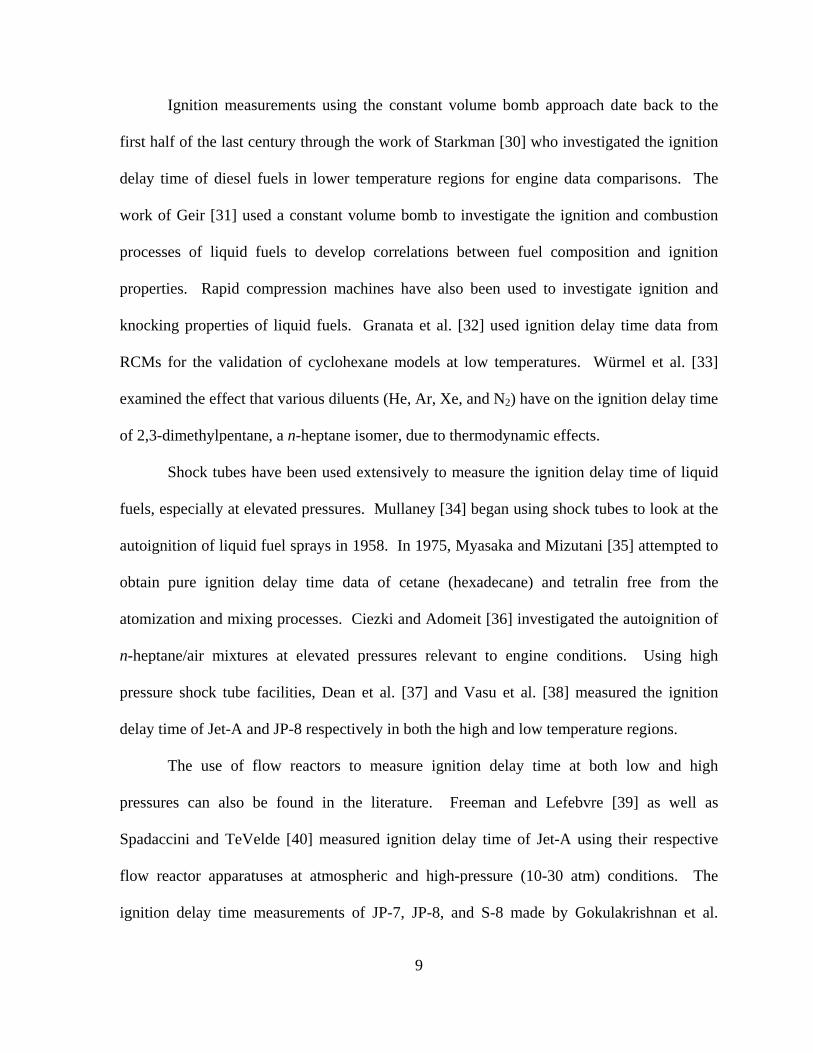
Ignition measurements using the constant volume bomb approach date back to the
first half of the last century through the work of Starkman [30] who investigated the ignition
delay time of diesel fuels in lower temperature regions for engine data comparisons. The
work of Geir [31] used a constant volume bomb to investigate the ignition and combustion
processes of liquid fuels to develop correlations between fuel composition and ignition
properties. Rapid compression machines have also been used to investigate ignition and
knocking properties of liquid fuels. Granata et al. [32] used ignition delay time data from
RCMs for the validation of cyclohexane models at low temperatures. Würmel et al. [33]
examined the effect that various diluents (He, Ar, Xe, and N2) have on the ignition delay time
of 2,3-dimethylpentane, a n-heptane isomer, due to thermodynamic effects.
Shock tubes have been used extensively to measure the ignition delay time of liquid
fuels, especially at elevated pressures. Mullaney [34] began using shock tubes to look at the
autoignition of liquid fuel sprays in 1958. In 1975, Myasaka and Mizutani [35] attempted to
obtain pure ignition delay time data of cetane (hexadecane) and tetralin free from the
atomization and mixing processes. Ciezki and Adomeit [36] investigated the autoignition of
n-heptane/air mixtures at elevated pressures relevant to engine conditions. Using high
pressure shock tube facilities, Dean et al. [37] and Vasu et al. [38] measured the ignition
delay time of Jet-A and JP-8 respectively in both the high and low temperature regions.
The use of flow reactors to measure ignition delay time at both low and high
pressures can also be found in the literature. Freeman and Lefebvre [39] as well as
Spadaccini and TeVelde [40] measured ignition delay time of Jet-A using their respective
flow reactor apparatuses at atmospheric and high-pressure (10-30 atm) conditions. The
ignition delay time measurements of JP-7, JP-8, and S-8 made by Gokulakrishnan et al.
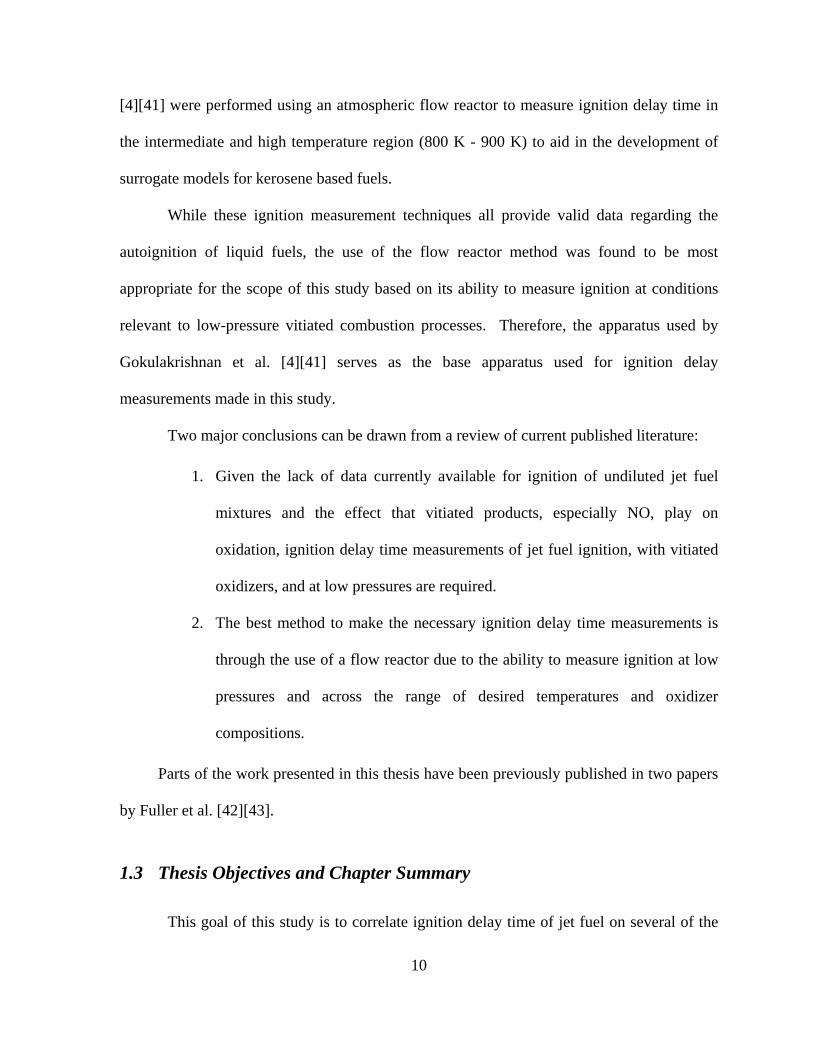
10
[4][41] were performed using an atmospheric flow reactor to measure ignition delay time in
the intermediate and high temperature region (800 K - 900 K) to aid in the development of
surrogate models for kerosene based fuels.
While these ignition measurement techniques all provide valid data regarding the
autoignition of liquid fuels, the use of the flow reactor method was found to be most
appropriate for the scope of this study based on its ability to measure ignition at conditions
relevant to low-pressure vitiated combustion processes. Therefore, the apparatus used by
Gokulakrishnan et al. [4][41] serves as the base apparatus used for ignition delay
measurements made in this study.
Two major conclusions can be drawn from a review of current published literature:
1. Given the lack of data currently available for ignition of undiluted jet fuel
mixtures and the effect that vitiated products, especially NO, play on
oxidation, ignition delay time measurements of jet fuel ignition, with vitiated
oxidizers, and at low pressures are required.
2. The best method to make the necessary ignition delay time measurements is
through the use of a flow reactor due to the ability to measure ignition at low
pressures and across the range of desired temperatures and oxidizer
compositions.
Parts of the work presented in this thesis have been previously published in two papers
by Fuller et al. [42][43].
1.3 Thesis Objectives and Chapter Summary
This goal of this study is to correlate ignition delay time of jet fuel on several of the
11
vitiated combustion variables relevant to low pressure applications, e.g. atmospheric and sub-
atmospheric EGR combustion devices, namely temperature, pressure, equivalence ratio (Φ)
and oxidizer composition. To accomplish this task, the study has been broken down into two
phases with the following objectives.
• Phase I - Screening Study
o Using an existing experimental flow reactor apparatus [4][41], measure the
ignition delay time of JP-8 at atmospheric pressure with varying equivalence
ratios and oxidizer compositions relevant to vitiated combustion due to exhaust
gas recirculation.
o Determine the significance of seven (7) design variables (temperature, Φ, XO2,
XCO2, XCO, XH2O, and XNO) at constant pressure through the use of design of
experiment (DOE) and response surface methodology techniques.
• Phase II - Detailed Investigation
o Apply findings of Phase I to determine which variables should be studied in
greater detail.
o Modify the flow reactor apparatus to measure a greater range of experimental
conditions and improve upon methods used in Phase I.
o Investigate the main and interaction effects of significant experimental design
variables across expanded ranges compared to those in Phase I as well as pressure
variation.
o Develop an empirical model that predicts ignition delay time within the
experimental envelope that provides insight into the physical and chemical
processes effecting ignition delay.
12
This thesis has been divided into several chapters that provide detailed explanation,
analysis, and results. Chapter 2 is divided into several sections that describe the experimental
setup and design for both phases of this study. The sections on experimental set up describe
the flow reactor apparatus for each experimental phase in detail, including the reasons for the
multiple modifications that were made to transition from Phase I to the Phase II. The
experimental design sections describe the procedures used to acquire ignition delay time data
as well as the experimental design technique used to develop efficient test matrices for the
screening study.
Chapter 3 discusses the results of the Phase I screening portion of this study,
including the experimental findings as well as the analysis of the main and two-factor
interaction effects of the 7 design variables: temperature, Φ, O2, CO2, CO, H2O, and NO.
The effects are analyzed using a cumulative probability method to determine their relative
significance to one another within the test envelope.
Chapter 4 discusses the results of the Phase II detailed investigation of the variables
found significant in Phase I: temperature, O2, and NO. The results are also broken down into
atmospheric and sub-atmospheric cases. The direct effect of each design variable, as well as
the interaction of temperature and NO and O2 and NO are also examined. This chapter
details the development of an empirical correlation to predict the ignition delay time of JP-8
within the atmospheric experimental envelope of this study. The recorded ignition delay
time data for all test conditions in this study can be found in the Appendix.
Chapter 5 summarizes the results of both Phase I and Phase II of this study and also
provides conclusions based on the overall findings and scope of this effort. Avenues for
future investigation are also examined in this section.
13
Chapter 2: Experimental Setup and Design
This study aims to determine the level of significance that major components of
vitiated combustion have on autoignition of jet fuel and more specifically the effect of the
significant variables. In practical combustors, vitiated combustion is typically due to the
mixing of fresh air with the exhaust gas from another combustor. This can also result in fuel-
oxidizer mixtures that fall in the intermediate to high temperature regime for ignition. The
vitiated air species of interest in this study are: O2, CO2, CO, H2O, and NOX in a bulk diluent
of N2. The concentration of O2 in the oxidizer was varied from 12 vol% to 21 vol %. The
oxidizer concentrations of CO2 and H2O were varied up to 6 vol% and up to 0.2 vol% for
CO. The oxidizer concentration of NOX, supplied as NO in this study, was varied from 0 to
1000 ppm. A multi-component jet fuel, JP-8, was used at the primary test fuel with
equivalence ratios, Φ, ranging from 0.5 to 1.5. Based on the combustor operating envelope
shown in Table 1-1, the pressure and temperature ranges examined were 0.5 atm to 1.0 atm
and 700 K to 1125 K respectively.
The ignition delay time of JP-8 was measured through the use of two separate but
related flow reactors in this ignition study. The apparatus used in Phase I, the screening
study, was nearly identical to the reactor used by both Gokulakrishnan et al. [4][41] and
Holton et al. [44]. It was comprised of an atmospheric tubular reaction zone made out of
alumina (aluminum oxide – Al2O3) that was heated to a steady temperature ranging from 950
K to 1125 K. The head end mixing zone consisted of a radial pre-mixer and a stainless steel
expanding duct designed to supply a homogenous, laminar flow to the entrance of the test
section. Ignition events were measured using a photomultiplier tube (PMT) equipped with a
narrow band pass filter to identify CH* emissions.
14
In Phase II, the detailed investigation, modifications were made to the initial flow
reactor apparatus to reduce reactor temperature, improve heating uniformity, improve
mixing, and allow for sub-atmospheric conditions. In order to accommodate these expanded
conditions, the modifications included: extension of the overall length of the reactor to
provide a longer residence time for lower temperature and sub-atmospheric tests;
modification of the injection section to improve mixing of the fuel and oxidizer; and
replacement of the narrow band pass filter to identify OH* rather than CH*emissions during
ignition events in order to reduce signal noise. Both setups will be discussed below.
The fuel and oxidizer components were the same for both phases of testing. Flow
reactor ignition measurements were made for three fuels: n-heptane, n-decane, and JP-8. The
n-alkanes were used for mixing and transport time correlations as well as comparison data
due to their similarity to typical surrogates components of typical kerosene type fuels. The
jet fuel used in these experiments was a JP-8 blend obtained from the Air Force Research
Laboratory (AFRL) in Dayton, OH, AFRL ID# 02-POSF-4177. Throughout the remainder
of this report, this fuel is referenced as JP-8 or JP-8 4177. Table 2-1 lists the chemical
properties of JP-8 02-POSF-4177 acquired through standardized ASTM testing for aviation
fuels [45][46]. The vitiated air oxidizer was supplied to the flow reactor by blending
individual gaseous components to match the prescribed test conditions. Air was supplied to
the system via an industrial compressor. Oxidizer species N2, O2, and CO2, were supplied as
pure gases from high pressure cylinders. For test cases including CO and/or NO, these
components were supplied via high pressure cylinders from CO/N2 and NO/N2 mixtures
respectively. For test cases including H2O in the oxidizer, tap water was filtered for chlorine
and particulate removal then vaporized and supplied as steam to the system.
15
Table 2-1: JP-8 Fuel Properties
Fuel Type JP-8 WPAFB ID 02-POSF-4177
ASTM D2425 [45] vol % ASTM D6379 [46] vol % (n + iso) Alkanes 51.3 Monoaromatics 16.1
Cycloalkanes 18 Diaromatics 1.2 Dicycloalkanes 11.8 Total Aromatics 17.3 Tricycloalkanes 1.6 Total Saturates 82.7 Alkylbenzenes 9.3
Indan and Tetralins 6.7 API gravity 42.4 Indenes CnH2n-10 <0.2 Specific gravity 0.814
Naphthalene <0.2 Avg. Boiling Pt. [C] 218 Naphthalenes 1 H mass % 13.7
Acenaphthenes <0.2 H/C atomic ratio 1.9 Acenaphthylenes <0.2 Molecular Weight 162
Tricyclic Aromatics <0.2 Total 100
2.1 Phase I Screening Study - Experimental Setup and Apparatus
2.1.1 Overview of Apparatus
The first phase of experimentation used a slightly modified version of the flow reactor
apparatus used by Gokulakrishnan et al.[4][41] and Holton et al. [44]. Figure 2–1 displays
the apparatus as used in the initial screening portion of this study. A basic flow and
equipment diagram of the apparatus is shown in Figure 2–2. The system was designed to be
a flow reactor heated in ramped and steady temperature sections in order to test ignition
delay from 925 K to 1125 K. Liquid fuel was vaporized and radially injected into a vitiated
air stream prior to entering an alumina flow reactor tube as a homogenous plug. Ignition
delay time was measured using a photomultiplier tube and corresponding narrow band filter
to detect the presence of CH* visible during an ignition event.

16
Figure 2–1: Flow reactor apparatus used for screening study.
Key: a) - flow reactor tube, b) tube furnace, c) flow control panel, d) photomultiplier tube, e) fuel vaporizer, f) water filtration,
g) main vitiated air heater, and h) heater controllers
17
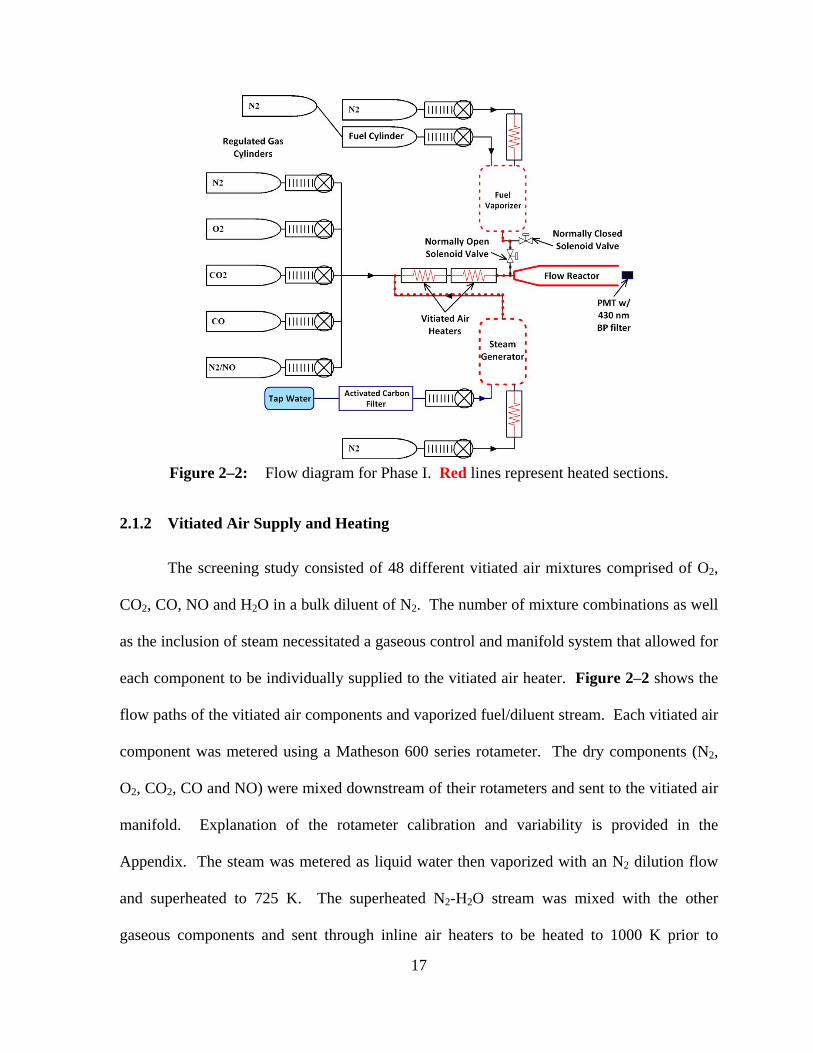
Figure 2–2: Flow diagram for Phase I. Red lines represent heated sections.
2.1.2 Vitiated Air Supply and Heating
The screening study consisted of 48 different vitiated air mixtures comprised of O2,
CO2, CO, NO and H2O in a bulk diluent of N2. The number of mixture combinations as well
as the inclusion of steam necessitated a gaseous control and manifold system that allowed for
each component to be individually supplied to the vitiated air heater. Figure 2–2 shows the
flow paths of the vitiated air components and vaporized fuel/diluent stream. Each vitiated air
component was metered using a Matheson 600 series rotameter. The dry components (N2,
O2, CO2, CO and NO) were mixed downstream of their rotameters and sent to the vitiated air
manifold. Explanation of the rotameter calibration and variability is provided in the
Appendix. The steam was metered as liquid water then vaporized with an N2 dilution flow
and superheated to 725 K. The superheated N2-H2O stream was mixed with the other
gaseous components and sent through inline air heaters to be heated to 1000 K prior to

18
mixing with the fuel.
The bulk diluent, N2, was the largest component of each of the vitiated air mixtures
and was used as a carrier gas for both the steam and fuel vaporizers. Three separate N2
streams were metered and sent to the fuel vaporizer, steam generator, and dry gas manifold
respectively as needed for a given test. For each test, the overall vitiated air flowrate of the
system was 100 slpm. Included in the total vitiated air flow was 20 slpm of N2 that was
diverted through the fuel vaporization circuit to aid in fuel injection. This flow was heated
separately from the remaining vitiated air prior to entrance to the fuel vaporizer.
Each gaseous component was mixed in a tubing manifold prior to entering a
customized inline gas heater assembly. The vitiated air heater consisted of two separate 3/8”
1.6 kW Osram-Sylvania inline pipe heaters (P/N 038821) aligned in series. Two heaters
were used to boost gas temperatures to a maximum of 1000 K and reduce the temperature
gradient between the mixing section and steady temperature test section of the flow reactor.
The heaters assembled as part of the flow reactor apparatus are shown in Figure 2–3.
Figure 2–3: Fuel and vitiated air heating system for initial screening study.

19
2.1.3 Fuel Supply and Vaporization
Two fuels were used in this study: JP-8 as the main test fuel and n-heptane for
calibration. Identical methods were used to control, vaporize and inject each fuel into the
flow reactor system. To examine the autoignition of liquid fuel from a vapor state, fuel was
vaporized, in a manner similar to Gokulakrishnan’s work [4], prior to injection into the flow
reactor mixing section. Liquid fuel was supplied via pressurized cylinders and controlled
using rotameters individually calibrated for JP-8 and n-heptane. The liquid flowrate of JP-8
varied from 3.7 sccm to 15.5 sccm (5.0E-05 kg/s to 2.1E-04 kg/s). The liquid fuel was
injected into a heated vaporizer and mixed with a heated N2 stream that served as a carrier
gas. For all tests, the flowrate of the N2 carrier gas was set to 20 slpm. Rather than
maintaining a constant N2/fuel ratio, the N2 flowrate was kept constant to normalize the
flowrate through the fuel injectors as well as the vitiated air heater. By doing this, fuel
injection dynamics were relatively constant between tests. Also, the constant flowrate of 80
slpm through the flow reactor between tests maintained temperature uniformity in the test
section.
A diagram of the fuel vaporizer is shown in Figure 2–4. The unheated liquid fuel
was injected from the bottom of the heated vaporizer through a bed of heated stainless steel
balls, each one 6.4 mm in diameter. The N2 was injected directly from an inline pipe heater
at the top of the vaporizer. N2 was injected at 750 K and the vaporizer walls were heated to
675 K. The transfer line from the vaporizer to the mixing section was heated to 650 K. Fuel
and N2 passed through the vaporizer for several minutes prior to injection into the mixing
section to ensure steady output concentrations for each test. Ignition measurements were
made to determine the minimum flow time of fuel through the vaporizer required to fall

20
within the overall repeatability error of the flow reactor system. Throughout the screening
study, no fuel coking was observed in the vaporizer or lines.
Figure 2–4: Fuel vaporizer diagram for screening study.
Unlike other flow reactors that are used to measure steady state flows, ignition
measurements made in a flow reactor require an intermittent injection of fuel. To quickly
inject and then stop the flow of fuel into the flow reactor, the automated solenoid valve
system shown in Figure 2–5 was used. The fuel injection system was comprised of two
solenoid valves: a normally closed valve on the transfer line going to the mixing section of
the flow reactor and a normally open valve located on the transfer line to the exhaust hood
and condenser. Between ignition tests, the vaporized fuel flowed through the normally open
valve to a condenser where the N2 vented to an exhaust hood while the fuel was recondensed
and collected for disposal. At the time of an ignition test, both valves were energized thereby
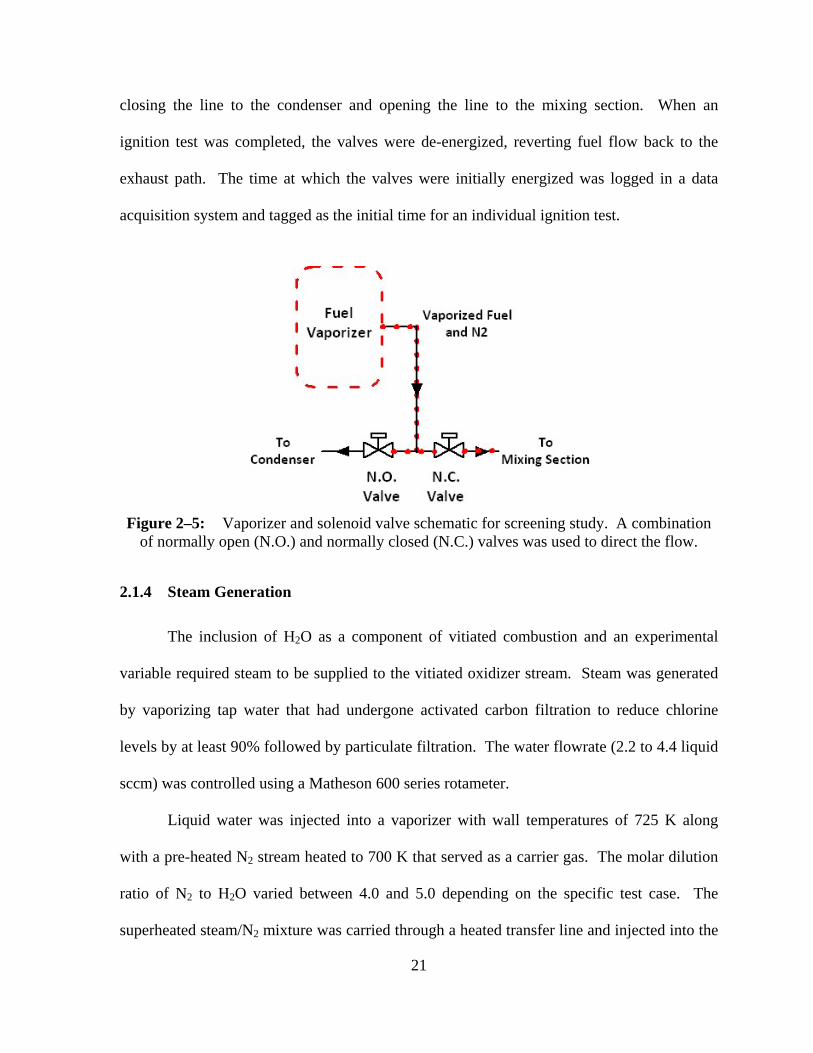
21
closing the line to the condenser and opening the line to the mixing section. When an
ignition test was completed, the valves were de-energized, reverting fuel flow back to the
exhaust path. The time at which the valves were initially energized was logged in a data
acquisition system and tagged as the initial time for an individual ignition test.
Figure 2–5: Vaporizer and solenoid valve schematic for screening study. A combination
of normally open (N.O.) and normally closed (N.C.) valves was used to direct the flow.
2.1.4 Steam Generation
The inclusion of H2O as a component of vitiated combustion and an experimental
variable required steam to be supplied to the vitiated oxidizer stream. Steam was generated
by vaporizing tap water that had undergone activated carbon filtration to reduce chlorine
levels by at least 90% followed by particulate filtration. The water flowrate (2.2 to 4.4 liquid
sccm) was controlled using a Matheson 600 series rotameter.
Liquid water was injected into a vaporizer with wall temperatures of 725 K along
with a pre-heated N2 stream heated to 700 K that served as a carrier gas. The molar dilution
ratio of N2 to H2O varied between 4.0 and 5.0 depending on the specific test case. The
superheated steam/N2 mixture was carried through a heated transfer line and injected into the
22
vitiated air manifold at 725 K. The H2O/N2 stream mixed with the dry gas components prior
to entering the primary inline gas heaters. The temperature of the vitiated stream once the
H2O had been added was no less than 1.5 times the dew point temperature of the mixture for
all test cases that involved H2O. The flow path and apparatus for the steam line are shown in
Figure 2–2 and Figure 2–3 respectively. The N2 stream was preheated using an inline pipe
heater while the vaporizer and transfer lines were heat traced with Samox heating tapes.
2.1.5 Mixing Section and Diffuser
The fuel and vitiated air were mixed in a stainless steel mixing section, shown in
Figure 2–6, and then flowed through a custom expanding duct (diffuser) prior to entering the
flow reactor test section. The inline pipe heater consisted of a spiraled heating element that
acted to mix the vitiated air components prior to the mixing section. Upon entrance to the
mixing section, the vitiated air was swirled inside an annular duct. Immediately downstream
of the swirler, the fuel/N2 mixture was injected radially from six injection orifices located on
the outer wall of the duct. Prior to injection, the fuel/N2 mixture was passed from the heated
transfer line into an annular plenum to improve injection uniformity.
The fuel/N2 stream was injected through six equally distributed injectors that were 1.5
mm in diameter. The outer diameter of the mixing annulus was 13 mm with an inner
diameter of 9 mm. The jet penetration of the fuel/N2 mixture into the swirled axial flow was
approximately 45% of the annular gap height. Using the hydraulic diameter of the annulus
(outer diameter minus the inner diameter) as the characteristic length, the Reynolds number
of the fuel/air mixture in the annulus after injection was approximately 3000. Upon leaving
the mixing section, the fuel/air flow entered the diffuser to provide a homogenous, laminar
23
plug to the entrance of the flow reactor. The diffuser duct expanded in diameter from 13 mm
to 51 mm over a distance of 178 mm. In Phase I, the Reynolds number of the flow exiting
the diffuser and entering the test section ranged from 1100 to 1200.
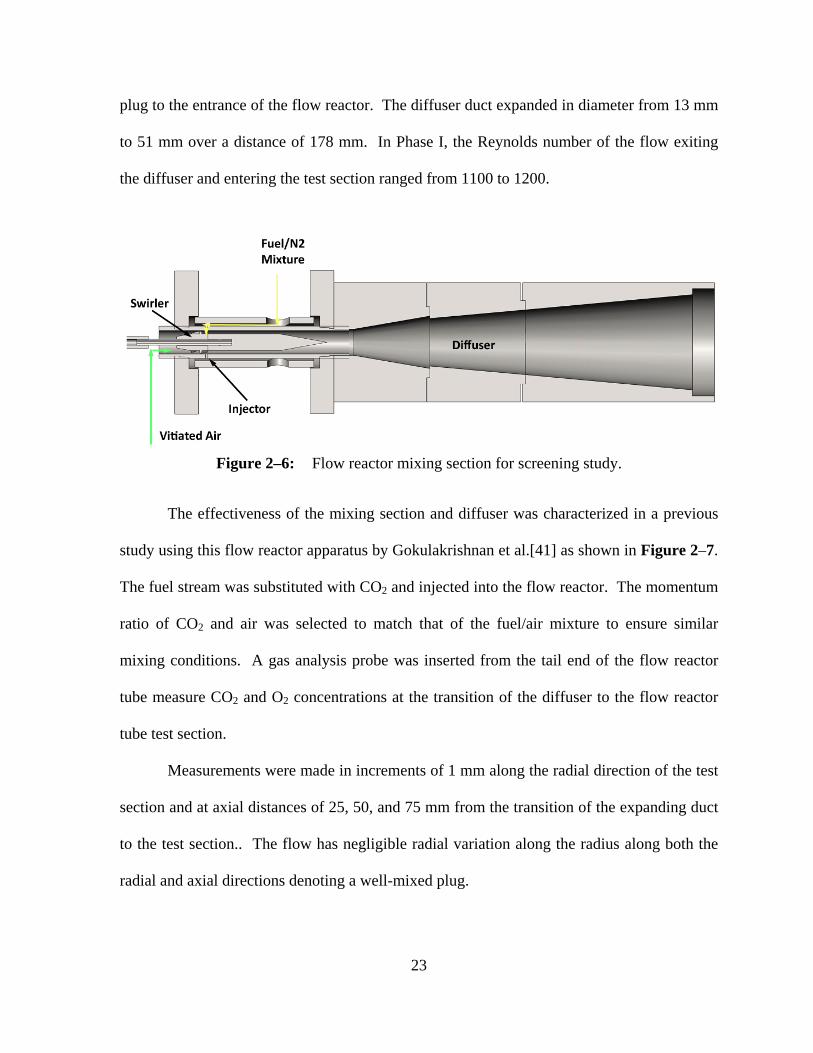
Figure 2–6: Flow reactor mixing section for screening study.
The effectiveness of the mixing section and diffuser was characterized in a previous
study using this flow reactor apparatus by Gokulakrishnan et al.[41] as shown in Figure 2–7.
The fuel stream was substituted with CO2 and injected into the flow reactor. The momentum
ratio of CO2 and air was selected to match that of the fuel/air mixture to ensure similar
mixing conditions. A gas analysis probe was inserted from the tail end of the flow reactor
tube measure CO2 and O2 concentrations at the transition of the diffuser to the flow reactor
tube test section.
Measurements were made in increments of 1 mm along the radial direction of the test
section and at axial distances of 25, 50, and 75 mm from the transition of the expanding duct
to the test section.. The flow has negligible radial variation along the radius along both the
radial and axial directions denoting a well-mixed plug.

24
Figure 2–7: Radial species profiles of CO2 (a) and O2 (b) at 3 axial locations within the
test section. Axial distance from the exit of the diffuser in meters: - 25 mm; - 50 mm; - 75 mm. Figure taken directly from Gokulakrishnan et. al[41]
2.1.6 Flow Reactor Tube and Furnace
The primary test section of the flow reactor, where autoignition occurred, was an
alumina (Al2O3) tube that measured 1.32 meters in length with an internal diameter of 0.051
meters. The test section was enclosed in a well-insulated ceramic furnace with three
independently controlled heating zones. The tube furnace and test section are shown in
Figure 2–1. The furnace (P/N SV13) and control system (P/N PS205-230) were
manufactured by Mellon.
The furnace heated the test section to a steady temperature and provided what can be
assumed to be adiabatic conditions inside the flow reactor. The tube functioned as a plug
flow reactor. The fuel and air mixture travelled down the tube as a well-mixed plug until the
mixture ignited at some distance along the reactor.
2.1.7 Ignition Measurement System
Ignition was measured inside the flow reactor by detecting the chemiluminescence of

25
CH* radical excitation. The emission of CH* was observed using a Hamamatsu R298
photomultiplier tube (PMT) equipped with a 430 nm narrow band pass filter. The PMT was
located at the exhaust end of the flow reactor with direct line of sight down the axis of the
test section through a quartz window. During an ignition event, CH* radicals emitted light at
430 nm that was registered by the PMT. The time of light emission (ignition) was recorded
in into a data acquisition system on the same temporal axis as the activation of the fuel
supply solenoid (injection). The signals were logged at a rate of 10 kHz giving the ignition
delay time measurements a resolution of 0.1 ms. An example of the solenoid and PMT
signal traces is shown in Figure 2–8a.
Figure 2–8: Solenoid and PMT signals CH* chemiluminescence measurements.
Raw (a) and smoothed (b) PMT signal data are shown as blue traces.
To calculate the time of ignition, a Python script was to used determine the time
corresponding to the initial peak of the PMT signal (approximately 1.32 s in Figure 2–8).
Due to significant signal noise in the raw signal (Figure 2–8a) data averaging was applied.
The data averaging smoothed out the noise from the signal, as shown in (Figure 2–8b), to
provide a clean curve for determining the point of ignition. The time of the solenoid signal,
26
representing the time of fuel injection into the system, was also determined using the Python
script. The time of injection was measured as the time in which the solenoid signal had the
largest gradient, signified by a nearly vertical signal spike (approximately 1.07 s in Figure 2–
8) and denoting the activation point of the valve. The time difference between fuel injection
(activation of the solenoid) and an ignition event (excitation of the PMT) was recorded as the
measured experimental ignition delay time for a given fuel/oxidizer mixture, τexp.
Due to transit and mixing time of the fuel and oxidizer, the measured ignition delay
time, τexp, accounts for more than just the desired autoignition delay time, τig, of the
fuel/oxidizer for the given furnace temperature. This not only leads into added delay prior to
ignition but also induction chemistry effects such as possible fuel decomposition prior to the
fuel/oxidizer mixture entering the test section. The temperature gradient at the entrance to
the test section of the flow reactor introduces additional uncertainty in the ignition delay time
as well. The issue of accounting for the mixing of the fuel and oxidizer components in a
flow reactor has been approached through various methods. These include: the time shifting
method [47], the quasi-steady-state approach [48], and the entrainment model approach [49].
The time-shifting approach has been used extensively in the Princeton Variable Pressure
Flow Reactor whose mixing and expanding duct sections served as the basis for the flow
reactors used in this current study. Gokulakrishnan et al. [50] compared the time shifting
method to numerical PSR-PFR modeling for n-heptane oxidation experiments and
determined that the impact of induction chemistry is sufficiently accounted for through the
use of time shifting.
To account for the induction time delay, the time-shifting method has been applied to
the flow reactor data acquired from the apparatus used in the Phase I screening portion of this
27
study. The ignition delay time for the given furnace temperature of the mixture, τig, was
calculated through the use of a well-characterized comparison fuel for which theoretical
ignition delay time could be calculated through validated kinetic models. In the screening
study, this comparison fuel was HPLC grade n-heptane. The use of n-heptane to determine
the time shift in the ignition delay time of kerosene based jet fuels due to fuel injection,
transit, and mixing was previously performed in the study by Gokulakrishnan et al. [4] to
determine the ignition delay time of JP-8, JP-7 and S-8 in the same flow reactor apparatus
used in this screening study.
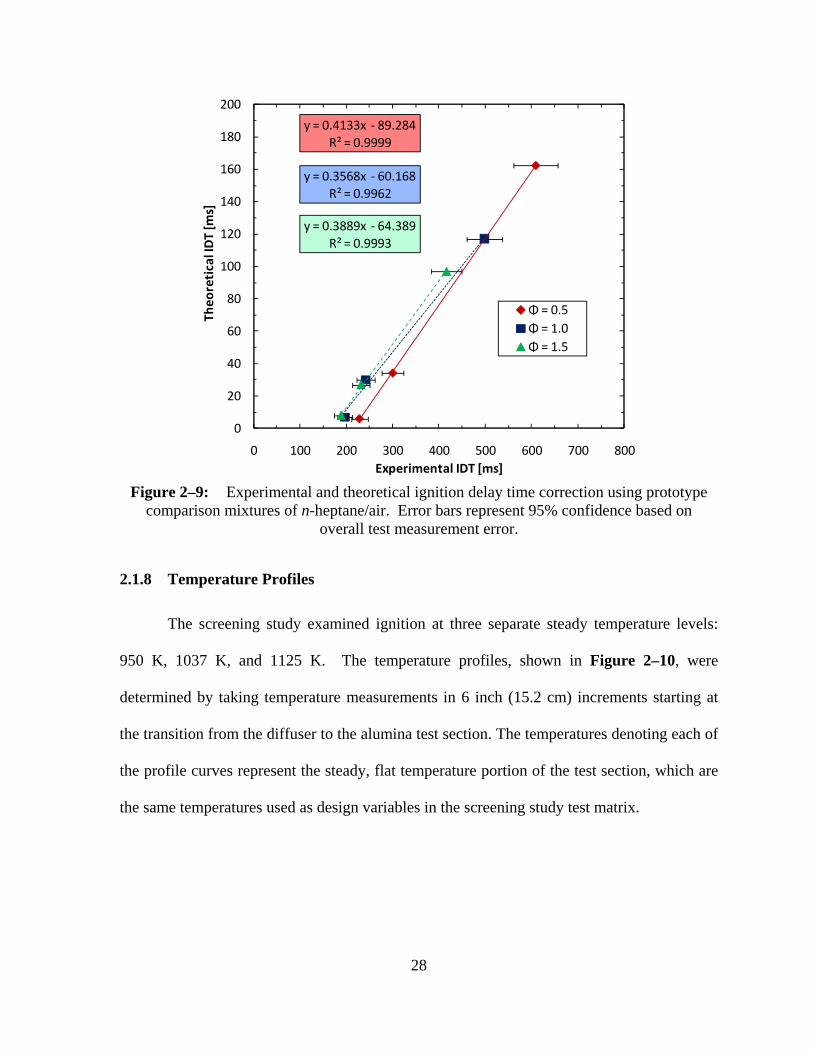
Mixtures of n-heptane and air (21 vol% O2/79 vol% N2) were ignited in the flow
reactor at test temperatures of 950 K, 1038 K and 1125 K as well as test equivalence ratios of
0.5, 1.0 and 1.5. The experimental τexp from these tests was compared to the theoretical
ignition delay time values using the kinetic mechanism experimentally validated for n-
heptane and developed by Curran et al. [5]. For a given Φ, the experimental τexp for all three
test temperatures was plotted against the corresponding theoretical ignition delay times to
determine the linear correction functions shown in Figure 2–9. These correction functions
were applied to each JP-8 test in the screening study based on the equivalence ratio for a
specific test and used to determine the value for each experimental condition. In the
following sections that discuss the results of the screening study, the ignition delay times
given will be the corrected values of τig.
28
Figure 2–9: Experimental and theoretical ignition delay time correction using prototype
comparison mixtures of n-heptane/air. Error bars represent 95% confidence based on overall test measurement error.
2.1.8 Temperature Profiles
The screening study examined ignition at three separate steady temperature levels:
950 K, 1037 K, and 1125 K. The temperature profiles, shown in Figure 2–10, were
determined by taking temperature measurements in 6 inch (15.2 cm) increments starting at
the transition from the diffuser to the alumina test section. The temperatures denoting each of
the profile curves represent the steady, flat temperature portion of the test section, which are
the same temperatures used as design variables in the screening study test matrix.
y = 0.4133x ‐ 89.284R² = 0.9999
y = 0.3568x ‐ 60.168R² = 0.9962
y = 0.3889x ‐ 64.389R² = 0.9993
0
20
40
60
80
100
120
140
160
180
200
0 100 200 300 400 500 600 700 800
Theo
retical IDT [m
s]
Experimental IDT [ms]
Φ = 0.5Φ = 1.0Φ = 1.5

29
Figure 2–10: Test section temperature profiles for screening study.
2.2 Phase I Screening Study - Experiment Procedure and Design
2.2.1 Experimental Procedure and Methodology
The experimental procedure involved three stages: setting the flow reactor conditions,
injecting the fuel and oxidizer, and determining the ignition delay time. This procedure was
used for each of the tests covered by the test matrix as well as tests made in non-vitiated
conditions and with n-heptane for flow reactor characterization purposes. A given test began
by setting the flowrates for the main oxidizer stream, fuel vaporizer and steam generator to
their corresponding test values and by setting the tube furnace, heat tracing and gas heaters to
their test temperatures. Execution of a test began with the injection of the fuel/N2 mixture
into the oxidizer stream through activation of the solenoid fuel control valves and was
700
750
800
850
900
950
1000
1050
1100
1150
1200
0 0.25 0.5 0.75 1 1.25
Temeprature [K]
Distance from Diffuser Transition [m]
1125 K 1038 K 950 K

30
completed when the solenoid valves were deactivated. Ignition time of the fuel/oxidizer
mixture was determined by measuring the difference between the time in which the PMT
registered and ignition event and the time of fuel injection denoted by the activation of the
control valves.
Setup of the system for injection measurements began with heating the flow reactor
apparatus and setting the flow rates through the different flow reactor components. For all
tests, the flow of the oxidizer stream was 80 slpm, made up of the necessary flow rates of N2,
O2, CO, CO2, H2O and NO to meet the test condition requirements. The flow rate through
the fuel vaporizer was made up of a constant 20 slpm flow of N2 and a variable flowrate of
fuel based on test requirements. Prior to injection of the fuel, these flows were set and the
heating elements (tube furnace, heat tracing and inline gas heaters) on the flow reactor
apparatus were allowed to reach steady temperatures corresponding to the test being
performed. Upon completion of a measurement, the system was allowed to return to steady
temperature levels.
2.2.2 Design of Experiment
The goal of the screening study was to determine the significance of the effects on
ignition delay time of the major variables of low pressure (1 atm) vitiated combustion of jet
fuel. For this study, seven (7) independent design variables were chosen to represent the
various components of vitiated combustion: temperature, equivalence ratio, and the
concentration of five (5) vitiated air species: O2, CO2, CO, H2O, and NO (all balanced in a
bulk diluent of N2). Because the study aimed to investigate a large number of variables, a
design of experiment (DOE) technique was used to systematically examine the role that each

31
has on JP-8 ignition under vitiated combustion conditions.
Due to the high non-linearity of combustion processes, the experiments were
performed so that each design variable was examined at a minimum of 3 levels. Examination
of every combination of these variables at 3 levels would have required 37 (2187) tests,
which were far too many experiments to perform in a timely and efficient manner. Thus, a
DOE technique was applied to reduce the number of tests while providing enough
information from the gathered data regarding the effect of each independent variable (known
as the main effect) and the synergy of two variables (known as the two-factor interaction
effect) on ignition delay time. To acquire this information and optimize test efficiency, the
Box-Behnken Design (BBD) [51], a second-order response surface methodology, was
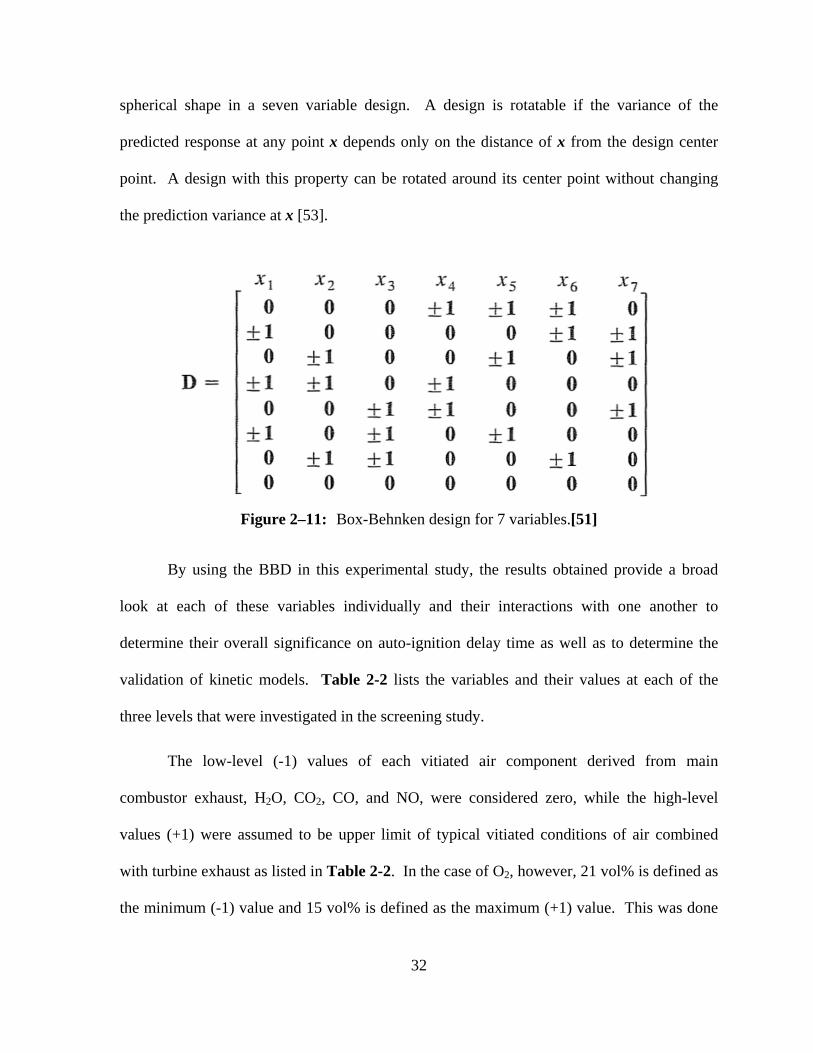
chosen. The BBD design matrix for seven variables is shown in Figure 2–11. For a seven
variable case, the BBD method reduces the number of tests from 2187 to 56 (7 blocks of 8)
while the design still accounts for the non-linear response of the variables. In the case of this
study, 60 tests were run: 7 blocks of 8 + 4 independently examined center points. In the
design matrix, the three levels for each variable are -1, 0 and +1, representing the low, middle
and high values respectively.
The BBD chosen for this study is a resolution V design [52], which entails that the
main effects are not confounded (confused) with the two-factor interaction effects, rather the
main effects are confounded with the four-factor interaction effects, while the two-factor
interaction effects are confounded with three-factor interaction effects. Generally, the
interaction effects higher than two-factors are considered insignificant [52]. Therefore, the
main effects and the two-factor interaction effects can be obtained with reasonable accuracy
in the current BBD. In addition, the use of the BBD is beneficial due to its rotatability and
32
spherical shape in a seven variable design. A design is rotatable if the variance of the
predicted response at any point x depends only on the distance of x from the design center
point. A design with this property can be rotated around its center point without changing
the prediction variance at x [53].
Figure 2–11: Box-Behnken design for 7 variables.[51]
By using the BBD in this experimental study, the results obtained provide a broad
look at each of these variables individually and their interactions with one another to
determine their overall significance on auto-ignition delay time as well as to determine the
validation of kinetic models. Table 2-2 lists the variables and their values at each of the
three levels that were investigated in the screening study.
The low-level (-1) values of each vitiated air component derived from main
combustor exhaust, H2O, CO2, CO, and NO, were considered zero, while the high-level
values (+1) were assumed to be upper limit of typical vitiated conditions of air combined
with turbine exhaust as listed in Table 2-2. In the case of O2, however, 21 vol% is defined as
the minimum (-1) value and 15 vol% is defined as the maximum (+1) value. This was done
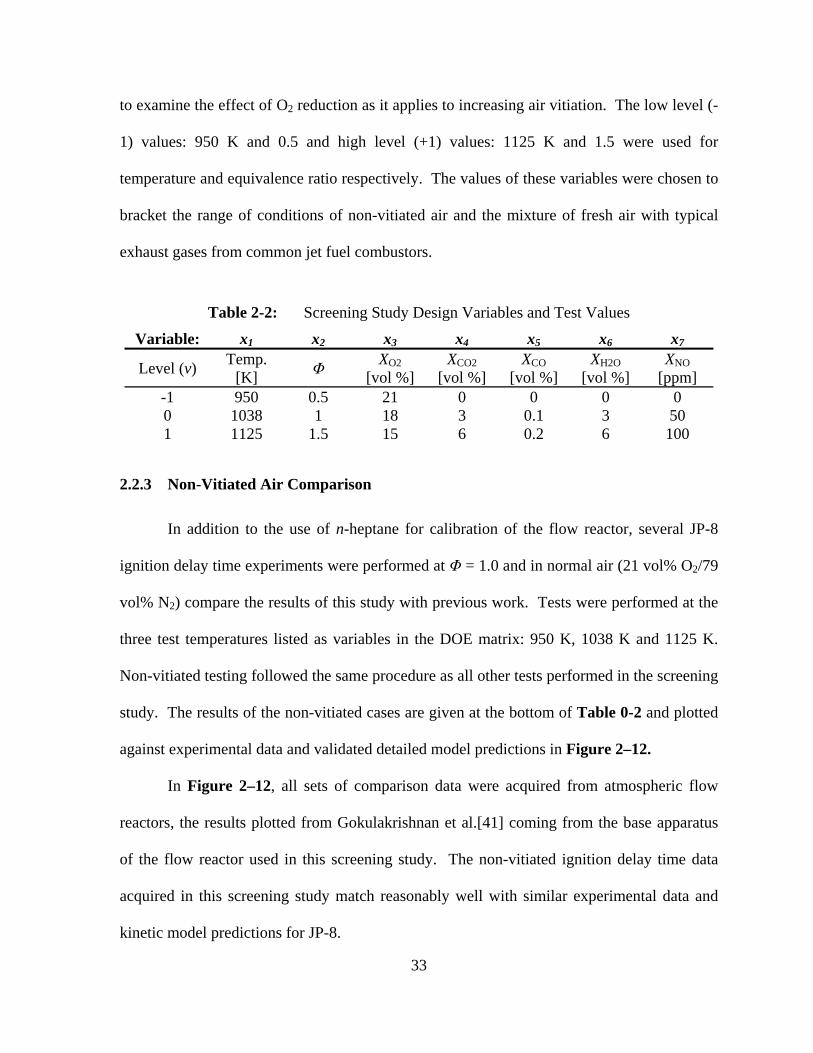
33
to examine the effect of O2 reduction as it applies to increasing air vitiation. The low level (-
1) values: 950 K and 0.5 and high level (+1) values: 1125 K and 1.5 were used for
temperature and equivalence ratio respectively. The values of these variables were chosen to
bracket the range of conditions of non-vitiated air and the mixture of fresh air with typical
exhaust gases from common jet fuel combustors.
Table 2-2: Screening Study Design Variables and Test Values
Variable: x1 x2 x3 x4 x5 x6 x7
Level (v) Temp. [K] Φ XO2
[vol %] XCO2
[vol %] XCO
[vol %] XH2O
[vol %] XNO
[ppm] -1 950 0.5 21 0 0 0 0 0 1038 1 18 3 0.1 3 50 1 1125 1.5 15 6 0.2 6 100
2.2.3 Non-Vitiated Air Comparison
In addition to the use of n-heptane for calibration of the flow reactor, several JP-8
ignition delay time experiments were performed at Φ = 1.0 and in normal air (21 vol% O2/79
vol% N2) compare the results of this study with previous work. Tests were performed at the
three test temperatures listed as variables in the DOE matrix: 950 K, 1038 K and 1125 K.
Non-vitiated testing followed the same procedure as all other tests performed in the screening
study. The results of the non-vitiated cases are given at the bottom of Table 0-2 and plotted
against experimental data and validated detailed model predictions in Figure 2–12.
In Figure 2–12, all sets of comparison data were acquired from atmospheric flow
reactors, the results plotted from Gokulakrishnan et al.[41] coming from the base apparatus
of the flow reactor used in this screening study. The non-vitiated ignition delay time data
acquired in this screening study match reasonably well with similar experimental data and
kinetic model predictions for JP-8.

34
Figure 2–12: Comparison of non-vitiated JP-8 IDT at atmospheric pressures to previous
studies of Gokulakrishnan et al. [4][41] and Freeman & Lefebvre [39].
2.3 Phase II Detailed Investigation - Experimental Setup and Apparatus
2.3.1 Overview of Apparatus
Upon completion of the Phase I screening study and the determination of the desired
experimental envelope for the Phase II detailed investigation, several limitations with the
initial experimental apparatus were addressed to properly modify the flow reactor:
insufficient residence time, changes in flowrates and mixing, reactor temperature uniformity,
sealing for sub-atmospheric operation, and solenoid and PMT signal issues.
Expansion of capabilities and improvements to the test methods of the screening
portion of this study resulted in numerous changes made to the flow reactor apparatus to
improve capabilities as well as the accuracy and efficiency of the system. The modified
1
10
100
1000
0.85 0.9 0.95 1 1.05 1.1
Ignition
Delay
Tim
e [m
s]
1000/T [1/K]
JP‐8/Air Phi = 1.0 (Phase I)
JP‐8/Air Phi = 1.0 (Gokulakrishnan et al.)
JP‐8/Air Phi = 0.5 (Gokulakrishnan et al.)
Jet‐A/Air Phi = 0.5 (Freeman & Lefebvre)
JP‐8/Air Phi = 1.0 ‐ CSE Surrogate Model (ver05f)

35
apparatus is shown in Figure 2–14. The modified system was designed to measure the
autoignition of liquid fuels at temperatures from 700 K to 900 K and at pressures down to 0.5
atm. The major changes to the system included extension of the length of the flow reactor,
redesign of the front end mixing section, improved temperature control, and the addition of a
vacuum system. A basic flow and equipment diagram of the modified system is shown in
Figure 2–13.
Figure 2–13: Flow diagram for Phase II. Red lines represent heated sections.

36
Figure 2–14: Flow reactor apparatus used for detailed phase experiments.
Key: a) flow reactor tube, b) tube furnace, c) flow control panel, d) solenoid manifold, e) fuel vaporizer, f) heater controls,
g) photomultiplier tube, and h) transition piece.

37
2.3.2 Extension of Flow Reactor Tube
The most significant issue in transitioning from the screening to detailed study was
the limitation that the residence time of the original system placed on the experiments. In the
detailed study it was desirable to examine lower temperatures (700 K – 900 K) and pressures
(0.5 – 1.0 atm) than those used in the screening study. These conditions result in longer
ignition times and therefore require that the fuel/air mixtures have longer residence times
inside the test section. Two options existed to increase residence time: extending the flow
reactor test section and/or reducing the axial velocity of the fuel/air plug. Advantages and
disadvantages existed for either option.
There were two main advantages to extending the test section. First, it allowed for
continued use of the original test apparatus with minor modifications rather than increasing
the tube diameter tube and purchasing a furnace. Second, by maintaining the diameter of the
test section, the design of the diffuser, which had been previously characterized, did not need
modifications that significantly altered the fluid dynamics of the fuel/air plug. The
disadvantages of extending the test section were the need for more lab space due to the
increased overall length and having to overcome length limitations of alumina tubing that
required multiple sections with connecter joints between each tube.
The alternative solution to increasing residence time by lengthening the test section
was lowering the flow velocity. The primary advantage of this solution was the ability to
limit the overall length of the flow reactor, requiring less lab space. However, the possible
methods of lowering the velocity have their own disadvantages. One option was to reduce
the flowrates of fuel and air flowing through the reactor. While this would lower the
velocity, it also would have required new gas heating equipment due to heating element

38
limitations of the original equipment. Re-characterization of the diffuser and mixing section
would also have been required based on changes in the fluid dynamics of the system.
Alternatively, increasing the diameter of the test section to lower the axial velocity would
mitigate some of the issues regarding reduced flow rates. This method, however, would have
meant that the diffuser and mixing section would have been totally redesigned and the
furnace used in the screening study would likely have needed to be replaced.
It was determined that the flow reactor to be used in the detailed investigation would
be extended in length by adding alumina tubes of the same dimension as the original test
section. This required that the flow reactor be moved to a new lab, but limited the necessary
modifications to the front end of the system and allowed for the use of the pre-existing
heating equipment.
In the screening study, approximately 0.9 m of the alumina test section was heated,
the initial portion undergoing a steep temperature gradient shown in Figure 2–10. In the
detailed investigation, the flow reactor tube was extended by three additional tubes and the
heated section was increased to 5.3 meters. Not only was the length of the test section
increased, but the front end temperature gradient seen in the screening study was removed
due to an improved heating scheme and lower overall test temperatures. The flow reactor
extension allowed for the residence time within the test section to exceed three seconds. A
schematic of the lengthened flow reactor is shown in Figure 2–15.
The reactor was lengthened by using four separate alumina tubes joined by stainless
steel connectors and graphite ring gaskets. The option of using a single long tube was not
possible due to individual tube length limitations set by the manufacturing process.
Connector pieces, placed between the alumina sections, were machined from stainless steel

39
pipe to slip over the alumina tube ends. Each connector rested on a stand that allowed it to
slide axially as the graphite gaskets were compressed to form a seal between the tubes and
connectors. Graphite ring gaskets were also used to seal the connections between alumina
tubes and the diffuser and exhaust transition piece. A combination of 3.2 mm and 1.6 mm
thick graphite gaskets were used in the detailed study while only 1.6mm gaskets were used in
the Phase I apparatus.
Figure 2–15: Extended flow reactor diagram and temperature capacities.
2.3.3 Modifications to Mixing Section and Diffuser
Characterization of the flow reactor mixing and diffuser section performed in the
study by Gokulakrishnan et al. [41] supported that the original apparatus used in the
screening study provided a well-mixed plug flow to the steady temperature test section.
However, future testing with the flow reactor apparatus, for the detailed investigation and
other studies, required the ability to run tests at lower overall flow rates and sub-atmospheric
conditions. These flows resulted in reduced Reynolds numbers and less turbulence in the
mixing section in this test series. To improve mixing, the radial injectors and the length of
the mixing section were both modified. Fuel injector changes increased the penetration of

40
fuel into the vitiated air stream and extension of the mixing section increased the mixing
length for the fuel/air stream prior to entering the diffuser.
The original diffuser was comprised of three separately welded parts and lacked ports
for instrumentation. During early shakedown tests for the screening study, fuel and air were
found to leak from the fittings connecting the diffuser to the mixing section due to
breakdown of the graphite gaskets at test temperatures. The diffuser and mixing section were
welded together for to prevent leaking, but this also removed the ability to modify the
injectors or mixing section. To improve sealing and allow for interchangeability of mixing
sections in the detailed investigation and future studies, the parts were connected with
compression fittings in the redesigned apparatus.
The modified mixing and diffuser components are shown in Figure 2–16. Two major
modifications were made to the mixing section and diffuser to improve mixing as well as
measurement capabilities in the head end of the flow reactor. The first modification was to
the radial fuel injectors. In the screening study, the fuel and N2 were injected through 6
injectors (1.5 mm in diameter) with a calculated jet penetration of approximately 45% of the
distance between the outer annular wall and the center body. To improve mixing, the
number of injectors was increased to 8 and the diameter was reduced to 0.8 mm. This
modification increased the calculated jet penetration to 67% as well as added additional
streams to penetrate and mix into the swirling, vitiated air flow.
The second modification was the lengthening of the center body and mixing annulus.
This modification was made to extend the mixing time of the fuel and air prior to their
entrance to the diffuser. The cylindrical portion of the solid body was lengthened from 3.8
cm to 15.2 cm, increasing the length-to-hydraulic diameter ratio of the mixing annulus from
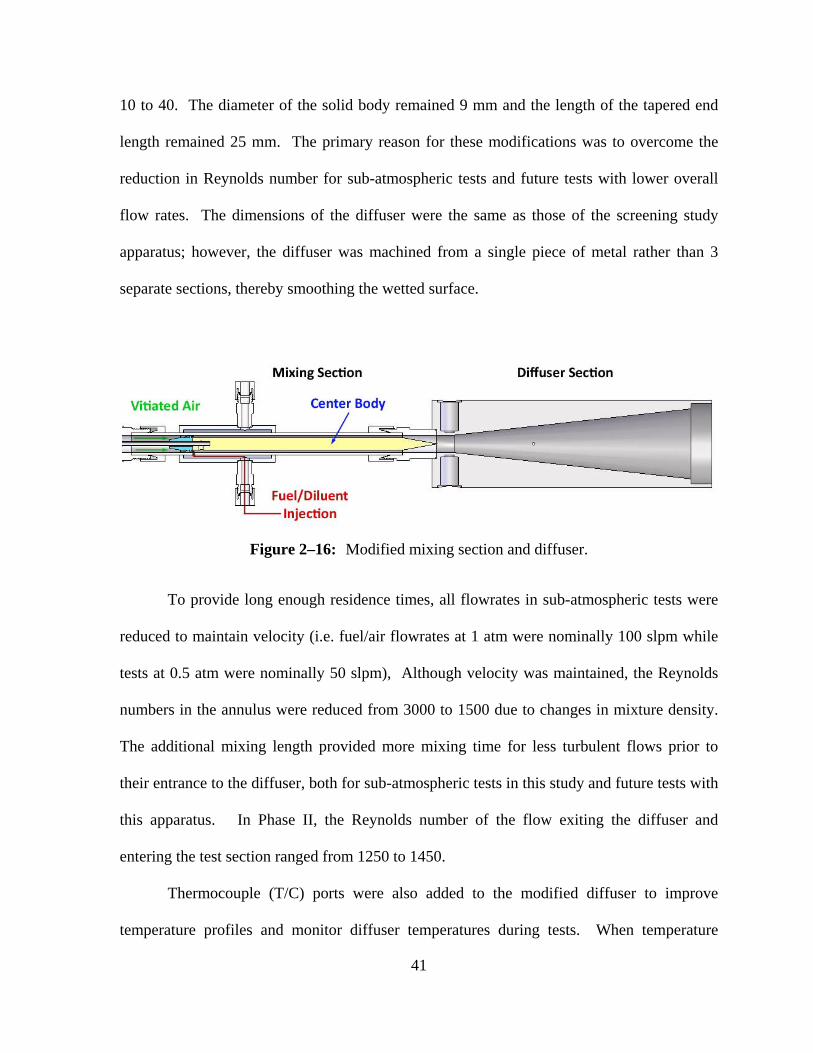
41
10 to 40. The diameter of the solid body remained 9 mm and the length of the tapered end
length remained 25 mm. The primary reason for these modifications was to overcome the
reduction in Reynolds number for sub-atmospheric tests and future tests with lower overall
flow rates. The dimensions of the diffuser were the same as those of the screening study
apparatus; however, the diffuser was machined from a single piece of metal rather than 3
separate sections, thereby smoothing the wetted surface.
Figure 2–16: Modified mixing section and diffuser.
To provide long enough residence times, all flowrates in sub-atmospheric tests were
reduced to maintain velocity (i.e. fuel/air flowrates at 1 atm were nominally 100 slpm while
tests at 0.5 atm were nominally 50 slpm), Although velocity was maintained, the Reynolds
numbers in the annulus were reduced from 3000 to 1500 due to changes in mixture density.
The additional mixing length provided more mixing time for less turbulent flows prior to
their entrance to the diffuser, both for sub-atmospheric tests in this study and future tests with
this apparatus. In Phase II, the Reynolds number of the flow exiting the diffuser and
entering the test section ranged from 1250 to 1450.
Thermocouple (T/C) ports were also added to the modified diffuser to improve
temperature profiles and monitor diffuser temperatures during tests. When temperature

42
profiles were taken (Figure 2–17a), a thermocouple, located 5.8 cm from the transition of the
mixing section to the diffuser, was placed at a depth that intersected the flow reactor axis.
During test conditions, the thermocouple was moved to the wall of the diffuser to avoid flow
disruptions (Figure 2–17b). For temperature monitoring purposes, a second thermocouple
was located inside the diffuser body close to the wall of the expanding duct, 0.12 m from the
transition of the mixing section to the diffuser. These thermocouples were used to improve
the overall resolution and flatness of the temperature profile throughout the reactor. The
fittings on the mixing section were changed to compression fittings rather than the threaded
pipe and graphite gaskets used in the apparatus from the screening study. This modification
limited leakage in the head end of the system during the sub-atmospheric testing portion of
the study. It also provided the ability to switch out mixing sections for future testing.
Figure 2–17: Alignment of diffuser T/Cs. Full apparatus not shown.
2.3.4 Improvements and Additions to Heating System
Extension of the flow reactor required additional heating and control in order to

43
maintain a constant temperature test section for longer ignition tests. The initial temperature
ramp seen in the screening study temperature profiles, Figure 2–10, was eliminated in the
detailed investigation apparatus. This was possible through the combination of lower test
temperatures and several modifications made to the heating and temperature control of the
apparatus. For the detailed investigation, temperature profiles taken within the test section
were made using a custom multipoint T/C probe. The probe was 6 m long with a diameter of
6.4 mm and consisted of fifteen type K thermocouples spanning from the tip to 5.18 m down
the length of the probe. Temperature measurements were taken within the flow reactor at
two offset probe depths 15.25 cm (6 in) apart. The axial locations along the flow reactor that
were measured by the probe are shown in Figure 2–18.
Figure 2–18: Axial locations of T/C’s in multipoint probe. To increase the resolution of
temperature profile through measuerments, the T/C probe was shifted 6 inches.
The front end of the flow reactor tube was heated and controlled by the Mellon tube
furnace system used in the screening and previous studies of Gokulakrishnan et al. [4][41]
and Holton et al. [44]. The additional alumina tubing was traced with Samox heating tapes
that could raise the gas temperature of the extended flow reactor section to 950 K. The heat
tracing was controlled in ten separate zones along the length of flow reactor downstream of

44
the tube furnace. The entire mixing section and diffuser were also heat traced and controlled
to match the temperature of the fuel/air mixture entering the diffuser to the steady
temperature along the test section.
The flowrate used to measure the profile differed from the flowrate of the fuel/air
mixture during an actual ignition test. In the screening study, 80 slpm of air was used to set
the heater controllers and determine the temperature profile of the flow reactor. This was
done to match the settings of the flow reactor immediately prior to an ignition test, at which
point the additional flowrate of fuel and N2 is added to the system for a few seconds. This
method reduced the accuracy of the temperature profile for the duration of an ignition test.
The use of n-heptane to calibrate the flow reactor mixing and temperature ramping helped to
account for this method in the screening study, however for the detailed investigation the
system was adjusted with additional N2 to account for the fuel injection flowrate that occurs
with ignition tests. This provided for more accurate conditions during the temperature profile
measurements.
A fuel injection bypass system, shown in Figure 2–19, that replaced the fuel/diluent
stream with heated N2 (20 slpm at atmospheric conditions, 10 slpm at 0.5 atm) was added to
the system for the detailed investigation. During temperature profile measurements and
between ignition tests, all three solenoid valves were de-energized, sending the fuel/N2
stream to the condenser and the heated N2 stream through the injectors in the mixing section.
To begin an ignition test, the solenoids were activated by the data acquisition and control
system, shutting off N2 flow to the injectors and re-directing the fuel/N2 stream to the mixing
section. By replacing the fuel/N2 flow with heated N2 between tests, the temperature profiles
measured in the flow reactor were more accurate representations of the conditions

45
experienced by a fuel/air plug during an ignition test.
Figure 2–19: Fuel vaporizer, N2 bypass and solenoid valve schematic for detailed
investigation. A combination of normally open (N.O.) and normally closed (N.C.) valves was used to direct the flow.
2.3.5 Transition Piece and Vacuum System
The transition piece, Figure 2–20, was manufactured from stainless steel to connect
the alumina tube test section to the exhaust and vacuum systems. For atmospheric tests,
exhaust from the flow reactor vented directly to a fume hood. For sub-atmospheric tests, the
exhaust was transferred to a rotary vane vacuum pump after passage through 2.54 cm
diameter copper tubing submerged in a cooling bath. Inlet temperature limitations of the
rotary vane vacuum pump made this cooling system necessary. The transition piece was
placed on rollers with the ability to move along the axis of the flow reactor. Movement was
controlled by manually adjusting four lead screws that connected the transition piece to the
Unistrut frame supporting the flow reactor. The flow reactor tubes were sealed by adjusting
the position of the transition piece to compress the graphite gaskets located between the
diffuser, flow reactor tubes, tube connectors and the transition piece itself. The transition
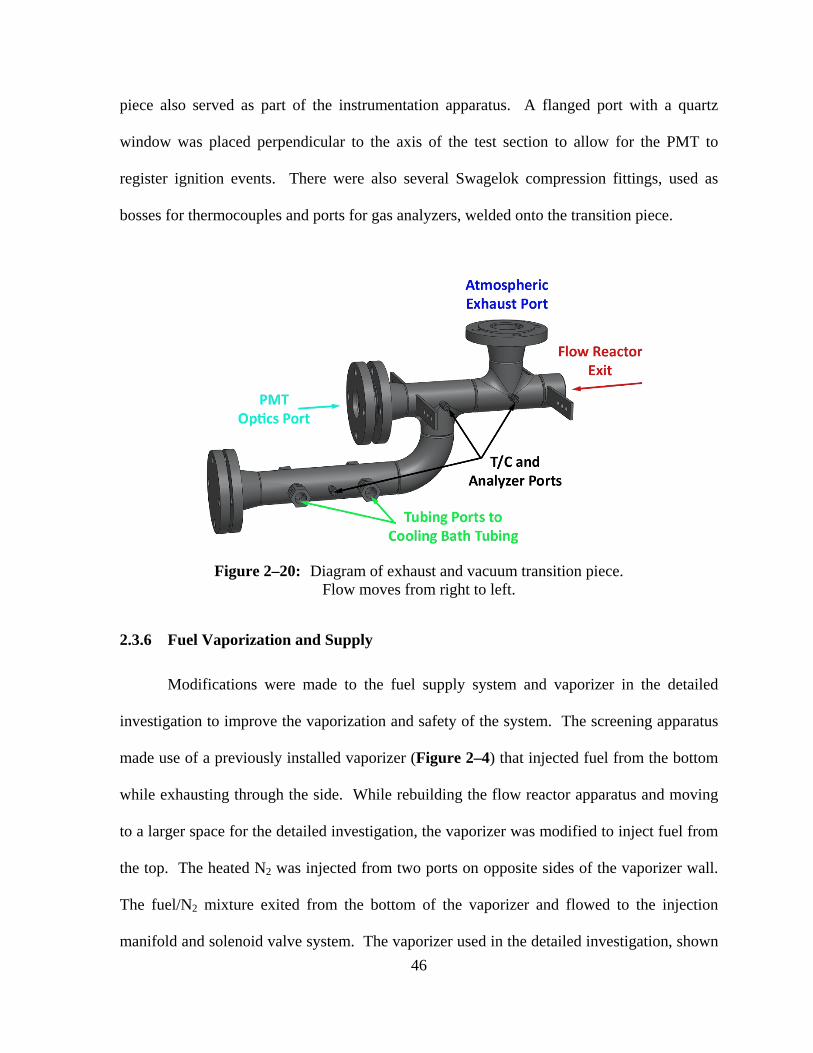
46
piece also served as part of the instrumentation apparatus. A flanged port with a quartz
window was placed perpendicular to the axis of the test section to allow for the PMT to
register ignition events. There were also several Swagelok compression fittings, used as
bosses for thermocouples and ports for gas analyzers, welded onto the transition piece.
Figure 2–20: Diagram of exhaust and vacuum transition piece.
Flow moves from right to left.
2.3.6 Fuel Vaporization and Supply
Modifications were made to the fuel supply system and vaporizer in the detailed
investigation to improve the vaporization and safety of the system. The screening apparatus
made use of a previously installed vaporizer (Figure 2–4) that injected fuel from the bottom
while exhausting through the side. While rebuilding the flow reactor apparatus and moving
to a larger space for the detailed investigation, the vaporizer was modified to inject fuel from
the top. The heated N2 was injected from two ports on opposite sides of the vaporizer wall.
The fuel/N2 mixture exited from the bottom of the vaporizer and flowed to the injection
manifold and solenoid valve system. The vaporizer used in the detailed investigation, shown

47
in Figure 2–21, reached steady temperatures faster than the apparatus used in the screening
study. Fuel coking was not found in the vaporizer, injector or plumbing throughout Phase II.
Figure 2–21: Diagram of fuel vaporizer used for detailed investigation.
The fuel supply system was also modified to improve efficiency and safety. The
transfer line from the fuel control rotameter was reduced in diameter and length to reduce
transfer time to the vaporizer. Toggle valves were put in place to facilitate fast shut down of
the liquid fuel flow to the vaporizer and to provide N2 purge of the system. The purge
system allowed for the transition of fuels, i.e. JP-8 to n-decane, to occur with more efficiency
than in the screening study.
2.3.7 Solenoid, PMT and Data Acquisition
Minor issues were found with the solenoid valve, PMT and data acquisition setups

48
used for the screening study. The mechanical switch to activate the valves for fuel injection
and shutdown led to some injection times not registering in the data acquisition system. On
the other hand, the PMT signal noise made it difficult in some tests to define the ignition
time. Ambient lighting in the room caused cyclic noise in the PMT signal that made ignition
events with CH* emissions of small magnitude difficult to identify.
The modifications made to the solenoid, PMT, and data acquisition systems of the
flow reactor were done primary to improve test efficiency and accuracy. The solenoid
injection system was further automated and coupled with the data acquisition system through
the use of a solid state relay that responded to an output voltage sent by Labview to activate
the solenoid valves. Rather than recording the signal sent during manual activation of the
solenoid valves, the modified system sent the signal for a specific amount of time and
automatically closed the valves to end a test. The use of a manual control switch for the
solenoid valves was maintained for emergency shutdown purposes.
The optic filter on the PMT was changed from a 430 nm narrow band filter used to
measure the emission of CH* to a 310 nm narrow band filter to measure OH* emission. This
change was made to eliminate much of the cyclic noise from the recorded PMT signal
filtered for CH* seen in Figure 2–8a compared to the signal recorded when the PMT filtered
to measure OH* shown in Figure 2–22. This modification improved accuracy when
determining the time of an ignition event as well as efficiency by reducing the need for post
processing and data averaging. This was especially useful for fast ignitions that physically
occurred close to the head end of the flow reactor and registered low amplitude signals on the
PMT.
For the detailed investigation, the experimental ignition delay time, τexp, for a given
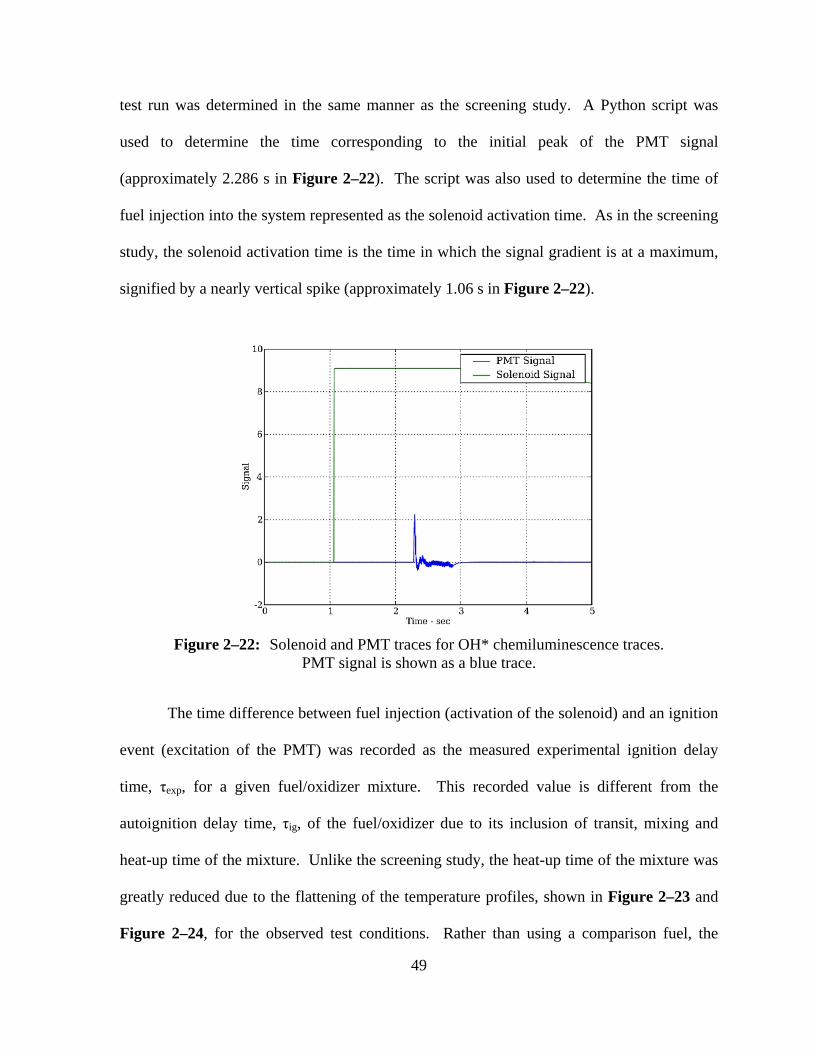
49
test run was determined in the same manner as the screening study. A Python script was
used to determine the time corresponding to the initial peak of the PMT signal
(approximately 2.286 s in Figure 2–22). The script was also used to determine the time of
fuel injection into the system represented as the solenoid activation time. As in the screening
study, the solenoid activation time is the time in which the signal gradient is at a maximum,
signified by a nearly vertical spike (approximately 1.06 s in Figure 2–22).
Figure 2–22: Solenoid and PMT traces for OH* chemiluminescence traces.
PMT signal is shown as a blue trace.
The time difference between fuel injection (activation of the solenoid) and an ignition
event (excitation of the PMT) was recorded as the measured experimental ignition delay
time, τexp, for a given fuel/oxidizer mixture. This recorded value is different from the
autoignition delay time, τig, of the fuel/oxidizer due to its inclusion of transit, mixing and
heat-up time of the mixture. Unlike the screening study, the heat-up time of the mixture was
greatly reduced due to the flattening of the temperature profiles, shown in Figure 2–23 and
Figure 2–24, for the observed test conditions. Rather than using a comparison fuel, the

50
nominal transit time from the normally closed solenoid fuel injection valve to the transition
from the mixing section to the diffuser was calculated to be 25 ms. This transit time was
used as a step-function the correction factor for all tests performed in the detailed
investigation to convert τexp to τig. Therefore, in the case shown in Figure 2–22, the τexp
value of 1.226 s results in a τig of 1.201 s In the detailed study, measured ignition times, τexp,
approximately range from 0.12 s to 3.2 s, resulting in mixing time effects of 20% down to
0.8% of the total ignition time. This is a vast improvement from the screening study which
saw measured ignition delay times, τexp, ranging from 2.5 to 20 times larger than the
corrected autoignition delay time, τig due to larger temperature ramps between the mixing and
test sections.
2.3.8 Temperature Profiles
As shown in Figure 2–10 and other studies using the initial version of the flow
reactor [54], the temperature profiles of the test section have a significant initial temperature
ramp. This ramp was due to the inability to heat the mixing section and diffuser to the
temperature level of the tube furnace. In the screening study, this temperature ramp and
corresponding induction time delay required adjustment to the measured ignition delay time
based on n-heptane calibrations. In the detailed investigation, the temperatures examined
were lower than those of the screening study, which allowed for the diffuser and mixing
section to be heated to the same level, flattening the profiles as shown in Figure 2–23 and
Figure 2–24.
The atmospheric portion of the detailed investigation examined ignition at the
following temperatures: 700 to 900 K. The sub-atmospheric portion only recorded ignition
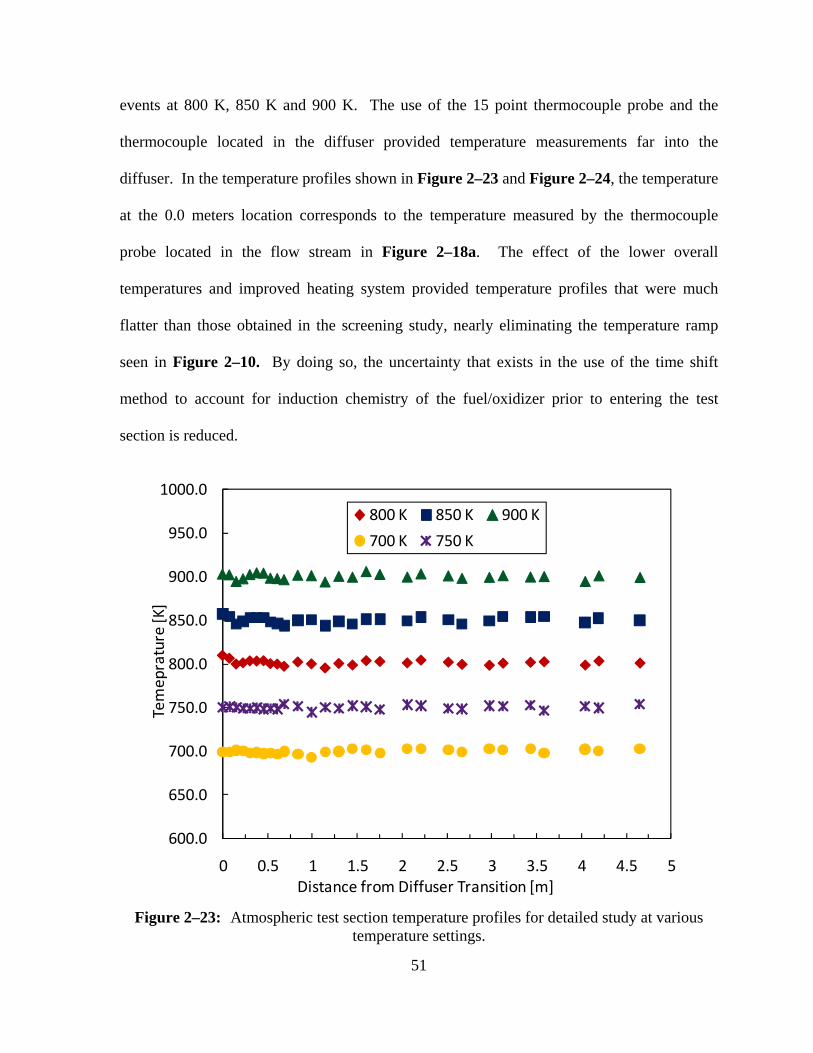
51
events at 800 K, 850 K and 900 K. The use of the 15 point thermocouple probe and the
thermocouple located in the diffuser provided temperature measurements far into the
diffuser. In the temperature profiles shown in Figure 2–23 and Figure 2–24, the temperature
at the 0.0 meters location corresponds to the temperature measured by the thermocouple
probe located in the flow stream in Figure 2–18a. The effect of the lower overall
temperatures and improved heating system provided temperature profiles that were much
flatter than those obtained in the screening study, nearly eliminating the temperature ramp
seen in Figure 2–10. By doing so, the uncertainty that exists in the use of the time shift
method to account for induction chemistry of the fuel/oxidizer prior to entering the test
section is reduced.
Figure 2–23: Atmospheric test section temperature profiles for detailed study at various
temperature settings.
600.0
650.0
700.0
750.0
800.0
850.0
900.0
950.0
1000.0
0 0.5 1 1.5 2 2.5 3 3.5 4 4.5 5
Temeprature [K]
Distance from Diffuser Transition [m]
800 K 850 K 900 K
700 K 750 K

52
Figure 2–24: Sub-atmospheric test section temperature profiles for detailed study at various
temperature settings.
600
650
700
750
800
850
900
950
1000
0 0.5 1 1.5 2 2.5 3 3.5 4 4.5 5 5.5
Temeprature [K]
Distance from Diffuser Transition [m]
800 K 850 K 900 K
53
2.4 Phase II Detailed Investigation - Experimental Procedure and Design
2.4.1 Experimental Procedure
The experimental procedure of the detailed investigation involved the same three
stages as the screening study: setting the flow reactor conditions, injecting the fuel and
oxidizer, and determining the ignition delay time. This overall procedure was used for all JP-
8 and n-alkane tests, both atmospheric and sub-atmospheric.
Setup of the system for injection measurements began with heating the flow reactor
apparatus and setting the flow rates through the different flow reactor components. For all
tests, the flow of the oxidizer stream (80 slpm for atmospheric tests, 40 slpm for 0.5 atm
tests) was made up of the necessary flow rates of air, N2, O2, and NO to meet the test
condition requirements. The flow rate through the fuel vaporizer was made up of a constant
flow of N2 (20 slpm for atmospheric tests, 10 slpm for 0.5 atm tests) and a variable flowrate
of fuel based on test requirements. An additional heated N2 stream was added to the system
that was injected through the fuel system between tests that had a flowrate equal to the flow
rate of N2 through the fuel vaporizer for a corresponding test condition.
Prior to a test, these flows were set and the heating elements (tube furnace, heat
tracing and inline gas heaters) on the flow reactor apparatus were allowed to reach steady
temperatures corresponding to the test being performed. Upon completion of a test, the
system was allowed to return to steady temperature levels. To refer back to the flow and
heating diagram of the modified apparatus for the detailed investigation, see Figure 2–13.
An ignition test was initiated by the activation of the fuel control valves, a
combination of three solenoid valves that directed the fuel/N2 flow to either the mixing
section of the flow reactor or a condenser and exhaust hood. Ignition events during the

54
detailed investigation were measured by a PMT equipped with a 310 nm narrow band pass
filter to record ignition events by observing the chemiluminescent of OH* radical which is
present at the time of ignition, as discussed in Section 2.3.7.
2.4.2 Experimental Variables and Test Matrix
The screening study determined that temperature, NO concentration and O2
concentration were of the largest significance to the ignition delay time of JP-8 in vitiated
environments high temperatures (See Chapter 3). Correspondingly, the purpose of the
detailed investigation was to examine these variables in further depth and at values extending
beyond the scope of the screening study. For the atmospheric tests, temperature was varied
from 700 K to 900 K in 50 K increments. The NO concentration of the oxidizer was
nominally varied at the following levels: 0, 50, 100, 250, 500 and 1000 ppm. The
concentration of O2 was examined at 20 vol% and 12 vol% balanced with N2 as the bulk
diluent. These ranges bracketed the values seen in vitiated combustors used in many aircraft
operations. All tests were performed at Φ = 1.0. The other components of vitiated air
examined in the screening study (CO2, CO, and H2O) were not included in the vitiated stream
for the detailed examination. The reduction in design variables simplified the test matrix and
experimental design for this portion of the study. If ignition occurred for all combinations of
each test temperature, NO and O2 concentration at atmospheric pressure, it would have
resulted in the 60 test cases that are shown in Table 0-5.
This phase of the study investigated the effect of these design variables at sub-
atmospheric conditions. These tests were performed at 0.5 atm and mirrored the atmospheric
test matrix down to the point where ignition would not occur due to insufficient residence

55
time inside the flow reactor, even with the extended length of the flow reactor test section.
2.4.3 Baseline Comparison
As was done in the screening study, the non-vitiated ignition delay time of JP-8 was
measured and compared to other non-vitiated experimental data. The ignition delay time
results for the atmospheric JP-8 tests in 20% O2/80% N2 mixtures without NO addition are
compared to other atmospheric jet fuel/air data in Figure 2–25. When compared to the
ignition delay time data of JP-8/air mixtures from the screening and previous studies[4]
[39][41], the data obtained from the detailed investigation appears to follow the same trend.
Figure 2–25: Comparison of atmospheric JP-8 IDT from detailed investigation to jet fuel experimental IDT data from Gokulakrishnan et. al. [4][41] and Freeman & Lefebvre [39]
In Figure 2–26, the atmospheric ignition delay time data for both JP-8 and n-decane
1
10
100
1000
0.8 0.9 1 1.1 1.2 1.3
Ignition
Delay
Tim
e [m
s]
1000/T [1/K]
JP‐8/Air Phi = 1.0 (Phase I)
JP‐8/20% O2/80% N2 Phi = 1.0 (Phase II)
JP‐8/Air Phi = 1.0 (Gokulakrishnan et al.)
JP‐8/Air Phi = 0 5 (Gokulakrishnan et al.)
Jet‐A/Air Phi = 0.5 (Freeman & Lefebvre)
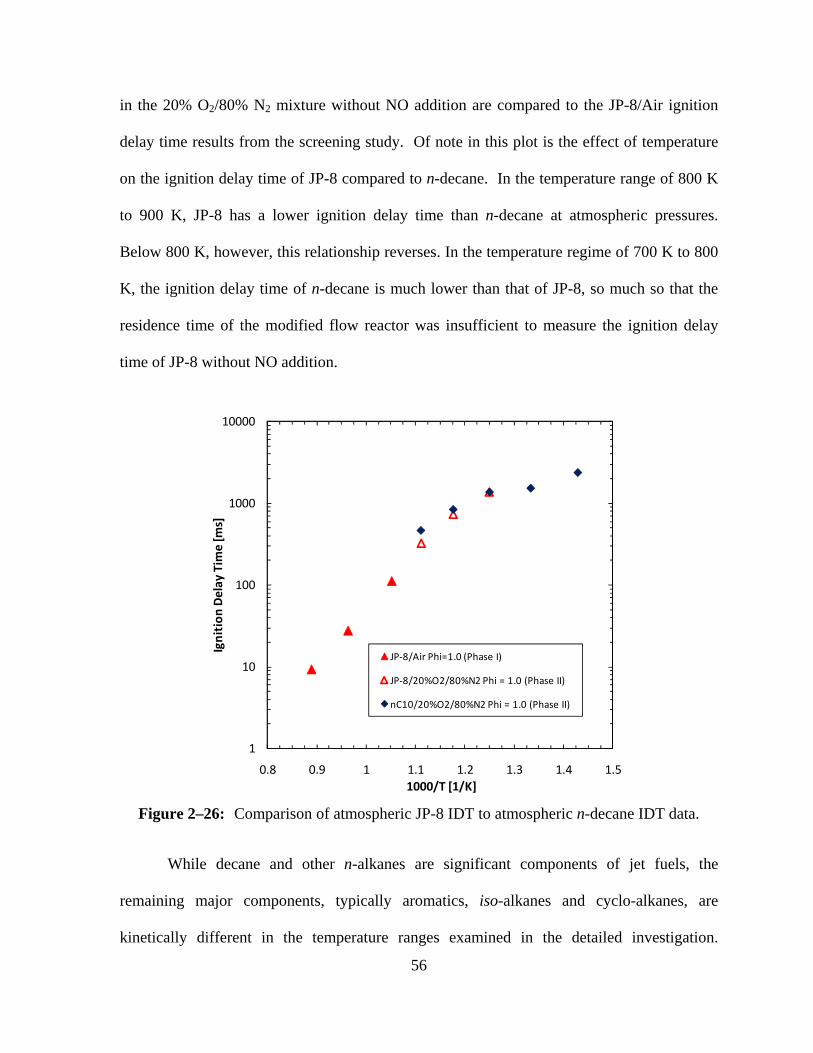
56
in the 20% O2/80% N2 mixture without NO addition are compared to the JP-8/Air ignition
delay time results from the screening study. Of note in this plot is the effect of temperature
on the ignition delay time of JP-8 compared to n-decane. In the temperature range of 800 K
to 900 K, JP-8 has a lower ignition delay time than n-decane at atmospheric pressures.
Below 800 K, however, this relationship reverses. In the temperature regime of 700 K to 800
K, the ignition delay time of n-decane is much lower than that of JP-8, so much so that the
residence time of the modified flow reactor was insufficient to measure the ignition delay
time of JP-8 without NO addition.
Figure 2–26: Comparison of atmospheric JP-8 IDT to atmospheric n-decane IDT data.
While decane and other n-alkanes are significant components of jet fuels, the
remaining major components, typically aromatics, iso-alkanes and cyclo-alkanes, are
kinetically different in the temperature ranges examined in the detailed investigation.
1
10
100
1000
10000
0.8 0.9 1 1.1 1.2 1.3 1.4 1.5
Ignition
Delay
Tim
e [m
s]
1000/T [1/K]
JP‐8/Air Phi=1.0 (Phase I)
JP‐8/20%O2/80%N2 Phi = 1.0 (Phase II)
nC10/20%O2/80%N2 Phi = 1.0 (Phase II)

57
Specifically, cyclo-alkanes have been found, in both experimental and theoretical analysis, to
have ignition delay times on the order of those of n-alkanes at the upper end of the
temperature range examined in the detailed investigation [55]. As temperatures are reduced,
however, their ignition delay times increase dramatically, similar to the effect that low
temperatures have on JP-8 in this study.
58
Chapter 3: Phase I Screening Study - Results and Discussion
3.1 Table of Results
Experimental results from the screening study are shown in Table 0-2 in the
Appendix. Listed at the top of Table 0-2 is the center point test (Test 0) which represents
the combined overall average and standard deviation of all runs for the four separately run 0
point test cases. Listed at the bottom of the matrix are three cases using non-vitiated air. For
each 56 tests as well as the Test 0 and the non-vitiated cases, the experimental ignition delay
time, τexp, its corresponding standard deviation of measured values, and the corrected ignition
delay time, τig, are given.
3.2 Significance of Main and Two-Factor Interaction Effects
The experimental data obtained from the 56 test cases determined in the BBD test
matrix was used to examine the significance of the 7 main effect and the 21 two-factor
interaction effects that the design variables of temperature, Φ, O2, CO2, CO, H2O, and NO
have on the autoignition time of JP-8. A discussed in section 2.2, the resolution V design of
this experiment avoids confounding of the main and two-factor interaction effects of the
variables and allows the examination of all 7 main effects and 21 interaction effects
independently.
As defined by Box et al. [52], the effect of a factor is the change in response to a
variable due to the move from the -1 value to the +1 value, e.g. from 950 K to 1125 K for the
temperature variable. For this study, the main effect of the 7 design variables is determined
first by taking the level of the design variable for a specific test (-1, 0 or +1) and multiplying
59
it with the ignition delay time for that test. The sum of this value across all 56 tests is the
main effect for that design variable:
eq. 1
where Em is the main effect for a given variable m while and are the design level for
variable m and the ignition delay time respectively for a given test k. For example, the main
effect of temperature is calculated as follows. The value of τig for each test case, k, is
multiplied by the corresponding variable level, νm, for the temperature variable of that test: -1
for 950 K, 0 for 1038 K, or +1 for 1125 K. Ignition delay time values therefore have a
negative value for low level for temperature cases and a positive value for high level for
temperature cases. The value of tests performed at the midpoint temperature becomes zero.
The summation of these values is then taken to calculate the overall effect of the given
variable. In the case of temperature, the values sum to -780.6, denoting a negative effect i.e.
as temperature increases ignition delay time decreases and vice versa. The effect of
temperature was found to be the largest in magnitude of all main and two-factor interaction
effects.
The full main effect matrix is shown in Table 0-3. The main effects of the 7 design
variables are normalized to the largest effect, temperature whose magnitude is set equal to 1
and shown in Figure 3–1. A negative effect denotes that increasing the BBD design level of
a given design variable (from -1 to +1) results in a reduction of ignition delay time whereas a
positive value denotes an increase in ignition delay time as the design level increases. It
should be noted that in the case of O2, an increase in the design level from -1 to +1 denotes a
decrease of the O2 concentration in the oxidizer stream which is due to the presence of more
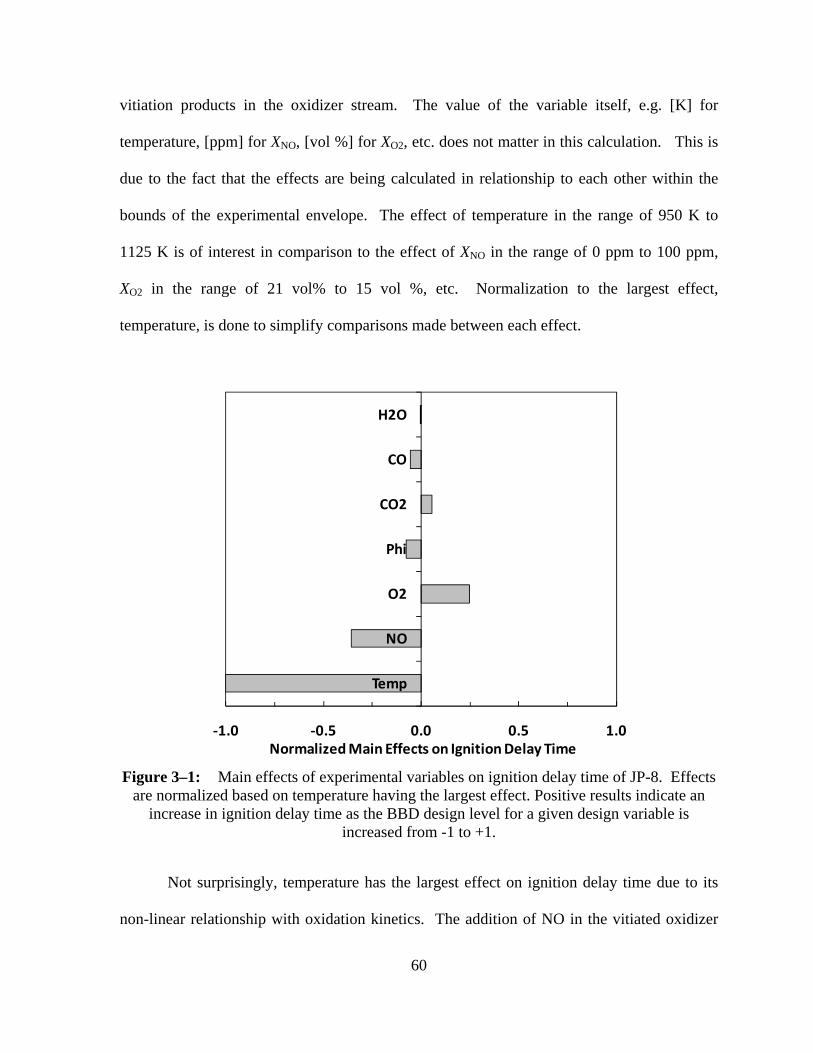
60
vitiation products in the oxidizer stream. The value of the variable itself, e.g. [K] for
temperature, [ppm] for XNO, [vol %] for XO2, etc. does not matter in this calculation. This is
due to the fact that the effects are being calculated in relationship to each other within the
bounds of the experimental envelope. The effect of temperature in the range of 950 K to
1125 K is of interest in comparison to the effect of XNO in the range of 0 ppm to 100 ppm,
XO2 in the range of 21 vol% to 15 vol %, etc. Normalization to the largest effect,
temperature, is done to simplify comparisons made between each effect.
Figure 3–1: Main effects of experimental variables on ignition delay time of JP-8. Effects
are normalized based on temperature having the largest effect. Positive results indicate an increase in ignition delay time as the BBD design level for a given design variable is
increased from -1 to +1.
Not surprisingly, temperature has the largest effect on ignition delay time due to its
non-linear relationship with oxidation kinetics. The addition of NO in the vitiated oxidizer
‐1.0 ‐0.5 0.0 0.5 1.0
Temp
NO
O2
Phi
CO2
CO
H2O
Normalized Main Effects on Ignition Delay Time

61
stream has the second largest effect of the design variables on ignition delay time. Nitric
oxide, which is known for its catalytic effect on promoting the oxidation of fuel-lean
hydrocarbon mixtures at low temperatures [17], not only has the largest significance of the
oxidizer composition variables, but also occurs with trace quantities in the vitiated air stream.
Oxygen concentration is the third design variable that has a significant effect, resulting in
longer ignition delay times at lower O2 concentrations. Equivalence ratio, CO2, and CO
concentrations have less significant effects on ignition delay time, with Φ and CO reducing
ignition delay time while CO2 increases ignition delay time. For the conditions studied, H2O
is found to have a negligible effect on ignition delay time compared to the other design
variables.
Along with main effects, two-factor interaction effects of design variables can have a
substantial influence on the response variable of a given system, in the case of this study,
ignition delay time. Box et al. [52] determines the value of the interaction effect by taking
the difference between the average of effect m with the high and low value averages of effect
n; where m and n represent the two unlike design variables for whose interaction effect is
being determined. Similar to the calculation of the main effects, the 21 two-factor interaction
effects are calculated by taking the level of two design variables for a specific test and
multiplying their product with the ignition delay time for that given test. The sum of these
values across all tests is the two-factor interaction effect EmEn for those design variables m
and n.
eq. 2
where and are the design levels (i.e. -1, 0, or +1) for variables m and n. is the

62
ignition delay time for a given test k. The 7 main effects and 21 two-factor interaction effects
are normalized based on the largest effect and listed in Table 0-3 and Table 0-4 respectively.
In Figure 3–2, the cumulative probability of the 28 main and two-factor interaction
effects are plotted with 24 of the 28 effects fall within the following range:
2 eq. 3
where R is the range of effects that fall between one half of a standard deviation, s, above and
below the median, m, of the 28 effects.
Figure 3–2: Normalized main factor and two-factor interaction effects of experimental
design variables based on ignition delay time.
In Figure 3–2, the solid red line, —, represents the normalized median of the
interaction effects. The dotted red lines, ·····, represent ± one half of the standard deviation of
0
25
50
75
100
‐100% ‐50% 0% 50% 100%
Cumulative Prob
ability
Main and Two‐Factor Interaction Effects Based on the Experimental Data
TNO
O2T‐NO
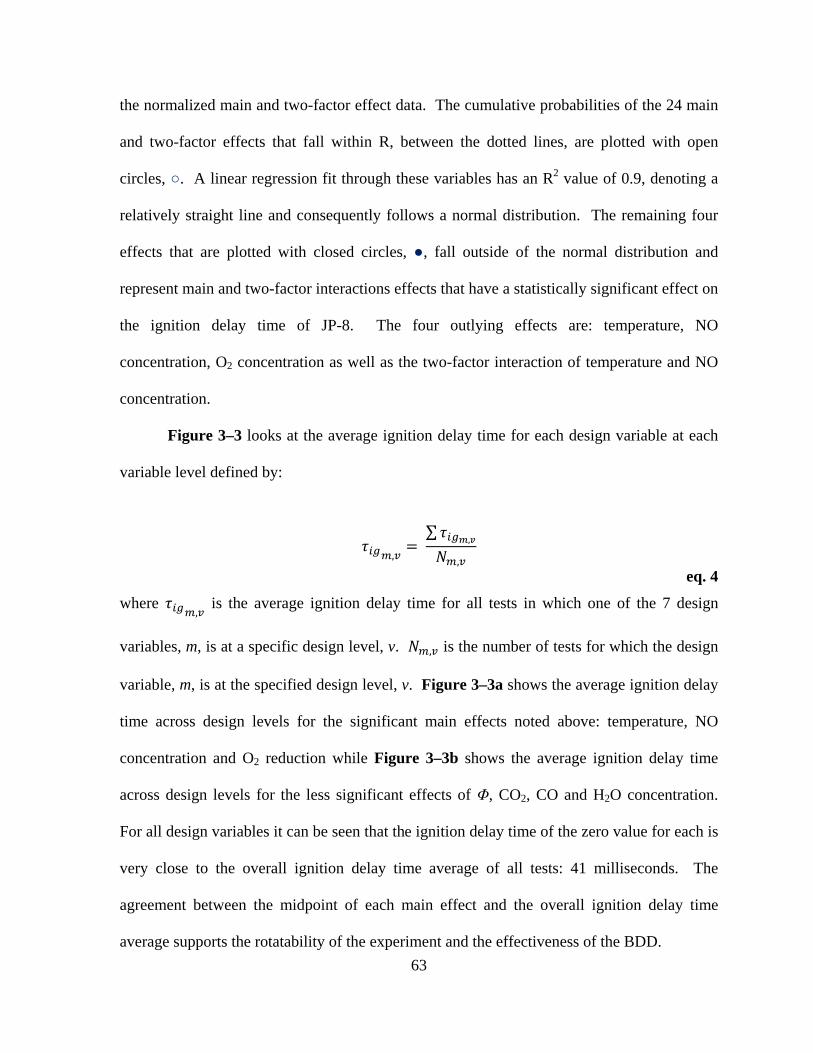
63
the normalized main and two-factor effect data. The cumulative probabilities of the 24 main
and two-factor effects that fall within R, between the dotted lines, are plotted with open
circles, ○. A linear regression fit through these variables has an R2 value of 0.9, denoting a
relatively straight line and consequently follows a normal distribution. The remaining four
effects that are plotted with closed circles, ●, fall outside of the normal distribution and
represent main and two-factor interactions effects that have a statistically significant effect on
the ignition delay time of JP-8. The four outlying effects are: temperature, NO
concentration, O2 concentration as well as the two-factor interaction of temperature and NO
concentration.
Figure 3–3 looks at the average ignition delay time for each design variable at each
variable level defined by:
, ∑ ,
,
eq. 4
where ,
is the average ignition delay time for all tests in which one of the 7 design
variables, m, is at a specific design level, v. , is the number of tests for which the design
variable, m, is at the specified design level, v. Figure 3–3a shows the average ignition delay
time across design levels for the significant main effects noted above: temperature, NO
concentration and O2 reduction while Figure 3–3b shows the average ignition delay time
across design levels for the less significant effects of Φ, CO2, CO and H2O concentration.
For all design variables it can be seen that the ignition delay time of the zero value for each is
very close to the overall ignition delay time average of all tests: 41 milliseconds. The
agreement between the midpoint of each main effect and the overall ignition delay time
average supports the rotatability of the experiment and the effectiveness of the BDD.

64
Figure 3–3: Average IDT for each main factor of all tests for a given variable ranking.
Error bars represent standard deviation for averaged set of tests for a given design variable across all three levels. Note: XO2 is represented as the reduction in O2
from 21% at -1 to 15% at +1.
To further highlight the significance of temperature, NO concentration and O2
reduction, Figure 3–4 plots the average change in ignition delay time from the -1 to +1 value
for each main affect as a percent change from the value for ,‐
for all 7 main effects. In
Figure 3–4a, the changes in ignition delay time from the -1 to +1 level for temperature, O2
and NO are -82%, -43% and +49% respectively. The changes in ignition delay time for these
three variables can be compared to a maximum change of ± 13% for the remaining main
factors shown in Figure 3–4b. Based on the significance of temperature, NO concentration
and O2 reduction, these main effects as well as the two-factor interaction effect of
temperature and NO will be discussed in more detail in the following sections.
0
10
20
30
40
50
60
70
80
90
100
‐1 0 1
IDT [m
s]
Variable Level
Temp [K]
XO2 [vol% red.]
XNO [ppm]
a
0
10
20
30
40
50
60
70
80
90
100
‐1 0 1
IDT [m
s]
Variable Level
ΦXCO2 [vol%]XCO [vol%]XH2O [vol%]
b
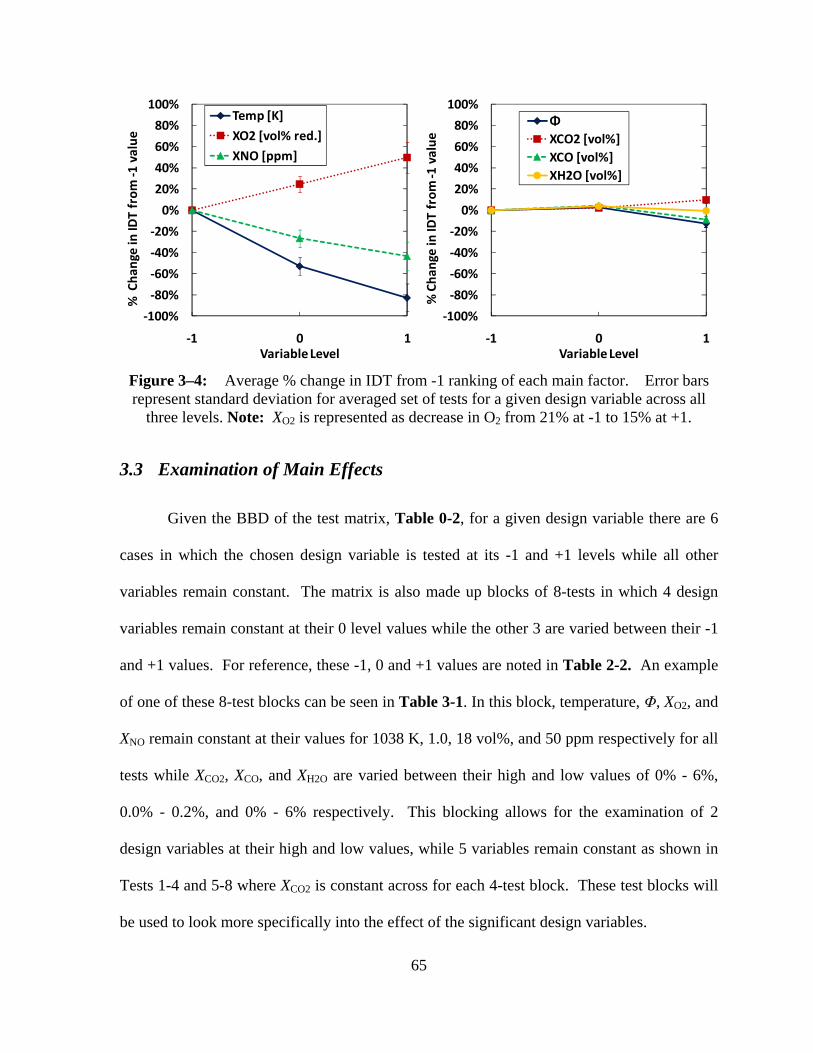
65
Figure 3–4: Average % change in IDT from -1 ranking of each main factor. Error bars represent standard deviation for averaged set of tests for a given design variable across all
three levels. Note: XO2 is represented as decrease in O2 from 21% at -1 to 15% at +1.
3.3 Examination of Main Effects
Given the BBD of the test matrix, Table 0-2, for a given design variable there are 6
cases in which the chosen design variable is tested at its -1 and +1 levels while all other
variables remain constant. The matrix is also made up blocks of 8-tests in which 4 design
variables remain constant at their 0 level values while the other 3 are varied between their -1
and +1 values. For reference, these -1, 0 and +1 values are noted in Table 2-2. An example
of one of these 8-test blocks can be seen in Table 3-1. In this block, temperature, Φ, XO2, and
XNO remain constant at their values for 1038 K, 1.0, 18 vol%, and 50 ppm respectively for all
tests while XCO2, XCO, and XH2O are varied between their high and low values of 0% - 6%,
0.0% - 0.2%, and 0% - 6% respectively. This blocking allows for the examination of 2
design variables at their high and low values, while 5 variables remain constant as shown in
Tests 1-4 and 5-8 where XCO2 is constant across for each 4-test block. These test blocks will
be used to look more specifically into the effect of the significant design variables.
‐100%
‐80%
‐60%
‐40%
‐20%
0%
20%
40%
60%
80%
100%
‐1 0 1
% Cha
nge in ID
T from
‐1 value
Variable Level
Temp [K]
XO2 [vol% red.]
XNO [ppm]
‐100%
‐80%
‐60%
‐40%
‐20%
0%
20%
40%
60%
80%
100%
‐1 0 1
% Cha
nge in ID
T from
‐1 value
Variable Level
ΦXCO2 [vol%]XCO [vol%]XH2O [vol%]
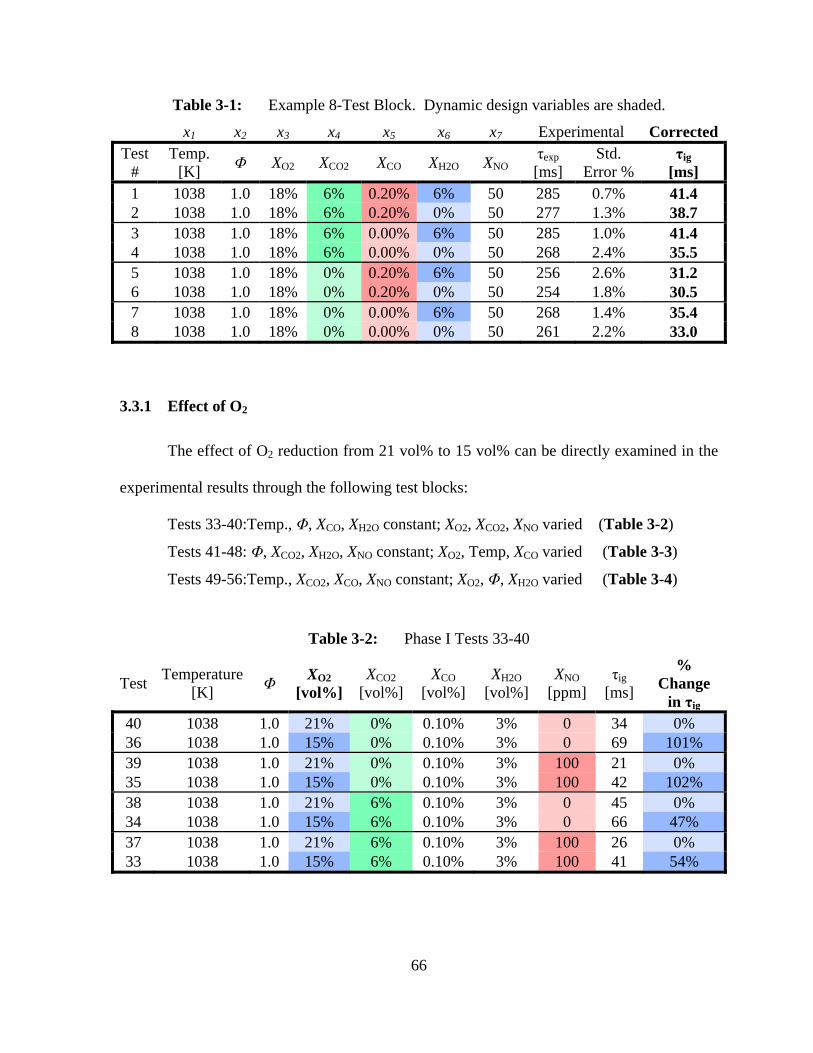
66
Table 3-1: Example 8-Test Block. Dynamic design variables are shaded.
x1 x2 x3 x4 x5 x6 x7 Experimental CorrectedTest
# Temp.
[K] Φ XO2 XCO2 XCO XH2O XNO τexp [ms]
Std. Error %
τig [ms]
1 1038 1.0 18% 6% 0.20% 6% 50 285 0.7% 41.4 2 1038 1.0 18% 6% 0.20% 0% 50 277 1.3% 38.7 3 1038 1.0 18% 6% 0.00% 6% 50 285 1.0% 41.4 4 1038 1.0 18% 6% 0.00% 0% 50 268 2.4% 35.5 5 1038 1.0 18% 0% 0.20% 6% 50 256 2.6% 31.2 6 1038 1.0 18% 0% 0.20% 0% 50 254 1.8% 30.5 7 1038 1.0 18% 0% 0.00% 6% 50 268 1.4% 35.4 8 1038 1.0 18% 0% 0.00% 0% 50 261 2.2% 33.0
3.3.1 Effect of O2
The effect of O2 reduction from 21 vol% to 15 vol% can be directly examined in the
experimental results through the following test blocks:
Tests 33-40:Temp., Φ, XCO, XH2O constant; XO2, XCO2, XNO varied (Table 3-2)
Tests 41-48: Φ, XCO2, XH2O, XNO constant; XO2, Temp, XCO varied (Table 3-3)
Tests 49-56:Temp., XCO2, XCO, XNO constant; XO2, Φ, XH2O varied (Table 3-4)
Table 3-2: Phase I Tests 33-40
Test Temperature [K] Φ XO2
[vol%]XCO2
[vol%] XCO
[vol%] XH2O
[vol%] XNO
[ppm] τig
[ms]
% Change
in τig 40 1038 1.0 21% 0% 0.10% 3% 0 34 0% 36 1038 1.0 15% 0% 0.10% 3% 0 69 101% 39 1038 1.0 21% 0% 0.10% 3% 100 21 0% 35 1038 1.0 15% 0% 0.10% 3% 100 42 102% 38 1038 1.0 21% 6% 0.10% 3% 0 45 0% 34 1038 1.0 15% 6% 0.10% 3% 0 66 47% 37 1038 1.0 21% 6% 0.10% 3% 100 26 0% 33 1038 1.0 15% 6% 0.10% 3% 100 41 54%
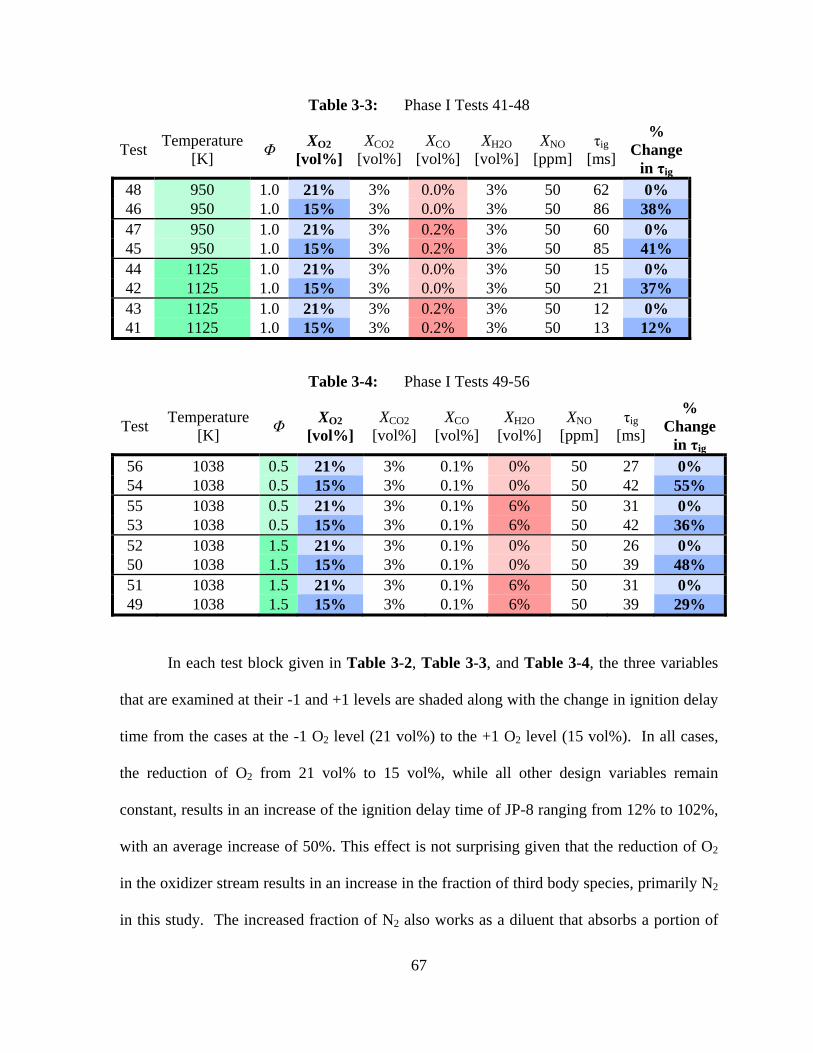
67
Table 3-3: Phase I Tests 41-48
Test Temperature [K] Φ XO2
[vol%]XCO2
[vol%]XCO
[vol%]XH2O
[vol%]XNO
[ppm] τig
[ms]
% Change
in τig 48 950 1.0 21% 3% 0.0% 3% 50 62 0% 46 950 1.0 15% 3% 0.0% 3% 50 86 38% 47 950 1.0 21% 3% 0.2% 3% 50 60 0% 45 950 1.0 15% 3% 0.2% 3% 50 85 41% 44 1125 1.0 21% 3% 0.0% 3% 50 15 0% 42 1125 1.0 15% 3% 0.0% 3% 50 21 37% 43 1125 1.0 21% 3% 0.2% 3% 50 12 0% 41 1125 1.0 15% 3% 0.2% 3% 50 13 12%
Table 3-4: Phase I Tests 49-56
Test Temperature [K] Φ XO2
[vol%] XCO2
[vol%] XCO
[vol%] XH2O
[vol%] XNO
[ppm] τig
[ms]
% Change
in τig 56 1038 0.5 21% 3% 0.1% 0% 50 27 0% 54 1038 0.5 15% 3% 0.1% 0% 50 42 55% 55 1038 0.5 21% 3% 0.1% 6% 50 31 0% 53 1038 0.5 15% 3% 0.1% 6% 50 42 36% 52 1038 1.5 21% 3% 0.1% 0% 50 26 0% 50 1038 1.5 15% 3% 0.1% 0% 50 39 48% 51 1038 1.5 21% 3% 0.1% 6% 50 31 0% 49 1038 1.5 15% 3% 0.1% 6% 50 39 29%
In each test block given in Table 3-2, Table 3-3, and Table 3-4, the three variables
that are examined at their -1 and +1 levels are shaded along with the change in ignition delay
time from the cases at the -1 O2 level (21 vol%) to the +1 O2 level (15 vol%). In all cases,
the reduction of O2 from 21 vol% to 15 vol%, while all other design variables remain
constant, results in an increase of the ignition delay time of JP-8 ranging from 12% to 102%,
with an average increase of 50%. This effect is not surprising given that the reduction of O2
in the oxidizer stream results in an increase in the fraction of third body species, primarily N2
in this study. The increased fraction of N2 also works as a diluent that absorbs a portion of

68
the exothermic energy of the combustion process. This effect can also be seen in Figure 3–5
through the reduction in the adiabatic flame temperature of jet fuel as O2 in a system is
replaced by N2 while the remaining vitiated species concentrations, Φ, and temperature
remain the same.
Figure 3–5: Calculated adiabatic flame temperature of Jet-A(C12H23)/vitiated air mixtures.
Jet-A acquired from Burcat [56] and Gracia-Salcedo et al. [57]. O2 concentration varied from 21 vol% to 15 vol%. Remaining design variables are constant at their
corresponding 0 level values.
3.3.2 Effect of Temperature
The effect of temperature from 950 K to 1125 K can be directly examined in the
experimental results through the following test blocks:
Tests 9-16: Φ, XO2, XCO2, XCO, constant; Temp., XH2O, XNO varied (Table 3-5)
Tests 25-32: XO2, XCO, XH2O, XNO constant; Temp, Φ, XCO2 varied (Table 3-6)
Tests 41-48: Φ, XCO2, XCO, XNO constant; Temp, XO2, XCO varied (Table 3-7)
2300
2350
2400
2450
2500
2550
2600
15%18%21%
Adiabatic Flame Tempe
rature [K]
XO2 [vol %]
Tin = 1038 K, Φ = 13% CO2, 0.1% CO
3% H2O, 50 ppm NO

69
Table 3-5: Phase I Tests 9-16
Test Temperature [K] Φ XO2
[vol%] XCO2
[vol%] XCO
[vol%] XH2O
[vol%] XNO
[ppm] τig
[ms]
% Change
in τig 16 950 1.0 18% 3% 0.1% 0% 0 118 0% 12 1125 1.0 18% 3% 0.1% 0% 0 18 -85% 15 950 1.0 18% 3% 0.1% 0% 100 61 0% 11 1125 1.0 18% 3% 0.1% 0% 100 9 -85% 14 950 1.0 18% 3% 0.1% 6% 0 97 0% 10 1125 1.0 18% 3% 0.1% 6% 0 21 -79% 13 950 1.0 18% 3% 0.1% 6% 100 49 0% 9 1125 1.0 18% 3% 0.1% 6% 100 16 -67%
Table 3-6: Phase I Tests 25-32
Test Temperature [K] Φ XO2
[vol%] XCO2
[vol%] XCO
[vol%] XH2O
[vol%] XNO
[ppm] τig
[ms]
% Change
in τig 32 950 0.5 18% 0% 0.1% 3% 50 86 0% 28 1125 0.5 18% 0% 0.1% 3% 50 11 -87% 31 950 0.5 18% 6% 0.1% 3% 50 94 0% 27 1125 0.5 18% 6% 0.1% 3% 50 6 -94% 30 950 1.5 18% 0% 0.1% 3% 50 73 0% 26 1125 1.5 18% 0% 0.1% 3% 50 9 -87% 29 950 1.5 18% 6% 0.1% 3% 50 71 0% 25 1125 1.5 18% 6% 0.1% 3% 50 14 -80%
Table 3-7: Phase I Tests 41-48
Test Temperature [K] Φ XO2
[vol%] XCO2
[vol%] XCO
[vol%] XH2O
[vol%] XNO
[ppm] τig
[ms]
% Change
in τig 48 950 1.0 21% 3% 0.0% 3% 50 62 0% 44 1125 1.0 21% 3% 0.0% 3% 50 15 -75% 47 950 1.0 21% 3% 0.2% 3% 50 60 0% 43 1125 1.0 21% 3% 0.2% 3% 50 12 -80% 46 950 1.0 15% 3% 0.0% 3% 50 86 0% 42 1125 1.0 15% 3% 0.0% 3% 50 21 -76% 45 950 1.0 15% 3% 0.2% 3% 50 85 0% 41 1125 1.0 15% 3% 0.2% 3% 50 13 -85%
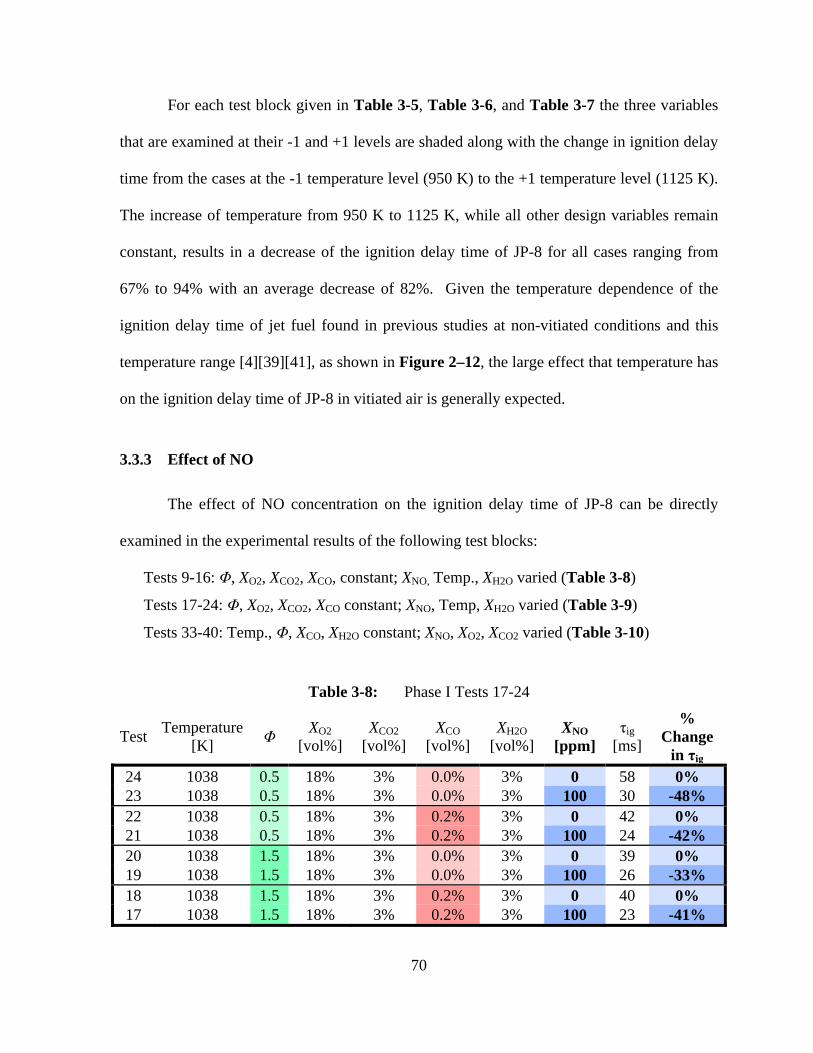
70
For each test block given in Table 3-5, Table 3-6, and Table 3-7 the three variables
that are examined at their -1 and +1 levels are shaded along with the change in ignition delay
time from the cases at the -1 temperature level (950 K) to the +1 temperature level (1125 K).
The increase of temperature from 950 K to 1125 K, while all other design variables remain
constant, results in a decrease of the ignition delay time of JP-8 for all cases ranging from
67% to 94% with an average decrease of 82%. Given the temperature dependence of the
ignition delay time of jet fuel found in previous studies at non-vitiated conditions and this
temperature range [4][39][41], as shown in Figure 2–12, the large effect that temperature has
on the ignition delay time of JP-8 in vitiated air is generally expected.
3.3.3 Effect of NO
The effect of NO concentration on the ignition delay time of JP-8 can be directly
examined in the experimental results of the following test blocks:
Tests 9-16: Φ, XO2, XCO2, XCO, constant; XNO, Temp., XH2O varied (Table 3-8)
Tests 17-24: Φ, XO2, XCO2, XCO constant; XNO, Temp, XH2O varied (Table 3-9)
Tests 33-40: Temp., Φ, XCO, XH2O constant; XNO, XO2, XCO2 varied (Table 3-10)
Table 3-8: Phase I Tests 17-24
Test Temperature [K] Φ XO2
[vol%] XCO2
[vol%] XCO
[vol%] XH2O
[vol%] XNO
[ppm] τig
[ms]
% Change
in τig 24 1038 0.5 18% 3% 0.0% 3% 0 58 0% 23 1038 0.5 18% 3% 0.0% 3% 100 30 -48% 22 1038 0.5 18% 3% 0.2% 3% 0 42 0% 21 1038 0.5 18% 3% 0.2% 3% 100 24 -42% 20 1038 1.5 18% 3% 0.0% 3% 0 39 0% 19 1038 1.5 18% 3% 0.0% 3% 100 26 -33% 18 1038 1.5 18% 3% 0.2% 3% 0 40 0% 17 1038 1.5 18% 3% 0.2% 3% 100 23 -41%

71
Table 3-9: Phase I Tests 9-16
Test Temperature [K] Φ XO2
[vol%] XCO2
[vol%] XCO
[vol%] XH2O
[vol%] XNO
[ppm] τig
[ms]
% Change
in τig 16 950 1.0 18% 3% 0.1% 0% 0 118 0% 15 950 1.0 18% 3% 0.1% 0% 100 61 -49% 14 950 1.0 18% 3% 0.1% 6% 0 97 0% 13 950 1.0 18% 3% 0.1% 6% 100 49 -50% 12 1125 1.0 18% 3% 0.1% 0% 0 18 0% 11 1125 1.0 18% 3% 0.1% 0% 100 9 -50% 10 1125 1.0 18% 3% 0.1% 6% 0 21 0% 9 1125 1.0 18% 3% 0.1% 6% 100 16 -22%
Table 3-10: Phase I Tests 33-40
Test Temperature [K] Φ XO2
[vol%]XCO2
[vol%]XCO
[vol%]XH2O
[vol%]XNO
[ppm] τig
[ms]
% Change
in τig 36 1038 1.0 15% 0% 0.1% 3% 0 69 0% 35 1038 1.0 15% 0% 0.1% 3% 100 42 -39% 34 1038 1.0 15% 6% 0.1% 3% 0 66 0% 33 1038 1.0 15% 6% 0.1% 3% 100 41 -39% 40 1038 1.0 21% 0% 0.1% 3% 0 34 0% 39 1038 1.0 21% 0% 0.1% 3% 100 21 -40% 38 1038 1.0 21% 6% 0.1% 3% 0 45 0% 37 1038 1.0 21% 6% 0.1% 3% 100 26 -42%
In each test block given in Table 3-8, Table 3-9, and Table 3-10, the three variables
that are examined at their -1 and +1 levels are shaded along with the change in ignition delay
time from the cases at the -1 NO level (0 ppm) to the +1 NO level (100 ppm). The addition
of NO to the vitiated stream from 0 ppm to 100 ppm, while all other design variables remain
constant, results in a decrease of the ignition delay time of JP-8 for all applicable test cases.
The percentage of ignition delay time reduction ranges from 22% to 50% with an average
decrease of 41%. This reductive effect occurs regardless of the temperature, Φ, or balance
concentration of the vitiated air.

72
This measureable effect of NO on the ignition and oxidation of JP-8 is supported by
numerous previous studies examining the effect of nitric oxides on the ignition and oxidation
of H2 and hydrocarbon fuels, including kerosene and gasoline surrogates [13]-[26][58].
Although the presence of 100 ppm of NO decreased ignition delay time for all tests in this
study, the relative effect of NO on ignition diminishes as the concentration increases. This
can be seen by looking at the averaged ignition delay time curve based on NO in Figure 3–4.
By noting that the percent change in ignition delay time from the 0 to +1 variable rank (50 to
100 ppm NO) is less than the percent chance in ignition delay time from the -1 to 0 variable
rank (0 to 50 ppm NO), the decrease of effectiveness at higher concentrations is shown. A
similar trend noting the decreased effect of NO at higher concentrations was observed by
Bromly et al.[17]. In that study, increasing the initial concentration of NO enhanced
oxidation up to 100 ppm at which point the consumption of CH4 plateaued and then
decreased slightly up to 200 ppm. Norrish et al.[14] also noted an inhibiting effect of NO at
higher concentrations. While the results of the screening study show an apparent reduction
in the effectiveness of NO, further examination across a larger range of concentrations is
required to better determine the asymptotic behavior and possible inhibition effects that NO
has on jet fuel ignition.
3.4 Interaction Effect of Temperature and NO
Statistically, the majority of the 21 two-factor effects of the 7 design variables on
ignition delay are not significant within the ranges inspected by the DOE of the screening
study. The exception to this finding is the two-factor interaction effect of temperature and
NO. As shown in Figure 3–2, the two-factor effect of temperature and NO is positive, rather

73
than negative, as is the case for the effect of both temperature and NO as main factors. The
positive value for the temperature-NO effect implies that the role of NO promoting the
oxidation of JP-8 would decrease as the temperature is increased. This point is further
illustrated in Figure 3–6 and Figure 3–7.
Figure 3–6: Comparison of the averaged main, combined and two-factor interaction effect
of temperature and XNO. -1, 0, & +1 values for temperature and XNO are 950, 1038, and 1125 K and 0, 50, and 100 ppm repsectively.
Figure 3–6 compares the effect of temperature, NO, and temperature-NO on the
ignition delay time of JP-8 over the rank of the design variables. The three points in each
curve represent average ignition delay time data for the specific main or combined effect at
each of the three variable rankings, -1, 0 and +1. In the case of NO they represent the
average of all the tests that contain 0 ppm (12 tests), 50 ppm (32 tests) and 100 ppm NO (12
tests). For the temperature curve they represent the average of tests that were run at 950K
‐100%
‐80%
‐60%
‐40%
‐20%
0%
20%
40%
60%
80%
100%
‐1 0 1
% Change in ID
T
Experimental Span
Temperature
NO
Temp/NO Combined
Temp/NO Interaction
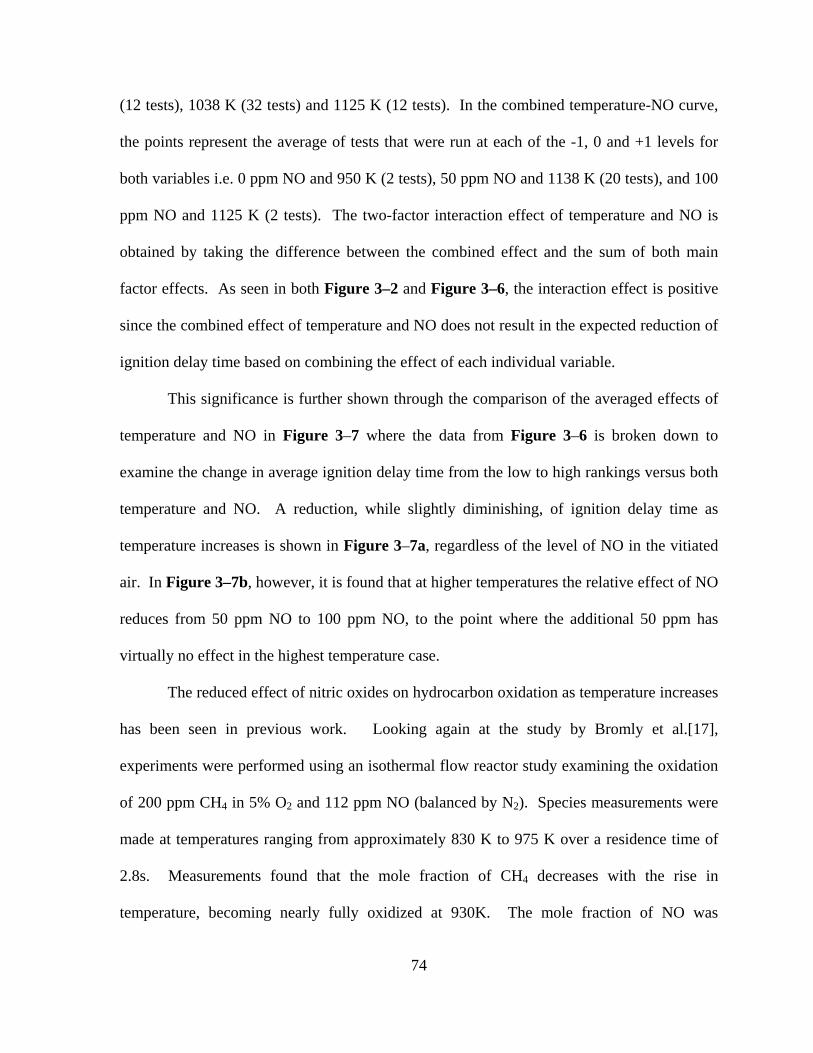
74
(12 tests), 1038 K (32 tests) and 1125 K (12 tests). In the combined temperature-NO curve,
the points represent the average of tests that were run at each of the -1, 0 and +1 levels for
both variables i.e. 0 ppm NO and 950 K (2 tests), 50 ppm NO and 1138 K (20 tests), and 100
ppm NO and 1125 K (2 tests). The two-factor interaction effect of temperature and NO is
obtained by taking the difference between the combined effect and the sum of both main
factor effects. As seen in both Figure 3–2 and Figure 3–6, the interaction effect is positive
since the combined effect of temperature and NO does not result in the expected reduction of
ignition delay time based on combining the effect of each individual variable.
This significance is further shown through the comparison of the averaged effects of
temperature and NO in Figure 3–7 where the data from Figure 3–6 is broken down to
examine the change in average ignition delay time from the low to high rankings versus both
temperature and NO. A reduction, while slightly diminishing, of ignition delay time as
temperature increases is shown in Figure 3–7a, regardless of the level of NO in the vitiated
air. In Figure 3–7b, however, it is found that at higher temperatures the relative effect of NO
reduces from 50 ppm NO to 100 ppm NO, to the point where the additional 50 ppm has
virtually no effect in the highest temperature case.
The reduced effect of nitric oxides on hydrocarbon oxidation as temperature increases
has been seen in previous work. Looking again at the study by Bromly et al.[17],
experiments were performed using an isothermal flow reactor study examining the oxidation
of 200 ppm CH4 in 5% O2 and 112 ppm NO (balanced by N2). Species measurements were
made at temperatures ranging from approximately 830 K to 975 K over a residence time of
2.8s. Measurements found that the mole fraction of CH4 decreases with the rise in
temperature, becoming nearly fully oxidized at 930K. The mole fraction of NO was

75
increasingly consumed in flows with temperatures up to 875 K. However, at higher
temperatures, the NO concentration began to rise back up towards initial levels. This finding
signifies the reduced ability of the NO to enhance reaction rates at higher temperatures.
Figure 3–7: Comparison of the averaged effects of temperature and XNO.
‐100%
‐90%
‐80%
‐70%
‐60%
‐50%
‐40%
‐30%
‐20%
‐10%
0%
950 975 1000 1025 1050 1075 1100 1125
% Cha
nge in ID
T
Temperature [K]
0 ppm NO50 ppm NO100 ppm NO
a
‐100%
‐90%
‐80%
‐70%
‐60%
‐50%
‐40%
‐30%
‐20%
‐10%
0%
0 20 40 60 80 100
% Cha
nge in ID
T
X_NO [ppm]
950 K1038 K1125 K
b
76
Chapter 4: Detailed Study - Results and Discussion
4.1 Tables of Results
A tabular version of the results of the detailed investigation are located in the
Appendix in Table 0-6, Table 0-7, and Table 0-8 and are broken up into three categories:
atmospheric results of JP-8 and O2/N2/NO mixtures, sub-atmospheric results of JP-8 and
O2/N2/NO mixtures, and all results of n-decane and O2/N2/NO mixtures respectively. Test
conditions are represented along with τig and the standard error for each test.
Experimental results for the atmospheric JP-8 tests are given in Table 0-6. For
atmospheric tests conducted with 20% O2 in the oxidizer, experiments were performed from
700 K to 900 K. Atmospheric tests with 12% O2 in the oxidizer were conducted from 800 K
to 900 K. The temperature range was reduced for 12% O2 tests due to residence time
limitations of the flow reactor apparatus. For both O2 levels, several tests points did not
register ignition or were not performed. These points are shaded out in Table 0-6.
Experimental results for the sub-atmospheric (0.5 atm) JP-8 tests are given in Table 0-7.
The sub-atmospheric testing was based off the atmospheric test matrix, Table 0-5. Tests
were only performed from 800 K to 900 K due to residence time limitations of the flow
reactor. Tests for which an ignition event did not occur are shaded out in the table.
In addition to JP-8 ignition testing, the ignition delay time of n-decane was examined
in this study at certain test conditions in order to compare JP-8 results to a component
typically found in surrogate mixtures for chemical kinetic modeling. Baseline tests (free of
NO in the oxidizer) were conducted at atmospheric pressure from 900 K to 700 K with 20
vol% O2 and at 900 K and 850 K with 12 vol% O2 in the oxidizer. Several tests looking at
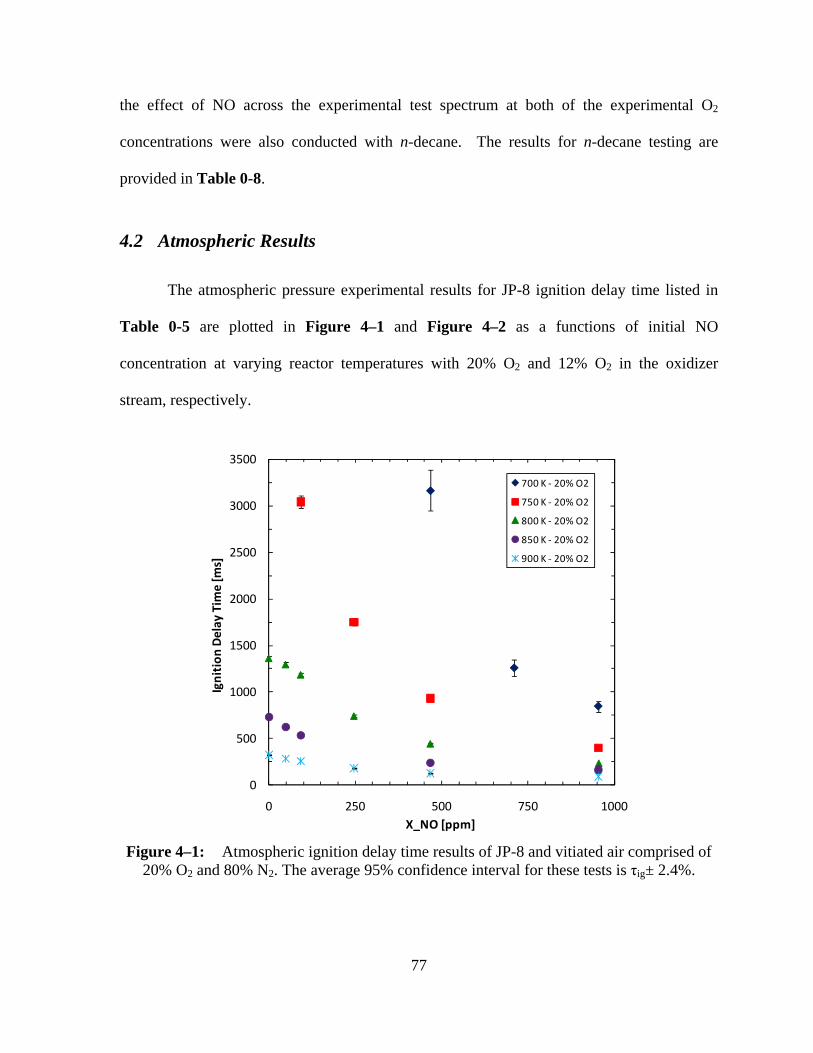
77
the effect of NO across the experimental test spectrum at both of the experimental O2
concentrations were also conducted with n-decane. The results for n-decane testing are
provided in Table 0-8.
4.2 Atmospheric Results
The atmospheric pressure experimental results for JP-8 ignition delay time listed in
Table 0-5 are plotted in Figure 4–1 and Figure 4–2 as a functions of initial NO
concentration at varying reactor temperatures with 20% O2 and 12% O2 in the oxidizer
stream, respectively.
Figure 4–1: Atmospheric ignition delay time results of JP-8 and vitiated air comprised of
20% O2 and 80% N2. The average 95% confidence interval for these tests is τig± 2.4%.
0
500
1000
1500
2000
2500
3000
3500
0 250 500 750 1000
Ignition
Delay
Tim
e [m
s]
X_NO [ppm]
700 K ‐ 20% O2
750 K ‐ 20% O2
800 K ‐ 20% O2
850 K ‐ 20% O2
900 K ‐ 20% O2

78
Figure 4–2: Atmospheric ignition delay time results of JP-8 and vitiated air comprised of
12% O2 and 88% N2. The average 95% confidence interval for these tests is τig± 1.7%.
4.2.1 Direct Effects of Temperature, O2 and NO on Ignition Delay Time of JP-8
In the screening portion of this study, test temperature as well as the concentrations of
O2 and NO in the oxidizer stream of the reactor were all found to significantly affect ignition
of JP-8 at atmospheric conditions, as shown in Figure 3–1. Through expanded
investigation, the direct effect of each of these design variables are found to be akin to the
screening results in the intermediate to high temperature range.
For JP-8/oxidizer mixtures consisting of the same levels of O2 and NO, increasing
temperature by any increment from 700 K to 900 K results in a reduction in ignition delay
time. Experimental ignition delay time results of stoichiometric mixtures of JP-8 and air
(free of NO in the oxidizer) for both phases of testing in this study are plotted along with
previous experimental findings and a surrogate model prediction [4][41] in Figure 4–3.
0
500
1000
1500
2000
2500
0 250 500 750 1000
Ignition
Delay
Tim
e [m
s]
X_NO [ppm]
800 K ‐ 12% O2
850 K ‐ 12% O2
900 K ‐ 12% O2
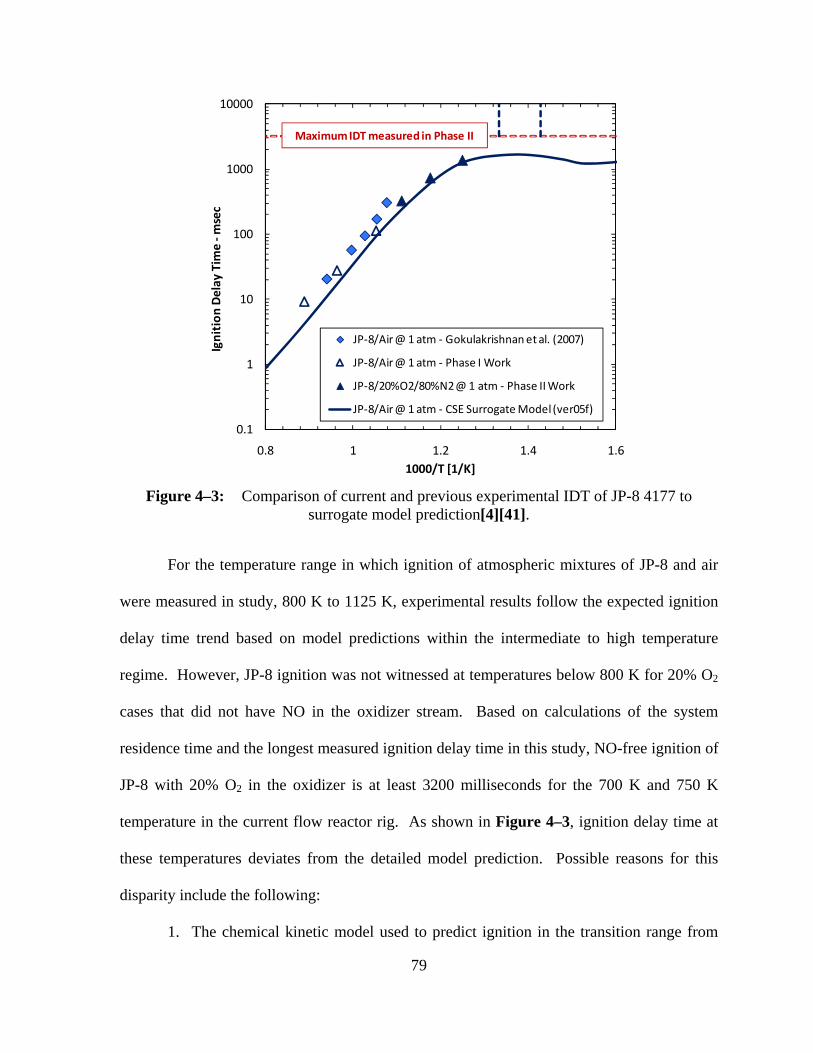
79
Figure 4–3: Comparison of current and previous experimental IDT of JP-8 4177 to
surrogate model prediction[4][41].
For the temperature range in which ignition of atmospheric mixtures of JP-8 and air
were measured in study, 800 K to 1125 K, experimental results follow the expected ignition
delay time trend based on model predictions within the intermediate to high temperature
regime. However, JP-8 ignition was not witnessed at temperatures below 800 K for 20% O2
cases that did not have NO in the oxidizer stream. Based on calculations of the system
residence time and the longest measured ignition delay time in this study, NO-free ignition of
JP-8 with 20% O2 in the oxidizer is at least 3200 milliseconds for the 700 K and 750 K
temperature in the current flow reactor rig. As shown in Figure 4–3, ignition delay time at
these temperatures deviates from the detailed model prediction. Possible reasons for this
disparity include the following:
1. The chemical kinetic model used to predict ignition in the transition range from
0.1
1
10
100
1000
10000
0.8 1 1.2 1.4 1.6
Ignition
Delay
Tim
e ‐m
sec
1000/T [1/K]
JP‐8/Air @ 1 atm ‐ Gokulakrishnan et al. (2007)
JP‐8/Air @ 1 atm ‐ Phase I Work
JP‐8/20%O2/80%N2 @ 1 atm ‐ Phase II Work
JP‐8/Air @ 1 atm ‐ CSE Surrogate Model (ver05f)
MaximumIDT measured in Phase II
80
intermediate to low temperatures over-predicts the NTC effect, resulting in lower
ignition times or;
2. The reactor model does not account for aspects of the experimental setup,
including the test apparatus and long residence times, that may affect ignition in
the NTC region. These include surface effects and diffusion of radicals to the
reactor wall that are relevant to NTC kinetics.
Future analysis will examine the role of the apparatus on ignition delay time at low
temperatures and apply these experimental findings to modeling techniques.
The results show the effect that varying the O2 concentration in the oxidizer has on
ignition delay time is consistent with the results from the screening study. Reducing the O2
concentration results in a significant increase in ignition delay time. Results from the
screening study show that the average increase in ignition delay time is 50% as O2 mole
fraction is reduced from 21% to 15%. In the detailed investigation, O2 mole fraction is
reduced from 20% to 12% at atmospheric pressure which results in an average increase in
ignition delay time of approximately 70%. The maximum and minimum increases are found
to be 115% and 32% respectively. This indicates that the two apparatuses are giving
consistent results.
As mentioned previously, the effect of even trace concentrations of NO (50 ppm) in
the oxidizer significantly affects the ignition time of JP-8. Increasing the oxidizer
concentration of NO from 50 ppm to approximately 1000 ppm consistently leads to shorter
ignition delay times. This follows suit with the findings of previous studies [22][24], in
which the presence of NO in the intermediate to high temperature range enhances the
oxidation of highly diluted mixtures of jet fuel surrogates and air. Although the effect that

81
NO has on JP-8 ignition increased with concentration, it was found to be exponential as
shown in Figure 4–1 and Figure 4–2, with ignition reduction reaching a maximum of
approximately 80% for the highest concentrations of NO examined. For example, in Figure
4–1, at 850 K, approximately 500 ppm NO reduces the ignition delay time from 730
milliseconds to 240 milliseconds, approximately a 67% reduction. However, further addition
of up to a total of approximately 1000 ppm NO has a marginal reduction of less than 100 ms
in ignition delay time and a total reduction of only 78% from the 0 ppm case as the effect of
NO levels off.
4.2.2 Interaction of Temperature with NO
In the screening study, the 21 two-factor interaction effects of all 7 design variables
were examined and plotted on a cumulative probability plot, Figure 3–2. Results show that a
significant interaction between temperature and NO exists in regard to JP-8 ignition at
atmospheric pressure and temperatures of 950 K - 1125 K. Continued significance of this
interaction is found in the intermediate to high temperature regime of 700 K to 900 K.
Evidence of this interaction is seen through the temperature-NO dependence discovered in
development of an empirical ignition model, as shown later in eq. 9 and discussed in section
4.2.4, as well as through the examination of the level of ignition delay time reduction due to
NO as varying test temperatures.
Figure 4–4 and Figure 4–5 show comparisons of the reduction of the ignition delay
time of JP-8 due to NO at atmospheric pressure and with 20% O2 and 12% O2 in the oxidizer
respectively. Figure 4–4 shows the ignition delay time results for cases where ignition could
occur at 20 % O2 without any added NO at 800 K, 850 K and 900 K. Similarly at 12 % O2,

82
only the 850 K and 900 K cases are shown Figure 4–5 given for the same reason. For the
20% O2 cases, the percent reduction in ignition delay time at 850 K is consistently higher
than that of 900 K for all cases with an initial concentration of NO in the oxidizer. A similar
trend is found for the 12% O2 cases, in which reduction is higher at 850K compared to 900 K
for all initial NO concentration of 100 ppm and higher. For the 20% O2 case, the average
difference in reduction between these two temperatures is ~6% while the average difference
is only ~4% for the 12% O2 case.
Figure 4–4: Comparison of temperature-NO interaction on reduction of atmospheric JP-8
ignition and vitiated air comprised of 20% O2 and 80% N2.
The reduction in ignition delay time at 800 K trends differently than at 850 K and 900
K cases at 20% O2 level as shown in Figure 4–1 and Figure 4–4. While the overall shape of
the ignition delay time and reduction curves at 850 K and 900 K are exponentially convex,
‐100%
‐80%
‐60%
‐40%
‐20%
0%
0 250 500 750 1000
(IDT ‐IDT 0)/IDT 0
X_NO [ppm]
900 K ‐ 1.0 atm ‐ 20% O2
850 K ‐ 1.0 atm ‐ 20% O2
800 K ‐ 1.0 atm ‐ 20% O2
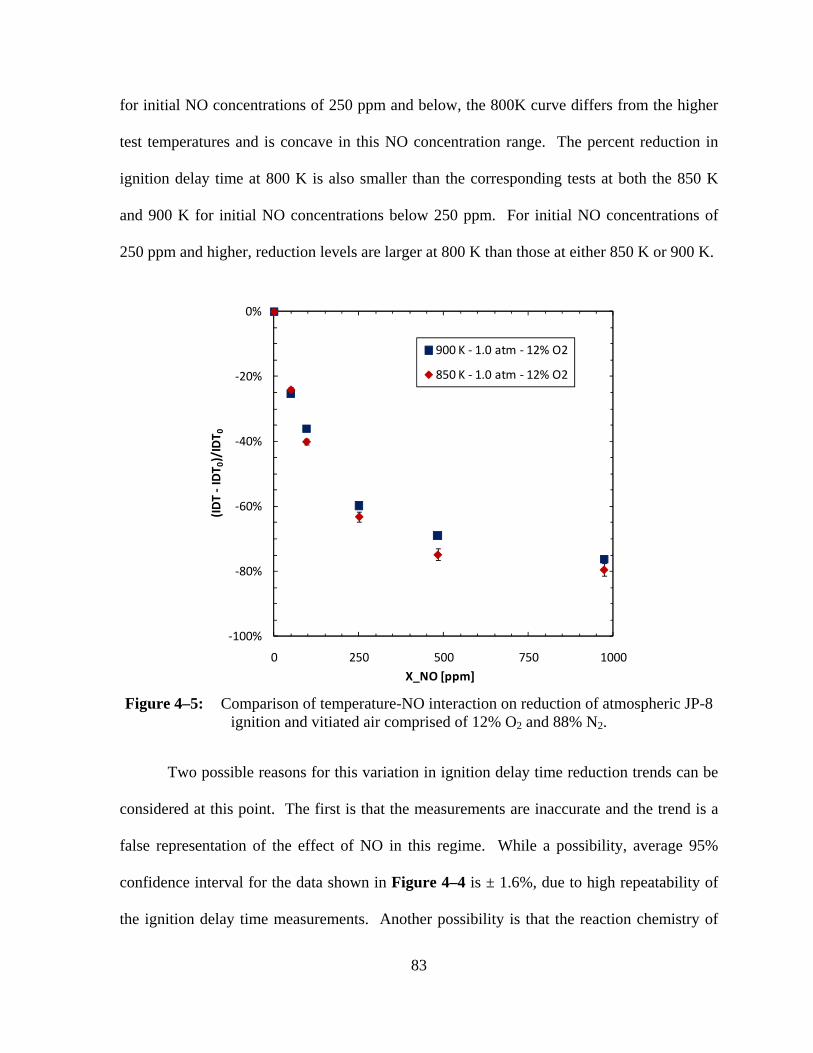
83
for initial NO concentrations of 250 ppm and below, the 800K curve differs from the higher
test temperatures and is concave in this NO concentration range. The percent reduction in
ignition delay time at 800 K is also smaller than the corresponding tests at both the 850 K
and 900 K for initial NO concentrations below 250 ppm. For initial NO concentrations of
250 ppm and higher, reduction levels are larger at 800 K than those at either 850 K or 900 K.
Figure 4–5: Comparison of temperature-NO interaction on reduction of atmospheric JP-8
ignition and vitiated air comprised of 12% O2 and 88% N2.
Two possible reasons for this variation in ignition delay time reduction trends can be
considered at this point. The first is that the measurements are inaccurate and the trend is a
false representation of the effect of NO in this regime. While a possibility, average 95%
confidence interval for the data shown in Figure 4–4 is ± 1.6%, due to high repeatability of
the ignition delay time measurements. Another possibility is that the reaction chemistry of
‐100%
‐80%
‐60%
‐40%
‐20%
0%
0 250 500 750 1000
(IDT ‐IDT 0)/IDT 0
X_NO [ppm]
900 K ‐ 1.0 atm ‐ 12% O2
850 K ‐ 1.0 atm ‐ 12% O2

84
JP-8 has begun to shift from the high temperature regime to the intermediate temperature
regime, resulting in varied effect of NO on ignition. As shown in Figure 4–3, 800 K
appears, based on the validated surrogate model, to be within the intermediate temperature
regime for which ignition chemistry becomes influenced by the NTC effect for non-vitiated
combustion of JP-8. This shift in chemistry results in different reaction pathways for the
oxidation of JP-8 but also variation in the effect of NO on ignition as well. Studies by
Moréac et al. [22] and Dubreuil et al. [24] found that for heavily diluted mixtures of jet fuel
surrogate components and mixtures (iso-octane, n-heptane, and toluene), the presence of 50
ppm to 500 ppm of NO enhances oxidation in the high temperature regime, but significantly
inhibits it at low to intermediate temperatures.
Unfortunately, ignition measurements were unable to be made at temperatures below
800 K without the presence of NO, preventing further analysis of its effect on ignition delay
time reduction and a single temperature case does not allow for strong conclusions to be
made regarding the effect on ignition that NO has as temperatures transition from high to
intermediate and low temperature regimes. The fact that ignition did occur and decreased
exponentially for the cases with NO in the oxidizer suggests that its presence in large enough
concentrations does enhance ignition down to 700 K. It must be noted, however, that
questions remain regarding possible experimental effects (i.e. surface effects and radical
diffusion discussed in section 4.2) could alter the reaction pathways being used for oxidation
and therefore further analysis is necessary to fully understand this phenomena.
4.2.3 Interaction of O2 with NO
As shown in Figure 3–2, the only interaction effect examined in the screening study

85
that falls outside the range of normal probability is that of temperature and NO, which has a
normalized effect value of 0.118 (compared to a value of 1.0 for temperature). The
interaction of NO and other screening design variables are found to have comparatively low
significance within the envelope of conditions tested in the screening study. For example,
the interaction of O2 and NO has a normalized effect value of only 0.034 as listed in Table
0-4. In the detailed investigation, however, the interaction of NO and O2 was examined in
further detail and is found to have a measureable effect on the ignition delay time of JP-8 in
the expanded experimental conditions, i.e. lower temperatures and a larger range of initial
NO concentration. Figure 4–6 compares the reduction of the ignition delay time of JP-8
with 20% O2 vs. 12% O2 in the oxidizer at atmospheric pressure and reactor temperatures of
850 K and 900 K. The results plotted in Figure 4–6 show that reducing the concentration of
O2 in the oxidizer stream enhances the effect of NO to reduce ignition delay time. This is
determined from the observation that the average percent reduction in ignition delay time at
the 12 % O2 level is larger than that of the 20% O2 level for both constant temperature cases
at 850 K and 900 K.
At 850 K, the average difference in the percent reduction of ignition delay time
between the 12% O2 and 20% O2 cases is approximately 8% with the largest differences of
10% and 13% corresponding to initial NO concentrations of 50 ppm and 100 ppm
respectively. At 900 K, the average difference across all NO concentrations is larger,
approximately 11%, with a maximum difference of 15% corresponding to initial NO
concentrations of 50 ppm and 100 ppm. In both temperature cases, the smallest difference in
reduction is found with approximately 1000 ppm NO in the oxidizer. At 850 K the
difference is only 2%, while at 900 K it increases to 5%. Based on these differences, the
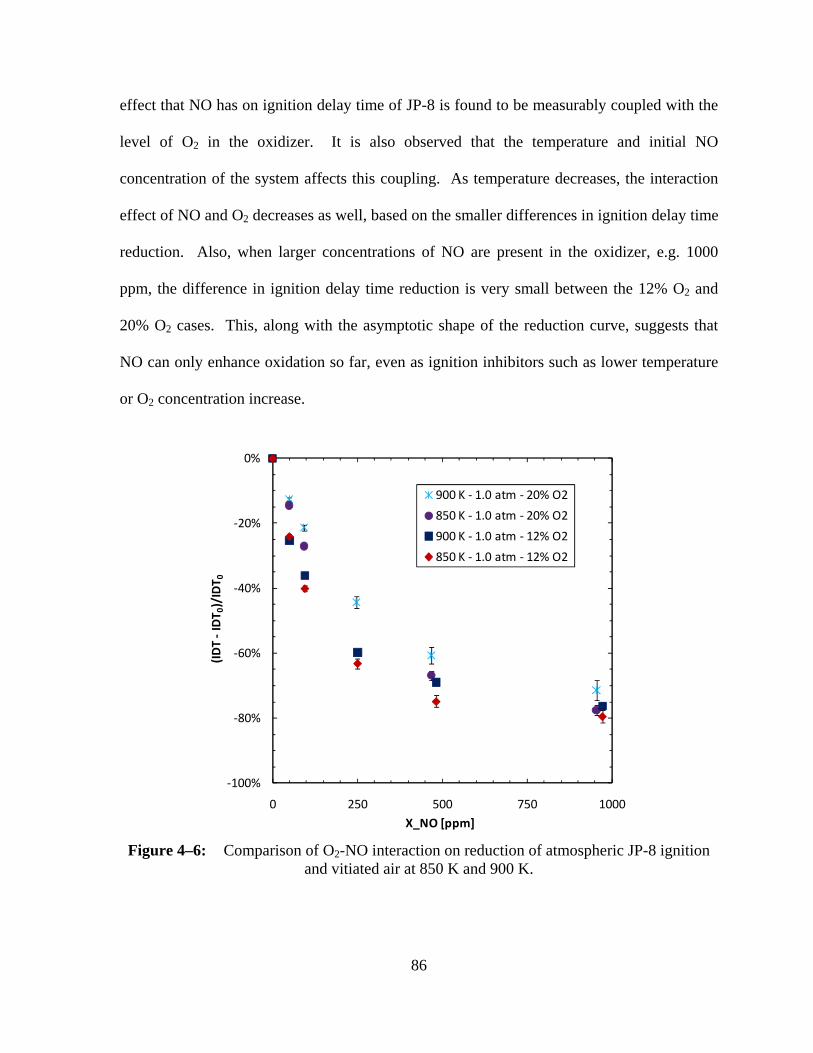
86
effect that NO has on ignition delay time of JP-8 is found to be measurably coupled with the
level of O2 in the oxidizer. It is also observed that the temperature and initial NO
concentration of the system affects this coupling. As temperature decreases, the interaction
effect of NO and O2 decreases as well, based on the smaller differences in ignition delay time
reduction. Also, when larger concentrations of NO are present in the oxidizer, e.g. 1000
ppm, the difference in ignition delay time reduction is very small between the 12% O2 and
20% O2 cases. This, along with the asymptotic shape of the reduction curve, suggests that
NO can only enhance oxidation so far, even as ignition inhibitors such as lower temperature
or O2 concentration increase.
Figure 4–6: Comparison of O2-NO interaction on reduction of atmospheric JP-8 ignition
and vitiated air at 850 K and 900 K.
‐100%
‐80%
‐60%
‐40%
‐20%
0%
0 250 500 750 1000
(IDT ‐IDT 0)/IDT 0
X_NO [ppm]
900 K ‐ 1.0 atm ‐ 20% O2
850 K ‐ 1.0 atm ‐ 20% O2
900 K ‐ 1.0 atm ‐ 12% O2
850 K ‐ 1.0 atm ‐ 12% O2
87
4.2.4 Empirical Ignition Delay Time Correlation
As found in previous works [40][39][44][59], the ignition delay time of hydrocarbon
fuels in the high-temperature oxidation regime can be predicted using some form of the
Arrhenius equation:
exp eq. 5
where A is an empirical coefficient, E is the global activation energy, R is the universal gas
constant, and T is the system temperature. The effect of composition variation on ignition,
namely fuel or oxidizer, is typically represented in the following modified form of the
equation [39]:
exp Fuel Oxygen eq. 6
where [Fuel] and [Oxygen] are the respective concentrations of fuel and O2 in the reactant
stream. The empirical coefficients m and n represent the power dependency that τign has on
fuel and O2 respectively.
As discussed previously, temperature, NO and O2 are each found to influence ignition
both individually as well as coupled with the other design variables (i.e. the NO-temperature
interaction). In order to determine an empirical correlation for ignition delay time that
accounts for each of these variables, the effect of NO for a constant temperature and O2
concentration is first examined. For a given constant temperature and oxidizer O2
concentration, the approximation of ignition delay time with respect to NO concentration can
be predicted by an equation of the following form:

88
exp NO eq. 7
where [NO] is the initial concentration of NO in the oxidizer, C is an empirical coefficient
related to temperature and O2 content for a given curve, and b is an empirical constant related
to the concentration of NO in the oxidizer stream and its effect on ignition.
This equation can be expanded upon to also account for multiple temperatures and O2
concentrations by separating it into two parts. The coefficient C from eq. 7 at a given
temperature and O2 concentration can be converted to an empirical function with respect to
temperature and O2 written in the following Arrhenius form similar to eq. 6:
, O O‐ exp O
‐
eq. 8 where [O2] is the concentration of O2 in oxidizer, T is the reactor temperature, and R is the
universal gas constant. A′ and E′ represent the Arrhenius coefficient and global activation
energy components of the equation, respectively. β and γ are exponential coefficients for O2.
The coefficient b from eq. 7, used to determine the effect of NO at a specific temperature,
can also be converted to an empirical function with respect to different temperatures in the
following temperature dependent power function:
‐
eq. 9 where T is the reactor temperature, R is the universal gas constant, b′ represents the effect of
NO on activation energy, and α is a coefficient that represents the power dependence the
effect of NO has with temperature. The function is in the same form as the activation
energy component within the exponential of the Arrhenius equation shown in eq. 5.

89
Implementation of the sub-functions , O and from eq. 8 and eq. 9
respectively into eq. 7 results in the following modified form of an Arrhenius expression to
predict the ignition delay time of JP-8 in and O2/N2/NO oxidizer stream:
O‐ exp O
‐NO
‐
eq. 10 Values for the empirical constants in eq. 10 were determined using the atmospheric
pressure experimental JP-8 ignition delay time data from Table 0-6. The following empirical
correlation can be used to predict the ignition delay time of stoichiometric JP-8/O2/N2/NO
mixtures at the atmospheric pressure test conditions used in the detailed portion of this study
(i.e., temperature: 700 K – 900 K; NO: 0 ppm – 1000 ppm; O2: 12% - 20% ):
5.31e‐07 O‐0.425 exp
20700 O‐0.0487 1.23e12 NO
‐1.934
eq. 11 where τign is in seconds, XO2 and XNO are mole fractions, T is in Kelvin, and R is in cal/mol-K.
The model predictions based on the empirical correlation in eq. 11 are compared with the
experimental data in Figure 4–7 and Figure 4–8. The average goodness of the fit as well as
the goodness for each isotherm is provided in Table 4-1.
Table 4-1: Goodness of Emperical Model Fits at 1 atm
1 atm - 20 vol% O2 1 atm - 12 vol% O2 Temperature [K] R2 Temperature [K] R2
900 92.6% 900 78.3% 850 90.2% 850 77.4% 800 96.8% 800 85.8% 750 95.1% 700 95.0%
20% vol O2 Avg. 94.0% 12% vol O2 Avg. 80.5% 1 atm Average R2 = 88.9%
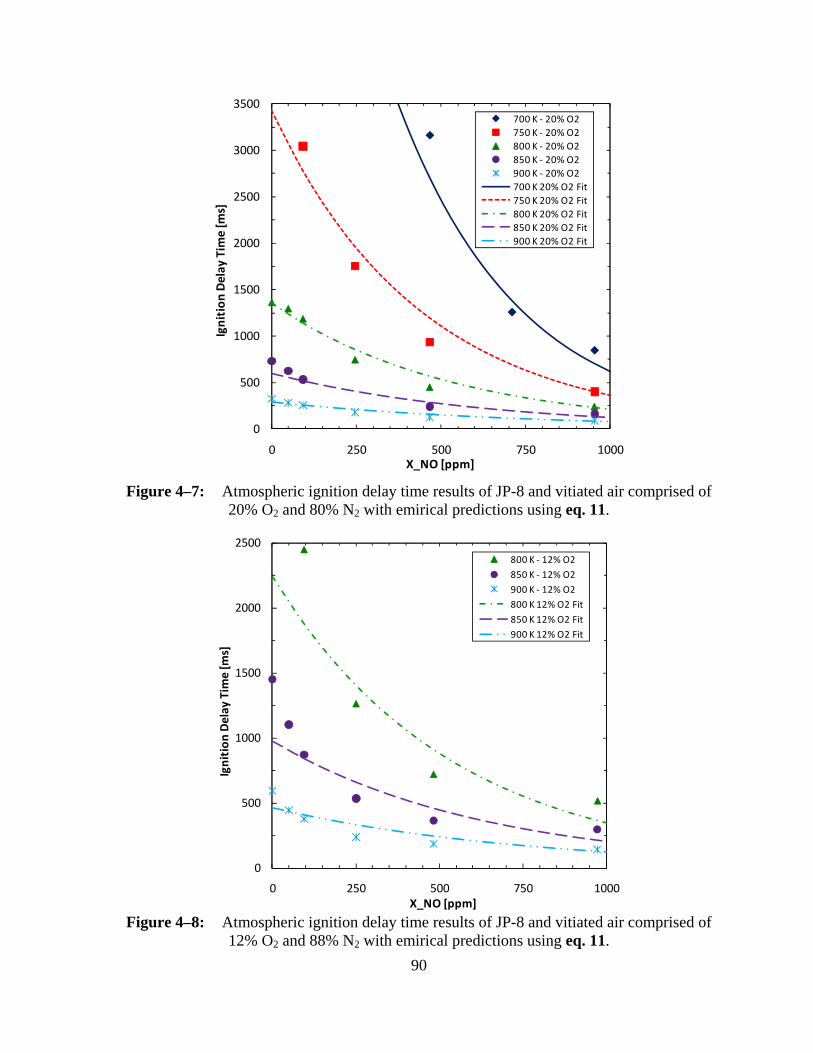
90
Figure 4–7: Atmospheric ignition delay time results of JP-8 and vitiated air comprised of
20% O2 and 80% N2 with emirical predictions using eq. 11.
Figure 4–8: Atmospheric ignition delay time results of JP-8 and vitiated air comprised of
12% O2 and 88% N2 with emirical predictions using eq. 11.
0
500
1000
1500
2000
2500
3000
3500
0 250 500 750 1000
Ignition
Delay
Tim
e [m
s]
X_NO [ppm]
700 K ‐ 20% O2750 K ‐ 20% O2800 K ‐ 20% O2850 K ‐ 20% O2900 K ‐ 20% O2700 K 20% O2 Fit750 K 20% O2 Fit800 K 20% O2 Fit850 K 20% O2 Fit900 K 20% O2 Fit
0
500
1000
1500
2000
2500
0 250 500 750 1000
Ignition
Delay
Tim
e [m
s]
X_NO [ppm]
800 K ‐ 12% O2
850 K ‐ 12% O2900 K ‐ 12% O2800 K 12% O2 Fit
850 K 12% O2 Fit900 K 12% O2 Fit
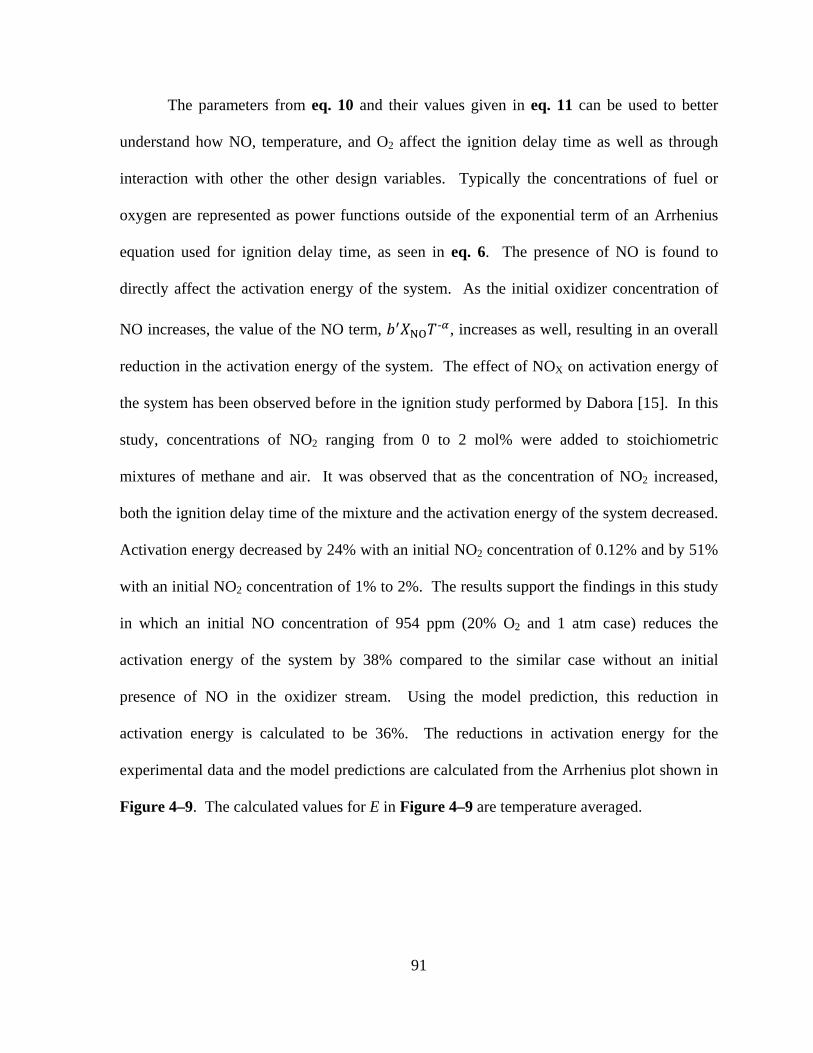
91
The parameters from eq. 10 and their values given in eq. 11 can be used to better
understand how NO, temperature, and O2 affect the ignition delay time as well as through
interaction with other the other design variables. Typically the concentrations of fuel or
oxygen are represented as power functions outside of the exponential term of an Arrhenius
equation used for ignition delay time, as seen in eq. 6. The presence of NO is found to
directly affect the activation energy of the system. As the initial oxidizer concentration of
NO increases, the value of the NO term, NO- , increases as well, resulting in an overall
reduction in the activation energy of the system. The effect of NOX on activation energy of
the system has been observed before in the ignition study performed by Dabora [15]. In this
study, concentrations of NO2 ranging from 0 to 2 mol% were added to stoichiometric
mixtures of methane and air. It was observed that as the concentration of NO2 increased,
both the ignition delay time of the mixture and the activation energy of the system decreased.
Activation energy decreased by 24% with an initial NO2 concentration of 0.12% and by 51%
with an initial NO2 concentration of 1% to 2%. The results support the findings in this study
in which an initial NO concentration of 954 ppm (20% O2 and 1 atm case) reduces the
activation energy of the system by 38% compared to the similar case without an initial
presence of NO in the oxidizer stream. Using the model prediction, this reduction in
activation energy is calculated to be 36%. The reductions in activation energy for the
experimental data and the model predictions are calculated from the Arrhenius plot shown in
Figure 4–9. The calculated values for E in Figure 4–9 are temperature averaged.
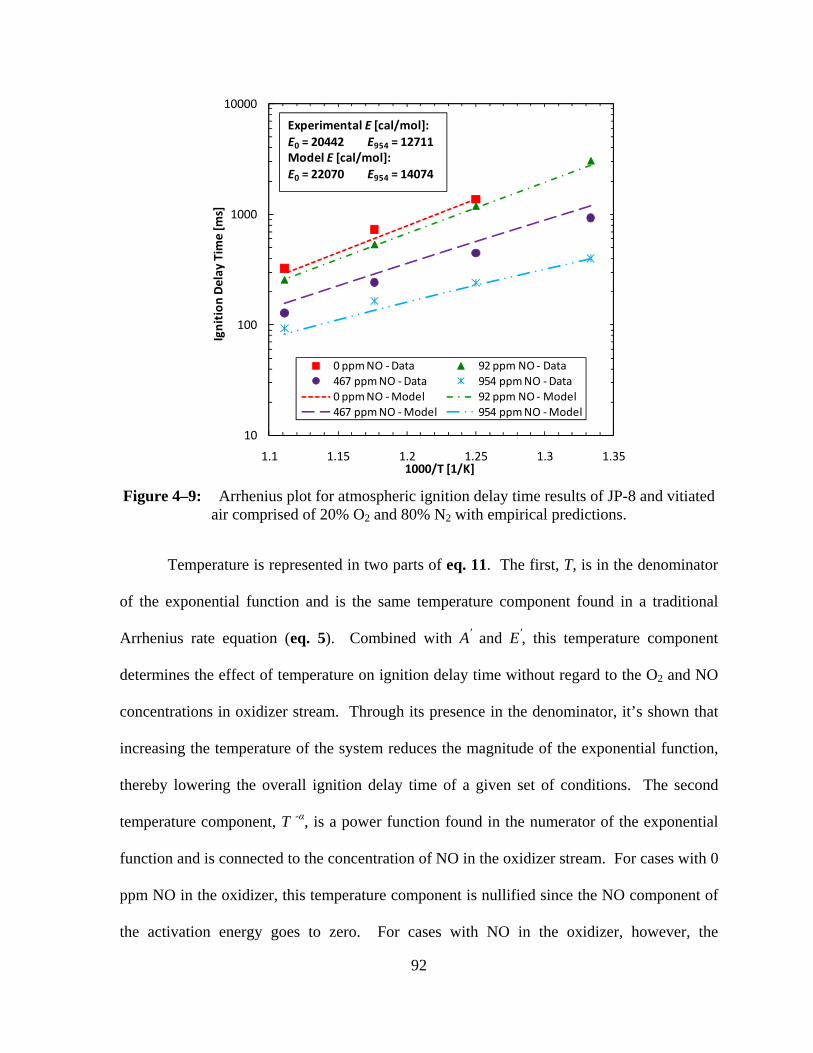
92
Figure 4–9: Arrhenius plot for atmospheric ignition delay time results of JP-8 and vitiated
air comprised of 20% O2 and 80% N2 with empirical predictions.
Temperature is represented in two parts of eq. 11. The first, T, is in the denominator
of the exponential function and is the same temperature component found in a traditional
Arrhenius rate equation (eq. 5). Combined with A′ and E′, this temperature component
determines the effect of temperature on ignition delay time without regard to the O2 and NO
concentrations in oxidizer stream. Through its presence in the denominator, it’s shown that
increasing the temperature of the system reduces the magnitude of the exponential function,
thereby lowering the overall ignition delay time of a given set of conditions. The second
temperature component, T -α, is a power function found in the numerator of the exponential
function and is connected to the concentration of NO in the oxidizer stream. For cases with 0
ppm NO in the oxidizer, this temperature component is nullified since the NO component of
the activation energy goes to zero. For cases with NO in the oxidizer, however, the
10
100
1000
10000
1.1 1.15 1.2 1.25 1.3 1.35
Ignition
Delay
Tim
e [m
s]
1000/T [1/K]
0 ppm NO ‐Data 92 ppm NO ‐ Data467 ppm NO ‐Data 954 ppm NO ‐Data0 ppm NO ‐Model 92 ppm NO ‐Model467 ppm NO ‐Model 954 ppm NO ‐Model
Experimental E [cal/mol]:E0 = 20442 E954 = 12711Model E [cal/mol]:E0 = 22070 E954 = 14074
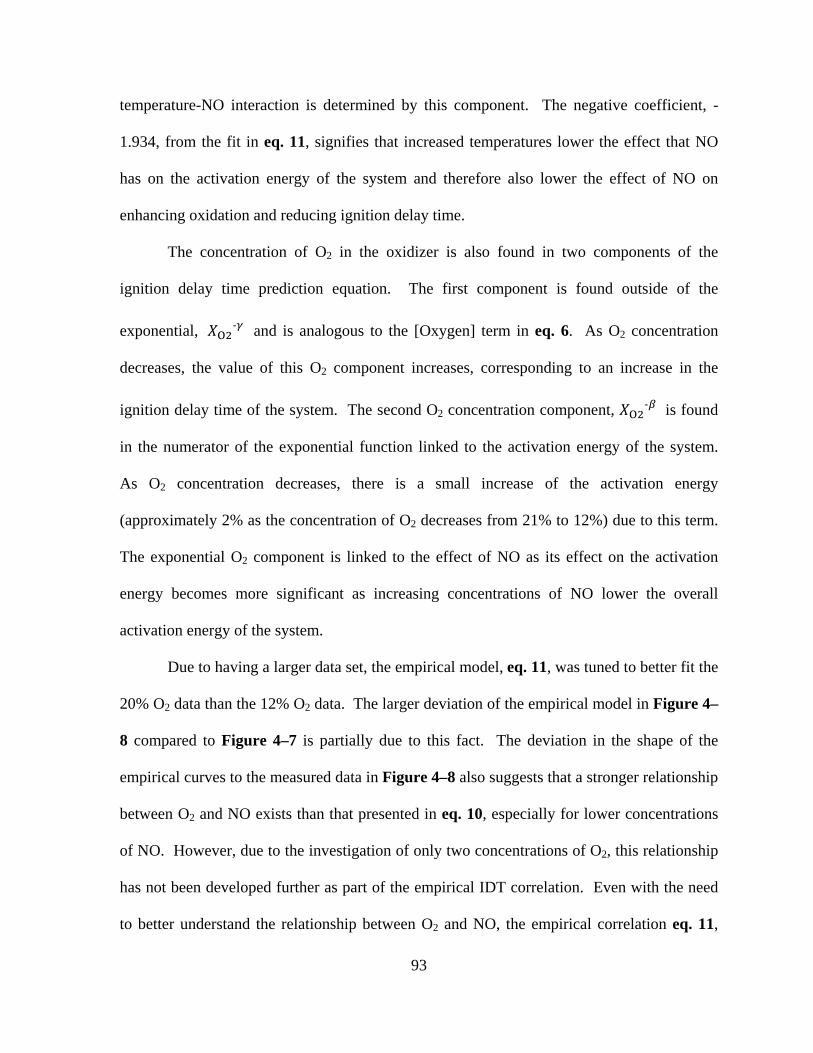
93
temperature-NO interaction is determined by this component. The negative coefficient, -
1.934, from the fit in eq. 11, signifies that increased temperatures lower the effect that NO
has on the activation energy of the system and therefore also lower the effect of NO on
enhancing oxidation and reducing ignition delay time.
The concentration of O2 in the oxidizer is also found in two components of the
ignition delay time prediction equation. The first component is found outside of the
exponential, O‐ and is analogous to the [Oxygen] term in eq. 6. As O2 concentration
decreases, the value of this O2 component increases, corresponding to an increase in the
ignition delay time of the system. The second O2 concentration component, O‐ is found
in the numerator of the exponential function linked to the activation energy of the system.
As O2 concentration decreases, there is a small increase of the activation energy
(approximately 2% as the concentration of O2 decreases from 21% to 12%) due to this term.
The exponential O2 component is linked to the effect of NO as its effect on the activation
energy becomes more significant as increasing concentrations of NO lower the overall
activation energy of the system.
Due to having a larger data set, the empirical model, eq. 11, was tuned to better fit the
20% O2 data than the 12% O2 data. The larger deviation of the empirical model in Figure 4–
8 compared to Figure 4–7 is partially due to this fact. The deviation in the shape of the
empirical curves to the measured data in Figure 4–8 also suggests that a stronger relationship
between O2 and NO exists than that presented in eq. 10, especially for lower concentrations
of NO. However, due to the investigation of only two concentrations of O2, this relationship
has not been developed further as part of the empirical IDT correlation. Even with the need
to better understand the relationship between O2 and NO, the empirical correlation eq. 11,
94
does provide a solid method to predict ignition delay time and how it is influenced by NO
within these temperature and O2 regimes.
4.3 Sub-Atmospheric Results
Measurements of the ignition delay time of JP-8 at sub-atmospheric pressure and the
investigation of the corresponding effects of temperature, O2 and NO were also performed at
0.5 atm using 12% and 20% O2 in the oxidizer in the detailed study. The sub-atmospheric
ignition delay time results provided in Table 0-7 are plotted in Figure 4–10. It can be seen
that the overall effects of temperature, O2 and NO on ignition delay time at 0.5 atm are very
similar to those found at the atmospheric pressure tests. Experimental results also show that
reducing the pressure from 1.0 atm to 0.5 atm corresponds to an increase in ignition delay
time for JP-8 as expected. Ignition across the full range of initial NO concentration was
measured at 900 K for both mixtures with 12% O2 and 20% O2. For tests performed at 800 K
and 850 K, limitations in the residence time of the flow reactor resulted in measurable
ignition only occurring with the presence of NO in the oxidizer.
Comparison of the reduction of ignition delay time of JP-8 at both pressures at 900 K
is provided in Figure 4–11. Decreasing the system pressure from 1.0 atm to 0.5 atm at 900
K and with both 20% and 12% O2 in the oxidizer results in greater reduction of ignition delay
time as the NO concentration is increased to 1000 ppm. For the 20% O2 cases, the average
difference in ignition delay time reduction between 0.5 and 1.0 atm is approximately 11%,
ranging from 17% with approximately 100 ppm NO in the oxidizer down to 5% when
approximately 1000 ppm NO is present. With 12% O2 in the oxidizer, two aspects of the
reduction are of note. The first is that an inflection in reduction curve occurs from 0 ppm to
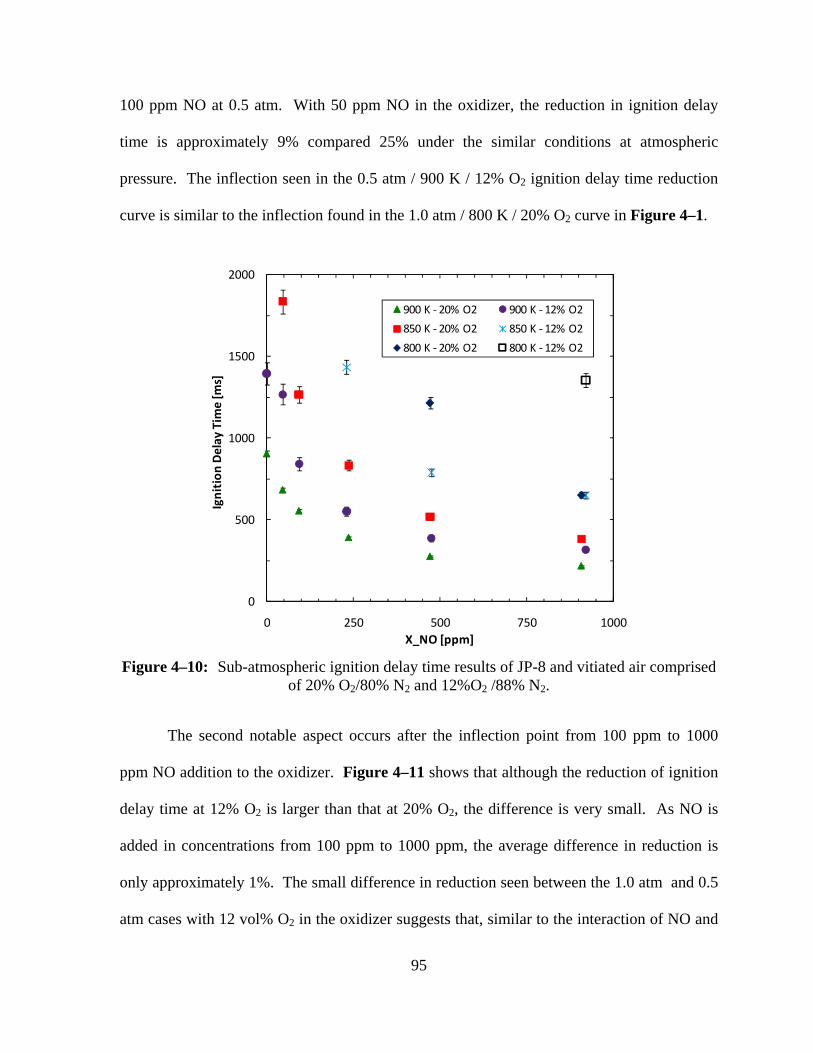
95
100 ppm NO at 0.5 atm. With 50 ppm NO in the oxidizer, the reduction in ignition delay
time is approximately 9% compared 25% under the similar conditions at atmospheric
pressure. The inflection seen in the 0.5 atm / 900 K / 12% O2 ignition delay time reduction
curve is similar to the inflection found in the 1.0 atm / 800 K / 20% O2 curve in Figure 4–1.
Figure 4–10: Sub-atmospheric ignition delay time results of JP-8 and vitiated air comprised
of 20% O2/80% N2 and 12%O2 /88% N2.
The second notable aspect occurs after the inflection point from 100 ppm to 1000
ppm NO addition to the oxidizer. Figure 4–11 shows that although the reduction of ignition
delay time at 12% O2 is larger than that at 20% O2, the difference is very small. As NO is
added in concentrations from 100 ppm to 1000 ppm, the average difference in reduction is
only approximately 1%. The small difference in reduction seen between the 1.0 atm and 0.5
atm cases with 12 vol% O2 in the oxidizer suggests that, similar to the interaction of NO and
0
500
1000
1500
2000
0 250 500 750 1000
Ignition
Delay
Tim
e [m
s]
X_NO [ppm]
900 K ‐ 20% O2 900 K ‐ 12% O2
850 K ‐ 20% O2 850 K ‐ 12% O2
800 K ‐ 20% O2 800 K ‐ 12% O2

96
O2 at lower temperatures, the effect of NO enhancement on the reduction of ignition delay
time approaches a limit even as variables that inhibit ignition are increased and that the
majority of the effect of NO occurs in lower concentrations.
Figure 4–11: Comparison of the relative reduction of JP-8 ignition delay time from the 0
ppm NO condition along 900 K temperature test cases at 0.5 and 1.0 atm with vitiated air comprised of 20% O2/80% N2 and 12%O2 /88% N2
The limited number of sub-atmospheric data points obtained in this investigation
currently prevent implementation of the contribution of pressure into the empirical model for
ignition delay time shown in eq. 11. It can be hypothesized, however, that the effect of
pressure will contribute similarly to the effect of O2. As pressure is reduced, the available
data shows that the ignition delay time of JP-8 shifts to a higher range and that the shape of
the curve with respect NO concentration sharpens at lower concentrations, much like the
effect of O2 reduction. Further study across an expanded range of pressure, O2 concentration
‐100%
‐80%
‐60%
‐40%
‐20%
0%
0 250 500 750 1000
(IDT ‐IDT 0)/IDT 0
X_NO [ppm]
900 K ‐ 1.0 atm ‐ 20% O2
900 K ‐ 1.0 atm ‐ 12% O2
900 K ‐ 0.5 atm ‐ 20% O2
900 K ‐ 0.5 atm ‐ 12% O2

97
and temperature will increase the ability to model these effects in relation to their interaction
with NO on jet fuel ignition.

98
Chapter 5: Summary, Conclusions, and Future Work
The overall goal of this research is to better understand the ignition behavior of multi-
component jet fuels at low pressure, vitiated conditions across the range of intermediate to
high temperature regimes in order to improve combustor design and predictive kinetic model
capabilities. Examination of the autoignition of JP-8 under conditions relevant to those
found in low pressure, vitiated combustors provides insight into the chemical kinetics of
these systems as well as a key tool in the development of chemical kinetic models. In order
to obtain this information, this study was broken down into two phases: a screening study
used to determine which components of vitiated air are most significant to the autoignition of
jet fuel and a detailed investigation of these components, with special attention paid to the
effect of nitric oxide. A concise summary of the results discussed in the previous chapters
are provided in the following sections followed by conclusions and a look into future work.
5.1 Summary of Results
5.1.1 Summary of Screening Study Results (Phase I)
The first testing phase examined the effect of vitiated conditions on the autoignition
of jet fuels at low pressure through a broad experimental program looking at the ignition
delay time of JP-8 in an atmospheric flow reactor. A rotatable design of experiment
approach, the Box-Behnken Design (BBD), that allowed for the examination of both the
main and two-factor interaction effects of 7 experimental variables in an efficient manner
was used for the screening study. The BBD established a test matrix with 56 unique
experimental combinations of 7 design variables: temperature, equivalence ratio and the
concentration of CO2, CO, H2O and NO. The ranges of these variables can be found in

99
Table 0-1. Of the 7 main effects and 21 two factor interaction effects, four were found to be
statistically significant to vitiated combustion: temperature, O2 reduction, the presence of
initial concentrations of NO and the interaction of NO and temperature. The results of the
screening study can be found in Table 0-2, Table 0-3, and Table 0-4.
The results of most interest are the direct effect of NO as well as how its effect
changes with temperature. Within the design of this study, the addition of 100 ppm of NO to
the vitiated air stream results in an average reduction in the ignition delay time of JP-8 by
approximately 40%. Regardless of the other vitiated composition components or test
temperatures, the addition of NO consistently results in a reduction in ignition delay time.
The effect of NO is also temperature dependent in that it appears to be more effective at
reducing ignition delay time as temperature is lowered. It is postulated that a catalytic effect
of NO promotes the oxidation of JP-8 at lower temperatures. Based on the results of this
screening study, further experimentation to investigate the effect of NO at lower
temperatures, as well as lower O2 concentrations and pressures was undertaken in detailed
portion of this study.
5.1.2 Summary of Detailed Investigation Results (Phase II)
The second phase of testing investigated the effects of temperature, O2 oxidizer
concentration and the initial concentration of NO in the oxidizer stream in more detail than
the screening study as well as at lower temperatures and pressures that are relevant to
combustors using gas turbine exhaust as all or part of their oxidizer stream [3]. Examining
the results of the detailed investigation, provided in Table 0-7 and Table 0-8, the following
effects were observed by varying the four main design variables of temperature, NO

100
concentration in the oxidizer, O2 concentration in the oxidizer, and system pressure:
• increasing the steady temperature of the reactor within the range of 700 K to 900 K
reduces ignition delay time,
• increasing the initial concentration of NO in the oxidizer within the range of 0 ppm to
1000 ppm reduces ignition delay time,
• decreasing the concentration of O2 in the oxidizer from 20 % to 12% increases
ignition delay time,
• and decreasing the pressure of the reactor from 1.0 atm to 0.5 atm increases ignition
delay time.
The effect of NO was found to be coupled with temperature, O2 concentration and
pressure. The reduction in ignition delay time by NO was generally found to be larger as
temperature, O2 concentration or pressure were reduced. This was not always the case
however, as the effect of small traces of NO (50 - 100 ppm) was lessened at 800 K for 20%
O2 atmospheric cases compared to 850 K and 900 K. This difference in reduction is possibly
related to the proximity of 800 K to the transition to the NTC reaction region, denoting
different chemical pathways for oxidation and ignition. The interaction found between
temperature and NO was expected based on the significance of the interaction in the
screening study. The interaction between NO and O2 was not found to be significant in the
screening study, however in the detailed investigation its effect was found to be quite
measureable.
Ignition results obtained in this study were used to develop an empirical correlation to
predict ignition delay time of JP-8 at atmospheric pressure in relation to temperature, O2, and
NO concentration. The following empirical correlation can be used to predict the ignition
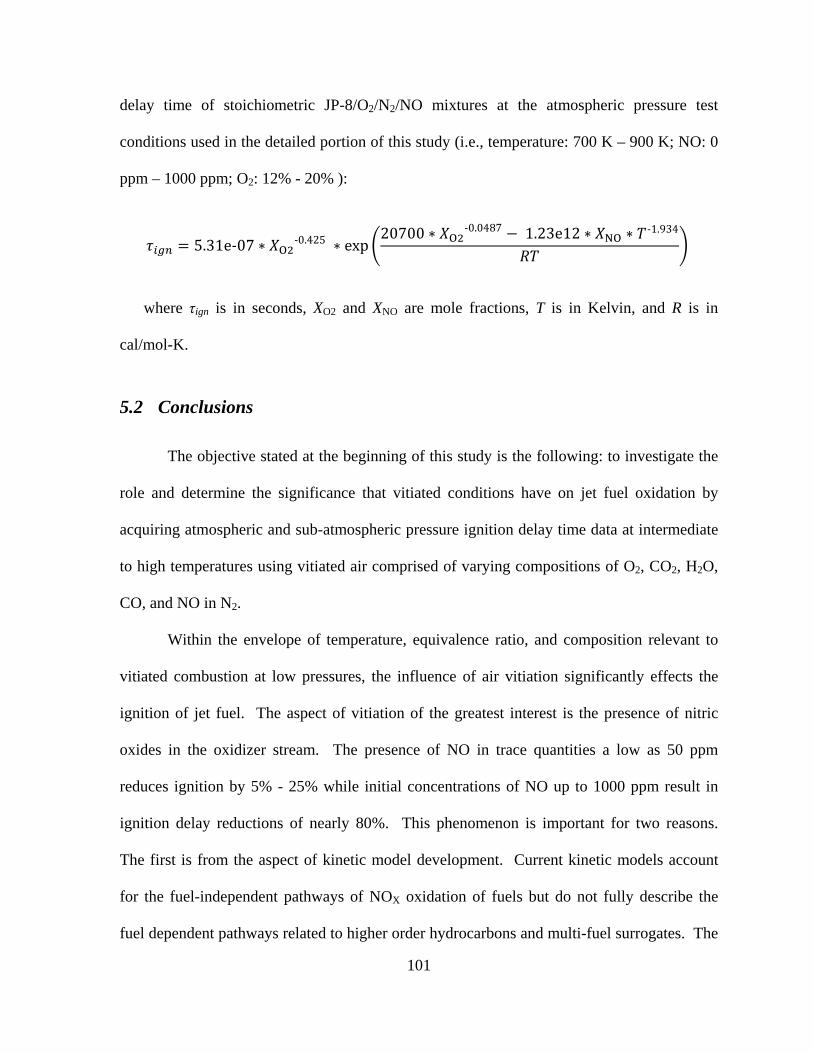
101
delay time of stoichiometric JP-8/O2/N2/NO mixtures at the atmospheric pressure test
conditions used in the detailed portion of this study (i.e., temperature: 700 K – 900 K; NO: 0
ppm – 1000 ppm; O2: 12% - 20% ):
5.31e‐07 O‐0.425 exp
20700 O‐0.0487 1.23e12 NO
‐1.934
where τign is in seconds, XO2 and XNO are mole fractions, T is in Kelvin, and R is in
cal/mol-K.
5.2 Conclusions
The objective stated at the beginning of this study is the following: to investigate the
role and determine the significance that vitiated conditions have on jet fuel oxidation by
acquiring atmospheric and sub-atmospheric pressure ignition delay time data at intermediate
to high temperatures using vitiated air comprised of varying compositions of O2, CO2, H2O,
CO, and NO in N2.
Within the envelope of temperature, equivalence ratio, and composition relevant to
vitiated combustion at low pressures, the influence of air vitiation significantly effects the
ignition of jet fuel. The aspect of vitiation of the greatest interest is the presence of nitric
oxides in the oxidizer stream. The presence of NO in trace quantities a low as 50 ppm
reduces ignition by 5% - 25% while initial concentrations of NO up to 1000 ppm result in
ignition delay reductions of nearly 80%. This phenomenon is important for two reasons.
The first is from the aspect of kinetic model development. Current kinetic models account
for the fuel-independent pathways of NOX oxidation of fuels but do not fully describe the
fuel dependent pathways related to higher order hydrocarbons and multi-fuel surrogates. The

102
addition of jet fuel ignition data with NO present in the oxidizer will allow for further
development of kinetic models and improved predictive abilities. The second reason for the
importance of understanding this phenomenon is from the combustor design point of view.
For systems in which ignition is difficult within the prescribed operating envelope, the ability
to use NOX species from a separate exhaust stream can provide the ability to run at a wider
range of conditions. Application of the knowledge gained from this and future studies will
allow for more efficient vitiated combustors.
5.3 Future Work
The findings of this study have answered certain questions regarding the significance
that vitiated combustion plays on jet fuel ignition but they have also raised new topics and
issues to be addressed in the future. Important questions remain about the effect of NO and
other nitric oxides, especially at temperatures below the intermediate regime.
The aspect of two phases of experimentation in this study provided the opportunity to
thoroughly examine the flow reactor apparatus and methodology used in Phase I and then
make modifications for improvement in Phase II. Based on the experimental process in
Phase II, further improvements could be made for future flow reactor ignition measurements.
A constant goal with flow reactor experimentation is the minimization of the uncertainty
regarding the transit, mixing, and, in the case of higher temperature tests, heat up time of the
fuel and oxidizer prior to entering the constant temperature test section. One improvement
could be the implementation of a laser system to make adsorption measurements across the
transition from the mixing section to the diffuser and/or from the diffuser to the test section.
This technique was used by Beerer [60] in a high pressure and temperature flow reactor to

103
measure the ignition of natural gas constituents. Not only can this technique assist in
determining the time in which the fuel/oxidizer mixture enters the test section, it can also be
used to examine the extent of pre-ignition fuel decomposition.
A second possible improvement to the flow reactor apparatus is the examination and
reduction of possible wall effects in the flow test section. Alumina tubes are currently used
to form the test section of the flow reactor is due to their ability to withstand high
temperatures and provide a surface with low chemical reactivity. For tests performed at
temperatures above the expected NTC region of JP-8 and n-decane, the ignition
measurements both with and without initial concentrations of NO behaved differently than
would be expected based on previous high pressure ignition [38] and oxidation experiments
[23][24][26] in which jet fuel has lower ignition delay times in the NTC region and is
inhibited by NO rather than enhanced. A hypothesis for this discrepancy is that the
combination of long residence times (greater than 1 second) and a relative small surface area
to volume ratio of the flow reactor tube allow for low temperature oxidation radials to diffuse
to the reactor walls. This would result in ignition being driven only by the thermal process
and with a diminishing NTC effect. Future testing that examines and possibly limits radical
diffusion could be done through variation in bulk dilution (He or Ar vs. N2), of the surface
area to volume ratio of the test section, and of the test section material.
Outside of changes made to the apparatus, examination of expanded ranges of
temperature and pressure can also provide further insight. In this study, at temperatures as
low as 700 K, small amounts of NO significantly reduce ignition delay time. Ignition data is
still lacking however in the low (NTC to sub-NTC) temperature regime where previous fuel
oxidation studies[22][24] have found that NO has little or no enhancement effect and in some

104
cases inhibits oxidation. Further ignition experimentation, possibly at higher pressures to
reduce residence times, is necessary to examine the effect of NO at these low temperatures.
Further investigation may also include examination of the effects that other NOX species,
NO2 and N2O, have on jet fuel ignition.
Another question that arises is in regard to the time scale of ignition and the
effectiveness of enhancement by NO at shorter residence times. In the temperature regimes
examined in this study there are many cases of ignition times surpassing hundreds of
milliseconds, even with the enhancement of nearly 1000 ppm in the oxidizer. While the
strong effect that NO has on ignition is quite apparent, for combustion processes within this
temperature regime that require residence times much smaller than those required for full
autoignition, the effect of NO to enhance oxidation is still not fully known. Examining the
intermediate specie generation of jet fuel oxidation due to NO enhancement would provide
insight into this issue.
105
Appendix
A.1 Measurement Variability
As discussed in Chapter 2Chapter 2:, the flow reactor system made use of both
gaseous and liquid fluids to measure the ignition delay time of JP-8, n-heptane, and n-decane
in vitiated air. In both phases of testing, gaseous N2, O2, CO2, CO, and NO were supplied via
high pressure cylinders. N2, O2, and CO2 were supplied as pure components while CO and
NO were supplied as part of certified mixtures balanced with N2. In Phase II, air was
supplied via a compressor. The liquids fuels used in this study, JP-8, n-heptane, and were
supplied via cylinders pressurized by N2. Water was supplied via the lab tap.
Each of these fluids was metered using a variable area flowmeter (rotameter) that was
calibrated for a specific fluid in the specific rotameter for which it was used. Gaseous
calibration was performed using an Elster American Dry Test Meter (DTM-200A) for flow
rates of 12 slpm and higher. Gaseous flowrates below 12 slpm were calibrated using a
bubble meter. Calibrations with both systems accounted for temperature and pressure
corrections. Liquid calibration was performed using graduated cylinders.
Each flowmeter, gaseous and liquid, was calibrated at a minimum of several points
spanning the entire range of flowrates examined in this study for a given fluid.
Measurements were repeated no less than three times for each rotameter point that was
calibrated. For both gaseous and liquid fuels, the reproducibility at a given rotameter point
was very good with average standard deviations of approximately 2% of the mean.
Gas analysis measurements were also made in the exhaust stream of the flow reactor
to check the composition. In the Phase I screening study, the O2 concentration of the
106
oxidizer was verified at 21% for non-vitiated cases. At the end of Phase II, the flowrates of
the system were re-verified using the overall exit flow of the reactor and the actual
concentrations of O2 and NO were determined. For the high O2 cases, the average O2
concentration was 19.8% with a standard deviation of 0.2%. It’s therefore represented as
20% in the results section above. For the low O2 cases, the average concentration was 11.5%
with a standard deviation of 0.1%. It’s therefore represented as 20% O2 in the results section
above. The nominal NO concentrations examined in this study were 0, 50, 100, 250, 500,
750 and 1000 ppm, however analysis of the flows determined values that differed from the
nominal targets. These actual values are shown in the tables and plots of the Phase II data
and were used in the development of the empirical model.
A.2 Test Reproducibility
A.2.1 Phase I Screening Study
Four separate center point tests of the BBD were run for a total of 15 individual test
iterations. The standard error (SE) is defined as follows:
√
eq. 12
where s is the standard deviation of a sample and n = the number of samples. For a given
test, the sample is represented by the test iterations for that given test point. The overall
standard error of the 15 center point ignition delay time measurements is 1.6% of the mean
experimental ignition delay time value of 269 ms. This center point error value is used to
represent the standard error of the BBD as a whole.
For the individual test cases, the maximum and average standard errors for all tests

107
are respectively 4.8% and 2.4% of the average mean ignition delay time for a given test.
Summing the average standard error with the standard error for the center point, the overall
average standard error for the system is approximately 4.0%. For a normal distribution, the
upper and lower 95% confidence limits are calculated as follows:
· 1.96 eq. 13
where is the mean of a given sample. Using the overall average standard error, the 95%
confidence limits for the experimental ignition delay time measurements are ± 7.8% of the
mean measured ignition delay time for a given test.
A.2.1 Phase II Detailed Investigation
DOE techniques were not applied in the detailed investigation which aimed to
examine the sensitivity of fewer design variables rather than determine the significance of
many. Due to significant variations in certain test conditions, namely fuel and pressure, the
standard error of these groupings is useful in order to understand variability for different test
conditions. The variability of different combinations of tests broken down by pressure and
fuel source is provided in Table 0-1.
The maximum and mean standard errors for all tests recorded in the detailed study are
respectively 12.4% and 2.4% of the mean ignition delay time for a given test. Using this
average standard error, the 95% confidence limits for the experimental ignition delay time
measurements in the detailed study are ± 4.7% of the mean of the measured ignition delay
times for all experimental runs of a given test case. The variability for each single test case
examined in the detailed investigation is provided in Table 0-7, and Table 0-8 The error and
confidence level for all tests examined in the detailed investigation as well as the errors for

108
significant subsets are provided in Table 0-1.
Table 0-1: Measurement Variability - Detailed Investigation
Test Group Mean τexp[ms]
Mean SE%
Max SE%
Avg 95% Confidence
All Tests 824 2.4% 12.4% τexp±4.7% All Tests @ 1.0 atm 843 1.9% 12.4% τexp ±3.8% All Tests @ 0.5 atm 781 3.4% 9.8% τexp ±6.7%
All JP-8 Tests 803 2.4% 12.4% τexp ±4.7% All JP-8 Tests @ 1.0 atm 796 2.1% 12.4% τexp ±4.2% All JP-8 Tests @ 0.5 atm 815 2.9% 9.3% τexp ±5.6%
All n-C10 Tests 867 2.4% 9.8% τexp ±4.6% All n-C10 Tests @ 1.0 atm 918 1.6% 3.9% τexp ±3.2% All n-C10 Tests @ 0.5 atm 650 5.5% 9.8% τexp ±10.8%
109
A.3 Phase I Screening Study Test and Effects Matrices
Table 0-2: Screening Study Test Matrix and Results
x1 x2 x3 x4 x5 x6 x7 Experimental CorrectedTest
# Temp.
[K] Φ XO2 XCO2 XCO XH2O XNO τexp [ms]
Std. Err.%
τig [ms]
0 1038 1 18% 3% 0.10% 3% 50 269 1.6% 35.8 1 1038 1 18% 6% 0.20% 6% 50 285 0.7% 41.4 2 1038 1 18% 6% 0.20% 0% 50 277 1.3% 38.7 3 1038 1 18% 6% 0.00% 6% 50 285 1.0% 41.4 4 1038 1 18% 6% 0.00% 0% 50 268 2.4% 35.5 5 1038 1 18% 0% 0.20% 6% 50 256 2.6% 31.2 6 1038 1 18% 0% 0.20% 0% 50 254 1.8% 30.5 7 1038 1 18% 0% 0.00% 6% 50 268 1.4% 35.4 8 1038 1 18% 0% 0.00% 0% 50 261 2.2% 33.0 9 1125 1 18% 3% 0.10% 6% 100 214 3.3% 16.2 10 1125 1 18% 3% 0.10% 6% 0 227 1.2% 20.8 11 1125 1 18% 3% 0.10% 0% 100 194 0.6% 8.9 12 1125 1 18% 3% 0.10% 0% 0 218 4.7% 17.8 13 950 1 18% 3% 0.10% 6% 100 305 1.7% 48.5 14 950 1 18% 3% 0.10% 6% 0 440 4.6% 97.0 15 950 1 18% 3% 0.10% 0% 100 339 3.6% 60.6 16 950 1 18% 3% 0.10% 0% 0 499 2.1% 118 17 1038 1.5 18% 3% 0.20% 3% 100 226 2.2% 23.4 18 1038 1.5 18% 3% 0.20% 3% 0 268 3.5% 39.9 19 1038 1.5 18% 3% 0.00% 3% 100 232 3.1% 26.0 20 1038 1.5 18% 3% 0.00% 3% 0 266 0.9% 38.9 21 1038 0.5 18% 3% 0.20% 3% 100 275 4.0% 24.2 22 1038 0.5 18% 3% 0.20% 3% 0 318 2.6% 42.0 23 1038 0.5 18% 3% 0.00% 3% 100 290 0.9% 30.4 24 1038 0.5 18% 3% 0.00% 3% 0 357 3.0% 58.4 25 1125 1.5 18% 6% 0.10% 3% 50 201 3.7% 13.9 26 1125 1.5 18% 0% 0.10% 3% 50 189 3.5% 9.1 27 1125 0.5 18% 6% 0.10% 3% 50 224 2.7% 3.2 28 1125 0.5 18% 0% 0.10% 3% 50 242 2.4% 10.8

110
Table 0-2b: Screening Study Test Matrix and Results
x1 x2 x3 x4 x5 x6 x7 Experimental Corrected
Test # Temp. [K] Φ XO2 XCO2 XCO XH2O XNO
τexp [ms]
Std. Err.%
τig [ms]
29 950 1.5 18% 6% 0.10% 3% 50 349 4.1% 71.4 30 950 1.5 18% 0% 0.10% 3% 50 353 2.2% 72.8 31 950 0.5 18% 6% 0.10% 3% 50 444 1.4% 94.4 32 950 0.5 18% 0% 0.10% 3% 50 423 1.6% 85.7 33 1038 1 15% 6% 0.10% 3% 100 283 1.1% 40.7 34 1038 1 15% 6% 0.10% 3% 0 354 1.5% 66.3 35 1038 1 15% 0% 0.10% 3% 100 286 0.1% 41.7 36 1038 1 15% 0% 0.10% 3% 0 361 1.6% 68.8 37 1038 1 21% 6% 0.10% 3% 100 243 4.3% 26.4 38 1038 1 21% 6% 0.10% 3% 0 295 2.2% 45.2 39 1038 1 21% 0% 0.10% 3% 100 227 2.8% 20.7 40 1038 1 21% 0% 0.10% 3% 0 265 3.6% 34.2 41 1125 1 15% 3% 0.20% 3% 50 206 0.7% 13.2 42 1125 1 15% 3% 0.00% 3% 50 227 2.1% 20.9 43 1125 1 21% 3% 0.20% 3% 50 207 4.8% 11.8 44 1125 1 21% 3% 0.00% 3% 50 212 4.4% 15.3 45 950 1 15% 3% 0.20% 3% 50 408 2.2% 85.2 46 950 1 15% 3% 0.00% 3% 50 410 1.9% 86.2 47 950 1 21% 3% 0.20% 3% 50 338 2.5% 60.4 48 950 1 21% 3% 0.00% 3% 50 343 2.1% 62.3 49 1038 1.5 15% 3% 0.10% 6% 50 267 3.6% 39.5 50 1038 1.5 15% 3% 0.10% 0% 50 266 1.8% 39.2 51 1038 1.5 21% 3% 0.10% 6% 50 245 2.6% 30.7 52 1038 1.5 21% 3% 0.10% 0% 50 234 1.5% 26.5 53 1038 0.5 15% 3% 0.10% 6% 50 318 2.9% 42.2 54 1038 0.5 15% 3% 0.10% 0% 50 318 3.3% 42.0 55 1038 0.5 21% 3% 0.10% 6% 50 291 2.3% 31.1 56 1038 0.5 21% 3% 0.10% 0% 50 282 1.9% 27.2
NV 950 950 1 21% 0% 0% 0% 0 482 1.1% 111.8 NV 1038 1038 1 21% 0% 0% 0% 0 246 1.8% 27.6 NV 1125 1125 1 21% 0% 0% 0% 0 195 2.8% 9.2

111
Table 0-3: Matrix of Main Effects
x1 x2 x3 x4 x5 x6 x7 Test # Temp. Φ XO2 XCO2 XCO XH2O XNO
1 0.0 0.0 0.0 41.4 41.4 41.4 0.0 2 0.0 0.0 0.0 38.7 38.7 -38.7 0.0 3 0.0 0.0 0.0 41.4 -41.4 41.4 0.0 4 0.0 0.0 0.0 35.5 -35.5 -35.5 0.0 5 0.0 0.0 0.0 -31.2 31.2 31.2 0.0 6 0.0 0.0 0.0 -30.5 30.5 -30.5 0.0 7 0.0 0.0 0.0 -35.4 -35.4 35.4 0.0 8 0.0 0.0 0.0 -33.0 -33.0 -33.0 0.0 9 16.2 0.0 0.0 0.0 0.0 16.2 16.2 10 20.8 0.0 0.0 0.0 0.0 20.8 -20.8 11 8.9 0.0 0.0 0.0 0.0 -8.9 8.9 12 17.8 0.0 0.0 0.0 0.0 -17.8 -17.8 13 -48.5 0.0 0.0 0.0 0.0 48.5 48.5 14 -97.0 0.0 0.0 0.0 0.0 97.0 -97.0 15 -60.6 0.0 0.0 0.0 0.0 -60.6 60.6 16 -118.0 0.0 0.0 0.0 0.0 -118. -118. 17 0.0 23.4 0.0 0.0 23.4 0.0 23.4 18 0.0 39.9 0.0 0.0 39.9 0.0 -39 9 19 0.0 26.0 0.0 0.0 0.0 0.0 26.0 20 0.0 38.9 0.0 0.0 -38.9 0.0 -38 9 21 0.0 -24.2 0.0 0.0 24.2 0.0 24.2 22 0.0 -42.0 0.0 0.0 42.0 0.0 -42.0 23 0.0 -30.4 0.0 0.0 -30.4 0.0 30.4 24 0.0 -58.4 0.0 0.0 -58.4 0.0 -58.4 25 13.9 13.9 0.0 13.9 0.0 0.0 0.0 26 9.1 9 1 0.0 -9.1 0.0 0.0 0.0 27 3.2 -3.2 0.0 3.2 0.0 0.0 0.0 28 10.8 -10.8 0.0 -10.8 0.0 0.0 0.0 29 -71.4 71.4 0.0 71.4 0.0 0.0 0.0 30 -72.8 72.8 0.0 -72.8 0.0 0.0 0.0 31 -94.4 -94.4 0.0 94.4 0.0 0.0 0.0 32 -85.7 -85.7 0.0 -85.7 0.0 0.0 0.0 33 0.0 0.0 40.7 40.7 0.0 0.0 40.7 34 0.0 0.0 66.3 66.3 0.0 0.0 -66 3 35 0.0 0.0 41.7 -41.7 0.0 0.0 41.7 36 0.0 0.0 68.8 -68.8 0.0 0.0 -68.8 37 0.0 0.0 -26.4 26.4 0.0 0.0 26.4 38 0.0 0.0 -45.2 45.2 0.0 0.0 -45 2 39 0.0 0.0 -20.7 -20.7 0.0 0.0 20.7 40 0.0 0.0 -34.2 -34.2 0.0 0.0 -34 2 41 13.2 0.0 13.2 0.0 13.2 0.0 0.0 42 20.9 0.0 20.9 0.0 -20.9 0.0 0.0 43 11.8 0.0 -11.8 0.0 11.8 0.0 0.0 44 15.3 0.0 -15.3 0.0 -15.3 0.0 0.0 45 -85.2 0.0 85.2 0.0 85.2 0.0 0.0 46 -86.2 0.0 86.2 0.0 -86.2 0.0 0.0 47 -60.4 0.0 -60.4 0.0 60.4 0.0 0.0 48 -62.3 0.0 -62.3 0.0 -62.3 0.0 0.0 49 0.0 39.5 39.5 0.0 0.0 39.5 0.0 50 0.0 39.2 39.2 0.0 0.0 -39.2 0.0 51 0.0 30.7 -30.7 0.0 0.0 30.7 0.0 52 0.0 26.5 -26.5 0.0 0.0 -26.5 0.0 53 0.0 -42.2 42.2 0.0 0.0 42.2 0.0 54 0.0 -42.0 42.0 0.0 0.0 -42.0 0.0 55 0.0 -31.1 -31.1 0.0 0.0 31.1 0.0 56 0.0 -27.2 -27.2 0.0 0.0 -27.2 0.0
Main Effect -780.6 -60.0 194.2 44.8 -41.8 -2.4 -279.5 Normalized Effect -1.00 -0.08 0.25 0.06 -0.05 0.00 -0.36
112
Table 0-4: Matrix of Two-Factor Interaction Effects T Φ T O2 T CO2 T CO T H2O T NO Φ O2 Φ CO2 Φ CO Φ H2O Φ NO
Test # x1x2 x1x3 x1x4 x1x5 x1x6 x1x7 x2x3 x2x4 x2x5 x2x6 x2x7 1 0.0 0.0 0.0 0.0 0.0 0.0 0.0 0.0 0.0 0.0 0.0 2 0.0 0.0 0.0 0.0 0.0 0.0 0.0 0.0 0.0 0.0 0.0 3 0.0 0.0 0.0 0.0 0.0 0.0 0.0 0.0 0.0 0.0 0.0 4 0.0 0.0 0.0 0.0 0.0 0.0 0.0 0.0 0.0 0.0 0.0 5 0.0 0.0 0.0 0.0 0.0 0.0 0.0 0.0 0.0 0.0 0.0 6 0.0 0.0 0.0 0.0 0.0 0.0 0.0 0.0 0.0 0.0 0.0 7 0.0 0.0 0.0 0.0 0.0 0.0 0.0 0.0 0.0 0.0 0.0 8 0.0 0.0 0.0 0.0 0.0 0.0 0.0 0.0 0.0 0.0 0.0 9 0.0 0.0 0.0 0.0 16.2 16.2 0.0 0.0 0.0 0.0 0.0 10 0.0 0.0 0.0 0.0 20.8 -20.8 0.0 0.0 0.0 0.0 0.0 11 0.0 0.0 0.0 0.0 -8.9 8.9 0.0 0.0 0.0 0.0 0.0 12 0.0 0.0 0.0 0.0 -17.8 -17.8 0.0 0.0 0.0 0.0 0.0 13 0.0 0.0 0.0 0.0 -48.5 -48 5 0.0 0.0 0.0 0.0 0.0 14 0.0 0.0 0.0 0.0 -97.0 97.0 0.0 0.0 0.0 0.0 0.0 15 0.0 0.0 0.0 0.0 60.6 -60.6 0.0 0.0 0.0 0.0 0.0 16 0.0 0.0 0.0 0.0 118.0 118.0 0.0 0.0 0.0 0.0 0.0 17 0.0 0.0 0.0 0.0 0.0 0.0 0.0 0.0 23.4 0.0 23.4 18 0.0 0.0 0.0 0.0 0.0 0.0 0.0 0.0 39.9 0.0 -39.9 19 0.0 0.0 0.0 0.0 0.0 0.0 0.0 0.0 -26.0 0.0 26.0 20 0.0 0.0 0.0 0.0 0.0 0.0 0.0 0.0 -38.9 0.0 -38.9 21 0.0 0.0 0.0 0.0 0.0 0.0 0.0 0.0 -24.2 0.0 -24.2 22 0.0 0.0 0.0 0.0 0.0 0.0 0.0 0.0 -42.0 0.0 42.0 23 0.0 0.0 0.0 0.0 0.0 0.0 0.0 0.0 30.4 0.0 -30.4 24 0.0 0.0 0.0 0.0 0.0 0.0 0.0 0.0 58.4 0.0 58.4 25 13.9 0.0 13.9 0.0 0.0 0.0 0.0 13.9 0.0 0.0 0.0 26 9.1 0.0 -9.1 0.0 0.0 0.0 0.0 -9.1 0.0 0.0 0.0 27 -3.2 0.0 3.2 0.0 0.0 0.0 0.0 -3.2 0.0 0.0 0.0 28 -10.8 0.0 -10.8 0.0 0.0 0.0 0.0 10.8 0.0 0.0 0.0 29 -71.4 0.0 -71.4 0.0 0.0 0.0 0.0 71.4 0.0 0.0 0.0 30 -72.8 0.0 72.8 0.0 0.0 0.0 0.0 -72.8 0.0 0.0 0.0 31 94.4 0.0 -94.4 0.0 0.0 0.0 0.0 -94.4 0.0 0.0 0.0 32 85.7 0.0 85.7 0.0 0.0 0.0 0.0 85.7 0.0 0.0 0.0 33 0.0 0.0 0.0 0.0 0.0 0.0 0.0 0.0 0.0 0.0 0.0 34 0.0 0.0 0.0 0.0 0.0 0.0 0.0 0.0 0.0 0.0 0.0 35 0.0 0.0 0.0 0.0 0.0 0.0 0.0 0.0 0.0 0.0 0.0 36 0.0 0.0 0.0 0.0 0.0 0.0 0.0 0.0 0.0 0.0 0.0 37 0.0 0.0 0.0 0.0 0.0 0.0 0.0 0.0 0.0 0.0 0.0 38 0.0 0.0 0.0 0.0 0.0 0.0 0.0 0.0 0.0 0.0 0.0 39 0.0 0.0 0.0 0.0 0.0 0.0 0.0 0.0 0.0 0.0 0.0 40 0.0 0.0 0.0 0.0 0.0 0.0 0.0 0.0 0.0 0.0 0.0 41 0.0 13 2 0.0 13.2 0.0 0.0 0.0 0.0 0.0 0.0 0.0 42 0.0 20 9 0.0 -20.9 0.0 0.0 0.0 0.0 0.0 0.0 0.0 43 0.0 -11.8 0.0 11.8 0.0 0.0 0.0 0.0 0.0 0.0 0.0 44 0.0 -15.3 0.0 -15.3 0.0 0.0 0.0 0.0 0.0 0.0 0.0 45 0.0 -85.2 0.0 -85.2 0.0 0.0 0.0 0.0 0.0 0.0 0.0 46 0.0 -86.2 0.0 86.2 0.0 0.0 0.0 0.0 0.0 0.0 0.0 47 0.0 60.4 0.0 -60.4 0.0 0.0 0.0 0.0 0.0 0.0 0.0 48 0.0 62 3 0.0 62.3 0.0 0.0 0.0 0.0 0.0 0.0 0.0 49 0.0 0.0 0.0 0.0 0.0 0.0 39.5 0.0 0.0 39.5 0.0 50 0.0 0.0 0.0 0.0 0.0 0.0 39.2 0.0 0.0 -39.2 0.0 51 0.0 0.0 0.0 0.0 0.0 0.0 -30.7 0.0 0.0 30.7 0.0 52 0.0 0.0 0.0 0.0 0.0 0.0 -26.5 0.0 0.0 -26.5 0.0 53 0.0 0.0 0.0 0.0 0.0 0.0 -42.2 0.0 0.0 -42.2 0.0 54 0.0 0.0 0.0 0.0 0.0 0.0 -42.0 0.0 0.0 42.0 0.0 55 0.0 0.0 0.0 0.0 0.0 0.0 31.1 0.0 0.0 -31.1 0.0 56 0.0 0.0 0.0 0.0 0.0 0.0 27.2 0.0 0.0 27.2 0.0
Main Effect 44.8 -41.7 -10.1 -8.4 43.5 92.4 -4.4 2.4 20.9 0.4 16.3 Norm. Effect 0.057 -0.053 -0.013 -0.011 0.056 0.118 -0.006 0.003 0.027 0.001 0.021
113
Table 0-4b: Matrix of Two-Factor Interaction Effects
O2 CO2 O2 CO O2 H2O O2 NO CO2 CO CO2 H2O CO2 NO CO H2O CO NO H2O NO Test # x3x4 x3x5 x3x6 x3x7 x4x5 x4x6 x4x7 x5x6 x5x7 x6x7
1 0.0 0.0 0.0 0.0 41.4 41.4 0.0 41.4 0.0 0.0 2 0.0 0.0 0.0 0.0 38.7 -38.7 0.0 -38.7 0.0 0.0 3 0.0 0.0 0.0 0.0 -41.4 41.4 0.0 -41.4 0.0 0.0 4 0.0 0.0 0.0 0.0 -35.5 -35.5 0.0 35 5 0.0 0.0 5 0.0 0.0 0.0 0.0 -31.2 -31.2 0.0 31 2 0.0 0.0 6 0.0 0.0 0.0 0.0 -30.5 30 5 0.0 -30.5 0.0 0.0 7 0.0 0.0 0.0 0.0 35.4 -35.4 0.0 -35.4 0.0 0.0 8 0.0 0.0 0.0 0.0 33.0 33.0 0.0 33.0 0.0 0.0 9 0.0 0.0 0.0 0.0 0.0 0.0 0.0 0.0 0.0 16.2 10 0.0 0.0 0.0 0.0 0.0 0.0 0.0 0.0 0.0 -20.8 11 0.0 0.0 0.0 0.0 0.0 0.0 0.0 0.0 0.0 -8.9 12 0.0 0.0 0.0 0.0 0.0 0.0 0.0 0.0 0.0 17.8 13 0.0 0.0 0.0 0.0 0.0 0.0 0.0 0.0 0.0 48.5 14 0.0 0.0 0.0 0.0 0.0 0.0 0.0 0.0 0.0 -97.0 15 0.0 0.0 0.0 0.0 0.0 0.0 0.0 0.0 0.0 -60.6 16 0.0 0.0 0.0 0.0 0.0 0.0 0.0 0.0 0.0 118.0 17 0.0 0.0 0.0 0.0 0.0 0.0 0.0 0.0 23.4 0.0 18 0.0 0.0 0.0 0.0 0.0 0.0 0.0 0.0 -39.9 0.0 19 0.0 0.0 0.0 0.0 0.0 0.0 0.0 0.0 -26.0 0.0 20 0.0 0.0 0.0 0.0 0.0 0.0 0.0 0.0 38.9 0.0 21 0.0 0.0 0.0 0.0 0.0 0.0 0.0 0.0 24.2 0.0 22 0.0 0.0 0.0 0.0 0.0 0.0 0.0 0.0 -42.0 0.0 23 0.0 0.0 0.0 0.0 0.0 0.0 0.0 0.0 -30.4 0.0 24 0.0 0.0 0.0 0.0 0.0 0.0 0.0 0.0 58.4 0.0 25 0.0 0.0 0.0 0.0 0.0 0.0 0.0 0.0 0.0 0.0 26 0.0 0.0 0.0 0.0 0.0 0.0 0.0 0.0 0.0 0.0 27 0.0 0.0 0.0 0.0 0.0 0.0 0.0 0.0 0.0 0.0 28 0.0 0.0 0.0 0.0 0.0 0.0 0.0 0.0 0.0 0.0 29 0.0 0.0 0.0 0.0 0.0 0.0 0.0 0.0 0.0 0.0 30 0.0 0.0 0.0 0.0 0.0 0.0 0.0 0.0 0.0 0.0 31 0.0 0.0 0.0 0.0 0.0 0.0 0.0 0.0 0.0 0.0 32 0.0 0.0 0.0 0.0 0.0 0.0 0.0 0.0 0.0 0.0 33 40.7 0.0 0.0 40.7 0.0 0.0 40.7 0.0 0.0 0.0 34 66.3 0.0 0.0 -66.3 0.0 0.0 -66.3 0.0 0.0 0.0 35 -41.7 0.0 0.0 41.7 0.0 0.0 -41.7 0.0 0.0 0.0 36 -68.8 0.0 0.0 -68.8 0.0 0.0 68.8 0.0 0.0 0.0 37 -26.4 0.0 0.0 -26.4 0.0 0.0 26.4 0.0 0.0 0.0 38 -45.2 0.0 0.0 45.2 0.0 0.0 -45.2 0.0 0.0 0.0 39 20.7 0.0 0.0 -20.7 0.0 0.0 -20.7 0.0 0.0 0.0 40 34.2 0.0 0.0 34.2 0.0 0.0 34.2 0.0 0.0 0.0 41 0.0 13.2 0.0 0.0 0.0 0.0 0.0 0.0 0.0 0.0 42 0.0 -20.9 0.0 0.0 0.0 0.0 0.0 0.0 0.0 0.0 43 0.0 -11.8 0.0 0.0 0.0 0.0 0.0 0.0 0.0 0.0 44 0.0 15.3 0.0 0.0 0.0 0.0 0.0 0.0 0.0 0.0 45 0.0 85.2 0.0 0.0 0.0 0.0 0.0 0.0 0.0 0.0 46 0.0 -86.2 0.0 0.0 0.0 0.0 0.0 0.0 0.0 0.0 47 0.0 -60.4 0.0 0.0 0.0 0.0 0.0 0.0 0.0 0.0 48 0.0 62.3 0.0 0.0 0.0 0.0 0.0 0.0 0.0 0.0 49 0.0 0.0 39.5 0.0 0.0 0.0 0.0 0.0 0.0 0.0 50 0.0 0.0 -39.2 0.0 0.0 0.0 0.0 0.0 0.0 0.0 51 0.0 0.0 -30.7 0.0 0.0 0.0 0.0 0.0 0.0 0.0 52 0.0 0.0 26.5 0.0 0.0 0.0 0.0 0.0 0.0 0.0 53 0.0 0.0 42.2 0.0 0.0 0.0 0.0 0.0 0.0 0.0 54 0.0 0.0 -42.0 0.0 0.0 0.0 0.0 0.0 0.0 0.0 55 0.0 0.0 -31.1 0.0 0.0 0.0 0.0 0.0 0.0 0.0 56 0.0 0.0 27.2 0.0 0.0 0.0 0.0 0.0 0.0 0.0
Main Eff. -20.2 -3.2 -7.8 -20.3 9.9 5.5 -3.8 -4.8 6.4 13.2 Norm.Eff -0.026 -0.004 -0.010 -0.026 0.013 0.007 -0.005 -0.006 0.008 0.017

114
A.4 Phase II Detailed Investigation Test Matrices
Table 0-5: Detailed Investigation Atmospheric Test Matrix - Nominal Values
Temp [K] XO2 XNO Temp
[K] XO2 XNO
900 20% 0 900 12% 0 900 20% 50 900 12% 50 900 20% 100 900 12% 100 900 20% 250 900 12% 250 900 20% 500 900 12% 500 900 20% 1000 900 12% 1000 850 20% 0 850 12% 0 850 20% 50 850 12% 50 850 20% 100 850 12% 100 850 20% 250 850 12% 250 850 20% 500 850 12% 500 850 20% 1000 850 12% 1000 800 20% 0 800 12% 0 800 20% 50 800 12% 50 800 20% 100 800 12% 100 800 20% 250 800 12% 250 800 20% 500 800 12% 500 800 20% 1000 800 12% 1000 750 20% 0 750 12% 0 750 20% 50 750 12% 50 750 20% 100 750 12% 100 750 20% 250 750 12% 250 750 20% 500 750 12% 500 750 20% 1000 750 12% 1000 700 20% 0 700 12% 0 700 20% 50 700 12% 50 700 20% 100 700 12% 100 700 20% 250 700 12% 250 700 20% 500 700 12% 500 700 20% 1000 700 12% 1000

115
Table 0-6: Results for Atmospheric Tests of JP-8 and O2/N2/NO Mixtures
1.0 atm 20% O2 - JP-8 Tests w/ NO 1.0 atm 12% O2 - JP-8 Tests w/ NO
Fuel XO2 Temp.
[K] XNO τig SE% Fuel XO2 Temp. XNO τig SE% [ms] [K] [ms]
JP-8 20% 900 0 325 2.0% JP-8 12% 900 0 593 0.9% JP-8 20% 900 49 284 1.8% JP-8 12% 900 49 443 0.8% JP-8 20% 900 92 256 0.5% JP-8 12% 900 95 379 2.1% JP-8 20% 900 246 181 1.4% JP-8 12% 900 251 239 1.0% JP-8 20% 900 467 128 5.3% JP-8 12% 900 482 184 2.3% JP-8 20% 900 954 93 1.5% JP-8 12% 900 972 141 1.4%
Fuel XO2 Temp. XNO τig SE% Fuel XO2
Temp. XNO τig SE% [K] [ms] [K] [ms] JP-8 20% 850 0 731 1.8% JP-8 12% 850 0 1452 1.5% JP-8 20% 850 49 626 0.2% JP-8 12% 850 49 1103 0.9% JP-8 20% 850 92 533 0.3% JP-8 12% 850 95 870 2.4% JP-8 20% 850 246 Did Not Run JP-8 12% 850 250 251 1.4% JP-8 20% 850 467 242 1.2% JP-8 12% 850 482 365 1.3% JP-8 20% 850 954 164 2.1% JP-8 12% 850 972 298 1.7%
Fuel XO2 Temp. XNO τig SE% Fuel XO2
Temp. XNO τig SE% [K] [ms] [K] [ms] JP-8 20% 800 0 1365 2.1% JP-8 12% 800 0 No Ign. JP-8 20% 800 49 1298 3.1% JP-8 12% 800 49 No Ign. JP-8 20% 800 92 1188 2.5% JP-8 12% 800 95 2446 4.1% JP-8 20% 800 246 745 1.0% JP-8 12% 800 251 1261 1.6% JP-8 20% 800 467 448 0.3% JP-8 12% 800 482 717 1.7% JP-8 20% 800 954 239 0.5% JP-8 12% 800 972 514 2.5%
Fuel XO2 Temp. XNO τig SE%
[K] [ms] JP-8 20% 750 0 No Ign. JP-8 20% 750 49 No Ign. JP-8 20% 750 92 3044 1.7% JP-8 20% 750 246 1752 2.5% JP-8 20% 750 467 932 2.9% JP-8 20% 750 954 401 1.9%
Fuel XO2 Temp. XNO τig SE%
[K] [ms] JP-8 20% 700 0 No Ign. JP-8 20% 700 49 No Ign. JP-8 20% 700 92 No Ign. JP-8 20% 700 246 No Ign. JP-8 20% 700 467 3166 12.4% 705 ppm NO case added for this
temperature only at 1 atm and 20% O2 JP-8 20% 700 705 1314 4.4% JP-8 20% 700 954 845 4.0%

116
Table 0-7: Results for Sub-atmospheric Tests of JP-8 and O2/N2/NO Mixtures
0.5 atm 20% O2 - JP-8 Tests w/ NO 0.5 atm 12% O2 - JP-8 Tests w/ NO
Fuel XO2 Temp.
[K] XNO τig SE% Fuel XO2 Temp. XNO τig SE% [ms] [K] [ms]
JP-8 20% 900 46 905 2.9% JP-8 12% 900 46 1396 7.2% JP-8 20% 900 46 683 3.1% JP-8 12% 900 46 1268 4.6% JP-8 20% 900 93 555 2.2% JP-8 12% 900 94 844 4.9% JP-8 20% 900 236 392 0.9% JP-8 12% 900 231 552 4.4% JP-8 20% 900 472 276 1.5% JP-8 12% 900 475 390 3.9% JP-8 20% 900 908 218 0.8% JP-8 12% 900 921 319 5.4%
Fuel XO2 Temp.
[K] XNO τig SE% Fuel XO2 Temp. XNO τig SE% [ms] [K] [ms]
JP-8 2% 850 49 No Ign. JP-8 12% 850 49 No Ign. JP-8 20% 850 46 1837 9.3% JP-8 12% 850 49 No Ign. JP-8 20% 850 93 1268 3.0% JP-8 12% 850 49 No Ign. JP-8 20% 850 236 834 3.3% JP-8 12% 850 231 1435 3.9% JP-8 20% 850 472 521 2.4% JP-8 12% 850 475 789 1.4% JP-8 20% 850 908 384 1.9% JP-8 12% 850 921 650 3.5%
Fuel XO2 Temp.
[K] XNO τig SE% Fuel XO2 Temp. XNO τig SE% [ms] [K] [ms]
JP-8 20% 800 0 No Ign. JP-8 12% 800 49 No Ign. JP-8 20% 800 49 No Ign. JP-8 12% 800 49 No Ign. JP-8 20% 800 92 No Ign. JP-8 12% 800 49 No Ign. JP-8 20% 800 246 No Ign. JP-8 12% 800 49 No Ign. JP-8 20% 800 472 1217 3.3% JP-8 12% 800 49 No Ign. JP-8 20% 800 908 654 2.5% JP-8 12% 800 921 1355 3.1%
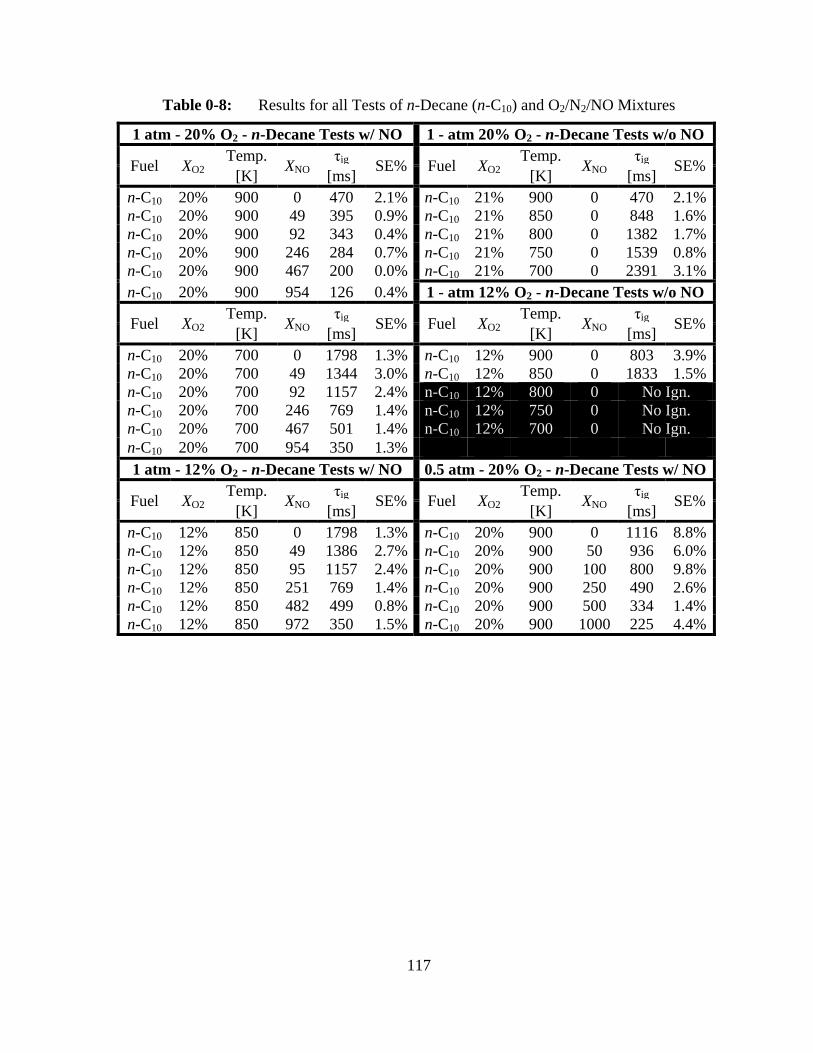
117
Table 0-8: Results for all Tests of n-Decane (n-C10) and O2/N2/NO Mixtures
1 atm - 20% O2 - n-Decane Tests w/ NO 1 - atm 20% O2 - n-Decane Tests w/o NO
Fuel XO2 Temp. XNO τig SE% Fuel XO2
Temp. XNO τig SE%[K] [ms] [K] [ms] n-C10 20% 900 0 470 2.1% n-C10 21% 900 0 470 2.1%n-C10 20% 900 49 395 0.9% n-C10 21% 850 0 848 1.6%n-C10 20% 900 92 343 0.4% n-C10 21% 800 0 1382 1.7%n-C10 20% 900 246 284 0.7% n-C10 21% 750 0 1539 0.8%n-C10 20% 900 467 200 0.0% n-C10 21% 700 0 2391 3.1%n-C10 20% 900 954 126 0.4% 1 - atm 12% O2 - n-Decane Tests w/o NO
Fuel XO2 Temp. XNO τig SE% Fuel XO2
Temp. XNO τig SE%[K] [ms] [K] [ms] n-C10 20% 700 0 1798 1.3% n-C10 12% 900 0 803 3.9%n-C10 20% 700 49 1344 3.0% n-C10 12% 850 0 1833 1.5%n-C10 20% 700 92 1157 2.4% n-C10 12% 800 0 No Ign. n-C10 20% 700 246 769 1.4% n-C10 12% 750 0 No Ign. n-C10 20% 700 467 501 1.4% n-C10 12% 700 0 No Ign. n-C10 20% 700 954 350 1.3% 1 atm - 12% O2 - n-Decane Tests w/ NO 0.5 atm - 20% O2 - n-Decane Tests w/ NO
Fuel XO2 Temp. XNO τig SE% Fuel XO2
Temp. XNO τig SE%[K] [ms] [K] [ms] n-C10 12% 850 0 1798 1.3% n-C10 20% 900 0 1116 8.8%n-C10 12% 850 49 1386 2.7% n-C10 20% 900 50 936 6.0%n-C10 12% 850 95 1157 2.4% n-C10 20% 900 100 800 9.8%n-C10 12% 850 251 769 1.4% n-C10 20% 900 250 490 2.6%n-C10 12% 850 482 499 0.8% n-C10 20% 900 500 334 1.4%n-C10 12% 850 972 350 1.5% n-C10 20% 900 1000 225 4.4%

118
References
[1] Vitiate | Define Vitiate at Dictionary.com. (n.d.). Retrieved April 17th, 2010, from Dictionary.com: http://dictionary.reference.com/browse/vitiate
[2] Cavaliere, A., & de Joannon, M. (2004). Mild Combustion. Progress in Energy and Combustion Science , 30, 329-366.
[3] Lovett, J. A., Brogan, T. P., Derk, S. P., Kiel, B. V., & Thompson, T. V. (2004). Development Needs for Advanced Afterburner Designs. 40th AIAA/ASME/SAE/ASEE Joint Propulsion Conference and Exhibit, AIAA 2004-4192. Fort Lauderdale, Florida.
[4] Gokulakrishnan, P. G. (2007). Experimental and Kinetic Modeling of Kerosene-Type Fuels at Gas Turbine Operating Conditions. Journal of Engineering for Gas Turbines and Power , 129, 655-663.
[5] Curran, H. J., Gaffuri, P., Pitz, W. J., & Westbrook, C. K. (1998). A Comprehensive Modeling Study of n-Heptane Oxidation. Combustion and Flame , 114, 149-177.
[6] Dooley, S., Won, S. H., Chaos, M., Heyne, J., Ju, Y., Dryer, F. L., et al. (2010). A jet fuel surrogate formulated by real fuel properties. Combustion and Flame , 157 (12), 2333-2339.
[7] Dagaut, P., Reuillon, M., Boettner, J. -C., & Cathonnet, M. (1994). “Kerosene Combustion at Pressures upto 40 atm: Experimental Study and Detailed Chemical Kinetic Modeling. Proceeding of the Combustion Institute , 25, 919-926.
[8] Ranzi, E., Dente, M., Goldaniga, A., Bozzano, G., & Faravelli, T. (2001). Lumping procedures in detailed kinetic modeling of gasification, pyrolysis, partial oxidation and combustion of hydrocarbon mixtures. Progress in Energy and Combustion Science , 27 (1), 99-139 .
[9] Faravelli, T., Frassoldati, A., & Ranzi, E. (2003). Kinetic modeling of the interactions between NO and hydrocarbons in the oxidation of hydrocarbons at low temperatures. Combustion and Flame , 132, 188-207.
[10] Frassoldati, A., Faravelli, T., & Ranzi, E. (2003). Kinetic modeling of the interactions between NO and hydrocarbons at high temperature. Combustion and Flame , 135, 97-122.
[11] Seiser, R., & Seshadri, K. (2005). The influence of water on extinction and ignition of hydrogen and methane flames. Proceedings of the Combustion Institute , 30, 407-414.
[12] Le Cong, T., Dagaut, P., & Dayma, G. (2008). Oxidation of Natural Gas, Natural Gas/Syngas Mixtures, and Effect of Burnt Gas Recirculation: Experimental and Detailed Modeling Study. Journal of Engineering for Gas Turbines and Power, , 130 (4).
[13] Thompson, H. W., & Hinshelwood, C. N. (1929). The Influence of Nitrogen Peroxide on the Combination of Hydrogen and Oxygen. Proceedings of the Royal Society of London , A124, 219-227.
119
[14] Norrish, R. G., & Wallace, J. (1934). The Reaction of Methane and Oxygen Sensitized by Nitrogen Peroxide. Part I – Thermal Ignition. Proceedings of the Royal Society of London , 134, 307-321.
[15] Dabora, E. K. (1975). Effect of NO2 on the Ignition Delay of CH4-Air Mixtures. Combustion and Flame , 24, 181-184.
[16] Slack, M. W., & Grillo, A. R. (1981). Shock Tube Investigation of Methane-Oxygen Ignition Sensitized by NO2. Combustion and Flame , 40, 155-172.
[17] Bromly, J. H., Barnes, F. J., Muris, S., You, X., & Haynes, B. S. (1996). Kinetic and Thermodynamic Sensitivity Analysis of the NO-Sensitized Oxidation of Methane. Combustion Science and Technology , 115, 259-296.
[18] Bromly, J. H., Barnes, F. J., Mandyczewsky, R., Edwards, T. J., & Haynes, B. S. (1992). An experimental investigation of the mutually sensitised oxidation of nitric oxide and n-butane. 24th Symposium (International) on Combustion (24), 899-907.
[19] Dagaut, P., & Nicolle, A. (2005). Experimental study and detailed kinetic modeling of the effect of exhaust gas on fuel combustion: mutual sensitization of the oxidation of nitric oxide and methane over extended temperature and pressure ranges. Combustion and Flame , 140, 161-171.
[20] Bendtsen, A. B., Glarborg, P., & Dam–Johansen, K. (2000). Low Temperature Oxidation of Methane: The Influence of Nitrogen Oxides. Combustion Science and Technology , 151, 31-71.
[21] Konnov, A. A., Zhu, J. N., Bromly, J. H., & Zhang, D. (2005). The effect of NO and NO2 on the partial oxidation of methane: experiments and modeling. Proceedings of the Combustion Institute , 30, 1093-1100.
[22] Moréac, G., Dagaut, P., Roesler, J. F., & Cathonnet, M. (2006). Nitric oxide interactions with hydrocarbon oxidation in jet-stirred reactor at 10 atm. Combustion and Flame , 145, 512-520.
[23] Moréac, G., Dagaut, P., Roesler, J. F., & Cathonnet, M. (2002). Impact of Trace NO and other residual burnt gas components from piston engines on the oxidation of various hydrocarbons in a jet stirred reactor at atmospheric pressure. Proceedings of the Second Mediterranean Combustion Symposium 6-11 January 2002, (pp. 240-251). Sharm El-Sheikh, Egypt.
[24] Dubreuil, A., Foucher, F., Mounáim-Rousselle, C., Dayma, G., & Dagaut, P. (2007). HCCI combustion: Effect of NO in EGR. Proceedings of the Combustion Institute. 31, pp. 2879-2886. The Combustion Insitute.
[25] Anderlohr, J. M., Piperel, A., Pires da Cruz, A., Bounaceur, R., Battin-Leclerc, F., Dagaut, P., et al. (2009). Influence of EGR componunds on the oxidiation of an HCCI-diesel surrogate. Proceedings of the Combustion Institute, 32, pp. 2852-2859.
[26] Kowalski, S. (1993). A Study of the Low and Intermediate Temperature Oxidiation Chemistry of a Primary Reference Fuel Blend and Two Gasolines at High Pressure. Masters Thesis, Princeton University, Department of Mechanical and Aerospace Engineering.

120
[27] Dagaut, P. (2002). On the Kinetics of Hydrocarbons Oxidation from Natural Gas to Kerosene and Diesel Fuel”. Physical Chemistry and Chemical Physics , 4, 2079 –2094.
[28] Violi, A., Yan, S., Eddings, E. G., Sarofim, A. F., Granata, S., Faravelli, T., et al. (2002). Experimental Formulation and Kinetic Model for JP-8 Surrogate Mixtures. Combustion Science and Technology , 174, 399-417.
[29] Lindstedt, R. P., & Maurice, L. Q. (2000). Detailed Chemical-Kinetic Model for Aviation Fuels. Journal of Propulsion and Power , 16, 187-195.
[30] Starkman, E. (1946). Ignition delay in diesel engines. American Institute of Chemical Engineers -- Transactions , 42 (1), 107-207.
[31] Geir, F. (1985). Investigations of Combustion Properties of Liquid Fuels in a Constant Volume Bomb. ASTM Special Technical Publication , 190-203.
[32] Granata, S., Faravelli, T., & Ranzi, E. (2003). A Wide Range Kinetic Modeling Study of the Pyrolysis and Combustion of Naphthenes. Combustion and Flame , 132, 533–544.
[33] Wurmel, J., Silke, E. J., O Conaire, M. S., & Simmie, J. M. (2007). The effect of diluent gases on ignition delay times in the shock tube and in the rapid compression machine. Combustion and Flame , 151 (1-2), 289-302 .
[34] Mullaney, G. J. (1958). Shock tube technique for study of autoignition of liquid fuel sprays. Industrial and Engineering Chemistry , 50, 53-58.
[35] Miyasaka, K., & Mizutani, Y. (1975). Ignition of Sprays by an Incident Shock. Combustion and Flame , 25, 177-186.
[36] Ciezki, H. K., & Adomeit, G. (1993). Shock-Tube Investigation of Self-Ignition of n-Heptane Mixtures Under Engine Relevant Conditions. Combustion and Flame , 93, 421-433.
[37] Dean, A. J., Penyazkov, O. G., Sevruk, K. L., & Varatharajan, B. (2005). Ignition of Aviaition Kerosene at High Temperatures. 20th International Colloquium on Dynamics of Explosions and Reactive Systems. Montreal, Canada.
[38] Vasu, S. S., Davidson, D. F., & Hanson, R. K. (2006). Shock Tube Ignition Delay Times and Modeling of Jet Fuel Mixtures. 42nd AIAA/ASME/SAE/ASEE Joint Propulsion Conference and Exhibit, AIAA-2006-4402. Sacramento, CA.
[39] Freeman, G., & Lefebvre, A. H. (1984). Spontaneous Ignition Characteristics of Gaseous Hydrocarbon-Air Mixtures. Combustion and Flame , 58, 153-162.
[40] Spadaccini, L. J., & TeVelde, J. A. (1980). Autoignition Characteristics of Aircraft-Type Fuels. Report No. NASA CR-159886. United Technologies Research Center, East Hartford,CT.
[41] Gokulakrishnan, P., Gaines, G. G., Klassen, M. S., & Roby, R. J. (2007). Autoignition of Aviation Fuels: Experimental and Modeling Study. AIAA/ASME/SAE/ASEE 43rd Joint Propulsion Conference, AIAA 2007-5701. Cincinnati, OH.
121
[42] Fuller, C. C., Gokulakrishnan, P., Klassen, M. S., Roby, R. J., & Kiel, B. V. (2009). Investigation of the Effects of Vitiated Conditions on the Autoignition of JP-8. 45th AIAA/ASME/SAE/ASEE Joint Propulsion Conference & Exhibit. Denver, CO: American Institute of Aeronautics and Astronautics, Inc.
[43] Fuller, C. C., Gokulakrishnan, P., Klassen, M. S., Roby, R. J., & Kiel, B. V. (2011). Investigation of the Effect of Nitric Oxide on the Autoignition of JP-8 at Low Pressure Vitiated Conditions. 49th AIAA Aerospace Sciences Meeting including the New Horizons Forum and Aerospace Exposition. Orlando, FL: American Institute of Aeronautics and Astronautics, Inc.
[44] Holton, M. M., Gokulakrishnan, P., Klassen, M. S., Roby, R. J., & Jackson, G. S. (2010). Autoginition Delay Time Measurements of Methane, Ethane, Propane Pure Fuels and Methane-Based Fuel Blends. Journal of Engineering for Gas Turbines and Power , 132 (9).
[45] ASTM Standard D2425. (2004). Standard Test Method for Hydrocarbon Types in Middle Distillates by Mass Spectrometry . ASTM International, West Conshohocken, PA, 2004: DOI: 10.1520/D2425-04, www.astm.org.
[46] ASTM Standard D6379. (2004). Standard Test Method for Determination of Aromatic Hydrocarbon Types in Aviation Fuels and Petroleum Distillates—High Performance Liquid Chromatography Method with Refractive Index Detection . ASTM International, West Conshohocken, PA: DOI: 10.1520/D6379-04, www.astm.org.
[47] Yetter, R. A., Dryer, F. L., & Rabitz, H. (1991). Flow Reactor Studies of Carbon Monoxide/Hydrogen/ Oxygen Kinetics. Combustion Science and Technology , 27 (1-3), 129-140.
[48] Li, J., Kazakov, A., & Dryer, F. L. (2001). Ethanol pyrolysis experiments in a variable pressure flow reactor. International Journal of Chemical Kinetics , 33 (12), 859–867.
[49] Schmidt, C. (2001). Flow Reactor Study on the Effect of Pressure on the Thermal De-NOx Reaction. Phd. Thesis, Stanford University, Stanford, CA.
[50] Gokulakrishnan, P., Kazakov, A., & Dryer, F. L. (2003). Comparison of Numerical and Experimental Kinetic Data for Flow Reactor Systems: Mixing Effects. Proceedings of the Third US Combustion Meeting. Chicago, IL: The Combustion Institute.
[51] Myers, R. H., & Montgomery, D. C. (1995). Reponse Surface Methodology: Process and Product Optimization Using Designed Experiments. Wiley and Sons.
[52] Box, G. E., Hunter, W. G., & Hunter, J. S. (1978). Statistics for Experimenters: An Introduction to Design, Data Analysis and Model Building. Wiley-Interscience.
[53] NIST/SEMATECH e-Handbook of Statistical Methods. (n.d.). Retrieved November 20, 2008, from http://www.itl.nist.gov/div898/handbook
[54] Holton, M. M. (2008). Autoignition Delay Time Measurements for Natural Gas Fuel Components and their Mixtures. M.S. Thesis, University of Maryland, College Park, Mechanical Engineering.
122
[55] Joklik, R., Fuller, C., Turner, B., & Gokulakrishnan, P. (2010). The Effect of Multi-Component Fuel Evaporiation on the Ignition of JP-8. ASME Turbo Expo 2010: Power for Land, Sea, and Air (GT2010) (pp. 813-822). Glasgow, UK: ASME.
[56] Burcat, A. (2006, March 13th). Burcat's Thermodynamic Data. Retrieved from Burcat's Thermodynamic Data: http://garfield.chem.elte.hu/Burcat/burcat.html
[57] Gracia-Salcedo, C. M., Brabbs, T. A., & McBride, B. J. (1988). Experimental verification of the thermodynamic properties of a Jet-A fuel. Coal combustion and soot formation (pp. 875-882). Los Angeles, CA: NASA.
[58] Gokulakrishnan, P., McLellan, P. J., Lawrence, A. D., & Grandmaison, E. W. (2005). Kinetic analysis of NO-sensitized methane oxidation. Chemical Engineering Science , 60, 3683 - 3692.
[59] Beerer, D., McDonell, V., & Samuelsen, S. (2009). Interpretation of Flow Reactor Based Ignition Delay Measurements. Proceedings of the ASME Turbo Expo, v2, pp. 1011-1026. Orlando, FL.
[60] Beerer, D. J. (2009). Autoignition of Methane, Ethane, Propane and Hydrogen in Turbulent High Pressure and Temperature Flows. Master's Thesis, University of California, Irvine, Mechanical and Aerospace Engineering.


![CUBE-BL-JP-18 CUBE-PK-JP-18 CUBE-YL-JP-18 (JP) …...CUBE-BL-JP-18 CUBE-PK-JP-18 CUBE-YL-JP-18 (JP) 1.2 Litre Capacity [JP] Operating Guide (JP)Please read this entire guide before](https://img.dokumen.tips/doc/110x75/5f0aa9a57e708231d42cb922/cube-bl-jp-18-cube-pk-jp-18-cube-yl-jp-18-jp-cube-bl-jp-18-cube-pk-jp-18-cube-yl-jp-18.jpg)


![[JP] Promotion Material_translated into JP](https://img.dokumen.tips/doc/110x75/58ab4f791a28ab61758b69f3/jp-promotion-materialtranslated-into-jp.jpg)


![V19N52 PCT 2NDonlineservices.ipophil.gov.ph/.../V19N52_PCT_2nd.pdf · 2016. 5. 13. · USHIODA[JP]: RIE TAKAHASHI[JP]: TOMIO YAMAKAWA[JP]: SEIICHIRO MASUI[JP] [73] Assignee(s): NIPPON](https://img.dokumen.tips/doc/110x75/6092274e60ff73501273d5d6/v19n52-pct-2016-5-13-ushiodajp-rie-takahashijp-tomio-yamakawajp-seiichiro.jpg)