Embed Size (px)
Citation preview

ABSTRACT
THE CARDIOVASCULAR AND METABOLIC EFFECTS OF HIGH INTENSITY
INTERVAL TRAINING WITH AND WITHOUT HIGH ALTITUDE SIMULATION
AND EITHER WITH AND WITHOUT HIGH
CONCENTRATION OXYGEN
RECOVERY ASSISTANCE
Frank Wojan, MS Ed
Department of Kinesiology and Physical Education Northern Illinois University, 2017
Craig E. Broeder PhD, Director
Purpose: The study investigated the acute responses of altitude (Denver, CO) simulation
during high intensity interval training and the subsequent supplementation of oxygen to
facilitate greater recovery. Lacking literature on the subject matter is a major
consideration for completion of the study. We hypothesize that oxygen supplementation
during an acute bout of high intensity interval training with accompanying altitude will
allow for greater recovery.
Methods: Seven healthy cyclists aged 40.9 ± 7.01 (Height: 68.4 ± 4.98: Weight: 171.3 ±
33.29: 19.3% ±7.41%: VO2 Max L/min 4.12 ± 1.17) performed baseline VO2max testing
and three subsequent separate randomized trials consisting of three HIIT and recovery
intervals with varying conditions. Session A: altitude intervals / supplemental oxygen
recovery. Session B: sea level HIIT / sea level recovery. Session C: altitude HIIT / sea
level recovery. Trial intensity will be established by cardiac output prediction and set at
75% HIIT and 50% recovery in watts
Results: Supplemental oxygen following HIIT elicited significant responses in HR
(p<0.035, p<0.012), VO2 (p<0.029, p<0.030, p<0.004, p<0.001), cardiac output
(p<0.012, p<0.002), and right quadricep oxygen saturation (p<0.011, p<0.013, p<0.009)
Conclusion: The implementation of supplemental oxygen following altitude simulation
with HIIT will facilitate greater recovery. Although significance was found among
multiple variables, more subjects are needed for other to become significant.
NORTHERN ILLINOIS UNIVERSITY
DE KALB, ILLINOIS
AUGUST 2017
THE CARDIOVASCULAR AND METABOLIC EFFECTS OF HIGH-INTENSITY
INTERVAL TRAINING WITH AND WITHOUT HIGH-ALTITUDE SIMULATION
AND EITHER WITH AND WITHOUT HIGH-
CONCENTRATION OXYGEN
RECOVERY ASSISTANCE
BY
FRANK WOJAN
© 2017 Frank Wojan
A THESIS SUBMITTED TO THE GRADUATE SCHOOL
IN PARTIAL FULFILLMENT OF THE REQUIREMENTS
FOR THE DEGREE
MASTER OF SCIENCE IN EDUCATION
DEPARTMENT OF KINESIOLOGY AND PHYSICAL EDUCATION
Thesis Director:
Craig E. Broeder, PhD

TABLE OF CONTENTS
Page
LIST OF TABLES ........................................................................................................................ v
LIST OF FIGURES ...................................................................................................................... vi
Chapter
1. INTRODUCTION ........................................................................................................ 1
2. LITERATURE REVIEW ............................................................................................. 4
Physiological Acute Responses to Altitude ......................................................... 4
Acute Responses of Interval Training .................................................................. 8
Physiological Acute Responses to Altitude and Intervals .................................... 13
3. METHODS .................................................................................................................. 16
Subject Demographics ........................................................................................... 16
Subject Qualification Process ................................................................................ 16
Experimental Design ............................................................................................. 17
Oxygen Contrast and HIIT Trial ............................................................................ 19
Baseline Data: 𝑉𝑂2 𝑚𝑎𝑥 Design and Protocol ...................................................... 21
HIIT Interval Session Technology Preparation Description .................................. 25
Session A: Altitude and Hyperoxia Recovery ....................................................... 28
Session B: Sea-Level Verification of Intensity ...................................................... 28
Session C: Altitude with Sea-Level Recovery ....................................................... 29

iv
Data Processing and Statistical Analysis ............................................................... 29
Chapter Page
4.STUDY HYPOTHESES ................................................................................................ 31
5.RESULTS ...................................................................................................................... 33
Subject Demographics .......................................................................................... 33
Subject Fitness Demographics .............................................................................. 33
Full Trial Results................................................................................................... 34
Full HIIT and HIIT Last 15 Seconds .................................................................... 37
Full Recovery and Recovery Last 15 Seconds ..................................................... 39
6.DISCUSSION ................................................................................................................ 44
Purpose Revisited.................................................................................................. 44
Entire Trial Significance ....................................................................................... 45
HIIT Interval Significance .................................................................................... 46
Recovery Interval Significance ............................................................................. 48
Practical Significance of Results .......................................................................... 49
Future Considerations ........................................................................................... 50
REFERENCES ............................................................................................................................. 51

LIST OF TABLES
Table Page
1. ACSM definitions of exercise intensity .................................................................... 9
2. HIIT physiology data ................................................................................................. 12
3. Experimental variables .............................................................................................. 20
4. Maximal oxygen consumption study protocol .......................................................... 21
5. Estimating wattages for sessions A, B, and C ........................................................... 25
6. Hypothesized physiological variable response .......................................................... 32
7. Subject overall demographics ................................................................................... 33
8. Subject fitness demographics .................................................................................... 34
9. Entire trial variable means and significance .............................................................. 37
10. Full HIIT variable means and significance ............................................................... 38
11. Last 15 seconds of HIIT variable means and significance ........................................ 39
12. Full recovery variable means and significance ......................................................... 40
13. Last 15 seconds variable means and significance ..................................................... 43
LIST OF FIGURES
Figure Page
1. Body Systems.............................................................................................................. 2
2. Altitude Physiology .................................................................................................... 4
3. Partial Pressures .......................................................................................................... 5
4. Altitude and Partial Pressures ..................................................................................... 5
5. Altitude Responses...................................................................................................... 6
6. Incomplete Saturation ................................................................................................. 8
7. HIIT Physiology.......................................................................................................... 11
8. Baseline Data Qualification Procedures ..................................................................... 17
9. Testing Performance Sequence ................................................................................... 18
10. Individual Session Explanation................................................................................... 19
11. LiveO2 Oxygen Contrast Simulator Setup ................................................................. 20
12. Results of Broeder et al. (2009) .................................................................................. 24
13. Intensity Prediction ..................................................................................................... 24
14. PhysioFlow Electrode Placement ............................................................................... 26
15. Project Setup ............................................................................................................... 27
16. Statistical Analysis ...................................................................................................... 30
17. Entire Trial VO2 Comparison ..................................................................................... 35
vii
18. PhysioFlow Cardiac Output Entire Trial .................................................................... 35
19. PhysioFlow Stroke Volume Entire Trial..................................................................... 36
Figure Page
20. PhysioFlow Heart Rate Entire Trial ............................................................................ 36
21. Neck Oxygen Percent Across All Trials ..................................................................... 37
22. Cardiac Output Full Recovery Means Across Sessions A, B, and C .......................... 41
23. Right Quadricep O2 Saturation Full Recovery Means
Across Sessions A, B, and C ....................................................................................... 41
24. VO2 Full Recovery Means Across Sessions A, B, and C .......................................... 42

CHAPTER 1
INTRODUCTION
The physiological and metabolic responses for meeting the demands of exercise are
complex. Additionally, with increasing exercise intensity, how well a person meets these
demands requires a highly integrated response across each major system involved. Limitations in
any key system (i.e. heart function) play a major factor in how coordinating systems need to
respond (Porcari, Bryant, & Comana, 2015).
For example, endurance capacity (i.e. 𝑉𝑂2 𝑚𝑎𝑥 ) is dependent on three major systems
(Figure 1): the respiratory system, the cardiovascular system, and muscle metabolism (Wilmore,
1969). Individuals with high maximal oxygen consumption values (i.e. ≥ 90th percentile) usually
show similar and well–coordinated responses as exercise intensity goes from low to maximal
effort (Ekblom & Hermansen, 1968). In healthy people, 𝑉𝑂2 𝑚𝑎𝑥 is primarily determined by the
cardiovascular system’s ability to maintain cardiac output and stroke volume (Brooks, Fahey, &
Baldwin, 2005). In rare situations with elite endurance athletes, the cardiovascular system is so
well developed that, like in elite race horses, arterial desaturation occurs because the rate of
blood passing through the lung exceeds the respiratory gas exchange oxygen uptake transit time
(Powers, Lawler, Dempsey, Dodd, & Landry, 1989). Thus, in these athletes, 𝑉𝑂2 𝑚𝑎𝑥 is limited
by the cardiorespiratory system together (Brooks et al., 2005; Evans & Rose, 1988).

2
Figure 1: Body systems. Integration of bodily mechanisms during
exercise.
The primary focus of this project is to understand the metabolic and physiological
responses to a training modality called “oxygen contrast” training during moderate-to high-
intensity exercise (Wilson & Welch, 1974). Oxygen contrast exercise training involves having a
person exercise for a short duration (i.e. 60 seconds) at approximately 75% of 𝑉𝑂2 𝑚𝑎𝑥 while the
air a subject consumes is at an oxygen concentration representing 10-15,000ft above sea level or
a 𝑃𝑖𝑜2 equal to 99.5mmHg. After completing the interval under reduced oxygen driving
pressures, a person continues the interval (15 seconds additionally) followed by a 2-minute
recovery at 50% of 𝑉𝑂2 𝑚𝑎𝑥 breathing air at 48% oxygen concentration to enhance recovery.
Practitioners believe that with this type of training, individuals can gain the same metabolic and
physiological benefits as performing high-intensity interval training (HIIT) with more resultant
volume. HIIT sessions usually require a person to exercise above their 𝑉𝑂2 𝑚𝑎𝑥 workload by 15-
30% for short periods (10-60seconds) with contrasting active recovery periods (Astorino &

3
Robergs, 2003; Gibala, Little, MacDonald, & Hawley, 2012). Previous research has shown that
HIIT can “serve as an effective alternate to endurance training producing similar or even superior
changes in a range of physiological, performance, and health-related markers in both healthy
individuals and diseased populations” (Gibala et al, 2012, p. 1). The physiological benefits of
HIIT training include increasing the maximal activity of mitochondrial enzymes, reducing
glycogen utilization and lactate accumulation during matched-work exercise, and improving
performance on tasks that rely on aerobic metabolism. Usually, HIIT requires less total training
time compared to high-volume endurance training. However, HIIT can result in similar training
adaptions and performance outcomes (Gibala et al., 2006).
Practitioners of contrast training believe that by using this type of modality in
combination with moderately high-intensity exercise, individuals can display the same benefits
of HIIT workouts, but at a much lower risk for injury. They also believe that contrast training
may have greater applications in people with limited exercise capacity by creating a HIIT-like
training effect while keeping the overall exercise moderate in duration and intensity.
To date, there are no well-controlled oxygen contrast training (OCT) studies
characterizing the acute or chronic metabolic, cardiovascular, and respiratory effects of this
training modality. Thus, the purpose of this thesis is to discover what specific effects oxygen-
contrast HIIT training produces as implemented in sports performance and wellness patients at
the EnergyBar Wellness Center in Naperville, IL.
CHAPTER 2
LITERATURE REVIEW
Physiological Acute Responses to Altitude
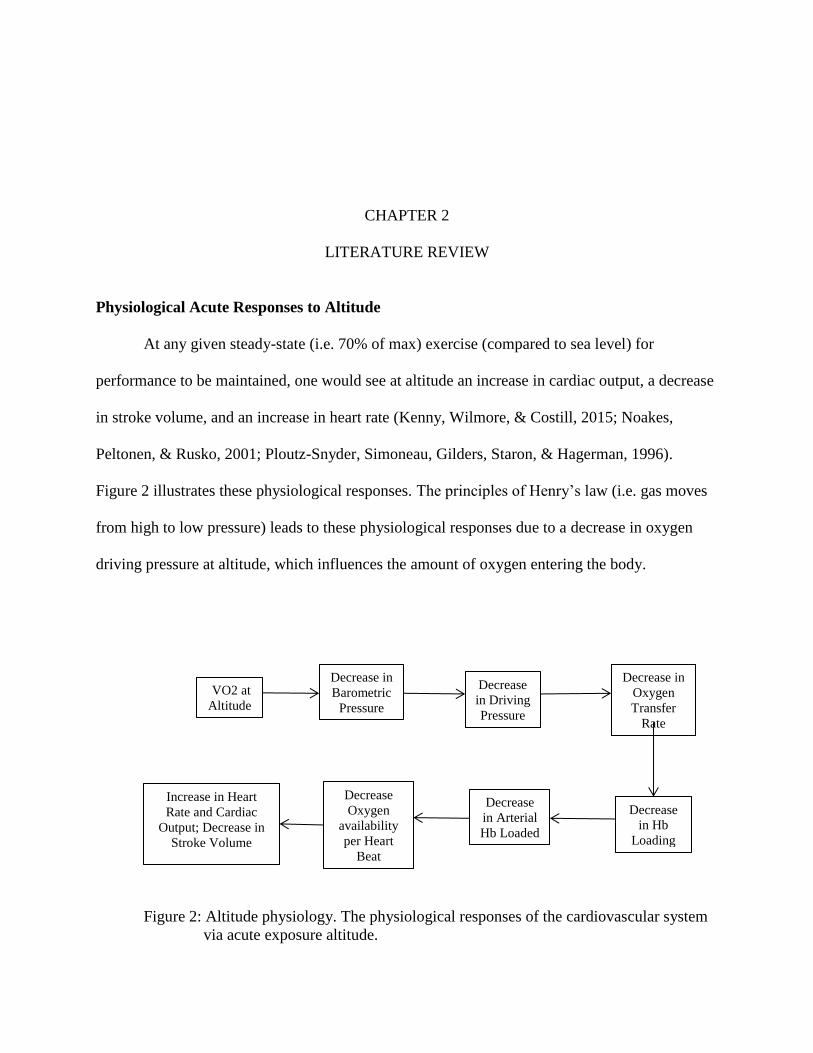
At any given steady-state (i.e. 70% of max) exercise (compared to sea level) for
performance to be maintained, one would see at altitude an increase in cardiac output, a decrease
in stroke volume, and an increase in heart rate (Kenny, Wilmore, & Costill, 2015; Noakes,
Peltonen, & Rusko, 2001; Ploutz-Snyder, Simoneau, Gilders, Staron, & Hagerman, 1996).
Figure 2 illustrates these physiological responses. The principles of Henry’s law (i.e. gas moves
from high to low pressure) leads to these physiological responses due to a decrease in oxygen
driving pressure at altitude, which influences the amount of oxygen entering the body.
Figure 2: Altitude physiology. The physiological responses of the cardiovascular system
via acute exposure altitude.
Increase in Heart
Rate and Cardiac
Output; Decrease in
Stroke Volume
VO2 at
Altitude
Decrease in
Barometric
Pressure
Decrease
in Driving
Pressure
Decrease in
Oxygen
Transfer
Rate
Decrease
Oxygen
availability
per Heart
Beat
Decrease
in Arterial
Hb Loaded
Decrease
in Hb
Loading

5
Sea LevelBarometric Pressure= 760mmHg
4,300m above Sea LevelBarometric Pressure=460mmHg
Figure 3: Partial pressures. Depiction of partial pressures upon exposure to sea level and
altitude’s barometric pressure.
Figure 4: Altitude and partial pressure. Physiological responses to a decrease in
barometric pressure accompanied by an increase in altitude to 4,300m.
Partial
Pressure of
O2
decreased by
63mmHg
Increase
in Lactate
formation
At 70% of
steady state
VO2 max;
Increase in
Anaerobic
metabolism
Partial Pressure
of O2 decreased
58% to 42mmHg
Vs. Sea Level at
100mmHg
Decrease
in pH
Increase
in Ve &
RR to
expel
CO2
6
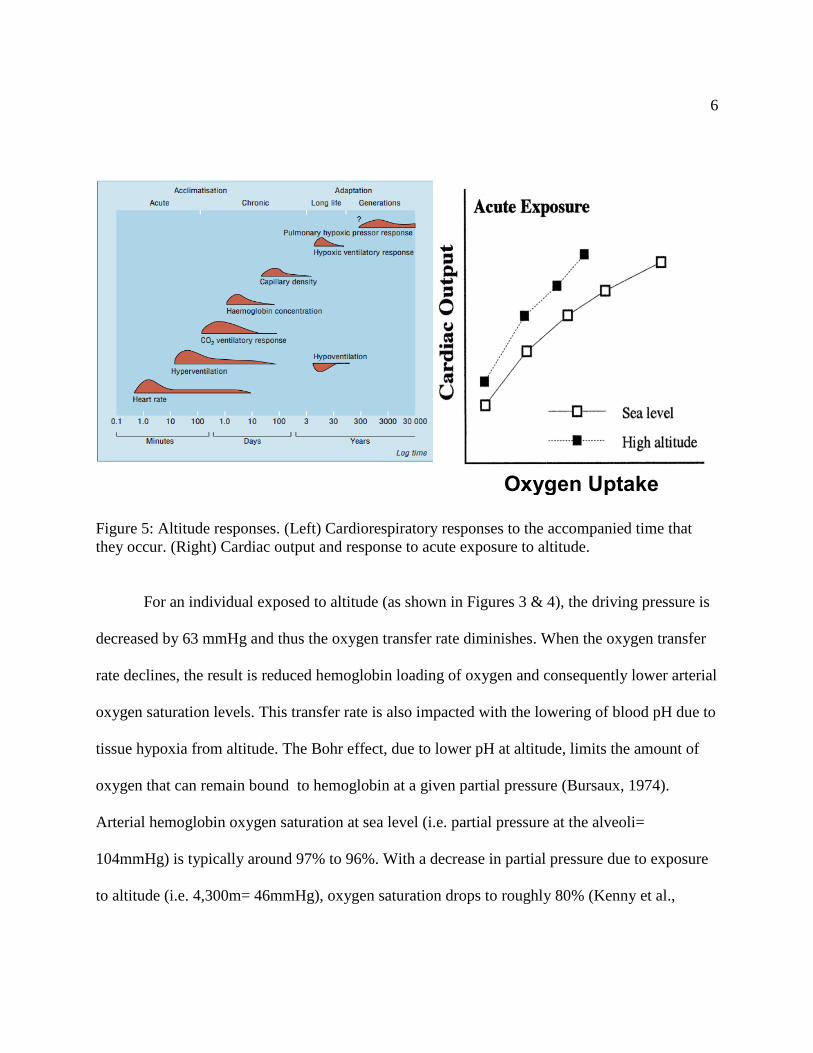
Figure 5: Altitude responses. (Left) Cardiorespiratory responses to the accompanied time that
they occur. (Right) Cardiac output and response to acute exposure to altitude.
For an individual exposed to altitude (as shown in Figures 3 & 4), the driving pressure is
decreased by 63 mmHg and thus the oxygen transfer rate diminishes. When the oxygen transfer
rate declines, the result is reduced hemoglobin loading of oxygen and consequently lower arterial
oxygen saturation levels. This transfer rate is also impacted with the lowering of blood pH due to
tissue hypoxia from altitude. The Bohr effect, due to lower pH at altitude, limits the amount of
oxygen that can remain bound to hemoglobin at a given partial pressure (Bursaux, 1974).
Arterial hemoglobin oxygen saturation at sea level (i.e. partial pressure at the alveoli=
104mmHg) is typically around 97% to 96%. With a decrease in partial pressure due to exposure
to altitude (i.e. 4,300m= 46mmHg), oxygen saturation drops to roughly 80% (Kenny et al.,
Oxygen Uptake
7
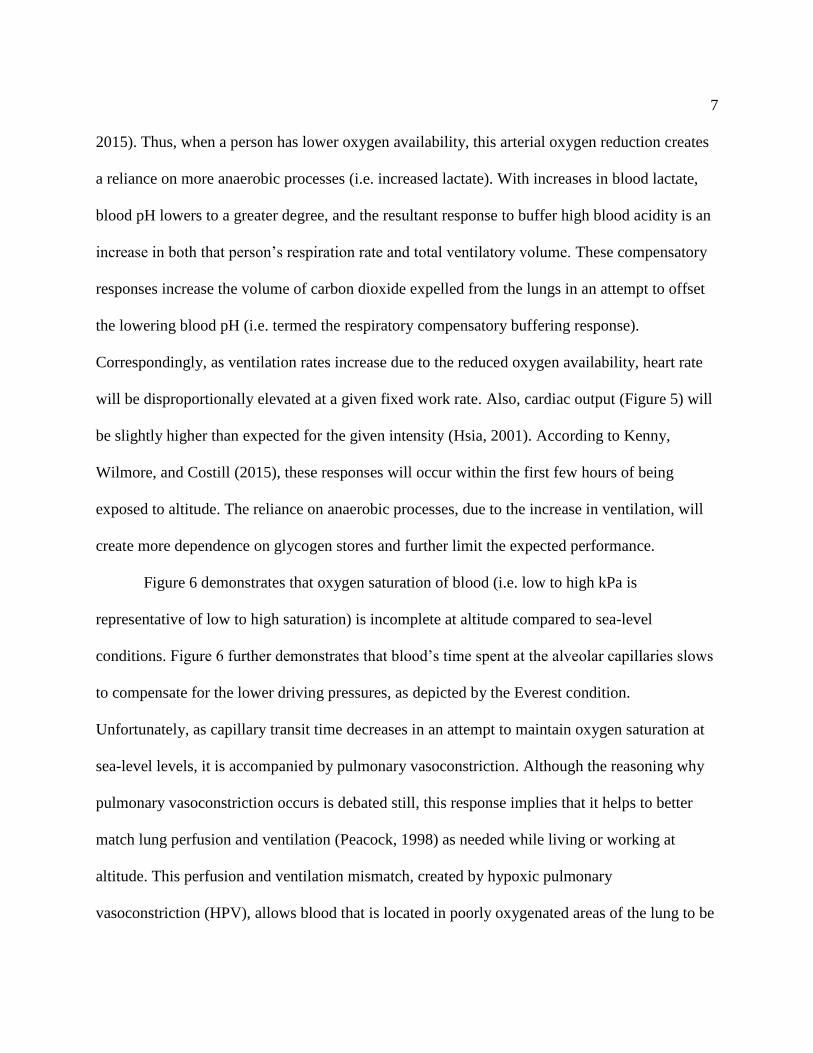
2015). Thus, when a person has lower oxygen availability, this arterial oxygen reduction creates
a reliance on more anaerobic processes (i.e. increased lactate). With increases in blood lactate,
blood pH lowers to a greater degree, and the resultant response to buffer high blood acidity is an
increase in both that person’s respiration rate and total ventilatory volume. These compensatory
responses increase the volume of carbon dioxide expelled from the lungs in an attempt to offset
the lowering blood pH (i.e. termed the respiratory compensatory buffering response).
Correspondingly, as ventilation rates increase due to the reduced oxygen availability, heart rate
will be disproportionally elevated at a given fixed work rate. Also, cardiac output (Figure 5) will
be slightly higher than expected for the given intensity (Hsia, 2001). According to Kenny,
Wilmore, and Costill (2015), these responses will occur within the first few hours of being
exposed to altitude. The reliance on anaerobic processes, due to the increase in ventilation, will
create more dependence on glycogen stores and further limit the expected performance.
Figure 6 demonstrates that oxygen saturation of blood (i.e. low to high kPa is
representative of low to high saturation) is incomplete at altitude compared to sea-level
conditions. Figure 6 further demonstrates that blood’s time spent at the alveolar capillaries slows
to compensate for the lower driving pressures, as depicted by the Everest condition.
Unfortunately, as capillary transit time decreases in an attempt to maintain oxygen saturation at
sea-level levels, it is accompanied by pulmonary vasoconstriction. Although the reasoning why
pulmonary vasoconstriction occurs is debated still, this response implies that it helps to better
match lung perfusion and ventilation (Peacock, 1998) as needed while living or working at
altitude. This perfusion and ventilation mismatch, created by hypoxic pulmonary
vasoconstriction (HPV), allows blood that is located in poorly oxygenated areas of the lung to be

8
shunted to areas of high oxygenation, and thus improvement of alveoli efficiency (Moudgil,
Michelakis, & Archer, 2005). This increase of vasoconstriction increases the pulmonary arterial
pressure (PAP) and increases the likelihood of pulmonary edema (Bärtsch & Gibbs, 2007;
Peacock, 1998). This effect, though, is reversed immediately upon return to sea-level barometric
pressure (Moudgil et al., 2005). As seen in Figure 6, the transient time to saturation is severely
elongated and incomplete with higher altitudes. This response contributes to the limitations of
performance as previously discussed.
Figure 6: Incomplete saturation. Depiction of an acute response to hypoxic pulmonary
vasoconstriction (HPV) and its effect on oxygen transfer rate.
Acute Responses of Interval Training
Interval training as defined by the American College of Sports Medicine (ACSM, 2014),
involves varying exercise intensity and duration at fixed intervals during a single exercise bout.
The duration and intensity of the intervals can be varied depending on the goals of the training
9
session and physical fitness level of the subject. Therefore, duration and intensity are the
determinants of the physiological acute responses that occur during the said exercise bout. These
two factors are inversely related. This allows for intensity during the exercise to be high with low
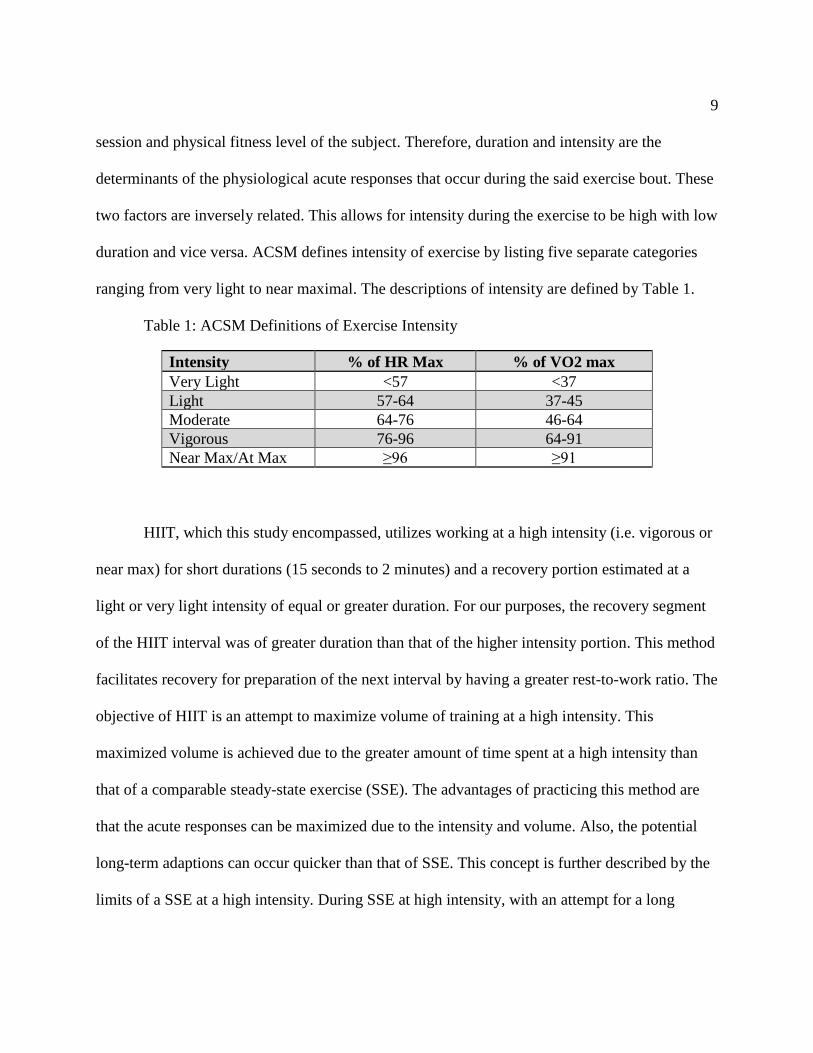
duration and vice versa. ACSM defines intensity of exercise by listing five separate categories
ranging from very light to near maximal. The descriptions of intensity are defined by Table 1.
Table 1: ACSM Definitions of Exercise Intensity
Intensity % of HR Max % of VO2 max
Very Light <57 <37
Light 57-64 37-45
Moderate 64-76 46-64
Vigorous 76-96 64-91
Near Max/At Max ≥96 ≥91
HIIT, which this study encompassed, utilizes working at a high intensity (i.e. vigorous or
near max) for short durations (15 seconds to 2 minutes) and a recovery portion estimated at a
light or very light intensity of equal or greater duration. For our purposes, the recovery segment
of the HIIT interval was of greater duration than that of the higher intensity portion. This method
facilitates recovery for preparation of the next interval by having a greater rest-to-work ratio. The
objective of HIIT is an attempt to maximize volume of training at a high intensity. This
maximized volume is achieved due to the greater amount of time spent at a high intensity than
that of a comparable steady-state exercise (SSE). The advantages of practicing this method are
that the acute responses can be maximized due to the intensity and volume. Also, the potential
long-term adaptions can occur quicker than that of SSE. This concept is further described by the
limits of a SSE at a high intensity. During SSE at high intensity, with an attempt for a long
10
duration, fatigue occurs quickly due to physiological limits, and thus the adaptions that occur as
a result of working at the said intensity are minimized compared to HIIT (ACSM, 2014).
The acute responses that occur during a HIIT session can be manipulated in a variety of
ways. These responses can vary by changing the peak workload, peak workload duration,
recovery workload, recovery workload duration, or mean workload. High peak workloads (i.e.
95% of max oxygen consumption) and long durations (i.e. 4 min intervals; 4 min recovery) at the
prescribed workload produce a higher peak response of heart rate and lactate levels contrasted to
short duration HIIT (i.e. 20 second intervals) and SSE (i.e. SSE mean workload equivalent to
mean workload of both HIIT scenarios) (Tschakert et al., 2015). This response coincides with the
findings that mean workload (i.e. duration and intensity) is the sole determinant of acute
cardiorespiratory responses (ACSM, 2014; Åstrand, Åstrand, Christensen, & Hedman, 1960;
Tschakert & Hofmann, 2013). Figure 7 graphically illustrates and Table 2 quantifies the response
of heart rate (HR) and lactate (La) during these three protocols. Therefore, the conclusion of
these findings is that longer duration HIIT intervals exhibit anaerobic responses, and conversely,
aerobic responses for short duration HIIT intervals (Tschakert et al., 2015; Wallner, Simi,
Tschakert, & Hofmann, 2014). The rationale behind the determination of anaerobic or aerobic
work, in which intervals are classified, is whether the lactate accumulation can be cleared during
a recovery portion of an interval (Christensen, Hedman, & Saltin, 1960). The determinant of the
La accumulation rate is defined by the peak workload of the interval and creation is defined by
the time at the said peak workload (Tschakert & Hofmann, 2013). The Tschakert study protocol
of a longer, then typical, duration HIIT (i.e. 4 minutes at 95% of 𝐻𝑅𝑚𝑎𝑥 in watts during interval

11
segments and 4 minutes at 70% of 𝐻𝑅𝑚𝑎𝑥 in watts during recovery segments) mimics the
responses that will potentially be observed, as later discussed in our study description below.
Figure 7: HIIT physiology. Heart rate and lactate during differing HIIT and steady-state
protocols (CE is defined as SSE).
Another facet of the Tschakert study was the significant difference in peak HR for longer
duration HIIT protocols (Table 2). What is also important to note is that mean HR stays
relatively low (i.e. with respect to long duration HIIT) for SSE and short-duration HIIT due to a
short duration at peak workload. This is extremely important because the peak HR of both these
two protocols was similar, but the peak workload was higher. This result allows for individuals

12
to gain the long-term cardiovascular adaptions that occur after higher workloads with reduced
stress and a more efficient use of time (Åstrand et al., 1960; Burgomaster et al., 2008; Meyer et
al., 1997). The implementation of this response via short-duration HIIT trials is currently being
used in diseased populations for rehabilitation, as a substitute for SSE (Meyer et al., 1997;
Tschakert & Hofmann, 2013; Tschakert et al., 2015).
Table 2: HIIT physiology data. Responses to exercise of three different protocols (also
represented by Figure 7). CE is defined as SSE.
Although this trend that was described above in relation to HR, La, duration, and
intensity is established, there is inadequate research completed on longer duration intervals
above lactate steady state (LaSS), which this study sought to understand (Tschakert et al., 2015).
The majority of the research on HIIT encompasses improvements in maximal oxygen
consumption, not acute cardiovascular and metabolic responses (Daussin et al., 2008; Helgerud
et al., 2007; Tschakert et al., 2015). These acute responses are of great importance to be
researched due to the strong likelihood of them determining the particular muscular and systemic
adaptations (healthy and diseased populations) that take place over the course of a training
regimen. These responses also help display the potential health risks and benefits to individuals

13
while performing this type of exercise (Hawley, 2004, 2008; Meyer et al., 1997; Rognmo et al.,
2012; Tschakert et al., 2015).
Physiological Acute Responses to Altitude and Intervals
The acute individual responses to altitude and HIIT physiologically, as discussed
previously, are amplified when the two said conditions are implemented together with respect to
perceived maximal intensity. The conditions of this study aim to present hypoxia (i.e. low
oxygen driving pressure) during the interval portion of HIIT and present hyperoxia (i.e. high
oxygen driving pressure) during the recovery portion of HIIT. Also, normobaric (i.e. sea-level)
conditions were used in order to compare oxygen deprivation versus oxygen hyperoxia after the
physiological responses of this study’s HIIT protocol’s effect on each subject. These
combinations helped to establish a knowledge based upon which further research may be
conducted, since the literature on the matter is limited (Ploutz-Snyder et al., 1996).
While working at an interval of the present study (i.e. 75% of 𝑉𝑂2 𝑚𝑎𝑥 in watts), the
added hypoxia should result in amplified responses (i.e. simulating near or above max) in
comparison to normobaric conditions. The acute responses that should be seen under the hypoxic
condition of the HIIT are increases in cardiac output (i.e. increase in HR and decrease in SV) and
reliance on more anaerobic processes. These effects result in higher lactate (La) levels, lower pH,
increased ventilatory compensation, and increased resulting fatigue perception (i.e. increased
RPEs during the HIIT trials with hypoxia) (Hill, Long, & Lupton, 1924; Noakes et al., 2001;
Ploutz-Snyder et al., 1996). The low driving pressure from the hypoxic environment has a

14
pronounced detriment on arterial saturation of oxygen. This response, as outlined in Figure 2,
will allow for the intensity of the exercise to arise to perceived maximal levels, although working
at 75% of 𝑉𝑂2 𝑚𝑎𝑥 during an interval segment (Wilson & Welch, 1974). Few studies have
researched the acute effects of hypoxia and HIIT, but recently many studies have begun to
understand the long-term adaptions (i.e. 2 to 4 weeks) associated with this type of training (i.e.
pro-inflammatory cytokines increase, increase in capillarization, and heart remodeling) (Faiss,
Girard, & Millet, 2013; Faiss et al., 2015; Richardson & Gibson, 2015; Richardson, Relf,
Saunders, & Gibson, 2016). These studies lay out the inherent need to understand and study the
acute responses of HIIT and hypoxia that create these long-term adaptions.
During recovery of a HIIT interval (i.e. 50% of 𝑉𝑂2 𝑚𝑎𝑥 in watts) for our study, a subject
experienced either a hyperoxic or normobaric condition. The protocol for the current study is
outlined in the next chapter. This recovery segment of the HIIT protocol allowed for the
responses brought on by hypoxia and HIIT to decrease (i.e. recover) until the onset of the next
HIIT interval. The responses observed should indicate that an improved recovery will occur with
the implementation of hyperoxia, then that of a normoxia (i.e. sea level). Observations that
should be seen with the added hyperoxia, contrasted against similar intervals of the alternative
condition of recovery (i.e. normoxia; sea level), are a lower RPE (i.e. rating of perceived
exertion), lower lactate levels, decreased heart rate, decreased cardiac output, and higher muscle
oxygen saturation. The physiological interpretation behind these responses are simply due to a
greater concentration of oxygen within the arterial blood supply, leading to a reduction of blood
being pumped and lower levels of lactate creation.

15
The amount of oxygen supplementation needed to produce responses, previously
discussed, has been researched by numerous studies. A study conducted by Wilson and Welch in
1974 found significance to implicate that at least 40% concentration of supplemental oxygen (i.e.
hyperoxic environment) allows for increased performance in regard to duration of the exercise
(18% increase). Significant reductions in ventilation were also observed at the same work rate
under the hyperoxic condition compared to normobaric conditions, implying increased arterial
oxygen saturation. These findings suggest that the hyperoxia condition reduced the physiological
metabolic demand of the HIIT workload. Consequently, as expected, each subject perceived the
HIIT exercise as less intense, allowing them to complete more HIIT intervals. It was concluded
that the increased exercise duration seen in Wilson and Welch’s study was primarily related to
the greater arterial oxygen saturation stimulated by the supplemental oxygen condition. This
finding was so significant that other studies have built upon this and used it in conjunction with
HIIT (Linossier et al., 2000; Morris, Kearney, & Burke, 2000). Morris, Kearney, and Burke,
demonstrated that power outputs improved with the increase in supplemental oxygen (i.e.
hyperoxia), and thus training at a higher intensity could be obtained. Linossier et al., (2000),
demonstrated the metabolic impact of hyperoxia (60% oxygen concentration) during maximal
cycling exercise. Their results showed glycogen depletion was significantly greater and lactate
accumulation was less than normoxia (i.e. 21% oxygen). The data suggests that a higher
oxidation rate for pyruvate and NADH in mitochondria exists, which allows for a lower
metabolic acidosis (i.e. better functioning of the glycolitic processes that delays time to
exhaustion). This study showed a 38% improvement in time to exhaustion under hyperoxia.
CHAPTER 3
METHODS
Subject Demographics
Nine healthy subjects with fitness levels exceeding the 50th percentile of maximal oxygen
consumption (i.e. Female > 37.8ml/kg/min for 50 yrs. of age; Male >43.9ml/kg/min for 50 yrs.
of age) were recruited to participate in this study (ACSM, 2014). Exclusions for participants was
anyone who was outside of the testing age range (i.e. 18-50 years of age), currently had an
implanted pacemaker, pregnant or expecting women, medical history of cardiovascular disease,
currently had cardiovascular disease, and did not meet the 50th percentile of maximal oxygen
consumption.
Subject Qualification Process
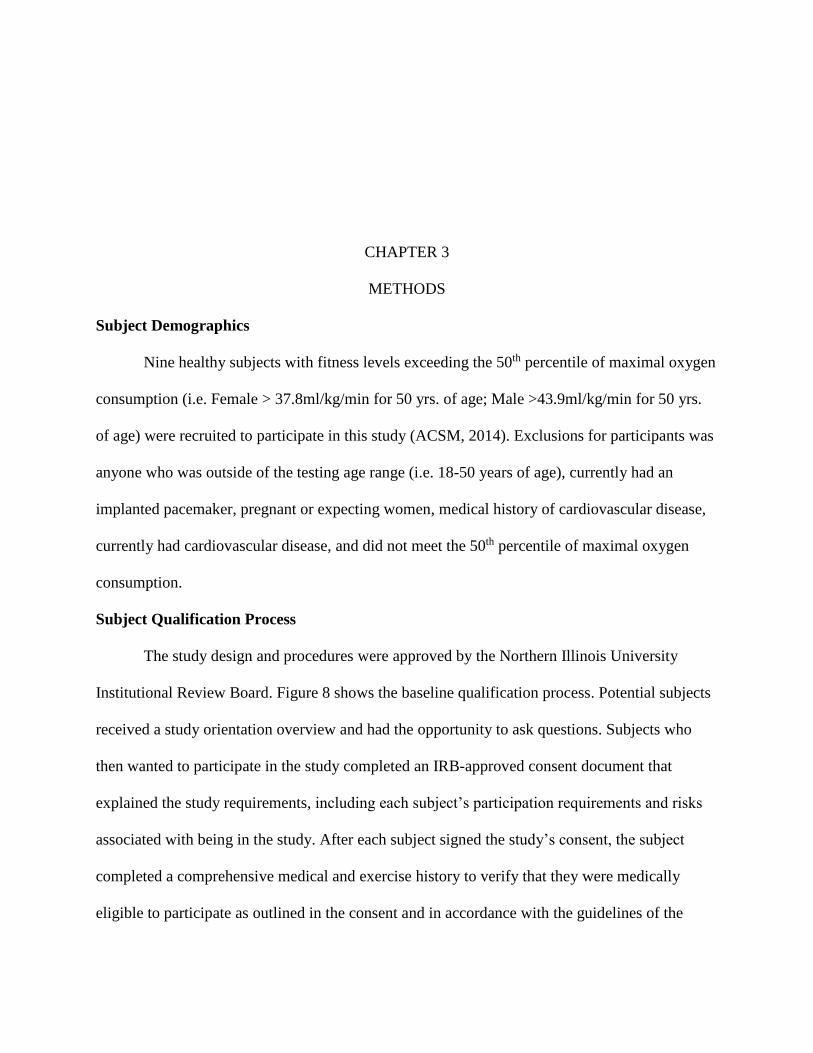
The study design and procedures were approved by the Northern Illinois University
Institutional Review Board. Figure 8 shows the baseline qualification process. Potential subjects
received a study orientation overview and had the opportunity to ask questions. Subjects who
then wanted to participate in the study completed an IRB-approved consent document that
explained the study requirements, including each subject’s participation requirements and risks
associated with being in the study. After each subject signed the study’s consent, the subject
completed a comprehensive medical and exercise history to verify that they were medically
eligible to participate as outlined in the consent and in accordance with the guidelines of the
17
American College of Sports Medicine. Although specific subject characteristics (i.e. height,
weight, and body composition) were not required to meet qualification standards, these variables
were measured on each subject during the baseline screening process. These demographic
variables were used to describe the study’s participant’s general physical characteristics (i.e.
percent body fat to lean muscle mass ratio). Each subject completed a standardized cycling-based
maximal oxygen consumption test to ensure each subject met or exceeded the main inclusion
criteria for the 𝑉𝑂2 𝑚𝑎𝑥 50th percentile for their age and gender.
Figure 8: Baseline data qualification procedure.
Experimental Design
All testing was performed at Exercising Nutritionally’s physiology performance
laboratory in Lisle, IL. The testing sequence was comprised of three treatment sessions and two
rest days (Figure 9). Sessions A and C used a randomized matched pair design. Session B was
always the second treatment session. For example, a typical match pairing was as follows:
Subject 1-Treatment Order = ABC and Subject 2-Teatment Order = CBA.

18
Figure 9: Testing performance sequence.
For this study, the comparisons of the three sessions was the basis by which our
conclusions were made. The test sequence allowed us to demonstrate the physiological responses
that occur when working at altitude compared with sea-level conditions and the strain that is
placed upon the body. The sequence also allowed us to see if the responses and strains of the
altitude can be mitigated by the supplementation of oxygen (i.e. 48%) during recovery compared
to recovery at sea-level conditions.
19
Oxygen Contrast and HIIT Trial
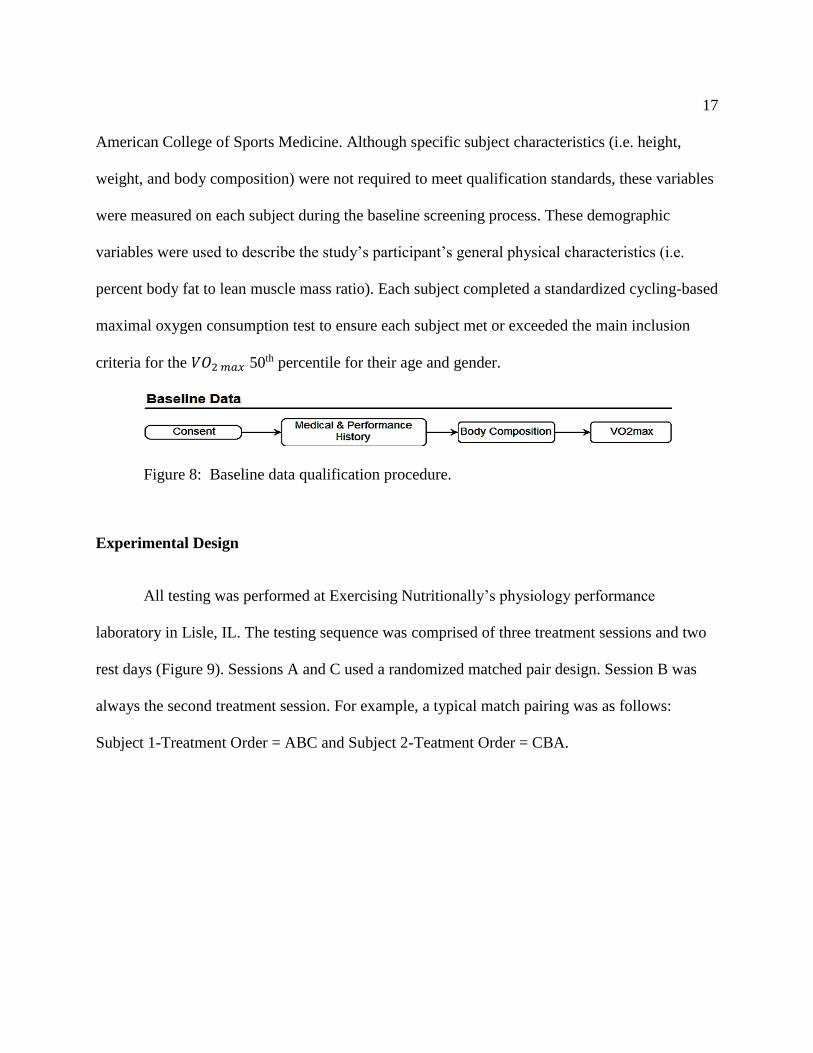
Figure 10 and Table 3 illustrate the specific implementation of each session and the
variables that were examined. Figure 11 depicts the LiveO2 oxygen contrast simulation machine
and setup.
Figure 10: Individual session explanation. Session A: Altitude with Hyperoxia
Recovery, Session B: Sea-Level Verification of Intensity, Session C:
Altitude with Sea-Level Recovery.

20
Table 3: Experimental variables. List of variables measured during all HIIT sessions † - When using the altitude simulation system, a subject cannot be measured simultaneously using a
metabolic cart system. Thus, the variables were not directly measured.
Variables to be measured during HIIT sessions A B C
Volume of Oxygen Consumption (ml/kg/min) † x
-efficiency of the body; cardio, respiratory, metabolism
Heart Rate (b/min) x x x
-definition of intensity
Ventilatory Threshold† x x x
-indication of increased lactate production
Muscle Oxygen Saturation Percent x x x
-quantifies demands and supply of oxygen
Muscle Hemoglobin Levels x x x
-quantifies blood flow to the area of work
Blood Lactate x x x
-quantifies anaerobic glycolysis
Cardiac Output, Stroke Volume, Total Peripheral Resistance x x x
-displays intensity and efficiency of the cardiovascular system
Ventilation x
-increases to accommodate metabolism and lactate build-up
Watts x x x
-increase in intensity for exercise
Time/ Number of Intervals x x x
-explains the outcomes of trials
Figure 11: LiveO2 oxygen contrast simulator setup.

21
Baseline Data: 𝑽𝑶𝟐 𝒎𝒂𝒙 Design and Protocol
𝑉𝑂2 𝑚𝑎𝑥 was assessed using a standardized cycling protocol on a Monark cycle
ergometer (Model #: LC4) as outlined in Table 4.
Table 4: Maximal oxygen consumption study protocol
Stage Watts Time (min)
0 0 0:00
1 25 1:00
2 50 2:00
3 75 3:00
4 100 4:00
5 125 5:00
6 150 6:00
7 175 7:00
8 200 8:00
9 225 9:00
10 250 10:00
11 275 11:00
12 300 12:00
13 325 13:00
14 350 14:00
15 375 15:00
During the 𝑉𝑂2 𝑚𝑎𝑥 test, each subject’s heart rate, VO2, RER, ventilatory response,
cardiac output, stroke volume, total peripheral resistance, regional muscle oxygenation, and total
hemoglobin were measured. Moxy near-infrared sensors (i.e. measures regional muscle oxygen
saturation (SMO2) and total regional hemoglobin (THb) concentrations) were placed over the
midpoint of each subject’s medial left and right leg quadricep muscle to determine oxygen
saturation changes and break points. Along with the leg sensors, a single Moxy sensor was
placed the right carotid artery upon the neck to measure oxygen and blood flow to the brain (i.e.
data to supplement the safety of the experiment). Previous research has shown that oxygen
saturation break points can accurately predict a person’s true lactate threshold (Perry et al.,

22
2017). Each subject was fitted for a Hans Rudolph, Inc., V2 maximal oxygen consumption mask
connected to a Korr metabolic cart (i.e. VO2, RER, and ventilatory response). The Korr
metabolic cart was calibrated as recommended by the manufacturer. The PhysioFlow PF-05
advanced impedance cardiac output measurement system was used to collect cardiac function
data (i.e. heart rate, stroke volume, cardiac output, and total peripheral resistance (TPR)). This
unit is a non-invasive cardiac monitoring system which provides hemodynamic parameters by
measuring thoracic heart blood volumes using advanced electrical bioimpedance signal changes
synced to each heart beat’s ventricular activation (QRS wave). A back-up monitoring device for
heart rate was also used (i.e. MYZONE MZ-3 heart rate chest monitor). Subjects began the
prescribed warm-up upon completion of pre-trial preparation. The prescribed warm-up for the
𝑉𝑂2 𝑚𝑎𝑥 test required cycling on a Monark cycle ergometer for 10 minutes at subject self-
selected wattage and RPMs. Testing ensued upon completion of the warm-up and ended at
volitional fatigue.
The data obtained after the conclusion of the maximal oxygen consumption test was used
to establish each subject’s OCT intensities. During each of the OCT sessions, subjects performed
the 75-second HIIT segments at the wattage equal to 75% of a subject’s respective 𝑉𝑂2 𝑚𝑎𝑥.
Each subject’s recovery intensity was at 50% of his or her 𝑉𝑂2 𝑚𝑎𝑥 wattage. Physiological
variables associated at these selected intensities (e.g., cardiac output, stroke volume, oxygen
saturation, & heart rate) were key performance markers by which all subsequent trials were
evaluated, since VO2 cannot be measured during Trials A and C.
The setup of oxygen contrast simulator (Live O2 Altitude Simulator) when used during
trials A and C, simulating high altitude and to deliver oxygen recovery loads, was adapted from

23
manufactures specifications regarding the mask worn. The mask provided by the manufacture
would not coincide with the Korr unit and did not allow for a closed system between the Live O2
simulator and the subject. Instead of the manufacture’s mask, the Hans Rudolph mask with Korr
attachments was used for all sessions. This also allowed for the subject to have consistent
conditions (i.e. pressure on the face, resistance of flow, volume and specifications within the
mask) across all trials. Since the direct metabolic and ventilatory measurements cannot be taken
at during sessions A and C because of altitude, hyperoxia, and the measurement with the
metabolic cart, prediction of VO2 had to be made. The comparison of the overall physiological
strain of each respective treatment session was quantified by the primary variables monitored
across all trials such as cardiac output, stroke volume, heart rate, and SMO2-THb at both the
active muscle (medial quad) and neck (right carotid artery). In addition, blood lactate was
measured prior to the start of each trial and immediately after completing the recovery period to
further assess each trial’s physiological responses. Previous research with the PhysioFlow system
had demonstrated that this system can accurately assess exercise intensity during submaximal
exercise in relationship to metabolic demand measured by direct oxygen uptake at the same
exercise intensities in the current study (Broeder, Hickok, & Burditt, 2009). For example,
Broeder et al. (2009) showed that the measurement of cardiac output using the PhysioFlow
system in a linear regression had a R-squared value equal to 0.998 with respect to the direct Fick
equation. The intensities of 25%, 50% and 75% of max effort were verified and indicated the
PhysioFlow system can accurately quantify the HIIT training session with respective
physiological demands induced during the high-altitude HIIT and oxygen-contrasting protocols
compared to the control trial at sea level (see Figure 12). Each subject’s trial exercise loads

24
during HIIT cycle ergometer sessions were derived directly from the linear relationship between
external workload demand set on the cycle ergometer (watts per stage) and each person’s oxygen
uptake response to that work rate as shown in Figure 13 and estimated wattages in Table 5.
Figure 12: Results of Broeder et al. (2009). Reliability of Q correlating with VO2
intensities.
Figure 13: Intensity prediction. Prediction of interval and recovery wattages for Sessions A, B,
and C.
25
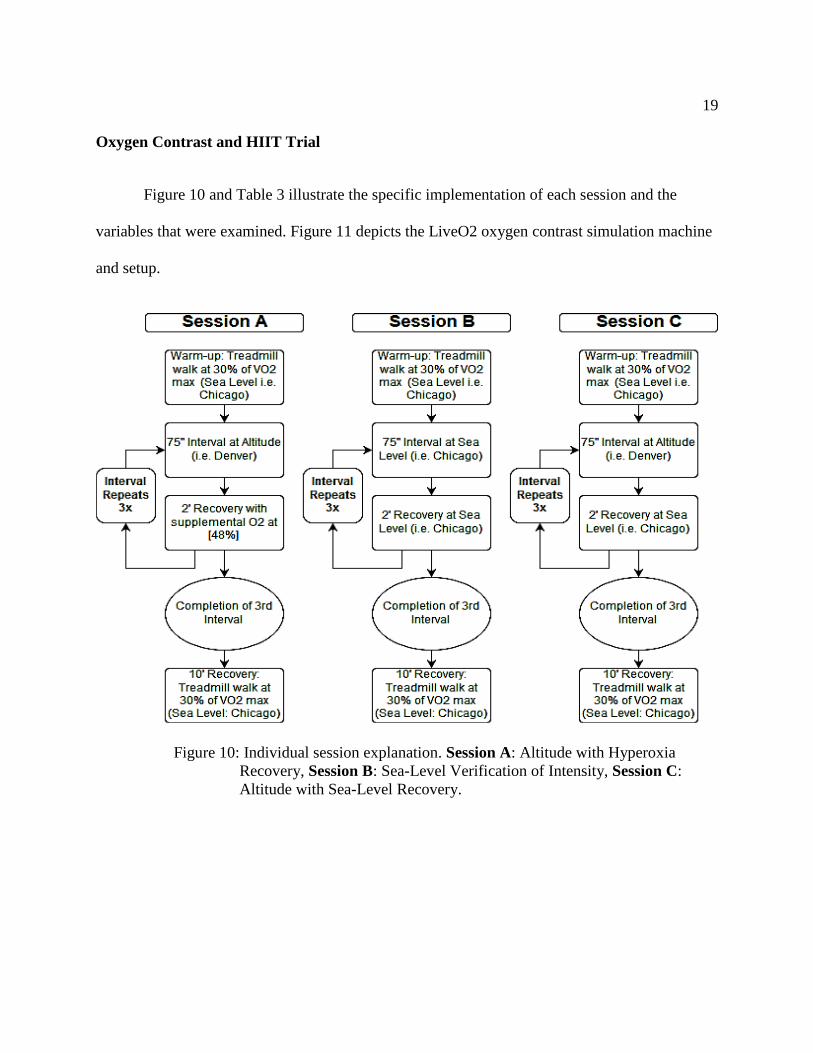
Table 5: Estimated wattages for Sessions A, B, and C. Wattages are rounded to the
nearest 5 watts.
HIIT Interval Session Technology Preparation Description
Prior to starting each HIIT interval session, a Moxy SMO2 sensor was placed at the
following locations to assess changes in oxygen saturation and THb changes: right quadriceps,
left quadriceps, and right carotid artery. Sensor placement allowed direct comparisons of oxygen
saturation (SMO2) and THb changes in the muscle directly involved in the cycling exercise
(quadricep) and saturation of blood headed to the brain for safety under each testing condition.
These comparisons helped distinguish how the altitude simulation and oxygen contrasting affect
the working muscle and the vitals of the brain. After proper cleansing skin preparation, several
PhysioFlow EKG pads was placed on each subject for PhysioFlow data collection process as
shown in Figure 14. A MY-Zone Heart Rate monitor was placed on each subject as a heart rate
back-up. Finally, each subject was fitted for Hans Rudolph masks to ensure a snug fit around the
face prior to starting the HIIT interval sessions but not be placed on each subject until after the
warm-up period was completed.
Max 75% 50% 30%
VO2 50 37.5 25 15
Wattage 300 205 120 55
VO2 and Wattage Establishment

26
Figure 14: PhysioFlow electrode placement.
The LiveO2 oxygen contrast simulator was implemented for the duration of sessions A
and C. Figure 15 depicts the completed setup of the testing setup. The main mechanism of the
machine that allowed for storage of supplemental oxygen within the LiveO2 bag utilized a
nitrogen extraction filter. The filtration process utilized a fan that pulls air within the unit and
does not allow for the larger molecules of nitrogen to diffuse through the filter, only allowing the
smaller oxygen molecules to enter the Live O2 bag. The system remained on throughout the
sessions to ensure adequate supplemental oxygen was available for use. This also ensured that
oxygen escape via backflow through the nitrogen filter would be minimized. The LiveO2 bag
was connected to the Hans Rudolph facemask, similar of that used for standard metabolic testing.
This mask surrounded the nose and mouth as shown in Figure 14. This allowed for a closed
system between the subject and the bag (i.e. no ambient air or normoxia influences occur). With
the aid of a contrasting switch located on the bag, a deprivation (i.e. altitude) or supplementation
simulation mode could be switched on. This mode closes off the supplemental oxygen
compartment and directs the subject’s inhalable air to the smaller attached compartment within

27
the same closed system. As breathing progresses from this compartment, the driving pressure of
oxygen decreases similar to the process of ascending to altitude. This process occurs due to the
size of the compartment and the amount of oxygen being pumped into the compartment. The
physiological challenges to the subject when the altitude simulation chamber is activated is equal
to the subject exercising in Aspen, CO.
Figure 15: Project setup. LiveO2 oxygen contrast and altitude simulation setup.
Prior to starting each training session, each subject performed a standardized warm-up
period before beginning the oxygen-contrasting interval trial segments. The warm-up was
executed at 30% of 𝑉𝑂2 𝑚𝑎𝑥 in watts for 10 minutes on the Monark cycle ergometer. This warm-
up period was completed under normal sea-level conditions. After the warm-up period was

28
completed, the Hans Rudolph mask was applied and the experimental protocol began. When the
HIIT protocol had been completed, a cool-down session was completed at the same exercise
intensity as the warm-up (i.e. 30% of 𝑉𝑂2 𝑚𝑎𝑥 for 10 minutes on a cycle ergometer) to ensure
recovery from the physiological strain of altitude and HIIT.
Session A: Altitude with Hyperoxia Recovery
During Session A, each subject performed the HIIT cycle ergometer protocol under the
conditions of altitude and supplemental oxygen recovery. The HIIT altitude simulation (LiveO2
altitude simulation unit) segment mimicked the oxygen driving pressure of Aspen, CO, and
lasted 75 seconds. After completing the altitude-based interval, each subject completed a 2-
minute recovery period with supplemental oxygen (i.e. 48%). Altogether, each subject completed
three HIIT recovery combinations as described above. Refer to Figure 10 and Table 3 for a
session overview and a complete list of the variables collected.
Session B: Sea-Level Verification of Intensity
During Session B, each subject performed the HIIT cycle ergometer protocol under
normal sea-level conditions (i.e. Chicago, IL: 21% Oxygen saturation) for the interval (75
seconds) and recovery segments (2 minutes). This session was implemented to be used as a
control condition for comparison of the experimental variables. No matter the treatment order
assigned, Session B was always performed second to verify the intensities established from the
baseline 𝑉𝑂2 𝑚𝑎𝑥 test. Each subject was asked to complete three of the HIIT intervals and
recoveries under the conditions described above.

29
Session C: Altitude with Sea-Level Recovery
During Session C, each subject performed the HIIT cycle ergometer protocol under the
conditions of altitude and sea-level recovery. The HIIT altitude simulation (LiveO2 altitude
simulation unit) segment mimicked the oxygen driving pressure Aspen, CO, and lasted for 75
seconds. After completing the altitude-based interval, each subject completed a 2-minute
recovery segment without supplemental oxygen (Sea Level Condition, Chicago) contrary to
Session A. (i.e. Chicago, IL). Since, normal ambient conditions cannot be applied through the
LiveO2 system, each subject had the hose connected to the mask removed for the recovery
segment. This opened the closed system and allowed for the sea-level conditions to occur. The
hose was reconnected immediately prior at the start of the next HIIT interval. Each subject was
asked to complete three of the HIIT intervals and recoveries under the conditions described
above.
Data Processing and Statistical Analysis
Each subject’s trial data was stored in a secure ENLLC cloud server system. The trial
data was postprocessed so that the total physiological demands of HIIT and recovery session
could be compared across all three treatment sessions. Metabolic and physiological data for each
session’s mean full HIIT interval, mean HIIT last 15 seconds, full recovery, and recovery last 15
seconds data were compared between each treatment condition (i.e., sea level only, exercise at
altitude with supplemental oxygen recovery, and exercise at altitude without supplemental
oxygen). In addition, the metabolic and physiological effects of each HIIT session were
compared across each treatment condition comparing similar time points (see Figure 16).

30
Figure 16: Statistical analysis. A sample of the within and between data variable comparisons for
statistical analysis reporting.
Demographic and summary data are presented as the mean, standard deviation, and the
minimum/maximum values. A 3 X 3 repeated-measures ANOVA procedure were used to
analyze variables within and across each trial. When the ANOVA procedures identified a
significant main effect, an orthogonal pair-wise post-hoc procedure will be used to identify its
location (i.e., within a given trial period or between a give segment across the three treatments).
For those comparisons identified as statistically significant following the post-hoc processing,
Cohen’s effect size procedures were used to quantify the overall strength of the comparison
found to be significant. Effect size is considered good practice and helps facilitate the
interpretation of the importance of a statistical finding, as opposed to simply stating that a given
comparison is statistically significant. Effect size strength was defined as follows: small ≤ 0.20-
0.50, medium = 0.51 to 0.79, and large ≥ 0.80 (Cumming & Finch, 2001).

CHAPTER 4
STUDY HYPOTHESES
Hypothesis 1–We hypothesized that the physiological responses of Session A (i.e. altitude
intervals with supplemental O2 recoveries) in comparison to the same time points of Sessions B
and C will exhibit the trends in Table 6.
Hypothesis 2 – We hypothesized that the physiological responses of Session C (i.e. altitude
intervals with sea-level recoveries) in comparison to the same time points of Sessions A and B
will exhibit the trends in Table 6.
Hypothesis 3 – We hypothesized that the physiological responses of Session B (i.e. sea-level
intervals with sea-level recoveries) in comparison to the same time points of sessions A and C
will exhibit the trends in Table 6.
Hypothesis 4 – We hypothesized that the verbalized RPE after the completion of Session C will
be at or near max (i.e. Borg scale 18-20) compared to the RPE of Session A.
Hypothesis 5– We hypothesized that the measured intensity (i.e. heart rate, cardiac output, post-
session lactate) of Session C will be at or near maximal values despite standardized work
intensity.
Hypothesis 6– We hypothesized that the O2 saturation percentages after recovery, during
Session A, will reach post-warm-up values.

32
Hypothesis 7– We hypothesized that the O2 supplementation during Session A recoveries will
create reliance on more aerobic metabolism indicated by lower post-session lactate levels than
Sessions B and C.
Hypothesis 8– We hypothesized that greatest difference in pre vs. post-lactate will occur with
completion of Session C.
Table 6: Hypothesized physiological variable responses
Variables
Control Condition (B) Session A Session C
Sea Level
Interval
Sea Level
Recovery
Altitude
Interval
Supplemental
O2 Recovery
Altitude
Interval
Sea Level
Recovery
Cardiac Output Increase Decrease Moderate
Increase Moderate Decrease
Moderate
Increase
Little
Decrease
Heart Rate Increase Decrease Extreme Increase Moderate Decrease Extreme
Increase
Little
Decrease
Stroke Volume Decrease Increase Moderate
Decrease Moderate Increase
Moderate
Decrease Little Increase
O2 Sat% Post-Int Decrease N/A Extreme
Decrease N/A
Extreme
Decrease N/A
O2 Sat% Pre-Int N/A Increase N/A Extreme Increase N/A Little increase
TPR Decrease Increase Moderate Decrease
Moderate Increase Moderate Decrease
Little Increase
Post-Session
Lactate Moderate Low High
Post-Pre-Lactate Moderate Low High
RPE (Borg) Moderate Low Extreme Low Extreme Moderate
Ventilation Increase Decrease Extreme Increase Moderate Decrease Extreme
Increase
Little
Decrease

CHAPTER 5
RESULTS
Subject Demographics
Subect demographics are presented in Table 7. For this study the total number of
participants was seven (i.e. n=7). The subject means coincide well within the norm for the
specfic demographic selected and are determined to be an accurate representation of the
approved subject requirement.
Table 7: Subject overall demographics
Subject Fitness Demographics
The subject fitness demographics are presented in Table 8. The fitness profile of the
subjects tested achieved above the threshold at which the minimum requirement was set (i.e. 50th
percentile for 𝑉𝑂2 𝑚𝑎𝑥). Subjects obtained a mean 52.01 ± 7.5 ml/kg/min maximal oxygen
consumption which is well above the norm (i.e. 43.9ml/kg/min) for the mean age (i.e. 40.9) of
the study participants. Ventilatory threshold and respiratory compensation was determined from
Demographics Min Max
Age 26 49
Ht 63.0 75.0
Wt 121.5 213.0
BMI 21.5 30.1
%BF 7.4% 30.2%
FFM 94.8 196.9
BFM 15.7 48.1
Subject Demographics
Mean
40.9 ± 7.01
68.4 ± 4.98
19.3% ± 7.41%
139.4 ± 35.27
32.0 ± 12.17
171.3 ± 33.29
25.3 ± 2.72
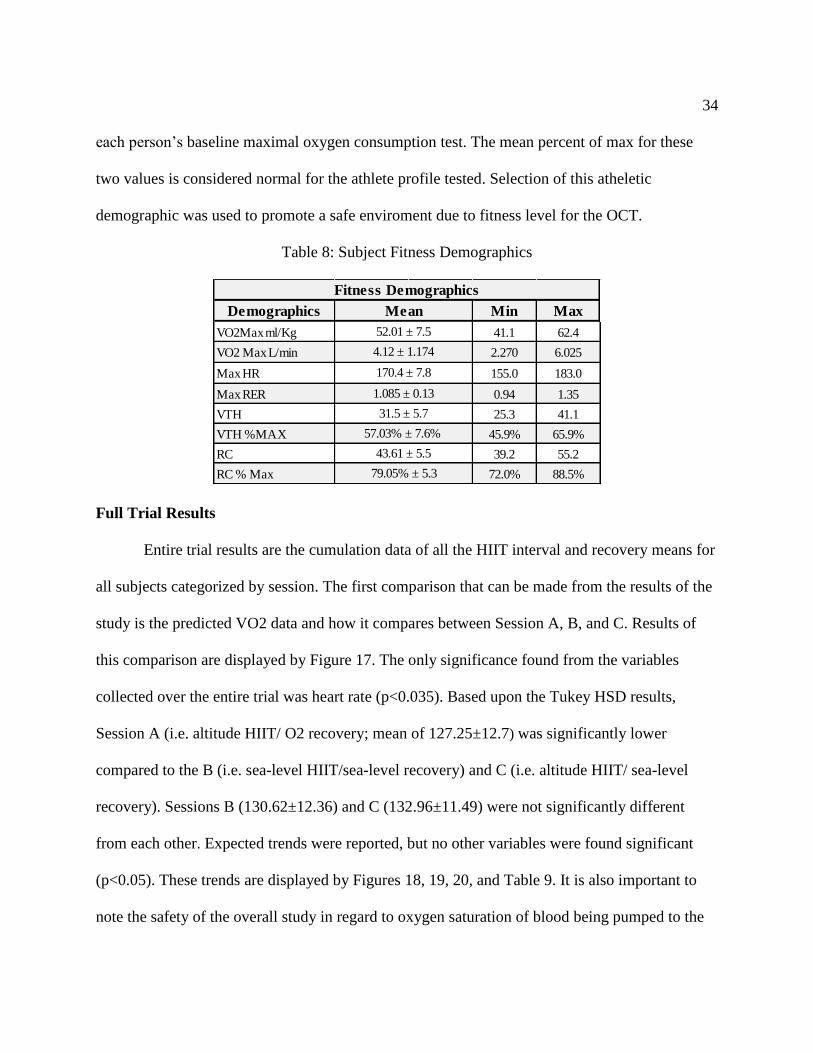
34
each person’s baseline maximal oxygen consumption test. The mean percent of max for these
two values is considered normal for the athlete profile tested. Selection of this atheletic
demographic was used to promote a safe enviroment due to fitness level for the OCT.
Table 8: Subject Fitness Demographics
Full Trial Results
Entire trial results are the cumulation data of all the HIIT interval and recovery means for
all subjects categorized by session. The first comparison that can be made from the results of the
study is the predicted VO2 data and how it compares between Session A, B, and C. Results of
this comparison are displayed by Figure 17. The only significance found from the variables
collected over the entire trial was heart rate (p<0.035). Based upon the Tukey HSD results,
Session A (i.e. altitude HIIT/ O2 recovery; mean of 127.25±12.7) was significantly lower
compared to the B (i.e. sea-level HIIT/sea-level recovery) and C (i.e. altitude HIIT/ sea-level
recovery). Sessions B (130.62±12.36) and C (132.96±11.49) were not significantly different
from each other. Expected trends were reported, but no other variables were found significant
(p<0.05). These trends are displayed by Figures 18, 19, 20, and Table 9. It is also important to
note the safety of the overall study in regard to oxygen saturation of blood being pumped to the
Demographics Min Max
VO2Max ml/Kg 41.1 62.4
VO2 Max L/min 2.270 6.025
Max HR 155.0 183.0
Max RER 0.94 1.35
VTH 25.3 41.1
VTH %MAX 45.9% 65.9%
RC 39.2 55.2
RC % Max 72.0% 88.5%
Fitness Demographics
Mean
4.12 ± 1.174
52.01 ± 7.5
170.4 ± 7.8
79.05% ± 5.3
43.61 ± 5.5
57.03% ± 7.6%
31.5 ± 5.7
1.085 ± 0.13

35
brain during the OCT. Figure 21 and Table 9 show that there was no significant difference
between sessions and that the desaturation that occurs is minimal. This displays that the exercise
with OCT is deemed safe, and blood saturation is not affected for our purposes.
Figure 17: Entire trial VO2 comparison.
Figure 18: PhysioFlow cardiac output entire trial. H1=HIIT 1, H1R1=Recovery 1.
±7.8
60% of Max 60% of Max
66% of Max

36
Figure 19: PhysioFlow stroke volume entire trial.
Figure 20: PhysioFlow heart rate entire trial.

37
Figure 21: Neck O2% across all trials.
Table 9: Entire trial variable means and significance.
Full HIIT and HIIT Last 15 Seconds
Table 10 displays the results of all HIIT interval data combined within a trial looking at
the overall interval trial means across the three treatments. The results indicate that there was no
56.49 57.35 57.15
0
10
20
30
40
50
60
70
TRA TRB TRC
Oxy
gen
Sat
ura
tio
n %
Entire Trial Mean Moxy O2%: Neck Placement
Variables TRA TRB TRC P-Val
HR 127.25±12.7 130.62±12.36 132.96±11.49 0.0348
SV 146.91±27.45 160.14±21.9 155.70±25.31 0.4938
CO 18.6±3.54 20.81±2.51 20.73±3.65 0.4908
Neck O2% 56.49±16.07 57.35±11.6 57.15±9.25 0.9638
Neck THb 12.95±0.15 12.86±0.15 12.94±0.17 0.4119
LFQ O2% 54.99±20.73 58.27±16.85 48.84±21.88 0.1646
LFQ THb 12.22±0.43 12.24±0.34 12.11±0.34 0.3285
RTQ O2% 58.55±14.71 57.11±9.14 53.16±12.23 0.2537
RTQ THb 12.3±0.38 12.27±0.33 12.35±0.38 0.3695
Overall Sat% 55.99±12.32 57.57±9.07 55.1±10.12 0.4878
Overall THb 12.53±0.3 12.54±0.25 12.43±0.27 0.8777
Deoxy Hb 5.52±1.58 5.29±1.18 5.59±1.29 0.4931
Entire Trial Variables

38
significant difference observed except for the predicted VO2 (p<0.029) or metabolic demand
comparisons across the trials. Although there was no significance with variables such as cardiac
output and right quadricep oxygen saturation percentage, the presumed effect trend of the
implemented treatment did exist. The inclusion of more power via more participants should
allow for significance to be found during this time period.
Table 10: Full HIIT variable means and significance
When the last 15s of each HIIT interval were compared across the three trials, a much
clearer picture of how supplemental oxygen and altitude affected the physiology responses to
exercise treatment workloads can be seen (Table 11) . The purpose of this analysis was to see the
physiological impact of the altitude condition near the end of the HIIT interval period; i.e., did it
alter oxygen desaturtation or change the cardiovascular response to completing this exercise
protocol at sea level. From these analyses, left quadricep oxygen saturation (p<0.045) and right
quadricep oxygen saturation (p<0.011) for Sessions A and C are significantly lower than the
Variables TRA TRB TRC P-Val
HR 124.98±12.81 128.01±12.77 128.93±13.42 0.59
SV 144.58±29.29 157.7±24.03 154.93±26.53 0.252
CO 18.02±3.89 20.19±3.02 20.13±4.09 0.1040
Neck O2% 58.42±3.06 60.26±2.83 60.11±3.06 0.891
Neck THb 12.94±0.12 12.83±0.15 12.92±0.17 0.072
LFQ O2% 53.29±19.16 59.76±14.68 49.18±19.92 0.169
LFQ THb 12.22±0.44 12.21±0.35 12.11±0.35 0.608
RTQ O2% 56.56±9.4 58.05±5.84 52.78±8.48 0.1000
RTQ THb 12.28±0.41 12.25±0.34 12.34±0.4 0.733
Predic VO2 24.41±6.54 30.36±8.43 29.5±7.74 0.0290
Overall Sat% 55.21±9.26 59.36±7.17 55.96±7.36 0.225
Overall THb 12.52±0.30 12.43±0.26 12.42±0.28 0.525
Deoxy Hb 5.61±1.18 5.06±0.95 5.48±0.97 0.23
Full HIIT Trial Data

39
control of Session B. Overall saturation (i.e the mean of neck, LFQ, and RTQ O2 %) was also
found under the altitude conditions (Trials A & C) to be significantly lower than the responses
observed during the sea-level trial (Trial B, p<0.003). As one would expect, with the mean
significant decrease of overall oxygen saturation, deoxygenated hemoglobin was significantly
greater during the altitude HIIT trial segments than at sea level (p<0.004).
Table 11: Last 15 seconds of HIIT variable means and significance.
Full Recovery and Recovery Last 15 Seconds
Similar to the compilation of the HIIT intervals into a mean for each trial, the recovery
data is displayed in Table 12. The full recovery allowed for comparison between trials to see if
there was an implications to what effect the oxygen supplementation would have upon
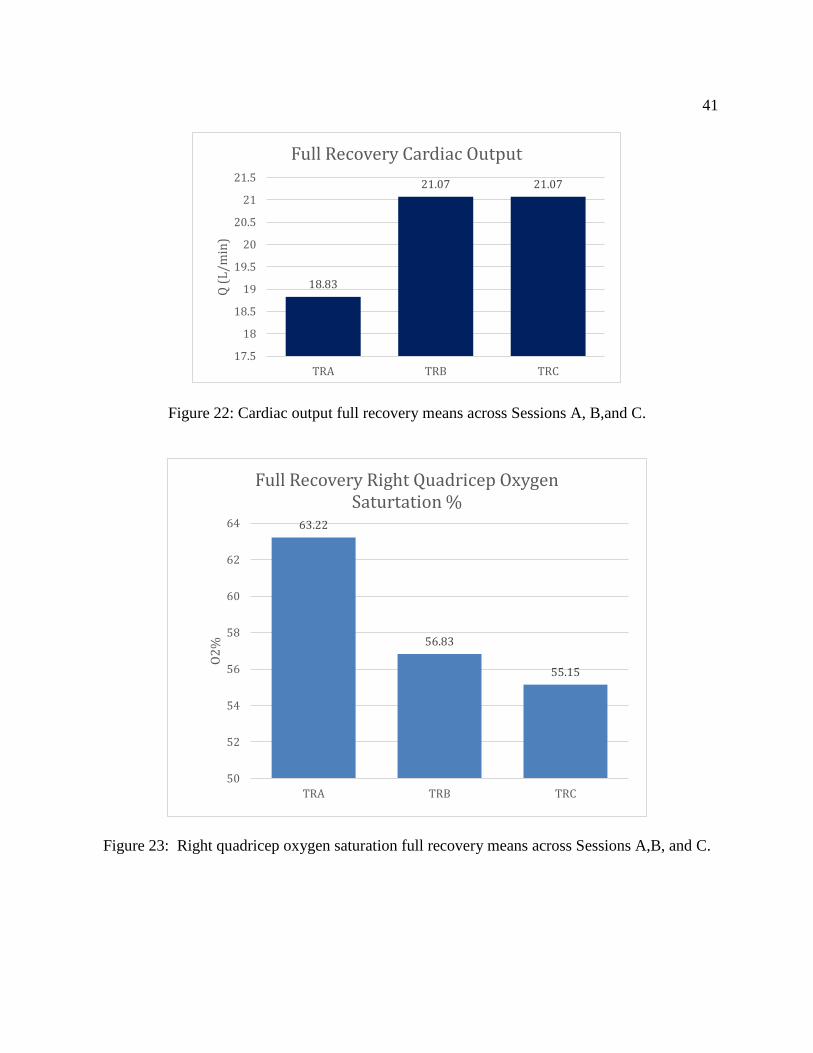
physiological variables. The only significantly different variables across trials were cardiac
output (p<0.012), right quadricep oxygen saturation (p<0.013), and VO2 (p<0.004). Cardiac
output (Figure 22) was significantly lower during Session A compared to both Sessions B and C,
Variables TRA TRB TRC P-Val
HR 137.5±10.65 137.05±10.62 139.78±9.84 0.6591
SV 150.4±31.06 162.57±23.35 160.07±25.35 0.3055
CO 20.44±4.09 22.14±2.62 22.36±3.68 0.1609
Neck O2% 47.91±16.58 56.25±11.19 53.01±10.5 0.1427
Neck THb 12.95±0.18 12.85±0.17 12.93±0.19 0.2125
LFQ O2% 37.92±20.36 51.36±16.9 36.25±25.01 0.0452
LFQ THb 12.22±0.49 12.2±0.38 12.09±0.40 0.5541
RTQ O2% 42.26±9.85 49±5.71 40.67±10.84 0.0105
RTQ THb 12.29±0.43 12.24±0.36 12.34±0.41 0.7072
Predic VO2 28.79±5.89 34.34±8.73 33.49±6..37 0.0300
Overall Sat% 42.41±9.11 52.19±6.92 45.59±10.32 0.0034
Overall THb 12.52±0.33 12.43±0.27 12.40±0.29 0.4469
Deoxy Hb 7.22±1.21 5.95±0.93 6.76±1.34 0.0043
Last 15s HIIT Trial Data

40
indicating supplemental oxidation reduced the metabolic demand of the workload segments and
enhanced recovery. Correspondingly, right quadricep oxygen saturation (Figure 23) during
session A was significantly greater than the mean oxygen saturation responses during Sessions B
and C. As a result, supplement oxygen usage during Session A led to significantly lower post-
exercise VO2 uptake and the metabolic demand compared against Sessions B and C (Figure 24).
Table 12: Full recovery variable means and significance.
Variables TRA TRB TRC P-Val
HR 127.8±10.59 131.9±12.30 135.29±9.42 0.0891
SV 147.95±26.19 160.97±19.99 155.99±25.43 0.2165
CO 18.83±2.89 21.07±1.83 21.07±3.28 0.0124
Neck O2% 56.07±13.67 53.38±8.84 53.94±7.11 0.6941
Neck THb 12.98±0.16 12.89±0.13 12.97±0.15 0.1161
LFQ O2% 59.27±16.64 57.36±17.11 49.66±19.42 0.1768
LFQ THb 12.22±0.43 12.26±0.34 12.12±0.34 0.4607
RTQ O2% 63.22±10.3 56.83±8.09 55.15±8.5 0.0128
RTQ THb 12.31±0.37 12.28±0.34 12.36±0.39 0.7589
Predic VO2 26.38±4.4 32.25±6.88 31.04±5.63 0.0037
Overall Sat% 58.71±7.48 55.85±8.38 55.15±7.03 0.3412
Overall THb 12.54±0.29 12.47±0.25 12.44±0.27 0.5675
Deoxy Hb 5.19±1.03 5.52±1.10 5.59±0.94 0.4628
Full Rec Trial Data
41
Figure 22: Cardiac output full recovery means across Sessions A, B,and C.
Figure 23: Right quadricep oxygen saturation full recovery means across Sessions A,B, and C.
18.83
21.07 21.07
17.5
18
18.5
19
19.5
20
20.5
21
21.5
TRA TRB TRC
Q (
L/m
in)
Full Recovery Cardiac Output
63.22
56.83
55.15
50
52
54
56
58
60
62
64
TRA TRB TRC
O2
%
Full Recovery Right Quadricep Oxygen Saturtation %

42
Figure 24: VO2 full recovery means across Sessions A, B, and C.
Similar to the data collected for the last 15 seconds of each HIIT, the last 15 seconds of
recovery data were also collected and analyzed. These data allow for the comparison of variables
near the end of recovery, where one would assume provides the greatest degree of recovery
across each of the trials. Similar to the findings with the last 15 seconds of HIIT, comparing the
last 15s of the HIIT recovery sections allows us to observe the distinct effects of HIIT, altitude,
and supplement oxygen during the recovery processes. Heart rate was found to be significantly
attenuated in Session A (p<0.012) when compared to that of Sessions B and C, indicating
enhanced recovery and less post-HIIT metabolic demand. Along with a lower HR for Session A,
cardiac output was also reduced during Session A (p<0.002) when compared to the non-
supplement oxygen exercise sessions (B and C). Correspondingly, right quadricep oxygen
saturtation was enhanced as a result of the supplemental oxygen in recovery during Session A
26.38
32.2531.04
0
5
10
15
20
25
30
35
TRA TRB TRC
VO
2 (
ml/
kg*
min
)
Full Recovery VO2

43
(p<0.009) when compared Sessions B and C. As expected, metabolic demand or VO2 was
significantly reduced during Session A (p<0.001) compared to Sessions B and C. Table 13
displays the mean results and the corresponding significance.
Table 13: Last 15 seconds variable means and significance
Variables TRA TRB TRC P-Val
HR 118.74±9.37 125.55±11.31 127.83±9.1 0.0124
SV 144.7±24.4 159.32±21.36 151.83±25.08 0.1438
CO 17.12±2.38 19.85±1.89 19.35±3.01 0.0015
Neck O2% 63.53±14.65 59.53±12.91 61.8±7.07 0.5884
Neck THb 12.95±0.16 12.85±0.16 12.97±0.18 0.0842
LFQ O2% 69.49±14.43 64.59±17.01 60.28±16.82 0.1887
LFQ THb 12.23±0.39 12.28±0.31 12.13±0.3 0.3113
RTQ O2% 72.18±10.30 64.60±9.19 64.03±8.22 0.0094
RTQ THb 12.32±0.35 12.29±0.33 12.37±0.38 0.7858
Predic VO2 23.35±4.32 29.91±6.69 27.91±5.48 0.0011
Overall Sat% 67.65±7.80 62.91±10.24 64.20±5.86 0.2041
Overall THb 12.54±0.27 12.48±0.24 12.47±0.25 0.6804
Deoxy Hb 4.07±1.05 4.64±1.33 4.47±0.80 0.2713
Last 15s Recovery Trial Data
CHAPTER 6
DISCUSSION
Purpose Revistited
The study investigated the acute physiological responses of altitude simulation during
high-intensity interval training and the subsequent supplementation of oxygen to potentially
facilitate greater recovery. One of the main purposes of the study was to expand the lacking
literature on the acute responses of altitude, HIIT, and oxygen supplementation that might
possibly lead to chronic adaptations as overall HIIT workload is increased. Research currently
existing in relation to the current study (i.e. hyperoxia and sprint intervals) has shown
improvements in power output achieved by lower heart rates at preset intensities under hyperoxic
conditions (Nummela, Hämäläinen, & Rusko, 2002; C. G. Perry, Reid, Perry, & Wilson, 2005).
This seems to coincide with our findings, although power output was not measured. Under the
condition of altitude and supplemental oxygen, the physiological strain seemed to be reduced and
is in accordance with the discussed research findigs. Besides the supplemental oxygen condition,
our study supports these previous results across multiple physiological domains, time points, and
variables. Contrasting research recently completed involving oxygen supplementation compared
against altitude during an increasing incremental maximal load showed no change in the
submaximal cardiovascular responses of this test (Bell & Subudhi, 2017). The current study
design allowed us to easily control for which condition had an impact on recovery, i.e., altitude,

45
HIIT work, supplemental oxygen recovery. The purpose of Session B (i.e. sea-level HIIT/ sea-
level recovery) was not only for control reasons but allowed us to verify the intensity. It also
allowed us to observe what the normal recovery would be for our protocol. Session C (i.e.
altitude HIIT/ sea level recovery) allowed us to measure the effects altitude had on HIIT interval
physiological demand and its effect on the recovery processes. Finally, Session A (i.e. altitude
HIIT/ O2 recovery) provided us with the measurable data to quantify if supplemental O2 would
facilitate greater recovery than that of normal conditions (B) and normal conditions after altitude
exercise (C).
Entire Trial Significance
Cardiovascular data showed the most promise due to the ability to easily collect and
analyze multiple facets of the cardiovascular system. We observed, across the entire HIIT data
collection period, heart rate responses were reduced with the addition of a hyperoxic (A)
environment post-exercise at altitude compared to normal recovery at normobaric conditions (B
and C) (p<0.035). This finding suggests that supplement oxgyen reduces metabolic demand and
enhanced recovery compared to the non-supplemental trials. If the metabolic and cardiovascular
demand on this system is reduced, performance will increase (Adams, Cashman, & Young,
1986; Morris et al., 2000). Although respiratory data could not be collected, we can infer based
upon the literature existing and the significance with reduced heart rate that respiratory and
metabolic demand would decrease with the addition of supplemental oxygen.
Because this is the first study to look at HIIT intervals with altitude in non-acclimatized
subjects, it was important we determined what effects HIIT altitude training in our population of
subjects had on maintaining a safe exercise environment. Previous research has shown HIIT

46
training to be a very safe exercise modality in special populations and patients. But, to date no
one has determined if HIIT with altitude conditions reduced the safety of HIIT training. Based on
the neck oxygen saturation or blood flow changes across all three trials, the brain oxygenation
and blood flow, as well as cardiovascular changes, indicated that performing HIIT at altitude
with and without supplemental oxygen did not create an unsafe exercise environment for the
current subject population. Our results are in contrast to previous research published (Banchero
et al., 1966; Roach, Greene, Schoene, & Hackett, 1998). The findings from previous studies
show that with the exposure to altitude, arterial blood saturation imparement occurs. However, it
is important to point out that we did not directly measure arterial blood gas, which may account
for the between-study differences. With our study showing no significant difference between
sessions of altitude, this demonstrates that the amount of exposure to altitude for each subject is
not long enough to cause significant changes in desaturation levels that increased the overall
exercise risk of our subjects (i.e. even when exaggerated by exercise).
HIIT Intervals Significance
In regards to the HIIT component of the trial (i.e. full HIIT and last 15 seconds of HIIT),
one would only expect that the significance would be in the form of the two altitude conditions
being different than that of the sea-level control. The significance that was observed supported
this hypothesis as expected. With full HIIT (i.e. the mean of all HIIT segments compared to each
condtion), supplemental oxygen reduced the metabolic demand of the HIIT intervals. Similar
research supports this claim that hyperoxia , although not inhaled during the HIIT, improves
VO2 efficiency by enhancing artial oxygen saturation (Astorino & Robergs, 2003; C. G. Perry et

47
al., 2005). Along with the uneven work-to-rest ratio of our study, having the extra time under the
exposure to hyperoxia should allow for the same response (i.e., lower VO2) to occur when not
breathing the supplemental O2 for the HIIT. Multiple variables were close to significance, such
as right quadricep oxygen saturation (p>0.100). With more completed subjects, we believe that
signifcance would likely occur and show higher mean saturation values for Session A.
With respect to the last 15 seconds of the HIIT intervals, the true effects of altitude were
more clearly observed. The rational for this significance is that the comparison time frame is the
point at which the physiological variables should be at their highest or most demanding point in
the trial (Åstrand et al., 1960; Tschakert et al., 2015). With the analysis of the last 15 seconds, we
see significance in left (p<0.045) and right quadriceps (p<0.011) O2%, VO2 (p<0.030), overall
O2% (p<0.003), and deoxygenated hemoglobin (p<0.004). These findings show that altitude
increased a subject’s exercising metabolic demand and enhanced the need for a recovery
stimulus. Previous research shows that oxygen saturation is reduced within the blood due to the
inability to saturate within the lungs when a person performs intense exercise at altitude
compared to that same workload at sea level (Bärtsch & Gibbs, 2007; Hsia, 2001; Moudgil et al.,
2005; Peacock, 1998). Interestingly, we also observed, based on each subject’s deoxygenated
hemoglobin SMO2 muscle measurements, that each subject’s muscles were extracting O2 at a
greater level when exercising at sea level and altitude and not recovering with supplemental
oxygen. It is important to note that the metabolic demand (VO2 uptake) with supplemental
oxygen was significantly less than Sessions B and C. This further demonstates the effect that the
oxygen supplementation during the recoveries had on the actual work demand of the HIIT
intervals.

48
Recovery Interval Significance
Similar to the comparisons made for the time frames of the HIIT intervals, recovery
analysis resulted in showing the true effect of HIIT intervals at altitude and sea level with and
without supplemental oxygen recovery. The significance of the full recovery means clearly
showed that cardiovascular metabolic demand was reduced (cardiac output, p<0.012; VO2,
p<0.004) through an enhancement in the maintenance of oxygen saturation during the recovery
process (right quadricep O2%, p<0.013). The practical significance of these results is that the
subjects could resaturate better with more oxygen available, expend less energy, and have less
demand on the cardiovascular system as previously shown in past research (Chick, Stark, &
Murata, 1993; Linossier et al., 2000; Naeije, 2010; C. G. Perry et al., 2005). These findings were
further verified when we looked at the final 15s of each HIIT recovery segment. With or without
supplemental oxygen, one would expect the greatest recovery of the session to be as close to the
end of the recovery segment. With the analysis of this time domain, the results indicated, as
discussed above, supplemental oxygen enhanced cardiovascular and metabolic recovery when
comparing the supplemental oxygen trial to the other two sessions: Session A versus B/C
decreased heart rate (p<0.012), decreased cardiac output (p<0.002), enhanced right quadricep
O2% (p<0.009), and reduced VO2 (p<0.001). These results agree well with previous research
comparing supplemental oxygen on cardiovascular function and metabolic demand (Linossier et
al., 2000; Morris et al., 2000; Naeije, 2010). In summary, these results show that supplemental
oxygen following altitude-based HIIT training reduces the overall metabolic and cardiovascular
demand during the actual intervals through the enhancement of the recovery process.

49
Practical Significance of Results
The significance of the data collected in this study has a variety of practical uses. First
and foremost, the literature on the subject matter of altitude, HIIT, and oxygen supplementation
is greatly expanded in the discipline where the literaure is lacking. Literature currently published
lacks the combination of HIIT, altitude, and supplemental oxygen for recovery. The majority of
research articles have two of the three variables mentioned. Far too many are focused on the
steady-state singular responses to altitude and supplemental O2 at submax intensities or have too
short a duration to actually promote a significant physiological effect (Armstrong, Jacks,
Sowash, & Andres, 2000; Bell & Subudhi, 2017). Also, many studies are directed towards the
long-term adaptations, when the acute responses for HIIT alone have yet to be consistantly
established due to the subject and HIIT protocol variability (Gibala et al., 2012; Ploutz-Snyder et
al., 1996; Tschakert & Hofmann, 2013; Tschakert et al., 2015). Second, the use of this
methoodolgy can be implemented in cardiovascular rehabilitation facilities that already
incorperate HIIT training to facilitate greater adaptation following post-surgical rehabilitaion
(Bärtsch & Gibbs, 2007; Guiraud et al., 2012; Hsia, 2001; Naeije, 2010; Weston, Wisløff, &
Coombes, 2014). The use of oxygen suplementation in these protocols will reduce the overall
risk in these clinical populations while enhancing the potential to perfrom higher workloads,
whether that be working at a higher percent of max or performing a longer duration interval at
the prescibed percent of max (Gibala et al., 2012; Gibala et al., 2006). With the results from this
study, it is in all likelihood that this treatment will facilitate greater recovery. Last, the
performance aspect for atheletes using this treatment can be improved. Atheletes training with

50
the Live High Train Low programming can utilize O2 recovery for longer work at the altitude
accustomed to in order to facilitate increased workload. Atheletes training with the Live Low
Train High programming can utilize the O2 to facilitate greater workloads at altitude in
preparation of an event at a unaccustomed altitude (Vogt & Hoppeler, 2010; Wehrlin, Zuest,
Hallén, & Marti, 2006).
Future Considerations
There are many future considerations for expanding the knowledge within the disipline of
altitude, HIIT, or oxygen supplementation. One specfic consideration would be an 8-week
training program with the protocol implemented in this study. With this study, one could
measure the chronic adaptations that take place with the combination of altitude, HIIT, and
oxygen supplementation. Variables that could be collected include hematocrit levels and muscle
biopses (i.e. fiber type, mitochondrial density, metabolic enzymes). Another consideration would
be to keep the protocol similar but manipulate the recovery time or intensity of the HIIT interval
to investigate if there are further significances.

51
REFERENCES
ACSM. (2014). ACSM's Guidelines for Exercise Testing and Presciption (ninth ed.). Philadelphia, PA: Wolters Kluwer Lippincott Williams & Wilkins.
Adams, R., Cashman, P., & Young, J. (1986). Effect of hyperoxia on substrate utilization during intense submaximal exercise. Journal of Applied Physiology, 61(2), 523-529.
Armstrong, J., Jacks, D. E., Sowash, J., & Andres, F. F. (2000). The Effect Of Training While Breathing Oxygen-Enriched Air On Time-To-Exhauston And Aerobic Capacity. J Exerc Physiol, 3, 12-20.
Astorino, T. A., & Robergs, R. A. (2003). Effect of hyperoxia on maximal oxygen uptake, blood acid-base balance, and limitations to exercise tolerance. J. Exerc. Physiol, 6, 8-20.
Åstrand, I., Åstrand, P. O., Christensen, E. H., & Hedman, R. (1960). Intermittent muscular work. Acta Physiologica Scandinavica, 48(3‐4), 448-453.
Banchero, N., Sime, F., Peñaloza, D., Cruz, J., Gamboa, R., & Marticorena, E. (1966). Pulmonary pressure, cardiac output, and arterial oxygen saturation during exercise at high altitude and at sea level. Circulation, 33(2), 249-262.
Bärtsch, P., & Gibbs, J. S. R. (2007). Effect of altitude on the heart and the lungs. Circulation, 116(19), 2191-2202.
Bell, K., & Subudhi, A. W. (2017). Effects Of Supplemental Oxygen On Submaximal And Maximal Cycling Performance At Altitude: 929 Board# 108 May 31 2. Medicine & Science in Sports & Exercise, 49(5S), 245.
Broeder, C. E., Hickok, J., & Burditt, A. (2009). Does Advanced Cardiac Impedance Technology Accurately Measure Cardiac Output During Submaximal Steady State Exercise? Medicine & Science in Sports & Exercise, 41(5), 162.
Brooks, Fahey, & Baldwin. (2005). Exercise Physiology: Human Bioenergetics and Its Applications (Fourth ed.): McGraw-Hill.
Burgomaster, K. A., Howarth, K. R., Phillips, S. M., Rakobowchuk, M., MacDonald, M. J., McGee, S. L., & Gibala, M. J. (2008). Similar metabolic adaptations during exercise after low volume sprint interval and traditional endurance training in humans. The Journal of physiology, 586(1), 151-160.
Bursaux, E. (1974). [Affinity of hemoglobin for oxygen and tolerance to hypoxia]. Le Poumon et le coeur, 31(4), 183-186.

52
Chick, T. W., Stark, D. M., & Murata, G. H. (1993). Hyperoxic training increases work capacity after maximal training at moderate altitude. CHEST Journal, 104(6), 1759-1762.
Christensen, E. H., Hedman, R., & Saltin, B. (1960). Intermittent and continuous running (A further contribution to the physiology of intermittent work.). Acta Physiologica Scandinavica, 50(3‐4), 269-286.
Cumming, & Finch, S. (2001). A primer on the understanding, use, and calculation of confidence intervals that are based on central and noncentral distributions. Educational and Psychological Measurement, 61(4), 532-574.
Daussin, F. N., Zoll, J., Dufour, S. P., Ponsot, E., Lonsdorfer-Wolf, E., Doutreleau, S., . . . Richard, R. (2008). Effect of interval versus continuous training on cardiorespiratory and mitochondrial functions: relationship to aerobic performance improvements in sedentary subjects. American Journal of Physiology-Regulatory, Integrative and Comparative Physiology, 295(1), R264-R272.
Ekblom, B., & Hermansen, L. (1968). Cardiac output in athletes. Journal of Applied Physiology, 25(5), 619-625.
Evans, D., & Rose, R. (1988). Cardiovascular and respiratory responses in Thoroughbred horses during treadmill exercise. Journal of experimental biology, 134(1), 397-408.
Faiss, Girard, O., & Millet, G. P. (2013). Advancing hypoxic training in team sports: from intermittent hypoxic training to repeated sprint training in hypoxia. British journal of sports medicine, 47(Suppl 1), i45-i50.
Faiss, Willis, S., Born, D.-P., Sperlich, B., Vesin, J.-M., Holmberg, H.-C., & Millet, G. P. (2015). Repeated double-poling sprint training in hypoxia by competitive cross-country skiers. Med sci sports exerc, 47(4), 809-817.
Gibala, M. J., Little, J. P., MacDonald, M. J., & Hawley, J. A. (2012). Physiological adaptations to low‐volume, high‐intensity interval training in health and disease. The Journal of physiology, 590(5), 1077-1084.
Gibala, M. J., Little, J. P., Van Essen, M., Wilkin, G. P., Burgomaster, K. A., Safdar, A., . . . Tarnopolsky, M. A. (2006). Short‐term sprint interval versus traditional endurance training: similar initial adaptations in human skeletal muscle and exercise performance. The Journal of physiology, 575(3), 901-911.
Guiraud, T., Nigam, A., Gremeaux, V., Meyer, P., Juneau, M., & Bosquet, L. (2012). High-intensity interval training in cardiac rehabilitation. Sports Medicine, 42(7), 587.

53
Hawley, J. A. (2004). Exercise as a therapeutic intervention for the prevention and treatment of insulin resistance. Diabetes/metabolism research and reviews, 20(5), 383-393.
Hawley, J. A. (2008). Specificity of training adaptation: time for a rethink? The Journal of physiology, 586(1), 1-2.
Helgerud, J., Hoydal, K., Wang, E., Karlsen, T., Berg, P., Bjerkaas, M., . . . Bach, R. (2007). Aerobic High-Intensity Intervals Improve VO~ 2~ m~ a~ x More Than Moderate Training. Medicine and science in sports and exercise, 39(4), 665.
Hill, A. V., Long, C., & Lupton, H. (1924). Muscular exercise, lactic acid, and the supply and utilisation of oxygen. Proceedings of the Royal Society of London. Series B, Containing Papers of a Biological Character, 97(681), 84-138.
Hsia, C. C. (2001). Coordinated adaptation of oxygen transport in cardiopulmonary disease. Circulation, 104(8), 963-969.
Kenny, L., Wilmore, J. H., & Costill, D. L. (2015). Physiology of Sport and Exercise (Sixth ed.): Human Kinetics.
Linossier, M., Dormois, D., Arsac, L., Denis, C., Gay, J., Geyssant, A., & Lacour, J. (2000). Effect of hyperoxia on aerobic and anaerobic performances and muscle metabolism during maximal cycling exercise. Acta Physiologica Scandinavica, 168(3), 403-412.
Meyer, K., Samek, L., Schwaibold, M., Westbrook, S., Hajric, R., Beneke, R., . . . Roskamm, H. (1997). Interval training in patients with severe chronic heart failure: analysis and recommendations for exercise procedures. Medicine and science in sports and exercise, 29(3), 306-312.
Morris, D., Kearney, J., & Burke, E. (2000). The effects of breathing supplemental oxygen during altitude training on cycling performance. Journal of Science and Medicine in Sport, 3(2), 165-175.
Moudgil, R., Michelakis, E. D., & Archer, S. L. (2005). Hypoxic pulmonary vasoconstriction. Journal of Applied Physiology, 98(1), 390-403.
Naeije, R. (2010). Physiological adaptation of the cardiovascular system to high altitude. Progress in cardiovascular diseases, 52(6), 456-466.
Noakes, T. D., Peltonen, J. E., & Rusko, H. K. (2001). Evidence that a central governor regulates exercise performance during acute hypoxia and hyperoxia. Journal of experimental biology, 204(18), 3225-3234.

54
Nummela, A., Hämäläinen, I., & Rusko, H. (2002). Effect of hyperoxia on metabolic responses and recovery in intermittent exercise. Scandinavian journal of medicine & science in sports, 12(5), 309-315.
Peacock, A. J. (1998). Oxygen at high altitude. Bmj, 317(7165), 1063-1066.
Perry, Lindsay Davis, Paul Bender, John Thistlethwaite, Craig Broeder, F., Jakob D. Lauver, & Cayot, T. E. (2017). Estimation of the Lactate Threshold Using a New Wireless Near-Infrared Spectroscopy System. Paper presented at the American College of Sports Medicine, Denver, CO.
Perry, C. G., Reid, J., Perry, W., & Wilson, B. A. (2005). Effects of hyperoxic training on performance and cardiorespiratory response to exercise. Medicine & Science in Sports & Exercise, 37(7), 1175-1179.
Ploutz-Snyder, L., Simoneau, J.-A., Gilders, R., Staron, R., & Hagerman, F. (1996). Cardiorespiratory and metabolic adaptations to hyperoxic training. European journal of applied physiology and occupational physiology, 73(1-2), 38-48.
Porcari, J., Bryant, C., & Comana, F. (2015). Exercise Physiology: F.A. Davis Company.
Powers, S. K., Lawler, J., Dempsey, J. A., Dodd, S., & Landry, G. (1989). Effects of incomplete pulmonary gas exchange on VO2 max. Journal of Applied Physiology, 66(6), 2491-2495.
Richardson, & Gibson, O. (2015). Simulated hypoxia does not further improve aerobic capacity during sprint interval training. The Journal of sports medicine and physical fitness, 55(10), 1099-1106.
Richardson, Relf, R. L., Saunders, A., & Gibson, O. R. (2016). Similar inflammatory responses following sprint interval training performed in hypoxia and normoxia. Frontiers in Physiology, 7.
Roach, R. C., Greene, E., Schoene, R., & Hackett, P. H. (1998). Arterial oxygen saturation for prediction of acute mountain sickness. Aviation, space, and environmental medicine, 69(12), 1182-1185.
Rognmo, Ø., Moholdt, T., Bakken, H., Hole, T., Mølstad, P., Myhr, N. E., . . . Wisløff, U. (2012). Cardiovascular risk of high-versus moderate-intensity aerobic exercise in coronary heart disease patients. Circulation, 126(12), 1436-1440.
Tschakert, G., & Hofmann, P. (2013). High-intensity intermittent exercise: methodological and physiological aspects. Int J Sports Physiol Perform, 8(6), 600-610.

55
Tschakert, G., Kroepfl, J., Mueller, A., Moser, O., Groeschl, W., & Hofmann, P. (2015). How to regulate the acute physiological response to “aerobic” high-intensity interval exercise. Journal of Sports Science and Medicine, 14, 29-36.
Vogt, M., & Hoppeler, H. (2010). Is hypoxia training good for muscles and exercise performance? Progress in cardiovascular diseases, 52(6), 525-533.
Wallner, D., Simi, H., Tschakert, G., & Hofmann, P. (2014). Acute physiological response to aerobic short-interval training in trained runners. International Journal of Sports Physiology & Performance, 9(4).
Wehrlin, J. P., Zuest, P., Hallén, J., & Marti, B. (2006). Live high-train low for 24 days increases hemoglobin mass and red cell volume in elite endurance athletes. Journal of Applied Physiology, 100(6), 1938-1945.
Weston, K. S., Wisløff, U., & Coombes, J. S. (2014). High-intensity interval training in patients with lifestyle-induced cardiometabolic disease: a systematic review and meta-analysis. Br J Sports Med, 48(16), 1227-1234.
Wilmore, J. H. (1969). Maximal oxygen intake and its relationship to endurance capacity on a bicycle ergometer. Research Quarterly. American Association for Health, Physical Education and Recreation, 40(1), 203-210.
Wilson, G. D., & Welch, H. G. (1974). Effects of hyperoxic gas mixtures on exercise tolerance in man. Medicine and science in sports, 7(1), 48-52.


![Review Berberine in Cardiovascular and Metabolic Diseases ... · bleomycin [41] as well as side effects of analgesics (e.g. acetaminophen [42]). BBR in the treatment of cardiovascular](https://img.dokumen.tips/doc/110x75/5ed5c7b43e6f6128a847c2b9/review-berberine-in-cardiovascular-and-metabolic-diseases-bleomycin-41-as.jpg)