Embed Size (px)
Citation preview

i
Abstract
In order to verify the user‘s satisfaction of the quality of a system or its components under
development it is essential to evaluate quality of experience. The existing approach to quality of
experience is the following: 1) it is examined quantitatively on the sensorial level, favoring studies on
one modality or a certain piece of the system at one time, 2) it is assessed in highly controlled
circumstances, even though the final application is used in heterogeneous mobile contexts,
3) evaluators‘ background is disregarded or has only a small influence on quality requirements,
4) experienced quality is assessed independently of use of the final multimedia application. These
principles dramatically contradict what is known about perception in psychology or about user
experience in human-computer-interaction: 1) perception includes bottom-up and top-down
processing where emotions, attitudes, expectations, knowledge and the context take part in its active
interpretation, 2) the relation between produced and perceived quality is uneven, 3) multimodal
perception is adaptive and flexible, and more than a simple sum derived from two perceptual
channels separately, 3) resulting user-experience of a system is characterized by factors from the
user, the system or service, the context of use, and an outcome is described by different experiential
influences and consequences.
The aim of this thesis is two-fold. The first aim is to understand what the components of
experienced quality are and how these components affect experienced quality. The second aim of the
work is to develop user-centered quality evaluation methods for examining experiences of
multimedia quality.
This thesis contains eleven extensive quality evaluation experiments and a literature review. The
experiments were carried out for mobile television and mobile three-dimensional television with a
relatively low quality level at a time when the systems were not available on the consumer market.
More than 500 naïve evaluators (mostly non-students) participated in the experiments. The
experiments were carried out in controlled laboratory and quasi-experimental field circumstances
using hybrid data-collection methods containing quantitative quality excellence evaluation,
qualitative descriptions of quality, observation and advanced techniques for situational data-capture.
The audiovisual system parameters varied with respect to the level of content, media and
transmission. The systematic literature review of over 100 high-quality papers clarified the
components of use contexts for mobile-human-computer interaction. The compound thesis contains 5
journals, 7 conference publications and 16 supplementary publications.
The descriptive model of User-Centered Quality of Experience (UC-QoE) and the evaluation
methods developed summarize the outcome of the work. UC-QoE is constructed from four main
components: the user‘s characteristics, the system‘s characteristics, the context of use and the
experiential dimensions. According to the results, contrary to earlier understanding, quality of
experience is a broader phenomenon than sensorial excellence of a system component, and therefore
its evaluation and design needs to consider the components surrounding it. The methodological
contribution is in five parts: 1) a holistic framework for User-Centered Quality of Experience
evaluation, 2) Bidimensional method for assessing quantitatively the domain-specific acceptance

ii
threshold, 3) Experienced quality factors - interview-based descriptive method, 4) Open Profiling of
Quality, as an advanced mixed method, that combines quantitative quality evaluation and qualitative
descriptive quality evaluation based on an individual‘s own vocabulary, and 5) Hybrid method for
quality evaluation in the context of use. These methods are concrete tools for practitioners to
conduct quality evaluation experiments within the framework presented. Beyond this fundamental
and applied research contribution, this thesis supports user-centered development of novel mobile
multimedia systems for providing a better user experience in the long term.

iii
Preface
The research for this thesis has been conducted at Tampere University of Technology (TUT)
during the years 2005-2010. I would like to thank my supervisor Prof. Kaisa Väänänen-Vainio-
Mattila for her support and given freedom to focus on the footsteps on my own research path. Prof.
Patrick Le Callet (Ecole Polytechnique de l‘université de Nantes/ Université de Nantes, France)
and Dr. Wijnand IJsselsteijn (Eindhoven University of Technology, Netherlands) reviewed the thesis.
I highly appreciate their feedback and constructive comments. I am indebted to Prof. Sebastian
Möller (Deutsche Telekom Laboratories, Technische Universität Berlin, Germany) for agreeing to be
the opponent in the public defense of my thesis.
I am grateful to the co-authors of the papers for their contribution to the publications and the
thesis. I would like to express my respect especially to Dr. Miska M. Hannuksela, Dominik
Strohmeier, and Timo Utriainen for their genius way of sharing enthusiasm, criticism, knowledge and
effort in our collaborative work. I have also been extremely lucky to learn to know Miska and
Dominik as friends outside the work. All other co-authors Vinod Kumar Malamal Vadakital, Dr.
Teija Vainio, Kristina Kunze, Prof. Göte Nyman, Dr. Jukka Häkkinen, and Dr. Jari Korhonen made a
valuable contribution to this thesis.
I also want to acknowledge my colleagues and friends. I am grateful to my colleagues at IHTE
(Unit of Human-Centered Technology/Department of Software Systems) and Department of Digital
Signal Processing during the years 2004-2011. I especially want to thank Ville Ilvonen, Timo
Utriainen, Suvi Melakoski-Vistbacka, Piia Nurkka, Heli Väätäjä, Dr. Inka Vilpola, Mandy Weitzel,
Tomi Haustola, Dr. Atanas Gotchev, and Atanas Boev for their help, support and co-experiences.
The successfully shared MSc thesis with Ville Ilvonen, created in a highly competitive and ambitious
atmosphere, formed a strong base for many studies of this thesis and early motivation. I am grateful
for that time and for the friendship it created. I also want to thank Dr. Hendrik Knoche for sharing
the path from the very beginning to the point of finalizing the thesis. Furthermore, I am grateful to
Prof. Karlheinz Brandenburg and Dr. Ulrich Reiter for setting up the good research collaboration
between TU Ilmenau and TUT. Finally, I appreciate the comments made by Miska M. Hannuksela,
Dominik Strohmeier, Hendrik Knoche, Heli Väätäjä, Atanas Boev, Timo Utriainen, and Minna
Kynsilehto to improve the final manuscript of the thesis.
I am grateful for receiving the funded position at the Graduate School in User-Centered
Information Technology (UCIT) at a very early stage of my research work. It guaranteed a fluent
start for the work and enabled the commitment to the long-term research goals (2005-2010). The
industrial and academic research projects made it possible to conduct large-scale studies and act in
multidisciplinary research teams. These projects were funded by Radio- ja televisiotekniikan
tutkimus Oy and the European Union (the projects MOBILE 3DTV and 3DTV Noe). I have also
received financial support for the thesis from HPY Research Foundation, Ulla Tuominen Foundation,
Finnish Cultural Foundation (Artturi ja Aina Heleniuksen rahasto and Ulla ja Eino Karosuon
rahasto), and Nokia Foundation. These different types of funding have also given me a great chance

iv
to learn and enjoy my time as a visiting researcher at Technical University of Ilmenau, Technical
University of Berlin and University of California, Santa Barbara.
My warmest thanks belong to my family. I am extremely grateful to my parents, Anita and Mauri,
for the way they have raised me with my brothers, offered love, time, support and, encouragement for
picking up the gauntlets. I also want to thank my parents and my mother-in-law, Taru, for helping in
everyday things during my travel and at the phase of finalizing the thesis. Most importantly, I express
my deepest gratitude to my husband, Seppo, for the love, the shared experiences and support. I highly
value the time spent together abroad during the research exchanges and all your effort for everyday
routines to help me finalize the thesis. I am endlessly amazed about and grateful for the happiness,
smile, joy, energy and curiosity that our son, Pyry, brings to our lives.
Tampere 23.3. 2011 Satu Jumisko-Pyykkö

v
Supervisor: Professor Kaisa Väänänen-Vainio-Mattila
Department of Software Systems - Human-Centered Technology
Tampere University of Technology
Pre-examiners: Professor Patrick Le Callet
Ecole Polytechnique de l‘université de Nantes,
Université de Nantes, France
Associate professor Wijnand IJsselsteijn, Ph.D.
Eindhoven University of Technology, Netherlands
Opponent: Professor Sebastian Möller
Deutsche Telekom Laboratories,
Technische Universität Berlin, Germany

vi
Contents
Abstract ........................................................................................................................................... i
Preface .......................................................................................................................................... iii
Contents ........................................................................................................................................ vi
List of publications ..................................................................................................................... viii
List of acronyms ............................................................................................................................ x
1. Introduction ............................................................................................................................. 1
1.1 Objectives and scope ....................................................................................................... 2
1.2 Results and contribution .................................................................................................. 4
2. Quality of Experience .............................................................................................................. 6
2.1 Key concepts ................................................................................................................... 6
2.2 Multimedia quality .......................................................................................................... 7
2.2.1 Perceived quality................................................................................................. 7
2.2.2 Produced quality ............................................................................................... 11
2.3 Descriptive models ........................................................................................................ 14
2.3.1 Models of Quality of Experience ...................................................................... 15
2.3.2 Models of User Experience ............................................................................... 19
2.4 Influence of user, system and context on quality of experience .................................... 23
2.4.1 Users ................................................................................................................. 23
2.4.2 System............................................................................................................... 24
2.4.3 Context of use ................................................................................................... 29
2.5 Mobile (3D) television – users, system, context of use ................................................. 30
2.6 Summary........................................................................................................................ 32
3. Evaluation methods ............................................................................................................... 34
3.1 Key concepts ................................................................................................................. 34
3.2 Quantitative quality evaluation ...................................................................................... 38
3.2.1 Psychoperceptual quantitative evaluation ......................................................... 38
3.2.2 User-oriented quality evaluation ....................................................................... 39
3.3 Qualitative descriptive quality evaluation ..................................................................... 41
3.4 Mixed methods .............................................................................................................. 42
3.5 Supplementary methods ................................................................................................ 43
3.6 Summary........................................................................................................................ 44
4. Research method and content of studies ................................................................................ 46
4.1 The experiments ............................................................................................................ 46
4.2 Literature review............................................................................................................ 49
5. Results ................................................................................................................................... 50
5.1 Components of Quality of Experience ........................................................................... 50
5.1.1 User ................................................................................................................... 50

vii
5.1.2 System ............................................................................................................... 50
5.1.3 System - Descriptive quality of experience ....................................................... 54
5.1.4 Context of use ................................................................................................... 55
5.1.5 Summary ........................................................................................................... 60
5.1.6 Model of User-Centered Quality of Experience ................................................ 61
5.2 Evaluation methods ........................................................................................................ 65
5.2.1 Framework for evaluation of User-Centered Quality of Experience ................. 65
5.2.2 Bidimensional research method of acceptance .................................................. 69
5.2.3 Experienced quality factors - Interview-based descriptive method ................... 71
5.2.4 Open Profiling of Quality .................................................................................. 74
5.2.5 Hybrid method for quality evaluation in the context of use .............................. 76
5.2.6 Summary ........................................................................................................... 80
6. Discussion and conclusions .................................................................................................... 82
References .................................................................................................................................... 87
Appendices ................................................................................................................................... 99
Original publications .................................................................................................................. 116

viii
List of publications
The thesis consists of a summary and the following original publications:
P1 Jumisko-Pyykkö, S., Malamal Vadakital, V. K., & Hannuksela, M. M. (2008). Acceptance
threshold: Bidimensional research method for user-oriented quality evaluation studies.
International Journal of Digital Multimedia Broadcasting, Volume 2008, Article ID
712380, 20 pages. doi:10.1155/2008/712380 [Candidate‟s contribution 80%]
P2 Jumisko-Pyykkö, S. (2008). "I would like to see the subtitles and the face or at least hear the
voice": Effects of picture ratio and audio---video bitrate ratio on perception of quality in
mobile television. Multimedia Tools Appl., 36(1–2), 167–184. doi:10.1007/s11042-006-
0080-9 [Candidate‟s contribution 100%]
P3 Jumisko-Pyykkö, S., & Vainio, T. (2010). Framing the context of use for mobile HCI. In J.
Lumsden (Ed.), International Journal of Mobile-Human-Computer-Interaction: IJMHCI,
2(4) (pp. 1-28). doi:10.4018/IJMHCI.2010100101 [Candidate‟s contribution 75%]
P4 Strohmeier, D., Jumisko-Pyykkö, S., & Kunze, K. (2010). Open Profiling of Quality – A
mixed method approach to understand multimodal quality perception. Advances in
Multimedia, Volume 2010, Article ID 658980, 28 pages. [Candidate‟s contribution 45%]
P5 Jumisko-Pyykkö, S. & Utriainen, T. (2010). A hybrid method for the context of use:
Evaluation of user-centered quality of experience for mobile (3D) television.
International Journal of Multimedia Tools and Applications: Special issue on Mobile Media
Delivery (pp. 1-41). Netherlands: Springer. doi:10.1007/s11042-010-0573-4 [Candidate‟s
contribution 90%]
P6 Jumisko-Pyykkö, S., & Häkkinen, J. (2005). Evaluation of subjective video quality on
mobile devices. Proceedings of the 13th annual ACM international conference on
Multimedia 2005, 535–538. ISBN 1-59593-044-2. [Candidate‟s contribution 90%]
P7 Jumisko-Pyykkö, S., Vinod Kumar, M. V., & Korhonen, J. (2006). Unacceptability of
instantaneous errors in mobile television: From annoying audio to video. Proceedings of the
8th Conference on Human-Computer Interaction with Mobile Devices and Services: Mobile
HCI 2006, 1–8. ISBN 1-59593-390-5. [Candidate‟s contribution 80%]

ix
P8 Jumisko-Pyykkö, S., Häkkinen, J., & Nyman, G. (2007). Experienced quality factors -
Qualitative evaluation approach to audiovisual quality. Proceedings of IST/SPIE conference
Electronic Imaging, Multimedia on Mobile Devices 2007, 6507(65070M).
doi:10.1117/12.699797 [Candidate‟s contribution 95%]
P9 Jumisko-Pyykkö, S. & Häkkinen, J. (2008). Profiles of the evaluators - Impact of
psychographic variables on the consumer-oriented quality assessment of mobile television.
Proceedings of IST/SPIE conference Electronic Imaging, Multimedia on Mobile Devices
2008, 6821(68210L). doi:10.1117/12.765697 [Candidate‟s contribution 95%]
P10 Jumisko-Pyykkö, S., & Hannuksela, M. M. (2008). Does context matter in quality
evaluation of mobile television? Proceedings of the 10th international Conference on
Human Computer interaction with Mobile Devices and Services: MobileHCI '08, 63–72.
doi:10.1145/1409240.1409248 [Candidate‟s contribution 80%]
P11 Utriainen, T., & Jumisko-Pyykkö, S. (2010). Experienced audiovisual quality for mobile 3D
television. Proceedings of 3DTV Conference 2010, 1–4. doi:10.1109/3DTV.2010.5506310
[Candidate‟s contribution 50%]
P12 Jumisko-Pyykkö, S., Strohmeier, D., Utriainen, T., & Kunze, K. (2010). Descriptive quality
of experience for mobile 3D television. Proceedings of NordiCHI 2010, 1–10. ISBN 978-1-
60558-934-3 [Candidate‟s contribution 50%]
The publications are reproduced by permission of the publishers. The candidate‘s contribution is
expressed as a percentage of the written work of the publication. The appendix 7 presents the
contribution of the co-authors in detail. In addition to the main publications, the candidate has
contributed to 16 supplementary publications in the themes of this thesis. The supplementary
publications are included in the list of references and prefixed with ‗S - ‘.

x
List of acronyms
AAC Advanced Audio Coding standard
ACR Absolute Category Rating
ADAM Audio Descriptive Analysis & Mapping
AMR Adaptive Multi-Rate Audio Coding standard
ANOVA Analysis of Variances
ANSI American National Standardization Institute
AVI Audio Video Interleaved
BPS Bits per second
CI Confidence Interval
CoU Context of Use
DVB-H Digital Video Broadcasting – Handheld standard
FPS Frames per second
FEC Forward Error Correction
HCI Human-Computer Interaction
H.264/AVC Advanced Video Coding standard
HDTV High-Definition Television
IVP Individual Profiling Method
ISO International Standardization Organization
ITU-T International Telecommunication Union – Telecommunication Sector
ITU-R International Telecommunication Union – Radiocommunication Sector
KBPS Kilobits per second
LCD Liquid-Crystal Display
MFER Multiprotocol Encapsulation Forward Error Correction, frame error ratio
MHCI Mobile Human-Computer-Interaction
MOS Mean Opinion Scores
MPEG Motion Pictures Expert Group
PVD Preferred Viewing Distance
QCIF Quarter Common Interchange Format (176x144)
QoS Quality of Service
QoP Quality of Perception
QoE Quality of Experience
QVGA Quarter Video Graphics Array (640×480)
RaPID RaPID perceptual image description method
SAMVIQ Subjective Assessment Methodology for Video Quality
SIF-SP Standard Interchange Format (320x208)
SSQ Simulator Sickness Questionnaire
TAM Technology Acceptance Model
UCD User-Centered Design
UC-QoE User-Centered Quality of Experience
VQEG Video Quality Experts Group
2D Two-dimensional, monoscopic video presentation
3D Three-dimensional, depth in video produced with stereoscopic presentation

1
1. Introduction
Television has a significant role in everyday life. On average more than 2.5 hours are spent daily
by viewing moving pictures via different devices (Finnpanel, 2010; Nielsen, 2010). To provide a
more and more pleasurable viewing experience, the television technology has gone through an
evolution since it was established in 1926. There has been an evolution of quality from black-and-
white to color images, an increase in screen sizes and digitalization. This evolution is expected to
continue towards improvements in depth (3D). To measure the excellence of video quality of
television, International Telecommunication Union (ITU) has provided well-validated test
methodologies for more than 30 years (ITU-R BT.500-11, 2002).
The revolution of personal and mobile computing also had its effect on the emergence of
television and video. Broadcast television on mobile devices became a dream of the mass medium
and the system providers to offer ubiquitous viewing possibilities for customers. New challenges
were set to video quality not only because of the small display size but also because of the necessity
to combine a huge amount of data with a wireless transmission channel and wireless reception,
computational power and battery life time. This requires a high-level of optimization in the multiple
stages of the system. The further development from 2D to 3D mobile television and video is a highly
expected next step in the development. To create value for the end-users, their needs and
requirements for quality have to be fulfilled. The change in the technological context also requires
new ways of evaluating quality and taking into account the challenges of ubiquitous usage.
Videolization - the dramatic change in the availability and consumption of video - has taken place
during the course of this study (2005-2011). It covers the shift from analogue to digital television, the
introduction of TV over the internet (IPTV), and videos as a part of online newspaper editing.
Parallel to the accessibility of professionally created content via different devices, user -created
content has become available. For example, since the opening of YouTube in 2005 it has been
subscribed by millions of people. These videos introduced highly compressed, impaired and low
video quality to the users. Furthermore, video captures become a basic function of digital cameras
and multimedia mobile phones within the course of this study. The daily mobile video consumption
in the USA has been reported to be around three minutes (Nielsen, 2009). Videolization has made the
consumers familiar with the range of the different digital video qualities presented on different
devices as a part of their video consumption.
Previous research - To quantify the experienced quality of certain system components, and to
optimize them or predict their quality automatically, subjective evaluation experiments are
conducted. The existing view on the concept of experienced quality is strongly formulated through
the recommendations of International Telecommunication Union, which are widely spread among
the engineering quality evaluation society. The current mainstream approach to quality is the
following: 1) Perceived quality is examined only quantitatively on the sensorial level, favoring
studies of one modality or on a certain piece of system at a time. 2) Assessment is conducted in a
highly controlled environment (e.g. the requirements for non-functional system components are

2
derived from perceptually perfect conditions), even though the final application is assumed to be
used in heterogeneous mobile contexts. 3) The background of evaluators or users does not have or
has only a small impact on quality evaluations. 4) Quality evaluation is not connected to the use of
the final multimedia application. Although the current approach has benefits in aiming at maximizing
the high-level control in the examination of the causal effects and in serving the needs of identifying
trade-offs between a limited set of system components in their development, its view on experienced
quality is limited.
The principles of the existing approaches are highly in contradiction to what is known about
perception in psychology and human-computer-interaction: 1) Human perception always includes
high-level cognitive processing in which emotions, attitudes, knowledge and the context are part of
the active interpretation of perception. 2) Relation between the produced and the perceived quality is
not at a 1:1 ratio. 3) Multimodal perception is adaptive, flexible, and different from a simple sum
derived from two perceptual channels separately. 4) The final user experience of an application is
characterized by factors from the user, the system or service and its context of use and is described
by the different type of experiential influences and consequences. These approaches emphasize a
broad or holistic understanding of human perception and experiences, and a pragmatic view when
utilizing this information at different stages of design and evaluation processes.
1.1 Objectives and scope
This thesis has two main research goals (Table 1). The first aim of this thesis is to understand
what the components of experienced quality are and how these components impact on experienced
quality. The outcome is a descriptive model of User-Centered Quality of Experience. The second aim
is to develop user-centered quality evaluation method for examining experienced quality. The
outcome is a research methodology for user-centered multimodal quality evaluation for video on
mobile devices. Within the methodology, emphasis is given to quality evaluation in the context of
use, descriptive quality, and measurements of minimum quality levels that are useful.
Scope. Nature of this thesis is multidisciplinary. It primarily belongs to the research field of
human-computer interaction (HCI) : ‗Human-computer interaction is a discipline concerned with the
design, evaluation and implementation of interactive computing systems for human use and with the
study of major phenomena surrounding them (Hewett et al., 1996)‘. Secondarily, it belongs to
research field of multimedia which covers the various aspects of multimedia systems and technology,
signal processing and applications (e.g. IEEE Transactions in Multimedia, 2010). Empirical work has
been conducted in multidisciplinary research teams.
In more detail, the scope of this thesis is to evaluate the low produced qualities of critical system
components in the next generation multimedia services under the viewing task on mobile devices. At
the time of conducting the studies, 2D/3D mobile video and television were considered as next
generation products. There were no similar systems available on the market, they were not adopted
by the users, and the related technologies and standards were still highly maturing. The term critical
system component refers to the part of the whole system that can have a negative impact or prohibit
the utility of the whole system from user‘s point of view (P1). Mobile (3D) TV is a service that is

3
capable of receiving, reproducing and distributing (stereoscopic) video and audio content through
different networks and that can be used via a pocket sized mobile device (adapted from Oksman et
al., 2008). In mobile 2D/3D television under the broadcasting scenario, multimedia processing is
extremely demanding requiring a high-level optimization in multiple stages of the system from
capturing content, coding, transmission, presentation on display. This can result in independent or
jointly occurring noticeable impairments or artefacts in the presentation of content (Overview, Boev
et al., 2009). The term low quality characterizes a multimedia presentation which can contain
perceived noticeable impairments and the viewing or listening conditions are limited (e.g. small
screen size), and the term makes a distinction to perceptually impairment-free high-qualities (e.g.
top-end multi channel audio, or high-definition visual presentation). One aim is at ensuring that the
experienced quality of critical system components, developed in isolation from the other components
of product constitutes no obstacle to the wide audience acceptance of a product or service (P1). From
the system perspective, non-functional system-components are the focus. Furthermore, this thesis
focuses on the user assessment of the quality while viewing content because viewing is the most
important phase in video content use. The user‘s interactive tasks prior to and during the viewing
with a device are out of the scope of this thesis.
Table 1 The relation between the research questions and the publications.
Research Questions
Publications
RQ1. What are the components of user-centered multimodal quality
of experience for video on mobile devices?
a) How is quality of experience influenced by different factors of produced
quality and what are the common components of the descriptive quality
of experience?
b) How is quality of experience influenced by the context of use and what
are the common components of the descriptive quality of experience in
the context of use?
RQ2. How to evaluate user-centered multimodal quality of experience for
video on mobile devices?
a) What is the general framework for user-centered quality evaluation?
b) How to measure minimum quality levels that are still useful?
c) How to measure the excellence of quality and identify the attributes of
experience?
d) How to evaluate quality of experience in the context of use?
P1, P2, P6, P7, P8,
P9, P10, P11, P12
P1, P4, P8, P3, P5,
P10
Method - The thesis contains twelve extensive quality evaluation experiments and a literature
review. The experiments were carried out for mobile television and for mobile three-dimensional
television with a relatively low quality level. Each of the experiments has 30-75 naive participants
(non-students) forming a broad pool of data from over 500 participants. The experiments were
conducted in the controlled laboratory and field circumstances using hybrid data-collection methods
containing quantitative quality excellence evaluation, qualitative quality descriptions, and advanced
techniques for situational data-capture. The audiovisual system parameters varied on the level of

4
content (content types), media (presentation modes, bitrate, framerate, error concealments) and
transmission (MFER error rates). The literature review defined the framework for the problem of the
thesis and the central concept of the context of use for quality evaluation studies in the field. The
results of these studies are published in 12 scientific publications (5 in journals, the rest in the
conferences). The candidate is the first author in 10 publications and has a significant contribution in
all papers. In addition, the candidate has 16 supplementary publications in the theme of her thesis.
1.2 Results and contribution
This thesis provides both fundamental and applied research contributions. The descriptive Model
of User-Centered Quality of Experience (UC-QoE) and the evaluation methods developed summarize
the main outcome of this thesis. UC-QoE is constructed from four main components: the user‘s
characteristics, the system‘s characteristics, the context of use, and the experiential dimensions. 1)
The user‘s influence on the quality of experience was characterized by several demographic and
psychographic variables underlining the active nature of human perception at the sensorial,
emotional, attitudinal and cognitive levels. 2) The influence of the system quality factors depend on
their perceptual characteristics, modalities and the overall quality level. The visibility of objects, a
good spatial quality, and natural and impairment-free depth are essential for presenting video on a
small display. The relative dominance between modalities depends on the content type and the
overall quality level. Furthermore, the temporally dominating and accountable cut offs located within
or between modalities have an interruptive nature towards the viewing task. On the good quality
level, influent audio is found annoying. 3) According to the descriptive attributes, experienced
quality is constructed of the interpreted characteristics of video (audio, visual, audiovisual, content)
and the components of viewing experience and use (e.g. the task, ease of viewing, visual comfort and
user‘s relation to content). The descriptive quality model for mobile 3D video, containing the
attributes and a vocabulary, provides a timely guide for the development and evaluation of upcoming
systems. 4) Finally, the quality requirements drawn in conventional controlled conditions were more
easily detected and less appreciated compared to the requirements in the natural context of use with
variable physical and social distractions and actively divided attention. These studies also highlight
use-related aspects, not only quality. Taken together, quality of experience is a broader
phenomenon than the sensorial excellence of the system component, as it was earlier
understood, and therefore its evaluation and design need to consider the components
surrounding it.
The methodological contribution of the thesis has five parts: 1) the holistic framework was
developed to give an overview of the factors and techniques essential to its evaluation. It underlines
the selection of the users, the system parameters and contents, the context of evaluation as well as a
multi-methodological assessment to connect quality evaluation to the expected use. 2) Bidimensional
research method of acceptance was developed for identification of minimum useful level of quality
for use of a certain application as a part of quantitative quality evaluation. 3) Experienced quality
factor is an interview-based method with a light weight data-collection procedure to understand the
characteristics of the phenomenon under study. It can be used to complement quantitative quality

5
evaluation or during studies in the context of use. 4) Open Profiling of Quality is an advanced mixed
method which combines quantitative quality evaluation and qualitative descriptive quality evaluation
based on an individual‘s own vocabulary in a multi-step data-collection procedure. The methods 3-4
stress the understanding of descriptive quality attributes as a part of the evaluation of complex and
heterogeneous stimuli. 5) Hybrid method of quality evaluation in the context of use is a tool for
quasi-experiments conducted in natural circumstances (e.g. viewing mobile television while
travelling by bus). It contains a) a procedure for planning, data-collection and analysis, b) an
identification of the situational characteristics surrounding quality evaluation on the macro and micro
levels, c) the use of several techniques through the study. The methods presented vary in the levels of
details and they are partly related. These methods are concrete tools for practitioners to conduct
quality evaluation experiments within the framework presented and they have also contributed
to the standardization activities of the quality of experience evaluation (Strohmeier & Jumisko-
Pyykkö, 2011; Jumisko-Pyykkö & Utriainen, 2011).
Beside this main contribution, the model of context of use for mobile HCI was developed to
clarify the central concept of the context of use, its components, subcomponents and properties,
based on the systematic literature review of over 100 high-quality papers. The model can help both
practitioners and academics to identify broadly relevant contextual factors when designing,
experimenting with, and evaluating, mobile contexts of use.
The thesis is organized as follows: a literature review inspecting central the components of
quality of experience is presented in section 2. An overview of the existing evaluation methods is
given in section 3. Section 4 summarizes the research methods used and lists the main characteristics
of the studies of this thesis. The results are presented in two parts in section 5. At first, the
components of quality of experience based on the studies of this thesis are summarized. Secondly,
the methods for assessing user-centered quality of experience are presented. Finally, section 6
concludes the study.

6
2. Quality of Experience
The goal of this section is to provide an overview to quality of experience from three perspectives.
The first subsection - multimedia quality - aims at answering to the following questions: What are the
ingredients of human perception influencing experienced quality? What are the ingredients that affect
quality from system perspective? The second subsection reviews related work concerning quality of
experience in mobile televisions, categorized according to users, system and the context of use. In the
third subsection, the existing models of quality of experience are presented.
2.1 Key concepts
Quality - can be defined as a “degree to which a set of inherent characteristics fulfills
requirements” (ISO 9000, 2001). From the customer‘s perspective, it can be defined as “customer‟s
perception of the degree to which the customer‟s requirements have been fulfilled” (ISO 9001,
2001). In more detail, quality is “an integrated set of perceptions of overall excellence of an image
(Engeldrum, 2000) and has a dualistic nature as ―the degree of excellence of something” (Oxford
Dictionary, 2005) and as ―a distinctive attribute or characteristic possessed by – something” (Oxford
Dictionary, 2005). In this thesis, I understand quality to contain three different characteristics:
quantitative excellence, qualitative attributes and the ability to fill user‘s requirements. My definition
is: Quality is 1) an integrated set of perceptions of overall excellence and/or 2) composed of
distinctive perceptual attributes and/or 3) user‘s perception of the degree to which the user‘s
requirements have been fulfilled.
Quality of experience and quality of service - The candidate definitions for quality of
experience state that it is ―the overall acceptability of an application or service, as perceived
subjectively by the end-user‖ which includes end-to-end system effects and ―overall acceptability
may be influenced by user expectations and context” (ITU-T P.10, Amendment 1, 2008). Similarly,
the quality of experience indicates the degree of subjective satisfaction (Jain, 2004). More broadly,
the quality of experience can be seen as ‖a multidimensional construct of user perceptions and
behaviors” (Wu et al., 2009). The closely related term quality of service can be interpreted as a
subset of quality experience, defined as ”the collective effect of service performance which
determines the degree of satisfaction of a user of the service” (ITU-T Rec. E.800). These definitions
root mainly to the engineering quality research society of quality. According to these definitions the
nature of quality is strongly associated with quality as perceptual excellence of system components
while other aspects around it are less precisely defined.
User experience and usability - According to the candidate definitions of user experience
rooting to the HCI society, it is ―a person‟s perceptions and responses that result from the use/or
anticipated use of a product, system or service”(ISO 9241 – 210, 2010). ―UX is about technology
that fulfils more than just instrumental needs in a way that acknowledges its use as a subjective,
situated, complex and dynamic encounter. UX is a consequence of a user‟s internal state --, the

7
characteristics of designed system -- and the context -- within which the interaction occurs”
(Hassenzahl & Tractinsky, 2006). It is also attached to the positive aspect of use, being somehow
more than usability (e.g. Law & Schaik, 2010). Usability is defined as “the extent to which a product
can be used by specified users to achieve specified goals with effectiveness, efficiency and
satisfaction in a specified context of use” (ISO 9241-11, 1998). These definitions set the holistic
perspective to experience underlining the perceptions and responses which are influenced by user,
interaction with a system and context of use.
User-centered design - According to Keinonen (2004) ―UCD (User-Centered Design) is a broad
umbrella covering approaches such as traditional human factors and ergonomics, participatory
design, human-centered design, usability measurements and inspections, and design for user
experience”. UCD is based on a design process on information gathered from people who will use
the product (ISO 13407, 1999; UPA, 2008). UCD has its benefits not only in the terms of better user
and customer satisfaction, but also in better understanding of users, improved quality of the system
arising from more accurate system requirements, improved efficiency in the development (e.g.
avoidance of implementation of non-needed system features, avoidance of expensive changes in late
phase of development), improved level of acceptance of system, safety (Kujala, 2002; Damodaram,
1996; Muller et al., 1997). UCD, referred also as human-centered design, is a cyclic process
containing an active user involvement in the whole development activities from planning to design
and development, iterative design process as well as multidisciplinary approach (ISO 13407, 1999).
2.2 Multimedia quality
Multimedia is defined ―as the seamless integration of two or more media” (Heller et al., ,2001).
Individual media can contain text, sound, graphics, motion (ibid). Multimedia quality combines
perceived and produced quality. Perceived (also called experienced, hedonic, sensorial, affective)
quality represents the user‘s or consumer‘s side of multimedia quality, which is characterized by
active low and high-level perceptual processes (Lawless & Heyman, 1998; Bech & Zackharov, 2006;
Engeldrum, 2000). Produced quality describes the content and system related factors and they are
categorized into three different abstraction levels, called content, media and network (Nahrstedt &
Steinmetz, 1995; Wikstrand, 2003). A typical problem in multimedia quality studies is to optimize
quality factors produced under strict technical constraints or resources with as little negative
perceptual effects as possible. In novel multimedia services, such as mobile (3D) television, some
visible impairments can be a part of constructed quality and it is important to verify that the produced
quality can reach the user‘s quality requirements (P1; McCarthy et al., 2004).
2.2.1 Perceived quality
Human perception sets the boundaries for quality perception. Perception, defined as conscious
sensory experience, is constructed in an active process combining two processing levels (Goldstein,
2002). Low-level sensory processes concentrate on information processing and high-level cognitive
processes focus on understanding and interpretation. The line between these is not as clear as the

8
picture given, but it is made for emphasizing the approaches of the processing types and to clarify the
role of knowledge in different levels applied to video quality research.
In the low-level sensorial processing, data-driven bottom-up approach to perception is taken. The
purpose of early sensorial processing is to the extract relevant features from the incoming sensory
information. The sensorial processing remains a similar processing structure between senses: The
receiving receptor cells react to stimuli they are sensitive for, the incoming energy of stimuli (in a
form of electromagnetic waves for sound and vision) is transformed into an understandable form for
the neural processes of the brain, transduction is carried through pathways and finally, information is
processed in the primary cortical areas (e.g. overview, Goldstein 2002). During this process,
sensation gets a more structured form and it is prepared for higher-level processing. Early visual
sensorial experience is created from brightness, form, colour, stereoscopic and motion information
while pitch, loudness, timbre and location are the attributes of auditory processing (Grill-Spector &
Malach, 2004; Livingstone & Hubel, 1988; Lewici, 2002; Evans, 1992). These features are processed
in an automatic, parallel and mostly unconscious pre-attentive stage of attention (Treisman & Gelade,
1980). Low-level sensorial processes set the possibilities and constrains for the perception. The
identification of detection (absolute) and difference thresholds illustrates these properties. Several
low-level related processes can correlate with changes in demographic variables. For example,
contrast sensitivity, ability to detect slow motion and to quickly direct attention, decrease as a
function of the age (Jennings & Jacoby, 1993). The emphasis in quality evaluation research has
conventionally been in the modeling of low-level sensorial properties (e.g. Barten, 1999; Winkler,
1999). However, this approach may provide only a limited view to human perception and the final
quality judgment is always more than just receiving and processing incoming sensorial information.
In high-level cognitive processing, the interpretation of quality and its relevance to
intentions and goals are determined. This process, also called top-down processing, combines human
knowledge, emotions, expectations, attitudes and goal oriented actions to perception. It can modify or
complement the relative importance of different sensory attributes and enable human contextual
behaviour and active quality interpretation. Ulric Neisser‘s perceptual cycle (1976, Figure 1)
describes interaction between human perception and the surroundings on a high abstraction level. It
explains the influence of knowledge on our perception. The key concepts of the model are
knowledge, perceptual attention and stimuli. Knowledge is represented with the concept of schema
referring to hierarchal pre-existing data-structures built upon past experiences, abstract expectations
about how the world in generally operates, and representations of any property of external reality,
such as people, objects, events and situations. Focused attention is required for interpreting stimuli
and allocates limited and serial processing capacity to the attended entity (places, objects stimulus
attributes) and prioritizes the most relevant information for processing from sensorial channels
(Treisman, 1993). Schema directs attention. When the viewer has a schema indicating the most
important features of the situation, sensory processes select the most relevant samples from the
available stimulus environment (Bey & McAdams, 2002; Jennings et al., 2002). The selected stimuli
can further modify the structure of the schema in the case there are discrepancies between the
expectations laid by the schema and the structure of the sensory environment. To underline the role

9
of knowledge in quality perception, the study measuring the eye movement showed that the experts
and non-experts focus on different features in the images (Cui, 2003). The non-experts focused more
on brightness, while the experts emphasized more the clarity of edges and texture (ibid).
Available
Information
Object
Schema Exploration
Directs
SamplesModifies
Figure 1 Neisser’s perceptual cycle (1976) described the interaction between human perception
and environment.
Although the perceptual cycle presents the general frame for perception, there are more central
factors – emotions, attitudes, expectation and principles of ecological perception – also contributing
to high-level perception. Emotions, according to Arnold (1960, p.182) are: ‗the felt tendency toward
anything intuitively appraised as good (beneficial), or away from anything intuitively appraised as
bad (harmful)‟.They have several functions: 1) They vary on a positive-negative dimension
depending on the success in achieving goals (e.g. overview Oatley & Jenkis, 2003, Arnold, 1960). 2)
They guide human reactions as they activate the readiness to act, prompt plans as well as cause
changes in mental activity in the form of expressions, actions and bodily changes (Arnold, 1960;
Ekman & Davidson 1994; Oatley & Jenkis, 2003). For example, a decrease in framerate from 25 to 5
fps under a passive viewing task showed an increase in arousal by autonomic nervous system
(measured with skin conductance, hear rate, and bood-volume pulse) indicating a perceptual strain
(Wilson & Sasse, 2004). 3) They can act as heuristics in judgements; more attention is paid to
negative or positive than to neutral things, and objects in the same mood or with a similar attitude as
the perceiver are noticed easier (Oatley & Jenkis, 2003; Fiske & Taylor, 1991; Fredrickson, 2000).
4) They vary in their duration or can be either an object or non-object related (Ekman & Davidson,
1994). It has been proposed that a short term object-related emotions or non-object related moods are
essential for product perceptions (Desmet 2002, Gardner, 1985). Furthermore, Festinger‘s (1957)
dissonance theory states that people seek, notice and interpret data consistent with their attitudes and
avoid information that is inconsistent with their attitudes or choices (Fiske & Taylor, 1991). Bouch
and Sasse (2000) demonstrated the influence of attitude and expectations in their experiment in
which participants with low expectancies gave high ratings, and participants with high expectancies
were more critical in their evaluations. Finally, according to the approach of ecological psychology,
people perceive affordancies as action possibilities, or opportunities for action offered by a certain
object or environment (Gibson, 1979). This contextualises perception.
The interaction between the high-level cognitive and low-level sensorial processing levels has
been demonstrated in the recent studies. For example, domain specific-expertise not only directs

10
attention towards relevant objects or features in the scene but it can also introduce fundamental
changes in early visual processing influencing on change detection abilities in sensorial processing
(Werner & Thies, 2000; Sowden et al., 2000; Curran et al., 2009). Similarly, it has been shown that
emotion potentiates the effect of attention on contrast sensitivity (Phelps et al., 2006). These studies
underline that human perception is not only influenced by the individual differences on the different
processing levels, but also that these differences can have a joint influence on the final quality
perception.
Multimodal perception
Multimodal perception, integrating two or more sensorial channels, is much more complex than a
simple sum of different sensorial channels as different modalities complement and modify the final
perceptual experience (e.g. Shimojo & Shams, 2001; Hands 2004; Stein et al., 1996). In speech
perception domain, the McGurk effect is a classical example of audiovisual integration where the
mismatched visual and acoustical materials are integrated into a unified experience differing from
both presented material (McGurk & MacDonald, 1976). Fundamental cross-modal studies have not
only shown that the presence of other modality can influence on thresholds on other modality (e.g.
the influence of audio on visual motion detection) but also intensify the perception in other modality
(e.g. visually greater brightness is experienced when the intensity of sound is increased) (Stein et al.,
1996; Gregg & Brogden, 1952; Soto-Faraco & Kingstone, 2004 (overview)). A strong cross-modal
influence is also announced as an impact of audio on visual quality and vice versa in television
quality research (Beerends & de Caluwe, 1999; Reeves & Nass 1996; Storms 1998).
Appropriate integration of information from different sensorial channels is the requirement for
creation of unified multimodal perception. The detailed integration process of audiovisual perception
itself is still relatively unknown and complex, but there is evidence that it contains both early
combination and modality independent processing (Coen, 2001; Shimojo & Shams, 2001). Although
the processing is not understood in depth, synthesis between modalities is characterized by spatial
and temporal proximity (Slutsky & Recanzone, 2001). Audio led asynchrony is easier to detect and
more annoying than vision led (ITU-T J.100, 1990; Slutsky & Recanzone, 2001). In television
contents, inadequate synchronization reduces the clarity of message and distracts the viewer from the
intended content (Reeves & Nass, 1996).
Modality appropriateness hypothesis describes the relative dominance between modalities in
perception. The most appropriate, reliable or accurate modality with respect to a given task
dominates the perception (Welch & Warren, 1980). Similarly, when stimuli with two or more
discordant sensory modalities are presented, the modality with the greater resolution will have a
stronger influence on the perception than the modality with lesser resolution (ibid). Visual modality
can dominate in spatial tasks while audio in temporal tasks. Ventriloquist effect describes the
influence of visual stimulation on the perception of sound source (e.g. Vroomen 1999). For example,
in television viewing the voices are experienced to originate from the actors, not from the external
sound sources.

11
Relative importance between audio and visual data has also been demonstrated in television
quality evaluation on the suprathreshold level. Hands‘ (2004) content-based multimedia quality
model shows content-dependent importance between media. In the high motion sport content, video
quality has relatively more weight than audio. Both modalities are highly involved in head and
shoulder content, although the audio quality has a slightly more significant role. Neuman et al.,
(1991) explored the influence of audio on experienced quality while viewing High-Definition
Television (HDTV) with naïve participants. The results showed that participants had difficulties in
distinguishing audio qualities (mono vs. stereo, low vs. high fidelity) under the viewing task with
television contents. However, high-quality audio companied with television image resulted in a more
likeable, interesting and involving experience of quality indicating unconscious improvements in the
overall quality. Furthermore, it has been concluded that for creating an optimal multimodal
experience, the quality between audio and video needs to be in the same level of fidelities (Storms
1998; Woszczyk et al., 1995; Iwamiya, 1992). The composition between the audio and visual quality
can also be highly task dependent (e.g. Möller et al., 2010).
In summary, understanding the quality of experience is a matter of understanding the nature of
the underlying principles of human perception. The construction of human perception is an active
process in which individual differences in sensorial or cognitive level can influence the final quality
perception. These perceptual principles cannot be disregarded in quality evaluation research –
especially when emphasis is set to the experiential aspects of it. Fundamental research in multimodal
perception highlights the complexity of multi-channel information processing, requirements for
information integration and the task-dependency of modality appropriateness hypothesis. Evidence of
many of these aspects of multimodal perception phenomenon has also been shown in television and
video quality research. However, these studies are conducted in good viewing and listening settings
(large screens, several loudspeakers) with a relatively low level of detectable impairments in
presentation differing significantly from those of early mobile video and television.
2.2.2 Produced quality
Huge amounts of (3D) audiovisual data, limited bandwidth, vulnerable transmission channel, and
constraints of receiving devices (e.g. screen size, computational power, battery life-time) set specific
requirements for produced quality of multimedia on mobile devices. As an example, mobile
television under the broadcasting scenario, content is captured, encoded, and transmitted over the
mobile broadcasting channel to be received, decoded and played back on small screens of mobile
device (Figure 2). All these steps are gone through in the development of mobile television and the
needed modifications are under investigation for mobile 3D television (S9). Artefacts, referring to
impairments, anything man-made or something introduced through process that is not naturally
present, can occur independently or jointly, influencing experienced quality in the end (Oxford
Dictionary, 2005; Boev et al., 2009, Figure 3). These can affect spatial, temporal and depth quality. A
short overview is given in this section.

12
Figure 2 Produced quality in mobile 3D television system: Steps from content to visualization
on display under three different abstraction levels.
Content-level quality factors are related to the communication of information from content
production to viewers (Nahrstedt & Steinmetz, 1995). Both broadcasted and user-created contents are
appealing for mobile (3D) television (S8; Buchinger et al., 2009). Previous studies, carried out for
mobile (2D) television, are focused on content manipulations and studies about acceptable text size
and shot types (e.g. overview Knoche, 2010). For presenting content on small screen, too small
object sizes can make viewing hard or impossible, but also cause eye-strain (Lambooij et al., 2009).
Media-level quality factors include media coding for transport over the network and rendering on
receiving terminals (Nahrstedt & Steinmetz, 1995). Mobile TV and video studies have broadly
addressed the influence of compression capability of codecs, temporal factors (audio sampling
frequency, video framerate) as well as spatial factors (audio mono/stereophonic sound, video
resolution, bitrates) on perceived quality (e.g. Winkler & Faller, 2005; Knoche et al., 2005). In
addition, joint influence typical to multimodal applications has been investigated, e.g. audio-visual
skew, bitrate-share and error-control methods (Winkler & Faller, 2005; Knoche et al., 2006; Gulliver
& Ghinea, 2006). The typical artefacts can contain asynchronism between media, impression of pre-
echoes or roughness, double speak in audio, as well as blocking, ringing, mosaic patterns, jerkiness,
and color bleeding in video (Brandenburg, 1999; Boev et al., 2009).
Adaptation from 2D to 3D mobile television also requires changes in the media level. So far, the
focus has been on technical development to find solutions to many critical parts of the system.
Capturing the content is a particularly the vulnerable point of the chain. The position of the cameras,
their relative angle and distance of operation as well as down-scaling the size or resolution of a
stereoscopic pair to the small screen can result in visible artefacts, such as unnatural correspondence
between images (i.e. vertical disparity) (Boev et al., 2009). In the encoding phase, videos are
compressed by removing redundant and perceptually irrelevant information not only in temporal and
spatial but also inter-channel domain to enable transmission with sufficient amount of bandwidth
(Tikanmäki et al., 2008; Strohmeier & Tech., 2010; S9). Different artefacts such as block-edge
discontinuities, colour bleeding, blur and staircase artefacts might be introduced to image details
(object edges, texture) with high importance to depth perception (Boev et al., 2009). While these
factors have been mainly addressed from a development point of view, there are only few studies
targeting on their subjective quality on small screen size (representation formats: Strohmeier & Tech,
2010).
Network-level quality factors describe data transmission over a network to the mobile receiver
wirelessly. Physical characteristics of the radio channel can cause imperfections to video. The source
of error can be in interference from other co-channel signals, multi-path propagation due to signal
reflection from different natural and man-made structures in the vicinity of the receivers, fading as
CaptureVisualization
on DisplayDecodingTransmission
and Error
Resilience
CodingContent
MediaNetwork
MediaContent

13
well as speed on receiving device (Köpke et al., 2003; Himmanen et al., 2008). DVB-H represents
one of the mobile TV standards and the most typical errors in the DVB-H transmission are burst
errors caused by packet loss and their nature; the frequency and duration may vary (Poikonen &
Paavola, 2006). To minimize the effect on interference and errors during transmission, error
resilience methods are used. Forward error correction coding (FEC) is used as a technique in
broadcasted services to protect data (Reed & Solomon, 1960). The artefacts introduced in the
transmission phase are for example: jitter, data distortion and loss (Boev et al., 2009).
Finally, Display factors as a last step of the whole chain set their own characteristics on perceived
quality. Previous studies in 2D have investigated optimal physical screen size (Knoche, 2010). For
3D presentation, autostereoscopic display techniques are considered to be suitable for mobile devices
(e.g. Willner et al., 2008; Flack et al., 2007; S9). 3D is created without wearable glasses by an
additional optical layer placed on the surface of screen to divide the view into (two or more) fields
shown for right and left eye (Flack et al., 2007). Due to the imperfect separation of different views
(influenced by viewer‘s position and quality of the filter) these displays suffer from cross-talk
perceived as a ghosting effect (Kondrad & Angiel., 2006). Other common visible artefacts are, for
example, banding artefact/picket fence effect (vertical stripes with different luminance levels over the
image) and aliasing effects influencing colors (Boev et al., 2009). For 3D on small screens, the
influence of presentation modes (2D, 3D) on still-image quality has been explored (Shibata et al.,
2009).
In summary, produced multimodal quality factors for mobile television have been studied to some
extent while the work on next generation mobile 3D television is in progress. 3D requires adaptation
to the whole value chain, and critical system components of this chain are under examination from a
technical perspective in all levels from content to display, but their influence on experienced quality
is not yet well understood. Relating to the quality of both 2D and 3D mobile televisions, it is known
that the produced quality is presented under limited viewing conditions and it can be inferior in
nature resulting in relatively low perceived quality (e.g. compared to cinema). In the end, to make
value for people, produced quality needs to fulfill the user‘s requirements. Subsection 3.3 reviews
these requirements in more detail.

14
Figure 3 Example of an exhaustive list of possible artefacts in spatial, temporal and depth
domains of stereo video presentation from capture to visualization (Boev et al., 2009).
2.3 Descriptive models
This section presents a review of the main existing descriptive models of the quality of experience
and user experience. The goal of this section is to answer to the question: What are the components
of experienced quality based on the models? The review focuses on the presentation of the
descriptive models to capture the components of the multifaceted nature of experienced quality.
Although the model is defined as ―a simplified description -- of a system or process, to assist
calculations and predictions” (Oxford Dictionary, 2005), the predictive objective models are out of
the scope of this review as their examination level is commonly one detailed aspect of quality (e.g.
spatial visual quality) and they can lack the correlation to experiential subjective quality (e.g.
Winkler, 1999; Barten 1999). It is worth of pointing out that the selected descriptive models of
quality of experience describe broadly some of the aspects of quality perception or experience, but
they have not originally been named as models of quality of experience as this term has lately
become established (cf. subsection 2.1). As the existing user experience models are numerous and
their emphasis varies from design and phenomenology to emotion and system-oriented models (e.g.
overview Mahlke, 2008), the models highlighting the basic components of experience with relevance
to mobile use are presented.

15
2.3.1 Models of Quality of Experience
Engeldrum’s Image Quality Circle
―The Image Quality Circle (IQC) is a robust framework, or formulation, which organizes the
multiplicity of ideas that constitute image quality‖ (Engeldrum 2004, p. 447, Figure 4). Its four
elements define image quality: 1) Technology variables describe the (imaging) products e.g. pixels
per inch. 2) Physical image parameters are quantitative, objective and physically measurable with
instruments or computations on an image file. 3) Customer perceptions – ―the nesses‖ are the sensed
or interpreted attributes of image (e.g. colourfulness, brightness). 4) Customer image quality rating
represents the excellence of the technology variables, judged by using psychometric scaling
experiments. To describe the main connections of the model, customers construct several ―nesses‖ as
interpretations of sensed image attributes. The composition of these ―nesses‖ (image quality models)
further defines the customer image quality rating of the technology variables. The ratings are used to
evaluate and improve technology the variables iteratively. The image quality circle is a general
model of quality. Although it is originally designed for image quality only, it is not only limited to
that. The strength of the model is that it highlights two structures of quality perception: interpreted
attributes and excellence. However, it does not describe in detail what the ―nesses‖ are. Furthermore,
the model does not relate quality to the final products. It can be argued that these appropriateness
evaluations are necessary for new products or erroneous products to show that the quality provided is
appropriate.
Customer
Image Quality
Rating
Visual
AlgorithmsSystem/Image
Models
Customer
Perceptions –
The ”Nesses”
Physical Image
Parameters
Technology
Variables
Image
Quality
Models
The
Image
Quality
Circle
Figure 4 Engeldrum’s (2004) image quality model.
Seuntiëns’ 3D visual experience model
Seuntiëns (2006, Figure 5) has presented a model of 3D visual experience to extend the model of
image quality circle. Customer image quality rating is referred to as 3D visual experience. It is
composed of naturalness which combines both possible negative and positive dimensions of 3D
quality perception – excellence and possible distortions of image quality and the added value of

16
depth perception. Furthermore, visual comfort is included in the model, although its relation to the
viewing experience and naturalness is not accurately defined in the model. In 3D, visual discomfort
can be caused by accommodation-convergence, 3D artefacts, blur (cf. overview Lambooij et al.,
2009). The development of a 3D visual experience model is based on a series of image quality
evaluation studies. The goal has been to find the concepts to convey the known positive effects of
depth and variation in image quality. The image performance oriented measures have not been
accurate enough to identify these two dimensions. Naturalness, viewing experience, presence, image
quality and depth were among the tested dependent variables when depth and visual distortions were
varied. The strength of the model is the identification of the multidimensional experiential aspects of
the 3D visual experience, called naturalness, quality, depth and visual comfort. It can also be argued
that from the end-user‘s point of view, there should be one global measure to indicate the excellence
of quality. As Seuntiëns (2006) proposed: ―In appreciation-oriented applications, such as 3D TV, the
goal is to display 3D images as „pleasing‟ as possible”.
3D Visual Experience
Naturalness
Image Quality Depth Visual Comfort
Figure 5 3D visual experience model (Seuntiëns, 2006).
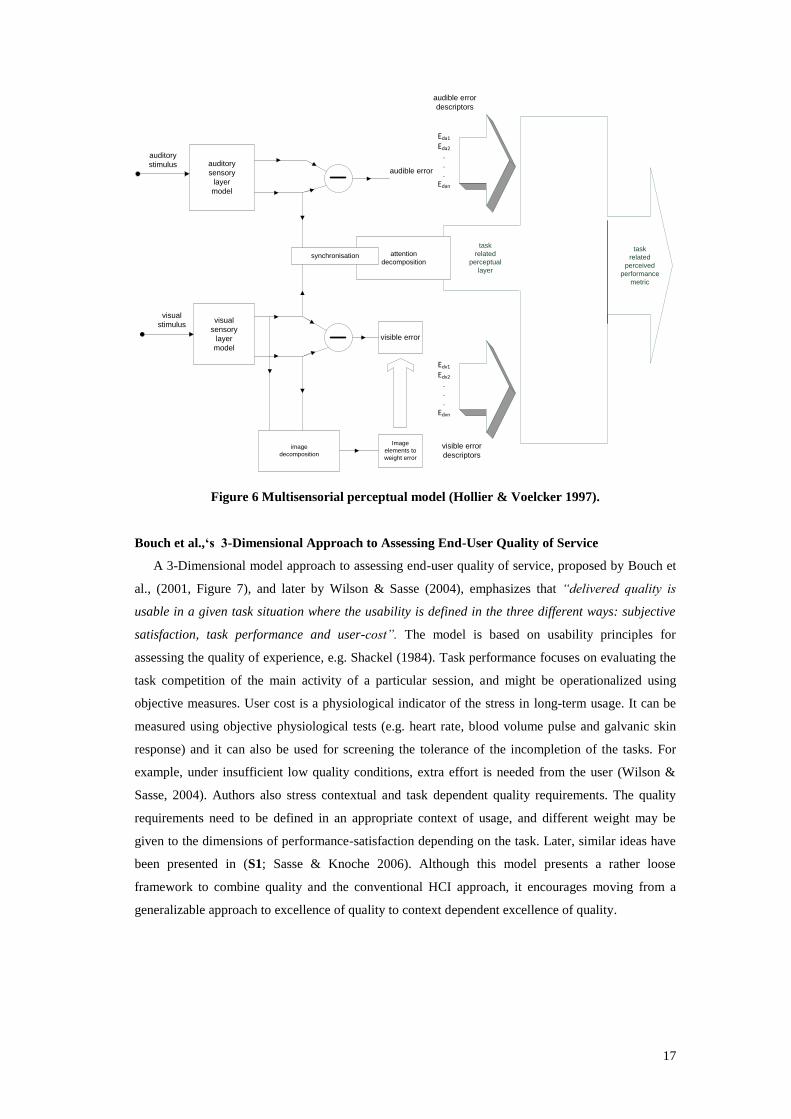
Hollier & Voelcker’s Multi-modal perceptual model
Hollier & Voelcker (1997, Figure 6) introduced a multi-modal perceptual model to guide
multimodal perceptual assessment and development of metrics. The model has three main levels: 1)
Audio and visual information is processed on each sensorial level based on the sensorial properties of
each modality. 2) On a higher perceptual level, relevant to the final quality judgment, the influence of
audible and visible error descriptions on the quality judgment is formulated. 3) Information from
different modalities is integrated when they are synchronized; the integration is weighted according
to the requirements of the task. The model has been used as a base e.g. for modeling content-
dependent multimedia quality (Hands, 2004). The multi-modal perceptual model is a system-oriented
model. Although the task is playing a significant role in the model for the final quality of experience,
the authors have later pointed out that the definition of the task is inaccurate (Hollier et al., 1999). To
extend this model towards user-centered ideas, the user‘s sensorial orientation (Childers et al., 1985),
as well as other factors in the surrounding context of use, may influence the experienced quality – not
only the task.
17
task
related
perceptual
layer
auditory
sensory
layer
model
visual
sensory
layer
model
attention
decompositionsynchronisation
image
decomposition
Image
elements to
weight error
task
related
perceived
performance
metric
auditory
stimulus
visual
stimulus
audible error
visible error
visible error
descriptors
audible error
descriptors
Eda1
Eda2
.
.
.
Edan
Edv1
Edv2
.
.
.
Edvn
Figure 6 Multisensorial perceptual model (Hollier & Voelcker 1997).
Bouch et al.,‘s 3-Dimensional Approach to Assessing End-User Quality of Service
A 3-Dimensional model approach to assessing end-user quality of service, proposed by Bouch et
al., (2001, Figure 7), and later by Wilson & Sasse (2004), emphasizes that “delivered quality is
usable in a given task situation where the usability is defined in the three different ways: subjective
satisfaction, task performance and user-cost”. The model is based on usability principles for
assessing the quality of experience, e.g. Shackel (1984). Task performance focuses on evaluating the
task competition of the main activity of a particular session, and might be operationalized using
objective measures. User cost is a physiological indicator of the stress in long-term usage. It can be
measured using objective physiological tests (e.g. heart rate, blood volume pulse and galvanic skin
response) and it can also be used for screening the tolerance of the incompletion of the tasks. For
example, under insufficient low quality conditions, extra effort is needed from the user (Wilson &
Sasse, 2004). Authors also stress contextual and task dependent quality requirements. The quality
requirements need to be defined in an appropriate context of usage, and different weight may be
given to the dimensions of performance-satisfaction depending on the task. Later, similar ideas have
been presented in (S1; Sasse & Knoche 2006). Although this model presents a rather loose
framework to combine quality and the conventional HCI approach, it encourages moving from a
generalizable approach to excellence of quality to context dependent excellence of quality.

18
User
satisfaction
User
cost
Task
performance
Figure 7 3-Dimensional Approach to Assessing End-User Quality of Service (Bouch et al.,2001).
Ghinea & Thomas’ Quality of Perception
The model of Quality of perception (Figure 8) is developed by Ghinea & Thomas (1998),
Gulliver & Ghinea (2004a), Gulliver et al., (2004a). It underlines human goal-oriented actions as a
part of quality; for multimedia consumption they are mainly entertainment and learning. QoP is a
combination of satisfaction and information assimilation (Figure 8). Satisfaction has two dimensions,
enjoyment and the level of objective quality (e.g. refers here to subjectively evaluated but content
independent quality such as sharpness, blurriness etc.). The model has been widely applied to
quantify the experienced quality for different system parameters, and devices and the evaluations
have also been complemented by eye-tracking data (Gulliver et al., 2004a, b; Serif et al., 2004).
Although the model takes a novel move towards quality and goal-oriented actions, there seem to be
some challenges. For example, there seems to be a lack of subjective and objective measures in this
model (e.g. the component of satisfaction is significantly more sensitive to variation in quality than
information assimilation (Gulliver et al., 2004a,b; Ghinea & Thomas 1998). Furthermore, the
question of content dependent appropriateness of the different components in evaluation is left open
(entertainment vs. infotainment content). These challenges may underline that the understanding of
the nature of quality of experience is still incomplete.
Quality of Perception
QoP
Information
assimilationSatisfaction
Objective
qualityEnjoyment
Figure 8 Quality of perception (QoP) model visualized from Gulliver et al., (2004a).

19
Perreira’s triple sensation-perception-emotion user model for content adaptation
Perreira (2005) introduced a hierarchical triple sensation-perception-emotion user model for
content adaptation. The first layer of the model describes experience on a sensorial level. Its
evaluation concentrates on factors such as fidelity, sharpness or blurriness, and a content adaptation
is achieved by adjustments of the conventional quality of service parameters (e.g. spatial, temporal
resolution). The perceptual layer of the model contains the interpretation of information from content
and describes the user‘s satisfaction as a cognitive experience (e.g. ability to learn/find information).
Technically, the content requires adaptation to improve human cognitive performance (e.g. improved
text readability, spatial information presentation or modality preferences). On the emotional layer,
the user‘s satisfaction is expressed as the intensity of the emotional experience and the aim is to
present the content in a way that it increases the emotional intensity by adjusting features (e.g. color
temperature, adaptation, additional modalities). This model binds together the levels of human
information processing and broadens the view to achieve the highest possible user satisfaction at all
levels with novel adaptation solutions for multimedia quality.
2.3.2 Models of User Experience
Hassenzahl & Tracktinsky’s model of user experience
The classical definition of user experience by Hassenzahl and Tracktinsky (2006, p. 95) states
that user experience is ―A consequence of a user‘s internal state (predispositions, expectations, needs,
motivation, mood, etc.), the characteristics of the designed system (e.g. complexity, purpose,
usability, functionality, etc.) and the context (or the environment) within which the interaction occurs
(e.g. organisational/social setting, meaningfulness of the activity, voluntariness of use, etc.)‖. The
main experiential attributes are the user‘s perceived hedonistic quality and perceived pragmatic
quality and they can be evaluated through beauty and goodness respectively (Hassenzahl, 2004). This
definition states that the building blocks of the user experience are the characteristics of the user, the
system and the context of use and the outcome of interaction (as broadly understrood), is described
by the different experiential qualities. The model has a broad and strongly user-centric focus, it has
benefits in the terms of providing a loose and general frame for the factors of user experience, but it
lacks the details that would be necessary for understanding experienced quality of system.
Mahlke’s Components of user experience
The model (Figure 9) proposed by Mahlke (2008), Mahlke & Thüring (2007), Thüring & Mahlke
(2007) presents the user experience components, influencing factors and consequences. The user
experience has three main central components: 1) instrumental quality, 2) non-instrumental quality
and 3) emotional user reactions. The instrumental quality of an interactive system is related to the
tasks and goals that the user wants to accomplish with a system and it highlights the aspects of
usefulness and usability. Non-instrumental quality is composed of sensorial aesthetics,
communicative and associative aspects of symbolism and motivational qualities. Emotional user
reactions contain multiple aspects, such as subjective feelings, physiological reactions, motor
expressions, cognitive appraisals and behavioral tendencies. These experiences are influenced by the
factors of human-technology interaction, named system properties, user characteristics and context

20
and task parameters. The consequences of user experience are the overall judgments of a product or
system, choice between available alternatives or user behavior. As this model is broad, holistic and
underlines universal aspects of user experience, it suffers from inaccuracy when focusing on the
product components, such as multimodal quality. However, the influencing factors (user, system,
context) and perception of non-instrumental quality may represent the characteristics for experienced
multimodal video quality on mobile devices.
System properties
User characteristics
Context / task parameters
Human-technology
interaction
Perception of
instrumental qualities
UsefulnessUtility
UsabilityEfficiency
Controllability
Helpulness
Learnability
Emotional user reactions
Subjective feelings
Motor expressions
Physiologial reactions
Cognitive appraisals
Behavioural tendencies
Perception of non-
instrumental qualities
Aesthetic aspects
Visual aesthetic
Haptic quality
Acoustic quality
Symbolic aspects
Associative symbolics
Communicative symbolics
Motivational aspects
User experience components
Consequences of the user experience
Overall judgements
Choise between alternatives
Usage behaviour
Figure 9 Components of user experience by Mahlke (2008).
Roto’s Mobile browsing user experience
Mobile browsing user experience is a system-centric user experience model, presented by Roto
(2006). The main affecting attributes of experience are user, context and system (Figure 10). User as
a person controlling or manipulating a system is characterized by motivation, experiences,
expectations, mental state and resources. Context, representing the circumstances in which mobile
browsing takes place, is composed of physical, social, temporal and task contexts. A system required
for an examined product to work or to be useful is constructed of the experiential aspects of a mobile
device, browser, connection, gateway and site. All in all, the advantage of the model is the careful
and detailed categorization of the experience factors and the related definitions of its concepts.
Although this model is an application field specific to mobile browsing, it has at least two strengths

21
from the point of view of multimodal video quality for mobile devices: 1) The model may generalize
to user experience of other quality of service critical mobile applications and services beyond mobile
browsing, such as mobile TV. 2) The model shows that different system components may reflect
different aspects in the user experience. For example, usability is announced to be among the aspects
for all other system components except connection.
Figure 10 Mobile browsing user experience (Roto, 2006, reprinted with permission).
Davis’ Technology Acceptance Model
Technology Acceptance Model (TAM) describes the factors predicting the intention to use an
information system and its adoption behavior (Davis, 1989; Venkatesh et al., 2003). TAM was
originally developed to measure the acceptance of information systems for mandatory usage
conditions, but later it was adapted and modified for consumer products and mobile services (e.g.
Amberg et al., 2004; Kaasinen, 2005; Papagan, 2004). Usefulness and ease of use are the main
components to predict the behavioural intention to use the tested technology. Usefulness refers to the
degree to which a person believes that a certain system will help perform a certain task while ease of
use is a belief that the use of the system will be relatively effortless. Low produced quality might be
one of the obstacles in the acceptance of technology (Davis, 1989; Venkatesh et al., 2003). In mobile
multimedia, failures of produced quality factors, such as screen size and capacity, interface
characteristics of mobile devices, wireless network coverage, capabilities and efficiency of data
transform (Amberg et al., 2004; Bruner & Kumar, 2005; Papagan, 2004; Sarker & Wells, 2003) can
have indirect effects on usage intentions or behavior by affecting the perceived usefulness and ease
of use (Davis, 1989; Venkatesh et al., 2003). In the further developments of the model, e.g. TAM for
mobile services, trust is one of the influencing factors of the intention to use (Kaasinen, 2005). To
estimate the strengths of the model, it aims at describing the expectation-based prediction to use,
which can be suitable when the system is under development. However, from the multimedia quality
perspective, the model does not necessarily describe the actual experiential characteristics, the
positive aspects of the experience or the differences in quality in fine granularities.

22
Summary - The components of the quality of experience and user experience models are
summarized in Table 2. The five main common components of the models can be identified:
Experience is influenced by 1) characteristics of the user, 2) characteristics of the system and 3) the
context, 4) experiential influences and 5) the consequences of experience. In the most extensive user
experience models, all these are taken into account (e.g. Mahlke, 2008). The characteristics of the
user, system and context as well as the experiential components covering the aspects of utility (ease
of use, usefulness, pragmatic quality) and aspects of impressions (non-instrumental, hedonistic
qualities) are replicated in several models with slight variations. Furthermore, the consequences or
expected consequences of user experience are part of two models. The view to the quality of
experience provided by the models is significantly narrower than in the user experience models. Only
two of the common components are part of the quality of experience models underlining the system
characteristics and experiential influences. The system characteristics cover technology and physical
variables, features of content and media characteristics. The experience is composed of excellence,
impressions (e.g. ―nesses‖), relation to or performance in task, and cost. Due to the gap between the
theoretical models, the influence of the user‘s characteristics, the context of use and the consequences
of the quality of experience need to be addressed in more detail.
Table 2 Components in the models of quality of experience and user experience.
MODEL
(Reference) COMPONENTS
Image Quality Circle
(Engeldrum, 2000)
Customer perceptions – The ‗Nesses‘, Customer image quality rating,
Technology variables, Physical image parameters
3D Visual Experience
(Seuntiëns, 2006)
Naturalness, Image quality, Depth
Multi-modal perceptual model
(Hollier & Voelcker 1997)
Auditory and Visual sensory layer, Synchronization, Attention, Task related
perceptual layer
Quality of Perception
(Ghinea & Thomas 1998)
(Gulliver & Ghinea, 2004a),
( Gulliver et al., 2004a)
Satisfaction: Objective quality, Enjoyment
Information assimilation
A3-Dimenisonal approach to Assessing
End-User Quality of Service
(Bouch et al., 2001;
Wilson & Sasse, 2004)
Task performance, User cost, User Satisfaction (in a given task situation)
A Triple sensation-perception-emotion
user model for content adaptation
(Perreira 2005)
Features to facilitate Sensorial, Perceptual, Emotional layers
User experience
(Hassenzahl and Tracktinsky 2006)
(Hassenzahl, 2004)
User‘s internal state
The characteristics of the designed system
The context within which the interaction occurs
Perceived hedonistic and pragmatic quality.
User Experience Components
(Mahlke, 2008;
Mahlke, S. & Thüring, M., 2007;
Thüring & Mahlke 2007)
1) User experience components: Perception of instrumental qualities, Perception of
non-instrumental qualities, Emotional user reactions
2) Influencing factors of human-technology-interaction: User, System, Context/Task
characteristics
3) Consequences of user experience
Characteristics of mobile browsing
user experience
(Roto, 2006)
User: Need, Motivation, Experiences, Expectations, Mental state, Resources
System: Mobile device, Browser, Connection, Gateway, Sites
Context: Physical, Social, Temporal, Task
Technology acceptance model
(Davis 1989; Venkatesh et al., 2003)
Usefulness, Ease of Use, Behavioral Intention to Use, Actual system use

23
2.4 Influence of user, system and context on quality of experience
This subsection reviews the influence of the user, the system/service and the context of use on the
quality of experience. The goal of the section is to answer the following questions: What kind of
components exist and how do they influence experienced quality?
2.4.1 Users
Studies comparing psychographic differences in video quality requirements are rare. In the
optimal case, the sample selection criterion in product development oriented quality evaluation
studies should target on potential users (Engeldrum, 2000). In the study of McGarthy et al., (2004),
targeting on one of the potential user groups for mobile TV, a group of soccer fans evaluated the
acceptance of football content when varying the frame rate and the frame quality. The results showed
that the participants accepted surprisingly low-quality video clips (6 fps of 80% time) indicating that
sufficient interest in the content might override the annoying effect created by even relatively gross
impairments present in the contents.
Outside the mobile video domain, the influence of cognitive styles on the perceived video quality
has been examined in a series of studies by Ghinea & Chen (2006, 2008) and Chen et al., (2006).
Cognitive style is an individual‘s characteristics and consistent approach to organizing and
processing information (Weller et al., 1994). The studied cognitive styles targeted on 1) sensorial
orientation (visualizer, verbalizer, bimodal) emphasizing the role of information presentation and 2)
field dependent processing styles (field-dependent learners, intermediate and field independent
learners) characterizing the way the surrounding perceptual field of context is contributing to
learning. In the experiments, framerate and color depth were varied for the audiovisual video clips,
presented on mid-sized screens and tasks of information assimilation and enjoyment were included in
the evaluations of perceived quality. The results showed neither differences between the groups nor
influence of different parameters on perceived quality for the whole sample, but the differences
between the groups were announced as preferences of contents and content presentation forms (e.g.
dynamic/static video). These results suggest that the way the content is constructed can have a
different influence on different groups, while substantial savings in produced quality can be reached
without a significant effect on the participants‘ level of understanding and enjoyment of multimedia
applications.
Furthermore, other studies, outside the mobile video have underlined the role of expectations in
relation to quality requirements. For example, in an image quality acceptability study of photographic
prints by Miller and Segur (1999), the participants were categorized into three different market
segments referred to as advanced, medium and low users of photographic and personal computer
products. Without knowledge of the image source, quality was equally evaluated between the groups.
However, when the participants were told that the images originated from upcoming technology (a
digital camera), the group of advanced participants was more tolerant towards image quality
compared to the other groups. For the advanced users, the expectations for novel technology seem to
modify the perception of provided quality compared to the other segments. For the lossy audio

24
evaluation, Bouch & Sasse (2000) showed that the groups of participants with low quality
expectancies gave high ratings while the groups with high expectancies were more critical in their
evaluations. These two studies show how prior expectations of technology or its performance can
contribute to final quality requirements.
Beyond these end-user oriented studies, the most common way to classify a sample to naïve or
expert evaluators is based on domain-specific knowledge. A naïve evaluator is a person who is not
directly involved with audio or picture quality or technology in his work and is not an experienced/
expert assessor (ITU-R BT.500-11, 2002; ITU-T. P.910, 1999; ITU-T. P.911 1998; ITU-T. P.920,
2002). An expert assessor has a high degree of sensory sensitivity and is trained for sensory testing
(ISO 8586-2., 1994). When comparing these groups, it has been shown that the experienced
evaluators are more critical in their evaluations, especially in low video quality with visible
degradations, and use a wider evaluation scale compared to naïve assessors (Hands et al., 2005; Cui,
2003; Heynderickx & Bech, 2002; Deffner et al., 1994; Speranza et al., 2010). Expert viewers are
also expected to be more consistent in their evaluations (Hands et al., 2005; Heynderickx & Bech,
2002). The sample selection criteria between naïve and expert assessors vary according to the target
of study. Naïve assessors are selected when the goal is to quantify the overall or general impression
of stimuli. This type of assessment assumes the participant‘s context, emotion, expectations and
background factors to be part of the evaluation process (Bech & Zacharov, 2006). In the audiovisual
quality experiments, the emphasis is on naïve evaluators, but experts are often used in pilot tests prior
to conducting a larger number of tests. When the goal of a quality evaluation study is to identify or
elicit certain quality attributes, experienced assessors are selected (Bech & Zacharov, 2006).
In sum, the quality of experience is not independent of the user‘s characteristics. According to a
few previous studies, there are three types of connections: 1) the user‘s relation to content in terms of
the information processing style and, as is expected, interests in the content, 2) the user‘s
expectations of quality and 3) knowledge about the characteristics of quality under study. These
characteristics remain similar to, the user‘s characteristics in holistic user experience studies, but
cover only a part of them. Further work needs to address more broadly the influence of these
background factors covering the user‘s relation to content (e.g. interests, knowledge), attitudinal
aspects towards technology (e.g. domain specific innovativeness) and knowledge about digital
qualities to understand their influence on experienced quality.
2.4.2 System
Visual and audiovisual video quality is a combination of multiple factors. This section gives a
short overview of the influence of these factors on perceived quality. Within the scope of this review
are: 1) results which are based on empirical experimental studies with users when the viewing and
listening conditions can be interpreted as comparable to mobile device conditions, 2) factors that
influence quality during viewing, but do not contain user-interaction (e.g. channel switching time), 3)
video or audiovisual factors as they can be understood as a necessary part of video in contrast to the
audio-only condition.

25
2.4.2.1 Content
Content on small screen – The visibility of the necessary details can suffer when television
material originally designed to be viewed on large screens is presented on small screens. To improve
the video viewing on small screen, a series of studies has examined the text legibility, shot types,
zooming and preferred size. Knoche et al., (2006a) studied the influence of text legibility on video
quality for news content. The results showed that an increase in the size of the news headlines and
the logo (from 3-6px to 9-12px) on a small display (120x126 px, 168x126 px on 21 pixels per
degree) significantly increased the experienced video quality with native viewers. Later, Knoche et
al., (2006b, 2008) analyzed the influence of shot types with different contents and spatial resolutions.
The shot types were categorized into six levels from extreme long shots (overall visibility of scene
e.g. buildings, sports) to close ups (head-and-shoulder content), depending on the content type and
resolutions (240x180, 208x156, 168x126, 120x90 px). All shot types are experienced acceptable
(above 70% of acceptance) while for the extreme long shots it is slightly lower (60%), in the highest
resolutions (240x180 px, 208x156 px). The results showed some content-dependency and they were
related to the small resolutions and the use of extreme long shots in particular. To improve the
viewing experience for extreme long shots with soccer content, Knoche et al., (2007) explored the
options for automated zooming. The zooming factors 1.14 and 1.33 were preferred for the tested
sizes from 176x144 (QCIF) to 320x240 (QVGA). High zooming of 1.6 was also experienced as
beneficial for 176x144 (QCIF). The descriptive quality components over these studies highlight the
following attributes: the visibility of details (e.g. text, object, shot, facial), juxtaposition between the
provided overview and details, visual quality, color and contrast, effort-comfort, the size in general
and fatigue (Knoche, 2010). Taken together, these results show that improvements in the visibility of
meaningful details in the content can contribute to improvements in the viewing experience on small
screens. In addition, the ease of viewing and an appropriate level of overview on the content also
contribute to the experienced quality on the content level.
Comparison between 2D and 3D presentation modes - Shibata et al., (2009) conducted a
comparison between monoscopic and steroscopic presentation modes for images on a mobile device.
The results showed that viewing on the stereoscopic presentation mode can improve experienced
quality compared to the monoscopic mode. Furthermore, viewing experience on the stereoscopic
presentation mode is described in terms of ―real-life likeness, presence, perceivable depth‖ as well as
negative aspects such as ―a troublesome feeling while watching and the impression of weirdness‖.
Although these results were concluded from a very limited sample (nine participants), they indicate
that the 3D presentation mode can improve visual image quality of experience and this experience is
not only associated with positive impressions but also with a negative consequence for the
stereoscopic quality.

26
2.4.2.2 Media level
Codecs and Bitrates - In a comparison of video codecs, H.264/AVC is experienced to give
higher visual quality than H.263 and MPEG-4 (Winkler & Faller, 2006; Zhai et al., 2008). The bitrate
describes the number of bits used to code a particular piece of data (bps). Zhai et al., (2008)
compared frame size (QCIF, CIF), bitrates (from 24kbps to 328kbps) and framerates up to 30 fps. At
least 0.1bpp is neededto provide good or excellent perceived quality, and this result is independent of
frame size and frame rate for QCIF (Zhai et al., 2008).
Framerate - Framerate is expressed as a unit of frames per second (fps), and it correlates to the
temporal resolution of video and has a less significant value than bitrate on small frame sizes (Zhai et
al., 2008). Insufficiently low framerates of video can give the impression of distinct snapshots and
can introduce instantaneous asynchrony to the presentation of audiovisual content (Knoche et al.,
2006; ANSI 1999). According to an extensive review by Chen & Thropp (2007), 15 fps is a threshold
for many human psychomotor and perceptual tasks. Apteker et al., (1999) found out in their
comparison of low framerates (5, 10, 15 fps at 160x120 pixels) that watchability decreased with
every step of 5 fps, and that its influence is strongly dependent on other factors, such as content and
the appropriateness of audio or visual media for the message of the content. In the studies of Gulliver
and Ghinea (2004a, b) and Gulliver et al., (2004b), the reduction of framerate from 15 to 5 fps causes
a significant decrease in quality satisfaction. Relevant to viewing conditions on mobile devices,
McCarthy et al., (2004) showed that the framerate of 12 fps seems to be critical for reducing the
acceptance ratings (at QCIF, above 100kbps). In the same study, a framerate as low as 6 fps was still
acceptable for 80% of the presented time, as long as the frame quality was high enough. The study of
Lu et al., (2005) showed that the influence of the framerate was independent of the resolutions
studied (QVGA and QCIF), and that the framerate of around 10 fps is the most critical to satisfaction.
Furthermore, the framerates of 8 fps and 15 fps are equally pleasing at very low bitrates (24-48 kbps,
QCIF) (Winkler & Faller 2005). Zhai et al., 2008 compared frame size (QCIF, CIF) bitrates (from
24kbps to 328kbps) and frame rates of up to 30 fps and concluded that bitrate gives more significant
value than framerate. The conclusions from the optimal combinations of frame rate, frame size, low
bitrates and content are a good example of the complexity of different parameter combinations: “For
the optimal combination of framerate and frame size, under the low-bitrates constrains, small frame
size is preferred, framerate should be kept low for video sequences with high temporal activity”
(Zhai et al., 2008).
Beyond quality satisfaction, the influence of framerates on cognition and emotion has been
studied. The viewer‘s ability to integrate visual information (in terms of correct answers from
content) is even increased when the framerate was decreased from 25 fps to 5 fps (Gulliver & Ghinea
(2004a, b, 2006). This may be explained by the prolonged viewing time per frame (at 25 fps – frame
visibility 40 ms; at 5 fps frame visibility 200 ms). In terms of visual attention and cognition, the
influence of framerate has not been announced (Gulliver et al., 2004b). Physiological measures have
indicated low framerate to be a source of physiological strain at the level of 5-10 fps (Meehan et al.,
2002; Wilson & Sasse, 2004). All in all, these results suggest that a perceptually appealing video
presentation on small screens can be achieved by using low framerates (8-15 fps) when the frame

27
quality is presented on an adequate level. However, for task accomplishment a lower framerate seems
to be enough (5 fps), but may result in physiological strain on the user.
Spatial resolution - Spatial resolution, also called frame size, describes the frame dimensions as
the number of pixels per frame. Among the multiple available resolution combinations Quarter
Common Interchange Format, QCIF (176 x 144 pixels), and Quarter Video Graphics Array QVGA
(320x240 pixels) have been common in early mobile multimedia devices while nowadays higher
resolution displays are on the market (e. g. Ipod 480×320 px). The spatial resolution combined with
other compression parameters has revealed a complicated impact on the perceived quality. Knoche et
al., (2005) examined the trade-off between the spatial resolution and encoding bitrates. Four different
image resolutions were varied (240x180, 208x156, 168x126, 120x90 pixels) with seven encoding
bitrates (video: from 224 to 32kbps and audio: 16 and 32kbps) on handheld devices. For the live
content (news, football, music video), the acceptable quality was reached when the size was
240x180, 208x156 and the bitrate was 128 kbps or higher. To present animation, the acceptable
quality was reached with a smaller screen size and bitrate (240x180, 208x156, 168x126 @ 32 kbps).
The reasons for unacceptable quality were: text details, object details, shot types, general details,
facial details, jerky pictures, audio fidelity, color and contrast. In addition, fatigue and effort were
listed. In the study of Lu et al., (2005), the effect of frame size (QVGA and QCIF) on perceived
quality depended on the contents.
Audio-visual quality - Few recent studies have examined the trade-off between audio and video
quality. Ries et al., (2005) compared the optimal share of audiovisual resources for three different
contents under low bitrate scenarios and different audio-video codec combinations at QCIF. The
study revealed three main results: 1) Audio-visual codec dependencies, where head and shoulder
speech content H.263 and AMR provided the most pleasant quality, while for fast motion contents
combined with music, the combination of MPEG-4 with AAC is the most pleasant. 2) Good audio
quality compensates the loss of visual information on low bitrates (56kbps), while on the higher
bitrates (75, 105kbps) audio quality does not have such a strong influence during dynamic visual
content viewing.
According to a study by Winker & Faller (2006), at very low total bitrates (56kbps, QCIF) the
experienced quality is influenced by both audio and video quality as well as their joint contribution
and it can be maximized when the video bitrate is between 32-40 kbps and audio is 16-24kbps for all
the contents used. Mono audio is preferred over stereo in comparison to the same bitrates because
stereo audio seems to appear as more distorted. Although this study did not specially underline
content dependent variations in audiovisual resources, the authors concluded that the importance of
audio seems to increase for complex visual scenes. The results of Knoche et al. (2005) showed that
the overall quality was rated higher when accompanied with audio on a lower bitrate (16kbps vs.
32kbps) when the video bitrate was 32-224kbps. To go beyond the 50% acceptance threshold, video
needs to have at least 96kbps. Based on the qualitative data, the importance of audio quality was
highlighted especially in the news content.

28
2.4.2.3 Transmission level
To characterize the time-varying quality, previous work has examined detection thresholds for
audio and visual stimuli and the nature of the least annoying error patterns. Pastrana-Vidal et al.,
(2004a; 2004b) investigated the characteristics of sporadic signal loss concentrating separately on
audio or video. Dependent on the content of its activity and the duration of the signal loss the
auditory detection threshold varies from 1ms to 6ms (Pastrana-Vidal et al., 2004a). The visual
detection threshold is 80ms and visual discontinuities (framedropping) are more visible in high-
motion contents (Pastrana-Vidal et al., 2004b). However, the duration of a discontinuity of 30ms is
audible in all contents and in video the unequivocal detection rate is 200ms (Pastrana-Vidal et al.,
2004a; 2004b). Huynh-Thu et al., (2008) conducted extensive experiments to study the nature of the
time-varying quality (QCIF, 4.7x3.8cm). They concluded that 1) the experienced quality is the
highest if the temporal impairments are regularly distributed over the time, 2) regular frame freezing
with high-density distribution are more pleasant than single isolated errors at low framerates (6-12
fps). This result indicates a kind of adaptation to rhythmic temporal impairments over the time and
higher sensitivity for jitter than jerkiness. Controversial with these results, it has been shown for
audio, video and multimedia quality that infrequent and large impairment bursts are less annoying
compared to frequently appearing several short discontinuities (Pastrana-Vidal & Colomes, 2007;
Hands & Wilkins, 1999; Pastrana Vidal et al., 2004a; 2004b). These studies, concluded from the use
of very short stimuli material, give direction to system improvement, but they do not describe overall
quality experience for current realistic multimedia transmission with heterogeneous losses resulting
in impairments for different media in a varying number, length and location of errors. In the past the
overall quality has been addressed (e.g. television, speech quality in video conferencing (Watson &
Sasse, 1998; Hands & Wilkins, 1999)). Because of different transmission protocols, compression
parameters, applications and output devices used it is hard to say how well these results can be
transferred to the perceived quality for mobile TV.
Summary - To summarize, the experienced quality is influenced by multiple produced quality
factors and their interactions. On the content level, the results have shown that the visibility of the
objects on video on a small screen is a critical factor of the experienced visual quality. It is
influenced by the text size, the shot type, and zooming to content, which are solely connected to the
viewing distance and media level factors, such as the resolution and physical size. In addition, the
ease of viewing and the appropriate level of overview on content contribute to the experienced
quality on the content level of 2D video. The initial comparisons between the 2D and 3D presentation
modes for image quality suggested that 3D presentation mode can improve the visual quality of
experience, and this experience is composed of an enhanced experience (depth, presence, real-life
likeness) as well as negative consequences (a troublesome feeling while watching and artefacts
causing an impression of weirdness). Finally, content has a significant influence on the conclusions
of the media and transmission level factors.
The results at the media level show complex interaction between the visual quality and
audiovisual quality factors when presenting video on a small screen. Firstly, for visual quality,
beyond these cross-influences of the codec, resolution, bitrate and framerate, some common

29
conclusions can be identified: 1) at least 0.1bpp is needed to provide a good or excellent quality (at
QCIF), 2) the role of frame quality (spatial resolution, quantization) is more significant than that of
the framerate, 3) a framerate between 10-15 fps provides an acceptable quality for presentation on
small resolutions, also for high motion content. Secondly, the results of the few existing studies
showed that audiovisual quality is influenced by 1) multiple factors of audio quality (codec, bitrate,
presentation mode) and visual quality (codec, bitrate), 2) the optimal share between modalities
depends on the content type, and 3) under limited video viewing conditions (e.g. a complex scene,
high motion, bad detectability of details), the role of audio quality becomes emphasized.
Finally, studies to identify the influence of transmission factors are rare. The results have shown
1) the detection threshold for audio and visual signal loss stimuli mimicking transmission scenarios
and 2) the controversial results on the characteristics of time varying quality (frequency, duration,
and focuson one media at a time).
Based on the literature review of system quality factors and their interactions, five main
uncovered research areas were identified. 1) In previous work, the emphasis has been in the
examination of produced quality on the content and media levels, although all three levels including
transmission are essentially contributing to quality of experience for mobile television. To understand
quality of experience, all three produced quality levels need to be studied. 2) Independent of the
studied level, the focus in the past has been mainly on the examination of the perceived quality of
one media at a time, although the final product is expected to be multimodal. 3) Furthermore, studies
for mobile 3D video or television are still rare and need to cover both multimodality as well as all the
produced quality levels. To understand quality of experience, multimodal quality is necessary to be
addressed when audio is accompanied with both 2D and 3D video. 4) Previous work has also shown
quantitatively complex relations between multiple produced quality factors. Keeping in mind the
target application, these excellence evaluations need to be connected to the application to show that
the provided quality level is good enough for use. 5) Finally, related work has also revealed that the
nature of the stimuli material can be very heterogeneous and contain different types of characteristics
depending on the produced quality level and the modalities studied. Currently, there is a strong
dominance on quantitative evaluation. To understand experiential components beyond quantitative
quality excellence evaluations, the research approach of qualitative or mixed methods is needed to
explain the results of these complex and modern phenomena.
2.4.3 Context of use
Previous quality evaluation studies conducted outside controlled laboratory conditions are rare
and have been conducted during the course of this thesis. Knoche & Sasse (2009) have conducted a
comparison between controlled and field (underground) settings. They replicated the laboratory
experiment in field settings as such, using the acceptance threshold method without any context-
related additional task. They varied the video bitrate and the image resolution. The results of
comparing the different bitrates showed an interaction between the quality level and context. In
contrast, experienced quality was improved when using higher image sizes in underground settings
compared to the laboratory conditions, being in line with other past studies examining the influence

30
on e.g. text size under vibration conditions (Mustonen et al., 2004). These controversial results of
bitrates and image resolution indicate that their nature as a phenomenon in contextual quality differs.
Beyond quality evaluation research, there are several studies conducted evaluating usability in the
context of use. To mention a few of these, Kaikkonen et al., (2008) compared the usability of mobile
browsing in a laboratory test to quasi-experimental study in field during a short-term travel task
(crossing a street, taking the subway and escalators as well as finding one's way). The results
remained similar between the controlled and field contexts. As an exception, people were more
tolerant of longer loading times in field settings, indicating a lower level of sensitivity for
transmission delay or errors in natural circumstances. Active sharing of attentional resources in
controlled and field settings was examined by Oulasvirta et al., (2005). In their study, the participants
conducted a mobile web browsing task in a laboratory and in the natural circumstances with parallel
tasks (e.g. a way finding task on a busy street, travelling in a bus/metro, chatting while having a
coffee, standing in a busy railway station and while waiting for a metro). The results showed that the
attentional span in silent lab conditions can last up to 16 seconds. In contrast, in the field it can be as
short as 4 seconds. These results indicate that the active sharing of attention and interleaving between
tasks on the mobile device and the surroundings is a fundamental part of mobile human-computer
interaction tasks in the context of use. Furthermore, it can be hypothesized to be a part of mobile
television viewing as well. In addition, several studies have examined the text legibility and entry on
the move. These studies are characterized by the tasks of walking in a predefined or freely-chosen
speed on a marked walking route, standing or sitting under variable light conditions in the laboratory
(Mustonen et al., 2004; Vadas et al., 2004; Barnard et al., 2007; Brewster, 2002; Mizobuchi et al.,
2005). Due to the insufficiency of parallel tasks (e.g. walking) for mobile television viewing, and the
nature of user-controlled tasks (interaction, reading) compared to viewing time varying audiovisual
medium, these studies provide only a little help for studying the quality of mobile TV in the context
of use.
In sum, there seems to be initial evidence that visual quality of experience is not independent of
context. However, the type of phenomenon under study (size or bitrate) seems to influence the way
quality is experienced in the context of use. The challenge for further work is to understand more
detail how the quality is experienced with regard to factors at the media and transmission level, how
the quality is described in the context of use, and how the other related factors, such as divided
attention, co-influence the quality of experience.
2.5 Mobile (3D) television – users, system, context of use
This section provides a short overview of the components of user experience – user, system
including service, and context of use for 2D and 3D mobile television and video. Mobile (3D) TV is
a service that is capable of receiving, reproducing and distributing broadcast (stereoscopic) video and
audio content through different networks and that can be used via a mobile device when in motion
(adapted from Oksman et al., 2008). This summary is based on several field studies carried out in
Finland, Germany, South Korea, UK, Belgium, Austria and Japan for mobile television (overview

31
Buchinger et al., 2009) and user requirement studies for mobile 3D television and video (overview
S8).
User – is defined as a person controlling or manipulating the system. She/he can be described as
having the characteristics of needs, motivations, experiences, expectations, mental state and
resources (Roto, 2006). Carlsson and Walden (2007) describe a typical user as being a well-educated
male aged between 23 and 35 with a yearly income of €20,001-30,000. In the Korean population, age
groups between 19-50 years are among the most common subscribers for mobile TV services (Shim
et al., 2008). Furthermore, women are more common viewers than men who in young age groups
seem to be more active to try out the service but may not adopt into long-term usage (Shim et al.,
2008; Lee et al., 2010).
The main motivations to use: People view mobile (3D) television to fulfill entertainment and
informational needs (Södergård, 2003; S8). Users also want to relax, spend/kill time, stay up-to-
date with daily news, and to learn (S8; Cui et al., 2007; Mäki, 2005). Furthermore, desire to
belong to the group of first users of novel service, owning and sharing content has also been
listed as motivations [Cui et al., 2007; O‘Hara et al., 2007). Mobile 3D television viewing is
expected to evoke in users the following impressions: increased realism, naturalness, a greater
emotional engagement and the feeling of being inside the story (S8).
System - is defined as the system required for the product under examination to work or to be
useful (Roto, 2006). From the user‘s point of view, the mobile system can contain components such
as a device, a browser or player, a connection and a site or content (adapted from Roto, 2006). In this
thesis, I understand the term system in a broad sense, and I do not draw a clear line between the
related terms such as application or service (see e.g. Verkasalo, 2009). I use the term content to refer
to any type of moving image or video.
Content – Both broadcasted and user-created content types are interesting for mobile (3D) TV
(O‘Hara et al., 2007; Södergård, 2003; S8). Among the most interesting genres are news, music,
sport and live broadcasts (Carlsson & Walden, 2007; Goldhammer, 2006; Knoche & McCarthy,
2004; Södergård, 2003). In mobile 3D television user-requirement studies, TV content (e.g.
news, series, sport, documentaries) as well as other video contents (e.g. games, tailored 3D
content, interactive guidance, navigation, product presentation) were also highly interesting for
users (S8). For relatively short viewing time on the move, the interaction with content needs to
provide summaries of existing programs, short clips, or news flashes as well as indexed content
to allow easy skipping of irrelevant content (Goldhammer, 2006; Stockbridge, 2006; Södergård,
2003).
Service – To access content, the users of mobile TV services prefer both on-demand and push
services offering a variety of programs to satisfy the needs of different user groups
(Goldhammer, 2006; Knoche & McCarthy, 2004; Stockbridge, 2006; S8). For interaction,
navigation and content search needs to be simple and the service should provide the possibility
of pausing the program and then resuming it or it should provide looped streams without fixed
start and end points (Carlsson & Walden, 2007; Stockbridge, 2006). The preferred payment
options are based on a fixed price model (e.g. 10 €/month) or pay-per-view for special services
or programs such as live events (Carlsson & Walden, 2007; Södergård, 2003).
Device – The users want to have a portable, pocket-sized, mobile TV device even though they
criticize small screens and set good audiovisual quality as an important criterion for these
devices (O‘Hara et al., 2004; Södergård, 2003). The device needs to support fluent changes
between the presentation modes from mono (audio or visual only) to multimodal (audiovisual)
presentation modes and visual 2D-3D presentation modes (S8). In addition, requirements for the
compatibility with other devices and functionalities for saving, receiving, sending, and recording
are expressed (Södergård, 2003; S8).

32
Context of use – “Context represents the circumstances under which the activity (--) takes
place”(Roto, 2006). To characterize these circumstances, Jumisko-Pyykkö & Vainio (2010, P3) have
presented a model of contexts of use for human-mobile computer interaction (CoU-HMCI) based on
a literature review and existing models in the field (e.g. Roto, 2006; Belk, 1975; Bradley & Dunlop;
2005; ISO 13407, 1999). The context contains five context components: 1) physical, 2) temporal, 3)
task, 4) social, and 5) technical and information context, their subcomponents and properties: 1)
magnitude, 2) dynamism, 3) patterns and 4) typical combinations. This section offers an insight of
where, how and when mobile (3D) television is used.
Physical context – There are certain main locations suitable for viewing. Watching while
commuting (public and private transportation), in the waiting halls, at home, parks and cafes
(during breaks or lunch) are the most common cases (S8; Buchinger et al, 2009; Södergård,
2003; Cui et al., 2006; Oksman et al., 2008). The viewing can take a place both indoors and
outdoors and contain private and public viewing (S8).
Temporal context – Viewing takes place during macro breaks to fill extra time (Södergård, 2003;
Cui et al., 2006; Oksman et al., 2008). Typical viewing time for mobile TV is from a couple of
minutes to 40 minutes; the most common viewing time is 10-15 minutes (S8, Södergård, 2003;
Carlsson & Walden, 2007). The prime time is scheduled for early morning, during lunch and
early in the evening, before dinner time (Oksman et al., 2008).
Social context – Mobile (3D) TV is primarily for one person viewing and used to minimize
solitude, avoid social engagement and create private space (S8; Buchinger et al., 2009; O‘Hara et
al., 2007). There are some occasions showing the need for shared viewing forming a social
group for sharing an experience, jokes etc. (S8; Buchinger et al., 2009; O‘Hara et al., 2007).
Shared viewing can also occur passively as involuntary co-viewing can happen in public
transport or in crowded environments (Cui et al., 2007).
Task, technical and informational context – Viewing as a task requires long enough time to
concentrate on it. During short breaks or hectic activity requiring strong shared attention
between mobility and the viewing task, users prefer other media (listening to music or radio)
(O‘Hara et al., 2007; Oksman et al., 2007; Cui et al., 2007).
2.6 Summary
In summary, multimedia quality is a combination of perceived and produced quality. Human
perception is an active process in which individual differences on a sensorial or cognitive level or
characteristics of multimodal information processing can complement and modify the final quality
perception. Produced quality describes the content and system related factors and they are
categorized into three different abstraction levels, content, media and network. With regard to quality
with both 2D and 3D mobile televisions, it is known that the produced quality is presented under
limited viewing conditions and it can be inferior in nature, resulting in relatively low perceived
quality (e.g. compared to cinema). A typical problem in multimedia quality studies is to optimize
quality factors produced under strict technical constraints or resources with as little negative
perceptual effects as possible.
The examination of the existing models of the quality of experience and user experience showed a
gap between them although they are partly working under the same phenomenon – human
experiences. Quality of experience describes the quality as a system-centric phenomenon or
underlines the influence of produced quality characteristics on the user. In the most holistic user-
experience models, experience is constructed of 1) the characteristics of user, 2) the characteristics of
system and 3) the context, 4) experiential influences and 5) the consequences of experience. To

33
extend the narrower system-centric approach, the influence of the user‘s characteristics, the context
of use and the consequences of the quality of experience need to be addressed in more detail.
The review of related work on the influence of user, system and context of use on quality of
experience confirmed the system-centric emphasis. The majority of the related work examined
produced quality factors on the levels of content and media by focusing on visual quality.
Furthermore, the results were expressed as one-dimensional excellence although in multiple cases the
complex relations between the parameters studied were announced, disregarding an essential
descriptive part of experience to draw a deeper understanding beyond these relations. In the few
exceptions, audiovisual quality was studied, its objective influence on the user was quantified or the
descriptive experiential characteristics were listed. The influence of the user‘s characteristics on the
quality requirements was proposed in a few studies. They underlined the user-system relation on the
level of information processing style, expectations and knowledge of digital quality features, but on
the other hand they covered a few of those background factors listed in user experience models or
potentially listed by human perceptual characteristics. Finally, the requirements for mobile video and
television were studied in the controlled conditions, although the final application is expected to be
used in heterogeneous mobile circumstances.
34
3. Evaluation methods
The goal of this section is to provide an overview on the research methods of quality evaluation. An
introduction to the methods clarifies the key concepts. The second part presents the quantitative,
qualitative and other supplementary related methods. The summarizing tables of the different
methods are presented in Table 3, Table 4 and Table 5.
3.1 Key concepts
The research method refers to a collection of independent methods or techniques which produce
information with as a small probability of error as possible. To measure experienced quality,
subjective quality evaluation is used. It is composed of human judgments of various aspects of
experienced material based on perceptual processes (Engeldrum, 2000; Lawless & Hayman, 1999;
Bech & Zacharov, 2006). Quality evaluation methods can be categorized in many ways and their
descriptions vary in terms of the details provided (from one detailed aspect, such as a data-collection
tool, to holistic methods covering the whole process from planning to data collection and analysis).
The methodological focus in this thesis is quality optimization studies of certain system components
keeping in mind the target application. This makes a distinction between fundamental psychophysical
research and late development usability testing with high-fidelity prototypes that require a high level
of product readiness of numerous system components and their integration (Reiter & Köhler, 2005;
S1).
To characterize a good research method, the terms validity and reliability are among the most
relevant. Validity describes the extent to which a given finding shows what it is believed to show and
defines the accuracy of the measure (e.g. Haslam & McGarty, 2003). In more detail, external validity
examines to what extent the research can be generalized into several aspects of research from the
sample, settings, researcher, materials and time. Internal validity, especially in experimental research,
is meant to check whether the independent variables are related to the dependent variables and to
enable to draw the conclusion of causal impact (Shadish et al., 2002). Finally, construct validity
describes the theoretical accuracy of the measurements (i.e. ibid). An extensive list for practitioners
to examine the aspects of validity is presented in Cook and Cambell, 1979; and Shadih et al., 2002;
and Oulasvirta, 2009. Reliability characterizes the consistency of the method (such as internal or
between-researchers, or laboratories) (Coolican, 2004). Other aspects such as complexity, utility and
cost can be identified as central factors to define good research methods (Smilowitz et al., 1993;
Hartson et al., 2003; McTigue et al., 1989).
From quantitative and qualitative to mixed methods: The major characteristics of traditional
quantitative research are a focus on deduction, confirmation, theory/hypothesis testing, explanation,
prediction, standardized data collection, and statistical analysis (Johnson & Onwuegbuzie, 2004).
Psychoperceptual quality evaluation belongs to this category of research methods. The major
characteristics of traditional qualitative research are induction, discovery, exploration,

35
theory/hypothesis generation, the researcher as the primary ―instrument‖ of data collection, and
qualitative analysis (ibid). To refer to qualitative data in this thesis, I have used parallel terms called
descriptive1, impression
2, interpretation
3, experiences
4 to clarify the verbally expressible nature of
distinctive perceptual attributes. Finally, mixed methods are defined ―as the class of research in
which the researcher mixes or combines quantitative and qualitative research techniques, methods,
approaches, concepts, or language into a single study” (Tashakkori & Teddlie, 2008).
Fundamentally, mixed method research has its roots in pragmatic philosophy, represents the third
wave of methods, and is suitable for applied research (Johnson & Onwuegbuzie, 2004). Mixed
methods are used to provide complementary viewpoints, to provide a complete picture of
phenomena, to expand the understanding of phenomena, and to compensate for the weaknesses of
one method (Tashakkori & Teddlie, 2008). Among the different design patterns to fuse these
methods with slight differences in the emphasis of the dominating method, their interdependency,
and purpose, triangulation is the most common (Creswell & Plano Clark, 2006).
From controlled to natural experiments: Experimental research is used in subjective quality
evaluation. An experiment is defined as “a study in which an intervention is deliberately introduced
to observe its effects” (Shadish et al,. 2002). The building blocks of the experiments are a treatment
(independent variables, e.g. bitrate), an outcome measure (dependent variable, e.g. overall quality),
and units of assignment (e.g. scale), and they contain some comparisons from which attributes to the
treatment can be inferred (Cook & Campbell, 1979). Table 3 presents the four main classes of
experiments including their definition, benefits, limitations and an example of a quality evaluation
study to build up an understanding of their characteristics and requirements. For this thesis, this
categorization becomes meaningful when thinking of the quality evaluation experiments outside the
fully controlled conditions. Furthermore, in this classification of experiments, ecological validity is
centrally described, but it is just one contributing factor to external validity parallel to other factors
(e.g. sample, system, task, and external components of the context of use).
1 to give an account or representation of in words, 2an effect produced in the mind by a stimulus, 3the action of explaining the meaning of something, 4 contact with and observation of facts or events (Oxford Dictionary, 2005)

36
Table 3 The classes of experiments and their properties (P5).
CLASSES OF EXPERIMENTS PROPERTIES
1. RANDOMISED EXPERIMENTS IN CONTROLLED LABORATORY CONDITIONS
───────►
───────►
„units are assigned to receive the treatment or alternative condition by random process‟ and the experiment takes
place in controlled laboratory circumstances.
+ accurate control of variables and replicable experiments
- limited realism, lack of ecological context, unknown level of generalizability, needs replication in field
conditions
Example: Quality evaluation in controlled viewing conditions (light, angle, distance, ITU).
2. RANDOMISED EXPERIMENTS WITH ANALOGUE CIRCUMSTANCES OR SIMULATIONS
Rea
lism
vs.
Contr
ol
Focu
s: U
se v
s. U
sabil
ity
Rep
lica
bil
ity:
Har
d v
s. E
asy
Len
gth
: L
ong-
vs.
Short
-ter
m
Pro
duct
rea
din
ess:
Hig
h v
s. L
ow
Inte
rpre
tati
ons
of
causa
l ef
fect
s
Des
ign:
Har
d v
s. E
asy „laboratory experiments that deploy simulations and emulations of real-world conditions to increase the
generalizability of results‟
+ similar to 1), can also take into account some aspects of context (walking speed, light, tasks)
- similar to 1), limited number of context characteristics can be studied at a time, some characteristics
impossible to simulate (social context, weather)
Example: Quality evaluation while walking, navigating and under pricing schemes.
3. QUASI-EXPERIMENTS
„units are not assigned to the conditions randomly‟ and „an experimental intervention is carried out even full
control over potential causal events cannot be exerted‟.
+ have their experimental nature, conducted in the field, enabling one to draw conclusions about the causal
effects, but the threats of quality need to be explicitly expressed, aspects of use can be revealed parallel to
system-oriented (usability) factors
◄─────────────────────
◄───────
- special care in instrumentation (e.g. data-collection tools during the experiment, existence of moderator),
relatively demanding to design and carry out.
Example Quality evaluation in the potential contexts of use including the natural social environment, such as
traveling by bus or while waiting at the railway station.
4. NATURAL EXPERIMENTS
„the cause cannot be manipulated and the measurements are typically „after the fact‟ contrasting naturally
occurring events‘
+ possible to explore behavior in natural settings, absence of visible elements related to the observation (people,
instrumentation) in order to preserve self-determinism of the user, possible long term and spatially widely
distributed studies
- cannot draw conclusions on causal effects, inaccuracy, low precision and control
Example: Field study about mobile TV use.
Assessor – Naïve, Experienced, Expert – An assessor is defined as a person taking part in a
quality evaluation test (adapted from ISO 8586-2, 1996). The synonyms participant, subject,
evaluator, panelist, user and consumer are parallel to assessors in this thesis. Participant selection
depends on the type of study and influence on the external validity of the results. In general, sensorial
sensitivity regarding the target of study is a common requirement in quality evaluation studies (ITU-
T P.911., 1998; Lawless & Heyman, 1999). The assessors can be categorized based on their sensorial
sensitivity, experience in evaluation and domain specific knowledge into 1) naïve assessors
(~untrained, defined as not meeting any particular selection criterion for assessment tests, neither has
experience in the research domain nor in the evaluation task (ITU-R- BT500-11, 2002; ITU-T P.920,
2002; Bech & Zacharov, 2006; ISO 8586-1, 1993.), 2) experienced assessors (trained for accurate,
detailed, and domain-specific evaluation tasks e.g. visual artefacts) (ISO 8586-2., 1994) and experts
(involved with audio and/or video quality or technology as part of his/her normal work (ITU-R
BT500-11, 2002; ITU-T P.920, 2002). However, the current quality evaluation methodologies do not
provide exact data collection tools for identifying the aforementioned categories of the assessor
neither for video nor audiovisual quality evaluation. When the goal is to quantify the overall quality,
the naïve assessors are selected, while experienced assessors or experts are chosen for the evaluation
of certain quality attributes such as brightness (Bech & Zacharov, 2006). In the audiovisual quality
experiments, the emphasis is on naïve evaluators, but experts can be used in pilot tests prior to
conducting a larger number of tests (e.g. ITU-R- BT500-11, 2002).The recommended number of
naïve participants starts at 15-16 at the minimum, while it is also dependent of the experimental
designs itself and the expected accuracy of the results (e.g. ITU-R BT500-11, 2002; ITU-T P.920,

37
2002). More broadly, the selection of participants influences the external validity of the results, i.e.
how the results can be generalized to the overall target population (e.g. a certain user group). The
review of the quality of samples in 38 subjective audiovisual evaluation studies showed that the
samples were described on the superficial level, and the main tendency was to use smaller sample
sizes (<30 participants) and limited user segments (e.g. young age groups), while in few studies
potential end-users were part of the sample population (P9). This thesis focuses on naïve assessors
and potential users for system user study.
Evaluation tasks – Overall or attribute specific quality – An evaluation task defines the
dimensions of stimuli to be judged and outcome measures as dependent variables. An overall quality
evaluation task, also called affective measurement, is an objective quantification of an overall
impression of stimuli (Bech & Zacharov, 2006). It can be used to evaluate heterogeneous stimuli
material to build up the global or holistic judgment of quality, it assumes that both stimuli-driven
sensorial processing and high-level cognitive processing including knowledge, expectations,
emotions and attitudes are integrated into the final quality perception of stimuli, and is an appropriate
task for naïve participants in user or consumer-oriented studies (Bech & Zacharov, 2006; ITU-T
P.911. 1998; Lawless & Heyman, 1999). An attribute-specific evaluation task, also called a
perceptual measurement, is an objective quantification of the sensorial strength of the individual
attributes of perceived stimuli (Bech & Zacharov, 2006). It defines the dimensions to be judged in
detail (e.g. brightness) for the participants and requires the use of highly trained and experienced
assessors (Bech & Zacharov, 2006).
Moment of rating – retrospective or continuous – defines the temporal relation between the
viewing of stimuli and giving the assessment about it. In retrospective ratings, the viewing of a
stimulus is completed prior the beginning of the rating task. Retrospective ratings are characterized
by (constraints) of human (short-term) memory and unequally weighted quality attributes over time
(e.g. Aldridge et al., 1995; Fredrickson, 2000). In the continuous rating tasks, both viewing and rating
are conducted simultaneously. Continuous rating over the whole viewing time (e.g. using slider) is a
demanding task for the assessor and may have an impact on the natural strategy of human
information processing (Bouch & Sasse, 2000; Hands & Avons, 2001). Furthermore, there is
evidence that quality rating tasks have an influence on the assessor‘s gaze behaviour and location
compared to natural scene viewing (e.g. Nyström & Holmqvist, 2008; Ninassi et al., 2006).
Stimuli is a test material presented to the participant during the study and it is characterized by
content, treatment and duration. Content is a sequence of a clip of video where the treatment is
generated. Treatment represents the independent variables in the experiments. The duration of the
stimuli content varies depending on the phenomenon under study (e.g. transmission) and the target of
the study. A short stimulus material, such as 10s, is conventionally used to go beyond the limitations
of human working memory (Aldridge et al., 1995).
Scaling and comparisons – Scaling refers to the application of numbers to quantify the sensory
experience (Lawless & Heyman, 1999). In quality evaluation research, the scales used vary from
nominal to continuous and are labeled or non-labeled. Further, the chosen scaling also determines the
statistical method of analysis to be used. Comparisons refer to the way the stimuli are presented and

38
rated. In single stimulus studies, stimuli are rated independently of other stimuli. The double stimulus
studis are used for pair-wise comparisons between two stimuli and multiple comparisons are used for
comparisons between more than two stimuli.
3.2 Quantitative quality evaluation
3.2.1 Psychoperceptual quantitative evaluation
Psychoperceptual quality evaluation examines the relation between physical stimuli and sensorial
experience following the methods of experimental research. These methods have their origin in the
classical psychophysics of the 19th century and have been later applied in uni- and multimodal
quality assessment (Engeldrum, 2000; Lawless & Heyman, 1999; ITU-T P.911, 1998; ITU-R-
BT500-11, 2002). For the quality assessment purposes the applied methods are standardized in the
form of technical recommendations by the International Telecommunication Union (ITU) or the
European Broadcasting Union (EBU) (ITU-T P.911, 1998; ITU-R- BT500-11, 2002; Kozamernik et
al., 2005). The aim of these methods is to analyze quantitatively the excellence of the perceived
quality of stimuli in a test situation. In general, psychoperceptual quality evaluation studies are
characterized by a high level of control over the variables and test circumstances, and they can
include the use of standardized test sequences, procedures, and the categorization of participants to
naïve or professional evaluators to ensure the repeatability of study. As an outcome, experienced
quality is expressed as an affective degree-of-liking using mean quality satisfaction or opinion scores
(MOS). These quantitative methods are useful in identifying trade-offs between several parameters in
system development and produce results in optimal form for the development of objective metrics.
The applicable method is chosen based on the research question and the variety of quality under
study. Single stimulus methods are useful for evaluations of the large quality range from low to high
with detectable differences between stimuli, whereas pair-wise comparisons are powerful when
comparing stimuli with small differences (ITU-T P.911, 1998; ITU-R- BT500-11, 2002). A short
overview to two methods – Absolute Category Rating and Subjective Assessment Method for VIdeo
Quality – is given (Table 4).
Absolute Category Rating (ACR) – The method is presented in the International
Telecommunication Union Recommendation P.911 called Subjective audiovisual quality assessment
methods for multimedia applications (ITU-T P.911, 1998). It is applicable for performance or system
evaluations with a wide quality range from low to high quality. In ACR, also known as the single
stimulus method, test sequences are presented one at a time and they are rated independently and
retrospectively. Short stimuli materials (10s) are used. The mean opinion scores (MOS) are collected
using 5-point or wider scales with labels from imperceptible to very annoying or from bad to
excellent.
Subjective Assessment Method for VIdeo Quality (SAMVIQ) (Kozamernik et al., 2005;
SAMVIQ, 2003) is a multi-stimulus method, standardized by the European Broadcasting Union
(EBU). The short stimuli are freely viewed one by one and rated retrospectively on a continuous
scale (0-100) with five labels from bad to excellent. During the evaluation task participants are given
the freedom to view the same stimuli several times and adjust the ratings. The method can use

39
explicit and hidden references. Due to the multiple comparison nature of the method, it has been
estimated to be suitable for evaluation on both high and low quality levels as well as the examination
of heterogeneous stimuli.
The few formal comparisons conducted have shown the differences in performance and costs
between these two psychoperceptual methods. In terms of performance, ACR has shown excellent
inter-laboratory and between-group reliability (Brotherton et al., 2006). Possible contextual effects,
where perceived quality is relative to recently seen stimuli, are a general challenge in ACR and can
be minimized with a careful randomization between the stimuli and participants (Parducci & Wedell,
1986; De Ridder, 1996). According to the threats of validity, SAMVIQ suffers from increased
reactivity and artificiality due to the replicated viewing task (Brotherton et al., 2006). In general, the
labeled MOS scale is criticized of having unequal distances between the labels and of suffering from
culture dependent meanings, while narrow scales can introduce an end-avoidance-effect (Lawless &
Heyman, 1998; Watson & Sasse, 1996; Watson & Sasse, 1998; Aldridge et al., 1998). In addition to
this general validity issue of labeled scales, SAMVIQ‘s fine resolution continuous rating scale is
shown to be superfluous (Rouse et al., 2010). When comparing the ACR and SAMVIQ between
methods the correlation is excellent, although SAMVIQ can achieve a slightly higher level of
accuracy and differentiation (Brotherton et al., 2006; Rouse et al., 2010). In terms of costs, ACR
experiments can contain a higher number of stimuli per session (2-4 times more) compared to double
or multiple comparison experiments (Brotherton et al., 2006; Huynh-Thu & Ghanbari, 2005). For
SAMVIQ, a lower number of stimuli can be used for the experiment due to replicated viewing, and
the preparations for the experiments have been estimated to be slightly more complex compared to
ACR (Brotherton et al., 2006; Rouse et al., 2010). Although this discussion of performance and the
costs of methods is extremely important in order to be able to compare system components or
algorithms between laboratories, these methods leave other valuable questions unanswered. Because
quality is understood as a one-dimensional degree-of-liking, it is not connected to ecological aspects,
such as appropriateness of use, the consequences of quality on the user beyond satisfaction (e.g. cost,
goals etc.) as well as understanding the qualitative aspects of quality, and they remain unexplored.
3.2.2 User-oriented quality evaluation
Quality of Perception (QoP) – is a user-oriented concept and evaluation method combining
different aspects of subjective quality (Ghinea & Thomas, 1998; Gulliver & Ghinea, 2004a, Gulliver
et al., 2004a). QoP is a sum of information assimilation and satisfaction further formulated from the
dimensions of enjoyment and subjective, but content independent objective quality (e.g. sharpness).
Information assimilation data is gathered with questions on audio, video or text in different content
and in the analysis the right answers are transformed into a ratio of right answers per number of
questions. Both satisfaction factors are assessed on a scale of 0-5. The final QoP is the sum of
information assimilation and satisfaction setting the stimuli into an order of preference. Later,
slightly different scales have been used and the evaluation has been complemented with eye-tracking
data (Gulliver & Ghinea, 2004b). Although this method makes a significant move to acquire deeper
understanding of the influence of quality on a user, it does not necessarily connect quality to the
actual use of a system.

40
Evaluations of acceptance – McCarthy et al., ‘s (2004) method for acceptance evaluations is
based on the classical Fechner psychophysical method of limit. The basic idea of the method is to
maximize the user‘s viewing task and minimize the effort in evaluation. The threshold of acceptance
is reached by gradually decreasing or increasing the intensity of the stimulus in discrete steps every
30 seconds. At the beginning of the test sequence, participants are asked if the quality is acceptable
or unacceptable for viewing. While viewing, participants evaluate quality continuously and report the
point of acceptable quality when the quality of stimuli is increasing, or the point of unacceptable
quality when quality is decreasing. Participants are also asked to verbally clarify the reasons for their
threshold judgments. In the analysis, binary acceptance ratings are transformed into a ratio
calculating the proportion of time during each 30 second period when quality was rated as
acceptable. Finally, the results are expressed as an acceptance percentage of time. The method has
been applied in several studies in controlled conditions and also as such in a quasi-experimental
study in the field (Knoche & Sasse, 2009). Maximizing the user‘s viewing task and evaluation of the
appropriateness to use are the strengths of this method. However, there are three main limitations:
This method is powerful for studying variables that are around the threshold but not for those clearly
below or above it, and it requires the researcher to start to use other methods during the quality
evolution (e.g. Lawless & Heyman, 1998). Regarding reliability, there seem to be differences in
evaluations between the conditions of decreasing and increasing the quality (Knoche, 2010). Finally,
although complementing qualitative data has been collected in numerous studies, its processing in
analysis has not been reported in detail.
Table 4 Quantitative quality evaluation methods divided into psychoperceptual and user-
oriented methods.
PSYCHOPERCEPTUAL USER-ORIENTED
ACR SAMVIQ QoP METHOD OF LIMIT
PRESENTATION
RATING
Single stimulus,
independently
Concurrent multi-
stimulus
Explicit, hidden
reference, anchors,
Free to adapt ratings
Single stimulus,
independently
Continuous, gradually
decreasing or increasing the
intensity of the stimulus
STIMULI ≤ 10s
wide quality range
~10-15s
wide quality range
~ 30s long stimuli Stimuli (≥ 210s) with varying
quality after constant time
interval 30s
SCALE Labeled 5-point
(or higher) scale
Labeled continuous
scale (0-100)
Satisfaction:
Enjoyment
(unlabelled 5-point)
Objective quality
(unlabelled 5-point)
Information assimilation:
questions of content in
different media
Binary acceptable / unacceptable
ANALYSIS Mean Opinion Scores,
ANOVA
Mean Opinion Score,
ANOVA
Satisfaction: ANOVA
Information assimilation:
ratio of correct answers
A ratio calculating the proportion
of time during each 30-second
period that quality was rated as
acceptable

41
3.3 Qualitative descriptive quality evaluation
Descriptive quality evaluation methods emphasize the qualitative nature especially at the early
phases of the data collection procedure. The goal of these methods is to identify the attributes for the
stimuli set or the criteria for quality judgments. An attribute is defined as a characteristic of stimuli
(adapted from Engeldrum, 2004). An overview to two different categories, interview and vocabulary-
based methods, is given in Table 5. In the beginning, the general goal of these methods is to identify
verbally expressible attributes for a set of stimuli, or reasons for a certain quality rating. These try to
find an answer to the following question: What are the ingredients of this set of stimuli? The
descriptions are collected using an interview or written techniques for individual, paired or grouped
stimuli with special techniques. For the procedure of interview-based methods, data-driven analysis
is applied to identify the main categories of data with adequate reliability estimation techniques.
Finally, a set of statistical techniques can be applied to create one- or multidimensional constructs of
the main categories. In vocabulary-based methods, after attribute elicitation, an individual or
consensus vocabulary is transferred to form attribute specific rating scales, and later on each
participant rates the stimuli using this scale. Finally, a statistical analysis is applied to form the
perceptual space based on the most contributing attributes.
Interview-based methods – In the existing interview-based methods, naïve participants describe
explicitly the characteristics of stimuli, or personal quality evaluation criteria under free-description
or stimuli-assisted description tasks (Knoche, 2010; Radun et al., 2008). For example, a free-sorting
task has been used parallel to an interview to identify the groups with similar items and describe their
characteristic (Radun et al., 2008). In the further steps, data-driven analysis applying a grounded
theory framework has been used to form the most common categories, and further connections
between categories have been modeled using multidimensional scaling and correspondence analysis.
In these few studies, the data collection procedure (including an interviewing technique) and the
method of analysis is not reported in detail, but can be interpreted to cover the data-drive process for
analysis (such as content-analysis or grounded theory). Data collection with interview-based methods
can be relatively easy to implement, while the early phase of the data analysis can be a demanding
task.
Table 5 Descriptive quality evaluation categorized to the interview-based and vocabulary-
based methods.
INTERVIEW-BASED METHODS VOCABULARY-BASED METHODS
Consensus vocabulary Individual vocabulary
ATTRIBUTE
ELICITATION
Interview,
supporting task: sorting, stimuli-assisted
Group discussions and
agreement of consensus
attribute list
Free, individual attribute lists,
supporting methods like
Repertory Grid method can
apply
ASSESSORS ≥ 15 naïve ≈ 10 highly trained ≥ 15 naïve
ANALYSIS Data-driven analysis (e.g. Grounded Theory)
and modeling using multidimensional scaling
or related methods
Principal Component
Analysis, multivariate
methods
Generalized Procrustes
Analysis, Multiple Factor
Analysis
NAMES USED Interpretation-Based Quality (IBQ), also
mixed method
RaPID, ADAM Free-Choice Profiling, Flash
Profiling

42
Vocabulary-based methods can be divided into two categories – consensus and individual
vocabulary profiling. Consensus vocabulary profiling is targeted for a trained panel of assessors to
rate several attributes of unimodal quality, using a developed consensus vocabulary (Bech et al.,
1996; Zacharov & Koivuniemi, 2001). The comparable methods for image quality are called the
RaPID perceptual image description method (RaPID) and the Audio Descriptive Analysis &
Mapping (ADAM) technique (Zacharov & Koivuniemi, 2001). The evaluation procedure has three
steps: 1) An initial consensus vocabulary is developed in extensive group discussions with panel
members regarding stimuli. 2) A refinement discussion is used to create an agreement about the
important attributes and the extremes of an intensity scale for stimuli specifically for a test among the
panel. 3) An evaluation task where assessors individually rate each attribute in a pair-wise
comparison between stimuli and a fixed reference. The second vocabulary-based method, individual
vocabulary profiling, is targeted for naïve participants to rate quality based on the vocabulary
developed. The method, called Individual Profiling Method (IVP), has also been applied to
multimodal quality assessment (Lorho, 2005; Lorho 2007). The procedure contains four steps: 1)
Familiarization – participants are trained to describe attributes of stimuli and develop their individual
vocabulary in two consecutive tasks. 2) A list of attributes is generated in a triad stimulus comparison
using an elicitation method called Repertory Grid Technique. 3) The attributes developed are used to
generate the evaluation scale containing the attribute and its minimum and maximum quantity. 4)
The participants are trained and they evaluate quality using the attributes. The procedure in the
analysis contains hierarchical clustering to identify underlying groups among all attributes and the
development of perceptual spaces of quality. Common to both vocabulary-based methods are the
time-consuming development of vocabulary, and a possible training of the panel, and the developed
vocabulary is limited to a certain domain. In contrast, the process in the analysis is relatively easy
and the location of the researcher‘s interpretation takes place at the very end compared to interview-
based methods.
Although complete comparisons between the qualitative descriptive methods have not been
reported, some aspects of them have been compared. Regarding the reliability, a free-sorting task
with naïve participants produces comparable results to the consensus vocabulary approach with
expert participants in terms of describing the same sensations and the related wording of the
attributes (Faye et al., 2004). Furthermore, the costs of free-sorting are lower because of naïve test
participants, missing training, and fast assessment of a large test set (ibid). These results indicate that
pre-defined vocabulary development in assessor training is not necessary when identifying the
quality attributes.
3.4 Mixed methods
Mixed methods to combine both quantitative and qualitative methods in the multimodal quality
domain are rare. Triangulation is the most common mixed method design where both data collection
and analysis are independently carried out for quantitative and qualitative methods (Creswell &
Plano Clark, 2006). While the aim is to create a broad picture of the phenomenon, the outcome can
be converging, complementing, divergent between the methods (Denzin, 1978). Interpretation-based

43
quality (IBQ), adapted from (Faye et al., 1991; Picard et al., 2003), combines a qualitative interview-
based classification task and quantitative psychoperceptual evaluation of one quality attribute
consecutively. In the analysis, IBQ combines preference and description data in a mixed analysis to
better understand the preferences and the underlying quality factors on the level of single stimulus
(Nyman et al., 2006; Radun et al., 2008). In contrast to the original definition of the method, the later
term IBQ has been inconsistently used to refer to monomethodological designs and variable
procedures of descriptive tasks (Shibata et al., 2009; Häkkinen et al., 2008). In this thesis, I
understand the method as it was originally presented. To evaluate the nature of mixed methods for
multimedia quality evaluation studies, the challenges are: 1) the schedule and order of the
quantitative and qualitative tasks in the data collection procedure, 2) equal or unequal sampling
between the methods, and 3) the flexibility of methods in variable research conditions, such as quasi-
experimental studies in field circumstances.
3.5 Supplementary methods
The role of other methods presented is supplementary to the actual quality evaluation.
Supplementary refers here to the way they provide complementary objective information about the
influence of produced quality on a user (e.g. visual attention, fatigue) or provide information about
one component of experienced quality (e.g. visual comfort), but experienced quality cannot be solely
interpreted based on information acquired using these methods.
Eye-tracking - Eye-tracking is a technique to record human eye-movements in relation to time
and provide information about human visual attention and emotion (cf. overview Poole & Ball, 2004;
Rötting, 2001). The analysis of visual attention is based on the eye-mind hypothesis, which assumes
that the viewer‘s attention is directed to the object the viewer is looking at (Buswell, 1935). As an
outcome, the location of viewing and factors indicating the complexity of human information
processing can be identified based on different eye-tracking parameters (e.g. fixation, saccades, their
duration, frequency and combinations). Furthermore, the measurements of blink rate and pupil size
can indicate emotional valence as well as fatigue (e.g. Poole & Ball, 2004; Bruneau et al., 2002;
Brookings et al., 1996; Partala & Surakka, 2004). In quality evaluation research, the eye-tracking
method has been applied for studying the annoyance of visual artefacts in video, exploring scanpaths
for video viewing under different settings, comparing attentional influence between 2D and 3D
viewing on large screens, and modeling the volume of interest (e.g. Rajashekar et al., 2008; Tosi et
al., 1997; Le Meur et al., 2010; Häkkinen et al., 2010; Nyström, & Holmqvist, 2007). There are at
least two general challenges related to applying eye-tracking for quality evaluation research. Firstly,
numerous different eye-tracking parameters are used and it can limit the comparability between
studies (Poole & Ball, 2004; Rötting, 2001). Secondly, the measurement accuracy
(spatial/temporal/binocular) of the eye-tracker used influences significantly the reliability and
applicability of the method. The use of videos presented on small screen or even combined with
stereoscopic presentation modes are challenging in eye-tracking.
Physiological measures – Other physiological measures attempt to objectively quantify the cost
as physiological indicators of stress. The measures of heart rate, blood volume pulse and galvanic

44
skin response have been used (Bouch et al., 2001; Wilson & Sasse, 2000). It seems that these
methods can be sensitive to detect the variation in quality, but they do not correlate with explicitly
expressible subjective quality (Wilson & Sasse, 2000).
Visual discomfort – Visual discomfort and fatigue are common byproducts of 3D presentation
on autostereoscopidc displays, often caused by impairments in stereoscopy (Lambooij et al., 2009;
Lambooij et al., 2007; Meesters et al., 2004). Visual discomfort can be studied with explorative
methods, psychophysical scaling and questionnaires (Lambooij et al., 2009). Simulator Sickness
Questionnaire (SSQ) is among the commonly applied methods to quantify the subjectively
experienced degree of visual discomfort. Kennedy et al., (1993) originally developed the SSQ to
study sickness related symptoms induced by aviation simulator displays, but it has later been applied
in several research fields. The questionnaire contains 16 physical symptoms rated on a categorical
labeled scale (none, slight, moderate, severe). It combines individual symptom measures to produce
combination measures of nausea, oculomotor symptoms, disorientation and a combined total severity
score to subjectively quantify the experienced symptoms of the participant. The data collection takes
place in the pre immersive session (e.g. prior to viewing) and numerous times in the post immersive
session. The method has been applied when studying autostereoscopic mid-sized and small mobile
screens (e.g. S11).
3.6 Summary
Related methodological work can be summarized to cover three main dimensions for quality and one
supplementary dimension for quality. 1) Quality as excellence – There is a strong dominance towards
quantitative-only evaluation, describing the quality as excellence in some predefined dimension. The
methods vary from well-validated and detailed psychoperceptual evaluation methods to
multidimensional user-centered methods, and provide practitioners tools for optimizing system
quality factors as well as for objective modeling. As the most common limitations, methods do not
connect quality evaluation to the expected use of the system, or if connected to use, a method is only
applicable to a certain quality level. 2) Quality as attributes – There are only few qualitative methods
that address the impressions of quality focusing on interview or vocabulary-based data collection
methods and they contain a demanding multistep data collection procedure. 3) Quality as appropriate
to use – The existing methods have started to take into account some aspects of use – either they
connect it to the utility threshold for the usage of certain systems, or they explore multidimensional
consequences on user. However, these methods disregard the other contributing components of user
experience, such as the influence of the user‘s characteristics and the context of use. 4) Quality as a
psychophysiological influence - The supplementary methods provide complementary information
about the influence of produced system quality on user, they typically use the objective physiological
methods (e.g. eye-tracking, blink rates) or their subjective counterpart (e.g. visual discomfort).
However, quality of experience cannot be solely concluded based on information provided by these
supplementary methods.
The challenges for further work are the following: A holistic methodological framework is
needed for the evaluation of user-centered quality of experience. To go beyond the state of the art,

45
focus in further work needs to be on aspects that maximize the external validity for certain
application fields – emphasis on the user‘s characteristics in sample selection, the existence of
relevant system components, and evaluation in the context of use parallel to conventional controlled
evaluations. Furthermore, methods to create a deeper understanding of experienced quality are
needed. Novel technologies, optimization of parameters on different produced quality levels and
modalities, and the existence of complex interactions between these parameters and artefacts result in
heterogeneous stimuli material to be evaluated. In such cases, it is necessary to complement existing
quantitative evaluation methods with more qualitative tools to explain the perceptually important
quality attributes beyond the quality preference ratings.

46
4. Research method and content of studies
This section shortly describes the studies conducted and gives an overview of the methods used. The
studies of this thesis – experiments and a review – are summarized in Table 6. The detailed
methodological issues relating to the experiments are described in section 5.2.
4.1 The experiments
The experiments for this thesis examined quality for conventional mobile TV and stereoscopic 3D
at different multimedia abstraction layers for visual or audiovisual quality in controlled laboratory
and field conditions. A total of eleven experiments were included in this thesis, resulting in a broad
and rich pool of quantitative and qualitative data (Table 6). The independent variables describe the
content of the study.
Quality for mobile television, with 2D presentation mode was in the focus of five experiments (1-
5). The produced quality factors were varied at the media and transmission layers and their
combinations were also studied. The majority of the experiments examined audiovisual quality (4/5).
Comparisons between the 2D/3D presentation modes were examined in four experiments (6-9). The
factors of produced quality concentrated on the media layer and audiovisual quality were investigated
in most of these experiments (3/4). The final two experiments (11-12) were conducted only with
visual 3D quality with the variables at the media and transmission layers. The role of the last
experiment is only to support descriptive model development, while its other parts are not discussed
in this thesis. In all the experiments, several content types were used. Their selection was based on
potential genres for mobile 2D/3D television with variable audiovisual characteristics. The popularity
of broadcasted content was also used as a criterion for 2D studies (experiments 1-5). This criterion
was not possible to apply for 3D studies, as the availability of stimuli material was very limited at the
time of conducting the experiments. Three experiments focused on quasi-experimental quality
evaluation in natural or simulated contexts. These studies contained four different contexts of use and
they were selected as potential contexts for mobile TV viewing according to user requirements or
existing field trials. For comparability, controlled laboratory conditions were conducted within the
same study in two cases.
Participants - The experiments were conducted with a total of over 500 participants. The
maximum number of participants in any of the methods of the experiment is listed in a table. The
stratified sampling method was used to focus on potential age groups for mobile TV, naïve evaluators
and mainstream users for mobile systems. The participants were equally stratified by gender and age
group. The main age groups in the studies were 18-45 years. This stratification enabled to avoid over
representation of inadequate groups or bias towards the use of students as participants. The
limitations in stratification were done in the following ways: Based on attitude on technology, people
with a strongly negative attitude towards technology (―laggards‖) were screened while the extremely
positive groups (―innovators‖) were limited to 20% (Rogers, 2002). In order to minimize possible

47
Table 6 The content of studies - a total of 11 experiments and a literature review.
TYPE OF STUDY METHOD SAMPLE PUBLICATIONS
EXPERIMENT
Independent variables
Participants 2
D
Experiment 1: Visual quality at media level
Video: Codecs, Bitrates, Resolution, Devices Content: News, Sport, Series, Cartoon, Tele-text, Music
video
Quantitative: ACR Qualitative: Interview-based
Environment: Lab
Other: Demo/psychographics
75 P2, P6, S2
Experiment 2: Audiovisual quality at media level
Video: Bitrate, Framerate
Audio: Bitrate Content: News, Sport, Series, Cartoon, Music video
Quantitative: ACR
Qualitative: Interview-bases Environment: Lab
Other: Demo/psychographics
60 P2, P6, S2, P8, P9
Experiment 3: Audiovisual quality at transmission level
Video/Audio: MFER error rates
Content: News, Cartoon, Sport, Music video
Quantitative: Bidimensional
Qualitative: Interview-based
Environment: Lab
45 P1, P7
Appendix 1
Experiment 4: Audiovisual quality at media and transmission level
Video/Audio: MFER error rates
Video/Audio: Error control methods Content: News, Cartoon, Sport, Music video
Quantitative: Bidimensional
Qualitative: Interview-based Environment: Lab
Other: Demo/psychographics
45 P1, P9, S3, S4
Appendix 3
Experiment 5: Audiovisual quality at transmission level
Video/Audio: MFER error ratios
Content: News, Cartoon, Sport, Music video –non-
repeated Context: Bus-travel, Station-wait, Café-relax
Quantitative: Bidimensional
Qualitative: Interview-based
Environment: Quasi-exp.
30
P5, P10
Appendix 2
2D
/3D
Experiment 6: Visual quality at media level
Video: Bitrate, Framerate, Presentation mode Content: Cartoon, User-created, Documentary, Series
Context: Laboratory, Home-like
Quantitative: Bidimensional Qualitative: Interview-based
Environment: Lab +Quasi-exp
Other: Simulator sickness
30 P5, P11, P12, S11, S12, S13
Experiment 7: Audiovisual quality at media level
Video: Bitrate, Presentation mode
Audio: Bitrate Content: Cartoon, User-created, Documentary, Series
Context: Laboratory, Bus-travel, Station-wait
Quantitative: Bidimensional
Qualitative: Interview-based Environment: Lab+Quasi-exp
30 P5, P11, P12,
S12, S13
Experiment 8: Audiovisual quality at media level
Video: Presentation mode
Audio: Presentation mode
Content: Animation, Documentary 1, Documentary 2,
Videoconference, User-creates, Music video
Quantitative: Bidimensional
Qualitative: Vocabulary-based
Environment: Lab
Other: Simulator sickness
45 P4, P12
S11, S14
Experiment 9: Audiovisual quality at media level
Video: Presentation mode
Audio: Room acoustic models
Content: Small and large room
Quantitative: Bidimensional
Qualitative: Vocabulary-based
Environment: Lab
25 P4, S15
3D
Experiment 10: Visual quality at media level
Video: Coding schemes, Quality levels Content: Talking head, Animation, Feature film, Horse,
Mountain, Sport
Quantitative: Bidimensional Qualitative: Vocabulary-based
Environment: Lab
Other: Simulator sickness
47 P4, P12 S11
Experiment 11: Visual quality at transmission level
Video: Coding schemes, Slice modes, MFER error rates
Content: Documentary, Animation, Nature, Roller
Quantitative: Bidimensional
Qualitative: Vocabulary-based Environment: Lab
Other: Simulator sickness
77 P12
S11
LITERATURE REVIEW
Goal to clarify
What is the context of use for mobile human-computer
interaction?
Qualitative: Content analysis
109 articles, years 2000-2007
5 journals, a main conference for HCI
P3
bias caused by the novelty effect in the evaluation of the future media services at a time of
conducting the studies, the above mentioned sampling method was used (e.g. Miller & Segur, 1999).
Furthermore, the number of professional evaluators (with previous experience in quality evaluation
experiments, they are experts in technical implementation, studying, working or are otherwise

48
strongly engaged in multimedia processing in their daily life as well as regularly participating in
quality evaluation experiments) were limited to 20%.
Methods - The experiments used methods of quantitative and qualitative descriptive evaluation,
collected supplementary, demographic or psychographic data, and they were conducted in the
different experimental circumstances.
1) Quantitative evaluation: The experiments were conducted using within-subject experimental
designs without division to the blocks. This strong design was chosen to reduce the between-subject
variation and improve the capability to differentiate the overall quality for heterogeneous multimodal
stimuli material. As a counterpart, it limits the number of independent variables within experiments
or prolongs them. The quantitative quality evaluation used a single stimulus presentation with the
retrospective evaluation task. Prior to the actual evaluation, participants were familiarized to the task
and anchored to the extremes of the quality range and the content types. A bidimensional method of
acceptance threshold (section 5.2.2) was used in all studies except the experiments 1-2.
2) Qualitative descriptive evaluation: Qualitative evaluation has used both interview-based and
individual vocabulary-based methods. The interview-based method (5.2.3.) was used in seven
experiments (1-7) including the experiments in the context of use. The individual vocabulary-based
method (5.2.4) was used in four experiments (8-11).
3) Experimental settings: The laboratory environment represents the controlled test environment.
It has high control over the variables and allows defining the test environment. In the quasi-
experimental studies, hybrid method for quality evaluation in the context of use was applied (5.2.5).
Within these studies, quantitative and descriptive qualitative evaluation methods were complemented
with situational data collection with mobile-usability laboratory, task complexity data using a NASA
TLX questionnaire (Hart & Staveland, 1988) and semi-structured observation by the moderator.
4) Other collected data contained demographic and psychographic variables and simulator
sickness when 3D was used in experiments. The following background factors were collected during
the experiments, but their influence on quality evaluations are published only in three experiments:
age, gender, relation to content (interest, knowledge, consumption), technology attitude, quality
expectancies, professionalism, intention to use the application under study, knowledge about digital
quality features and consumption. Simulator sickness questionnaire was used when 3D quality was
measured.
Equipments and circumstances - Different mobile devices or prototypes were used for
presenting content during the experiments (Appendix 6). For 2D video presentation, the devices
contained TFT-LCD displays with different physical sizes and variable pixel density. For 3D
experiments, two prototype devices with two dual-view autostereoscopic displays were used. The
displays showed a slightly different image for each eye of the observer based on the light filter build
on display and do not require the use of specialized glasses from the user. The displays utilized
applied parallax barrier technology which selectively blocks the light, and lenticular sheet which
refracts the light in different directions (Stereoscopic 3D LCD Display, 2009; Uehara et al., 2008;
Actius AL-3DU, 2005). The physical screen size and accuracy varied.

49
Viewing and listening conditions: Viewing distances were between 40-45 centimeters in the
laboratory. In the quasi-experimental field study, the participants were free to adjust it. The
recommendations for preferred viewing ratios (e.g. ITU-R BT.500-11, 2002) for small or
stereoscopic screens were not available at the time of conducting the studies.
The recently published preferred viewing ratio proposes a distance of 8-9.8 times the screen
height at the minimum (32-38cm/ 4cm high screen, depending on resolution) for monoscopic video
evaluation in the laboratory circumstances (Knoche, 2010). However, these distances do not predict
the viewing distances outside the laboratory conditions, where the user‘s posture and surrounding
physical objects determine the selection of distance (Knoche, 2010). The headphones were used for
audio-playback. For one-person viewing of mobile TV in public spaces, headphones are used to not
to disturb the people in the close proximity (Repo et al., 2006). In the laboratory conditions, the fixed
level of audio (75dBA) was kept while its adjustments were allowed in quasi-experimental settings.
The experiment, used for the development of the method, made an exception to these conditions as a
mid-sized autosteroscopic screen was used (17‘‘) with a surround sound set-up.
Laboratory circumstances were organized to follow the ITU-recommendation (ITU-T P.911,
1998). Quasi-experimental circumstances varied in terms of the physical context (location, sensed
environmental attributes such as light, audio, pseudo-motion, user‘s position), temporal context
(extra-time scenarios with low time pressure), task context (multitasking and possible interruptions),
social context (alone, bystanders) and dynamism within them (overview P5).
4.2 Literature review
A systematical literature review was conducted to define what the context of use in mobile
human-computer-interaction is (P3). The context of use is one of the main concepts for mobile user
experience. The review summarized the past research in mobile contexts of use to provide a deeper
understanding of the characteristics associated with it and to indicate a path for future research. The
systematical literature review was conducted following the content analysis (Schwarz et al., 2007). It
covered over 100 papers published in the five high-quality journals and one main conference in the
field of HCI during the years 2000-2007. For this thesis, the role of the review was to identify the
characteristics of contexts of use (main components, subcomponents and descriptive properties) to
help the development of method for quality evaluation in the context of use. For mobile-human-
computer-interaction in general, this publication guided further work to underline the dynamic
characteristics of the context of use and focus on the examination of the temporal characteristics and
transitions between contexts in more detail in future work.

50
5. Results
5.1 Components of Quality of Experience
The goal of this section is to present the results of the quality of experience evaluation studies
conducted for this thesis and summarize them combined with the related work to the model of User-
Centered Quality of Experience. At first, the influence of user characteristics on experienced quality
is briefly summarized. Secondly, the influence of produced quality factors on experienced quality
and related components of the descriptive quality of experience are presented. Thirdly, the results of
the impact of the context of use on the quality of experience and related descriptive contextual
quality of experience factors are summarized. Finally, the model of User-Centered Quality of
Experience encapsulates the results of this thesis and the related work of Section 2.
5.1.1 User
Several demographic and psychographic variables were examined as part of the quality
evaluation studies. The influence of the viewer‘s interests in content and content recognition on
visual and audiovisual quality requirements were studied in two experiments (S2). The results
showed that interesting content was more positively and familiar content more critically evaluated
(S2). In the other two studies, several non-content related background factors were examined (P9).
The results showed that age, professionalism, knowledge of digital quality features and attitude
towards technology were among the most influencing factors (P9). As a limitation, analysis of the
interaction between these factors was not possible due to the small sample size. In sum, these results
indicate that the user’s relation to content, knowledge about digital quality, technology attitude
and age can contribute to the quality of experience.
5.1.2 System
5.1.2.1 Media level
Studies at the media level explored audio-video bitrates, video codecs, resolution, as well as the
2D and 3D presentation modes. The quantitative results showed that audiovisual quality for 2D video
at a modest bitrate level (160kbps) is dependent on content (P6). Head and shoulder content (40%
resources for audio) and fast motion sport (10% for audio) presented the extremes for sharing the
resources, while other contents were located in between. The results also showed that when the
overall quality is dropped, the importance of audio increases (P2, confirming Winkler & Faller,
2006). The qualitative results underlined that the experienced quality is not only constructed from
factors of stimuli driven perception such as visual quality, audio quality, audiovisual quality, but also
content dependent differences and usage related factors (P8). In more detail, they confirmed that the
relative importance between the media was also connected to the extreme visually or auditory
dominating contents. Audio and visual erroneousness and visual details were among the most

51
commonly mentioned evaluation criteria, and some contents were considered to fit to the purpose of
use. Taken together, these results showed that 1) experienced audiovisual quality is content
dependent at the low overall produced quality level, 2) the role of audio seems to increase when
produced overall quality is extremely low.
The study of visual 2D video quality confirmed that significant improvements in video quality
can be achieved with the most sophisticated codec H.264 at a low total bitrate level (80kbps, QCIF)
(P2, P6). However, the increase in spatial frame dimensions (from QCIF to SIF-SP) improved the
experienced quality, even accompanied with a less sophisticated codec (P2). The qualitative results
showed that accuracy, regions of interests, text and picture ratio (e.g. the size of image or the frame
dimensions) were among the most commonly mentioned evaluation criteria (P2). These results
showed that the accuracy of video presentation, the visibility of meaningful details and the size
of image contribute to the experienced visual quality. These first two studies identified the
excellence between the parameters studied, but the connection to the minimum useful quality level
for use was not drawn. Later, it was confirmed that an acceptable quality for users was reached with
all content types when the H.264 codec was used with the audio-video bitrate combination
32/128kbps (P1).
Further studies were conducted with a slightly higher overall quality level, being clearly above
the acceptance threshold. In these studies, 80-90% of all stimuli were considered as acceptable (P4,
P5, P11). For 2D video presentation, only a small increase in experienced quality was reached when
the resources for produced video quality were doubled (bitrates from 160kbps to 320kbps, P5, P11).
The descriptive results underlined that the improvement was explained by increased accuracy and
error-freeness (S13). Similarly, a significant increase in produced audio quality (18-48kbps) caused
only a small improvement in the overall quality content independently (@video bitrate of 320kbps,
P2, P5). The related descriptive results emphasized the dominance of visual quality as visual
descriptions were numerous and the mentions in audio or audiovisual quality were minor (P12).
Finally, at the extremely high quality level (insufficient for broadcasting, 10Mbit/s, 25fps),
improvements in audio quality from mono to stereo presentation did not improve experienced overall
quality. Visual quality was a major evaluation criteria and content dependent differences were not
announced (P12, P4). In sum, these results showed that when the produced overall and visual
quality level is high, 1) the influence of increase in audio quality is very small or even non-
significant and 2) content-dependency as a phenomenon seems to be less announced than on a
lower produced quality level.
Quality of 3D on mobile devices is heavily influenced by the characteristics of the display
technology. In a study utilizing parallax barrier display technology, the quality of 3D was considered
unacceptable to use (below a 50% acceptance threshold) (P5, P11). For 3D presentation, higher
bitrates were equally rated (320 and 760kbps) independently of the framerate used and a significant
increase in bitrate-framerate resources (1536kbps, 25fps) did not improve experienced quality with
simulcast video coding (P5, P11). However, these outperformed very low bitrates (160kbps,
15/10fps) (P5, P11). The descriptive results showed that the pleasantness of 3D and the feeling of
depth were commonly perceived, but inaccuracy, unclarity, fogginess, bad details, shadows, seeing in

52
two, increased need to focus, fore-/background relation were among the most often mentioned side
effects (S13). Some of these negative effects were announced independently of the used produced
quality parameters (3D shadows, seeing in two) highlighting the weaknesses of parallax barrier
display technology (S13). When lenticular sheet display technology was used, 3D video quality was
experienced as more acceptable (the acceptance level was between 60-90%) (P4), and visual
discomfort was significantly lower compared to the studies with parallax barrier displays (S11). To
anchor the level of visual discomfort, it was lower or comparable to symptoms reported after fast
speed gaming lasting 40 minutes on a monoscopic CRT display (S11), Häkkinen et al, 2002). These
studies confirmed that highly acceptable (at least 80%) visual quality can be reached independently
of the coding technology, when the total bitrate is at least 320kbps (P4). The descriptive results
showed that the added value of depth is only conveyed if the level of visual artefacts is low. Good
visual 3D quality was characterised in terms of impressions of depth, spatial, sharp, layered, illusory,
detailed and pleasurable to view, while it was be negatively associated to visible artefacts, stress, and
blur (P4). In sum, these results showed that: 1) The provided quality of the display technology
can significantly influence experienced quality including visual comfort and, therefore,
comparisons of video quality should not be limited only to one available technology. 2)
Nowadays produced quality data rates (320kbps) and framerates (10fps/15fps) seem to be
sufficient for providing a pleasurable viewing experience if accompanied with appropriate
display technology for 3D on mobile devices.
The comparisons between 2D and 3D were conducted to go beyond the assumption of the
superiority of the novel technology under development. The comparisons were conducted in two
studies. The results showed that 2D was preferred over 3D when parallax barrier technology was
used (P11, P5, S13). In the descriptive results, 2D quality was characterized by accuracy, good
colors, pleasantness to watch, ease of viewing and error freeness (S13). In contrast, 3D conveyed
impressions of the feeling of depth, 3D experience and clarity, but it also covered broadly negative
impressions of errors and required extra effort from the user (S13). In addition, 3D viewing required
a higher amount of effort from the user to find the optimal viewing position (P5, S13). In the second
study using lenticular sheet technology, the overall quality of 3D was highly improved, but the 2D
presentation mode slightly outperformed 3D in the overall results (P4). The descriptive results
revealed that 2D was described with positive terms such as pleasant, beautiful and focusable, while
3D contained both positive impressions of depth but also negative expressions of errors (e.g.
stressful, blurred, unstable) (P4). In both studies, the improvements in audio (increase in bitrates or
change in the presentation mode) did not increase the overall quality while presenting 3D video
content, and the descriptive results relied on the visual characteristics. In our latest results, we have
been able to show that the 3D presentation mode with the lenticular sheet display technology can
provide more pleasurable visual quality than 2D with the absence or existence of a low degree of
spatial artefacts (Jumisko-Pyykkö et al., 2011). In summary, these results showed that 1) a visual
2D presentation mode is preferred if the visible artefacts are part of the 3D presentation, 2)
visual quality dominates over audio or audiovisual quality at these produced quality levels

53
(when a 3D presentation mode is used), 3) visual 3D viewing can provide enhanced viewing
experiences, but can require extra effort from the viewer compared to 2D.
5.1.2.2 Transmission
The influence of residual transmission error rates on perceived quality was studied for 2D video
(P1). The error rates for erroneous time-sliced bursts after FEC decoding (also known as also known
as MPE-FEC frame error ratio, MFER) were varied. According to the quantitative results, the
perceived preference order in all the content types for error rates was 1.7%, 6.9%, 13.8% and 20.7%,
respectively, indicating clearly detectable differences between stimuli (P1). In practice, acceptable
quality can be reached when approximately 4/60 seconds of the presentation is corrupted. The
components of experienced quality were audio, video, audiovisual, and media independent quality,
content, usage, and hedonistic factors (Appendices 1-2). Temporal impairments in audio (cut offs)
and video and ability to follow content were among the most mentioned sub-components, indicating
that the errors present in the contents had an interrupting role in relation to the user‘s viewing task
(Appendices 1-2). The further quantitative analysis of instantaneous annoyance between noticeable
audio, visual and audiovisual errors revealed the differences between the produced quality levels
(P7). When overall produced quality level (1.7%) was experienced as highly acceptable, errors in
audio were the most annoying (P7). At the acceptable error rate of 6.9%, audio and visual errors were
equally annoying. In contrast, when quality went below the acceptance threshold video and joint
audio-visual errors were among the most annoying (P7). These results indicate that at a good
produced quality level, users‘ attention is on the content and it is interrupted by few short sporadic
temporal audio or video impairments. If the produced quality is low, the viewing task is continuously
interrupted by several long-lasting uni- and multimodal cut-offs and attention may be shifted to these
errors. Later, our studies have shown that people can tolerate as high error rates as 10% for mobile
3D visual video quality if audio is presented as free from temporal gaps (Strohmeier et al., 2011). In
sum, these results showed that 1) people can tolerate a certain amount of transmission errors,
and this tolerance can be content independent, 2) these errors have a strongly temporal nature
and they act as interruptions to the user’s viewing task, and 3) instantaneous annoyance
between modalities depends on the overall produced quality level.
5.1.2.3 Media and transmission
The studies to combine targeted media and transmission components have examined error control
methods and error rates around the acceptance threshold for 2D audiovisual service (P1, S3, S4). The
quantitative results showed that 1) the error rates dominate over the control method, 2) only small
improvements in quality can be achieved by the different error control methods, 3) there is a relation
between audiovisual content dependency and the level of quality. In the low error rates (6.9%)
experienced as giving acceptable quality, error control methods improving audio quality were
emphasized in news presentations, while improvements in visual quality were highlighted in sports
content. By contrast, extremely erroneous produced quality having a high error rate (13.8%) seems to

54
hide the content dependent preferences highlighting the importance of audio quality in all contents.
In the qualitative results, the most commonly described categories remain similar to those from
studies where error rates were compared, the number of errors seems to be a more important
evaluation criteria than the duration of errors, and the importance of the excellence of audio was
interpretable for high error rates (Appendix 3). In summary, these results showed 1) the
dominance of the error rates over the error control methods, 2) that the number of detectable
errors seems to dominate over the error length, 3) a connection between the level of produced
quality, audiovisual quality and content-dependency: content dependent relative importance
between media is underlined at the acceptable quality level while the role of audio is
emphasized at the unacceptable quality level independently of content.
5.1.3 System - Descriptive quality of experience
Descriptive Audiovisual Quality of Experience for 2D video on mobile device - Experiential
descriptions, impressions and interpretations of quality for 2D video on mobile device were studied
in four experiments. The results of these studies are summarized study by study when produced
quality varied on the media (P8), the transmission level (Appendices 1-2) and on both the media and
transmission levels (Appendix 3). The results showed that experienced quality contained both
stimuli-driven low-level factors and high-level factors, which take into account users‘ goals of using
the system or their knowledge about the system (P8). The quality at the media level was constructed
from audio, video, audiovisual, content and usage components (ibid.) In addition to these
components, the later studies underlined hedonistic and media independent components (Appendices
1-3). To understand the permanent components of quality of experience over the studies the results of
these independent studies were further summarized (Appendix 4). The descriptive quality of
experience for 2D audiovisual video is composed of six main components: 1) audio, 2) video, 3)
audiovisual, 4) usage, 5) media independent quality, 6) content, and one supplementary component
called 7) hedonistic quality to define the excellence of the components. To assess the strengths of the
model, it underlines broadly the uni- and multimodality, but might overemphasize the role of
interruptive temporal impairments, their countable and appearance nature.
Descriptive Quality of Experience for 3D video on mobile device - The model of Descriptive
Quality of Experience for 3D video on mobile device (DQoE - mobile 3D video) was presented in
(P12). The model is based on the results of five studies where descriptive data-collection took place
together with psychoperceptual evaluation. The experiments contained a heterogeneous set of
produced quality factors by varying the content type, level of depth, compression and transmission
parameters, and audio and display factors for 3D. The model contains four main components: 1)
visual quality, 2) viewing experience, 3) content, and 4) quality of other modalities and their
interactions, and 16 related subcomponents. The model gives detailed definitions and examples of
subcomponent-dependent bipolar descriptive terms for each of the components and subcomponents.
The strengths of the model are the detailed descriptions of the visual quality and viewing experience,
but the impressions of audio and audiovisual quality lack a detailed presentation.
The summary of the subcomponents of both general descriptive models are presented in Table 7.
It shows that experienced quality is constructed from quality in 1) visual, 2) audio, 3) audiovisual

55
domain, 4) usage and viewing experience, 5) content, 6) overall quality, and 7) hedonistic
components. As the hedonistic component represents the characteristics of excellence of overall
quality or components or subcomponents, it is presented aside of the general components. These
components demonstrate a sole structure of attributes of descriptive quality that are replicated over
the several studies.
Table 7 Descriptive components of quality of experience for 2D and 3D mobile video.
DESCRIPTIVE COMPONENTS OF QUALITY OF EXPERIENCE 2D AND 3D VIDEO ON MOBILE DEVICE
(summarized from P12 and Appendix 4)
VISUAL HE
DO
NIS
TIC
Overall impression of visual quality
DEPTH: Perceivable depth, Impression of depth, Foreground-background layers, Balance of foreground-background quality
SPATIAL: Clarity of video, Block-free video, Color, brightness, contrast, sharpness
MOTION: Fluency of motion, Clarity of motion, Nature of motion in content, Visual error pattern, Number and
duration of errors
OBJECT: Detectability of objects and edges
AUDIO
Overall impression of audio
SPATIAL: Naturalness /Clarity of audio
TEMPORAL: Fluency of audio, Audio error pattern, Number and duration of errors
AUDIOVISUAL
Importance of media, Annoyance of errors in different media
TEMPORAL: Synchronism between media, Synchronism in error pattern
CONTENT
VIEWING EXPERIENCE AND USAGE
VIEWING TASK: Ability to follow content/Ease of viewing, Pleasantness of viewing, Enhanced immersion
VISUAL DISCOMFORT: Visual discomfort
RELATION TO CONTENT AND SYSTEM: Fitness to purpose of use, Comparison to existing technology,
Relation to content
OVERALL QUALITY/MEDIA INDEPENDENT QUALITY
Overall quality
TEMPORAL: Overall error pattern, number and duration of errors
5.1.4 Context of use
Three studies explored experienced quality in the context of use and compared the results
gathered in controlled laboratory circumstances.
5.1.4.1 Experience of transmission quality in three field contexts and an initial comparison to
controlled circumstances
The first study explored the influence of the context of use on quality requirements for mobile 2D
television when varying residual transmission error rates (P5, P10). The experiment was conducted
in three CoU (called station-wait, bus-travel, café-relax). The quantitative results showed small
differences in quality requirements between the three studied contexts (P10). The descriptive
experienced quality factors between the contexts contained 1) context characteristics (e.g. physical
and social context), 2) parallel tasks competing for attention between viewing and context, 3) usage
(ease of viewing, user‘s relation to context), 4) system quality (importance of audio and difficulty to
detect details), 5) the entity of context and system quality, and 6) affective factors (P5). Even though
the complexity of the tasks and the nature of the environments varied, they did not cause a difference

56
in acceptance or satisfaction with quality between these field contexts. This indicated that the simple
dual tasks during quality evaluation do not have an impact on quality requirements, even if people
are aware of differences in the task demands (S6). When it comes to the goals of viewing mobile TV,
the entertainment evaluations were the lowest in the bus context and information assimilation was the
highest in the café context. The qualitative results confirmed that the café context provided the
calmest and most pleasant environment for viewing, explaining the improved entertainment and
information recognition evaluations. In a bus, the task demands (viewing under harsh movements,
parallel tasks) may have contributed to unpleasant experiences of entertainment. A comparison
between the results of all the field contexts and the laboratory showed differences in the quality
requirements in two ways: 1) The extremes of quality were rated as better or worse in laboratory,
showing that improvements in good or bad qualities need to be clearly detectable to become
acknowledged in the field. 2) The ratings were systematically more approving in the field. This
indicates that quality requirements for acceptance drawn from laboratory are conservative, being in
line with Knoche & Sasse (2009) and showing the importance of validating them in the field for new
mobile services. The comparison between the contexts and laboratory results had some limitations, as
the difference might be explained by the context, divided attention, and viewing task. The laboratory
experiment was carried out in a distraction-free surrounding where the participants‘ only task was to
assess quality with the same stimuli repeated several times. In contrast, more demanding settings
existed in the field: different types of distractions, parallel tasks to share attention between the
evaluation task, surroundings, and the given scenario. In the field, the viewing of story-like content
formed from a series of videos shown only once might have resulted in better external validity with
more natural emotional responses from the viewer and the usage situation might have been easier to
emphasize as well (Appendix 2, Isomursu et al., 2007). In summary: 1) Differences in the
excellence of quality between the studied contexts were small, but they seem to differ from
controlled laboratory evaluations, depending on the level of quality. 2) Experienced quality in
context is constructed from multiple components (e.g. context characteristics, parallel tasks,
use related factors and impression of entity between system and context quality). 3) In
obstructive surroundings, the importance of fluent audio is highlighted, while under move the
ability to detect visual details is limited. 4) Story-like content seems to facilitate normal viewing
behavior while it may also underline the time varying nature of quality.
5.1.4.2 Experienced 3D visual quality in calm - controlled and simulated - contexts when
varying media level produced quality factors
The second study explored the influence of two calm contexts on the quality requirements for
mobile 3D television (P5). The chosen contexts represented conventional laboratory experiment
conditions and an analogue situation to a simulated home-like context with more freedom given for
the users (e.g. holding device, positions, lightning). The video encoding parameters under the
simulcast scenario and the presentation modes between 3D and 2D were varied. The results showed
contextual differences in quality between the contexts. Firstly, the quality was higher in the
laboratory than in the home-like context. This difference cannot be explained by the overall task

57
load, as it was rated equally demanding between the conditions. Our analysis of the context
characteristics showed that both contexts were very similar in terms of the social context, the easy
parallel tasks, and the audio surrounding, but differed in terms of the visual conditions (lighting,
viewing angle, holding device). In the laboratory, the participants had a face up position, no
reflections to the screen and a relatively low lighting level. In contrast, in the home-like context the
participants‘ the viewing position was face down, such as in normal mobile device use, and the room
had a higher level of lighting. Our qualitative results underlined that the home-like context was
understood as a natural or normal setting where the ability to move the device and change position
reflected the difficulty to find a comfortable viewing angle and concentrate on the task. All in all, the
descriptive experience of quality was composed of 1) the characteristics of context, 2) usage, 3)
system quality (viewing angle), 4) and the relation between context and system. To sum up: 1)
Increase in the degree of freedom in the user’s position and viewing conditions to achieve
natural viewing settings do not only show the small differences in the quality requirements but
also start to reveal aspects of use that may become critical in more demanding real-life viewing
conditions when viewing 3D video on the mobile device. 2) Experienced quality in these
circumstances reflected the characteristics of context, usage, system quality and the entity of
context and system.
5.1.4.3 Experienced 3D audiovisual quality in field and controlled contexts when varying media
level produced quality factors
The third study explored audiovisual quality for mobile 3D televisions in three contexts (bus,
station, lab) and compared the results to those gathered from calm circumstances (P5). The results of
the quality preferences showed differences between the field and controlled studies. Both field
conditions also showed similarities. The evaluations given in the analogue home-like context were
similar to the laboratory ratings, but they were very different to the others given in the real field
conditions. Differences in the quality ratings between the contexts appeared in three ways: 1)
experienced quality was as more acceptable and 2) less detectable in the field. 3) The interaction
between quality and context was also shown. In the good qualities, above the acceptance threshold,
the difference in the qualities needs to be very detectable to become acknowledged in the field. In
practice, to set up the quality level for the calm surroundings the results from the laboratory act as a
good reference, while for the busy surroundings lower quality can be enough depending on the nature
of the impairments. The results of quality experiences in the context and situational data are also
emphasized in the similarities between the field conditions compared to those of the controlled
laboratory. The distracting factors of physical contexts, especially reflections on screen, parallel tasks
and positive usage were related to the field contexts, and they were not comparable to the artificial
laboratory conditions to any degree. Although the parallel tasks were mentioned in the qualitative
data, the results of the overall task load did not show any significant differences between the
situations. In all, the descriptive contextual quality factors were following: 1) context characteristics,
2) task context including parallel tasks, 3) usage (ease of viewing, user‘s relation to context, hand
fatigue, fitness to use), 4) system quality, 5) context and system quality and 6) technical and media

58
context. The results of situational data-analysis revealed the aspect of fragmented attention and the
user‘s movements between the studied contexts. Firstly, the number of gaze shifts was higher and the
duration of continuous gaze spans shorter in the field (~8s) compared to the laboratory (>10.6s). The
gaze spans in the field remain similar to those documented in previous studies. Oulasvirta et al.,
(2005) concluded that the fragmentation is 7-8s in comparable noisy pseudo- and non-move
situations (metro, car, cafeteria, railway station), while in the laboratory the continuous span was 14s
on average during page loading on a mobile device. Later, Chen et al., (2008) summarized from an
observational study with 100 people that an average span length is approximately 6 seconds in the
field (3.27 shifts/20 sec). Our results also show that gaze shifts were guided by the surrounding
activities, not by presented visual quality (excluding the possibility that low or high quality clips had
been systematically used for coping with the surroundings). These results indicate that mobile video
viewing with actively divided attention has similarities to other mobile HCI tasks in the field.
Secondly, a higher amount of user‘s movements to maintain the optimal position for viewing 3D
video was also identified in the field compared to the controlled conditions. This shows that critical
aspects to use can become more easy emphasized in the field than in the laboratory. In summary: 1)
These results indicate that there are differences between the groups of contexts (calm vs. noisy
field) in the excellence of quality, depending on the level of quality. 2) Experienced quality in
the field underlined the characteristics of context, parallel tasks, usage, system quality and an
entity of context and system. 3) Divided attention is a part of viewing on a mobile device in the
field. 4) Differences in the quality requirements between contexts cannot be explained by task
load, although people are aware of distracting factors and their active share of attention in the
field. 5) Quasi-experiments in the field start to reveal the aspects of actual usage, as suggested
by Jambon (2009), and can act as early phase prototypes for requirement elicitation (Consolvo
et al., 2009).
Summary of quality in the context of use (P5) - The results of the three quality evaluation
studies in the context of use showed differences in quantitative quality preference assessment
between the studied contexts in three ways. 1) The results were similar in calm surroundings – in
conventional laboratory conditions and analogue home-like circumstances. 2) The results among all
the actual field conditions showed similarities by containing surrounding distractions (e.g. noise) and
active division of attention. 3) There was a difference between the former calm and the latter
distractive groups of contexts, indicating a situational dependence of the quality requirements. Figure
11 summarizes the interdependencies between the produced quality, the perceived quality, and the
use context on the conceptual level based on the results. At the high produced quality level, the
perceived quality was higher in the laboratory than in the field measures. At the low produced quality
level, the perceived quality was higher in the field contexts than in the laboratory. The threshold of
acceptable quality indicating the useful level of produced quality is located between these two
extremes (P1). The results showed that with equal resources of produced quality, the minimum
acceptable quality is experienced as better in the noisy field circumstances compared to the
laboratory conditions.

59
The practical implications based on these results are summarized in the following. The
requirements for perceived quality determined for optimal audiovisual laboratory conditions are
applicable to calm, static surroundings with minimal external distraction. The requirements for good
perceived quality in optimal conditions can be higher than those needed for noisy and distracting
field conditions. In these circumstances, the maximum perceived quality (Figure 11: α the point
where an increase in the produced quality does not increase the perceived quality) may be reached
with lower technical resources (Figure 11: β). In practice, it would be desirable to know the context-
dependent maximum perceived multimodal quality levels and adjust the produced quality
accordingly by applying context-aware solutions for sensing the characteristics of contexts and use
modern scalable audio and video coding techniques to adjust produced quality accordingly.
Figure 11 The relation between perceived and produced quality with different quality levels
and options for context-dependent quality optimization around the high produced quality level.
5.1.4.4 Descriptive quality of experience in context of use
Experiential descriptions and impressions of quality in the context of use were studied in three
quasi-experiments. The summary of the main components of the studies show that experienced
quality in the context of use is constructed from five main components (Table 8): 1) characteristics of
context of use, 2) viewing experience and usage, 3) system quality, 4) context and system quality and
a supplementary hedonistic component.

60
Table 8 Descriptive components of quality of experience in context of use.
COMPONENTS OF QUALITY OF EXPERERIENCE IN CONTEXT OF USE (summarized from P5 and Appendix 5)
CHARACTERISTICS OF CONTEXT OF USE HE
DO
NIS
TIC
Overall impression of context
PHYSICAL: Audio, visual, vibration
SOCIAL: Presence of other people
TECHNICAL AND MEDIA: Other media and device
TEMPORAL: Viewing time
TASK: Parallel tasks
VIEWING EXPERIENCE AND USAGE
VIEWING TASK: Ability to follow content
RELATION TO CONTENT OR/AND CONTEXT: Relation to context, Fitness of context to purpose of use, Fitness of content type on context of use, Fatigue
SYSTEM QUALITY
AUDIO AND VISUAL QUALITY
CONTENT
CONTEXT AND SYSTEM QUALITY
Overall quality
Quality detection and trade off between context and system quality
5.1.5 Summary
The central components of quality of experience based on studies conducted for this thesis are:
1. The level of quality determines the relative emphasis between audio and video quality in
multimodal presentation. At the low quality level, insufficient to use, audio is emphasized
independently on used contents. Low quality can be understood containing strong visual
distraction (hardly detectable details, highly impaired presentation, and reduced viewing
conditions due to the surrounding context). At the mid quality level, above the acceptance
threshold, importance between audio and video depends on content. At the high quality
level, clearly above acceptance threshold, visual quality is highlighted. At this level,
influence of improvements in audio quality to overall quality is very small, audiovisual
content dependency is less announced, but the temporal audio impairments are the most
annoying. The recent study by Peredugov et al., (2010) gives further support for the
conclusion of a quality level dependent optimal share between audio and video resources on
small screens. However, the relation between content-dependency and quality level cannot
be concluded from their study due to unequal experimental design between the content
types. In summary, these results indicate that the level of quality is an essential component
of multimodal quality of experience, and is a more complex phenomenon than the modality
appropriateness hypothesis (Welch & Warren, 1980) and existing models of multimodal
quality (Hollier et al., 1997) have proposed.
2. Quality of visual 3D experience is a more complex construction than a simple relation
between erroneous and error-free presentation. The following principles are attached to it: 1)
3D quality of experience is influenced by the provided quality of the display technology. 2)
A pleasurable viewing experience for 3D video seems to be possible to reach nowadays with
produced quality data rates (320kbps) and framerates (10fps/15fps) if appropriate display
techniques are used. 3) The ease of viewing is a central requirement for 3D video (as an
ability to focus on content and maintain the optimal viewing conditions while viewing in the
field under pseudo-move, variable light conditions and active share of visual attention
between the device and the surroundings). 4) The depth is detectable on small screen and it
can provide enhanced immersion on a mobile presentation when the level of visible artefacts
is low; otherwise 2D presentation is preferred. 5) 3D viewing with impaired presentation on
small screen can have some visual discomfort. These principles indicate a more complex
structure for 3D visual quality of experience than Seuntiens‘ (2006) model proposed.

61
3. The studies of the descriptive quality of experience underline five main characteristics of the
quality of experience: 1) interpreted system characteristics - visual, audio and audiovisual
quality and content - containing numerous detailed subcomponents, 2) viewing experience
and usage including subcomponents in the viewing task, visual discomfort and relation to
system and context, 3) interpreted characteristics of context of use, including distracting
factors and parallel tasks, 4) relation between context and system quality, 5) properties such
as overall impression of quality and hedonistic factors. These characteristics confirm that
the quality of experience goes beyond simple processing of data-driven features of stimuli
or surroundings, and they include aspects of higher-level perceptual processes and action-
related properties as an essential part of it (e.g. Gibson, 1979).
4. There are common characteristics for interpreted multimodal stimuli, but the emphasis
between the characteristics can vary. As extremes, when the transmission level factors were
varied, experiential factors emphasized strongly the nature of the temporal error pattern and
the user‘s ability to follow the content. In contrast, when depth was varied, its detectability,
the visibility of impairments, enhanced viewing experience, ease of viewing and visual
discomfort were underlined. These results indicate uneven influence of different produced
quality factors on perceived quality.
5. The studies evaluating quality under different contexts showed interaction between the level
of quality and the context characteristics. These studies indicated that in noisy surroundings,
evaluations are more approving and less detecting. This conclusion was confirmed by
Knoche & Sasse (2009). In addition, the parallel tasks and the active share of attention
seems to be an essential part of viewing in the field.
6. The quality of experience is influenced by the user‘s relation to content (interest and
knowledge), and to digital quality (knowledge), attitudes towards technology, and
demographic factors.
5.1.6 Model of User-Centered Quality of Experience
User-Centered Quality of Experience (UC-QoE) is constructed in an active perceptual
process where the characteristics of user, the system and the context of use are contributing
and its outcome is described by different experiential dimensions. An overview to the model is
presented in Figure 12 with its four main components. At the current stage, the model is not meant
for underlining the relative importance between the components as there is not enough evidence
available. The term UC-QoE is used to highlight the concept that experience is constructed by the
user and it is an outcome of her/his information processing in given circumstances. The established
concept of Quality of Experience (QoE) is assumed to be user-centric per se, but it has a strongly
system-centric emphasis, (e.g. ITU-T P.10, Amendment, 2008). To estimate quality of experience
reliably without people is difficult for novel systems (e.g. mobile 3D video) as their produced quality
is influenced by multiple factors and modalities over the end-to-end system chain and the accuracy of
predictive metrics is limited.
User - is a person who actively perceives (controls and manipulates) a system. A human active
perceptual process combines: 1) early sensorial processing to extract the relevant features from
incoming stimuli, 2) information between sensorial channels based on temporal and spatial
proximity, and the modality with the greater resolution to the task is dominating, 3) higher-level
cognitive processing to interpret quality, and to judge its relevance to intentions and goals, including

62
knowledge, expectations, attitude, emotion and ecological perception, are a necessary part of it. The
influence of knowledge (in digital qualities and content), attitude towards technology, expectations,
emotion (content), cognitive styles and demographic factors on quality requirements have been
demonstrated, summarizing that individual differences in both processing levels can complement and
modify final quality perception. The user‘s role in controlling and manipulating is necessary for
interactive systems, but is not discussed as part of this model.
The relations between the user, system and context of use are also part of quality perception.
They cover the user‘s relation to the overall system, to its content and sensorial influencing
properties, user‘s relation to context, and the combination over the whole chain including the user,
system and context of use.
System - represents the characteristics of produced video quality categorized into three
abstraction levels – content, media and network for multimedia presentation (Nahrstedt & Steinmetz,
1995). Noticeable artefacts can be part of the presentation in all layers. Content-level quality factors
are related to the communication of information from content production to viewers. Beyond the
story of the content, factors that contribute to the visibility, size of objects and structure in depth, and
the location of information between modalities are central. Media-level quality includes media
coding for transport over the network and rendering on receiving terminals. At this level, good spatial
quality has a strong contribution over framerate, or slightly impaired stereoscopic presentation. The
share between audio and video resources depends on the content and level of quality over the
numerous parameters studied at this level (bitrate, framerate, resolution, presentation modes, codecs
and error control methods in visual and audiovisual quality). The third abstraction layer summarizes
data transmission over a network where the physical characteristics of a radio channel can cause
imperfections to video. Under the broadcasting scenarios, detectable and accountable errors have a
strong negative and interruptive influence on quality and their pattern is a significant factor. At good
quality level, audio interruptions are the most annoying.
Context of use - represents the circumstances in which the activity of viewing takes place. These
circumstances can be categorized further to the physical, temporal, task, social, technical and
information domains with related properties of magnitude, dynamism, patterns and typical
combinations. For mobile television viewing, the following main characteristics are listed: viewing
while commuting, in public and private locations, it requires a macro break with enough time to start
and concentrate on viewing. For the sensorial quality, distraction from the physical and social context
and fragmented attention between video and the surroundings are essential characteristics.
The level of quality characterizes an uneven relation or thresholds between perceived and
produced quality within the context. For example, it can be a level where the focus of attention is
drawn from content to errors or context long-lastingly, or it can be an indicator of minimum useful
quality, or a layer where importance between modalities or annoyance between artefacts changes.
Furthermore, the level of quality can be characterized by a context-specific terminal threshold, a
detection threshold or the relation between context and system quality.

63
Experiential dimensions - defines the outcome of the perceptual process in four dimensions
called descriptive attributes, excellence, appropriateness to use and psychophysiological influence.
Descriptive attributes are verbally expressible distinctive features of quality. Excellence defines the
preference of overall quality or its attributes. Appropriateness to use relates quality to the fulfillment
of requirements to use. Psychophysiological influence is composed of physiological automatic
reactions to quality with a connection to a psychologically interpretable phenomenon, but it is not
necessarily connected to a conscious quality experience.
As an example, the model presents the descriptive attributes for the quality of experience of
mobile 2D/3D television in the context of use. The descriptive attributes are divided into two parts.
Firstly, the attributes the user‘s experienced quality of the system is are described by the two main
components – viewing experience and usage, and system characteristics. Viewing experience and
usage reflect the higher level constructs of experienced quality illustrating user‘s the relation to
viewing task, visual comfort and relation to system. The system characteristics contain the
representations of sensorial modality specific attributes for audio and video, their audiovisual joint
contribution and content. Secondly, in addition to these, a set of specific attributes describes the
quality in context of use. These characterize the viewing experience and usage, interpreted
characteristics of context of use, and relation between context and system quality. These descriptive
attributes demonstrate that the quality of experience goes beyond the interpretation of data-driven
features of produced quality and its mediated features of high-level perceptual processes including
action-related properties.
Processes between the components describe the actively ongoing actions and are marked with
arrows.
1. Between the user and the system in context: an active perceptual process where all these
components contribute.
2. Between the user and the experiential dimensions: an active learning process where active
adaptation and accommodation of our existing data structures take place. They further influence
the way of directing our attention in quality perception (following the idea of Neisser‘s
perceptual cycle 1976).
3. Between the experiential dimensions and the system: knowledge of the experiential dimensions
needs to contribute to and direct the further development of system characteristics.

64
S Y S T E M
C O N T E X T O F U S E
physical, task, social, technical and media, temporal
VIDEO
Object: Ability detect objects and edges
Depth:Perceivable deph, foregournd/background layers
Spatial: Clarity, block-free, colors, brigtness, contrast, sharpness
Temporal (motion): Fluency and clarity of motion,
nature of motion, error pattern, number and duration of errors
Overall impression of visual quality
AUDIO
Spatial, Naturalness/Clarity
Temporal: Fluency, error pattern, number and duration of errors
Overall impression of audio quality
AUDIOVISUAL
Between modalities: relative importance in content, annoyance of errors
Temporal: Synchronism between media, sychronism in error pattern
CONTENT
VIEWING TASK
Ability to follow content/ Ease of viewing
Pleasantness of viewing
Enhanced immersion
VISUAL DISCOMFORT
RELATION TO CONTENT / SYSTEM
Fitness to purpose of use, relation to content,
comparison to existing technology
OVERALL QUALITY
Overall quality, temporal error pattern, number
and duration of errors
IN CONTEXT OF USE
Le
ve
l o
f q
ua
lity
PERCEIVED QUALITY
CONTENT
MEDIAcapture, coding, decoding,
visualization on display
NETWORK
transmission, error resilience
mu
ltime
dia
, artifa
cts
as im
pe
rfectio
ns
PRODUCED QUALITY
LOW SENSORIALextraction of relevant features of
incoming information
MULTIMODALintergration, modality
appropriateness
HIGH COGNITIVEexpectation, attitude, knowledge
emotion, ecological perception
Active perceptual process
U S E R
Video presentation
E X P E R I E N T I A L D I M E N S I O N S
DESCRIPTIVE ATTRIBUTES EXCELLENCE APPROPRIATENESS TO USEPSYCHOPHYSIOLOGICAL
INFLUENCE
System quality: audio, visual and content
Overall quality
Quality detection and trade-off between context
and system quality
VIEWING TASK
Ability to follow content
RELATION TO CONTENT / CONTEXT
Relation to context, fittness to purpose of use,
Fitness of content on context, Fatigue
Physical: audio, visual, vibration
Task: parallel task
Social: presence of other people
Technical and media
Temporal: viewing time
Overall impression of context
QUALITY OF EXPERIENCE FOR MOBILE 2D/3D TELEVISION
MODEL OF USER-CENTERED QUALITY OF EXPERIENCE (UC-QoE)
VIEWING EXPERIENCE AND USAGE
VIEWING EXPERIENCE AND USAGE CHARACTERISTICS OF CONTEXT CONTEXT AND SYSTEM QUALITY
SYSTEM CHARACTERISTICS
EXAMPLE OF DESCRIPTIVE ATTRIBUTES
Figure 12 Model of User-Centered Quality of Experience (UC-QOE) is composed of four main
components: user, system, context of use, and experiential dimensions. In the experiential
dimension, the descriptive attributes for mobile 2D/3D television in the context of use are given
as an example.

65
5.2 Evaluation methods
This section presents the results in the development of methods for the evaluation of User-
Centered Quality of Experience. The presentation is partly redundant to the previous sub-section, as
the constructive method development has been parallel to conducting these studies. In the beginning,
the framework for the evaluation is presented to build up a holistic understanding of the factors
contributing to it. Four developed methods under this framework are presented in the next sub-
sections. The first method – Bidimensional research method of acceptance – targets on the evaluation
of a minimum useful quality level for a certain application as part of quantitative quality evaluation.
The second – Experienced quality factors – is an interview-based descriptive quality evaluation
method with a simplified data collection procedure. The third – Open Profiling of Quality (OPQ) – is
a mixed method to combine psychoperceptual quality evaluation and descriptive quality evaluation
based on an individual‘s own vocabulary. Finally, Hybrid method for quality evaluation in the
context of use tackles the challenges of conducting quality evaluations outside the controlled
conditions. A short introduction, an overview to the method and its evaluation, is presented for each
of the methods.
5.2.1 Framework for evaluation of User-Centered Quality of Experience
Introduction - The goal in the development of a methodological framework was to build an
overview of the factors that contribute to user-centered quality of experience evaluation (S16)3. This
holistic framework can be applied and adapted to different user-centered quality evaluation studies,
but it is not meant to be a detailed methodological guideline giving step-by-step instructions for
conducting the experiments. The development of the framework is based on a literature review,
presented in sections 2-3. The methods of the framework need to take into account the following
principles (S7, S9): 1) Quality perception is an active process combining different levels of human
information processing and combining information from multiple modalities. 2) Component user-
experience examines the quality of critical system components by reflecting the factors that surround
the whole user experience. This requires addressing the factors of external validity in terms of user,
system/service and context of use selection. 3) When studying quality for novel systems, combining
several modalities and multiple parameters included in their joint influence, an overall quality
assessment approach and a connection to quality requirements necessary for the usage are needed
(e.g. minimum useful quality level). 4) Quality needs to be understood more broadly than as
measures of existence of detectable artefacts or its negative consequences on the user (e.g. eye-
strain). 5) Quality evaluation experiments can be understood as a part of user-centered design
process. For the new systems, the quality evaluation experiments containing an early-phase prototype
can offer a possibility to verify user requirements prior to finishing the high-fidelity prototype.
Method - The User-Centered Quality of Experience evaluation framework is a collection of
independent methods and factors that relate quality evaluation to the potential use of system (Figure
3 The early version of the framework is presented in S16 and written by the candidate.

66
13). It takes into account 1) the potential users as quality evaluators, 2) the necessary system or
service characteristics included in its potential content and critical system components, 3) the
potential context of use resulting in evaluation in quasi-experimental settings and the controlled
surroundings, 4) that evaluation tasks are connected to expected usage, and/or they aim also to
understand the interpretation of quality parallel to excellence evaluation and can include
supplementary ergonomic measures. Ultimately all these four factors are taken into account, but in
practice that can be limited by external factors such as product readiness, accuracy of user-
requirements, or resources. The aim, the relation to external validity and its threats, the procedure and
reporting as part of evaluation are presented for the four main factors of the framework – for users,
system/service, context of use and task.
Figure 13 Framework for User-Centered Quality of Experience Evaluation.
1. User - Participant selection
Sample selection: The aim is to select the sample which is representative of the potential users
of the system. When designing the new system or service, sampling is done based on the user
group definitions of user requirements. Potentiality can also contain many aspects, like relation
to the content, service, or technology (P9, S1).
External validity of sample selection: Can the results be generalized beyond the sample tested
to a broader population of interests for a certain system or service?
Threats of external validity: The conventional categorization of participants to naïve or
professional evaluators in quality evaluation research can threaten the external validity as well as
assuming that the students are representing all user groups (P9).
Demographic and psychographic data-collection: Collect demographical and psychographic
factors with well validated tools for understanding quality and re-defining the user requirements.
The data collected may contain: age, gender, education, technology attitude, user‘s relation to
content, service, and technology. Test the participants‘ sensorial sensitivity of the modalities
under the investigation.
Reporting sample selection: Reporting needs to describe sampling on a level that the study can
be replicated. The reporting may cover: age, gender, education, technology attitude, user‘s
relation to content, service, and technology.
CONTEXT OF USE
USER SYSTEM
Content
System parameters
TASK
Quantitative quality preference evaluation in relation to user’s main task
Qualitative descriptive quality evaluation
TASK
Supplementary methods

67
2. System – Selection of produced quality factors (independent variables)
Content
Content selection: The aim is to select the test contents which are representative of the potential
contents of the system and which are representative of the measures the phenomena under
investigation. On the level of genre, user requirements describe the most potential contents. The
audiovisual characteristics also need to replicate the characteristics of the desired genre and be
representative of the measured produced quality parameters. Additionally, the length of the
content should aim at representing the length of the potential viewing of one meaningful episode.
External validity of content selection: Can the results be generalized beyond the content tested
to the whole content of interests?
Threats of external validity: As a difference to conventional psychoperceptual methods, test
materials contain a thread for external validity in two ways for user-oriented quality evaluation.
For example, standardized clips in video quality research represent the range of motion, content
and shooting distance provide a good comparability between the studies, but they are not
representative of the mobile TV quality research due to missing audio, not covering different
contents, limited camera shots within one test clip and short duration (10s) (VOEG, 2000;
Knoche et al., 2005).
Reporting content selection: Reporting needs to describe the content on a level that the study
can be replicated. The description should: contain the chosen genre, describe the story of the
chosen content containing a meaningful segment of content, its audiovisual characteristics (e.g.
motion, details, speech/ music, text, cuts) and duration.
System parameters
Parameter selection: The aim is to select system parameters or their combinations framing a
meaningful and representative unit of the whole system or service. A meaningful unit for
viewing may contain two modalities and combinations from the whole value chain (production
and packaging, its delivery and transmission and reception including the device and its display).
Furthermore, if price is an essential part of the service, it is necessary that it is part of the
evaluation (e.g. Bouch & Sasse, 2001).
External validity of parameter selection: Can the results be generalized beyond the parameters
tested to the whole system/service?
Threats of external validity of parameter selection: Threads of external validity choose
parameters from a limited part of the system, while their impact from the viewpoint of the whole
system can be very small. For example, drawing conclusions from the whole experienced quality
just by examining coding or, for multimodal quality of experience service, just focusing on one
modality at a time describes the potential thread (e.g. Winkler & Faller, 2007; Knoche et al.,
2005; P6, P2).
Reporting parameter selection: Reporting needs to describe parameters on a level that makes it
possible to replicate the study. The description should contain definitions of the parameters and
the used values.
3. Context of use – Contextual evaluation
Evaluation in the context of use: The aim of contextual quality evaluation is to assure that the
produced quality meets the requirements in the actual context of use. This is especially relevant
for those applications that are expected to be used in heterogeneous mobile contexts.
Context of use selection: The aim is to select the contexts which are representative of the
potential usage contexts of the system. User requirements define the most potential contexts on a
general level. Analysing the characteristics of surrounding contexts on macro and micro levels to
understand the circumstances of the study (P3, P5).
External validity of context of use selection: Can the results be generalized beyond the settings
used in the research to real-life settings of interest?
Threats of external validity: Conventional quality evaluation experiments have taken place in
highly controlled and sensorial optimal laboratory settings. It has been shown that the

68
requirements of these perceptually optimal settings differ compared to the requirements of noisy
mobile circumstances (P5, P10, Knoche & Sasse, 2009).
Conducting the experiments: It requires a shift from an experimental to a quasi-experimental
research method, understanding and reporting related threats of causal interference (Shadish,
Cook & Campell, 2002). A detailed presentation of quasi-experimentation is presented in (P5).
Reporting context selection: Reporting needs to describe the contextual characteristics so that
the circumstances of the study can be understood, including in temporal, physical, social, task
and technical and informational context and related dynamics.
4. Task – Selection of evaluation task
Quantitative quality preference evaluation
Evaluation in relation to action: The aim is to define the evaluation task in relation to the
actual viewing task with minimal distraction. The relation to the user‘s main task can be
understood as an identification of the minimum useful quality level (McCarthy et al., 2004), or it
can target more goal-oriented actions (e.g. entertainment). Bidimensional research method of
acceptance is presented in detail in (P1). If parallel tasks are the sole part of the expected use of
the system, they should be taken into account in the evaluation procedure. For example, an
active share of visual attention between a device and surroundings can be part of the use of a
mobile service (e.g. Oulasvirta et al., 2005; P5), or some applications may require active
interaction from the user (S6).
Reporting the data collection of evaluation task: An evaluation task and procedure need to be
reported, including the questions presented to the participants.
Qualitative descriptive quality evaluation
Understanding of quality: The purpose of measuring experienced quality qualitatively is to
understand the evaluators‘ interpretations and impressions of quality. When studying 1) novel
heterogeneous stimuli without knowing their perceptual effects in detail and 2) using an overall
evaluation approach with naïve participants, it is important to understand what kind of aspects of
stimuli have been paid attention to.
Data collection procedure: Select the method according to the goal of the study and fit to an
overall procedure. The light-weight interview-based method is addressed in detail in (P5, P8).
More advanced methods may be selected to draw deeper insight into the construction of stimuli
dependent descriptive quality using interviews (e.g. Radun et al., 2008) or individual vocabulary
(e.g. Lorho, 2005). The mixed method that to combine the individual vocabulary-based method,
and quantitative excellence evaluation is presented in (P4).
Reporting the data collection: The task and procedure for gathering interpretation of quality
needs to report including the main questions presented during the research. Furthermore,
definitions for the descriptive attributes need to be reported.
Supplementary methods
Influence on the user – The purpose is to examine the consequences of system quality, the
context of use or their combination on the user. These can reveal aspects of reliability of the
measures (e.g. task complexity during experiment) or joint influencing factors on experienced
quality (e.g. eye-strain). For example, NASA Task Load Index (Hart & Staveland, 1988) can be
used for measuring the influence of a task in quasi-experimental settings while Simulator
Sickness Questionnaire (SSQ) can provide supplementary information about cyber sickness as
part of experiments (Kennedy et al., 1993).
Reporting the data collection: The tools and procedures used for collecting supplementary
ergonomic impact need to reported.

69
Evaluation and further work - The framework challenges the existing paradigm of system-
centric evaluation towards user-centeredness. The main difference is to underline the increased level
of realism by improving external validity with a selection of potential users, potential system
characteristics and potential contexts of use, and use of a multimethodological approach. By
measuring and understanding quality in this way, the quality of experience is more than what is now
understood in the existing definitions and models (ITU-T P.10, Amendment 1 2008; Wu et al., 2009).
The increase of realism and a deeper understanding of experienced quality can result in more
expensive studies (i.e. more complex designs, increased time for planning and analyzing), underline
the locality and external validity of the results over high-level of control (e.g. test materials,
circumstances) of the conventional approach. Furthermore, the framework presents the factors and
methods independently, although many of them can be intertwined, their importance can be unequal
and the presentation accuracy varies, offering research topics for future work in this field.
5.2.2 Bidimensional research method of acceptance
Introduction – The aim of this work was to develop a research method to assess the acceptability
of quality. The presentation of the methods is based on (P1). The starting points for the development
of the method were: 1) Conventional psychoperceptual methods set the stimuli into an order of
preference, but do not connect quality to expected use. 2) An existing method (method of limit for
acceptance) is applicable when exploring quality near the threshold, but not above or below it. 3) For
the novel technologies, quality evaluation studies compare several parameters, media and their
interaction at the same time and their perceptual influence can be hard to predict beforehand. In some
of these scenarios, quality evaluations are comparisons between poor quality and, therefore, their
feasibility can be questioned. This leads to a connection between acceptability and preference on the
conceptual level (Figure 14A). As I concluded on regarding (P2): “-- to improve the connections
between the quality preferences or pleasances to the real usage, the anchor of binary acceptability is
necessary to -- set parallel to quality preferences –“. In the long term, the goal is to ensure that the
produced quality is set in a way that constitutes no obstacle to the wide audience acceptance of a
product or service.
Three studies were conducted to develop the method. The first experiment explored the
possibilities of using simplified continuous assessment in the evaluation of overall acceptance
parallel to retrospective measures. The second experiment studied the boundary between acceptable
and unacceptable quality using clearly detectable differences between stimuli. The third experiment
examined the acceptance threshold with small differences between stimuli under heterogeneous
conditions. These studies were conducted for mobile television with varying error rates and error
control methods with several television programs in a controlled environment. The results showed
that retrospective evaluations can be complemented with simplified continuous assessment during the
data collection procedure. Furthermore, all the measures were discriminative and correlated when
clearly detectable differences between stimuli were studied. By contrast, when small differences
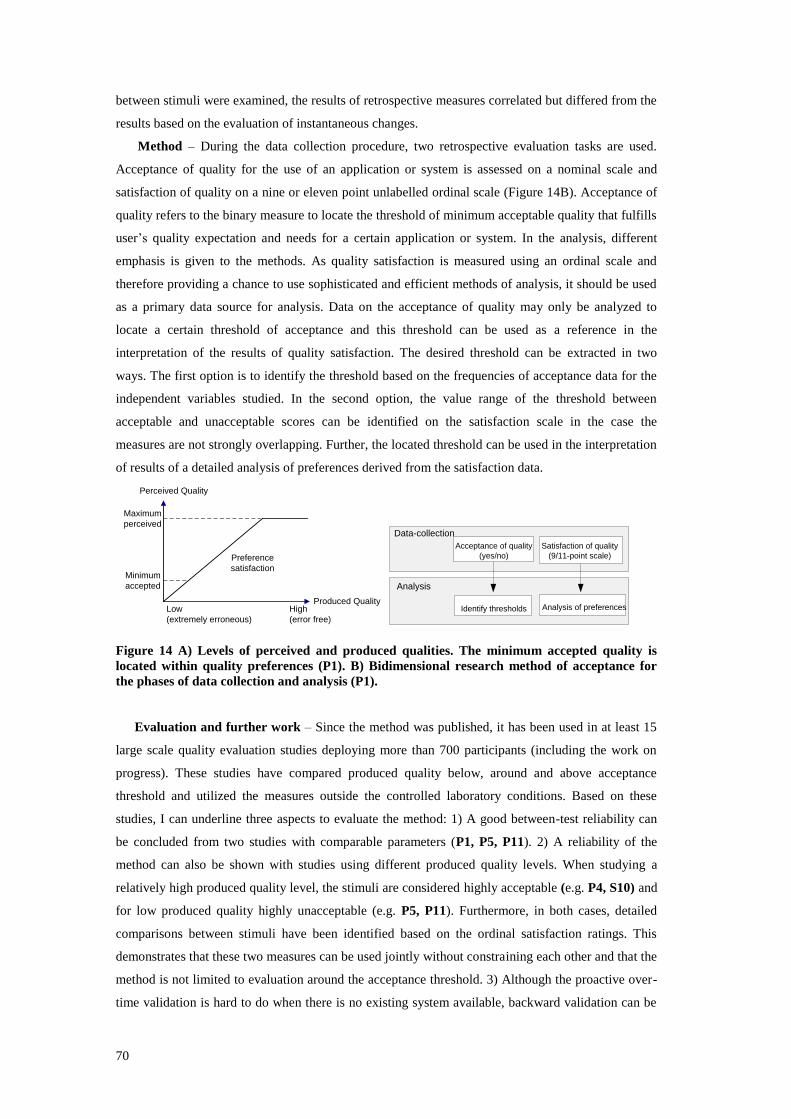
70
between stimuli were examined, the results of retrospective measures correlated but differed from the
results based on the evaluation of instantaneous changes.
Method – During the data collection procedure, two retrospective evaluation tasks are used.
Acceptance of quality for the use of an application or system is assessed on a nominal scale and
satisfaction of quality on a nine or eleven point unlabelled ordinal scale (Figure 14B). Acceptance of
quality refers to the binary measure to locate the threshold of minimum acceptable quality that fulfills
user‘s quality expectation and needs for a certain application or system. In the analysis, different
emphasis is given to the methods. As quality satisfaction is measured using an ordinal scale and
therefore providing a chance to use sophisticated and efficient methods of analysis, it should be used
as a primary data source for analysis. Data on the acceptance of quality may only be analyzed to
locate a certain threshold of acceptance and this threshold can be used as a reference in the
interpretation of the results of quality satisfaction. The desired threshold can be extracted in two
ways. The first option is to identify the threshold based on the frequencies of acceptance data for the
independent variables studied. In the second option, the value range of the threshold between
acceptable and unacceptable scores can be identified on the satisfaction scale in the case the
measures are not strongly overlapping. Further, the located threshold can be used in the interpretation
of results of a detailed analysis of preferences derived from the satisfaction data.
Perceived Quality
Produced Quality
Maximum
perceived
Minimum
accepted
Preference
satisfaction
Low
(extremely erroneous)
High
(error free)
Data-collection
Analysis
Identify thresholds
Acceptance of quality
(yes/no)
Satisfaction of quality
(9/11-point scale)
Analysis of preferences
Figure 14 A) Levels of perceived and produced qualities. The minimum accepted quality is
located within quality preferences (P1). B) Bidimensional research method of acceptance for
the phases of data collection and analysis (P1).
Evaluation and further work – Since the method was published, it has been used in at least 15
large scale quality evaluation studies deploying more than 700 participants (including the work on
progress). These studies have compared produced quality below, around and above acceptance
threshold and utilized the measures outside the controlled laboratory conditions. Based on these
studies, I can underline three aspects to evaluate the method: 1) A good between-test reliability can
be concluded from two studies with comparable parameters (P1, P5, P11). 2) A reliability of the
method can also be shown with studies using different produced quality levels. When studying a
relatively high produced quality level, the stimuli are considered highly acceptable (e.g. P4, S10) and
for low produced quality highly unacceptable (e.g. P5, P11). Furthermore, in both cases, detailed
comparisons between stimuli have been identified based on the ordinal satisfaction ratings. This
demonstrates that these two measures can be used jointly without constraining each other and that the
method is not limited to evaluation around the acceptance threshold. 3) Although the proactive over-
time validation is hard to do when there is no existing system available, backward validation can be

71
concluded. In the studies (P5, P11), the existing quality of service parameters for mobile television
was chosen as a reference and the results showed that these values provided highly acceptable quality
in the experiments. As a general limitation, the bidimensional acceptance threshold method connects
quality to the expected use, but it cannot predict the actual use. Wide audience acceptance is still
connected to multiple other factors – not only to quality (e.g. Rogers, 2003).
To estimate the cost of Bidimensional research method of acceptance it is a slightly more time-
consuming method to use compared to a one-dimensional measure (such as ACR, ITU-T P.911,
1998). As there is no systematical comparison available, these evaluations are based on the
estimations. In the phases of planning and data-collection, the increase in effort is small or not
significant. The use of two parallel collected dependent variables does not necessarily increase the
duration of the experiment, neither does the number of stimuli to be allocated to the experiment, nor
an increase in the needed sample size, being significant factors in the practical test design. However,
the use of a two-dimensional measure doubles the number of dependent variables to be analyzed and
reported. To reflect this effort for practitioners, the analysis including data-transfer but excluding
reporting is 0.21 hours/participant/dependent variable (for the set 48 of stimuli, Kunze, 2009). As a
reference, to conduct the experiment for this data set including in sensorial tests, training and
anchoring takes on average 1h/participant and therefore the analysis of two independent variables
requires only 42% of the time needed for their data-collection (estimated from Kunze, 2009). Based
on these calculations, the increased cost of Bidimensional research method of acceptance is resulted
from analysis, while from the perspective of the effort of the whole study (planning, conducting,
analyzing), this increase is estimated to be small.
In summary, Bidimensional research method of acceptance is beneficial when connecting quality
to the expected use of the (novel) system and it is applicable to stimuli on the variable quality levels.
The use of the method is estimated to slightly increase the cost of the study in the phase of analysis
compared to existing retrospective one-dimensional measures (e.g. ACR, ITU-T P.911, 1998).
5.2.3 Experienced quality factors - Interview-based descriptive method
Introduction – The goal was to develop a method with an easy data collection procedure for
descriptive quality evaluation. The presentation of the methods is based on (P1, P8, S5, Appendix 1-
4). The existing interview or vocabulary methods are complex to use as they require a multi-step
procedure and they are impractical to conduct in the field circumstances with time-varying media.
Method – The data collection procedure of descriptive experienced quality factors contains a
retrospective semi-structured interview. The interview is located after the quantitative quality
excellence evaluation, and it contains a free-description task which can be supplemented with a
stimuli-assisted description task. The flow of the tasks and an example of interview is presented in
Figure 15. In the free-description task, participants are encouraged to describe their impressions of
the phenomenon under study (quality or quality in context of use) as broadly as possible, and
additional stimuli material is not used. In a stimuli-assisted description task, a pool of stimuli is
characterized in more detail. The semi-structured interview has the following characteristics: 1) It is
beneficial for an unexplored, expectation-free research topic to identify the respondents‘ perceptions
or beliefs of a particular phenomenon. 2) It has a higher degree of control, reliability, speed and

72
interviewer effect compared to open interview, 3) but the analysis can be slow (Patton, 2002; Smith,
1995; Clark-Carter, 2002; Coolican, 2004). The semi-structured interview is composed of main and
supporting questions (ibid). The main questions with slight variations are asked several times during
the interview. The supporting questions clarify further the answers of the main questions and their
hedonistic dimensions. The supporting question replicates the terms introduced by the participant.
DATA-COLLECTION
Quality evaluation task
Experiences of quality
Free description task
Stimuli assisted description task
ANALYSIS
Data-driven analysis
One-dimenisional: Main categories of data
Multidimensional: Relations between main categories
8
MAIN QUESTIONS:
What kind of factors you paid attention to while evaluating quality (in this situation?)
What kind of thoughts, feelings and ideas came into your mind while evaluating quality
(in this situation?)
SUPPORTING QUESTIONS: (X=answer of main question)
Please could you describe in more detail what do you mean by the X?
Please could you describe in more detail how/when the X appeared?
Please could you clarify if the X was among annoying – acceptable - pleasurable /
positive – negative factors?
SEMI-STRUCTURED INTERVIEW:
Figure 15 Experienced quality factors – data-collection procedure with semi-structured
interview and analysis.
Procedure in the analysis follows the ideas of data-driven frameworks. Data-driven analysis is
well-applicable in the research areas with little a priori knowledge, and when aiming at
understanding the meaning or nature of a person‘s experiences (Strauss & Gorbin, 1998). In general,
semi-structured interview data can be analyzed in numerous ways within different frameworks
(Smith, 1995). The depth of the analysis can be decided according to the goal of the study. 1) One-
dimensional analysis identifies the major and sub-categories in the data. The Grounded Theory
framework presented by Strauss & Gorbin (1998) is used as a base in the analysis. The procedure
contains preparations (transcription of interviews to text, extraction of meaningful pieces of data),
open coding for identifying the concepts and their properties, further categorizing of data to sub- and
major categories. In the reporting of the results, the definitions for the sub- and major categories
needs to be available in oder to understand their internal structure. The most commonly described
categories can be identified based on their appearance frequency. To improve the reliability of coding
the review of second researches is used after the open coding and categorizing and inter-rater
reliability estimation applied to the final coded data. 2) Multidimensional analysis identifies the
relations between the categories (e.g. identifies the characteristics of per content or per context of use
or per different hedonistic categories). Correspondence analysis is a commonly applied descriptive
and explorative technique for visualization of a relationship between categories in a contingency
table (Greenacre 1984, ten Kleij & Musters, 2003, Ares et al., 2008, Nyman et al., 2006, Radun et al.,
2006). Furthermore, data-mining techniques can serve the need to identify the patterns within data.
For example, Bayesian modeling is applicable to context in which the variables are nominal and non-
normal in nature and to small sample sizes as they are typically the presumptions for the
sophisticated statistical methods (Myllymäki et al., 2002).

73
Evaluation and further work - The interview-based experienced quality factors method was
used altogether in nine different experiments to study the experiences of quality and quality in the
context of use (P2, P5, P8, P12, S5, Appendices 1-4, Kunze, 2009). Based on the meta-analysis of
the results, this method helps to identify the characteristic of a phenomenon, it can underline the
unexpected aspects (e,g, design ideas and guide further work), it is applicable to the controlled and
field circumstances, and the most importantly it can complement the quantitative excellence
evaluations by explaining them. As a limitation, when free-viewing task is used, the accuracy of the
descriptions highlights the most varying, the most recent and negative over positive factors due to the
retrospective nature of interviews (Fredrickson, 2000, e.g. P8, S5).
From the viewpoint of complexity and effort, interview data is easy to collect, but it is laborious
to analyze (as interview data in general, Smith 1995). To express this more accurately, Kunze (2009)
has recently conducted an initial comparison study between three different descriptive evaluation
methods. The compared methods were interview based experienced quality factors (P8), pairwise-
comparisons of stimuli with interview (Häkkinen et al., 2008), and an individual‘s vocabulary-based
sensory profiling (P4). The data collection of these descriptive methods was carried out after the
quantitative excellence assessment task with comparable samples of 15 participants for each
descriptive method and the audiovisual stimuli material (described in P4, experiment 2). The results
showed that the time spent for planning was 0.38 h/participant in total for quantitative and qualitative
interview-based experiences quality factors methods. The descriptive data-collection included only a
free description task with an average duration of 5 min 40s per participant, confirming the
assumptions of the fast data collection procedure for this method4. The average duration of the whole
data collection for both methods was 1.48 h/participant, while the data analysis included in data-
transfer and the analysis for both quantitative and qualitative data resulted in the average duration of
1.67 h/participant. To identify experienced quality factors, only one-dimensional analysis was
conducted, excluding not only all inter-rater reliability estimations as well as the time needed for
reporting and interpreting the results. Finally, the total time spent for the study with experienced
quality factors combined with excellence evaluation is the shortest (3.55h/participant) in the
comparison to the other methods, but it also produces the most inaccurate as non-stimuli-related
description of quality experiences. Although this initial comparison study by Kunze (2009) is based
on a small sample and might provide slightly optimistic time estimations for descriptive analysis due
to the limitation of one-dimensional analysis and a lack of reliability estimations, and has some
inaccuracy in the measurements of time for the different phases of study, these results can be
interpreted as indicative and valuable estimates about the cost-benefit ratio for practitioners.
Further work needs to systematically address the ways to safely simplify the procedure of the
analysis (e.g. by reducing the number of participants) to study the limitations in the broad and
systematical comparison to other existing methods and to utilize the results of descriptive method in
novel ways for predicting quality.
4 As a reference, the duration of the data-collection procedure for quantitative psychoperceptual evaluation has
been on average 1h/participant.

74
In summary, Experienced quality factors – the interview-based descriptive method – is a flexible
method that provides a fast data-collection procedure combined with psychoperceptual excellence
evaluation in different circumstances. The main benefits of the method are an ability to explain the
results of excellence evaluation and build fundamental understanding of phenomenon (e.g.
components of quality), but it may also help to identify design ideas. Accuracy of the results,
acquired using only the free-description task, is limited with regard to a certain individual stimulus.
The method can be applied in the evaluation of novel and heterogeneous stimuli with naïve
participants.
5.2.4 Open Profiling of Quality
Introduction – The aim of the method development was to create a tool for capturing the quality
of experience in depth by using mixed methods to combine quantitative quality excellence evaluation
and qualitative descriptive research into one study. The presentation of the methods is based on (P4).
As a requirement for the method was the applicability for evaluation of heterogeneous stimuli
material with naïve participants and an easy procedure in the analysis (e.g. compared to interview-
based methods). The method was applied in three multimedia quality evaluation experiments to
probe its options and limitations.
Method – The Open Profiling of Quality (OPQ) is a mixed method combining conventional
quantitative psychoperceptual quality evaluation and qualitative descriptive quality evaluation based
on individual‟s own vocabulary (P1). An overview to the method is presented in Figure 16 including
the research problem it solves, the data-collection procedure, the methods of analysis and the
expected type of the results. The method consists of three subsequent parts: 1) psychoperceptual
evaluation, 2) sensory profiling, and 3) external preference mapping. The studies are conducted using
the first two methods and analyzed independently and finally combined to the last method. The total
study is conducted in two or three sessions. In the first part, psychoperceptual evaluation to quantify
the excellence of stimuli is conducted using conventional psychoperceptual methods (e.g. ITU
BT.500-11, 2002) and can be complemented with other measures such as Bidimensional research
method of acceptance (P1). In the second part, a sensory profiling study is conducted to understand
the characteristics of quality perception by identifying the individual quality attributes. This part
contains a four-step procedure for identifying the attributes and rating stimuli using the attributes. As
an outcome, sensory profiling produced the idiosyncratic experienced quality attributes, a perceptual
quality model that separate the characteristics of stimuli, and a correlation plot to combine two
previous ones. As final steps, External Preference Mapping connects psycho-perceptual and sensory
profiling data. This analysis describes, for example, the attributes attached to high or low quality
stimuli.

75
Figure 16 Overview to a mixed method called Open Profiling of Quality (OPQ).
Evaluation and further work – To evaluate the method, a meta-analysis of three studies was
conducted and directions for further work were drawn. The results of three extensive quality
evaluation studies showed that with the use of mixed methods a deeper understanding on experienced
quality can be reached compared to mono-method designs. The use of OPQ was able to provide
convergence and complementation, mainly as the ability to explain quantitative results with
qualitative descriptions. To estimate the cost of the OPQ method, the initial comparison study by
Kunze (2009) can be interpreted as suggestive. The average duration of the OPQ study including its
all phases from planning to analysis was 5.5 h/participant. Time spent for planning (design and
material) was 0.47 h/participant. The participation to the study required two sessions and took 3.25
hours/participant (1.75h/participant for part of the sensory profiling) indicating a relatively
demanding data-collection procedure for this method. The time required for analysis5 was
1.78h/participant for the whole OPQ data while it was 1.15h/ participant for the sensory analysis. In
comparison to the effort of method of interview-based experienced quality factors, the analysis of
sensory profiling data is slightly more expensive (12%). The study by Kunze proposes that in total,
the OPQ study takes 55.8% more time to conduct compared to the combination of psychoperceptual
excellence evaluation with interview-based Experienced quality factors, but it provide rich and
detailed stimuli by stimuli descriptions. To complement this conclusion, I claim that the original
version of OPQ does not take the full benefit of data collected and therefore its benefits might be
slightly underestimated in relation to the demanding data-collection procedure. In our recent studies,
we have demonstrated the other ways of utilizing the OPQ data with different methods of analysis
(P12, Strohmeier et al., 2011).
Suggestions for future work covers four main ideas to improve the method and compare it against
other mixed methods. Further development of OPQ needs to 1) examine the reliability in terms of
outlier detection, comparisons of statistical methods, and improvements to procedure for the
interpretation of sensory profiling and external preference mapping data, 2) examine the possibilities
to explain quality beyond the most dominating quality components, 3) study the accuracy of methods
with stimuli having small differences. 4) Finally and among the most notable, systematical
5 Including data transfer, but excluding reporting (Kunze, 2009)
SENSORY PROFILING
DATA-COLLECTIONProcedure
METHOD OF ANALYSIS RESULTS
Generalized Procrustes
Analysis
Excellence of overall quality
Analysis of Variance
Profiles of overall quality
Relation between excellence
and profiles of overall quality
Preferences of treatments
EXTERNAL PREFERENCE MAPPING
Idiosyncratic experienced
quality factors
Perceptual quality model
Correlation plot – Experienced quality factors and
main components of the
quality model
PREFMAP or
Partial Least Square
Regression
Combined perceptual space –
Preferences and quality model
PSYCHOPERCEPTUAL EVALUATION Training and anchoring
Psychoperceptual
evaluation
Introduction
Attribute elicitation
Attribute refinement
Sensorial evaluation
METHOD
Research problem

76
comparisons (similarly to 5.2.3) between OPQ and existing methods are needed to provide guidelines
for an effective use of these methods for the practitioners. These comparisons need to at least to
examine performance related aspects exhaustively (e.g. accuracy in different quality ranges, validity,
reliability and costs), complexity (e.g. ease of planning, conducting and analyzing and interpreting
results), evaluation factors (e.g. number of stimuli, knowledge of research personnel) (e.g. (McTigue
et al., 1989; Hartson et al., 2003; Yokum & Amstrong, 1995). In the long term, the goal is to support
the idea of safe development of these instruments by understanding their benefits and limitations
when capturing a deeper understanding of experienced multimedia quality.
In summary, Open Profiling of Quality is a mixed method combining conventional quantitative
psychoperceptual quality evaluation and qualitative descriptive quality evaluation based on an
individual‘s own vocabulary. It is applicable in evaluation of novel and heterogeneous stimuli with
naïve participants. The method requires a rigorous multi-step data-collection procedure (as
vocabulary-based methods in general fc. Section 3.3.). The method provides rich but tightly stimuli
connected data that enables use of broad set of techniques of analysis, and can offer complementation
and convergence between the quantitative and qualitative results.
5.2.5 Hybrid method for quality evaluation in the context of use
Introduction – The goal was to develop a research method for the evaluation of quality in the
context of use. The presentation of the methods is based on (P5, P10). Conventional quality
evaluation experiments for mobile services take place in highly controlled laboratory circumstances,
although the final products are expected to be used in heterogeneous mobile contexts of use. This
underlines the problem of ecological validity. Furthermore, there were no existing methods for
evaluating the quality of experience for time-varying multimodal media in the context of use. There
were three main challenges in the development of the method: 1) Making a shift in a paradigm from
experimentation to quasi-experimentation when examining quality in the field setting. This requires
building up understanding about the factors that surround the causal effect and a multimethodological
approach. 2) To construct a macro-level understanding of the circumstances of the experiment.
Although the results of quasi-experiments are local, it is important to know the characteristics of the
experiment to be able to report and make them as comparable as possible between studies. 3) To
identify micro-level factors that surround the causal effect for getting a closer look at the
phenomenon during the experiment.
The method development contained a literature review and three studies. The goal of the review
was to understand the main characteristics of the context of use for mobile human-computer
interaction. The existing literature contained numerous definitions, frameworks, models with varying
emphasis between the user (context of use) and system-centric (context-awareness) approaches.
Based on this review, a descriptive model of context of use for mobile HCI (CoU-HMCI, Figure 17)
summarizing five components, their subcomponents and descriptive properties was constructed (P3).
The model can help both practitioners and academics to identify broadly relevant contextual factors
when designing, experimenting with, and evaluating mobile contexts of use. For method
development, the model was further operationalized to convey the macro level characteristics of the

77
context of use (in planning, data-collection and analysis) of the study. During the three studies,
different techniques and data-collection procedures were tried out, heterogeneous multimodal stimuli
with small and clearly detectable differences were used, and the experiments were conducted in three
different fields and one analogue context and compared to the conventional controlled laboratory
circumstances.
PHYSICAL CONTEXT- Spatial location, functional place and space- Sensed environmental attributes- Movements and mobility- Artefacts
TEMPORAL CONTEXT- Duration- Time of day/ weeks /year- Before – during – after- Actions in relation to time- Synchronism
TASK CONTEXT- Multitasking- Interruptions- Task type
TECHNICAL AND INFORMATION CONTEXT- Other systems and services- Interoperability- Informational artifacts and access- Mixed reality
SOCIAL CONTEXT- Persons present - Interpersonal actions- Culture
CONTEXT OF USE
USER MOBILESYSTEM
LEVEL OF MAGNITUDE (micro – macro)
PATTERN (rhythmic - random)
LEVEL OF DYNAMISM (static – dynamic)
TYPICAL COMBINATIONS
PR
OP
ER
TIE
S
CO
MP
ON
EN
TS
Figure 17 Model of Context of Use for Mobile HCI (CoU-HMCI) summarizing five
components, their subcomponents and descriptive properties (P3).
Method – Hybrid method for quality evaluation in the context of use is composed of 1) the
process, including planning, data collection and analysis, 2) understanding the factors that surround
the assessment in the context on a macro level (high-level features of a whole situation) and a micro
level (situational, e.g. second by second) and 3) the use of several techniques over the study (Figure
18). The detailed presentation of the method provides also instructions for carrying out such
experiences to minimize threats of validity.
Planning – The planning phase focuses on the macro level analysis of context characteristics.
User requirements guide the selection of CoU to the experiment. The most common and diverse
situations are chosen to represent the heterogeneity of circumstances, as only a limited number of
CoU can be selected. In the requirements, the CoU is described on a general level. To understand the
expected characteristic of the chosen contexts in more detail, the CoU-MHCI form is used. It helps to
1) richly identify and report the expected features of the contexts, 2) think about the diversity
between them and 3) consider systematically the potential factors influencing quality requirements.
Finally, potential threats of validity are analyzed.

78
Figure 18 Hybrid method for quality evaluation in the context of use (P5).
Data-collection – Contextual data contains both macro and micro levels during the experiments in
all contexts. The procedure in each of the CoU is identical for capturing the macro level influences.
Prior to the evaluation in the contexts, the moderator instructs the assessor with a possible related
scenario to increase the realism (e.g. travel to the railway station to catch the train) and to transfer the
responsibility to the participant of leading the situation on his/her own during the study. The actual
quality evaluation task is carried out in the context (e.g. using a retrospective Bidimensional research
method of acceptance, P1). During evaluation, the moderator shadows the assessor and observes the
situation with the aid of a semi-structured observation form based on CoU-MHCI and fills it in at the
end of the context. After the evaluation, the demand of the evaluation task in the CoU is examined
using the NASA-TLX questionnaire (Hart & Staveland, 1998). Finally, experiences and impressions
of the context are briefly gathered using a semi-structured interview during the transition to the next
situation. These transitions offer natural situations for short interviews. In the post-experimental
session, a broader interview targeting on experiences about the contexts and quality are conducted.
The importance of the interview is in an constructing understanding of the participant‘s own
experiences, interpreted quality and user requirements in these settings. The micro-level data-
collection procedure can be conducted using a light weight mobile usability lab containing several
miniature video cameras (one for face, one for the UI and one for the participant‘s field of view) and
audio recording is used to capture the situational data over the whole experiment.
Analysis – All the collected data is firstly analyzed separately and finally integrated. The actual
characteristics of contexts of use are updates to the planned CoU-MHCI form based on the central
values of observation forms. Other parts of analysis target on the focus of the study—contextual
PRE-TEST
CONTEXT 1
P r o c e d u r eDATA-COLLECTION
Quality evaluation task
Workload (NASA-TLX questionnaire)
CONTEXT 2
CONTEXT N
POST-TESTExperiences of CoU (Interview)
Experiences of quality (Interview)
Characteristics of CoU (Semi-structured observation, moderator)
PLANNING
ANALYSIS
MACRO LEVEL CONTEXT OF USE
User requirements
Characteristics of CoU (form)
Realized characteristics of CoU
Experiences of CoU
Experiences of quality(Data-driven analysis)
Quality evaluation (statistical analysis)
Analysis of threats of validity
Workload (statistical analysis)
Experiences of CoU (Interview)
Situational data:(Data-driven analysis)
Integration of results
MICRO LEVEL CONTEXT OF USE
Situational data-collection (Audio/video capture)
79
influences on experienced quality. 1) The influence of the CoU on quality requirements and
workload is analyzed statistically. 2) The analysis of an interview data about the experience of
contexts, quality and situational audio-video recordings is based on the data-driven frameworks,
which are applicable to the not well understood research phenomenon. From the latter, it can extract
objective data such as attention gaze information. Finally, all results underlining different aspects
(subjective and objective, quantitative and qualitative) about the contextual quality are combined.
Summarizing tables enable effective compression of hybrid data.
Evaluation and further work – The hybrid method was descriptively evaluated based on the
phases of the study and the appropriateness of the outcome of different techniques used as a part of
the method. At the current stage, the validation to the actual use is not conducted, as there were no
existing systems available at the time of conducting the studies and the systematical between-method
comparisons was not conducted, as there was no directly competing method available.
Hybrid method for quality evaluation in the context of use characterizes contextual quality
requirements and extends the evaluation towards the use, but is relatively demanding to design and
carry out. The benefits of hybrid method for quality evaluation in the context of use is 1) the
improved ecological validity compared to the laboratory evaluations, 2) revealed design ideas for
quality (e.g. context dependent quality optimization), 3) and also broadened the viewpoint from
system to usage (by proposing the design ideas, usability issues, fundamental aspects on contextual
use) as also suggested by e.g. Jambon 2009). However, the method requires the use of multiple
techniques to understand the factors that surround the causal effect in the different phases of study to
be able to explain the quantitative quality evaluation results, and therefore it requires a higher amount
of effort to carry out compared to laboratory evaluations. In general, the experiments in the field
require more effort (time, tools, assisting personnel, analysis) than laboratory experiments
(Kaikkonen et al, 2008). As there are no accurate cost measurements available, I introduce some of
the factors that increase the costs of these studies compared to laboratory experiments, but the list is
not meant be exhaustive. In the planning phase, the researcher needs to identify the requirements and
familiarize herself with the circumstances which require visits to the locations of study and make
detailed back-up plans (e.g. for alternative bus schedules). During the data-collection phase, the
experiment requires extra time allocation for transitions between the contexts and for unexpected
events6, and for the moderator to travel between the end and starting locations of the different
experiments7. As an example, the addition of time due to the transitions between the contexts to the
total duration of the experiment can be 12.5-25%, and including the moderator‘s effort it can be 29-
50%, if the duration of the experiments is counted as a constant of 2 hours. Finally, it is obvious that
the effort in the data-analysis increases as well. To give practitioners a touch to some of the aspects
of increased effort in the data-analysis beyond the quantitative excellence evaluations, I underline the
characteristics of interview and situational data sets. The total duration of all the interviews in the
study with three contexts (P4, experiment 3) was 12.9 minutes/participant, resulting in more than a
double amount of data (2.3) compared to the average interview duration in the controlled study by
6 E.g. 15-30 min/study in the log files of P4, experiment 3 with three contexts
7 E.g. 20-30 min/study in the log files of P4, experiment 3 with three contexts

80
Kunze (2009). The coding of the situational data in an accuracy of one second took 6-8 times of the
duration of the recoded data including video from three contexts8. Furthermore, integrating and
interpreting hybrid data requires time to take the benefit of the collected data. To cope between this
cost-benefit ratio, P4 concludes:”In the current stage, we recommend complementing the laboratory
evaluations with tests in the CoU in a sequential workflow. A large set of stimuli is first tested in the
controlled settings and a subset with detectable differences is further evaluated in the field”.
Further work needs to address the nature of the evaluation task in more detail to maximize the
viewability, develop even more invisible situational data-collection tools to improve social
acceptance, use sensors to characterize the viewing situation during the experiment and develop easy-
to-use tools for a multimethodological data-analysis. In addition, the applicability of the framework
to other application fields (quality in other types of applications, usability and user experience
evaluation) need to be addressed in future work.
In summary, Hybrid method for quality evaluation in the context of use is a quasi-experimental
method, which enables drawing conclusions about causal effects in the natural circumstances. It
requires identification of potential threats of validity and multimethodological approach to
characterize the surrounding context of the experiment. The main benefits of the method are the
ability to characterize the contextual quality requirements and extend the quality evaluation towards
the use, and improved ecological validity. As the quasi-experiments in general are relatively
demanding to design and carry out (cf. Table 3), it is currently proposed to conduct these experiments
to complement the laboratory experiments in a sequential workflow with a limited set of stimuli.
5.2.6 Summary
This section presented the development of evaluation methods for User-Centered Quality of
Experience in five parts. 1) A holistic framework for the evaluation of User-Centered Quality of
Experience aimed at building the overview to the factors and techniques that contribute to user-
centered quality evaluation. It underlined the selection of users, system parameters and contents,
context of evaluation as well as a multimethodological evaluation approach to connect quality
evaluation to expected use. 2) Bidimensional research method of acceptance was developed to
identify a minimum useful quality level for a certain application as a part of quantitative quality
evaluation. 3) Experienced quality factor is an interview-based method with a light-weight data-
collection procedure to understand the descriptive quality attributes for complex and heterogeneous
stimuli under study. It can be used to complement quantitative quality evaluation or evaluation in the
context of use to build broad, but not very detailed overview to the characteristics of phenomenon. 4)
Open Profiling of Quality is an advanced mixed method that combines quantitative quality evaluation
and qualitative descriptive quality evaluation based on an individual‘s own vocabulary in a multistep
data-collection procedure. It provides tools to answer the following research questions: What is the
8 Lab: 1 time, Station: 2-3times, Bus: 3-4 times duration of video. The duration of video:
20min/context. Number of coded classes: 10 classes including 2-7 subclassess each (Utriainen,
2010); As detailed coding is not necessary for all studies

81
preference order of produced qualities? What are the perceptual attributes of these qualities? What
kind of perceptual attributes are associated with different preferences of qualities? 5) Hybrid method
of quality evaluation in the context of use was developed to tackle the challenges of evaluating
quality in the expected circumstances for use (e.g. mobile television viewing while travelling by bus).
The method contains a) a procedure for planning, data-collection and analysis, b) an identification of
the characteristics of a situation surrounding quality evaluation on the macro and micro levels and c)
the use of several techniques in the study. The methods presented vary in the levels of details and
they are partly related.

82
6. Discussion and conclusions
The goal of this thesis has been to examine user-centered multimodal quality of experience for video
on mobile devices from two perspectives – the experiential components and the evaluation methods.
This thesis is composed of the results of 11 extensive quality evaluation experiments and a literature
review. The results were published in 12 main publicationa and 16 supplementary publications in the
themes of this thesis. The literature reviews defined the framework for the problem of the thesis and
clarified the concept of the context of use for mobile human-computer interaction. The experiments
were conducted with more than 500 participants altogether in the potential age groups for (three-
dimensional) mobile television consumption. The experiments were carried out with a relatively low
quality level when varying produced quality factors on the level of content, media and transmission.
They were conducted in controlled laboratory and field circumstances using hybrid data collection
methods containing quantitative quality excellence evaluation, qualitative quality descriptions and
advanced techniques for situational data capture.
The first research question of this thesis was:
What are the components of user-centered multimodal quality of experience
for video on mobile devices?
Based on the literature review and the studies conducted for this thesis, User-Centered Quality of
Experience is constructed in an active perceptual process where the user‘s characteristics, the system
characteristics at different abstraction levels as well as context of use are contributing. 1) The user‘s
influence on the quality of experience was characterized by several demographic and psychographic
variables underlining the influence of active perception in sensorial, emotional, attitudinal and
cognitive levels. The results of the system characteristics varied on the media and transmission levels
and showed that 2) experienced quality is contributed to by both audio and video quality, the level of
quality influence on their relative importance and content-dependency, and the nature of impairments
has an unequal influence in it. This result is supported by a recent study (Peregudov et al., 2010),
underlining that multimodal quality perception is a more multilayered phenomenon than the existing
models of multimodal quality (Hollier et al., 1997) and perception (Welch & Warren, 1980) have
proposed. Future work to cover an end-to-end system chain for multimodal quality small screens is
needed (comparably to work on high quality systems by Garcia & Raake, 2009). 3) Experienced
quality is unequally influenced by impairment types. Temporally dominating accountable and
detectable cut offs in audio and/or video have a strongly interruptive nature towards the user‘s
viewing task. 4) Experienced quality between monoscopic and stereoscopic video reflects a hierarcial
structure. Experienced quality of 3D video on a small screen can improve the viewing experience if
the level of visible impairments is low and appropriate display technology is used; otherwise, a
monoscopic presentation mode can provide better experience. The ease of viewing (ability to

83
maintain optimal viewing conditions and focus on content) is a central requirement for 3D video and,
visual discomfort can be part of the experienced quality of stereoscopic video. Compared to the
existing models of 3D viewing experience (Seuntiens, 2006), these results propose that effort is part
of stereoscopic viewing on small mobile devices. 5) The common descriptive characteristics
composed over nine studies for multimodal 2D and 3D video showed that experienced quality is
constructed not only of the perceived characteristics of video divided into visual, audio, audiovisual
and content characteristics, but also of the viewing experience and usage describing valence in the
viewing task, visual discomfort and the user‘s relation to the system. These confirm that quality
perception is an active process which goes beyond apparent features of produced quality and is
tightly related to action-related properties (Gibson, 1979). Further work needs to address the
possibilities of bringing these descriptions to the level of ―an aroma-wheel (e.g. Noble et al., 1984) of
multimodal quality‖ to characterize the permanent core structure of attributes of experienced quality
and to utilize it in design and evaluation. 6) Quality evaluations conducted in laboratory and field
circumstances showed interaction between the level of quality and context characteristics, as also
supported by Knoche & Sasse (2009). Tendencies between the circumstances were similar, but they
were more approving and less detecting in a natural noisy surroundings with actively interleaved
attention between the surroundings and the mobile HCI task (Oulasvirta et al., 2005). This result
indicates that laboratory evaluations cannot fully predict the needed quality in the field
circumstances, but that field evaluations also reveal other usage related aspects.
Based on these broad empirical results, the model of User-Centered Quality of Experience was
composed. The main distinction to the existing system-centric approaches is that it broadens the view
towards the user. The concepts of quality of experience and quality of service have been challenged
several times in the past and in recent research with the ideas of usability and user experience at the
level of models or their direct combinations have been proposed as such (Bouch et al., 2001; Sasse &
Knoche, 2006; De Moor et al., 2010; Möller et al., 2009; Geerts et al., 2010; S1 ). In the end, only
little has been done to show the evidence, to validate or to use of these models in the long term. The
goal of this thesis was to go beyond this assumption and construct a model based on the empirical
research and literature, and provide practical tools for measuring it. To continue on this track, further
research 1) needs to clarify the influence of the user‘s characteristics on quality domain more
specifically and over several studies, 2) examine the joint influence of the independent components
by aiming at maximizing the several independent components (users, system, context of use) in
comparison to the conventional quality evaluation approach. In this way, 3) the utility of the
approach presented can be estimated compared to an existing one, and 4) the relation between the
experience of system components and a holistic user experience can be addressed. Further work also
needs to consider novel ways of 5) modeling the quality of experience utilizing the components
presented and a descriptive quality model, as well as 6) designing scalable solutions utilizing the
level of quality and multimodality, visual presentation modes and context characteristics. Finally,
long-term consequences of quality of experience are worth sketching; in some scenarios, consumer
complaints may represent one aspect of these (Keijzers et al., 2009).

84
The second research question was:
How to evaluate user-centered multimodal quality of experience for video on mobile devices?
To answer this, the thesis has a five-fold methodological contribution. 1) A holistic framework
for the evaluation of User-Centered Quality of Experience was developed to build an overview of the
factors and techniques that contribute to user-centered quality evaluation. The framework underlined
the selection of users, system parameters and contents, the context of evaluation as well as a
multimethodological evaluation to connect quality evaluation to the expected use. 2) Bidimensional
research method of acceptance was developed for the identification of a minimum quality level that
is useful for certain application as part of quantitative quality evaluation. Two methods focused on
the problem of identifying the quality attributes or the rationale for the evaluation of complex and
heterogeneous stimuli. 3) Experienced quality factor is an interview-based method with a light-
weight data collection procedure to understand the characteristics of the phenomenon under study. It
can be used to complement quantitative quality evaluation or evaluation in the context of use. 4)
Open Profiling of Quality is an advanced mixed method which combines quantitative quality
evaluation and qualitative descriptive quality evaluation based on an individual‘s own vocabulary in
a multistep data collection procedure. This method gives answers to questions such as: What is the
preference order of produced qualities? What are the perceptual attributes of these qualities? What
kind of perceptual attributes are associated with the different preferences of qualities? 5) Finally,
Hybrid method of quality evaluation in the context of use is a tool for quality evaluation experiments
conducted in natural circumstances (e.g. mobile television viewing while travelling by bus). The
method contains a) a procedure for planning, data-collection and analysis, b) an identification of the
characteristics of the situation surrounding quality evaluation on the macro and micro levels, c) the
use of several techniques during the study. The methods presented vary by their level of details and
they are partly related. Two latest of these methods have contributed to the to the standardization
activities in this field (Jumisko-Pyykkö & Utriainen, 2011; Strohmeier & Jumisko-Pyykkö, 2011).
The framework and methods presented extend the existing system-centric quality evaluation
paradigm significantly towards user-centeredness. The current mainstream system-centric paradigm
has underlines that the quality of experience is an outcome of the perception of the produced quality
of a system, the users‘ characteristics are limited to professionalism in relation to system quality, and
experience is quantifiable in highly controlled and repeatable experimental conditions. The main
difference to user-centered quality of experience is the aim of increasing the realism by improving
external validity by the contributing factors of experience, including users, system and contents and
the context of use, and using a multimethodological approach to understand the experienced quality.
As a cost of increasing the realism, the proposed approach can result in more expensive studies (i.e.
more complex designs, increased time for planning and analyzing) and underline the locality of the
results over a high-level of control (e.g. test materials, circumstances) compared to the existing
approach. There are three central suggestions for further work. Firstly, extensive between-method
comparisons are needed for qualitative and mixed methods to increase the awareness of their

85
benefits, the applicability and limitations of these instruments to guide practitioners to use them, and
finally to support safe long-term development of these methods. In this thesis, the benefits of the
parallel use of quantitative and qualitative methods were demonstrated (e.g. characterizing the
phenomenon under study, providing explanations, unexpected aspects, guiding further work) and it
would not have been possible to reach this level of understanding using only quantitative tools. When
looking at the current landscape of qualitative and mixed methods, future work needs to address the
systematical comparisons between the combination of quantitative and qualitative interview-based
(Radun et al., 2008, P8) and vocabulary-based (P4, operationalization of P12) methods to guide
practitioners concerning the effective use of these tools. Instead of focusing on one part of a method
at a time, comparisons need to be extensive in nature with respect to utility, performance, and
complexity from planning to the interpretation of results (e.g. McTigue et al., 1989; Hartson et al.,
2003; Yokum & Amstrong, 1995). Secondly, future work needs to create a collection of well
validated tools to quantify the user‘s relation to content, multimodal quality and a system or service.
In the long term, the use of these tools can help to understand the most influential individual
differences and build up user profiles over the studies. Thirdly, to build up a more complete picture
of the experiential aspects of quality of experience, further work needs to examine the relation
between subjective and objective (psycho-physiological) quality evaluation methods. This work was
limited to explicitly expressible dimensions of subjective quality. Ultimately, we can connect the
cognitive (e.g. visual attention) and emotional influence (arousal, fatigue) of novel qualities on users,
and combine these to their subjective counterparts.
To put the themes of this thesis in a larger perspective, there are three essential questions for
further work. 1) How to integrate or define the role of quality evaluation studies as a part of user-
centered design processes? The user-centered design process contains the user‘s active involvement
from planning and development to design with short term iterative cycles to develop and verify the
system (ISO 13407, 1999). In one of the early development phase techniques, usability tests to
examine the instrumental qualities of system are conducted with relative small sample sizes. In
contrast, quality evaluation studies and more general studies focusing on the perception of non-
instrumental qualities (e.g. Mahlke, 2008) of certain product components, require relatively large
sample sizes, are expensive to carry out and are very time-consuming. Instead of underlining the
juxtaposition of the nature of these different studies, it would be valuable to identify processes and
techniques to successfully interleave them to maximally benefit from each other in a design process
that aims to achieve better user experiences in the long term. 2) What should we study – quality or
the viewing experience? Quality has been the target of evaluation in sensorial studies, while there are
also studies in which quality has been addressed from the perspective of viewing experience as a
directly action related property (Apteker et al., 1995; Ghinea & Thomas, 1998; McCarthy et al.,
2004). The qualitative results of this thesis underline that they are both represented. Instead of
making heuristic-based decisions between these two, we need to understand the nature of the
phenomenon and systematically study the benefits and limitations when choosing one over another in
evaluation. 3) How do these results generalize beyond multimodal video quality for mobile
television? Although the studies were conducted for mobile television under the broadcasting

86
scenario, which has not been taken up as successfully as expected (Shim et al., 2008; Taga et al.,
2009), the results of this work are not limited to this service. The characteristics of popular digital
video services streamed over wireless networks, and video on demand, or even mobile gaming on
2D/3D mobile devices can have similar type of characteristics in the different parts of the system
(e.g. display, coding) as studied in this thesis. The model of User-Centered Quality of Experience can
be adapted to other multimodal application scenarios. The descriptive attributes are expected to
resemble similar characteristics in other low quality digital video use-cases, and the methods can be
adapted to go beyond this application. Finally, the model of Context of Use for Mobile Human-
Computer Interaction (CoU-MHCI) is more generally targeted to help both practitioners and
academics to identify broadly relevant contextual factors when designing, experimenting with, and
evaluating, mobile contexts of use.
Limitations - The main limitations of these results and the method developed concern
experimental research methods, system readiness and over-time validation. The results of this thesis
are concluded from short-term experimental and quasi-experimental research. The former limits the
generalizability to natural circumstances and to longer-term viewing conditions while the latter
cannot fully take control over the causal effects (Shadish et al., 2002). The system readiness,
including the use of early-phase prototypes, the availability of test contents, and use of simulations
limited the planning of the experiments and further the external validity of the results. Furthermore,
over-time validation to quality requirements in actual use is limited. As there were no existing
systems available on the mass-markets at the time of conducting the studies, the validation to a
required long-term quality level for use is hard to do and these methods can only probe the quality
level needed.
Conclusions
To conclude, the quality of experience is a more complex phenomenon than quantifiable equation
between impaired and impairment free presentations. To understand and measure it for future
ubiquitous systems and services, a boarder perspective, a multimethodological research approach and
connections between quality and the expected use are necessary. The descriptive model of User-
Centered Quality of Experience (UC-QoE) and the evaluation methods developed summarize the
outcome of the work. UC-QoE is constructed from four main components called the user‘s
characteristics, the system characteristics, the context of use and experiential dimensions. The
methodological contribution of this thesis contains a methodological framework with four more
detailed methods for assessing a quantitatively domain specific acceptance threshold, a hybrid
method for quality evaluation in the context of use, an interview-based method for qualitative
descriptive quality evaluation, and an advanced mixed method, called Open Profiling of Quality for
vocabulary-based quality evaluation.

87
References
Actius. (2005). AL-3DU Laptop, Product brochure, Sharp. Available:
www.sharpsystems.com/products/ pc_notebooks/actius/al/3du/
Aldridge, R., Davidoff, J., Ghanbari, M., Hands, D., & Pearson, D. (1995). Regency effect in the
subjective assessment of digitally-coded television pictures. Proceedings of the 5th International
Conference on Image Processing and Its Applications: ICIP ‟95, 336–339.
Aldridge, R. P., Hands, D. S., Pearson, D. E., & Lodge, N. K. (1998). Continuous quality assessment
of digitally-coded television pictures. IEEE Proceedings Vision, Image Signal Process, 145(2),
116–123.
Amberg, M., Hirschmeier, M., & Wehrmann, J. (2004). The compass acceptance model for the
analysis and evaluation of mobile services. International Journal of Mobile Communications,
2(3), 248–259.
ANSI T1.801.02 (1996). Digital transport of video teleconferencing/videoTelephony signals—
performance terms, definitions, and examples. ANSI, New York
Apteker, R. T., Fisher, J. A., Kisimov, V. S., & Neishlos, H. (1995). Video acceptability and frame
rate. IEEE Multimed 3(3):32–40.
Ares, G., Gimenez, A., & Gambaro, A. (2008). Understanding consumers' perception of conventional
and functional yogurts using word association and hard laddering. Food Quality and Preference,
19(7), 636–643. ISSN 0950-3293.
Arnold, M. B. (1960). Emotion and personality, Vol 1: Psychological aspects. New York: Colombia
University Press.
Barnard, L., Yi, J. S., Jacko, J. A., & Sears, A. (2007). Capturing the effects of context on human
performance in mobile computing systems. Pers Ubiquit Comput, 11, 81–96.
Barten, P. G. J. (1999). Contrast Sensitivity of the Human Eye and Its Effects on Image Quality.
Washington: SPIE Press.
Bech, S., & Zacharov, N. (2006). Perceptual Audio Evaluation – Theory, Method and Application.
John Wiley & Sons Inc.
Bech, S., Hamberg, R., Nijenhuis, M., Teunissen, C., de Jong, H., Houben, P., & Pramanik, S.
(1996). The RaPID perceptual image description method (RaPID). Proceedings SPIE, 2657,
317–328.
Beerends, J. G., & de Caluwe, F. E. (1999). The influence of video quality on perceived audio quality
and vice versa. Journal of the Audio Engineering Society, 47(5), 355–362.
Belk, R. W. (1975). Situational variables and consumer behavior. J. Consumer Res., 2, 157–164.
Bey, C. & McAdams, S. M. (2002). Schema-based processing in auditory scene analysis. Perception
& Psychophysics, 64(5), 844–854.
Boev, A., & Gotchev, A. (2011) Comparative analysis of mobile 3D dispays, Proceedings of SPIE
Electronic Imaging, 2011, Multimedia on Mobile Devices. , San Francisco, CA, USA, January
2011
Boev, A., Hollosi, D., Gotchev, A., & Egiazarian, K. (2009). Classification and simulation of
stereoscopic artefacts in mobile 3DTV content. Electronic Imaging Symposium 2009,
Stereoscopic Displays and Applications.
Bouch, A. & Sasse, M. A. (2001). Why value is everything: A user-centred approach to internet
Quality of Service and pricing. In L. Wolf, D. Hutchison, & R. Steinmetz (Eds.), Quality of
Service – Proceedings of IWQoS 2001, Lecture Notes in Computer Science 2092 (pp. 49–72).
Springer.
Bouch, A., & Sasse, M. A. (2000). The case for predictable media quality in networked multimedia
applications. In K. Nahrstedt, & W. Feng (Eds.), Proceedings of SPIE Multimedia Computing
and Networking: MMCN'00, 3969, 188–195.
Bouch, A., Wilson, G., & Sasse, M. A. (2001). A 3-dimensional approach to assessing end-user
quality of service. Proceedings of the London Communications Symposium, 47–50.
Bradley, N. A., & Dunlop, M. D. (2005). Toward a multidisciplinary model of context to support
context-aware computing. Hum.–Comput. Interact., 20(4), 403–446.
doi:10.1207/s15327051hci2004_2
Brandenburg, K. (1999). MP3 and AAC explained. AES 17th International Conference on High
Quality Audio Coding.

88
Brewster, S. (2002). Overcoming the lack of screen space on mobile computers. Pers Ubiquit
Comput, 6, 188–205.
Brookings, J. B., Wilson, G. F., & Swain, C. R. (1996). Psychophysiological responses to changes in
workload during simulated air traffic control. Biological Psychology, 42, 361–377.
Brotherton, M. D., Huynh-Thu, Q., Hands, D. S., & Brunnström, K. (2006). Subjective Multimedia
Quality Assessment. IEICE Trans. Fundam. Electron. Commun. Comput. Sci. E89-A, 11 (Nov.
2006), 2920- 2932.
Bruneau, D., Sasse, M. A., & McCarthy, J. D. (2002). The eyes never lie: The use of eye tracking
data in HCI research. Proceedings of the CHI‟02 Workshop on Physiological Computing.
Bruner, G., & Kumar, A. (2005). Explaining consumer acceptance of handheld internet devices.
Journal of Business Research, 58, 553–558.
Buchinger, S., Kriglstein, S., & Hlavacs, H. (2009). A comprehensive view on user studies: survey
and open issues for mobile TV. Proceedings of the Seventh European Conference on European
Interactive Television Conference: EuroITV '09, 179–188. doi:10.1145/1542084.1542121
Buswell, G. (1935). How People Look at Pictures: A Study of the Psychology of Perception In Art.
Chicago, Illinois: The University of Chicago Press.
Carlsson, C., & Walden, P. (2007). Mobile TV – To live or die by content. Proceedings 40th HICSS
2007, 51b.
Chen, S. Y., Ghinea, G., & Macredie, R. D. (2006). A cognitive approach to user perception of
multimedia quality: An empirical investigation. International Journal of Human–Computer
Studies, 64(12), 1200–1213.
Chen, J. Y. C., & Thropp, J.E. (2007). Review of Low Frame Rate Effects on Human Performance.
Systems, Man and Cybernetics, Part A: Systems and Humans, IEEE Transactions on , vol.37,
no.6, pp.1063-1076 doi: 10.1109/TSMCA.2007.904779
Chen, T., Yesilada, Y., & Harper, S. (2008). RIAM D2.6: How do people use their mobile phones
while they are walking? A field study of real-world small device usage (EPSRC-EP/E002218/1).
Research Report School of Computer Science, University of Manchester. http://hcw-
eprints.cs.man.ac.uk/98/1/RIAM_D2_6_Field_Study.pdf
Childers, T. L., Houston, M. J., & Heckler, S. E. (1985). Measurement of individual differences in
visual versus verbal information processing. Journal of Consumer Research, 12, 125–134.
Clark-Carter, D. (2002). Quantitative Psychological research. New York Psychology: Press.
Coen, M. (2001). Multimodal integration – A biological view. Proceedings of IJCAI'01.
Consolvo, S., Harrison, B., Smith, I., Chen, M., Everitt, K., Froehlich, J., & Landay, J. A. (2007).
Conducting in situ evaluations for and with ubiquitous computing technologies. International
Journal of Human–Computer Interaction, 22(1), 107–122.
Cook, T., & Campbell, D. (1979). Quasi-Experimentation: Design & Analysis Issues for Field
Settings. New York: Houghton Mifflin.
Coolican, H. (2004). Research Methods and Statistics in Psychology (4th ed.). London: Arrowsmith.
Creswell, J. W., & Plano Clark, V. L. (2006). Designing and Conducting Mixed Methods Research.
Thousand Oaks, CA: Sage.
Cui, L. C. (2003). Do experts and naive observers judge printing quality differently? Proceedings of
SPIE, Image Quality and System Performance, 5294, 132–145.
Cui, Y., Chipchase, J., & Jung, Y. (2006). Personal television: A qualitative study of mobile TV
users. Lecture Notes in Computer Science, 4471, 195–204.
Curran, T., Gobson, L., Home, J. H., Young, B., & Boxell, A. P. (2009). Expert image analysts show
enhanced visual processing in change detection. Psychon Bull Rev, 16, 390–397.
doi:10.3758/PBR.16.2.390
Damodaran, L. (1996). User involvement in the systems design process – A practical guide for users.
Behaviour & Information Technology, 15, 363–377.
Davis, F. D. (1989). Perceived usefulness, perceived ease of use, and user‘s acceptance of
information technology. MIS Quarterly, 13(3), 319–341.
de Ridder, H. (1996). Current issues and new techniques in visual quality assessment. Proceedings
IEEE Intl. Conf. on Image Process
de Moor, K., Joseph, W., Ketykó, I., Tanghe, E., Deryckere, T., Martens, L., & de Marez, L. (2010).
Linking users' subjective QoE evaluation to signal strength in an IEEE 802.11b/g wireless LAN
environment. EURASIP Journal on Wireless Communications and Networking, 2010(541568).
doi:10.1155/2010/541568.
Deffner, G., Yuasa, M., McKeon, M., & Arndt, D. (1994). P-11: Evaluation of display-image quality:
experts vs. non-experts. SID Digest, 475–478.

89
Denzin, N. K. (1978). The Research Act: An Introduction to Sociological Methods. New York:
McGraw-Hill.
Desmet, P. M. A. (2002). Designing emotions. Doctoral dissertation, Delft University of Technology,
Delft, The Netherlands.
Ekman, P., & Davidson, R. J. (1994). The Nature of Emotion, Fundamental questions. Oxford:
Oxford University Press.
Engeldrum, P. (2000). Psychometric Scaling: A Toolkit for Imaging Systems Development.
Winchester, Mass: Imcotek Press.
Engeldrum, P. G. (2004). A theory of image quality. Jour. of Imag. Sci. & Tech., 48(5), 65–69.
ESAMVIQ, European Broadcast Union (EBU). (2003). SAMVIQ – Subjective assessment
methodology for video quality. Technical Report, BPN 056.
Evans, F. F. (1992). Auditory processing of complex sounds: An overview. Philosophical
Transactions of the Royal Society of London, Series B, Biological Sciences, 336(1278), 295–306.
Faye, P., Brémaud, D., Daubin, M. D., Courcoux, P., Giboreau, A., & Nicod, H. (2004). Perceptive
free sorting and verbalization tasks with naïve subjects: An alternative to descriptive mappings.
Food Quality and Preference, 15(7–8), 781–791.
Finnpanel, http://www.finnpanel.fi/tulokset/tv.php, retrieved 26.11.2010.
Fiske, S T., & Taylor, S. E. (1991). Social Cognition. Singapore: McGrow-Hill Book Co.
Flack, J., Harrold, J., & Woodgate, G. J. (2007). A prototype 3D mobile phone equipped with a next
generation autostereoscopic display. Proceedings SPIE 6490(64900M). doi:10.1117/12.706709
Fredrickson, B. L. (2000). Extracting meaning from past affective experiences: The importance of
peaks, ends and specific emotions. Cognition and Emotion, 14(4), 577–606.
Fredrickson, B. L., & Kahneman, D. (1993). Duration neglect in retrospective evaluation of affective
episodes. J Pers Soc Psychol. 1003 Jul, 65 (1), 45–55.
Garcia, M. N., & Raake, A. (2009). Impairment-factor-based audio-visual quality model for IPTV.
International Workshop on Quality of Multimedia Experience: QoMEX 2009, 1–6.
doi:10.1109/QOMEX.2009.5246985
Gardner, M. (1985). Mood states and consumer behaviour: A critical review. Journal of Consumer
Research, 12, 281–300.
Geerts, D., De Moor, K., Ketyk , I., Jacobs, A., Van den Bergh, J., Joseph, W., Martens, L., & De
Marez, L. (2010). Linking an integrated framework with appropriate methods for measuring
QoE. Second International Workshop on Quality of Multimedia Experience: QoMEX 2010, 158–
163. doi:10.1109/QOMEX.2010.5516292
Ghinea, G., & Chen, S. Y. (2006). Perceived quality of multimedia educational content: A cognitive
style approach. Multimedia Systems, 11(3), 271–279.
Ghinea, G., & Chen, S. Y. (2008). Measuring quality of perception in distributed multimedia:
Verbalizers vs. imagers. Computers in Human Behavior, 24(4), 1317–1329.
Ghinea, G., & Thomas, J. P. (1998). QoS impact on user perception and understanding of multimedia
video clips. Proceedings of the 6th ACM International Conference on Multimedia:
MULTIMEDIA ‟98, 49–54.
Gibson, J. J. (1979). The Ecological Approach to Visual Perception. Boston: Houghton Mifflin,
Lawrence Eribaum.
Gochev, A., Smolic, A., Jumisko-Pyykkö, S., Strohmeier, D., Akar, G. B., Merkle, P., & Daskalov,
N. (2009). Mobile 3D television: Development of core technological elements and user-centered
evaluation methods toward an optimized system. In R. Creutzburg, & D. Akopian (Eds.),
Multimedia on Mobile Devices 2009, 7256. doi:10.1117/12.816728
Goldhammer, K. (Ed.) (2006). Mobile TV 2010 – Marktpotenziale für Mobile TV über T-DMB und
DVB-H in Deutschland. Goldmedia Study, Berlin, Germany.
Golstein, E. B. (2002). Sensation and Perception, States of America: Wadsworth.
Greenacre, M. G. (1984). Theory and Application of Correspondence Analysis. Academic Press.
Gregg, L. W., & Brogden, W. J. (1952). The effect of simultaneous visual stimulation on absolute
auditory sensitivity. Journal of Experimental Psychology, 43, 179–186.
Grill-Spector, K., & Malach, R. (2004). The human visual cortex. Annual Review of Neuroscience,
27, 649–677.
Gulliver, S. R., & Ghinea, G. (2004a). Changing frame rate, changing satisfaction?. Proceedings
IEEE Multimedia Expo 2004, 177–180.
Gulliver, S. R., & Ghinea, G. (2004b). Region of interest displays: Addressing a perceptual
problem?. Proceedings IEEE 6th Int. Symp. Multimedia Softw. Eng., 2–9.

90
Gulliver, S. R., & Ghinea, G. (2006). Defining user perception of distributed multimedia quality.
ACM Transactions on Multimedia Computing, Communications and Applications, 2(4), 241–
257.
Gulliver, S. R., Serif, T., & Ghinea, G. (2004a). Pervasive and standalone computing: The perceptual
effects of variable multimedia quality. International Journal of Human Computer Studies, 60(5-
6), 640–665.
Gulliver, S. R., Serif, T., & Ghinea, G. (2004b). Stars in their eyes: What eye-tracking reveals about
multimedia perceptual quality. IEEE Transactions on Systems, Man and Cybernetics, Part A,
Systems and Humans, 34(4), 472–842.
Hands, D. S. (2004). A basic multimedia quality model. IEEE Transactions on Multimedia, 6(6),
806–816.
Hands, D. S., & Avons, S. E. (2001). Recency and duration neglect in subjective assessment of
television picture quality. Applied Cognitive Psychology, 15(6), 639–657.
Hands, D. & Wilkins, M. (1999). A study of the impact of network loss and burst size on video
streaming quality and acceptability. Interactive Distributed Multimedia Systems and
Telecommunication Services Workshop.
Hands, D. S., Brotherton, M. D., Bourret, A., & Bayart, D. (2005). Subjective quality assessment for
objective quality model development. Electronics Letters, 41(7), 408–409.
Hart, S. G., & Staveland, L.E. (1988). Development of NASA-TLX (Task Load Index): Results of
empirical and theoretical research. In P.A. Hancock, & N. Meshkati (Eds), Human mental
workload (pp. 139–183). North-Holland, Amsterdam.
Hartson, H. R., Andre, T. S., & Willigers, R. C. (2003). Criteria for evaluating usability evaluation
methods. International Journal of Human–Computer Interaction, 15(1), 145–181.
Haslam, S. A., & McGarty, C. (2003). Research Methods and Statistics in Psychology: Sage
Foundations of Psychology Series. London: Sage.
Hassenzahl, M. (2004). The interplay of beauty, goodness, and usability in interactive products.
Human–Computer Interaction, 19, 319–349.
Hassenzahl, M., & Tractinsky, N. (2006). User experience – A research agenda. Behaviour and
Information Technology, 25(2), 91–97.
Heller, R. S., Martin, C. D., Haneef, N., & Gievska-Krliu, S. (2001). Using a theoretical multimedia
taxonomy framework. ACM Journal of Educational Resources in Computing, 1(1), 1–22.
Hewett, T., Baecker, R., Card, S., Carey, T., Gasen, J., Mantei, M., Perlman, G., Strong, G., &
Verplank, W. (1996). ACM SIGCHI Curricula for Human-Computer Interaction.
http://old.sigchi.org/cdg/cdg2.html, retrieved, 20.10.2010.
Heynderickx, I., & Bech, S. (2002). Image quality assessment by expert and non-expert viewers.
Proceedings of the SPIE Human Vision and Electronic Imaging VII, 4662, 129–137.
Himmanen, H., Hannuksela, M. M., Kurki, T., & Isoaho, J. (2008). Objectives for new error
criteria for mobile broadcasting of streaming audiovisual services. EURASIP J. Adv.
Signal Process, 2008, 1–12. doi:10.1155/2008/518219
Ho, J., & Intille, S. S. (2005). Using context-aware computing to reduce the perceived burden of
interruptions from mobile devices. Proceedings of CHI 2005 Connect: Conference on Human
Factors in Computing Systems, 909–918.
Hollier, M. P., & Voelcker, R. M. (1997). Towards a multi-modal perceptual model. BT Technology
Journal, 15(4), 163–172. doi:10.1023/A:1018695832358
Hollier, M. P, Rimell, A. N., Hands, D. S., & Voelcker. R. M. (1999). Multi-modal perception. BT
Technology Journal 17(1), 35–46. doi:10.1023/A:1009666623193
Huynh-Thu, Q., & Ghanbari, M. (2005). A comparison of subjective video quality assessment
methods for low-bitrate and low-resolution video. Signal and Image Processing: Proceedings of
the Seventh IASTED International Conference 2005.
Huynh-Thu, Q., & Ghanbari, M. (2008). Temporal aspect of perceived quality in mobile video
broadcasting. IEEE Transactions on Broadcasting, 54(3), 641–651.
doi:10.1109/TBC.2008.2001246
Häkkinen, J., Kawai, T., Takatalo, J., Leisti, T., Radun, J., Hirsaho, A., & Nyman, G. (2008).
Measuring stereoscopic image quality experience with interpretation based quality methodology.
Image Quality and System Performance V, 6808(68081B).
Häkkinen. J., Kawai, T., Takatalo, J., Mitsuya, R., & Nyman, G. (2010). What do people look at
when they watch stereoscopic movies? In A. J. Woods, N. S. Holliman, & N. A. Dodgson (Eds.),
Electronic Imaging: Stereoscopic Displays & Applications XXI, 7524(1), 75240E.
Häkkinen, J., Vuori, T., & Puhakka, M. (2002). Postural stability and sickness symptoms after HMD
use. Proc. SMC Symp., 147–152.

91
IEEE. (2010). Transactions in Multimedia. http://www.ieee.org/organizations/society/tmm/,
retrieved: 26.11.2010.
ISO 13407. (1999). Human-centered design processes for interactive systems. International
Standardization Organization (ISO).
ISO 8586-1. (1993). Sensory analysis – General guidance for the selection, training and monitoring
of assessors – Part 1: Selected assessors. International Standardization Organization (ISO).
ISO 8586-2. (1994). Sensory analysis – General guidance for the selection, training and monitoring
of assessors – Part 2: Experts. International Standardization Organization (ISO).
ISO 9241-11:1998. (1998). Ergonomic requirements for office work with visual display terminals
(VDTs) – Part 11: Guidance on usability. International Standardization Organization (ISO).
ISO 9241-210:2010. (2010). Ergonomics of Human-System Interaction – Part 210: Human centred
design for interactive systems. International Standardization Organization (ISO).
ISO SFS-EN 9000. (2001). Quality management systems: Fundamentals and vocabulary. Finnish
Standards Association, p. 61.
ISO SFS-EN 9001. (2001). Quality management systems: Requirements. Finnish Standards
Association, p. 59.
Isomursu, M., Kuutti, K., & Väinämö, S. (2004). Experience clip: method for user participation and
evaluation of mobile concepts. 8th Conference on Participatory Design: Artful Integration:
Interweaving Media, Materials and Practices.
ITU-R BT.500-11 Recommendation. (2002). Methodology for the subjective assessment of the
quality of television pictures. International Telecommunications Union (ITU) –
Radiocommunication sector.
ITU-T J.100 Recommendation. (1990). Tolerance for transmission time differences between vision
and sound components of a television signal. International Telecommunication Union (ITU) –
Telecommunication sector.
ITU-T P.10 Recommendation Amendment 1. (2008). Vocabulary for performance and quality of
service: New appendix I definition of Quality of Experience (QoE). International
Telecommunication Union (ITU) – Telecommunication sector.
ITU-T P.910 Recommendation. (1999). Subjective video quality assessment methods for multimedia
applications. International Telecommunications Union (ITU) – Telecommunication sector.
ITU-T P.911 Recommendation. (1998). Subjective audiovisual quality assessment methods for
multimedia applications. International Telecommunications Union (ITU) – Telecommunication
sector.
ITU-T P.920 Recommendation. (2002). Interactive test methods for audiovisual communications.
International Telecommunications Union (ITU) – Telecommunication sector.
ITU-T. E.800 Recommendation. (1994). Terms and definitions related to quality of service and
network performance including dependability. International Telecommunication Union (ITU) –
Telecommunication sector.
Iwamiya, S. (1992). Interaction between auditory and visual processing when listening to music via
audio-visual media. Second International Conference on Music Perception and Cognition.
Jain, R. (2004). Quality of experience. IEEE Multimedia, 11(1), 96–97.
Jambon, F. (2009). User evaluation of mobile devices: In-situ versus laboratory experiments. Int J
Mobile Computer–Human Interaction, 1(2), 56–71.
Jennings, J. R., van der Molen, M. V., van der Veen, F. M., & Debski, A. B. (2002). Influence of
preparatory schema on the speed of responses to spatially compatible and incompatible stimuli.
Psychophysiology, 39, 496–504.
Jennings, J. M., & Jacoby, L. L. (1993). Automatic versus intentional uses of memory: aging,
attention, and control. Psychology and Aging, 8(2), 283–293.
Johnson, R. B., & Onwuegbuzie, A. J. (2004). Mixed methods research: A research paradigm whose
time has come. Educational Researcher, 33(7), 14–26.
Jumisko-Pyykkö, S., Haustola, T., Boev, A., & Gotchev, A. (2011). Subjective evaluation of mobile
3D video content: depth range versus compression artefacts. Proceedings of SPIE Electronic
Imaging 2011.
Jumisko-Pyykkö, S., & Utriainen, T. (2011). Hybrid Method for Multimedia Quality Evaluation in
the Context of Use Contribution, International Telecommunication Union, Q13/12, Study group
12
Kaasinen, E. (2005). User acceptance of mobile services – Value, ease of use, trust and ease of
adoption. Doctoral dissertation, VTT publications 566, Helsinki, Finland.
Kaikkonen, A., Kekäläinen, A., Cankar, M., Kallio, T., & Kankainen, A. (2008). Will laboratory test
results be valid in mobile contexts? In J. Lumsden (Ed.) Handbook of research on user interface

92
design and evaluation for mobile technology, chapter LIII, 897–909. Information Science
Reference.
Keijzers, J., Scholten, L., Lu, Y., & den Ouden, P. H. (2009). Scenario-based evaluation of
perception of picture quality failures in LCD televisions. In R. Roy, & E. Shebab (Eds.),
Proceedings of the 19th CIRP Design Conference (pp. 497–503). Cranfield, United Kingdom:
Cranfield University Press.
Keinonen, T. (2008). User-centered design and fundamental need. Proceedings of the 5th Nordic
Conference on Human-Computer interaction: Building Bridges: NordiCHI '08, 358, 211–219.
doi:10.1145/1463160.1463183
Kennedy, R., Lane, N., Berbaum, K., & Lilienthal, M. (1993). Simulator sickness questionnaire: An
enhanced method for quantifying simulator sickness. Int. J. Aviation Psychology, 3(3), 203–220.
Knoche, H. (2010). Quality of experience in digital mobile multimedia services. PhD thesis,
University College London, London, UK.
Knoche, H. O., & McCarthy, J. D. (2004). Mobile users needs and expectations of future multimedia
services. Proceedings of the WWRF12.
Knoche, H., & Sasse, M. A. (2009). The big picture on small screens delivering acceptable video
quality in mobile TV. ACM Trans. Multimedia Comput. Commun. Appl.: TOMCCAP, 5(3), 1–
27. doi:10.1145/1556134.1556137
Knoche, H., de Meer, H., & Kirsh, D. (2006). Extremely economical: How key frames affect
consonant perception under different audio-visual skews. Proceedings of 16th World Congress
on Ergonomics: IEA2006.
Knoche, H., McCarthy J. D., & Sasse, M. A. (2006a). Reading the fine print: The effect of text
legibility on perceived video quality in mobile TV. Proceedings of ACM Multimedia 2006.
Knoche, H., McCarthy, J. D., & Sasse, M. A. (2005). Can small be beautiful? Assessing image size
requirements for mobile TV. Proceedings of ACM Multimedia 2005, 561.
Knoche, H., McCarthy, J. D., & Sasse, M. A. (2006b). A close-up on mobile TV: The effect of low
resolutions on shot types. Proceedings of EuroITV 2006.
Knoche, H., McCarthy, J., & Sasse, M. A. (2008). How low can you go? The effect of low
resolutions on shot types. Springer Multimedia Tools and Applications Series, Personalized and
Mobile Digital TV Applications.
Knoche, H., Papaleo, M., Sasse, M. A., & Vanelli-Coralli, A. (2007). The kindest cut: Enhancing the
user experience of mobile TV through adequate zooming. Proceedings of ACM Multimedia
2007, 87–96.
Kondrad, J., & Angiel, P. (2006). Subsampling models and anti-alias filters for 3-D automonoscopic
displays. IEEE Transactions on Image processing, 15(1), 128–140.
Köpke, A., Willig, A., & Holger, K. (2003). Chaotic maps as parsimonious bit error models of
wireless channels. Proceedings of the IEEE INFOCOM, 513–523.
Kozamernik, F., Sunna, P., Wyckens, E., & Pettersen, D. I. (2005). Subjective quality of internet
video codecs phase ii evaluations using SAMVIQ. EBU Technical Review, European Broadcast
Union (EBU).
Kujala, S. (2002). User studies: A practical approach to user involvement for gathering user needs
and requirements. Doctoral dissertation, Finnish Academies of Technology, Espoo, Finland.
ISBN 951-666-599-3
Kunze, K. (2009). Designing a Sensory Profiling Method for Mobile 3D Video and Television, MSc
thesis, Technical University of Ilmenau, Germany.
Lambooij, M., IJsselsteijn, W., & Heynderickx, I. (2007). Visual discomfort in stereoscopic displays:
A review. Proceedings SPIE, 6490(64900I).
Lambooij, M., IJsselsteijn, W., Fortuin, M., & Heynderickx, I. (2009). Visual discomfort and visual
fatigue of stereoscopic displays: A review. J. Imaging and Technology, 53(3), 030201–030201-
14.
Law, E. L.-C., & van Schaik, P. (2010). Modelling user experience – An agenda for research and
practice. Interacting with Computers, 22(5), 313–322. doi:10.1016/j.intcom.2010.04.006.
Lawless, H. T., & Heymann, H. (1999). Sensory Evaluation of Food: Principles and Practices. New
York: Chapman & Hall.
Le Meur, O., Ninassi, A., Le Callet, P., & Barba, D. (2010). Do video coding impairments disturb the
visual attention deployment?. Image Commun., 25(8), 597–609.
doi:10.1016/j.image.2010.05.008
Lee, H., Ryu, J., & Kim, D. (2010). Profiling mobile TV adopters in college student populations of
Korea. Technological Forecasting & Social Change, 77, 514–523.
Lewicki, M. S. (2002). Efficient coding of natural sounds. Nature Neuroscience, 5(4), 292–294.

93
Livingstone, M., & Hubel, D. (1988). Segregation of form, color, movement, and depth: anatomy,
physiology, and perception. Science, 240, 740–749.
Lorho, G. (2005). Individual vocabulary profiling of spatial enhancement systems for stereo
headphone reproduction. Proceedings of Audio Engineering Society 119th Convention, 6629.
Lorho, G. (2007). Perceptual evaluation of mobile multimedia loudspeakers. Proceedings of Audio
Engineering Society 122th Convention.
Lu, Z., Lin, W., Seng, B. C., Katob, C., Yao, S., Ong, E., & Yang, X. K. (2005). Measuring the
negative impact of frame dropping on perceptual visual quality. Proceedings of the SPIE/IS&T
human vision and electronic imaging, 5666, 554–562.
Mahlke, S. & Thüring, M. (2007). Studying antecedents of emotional experiences in interactive
contexts. Proceedings CHI 2007, 915–918.
Mahlke, S. (2008). User experience of interaction with technical systems. PhD thesis, Berlin
University of Technology, Berlin, Germany.
http://opus.kobv.de/tuberlin/volltexte/2008/1783/pdf/mahlke_sascha.pdf
McCarthy, J. D., Sasse, M. A., & Miras, D. (2004). Sharp or smooth?: Comparing the effect of
quantization vs. frame rate for streamed video. Proceedings of the 2004 Conference on Human
Factors in Computing Systems, 535–542.
McGurk, H., & MacDonald, J. (1976). Hearing lips and seeing voices. Nature, 264, 746–748.
McTigue, M. C., Koehler, H. H., & Silbernagel, M. J. (1989). Comparison of four sensory evaluation
methods for assessing cooked dry beans. Journal of Food Science, 54(5), 1278–1283.
Meehan, M., Insko B., Whitton, M., & Brooks, F. P. (2002). Physiological measures of presence in
stressful virtual environments. ACM Trans. Graph., 21(3), 645–652.
Meesters, L. M. J., IJsselsteijn, W. A., & Seuntiens, P. J. H. (2004). A survey of perceptual
evaluations and requirements of three-dimensional TV. IEEE Trans. Circuits Syst. Video Tech.,
14(3), 381–391.
Miller, M. E., & Segur, R. (1999). Perceived image quality and acceptability of photographic prints
originating from different resolution digital capture devices. Proceedings of the 52nd Annual
Conference of the Society for Imaging Science and Technology, 131–136.
Mizobuchi, S., Chignell, M., & Newton, D. (2005). Mobile text entry: Relationship between walking
speed and text input task difficulty. Proceedings of the 7th international Conference on Human
Computer interaction with Mobile Devices & Services: MobileHCI '05, 111, 122–128.
doi:10.1145/1085777.1085798
Mäki, J. 2005. Finnish Mobile TV Results. Research International Finland, August. 2005.
M ller, S., elmudez, ., Garcia, M.-N., K hnel, C., Raake, A., & Weiss, B. (2010). Audiovisual
quality integration: Comparison of human-human and human-machine interaction scenarios of
different interactivity. Second International Workshop on Quality of Multimedia Experience:
QoMEX 2010, 58–63. doi:10.1109/QOMEX.2010.5518100
Möller, S., Engelbrecht, K.-P., Kühnel, C., Wechsung, I., Weiss, B. (2009). A taxonomy of quality of
service and Quality of Experience of multimodal human-machine interaction. International
Workshop on Quality of Multimedia Experience: QoMEX 2009, 7–12.
doi:10.1109/QOMEX.2009.5246986
Muller, M. J., Hallewell Haslwanter, J., & Dayton, T. (1997). Participatory practices in the software
lifecycle. In M. Helander, T. K. Landauer, & P. Prabhu (Eds.), Handbook of Human–Computer
Interaction (2nd ed., 255–297). Amsterdam: Elsevier.
Mustonen, T., Olkkonen, M., & Häkkinen, J. (2004). Examining mobile phone text legibility while
walking. Extended Abstracts on Human Factors in Computing Systems: CHI '04, 1243–1246.
doi:10.1145/985921.986034
Myllymäki, P., Silander, T., Tirri, H., & Uronen, P. (2002). B-course: A web-based tool for bayesian
and causal data analysis. International Journal on Artificial Intelligence Tools, 11(3), 369–387.
Nahrstedt, K., & Steinmetz, R. (1995). Resource management in networked multimedia systems.
IEEE Comput. 28(5), 52–63.
Neisser, U. (1976). Cognition and Reality, Principles and Implications of Cognitive Psychology. San
Francisco: W.H. Freeman and Company.
Neuman, W., Crigler, A., & Bove, V. M. (1991). Television sound and viewer perceptions.
Proceedings of the Audio Engineering Society 9th International Conference, 1(2), 101–104.
Nielsen. (2009). Television, Internet and Mobile Usage in the U.S.
http://in.nielsen.com/site/documents/3Screens_4Q09_US_rpt.pdf, retrieved: 26.11.2010.
Nielsen. (2010). How People Watch: A Global Nielsen Consumer Report. August 2010,
http://no.nielsen.com/site/documents/Nielsen_HowPeopleWatch_August2010.pdf, retrieved:
26.11.2010.

94
Ninassi, A., Le Meur, O., Le Callet, P., Barba, D., & Tirel, A. (2006). Task impact on the visual
attention in subjective image quality assessment. 14th European Signal Processing Conference:
EUSIPCO 2006.
Noble, A. C., Arnold, R. A., Masuda, B. M., Pecore, S. D., Schmidt, J. O., & Stern, P. M. (1984).
Progress towards a standardized system of wine aroma terminology. American Journal of
Enology and Viticulture 35, 107109.
Nyman, G., Radun, J., Leisti, T., Oja, J., Ojanen, H., Olives, J.-L., Vuori, T., & Häkkinen, J. (2006).
What do users really perceive: probing the subjective image quality. Proceedings of SPIE,
6059(605902), 13–19.
Nyström, M., & Holmqvist, K. (2007). Deriving and evaluating eye-tracking controlled volumes of
interest for variable-resolution video compression. J. Electron. Imaging., 16(1), 013006.
Nyström, M., & Holmqvist, K. (2008). Semantic override of low-level features in image viewing –
Both initially and overall. Journal of Eye Movement Research, 2(2), 1–11.
Oatley, K., & Jenkins, J. M. (2003). Understanding Emotions. Oxford: Blackwell publishing.
O'Hara, K., Mitchell, A. S., & Vorbau, A. (2007). Consuming video on mobile devices. Proceedings
CHI '07, 857–866.
Oksman, V., Noppari, E., Tammela, A., Mäkinen, M., & Ollikainen, V. (2007). News in mobiles:
Comparing text, audio and video. VTT Research Notes, 2375.
http://www.vtt.fi/inf/pdf/tiedotteet/2007/T2375.pdf
Oksman, V., Ollikainen, V., Noppari, E., Herrero, C., & Tammela, A. (2008). ‗Podracing‘:
Experimenting with mobile TV content consumption and delivery methods. Multimedia Systems,
14(2), 105–114.
Oulasvirta, A. (2009). Field experiments in HCI: promises and challenges. In P. Saariluoma, & H.
Isomaki (Eds.), Future Interaction Design II. Springer.
Oulasvirta, A., Tamminen, S., Roto, V., & Kuorelahti, J. (2005). Interaction in 4-second bursts: The
fragmented nature of attentional resources in mobile HCI. Proceedings of the SIGCHI
Conference on Human Factors in Computing Systems: CHI '05, 919–928.
doi:10.1145/1054972.1055101
Oxford Dictionary of English 1.0, MOT, (2005). Oxford University Press. Retrieved: 2010-03-01.
Papagan, M. (2004). Determinants of adoption of third generation mobile multimedia services.
Journal of interactive marketing, 18(3).
Parducci, A., & Wedell, D. H. (1986). The category effect with rating scales: Number of categories,
number of stimuli, and method of presentation. Journal of Experimental Psychology: Human
perception and performance, 12(4), 496–516.
Partala, T., & Surakka, V. (2003). Pupil size variation as an indication of affective processing. Int. J.
Hum.–Comput. Stud., 59(1–2), 185–198. doi:10.1016/S1071-5819(03)00017-X
Pastrana, R., Gicquel, J., Colomes, C., & Hocine. C. (2004a). Sporadic signal loss impact on auditory
quality perception. Measurement of Speech and Audio Quality in Networks: MESAQIN 2004.
http://wireless.feld.cvut.cz/mesaqin2004/contributions.html
Pastrana-Vidal, R. R., & Colomes, C. (2007). Perceived quality of an audio signal impaired by signal
loss: Psychoacoustic tests and prediction model. IEEE International Conference on Acoustics,
Speech and Signal Processing: ICASSP 2007, 1, I-277–I-280.
doi:10.1109/ICASSP.2007.366670
Pastrana-Vidal, R., Gicquel, J. C., Colomes, C., & Cherifi, H. (2004b). Sporadic frame dropping
impact on quality perception. Human Vision and Electronic Imaging IX, 5292.
Patton, M. Q. (2002). Qualitative research and evaluation methods. Thousand Oaks, Ca: Sage.
Peli, E., Goldstein, R. B., & Woods, R. L. (1976). Scanpaths of motion sequences: Where people
look when watching movies. Network, 2.
Peregudov, A., Grinenko, E., Glasman, K., Belozertsev, A. (2010). An audiovisual quality model of
compressed television materials for portable and mobile multimedia applications. IEEE 14th
International Symposium on Consumer Electronics (ISCE), 1–6.
doi:10.1109/ISCE.2010.5523737
Pereira, F. (2005). Sensations, perceptions and emotions: Towards quality of experience evaluation
for consumer electronics video adaptations. Proceedings of First International Workshop on
Video Processing and Quality Metrics for Consumer Electronics 2005.
Phelps, E. A., Ling, S., & Carrasco, M. (2006). Emotion facilitates perception and potentiates the
perceptual benefits of attention. Psychol Sci., 17(4), 292–299.
Picard, D., Dacremont, C., Valentin, D., & Giboreau, A. (2003). Perceptual dimensions of tactile
textures. Acta Psychologica, 114(2), 165–184.

95
Poikonen, J., & Paavola, J. (2006). Error models for the transport stream packet channel in the DVB-
H link layer. Proceedings ICC 2006, 1861–1866.
Poole, A., & Ball, L. J. (2004). Eye tracking in Human-Computer Interaction and usability research:
Current status and future prospects. In C. Ghaoui (Ed.), Encyclopedia of Human Computer
Interaction. Pennsylvania: Idea Group.
Radun, J., Leisti, T., Häkkinen, J., Ojanen, H., Olives, J.-L., Vuori, T., & Nyman, G. (2008). Content
and quality: Interpretation-based estimation of image quality. ACM Trans. Appl. Percept., 4(4),
1–15.
Radun, J., Virtanen, T., Nyman, G., & Olives, J.-L. (2006). Explaining multivariate image quality –
interpretation-based quality approach. Proceedings of ICIS 06, 119–121.
Rajashekar, U., Bovik, A. C., & Cormack, L. K. (2008). GAFFE: A gaze-attentive fixation finding
engine. IEEE Transactions on Image Processing, 17, 564–573.
Reed, I. S., & Solomon, G. (1960). Polynomial codes over certain finite fields, SIAM Journal of
Applied Mathematics, 8(2), 300–304.
Reeves, B., & Nass, C. (1996). The Media Equation: How People Treat Computers, Television, and
New Media Like Real People and Places. Cambridge University Press.
Reiter, U., & Köhler, T. (2005). Criteria for the subjective assessment of bimodal perception in
interactive AV application systems. IEEE/ISCE'05 International Symposium on Consumer
Electronics. ISBN 0-7803-8920-4
Repo, P., Hyvönen, K., Pantzar, M., & Timonen, P. (2006). Inventing use for a novel mobile service.
International Journal of Technology and Human Interaction, 2(2), 49–62.
Ries, M., Puglia, R., Tebaldi, T., & Nemethova, O. (2005). Audiovisual quality estimation for mobile
streaming services. IEEE Proceedings of the 2nd International Symposium on Wireless
Communication Systems 2005, 5–7.
Rogers, E. M. (2003). Diffusion of Innovations (5th ed.). New York, NY: Free Press.
Roto, V. (2006). Web browsing on mobile phones – Characteristics of user experience. Doctoral
dissertation, TKK Dissertations 49, Helsinki University of Technology, Helsinki, Finland.
Rouse, D., Pépion, R., Hemami, S., Le Callet, P. (2010). Tradeoffs in subjective testing methods for
image and video quality assessment. Human Vision and Electronic Imaging, 7527.
Rötting, M. (2001). Parametersystematik der Augen- und Blickbewegungen für
arbeitswissenschaftliche Untersuchungen. PhD Thesis, Technische Universität Berlin, Berlin,
Germany.
S1-Jumisko-Pyykkö, S., & Väänänen-Vainio-Mattila, K., (2006). The role of audiovisual quality in
mobile television. Proceedings of Second International Workshop in Video Processing and
Quality Metrics for Consumer Electronics: VPQM 2006, 1–5.
S2-Jumisko, S., Ilvonen, V., & Väänänen-Vainio-Mattila, K. (2005). The effect of TV content in
subjective assessment of video quality on mobile devices. In R. Creutzburg, & J. H. Takala
(Eds.), Proceedings of SPIE, 5684, Multimedia on Mobile Devices (pp. 243–254).
S3-Hannuksela, M. M., Malamal Vadakital, V. K., & Jumisko-Pyykkö, S. (2007). Comparison of
error protection methods for audio-video broadcast over DVB-H. EURASIP Journal on
Advances in Signal Processing, Volume 2007, Article ID 71801, 12 pages.
doi:10.1155/2007/71801
S4-Hannuksela, M. M., Malamal Vadakital, V. K., & Jumisko-Pyykkö, S. (2007). Synchronized
audio redundancy coding for improved error resilience in streaming over DVB-H. Third
International Mobile Multimedia Communications Conference: MobiMedia 2007, Article 36, 4
pages.
S5-Jumisko-Pyykkö, S., Reiter, U., & Weigel, C. (2007). Produced quality is not the perceived
quality: A qualitative approach to overall audiovisual quality. Proceedings of 3DTV Conference
2007. doi:10.1109/3DTV.2007.4379445
S6-Reiter, U., & Jumisko-Pyykkö, S. (2007). Watch, press and catch - impact of divided attention on
requirements of audiovisual quality. Proceedings of 12th International Conference on Human-
Computer Interaction, 943–952. doi:10.1007/978-3-540-73110-8
S7-Gotchev, A., Jumisko-Pyykkö, S., Boev, A., & Strohmeier, D. (2007). Mobile 3DTV system:
Quality and user perspective. Proceeding of 4th International Mobile Multimedia
Communications Conference: Mobimedia 2007, 1–5.
S8-Jumisko-Pyykkö, S., Weitzel, M., & Strohmeier, D. (2008). Designing for user experience: What
to expect from mobile 3D TV and video? The First International Conference on Designing
Interactive User Experiences for TV and Video: UXTV‟08, 183–192.
doi:10.1145/1453805.1453841

96
S9-Gotchev, A., Smolic, A., Jumisko-Pyykkö, S., Strohmeier, D., Akar, G. B., Merkle, P., &
Daskalov, N. (2009). Mobile 3D television: Development of core technological elements and
user-centered evaluation methods toward an optimized system. Proceedings of SPIE, 7256, 3D
Video Delivery for Mobile Devices. doi:10.1117/12.816728
S10-Strohmeier, D., & Jumisko-Pyykkö, S. (2008). How does my 3D video sound like? - Impact of
loudspeaker set-ups on audiovisual quality on mid-sized autostereoscopic display. Proceedings
of second 3DTV Conference 2008, 73–76. doi:10.1109/3DTV.2008.4547811
S11-Jumisko-Pyykkö, S., Utriainen, T., Strohmeier, D., Boev, A., & Kunze, K. (2010). Simulator
sickness – Five experiments using autostereoscopic mid-sized or small mobile screens.
Proceedings of 3DTV Conference 2010, 1–4. doi:10.1109/3DTV.2010.5506401
S12-Jumisko-Pyykkö, S., & Utriainen, T. (2010). User-centered quality of experience of mobile
3DTV: How to evaluate quality in the context of use. SPIE&IST Electronic Imaging: Mobile
Multimedia 2010, 7542(75420W). doi:10.1117/12.849572
S13-Jumisko-Pyykkö, S., & Utriainen, T. (2010). User-centered quality of experience: Is mobile 3D
video good enough in the actual context of use? Proceedings of Fourth International Workshop
on Video Processing and Quality Metrics for Consumer Electronics: VPQM 2010, 1–5.
S14-Strohmeier, D., Jumisko-Pyykkö, S., & Kunze, K. (2010). New, lively, and exciting or just
artificial, straining, and distracting? A sensory profiling approach to understand mobile 3D
audiovisual quality. Proceedings of Fourth International Workshop on Video Processing and
Quality Metrics for Consumer Electronics: VPQM 2010, 1–5.
S15-Strohmeier, D., Jumisko-Pyykkö, S., & Reiter, U. (2010). Profiling experienced quality factors
of audiovisual 3D perception. Second International Workshop on Quality of Multimedia
Experience: QoMEX 2010, 70–75. doi:10.1109/QOMEX.2010.5518028 – Best paper award
S16-Jumisko-Pyykkö, S., & Strohmeier, D. (2008) Report of research methodologies for the
experiments. MOBILE3DTV Technical report.
http://sp.cs.tut.fi/mobile3dtv/results/tech/D4.2_Mobile3dtv_v2.0.pdf
Sarker, S., & Wells, D. (2003). Understanding mobile handheld device use and adoption.
Communications ACM 2003, 46(12), 35–40.
Sasse, M. A., & Knoche, H. (2006). Quality in context – An ecological approach to assessing QoS
for mobile TV. 2nd ISCA/DEGA Tutorial & Research Workshop on Perceptual Quality of
Systems.
Schwarz, A., Mehta, M., Johnson, N., & Chin, W. W. (2007). Understanding frameworks and
reviews: A commentary to assist us in moving our field forward by analyzing our past. SIGMIS
Database 38(3), 29–50.
Serif, T., Gulliver, S. R., & Ghinea, G. (2004). Infotainment across access devices: the perceptual
impact of multimedia QoS. Proceedings ACM Symp. on Applied Computing 2004, 1580–1585.
Seuntïens, P. J. H. (2006). Visual experience of 3D TV. PhD Thesis, Technische Universiteit
Eindhoven, Eindhoven, Netherlands.
Shackel, B. (1984). The concept of usability. In J. Bennett, D. Case, J. Sandelin, & M. Smith (Eds.),
Visual display terminals: Usability issues and health concerns (pp. 45–88). Englewood Cliffs,
NJ: Prentice-Hall. ISBN 0-13-942482-2
Shadish, W., Cook, T., & Campbell, D. (2002). Experimental and Quasi-Experimental Designs.
Boston, MA: Houghton Mifflin.
Shibata, T., Kurihara, S., Kawai, T., Takahashi, T., Shimizu, T., Kawada, R., Ito, A., Häkkinen, J.,
Takatalo, J., & Nyman, G. (2009). Evaluation of stereoscopic image quality for mobile devices
using interpretation based quality methodology. Proceedings SPIE: Stereoscopic Displays and
Applications XX, 7237(72371E). doi:10.1117/12.807080
Shim, J. P., Park, S., & Shim, J. M. (2008). Mobile TV phone: Current usage, issues, and strategic
implications. Industrial Management & Data Systems, 108(9), 1269–1282.
doi:10.1108/02635570810914937
Shimojo, S., & Shams, L. (2001). Sensory modalities are not separate modalities: plasticity and
interactions. Current Opinion in Neurobiology, 11.
Slutsky, D. A., & Recanzone, G. H. (2001). Temporal and spatial dependency of the ventriloquism
effect. NeuroReport, 12, 7–10.
Smilowitz, E. D., Darnell, M. J., & Benson A. E. (1993). Are we overlooking some usability testing
methods? A comparison of lab, beta, and forum tests. Proceedings of the Human Factors and
Ergonomics Society 37th Annual Meeting 1993.
Smith, J. A. (1995). Envolving iseeus for qualitative pshychology. In J. T. E. Richards (Ed.),
Handbook of qualitative research methods for psychology and the social sciences. Leicester;
BPS Books.

97
Soto-Faraco, S., & Kingstone, A. (2004). Multisensory integration of dynamic information. In G.
Calvert, C. Spence, & B. E. Stein (Eds.), The handbook of multisensory processes.
Sowden, P. T., Davies I. R. L., & Roling P. (2000). Perceptual learning of the detection of features in
X-ray images: A functional role for improvements in adults‘ visual sensitivity?. Journal of
Experimental Psychology: Human Perception and Performance, 26(2000), 379–390.
Speranza, F., Poulin, F., Renaud, R., Caron, M., & Dupras, J. (2010). Objective and subjective
quality assessment with expert and non-expert viewers. Second International Workshop of
Quality of Multimedia Experience: QoMEX 2010, 46–51. doi:10.1109/QOMEX.2010.5518177
Stein, B. E., London, N., Wilkinson, L. K., & Price, D. D. (1996). Enhancement of perceived visual
intensity by auditory stimuli: A psychophysical analysis. Journal of Cognitive Neuroscience, 8,
497–506.
Stereoscopic 3D LCD Display module, Product Brochure, masterImage, 2009,
www.masterimage.co.kr/new_eng/product/module.htm
Stockbridge, L. (2006). Mobile TV: Experience of the UK Vodafone and Sky service. Proceedings of
EuroITV 2006.
Storms, R. (1998). Auditory-visual cross-modal perception phenomena. Doctoral dissertation, Naval
Postgraduate School, Monterey, California.
Strauss, A., & Corbin, J. (1998). Basics of Qualitative Research: Techniques and Procedures for
Developing Grounded Theory (2nd ed.). Thousand Oaks, CA: Sage.
Strohmeier, D., & Tech, G. (2010). Sharp, bright, three-dimensional: open profiling of quality for
mobile 3DTV coding methods. Proceedings of SPIE Multimedia on Mobile Devices 2010,
7542(75420T). doi:10.1117/12.848000
Strohmeier, D. & Jumisko-Pyykkö, S. Proposal on Open Profiling of Quality as a mixed method
evaluation approach for audiovisual quality assessment Contribution, International
Telecommunication Union, Q13/12, Study group 12
Strohmeier, D., Jumisko-Pyykkö, S., Kunze, K., & Bici, M. O. (2011). The extended-OPQ method
for User-Centered Quality of Experience evaluation: A study for mobile 3D video broadcasting
over DVB-H. EURASIP Journal on Image and Video Processing, 2011, Article ID 538294, 24
pages. doi:10.1155/2011/538294
Södergård C. (Ed.) 2003. Mobile television – technology and user experiences, Report on the Mobile
–TV Project. Espoo: VTT Publications 506.
Taga, K., Niegel, C., & Riegel, L. (2009). Mobile TV: Tuning in or switching off?. Arthur D. Little
Report. http://www.adl.com/reports.html?view=366
Tashakkori, A., & Teddlie, C. (2008). Quality of inferences in mixed methods research: Calling for
an integrative framework. In M. M. Bergman (Ed.), Advances in mixed methods research.
London: Sage.
ten Kleij, F., & Musters, P. A. D. (2003). Text analysis of open-ended survey responses: A
complementary method to preference mapping. Food Quality and Preference, 14, 43–52.
Thüring, M., & Mahlke, S. (2007). Usability, aesthetics, and emotions in Human-Technology-
Interaction. International Journal of Psychology, 42, 253–264.
Tikanmäki, A., Gotchev, A., Smolic, A., & Miller, K. (2008). Quality assessment of 3D video in rate
allocation experiments. IEEE International Symposium on Consumer Electronics: ISCE 2008,
1–4.
Tosi, V., Mecacci, L., & Pasquali, E. (1997). Scanning eye movements made when viewing film:
Preliminary observations. Int. J. Neuroscience, 92(1-2), 47–52.
Treisman, A. (1993). The perception of features and objects in attention: Selection, awareness and
control. In A. Baddley, L. Weiskrantz (Eds.), A tribute to Donald Broadbent. Oxford: Claredon
Press.
Treisman, A., & Gelade, G. (1980). A feature integration theory of attention. Cognitive Psychology,
12, 97–136.
Uehara,S., Hiroya, T., Kusanagi, H., Shigemura, K., & Asada, H. (2008). 1-inch diagonal
transflective 2D and 3D LCD with HDDP arrangement. Proc. SPIE-IS&T Electronic Imaging
2008, Stereoscopic Displays.
UPA, Usability Professionals‘ Association. Retrieved: 2008-12.
http://www.upassoc.org/usability_resources/about_usability/what_is_ucd.html.
Utriainen, T. (2010). Audiovisual quality in mobile 3D television and its evaluation methods for
context of use. MSc thesis, Tampere University of Technology.
Vadas, K., Patel, N., Lyons, K., Starner, T., & Jacko, J. (2006). Reading on-the-go: A comparison of
audio and hand-held displays. Proceedings of the 8th Conference on Human–Computer

98
interaction with Mobile Devices and Services: MobileHCI '06, 159, 219–226.
doi:10.1145/1152215.1152262
Venkatesh, V., Morris, M. G., Davis, G. B., & Davis, F. D. (2003). User acceptance of information
technology: Toward a unified view. MIS Quarterly, 27(3), 425–478.
Verkasalo, H. (2009). Contextual patterns in mobile service usage. Pers Ubiquitous Comput 13:331–
342
VQEG. (2000). Final report from the Video Quality Experts Group on the validation of objective
models of video quality assessment. Video Quality Experts Group (VQEG).
http://www.vqeg.org.
Vroomen, J. (1999). Ventriloquism and the nature of the unity assumption. In G. Aschersleben, T.
Bachmann, & J. Müsseler (Eds.), Cognitive contributions to the perception of spatial and
temporal events (pp. 389–393). Amsterdam: Elsevier.
Watson, A., & Sasse M. A. (1996). Evaluating audio and video quality in low-cost multimedia
conferencing systems. Interacting with computers, 8(3), 255–275.
Watson, A., & Sasse, M. A. (1998). Measuring perceived quality of speech and video in multimedia
conferencing applications. Proceedings ACM multimedia 1998, 55–60.
Welch, R. B., & Warren, D. H. (1980). Immediate perceptual response to intersensory discrepancy.
Psychological Bulletin, 88, 638–667.
Weller, H. G., Repman, J., & Rooze, G. E. (1994). The relationship of learning, behavior, and
cognitive styles in hypermedia-based instruction: Implications for design of HBI. Computers in
the Schools, 10(1994), 401–420.
Werner, S., & Thies, . (2000). Is ‗change blindness‘ attenuated by domain-specific expertise? An
expert-novices comparison of change detection in football images. Vis. Cogn., 7, 163–174.
Wikstrand, G. (2003). Improving user comprehension and entertainment in wireless streaming
media, introducing cognitive quality of service. Department of Computer Science, Umeå
University, Umeå, Sweden.
Willner, K., Ugur, K., Salmimaa, M., Hallapuro, A., & Lainema, J. (2008). Mobile 3D video using
MVC and N800 internet tablet. 3DTV Conference: The True Vision – Capture, Transmission and
Display of 3D Video 2008, 69–72.
Wilson, G. M., & Sasse, M. A. (2004). From doing to being: getting closer to the user experience.
Interacting with Computers, 16(4), 697–705.
Wilson, G. M., & Sasse, M. A. (2000). The head or the heart? Measuring the impact of media
quality. Proceedings CHI 2000, 1–6.
Winkler, S. (1999). Issues in vision modelling for perceptual video quality assessment. Signal
Processing, 78(2), 231–252.
Winkler, S., & Faller, C. (2005). Audiovisual quality evaluation of low-bitrate video. Proceedings of
SPIE Human Vision and Electronic Imaging X, 5666, 139–148.
Winkler, S., & Faller, C. (2006). Perceived audiovisual quality of low-bitrate multimedia content.
IEEE Transactions on Multimedia, 8(5), 973–980.
Woszczyk, W., Bech, S., & Hansen, V. (1995). Interaction between audio-visual factors in a home
theater system: Definition of subjective attributes. 99th Audio Engineering Society Convention
1995.
Wu, W., Arefin, A., Rivas, R., Nahrstedt, K., Sheppard, R., & Yang, Z. (2009). Quality of experience
in distributed interactive multimedia environments: Toward a theoretical framework.
Proceedings of the Seventeen ACM international Conference on Multimedia: MM '09, 481–490.
doi:10.1145/1631272.1631338
Yokum, J. T., & Armstrong, J. S. (1995). Beyond accuracy: comparison of criteria used to select
forcasting methods. International Journal of Forecasting, 11(4), 591–597.
Zacharov, N., & Koivuniemi, K. (2001). Audio descriptive analysis & mapping of spatial sound
displays. Proceedings of the 2001 International Conference on Auditory Displays
Zhai, G., Cai, J., Lin, W., Yang, X., Zhang, W., & Etoh, M. (2008). Cross-dimensional perceptual
quality assessment for low bitrate videos. IEEE Trans. on Multimedia, 10(7), 1316–1324.

99
Appendices
Appendix 1: Qualitative descriptive evaluation – experiment 3
The goal of this appendix is to present the results of descriptive quality factors for experiments where
residual transmission error rates were varied in controlled laboratory conditions. The
psychoperceptual preference ratings from the same study are presented in (P1) with an extensive
description of the experimental procedure and stimuli material. The presentation in this appendix is
restricted only to the descriptive data collection procedure, analysis and, finally, to its results.
Research method
Participants – 30 participants conducted a study in a controlled laboratory environment.
Procedure – The post-test session gathered qualitative data about participants‘ experiences,
impressions and interpretations of quality. The interview was conducted in two parts – a free-
description task and stimuli-assisted description tasks. In the free-description task, the participants
were encouraged to describe their impressions of quality as broadly as possible; additional stimuli
material was not used in this part. The quality descriptions of free-description tasks highlights the
characteristics of the most varied variable, and negative factors are easier to compose than positive
factors, as retrospectively assessed human experiences are formulated from peaks, ends and
intensities (Fredrickson, 2000, S5, P8). In the stimuli-assisted description task, four test stimuli, one
per content, coded with the most erroneous simulation (MFER 20.7%) were presented one by one in
a random order and the same interview procedure (Figure 19) was repeated immediately after each
stimulus. The semi-structured interview was chosen as it is beneficial for an unexplored and
expectation-free research topic (Clark-Carter, 2002; Coolican, 2004; Smith, 1995; Patton, 2002). This
approach was introduced to quality evaluation research originally by (S5, P8). The interview was
constructed of main and supporting questions. The main questions with slight variations were asked
several times during the interview. The interviewer used only terms introduced by the participant.
The role of the supporting questions was to clarify further the answers of the main question.
FREE-DESCRIPTION TASK
Interview Interview Interview
STIMULI-ASSISTED DESCRIPTION TASK
Interview
SUPPORTING QUESTIONS:
―What do you mean by X (X=answer of main question)?‖
―Please, could you describe in more detail what do you mean by X?‖
―Please could you describe in more detail how/when the X appeared?‖
―Please could you clarify if the X Was among the most annoying/
pleasurable/important factors did you pay attention to while evaluating
quality as a whole?
MAIN QUESTION:
―What kind of factors you paid attention to while evaluating quality /
acceptance of quality as a whole?‖
Figure 19 The post-test interview contained a free description task and a stimuli-assisted
description task. Semi-structured interviews containing the main and supporting questions
were used in both tasks.

100
Stimuli – During the experiment four different stimuli contents (~60s) were used, representing
variable audio-visual characteristics. Four different transmission error rates (1.6%- 20.7%), resulting
in a varying number, length, and location of transmission errors were simulated to these contents.
Method of analysis - contained two dimensions. 1) One-dimensional analysis: The qualitative
analysis was based on the Grounded Theory presented by Strauss & Gorbin (1998). It is well
applicable in research areas with not much a priori knowledge, such as experienced quality, and
aiming at understanding the meaning or nature of a person‘s experiences (ibid.). The theory or its
building blocks are derived from data with systematical steps of analysis. All recorded interviews
were transcribed into text as a pre-processing step of analysis. All data was read through, meaningful
sentences were extracted and initially open-coded from all data for creating the concepts and their
properties. This phase was conducted by one researcher and reviewed by another researcher. All
concepts were organized into sub-categories and the sub-categories were further organized under
main categories. For 20% of randomly selected pieces of data the inter-rater reliability between two
researchers was good (Cohen‟s Kappa: 0.70, p<.001). Sub-categories mentioned by more than 10%
of participants were considered. Frequencies in each category were determined by counting the
number of participants that described the category. In this level of categorization, several mentions of
the same concept by one person were recorded only once. The results were presented with the aid of
five different major categories called content, usage, audio, audiovisual, and visual quality
aspects/factors. 2) Correspondence analysis: Correspondence analysis was applied in order to
visualize the relationship between the different groups of experienced quality factors. The
correspondence analysis is a descriptive and exploratory technique for the analysis of a two-way
contingency tables. It includes a measure of correspondence between the rows and columns of the
table and visualizes the results spatially based on the row and column variables (Greenacre 1984).
The correspondence analysis is widely applied in different research fields, especially in consumer
research and sensorial studies of food (ten Kleij & Musters 2003, Ares et al., 2008), and recently in
visual quality studies (Nyman et al., 2006, Radun et al., 2006).
Results
One-dimensional analysis - Data from the free-description and the stimuli-assisted description
tasks were analyzed independently for exploring the influence of tasks on the number of descriptions.
The stimuli-assisted description tasks composed significantly higher frequencies per subcategories
than the free-description tasks (Table 9; X2=124.6, p<.001). However, the preference order of these
sub-categories (percent of all mentions within task) is not influenced by the different description
tasks (t=-0.53, df=34, p=0.96, ns). This result can be interpreted so that the most commonly
mentioned categories are assigned independently of the usage on highly impaired stimuli. A further
presentation of the actual analysis of experienced quality factors is based on all the descriptions given
during the presentation as the aim is to identify the most commonly mentioned factors.
Seven major categories of experienced quality factors were identified, including 1) audio, 2)
video, 3) audiovisual, 4) media independent, 5) content, 6) usage and 7) hedonistic factors (Table 9).
These factors represent a pool of low-level stimuli-driven factors (1-4), high-level user-driven factors

101
(5-6) and emotional factors (7). Within these major categories, the most commonly described sub-
factors (mentioned by over 85% of the participants) were temporal impairments in audio (cut offs)
and audio in general, temporal cut-offs in video, viewing task related factors, contents and
obtrusiveness and the importance of quality.
The factors mentioned by over 50% of the participants have similarities in audio, video and media
independent quality factors. Both impairment and excellence (spatial, temporal) related descriptions
are included in these as well as the number of errors. It is worth noting that the number of errors is a
more commonly mentioned criteria than the length of errors in both audio and video quality. Within
audiovisual factors, the importance of audio was emphasized over the importance of video, and
synchronism played the most significant role.
Correspondence analysis - Correspondence analysis was carried out to identify and visualize the
connections between experienced quality factors. The categories that collected more than 25% of all
mentions were included into the analysis. Figure 20 shows the results of the different associations of
the experienced quality factors to the hedonistic factors. The first two dimensions explained 95.5% of
the data variability. There are three main groups in the results. The first group connects the
obstructive and acceptable quality to erroneousness. For example, all descriptions of cut offs are
located in this group. The other two groups contain more neutral or positive descriptions. The list of
important factors includes mainly the audio related aspects (such as audio in general, its importance
and clarity), fluency of video motion and contents. The quality of pleasantness is connected to the
ability to view the content and the neutral aspects of video quality, such as video quality in general
and spatial aspects.
The content dependent quality descriptions are presented in Figure 21 without hedonistic factors.
In this case, the first two dimensions explained 83.3% of the data variability. The first dimension
separated audio and video related mentions mainly into two groups and located the factors related to
relative importance . The audio related mentions are attached to music video. In the other extreme,
sport content is described in terms of visual quality including temporal factors as well as the ability to
detect details on a small screen. News and animation contents are between these extremes and collect
not only the audio and video related descriptions but also the perceptions of media independence and
the ability to follow content. The visual quality factors that characterize this central group are more
oriented towards spatial quality than temporal quality. Figure 21 also illustrates that among the audio
related factors, there are descriptions about visual quality in general, spatial quality as well as
synchronism.
In news content, the ability to understand the information from the news is the major point in the
ability to follow. “Well, that the audio comes properly, so that it has no cuts, so that there are no
misunderstandings if it gets cut just at an important moment” (Woman 34). The importance of audio
was described for news and music video contents. For news: “Sound irritates immediately if it has
deficiencies. It is like more critical than tiny stops in video” (Man 36). For music video: ―This is also
the kind of video where you can pretty much forgive video quality, but because this is music the
sound should be flawless” (Man, 30).

102
Table 9 Experienced quality factors: the major categories and subcategories, their definitions
and the related percentage and number of mentions. ‘All descriptions’ contains all mentions
given during an interview, ‘Free-task’ summarizes the descriptions given in a free-description
task and ‘Task-stimuli’ contains the descriptions of stimuli-assisted tasks.
CATEGORIES (major and sub) DEFINITION (examples) ALL
DESC.
TASK-
FREE
TASK-
STIM.
% of 30 subjects
AUDIO (A) Describes the factors of audio excellence and inferiority
Cut off Temporal impairments in audio (cut offs, missing audio, jumpy, omissions,
pauses)
96.7 93.3 96.7
Audio quality in general General descriptions of audio quality where certain quality factor cannot be
further identified
86.7 33.3 86.7
Number of errors The number of audio errors 66.7 46.7 66.7
Clarity Clarity of audio (accuracy, fluency, smoothness, error-free) 63.3 30.0 63.3
Length of errors The length of the temporal audio impairments 10.0 3.3 10.0
VIDEO (V) Describes the factors of visual excellence and inferiority
Cut off Temporal impairments in video (still or frozen video, omissions, pauses,
jerkiness, stops)
100.0 93.3 100.0
Temporal motion Temporal factors in video (mobility, fluency, smoothness, fluidity) 76.7 46.7 76.7
Spatial factors Spatial factors of video quality (accuracy, fidelity, sharpness, colors) 73.3 53.3 73.3
Video quality in general General descriptions of visual video quality where certain quality factor cannot be
further identified
70.0 20.0 70.0
Number of errors The number of video errors 63.3 50.0 63.3
Length of errors The length of the temporal impairments 53.3 20.0 53.3
Spatial impairments Spatial impairments in visual quality (inaccuracy, graininess, blurriness,
fogginess, impairments in colors)
26.7 10.0 26.7
Small display size General mentions about the display size 26.7 13.3 26.7
Shooting angle Mentions of shooting angle or distance 26.7 10.0 26.7
Detail detection Ability to detect details in image (small objects or text size) 16.7 16.7
AUDIOVISUAL (AV) Describes the relative importance or annoyance of one media over another and
their temporal synchronism
Audio more important Audio has a relatively more important role than video (information is in audio,
visual media is not appropriate)
83.3 20.0 83.3
Synchronism Temporal synchronicity of audio and video media (how well audio and video fit
together)
66.7 40.0 66.7
Audio quality more annoying Audio errors are relatively more annoying than visual errors 30.0 20.0 30.0
Video more important Visual video has a relatively more important role than audio (information is in
video, audio media is not appropriate)
20.0 3.3 20.0
Video quality more annoying Visual errors are relatively more annoying than audio errors 20.0 20.0
Audio and video equal Audio and visual impairments are equally annoying or their importance is the
same
13.3 3.3 13.3
MEDIA INDEPENDENT (M) Describes the media independent factors of excellence or inferiority of quality
Cut offs in general General descriptions of quality where the certain uni- or multimodal quality factor
cannot be further identified (cut off)
63.3 36.7 63.3
Total number of errors Total number of errors and variance in quality 60.0 40.0 60.0
General quality descriptions Excellence or inferiority of quality (clarity, erroneousness) and its comparisons to
the existing systems (TV, internet)
36.7 20.0 36.7
CONTENT (C) Describes the associations to different contents
Animation Animation content 100.0 16.7 100.0
Music video Music video content 100.0 33.3 100.0
News News content 100.0 30.0 100.0
Sport Sport content 96.7 46.7 96.7
Content dependency Quality depends on content or it is described in comparison between contents 23.3 20.0 23.3
USAGE (U) Describes the factor‟s relation to the user‟s viewing task and her/his relation to
content
Ability to follow content Ability to follow content (to understand, watch and get the message, fitness to
purpose of use, easy to view)
100.0 70.0 100.0
Relation to content Relevance of content consumption, familiarity or interests in viewing content has
been mentioned
33.3 10.0 33.3
HEDONISTIC (H) Describes the different hedonistic levels associated to quality
Obstructive Strong negative expressions (annoying, irritating, kills the viewing experience,
cannot be used, hard to use)
100.0 96.7 100.0
Important Very important aspects 100.0 73.3 100.0
Acceptable Mild negative expressions of quality, but still acceptable for viewing 86.7 43.3 86.7
Pleasant Positive descriptions of quality (good, pleasant, easy) 50.0 30.0 50.0
Total number of mentions 643 353 457

103
Figure 20 Correspondence analysis plot of experienced quality factors associated with
hedonistic levels of quality.
Figure 21 Correspondence analysis plot of experienced quality factors associated with different
contents.
Discussion
The descriptive results underlined three main aspects in experienced quality. Firstly, they showed
that quality is strongly described by cut offs in audio and visual presentation and the ability to follow.
The numerous and long lasting gaps have associations to the temporal dimension of quality and act as
interruptions for the viewing task. An interruption is understood as an event that breaks the user‘s

104
attention on the current task and makes the user to focus on the interruption temporarily, being an
unwanted distraction to the primary task (see Ho & Intille, 2005 for overview). In the previous study
by (P8), experienced quality factors contained multiple aspects of inaccuracy in presentation (e.g.
visibility of details, blurriness, background sounds). These results are based on a study where the
audio-video bitrate ratios and framerates were varied. A comparison between these two studies
indicates that the nature of these impairment types can be fundamentally different and they may have
a different kind of influence on the viewer‘s task. Under the inaccurate conditions, the viewers may
be able to focus on the content if the fluency of the presentation is maintained, while a temporal gap
in playback may cause an annoying interruption. Secondly, the number of errors in both audio and
video were more commonly mentioned than their length. This may indicate that in further
development it would be important to consider the total number of errors or techniques that improve
cut offs in playback to be below the detection threshold. Thirdly, the results show that in very low
quality and bad visual circumstances (visibility of objects) high audio quality is needed in line with
the modality appropriateness hypothesis (Welch & Warren, 1980).

105
Appendix 2: Qualitative descriptive evaluation – experiment 5
The goal of this appendix is to present the results of the descriptive quality factors for the
experiments where residual transmission error rates were varied in field conditions. The quantitative
results and contextual experiential factors are presented in (P5, P10). This appendix summarizes the
descriptive data collection procedure, analysis and results.
Research method
Participants – 30 participants participated in the study in field circumstances.
Procedure – A post-test session gathered qualitative data about the participants‘ experiences,
impressions and interpretations of quality. The interview was composed of a free-description task
with a semi-structured interview identically to Appendix 1.
Method of analysis – The procedure in the analysis was identical to that in Appendix 1. Only a
one-dimensional analysis was conducted. For 20% of randomly selected pieces of data the inter-rater
reliability between two researchers was good (Cohen‟s Kappa: 0.71, p<.001).
Results
Six different factors of audiovisual quality were identified in the analysis: audio, video,
audiovisual, content, usage, media-independent quality and hedonistic levels. All components were
organized according to these factors (Table 10). The results show that among the most mentioned
categories (above 65% of the participants) are obtrusiveness, audio cut off, news content, ability to
follow content and video cut offs. These categories highly underline the negative influence of
impaired produced quality on subjective experience as well as its influence on the viewing task. The
participants‘ descriptions illustrate well these main categories: So, I paid most attention to cut offs as
they look extremely annoying --. And, it is even more irritating if there are audio gaps than video
gaps --. (Man, 37 years).

106
Table 10 Experienced quality factors: the major categories and subcategories, their definitions
and the related percentage and number of mentions for experiment 5.
CATEGORIES (major and sub) DEFINITION (example) % of 30
participants
AUDIO (A) Describes the influent audio or other audio-related factors
Cut off Temporal impairments in audio (e.g. cut offs, missing audio, jumpy, omissions, pauses) 73.3
Audio quality in general General descriptions of audio quality in which a certain quality factor cannot be further
identified 40.0
VISUAL (V) Describes the factors of visual excellence and inferiority
Cut off Temporal impairments in video (still video, freezing, omissions, pauses, jerkiness,
pauses, stops) 66.7
Spatial impairments Visual spatial impairments(e.g. inaccuracy, graininess, blurriness, fogginess, darkness,
colors) 43.3
Detail detection Details of image and their detectability (e.g. small objects or text size) 43.3
Video quality in general General descriptions of visual video quality in a which certain quality factor cannot be
further identified 40.0
Small display size General mentions about the display size 30.0
Shooting angle Factors of the shooting angle or distance 20.0
Spatial factors Spatial factors of image quality (e.g. accuracy, fidelity, sharpness) 20.0
Motion Temporal motion in the content 13.3
AUDIOVISUAL (AV) Describes the relative importance or annoyance of one media over another
Audio more important than video Audio has relatively a more important role than video due to location of information or
image size 33.3
Audio quality more annoying than video Audio errors are relatively more annoying than visual impairments 23.3
Video more important than audio Visual video has a relatively more important role than audio due to location of
information or image size 16.7
Audio and video equally important Audio and visual impairments are equally annoying 13.3
CONTENT (C) Describes the associations to different contexts
News News content 73.3
Sport Sport content 63.3
Animation Animation content 60.0
Music video Music video content 43.3
Content dependency Quality depends on content or it is described in comparison between contents 36.7
USAGE (U) Describes the factors relation to user‟s viewing task and her/his relation to content
Ability to follow content Descriptions about ability to follow content (e.g. ability to view, understand, ability to
watch content) 73.3
Relation to content Relevance of content consumption, familiarity or interests in viewing content has been
mentioned 36.7
MEDIA INDEPENDENT (Q) Describes the media independent factors of excellence or inferiority of quality
Inferiority in general General descriptions of quality in which a certain uni- or multimodal quality factor
cannot be further identified 56.7
Quality fluctuation Variance in quality including the number of errors or different relations between quality
factors 36.7
Relative evaluation of quality Quality is described in relation to some past quality experience (e.g. current television,
internet) 16.7
HEDONISTIC (H) Describes the different hedonistic levels associated to quality
Obstructive Strongly negative expressions of quality (e.g. annoying, irritating, kills the viewing
experience, does not fit into purpose of use, hardness to view) 86.7
Pleasant Positive descriptions of quality (e.g. good, pleasant, easy) 60.0
Acceptable Mild negative expressions of quality which are still acceptable for viewing 56.7
Total number of mentions 353
Discussion
These descriptive results emphasize four main aspects. Firstly, the most commonly mentioned
components (audio and video cut-offs and the ability to follow) are similar to those gathered from
controlled laboratory circumstances, showing a good reliability between these studies (Appendix 1).
Secondly, beyond the most common categories, the quality description seems to be less detailed in
the field. For example, the descriptions of length or the number of errors were not identified as a
category in the field although they were commonly mentioned in the controlled circumstances.
Thirdly, quality fluctuation appeared as a new component in the field study. As the contents shown
formed a continuous story in a length of four clips, the participants were annoyed about watching
stories with variable quality. This result indicates that smooth changes are appreciated under time-
varying quality (giving further support for Huynh-Thu & Ghanbari, 2008).

107
Appendix 3: Qualitative descriptive evaluation – experiment 4
The goal of this appendix is to present the results of descriptive quality factors for the experiments
where residual transmission error rates and error control methods were varied in laboratory
conditions. The quantitative results of this experiment are presented in (P1). This appendix
summarizes the descriptive data collection procedure, analysis and results.
Research method
Participants – 45 participants participated in the study.
Procedure – The post-test session gathered qualitative data about the participants‘ experiences,
impressions and interpretations of quality. The interview was composed of free and stimuli-assisted
description tasks identical to (Appendix 1). The stimuli-assisted description task contained all error
control methods presented with a MFER error rate of 13.8%.
Method of analysis – The procedure in the analysis was identical to Appendix 1. Only one-
dimensional analysis was conducted. For 20% of randomly selected pieces of data inter-rater
reliability between two researchers was excellent (Cohen‟s Kappa=0.82, p<.001).
Results
Descriptive experienced quality contained six different main components: audio, video,
audiovisual, media independent quality, usage and hedonistic factors (Table 11). Similarly to the
previous studies, audio and video cut offs and ability to follow were among the commonly mentioned
categories (over 88% of the participants). In more detail, the number of errors and different types of
spatial impairments in visual quality were commonly mentioned (over 65% of the participants). In
the stimuli-assisted descriptive task, audio-cut offs collected fewer mentions for the error control
method with good audio protection (SAR-PF) compared to the others. In contrast, a significantly
lower number of mentions of video-cut offs were collected with the method that targeting to improve
video (UEP-PF). These two methods were also considered as the least obstructive.

108
Table 11 Experienced quality factors: the major categories and subcategories, their definitions
and the related percentage and number of mentions for experiment 4 for the different control
methods at MFER 13.6%.
COMPONENTS
(major and sub) DEFINITION (examples)
ALL
N=30
%
CT-
EC
CT-
PF
SAR-
PF
UEP-
PF
AUDIO (A) Describes the components of audio excellence and inferiority
Cut off Temporal impairments in audio (cut offs, missing audio, jumpy, omissions, pauses) 97.7 85.0 85.7 76.2 81.0
Clarity Clarity of audio (accuracy, fluency, smoothness, error-free) 56.8 15.0 4.8 16.7 4.8
Audio in general General descriptions of audio where a certain quality factor cannot be further
identified
31.8 2.5 4.8 2.4
Metallic Impressions of metallic sound, stir, noise, scratchy noise 22.7 10.0 2.4 2.4 11.9
Number of errors Mentions of the amount or number of errors in general 68.2 7.5 21.4 14.3 40.5
Few errors Number of audio errors from one to few 47.7 5.0 2.4 9.5 23.8
Several errors Number of audio errors - several, numerous, a lot 34.1 2.5 19.0 7.1 16.7
Duration of errors Duration of audio impairments in general 54.5 2.5 4.8 19.0 19.0
Short Duration of audio impairments – short 47.7 4.8 16.7 16.7
Long Duration of audio impairments – long lasting 15.9 2.4 4.8
Pattern Pattern of audio impairment(s) (location in sequence (at the beginning/end),
rhythmic, continuous, time-varying)
29.5 2.5 7.1 7.1 7.1
VIDEO (V) Describes the components of audio excellence and inferiority
Cut off Temporal impairments in video (still or frozen video, omissions, pauses, jerkiness,
stops)
100.0 75.0 71.4 71.4 66.7
Fluency of motion Temporal factors in video (mobility, fluency, smoothness, fluidity) 38.6 12.5 2.4 2.4
Accuracy Spatial factors of video quality (accuracy, clarity, fidelity, sharpness, colors) 36.4 5.0 2.4 4.8 2.4
Video quality in
general
General descriptions of video quality where a certain quality factor cannot be further
identified
34.1 5.0 2.4 2.4
Number of errors Mentions of the amount or number of errors in general 68.2 17.5 14.3 16.7 11.9
Few errors Number of video errors from one to few 65.9 15.0 7.1 16.7 9.5
Several errors Number of video errors - several, numerous, a lot 11.4 4.8 2.4
Duration of errors Duration of video impairments in general 61.4 7.5 16.7 26.2 14.3
Short Duration of video impairments – short 29.5 7.1 4.8 2.4
Long Duration of video impairments – long lasting 45.5 7.5 11.9 21.4 11.9
Spatial impairments Spatial impairments in visual quality (inaccuracy, blurriness, fogginess, color
impairments)
68.2 32.5 7.1 7.1 4.8
Small display size General mentions about the display size 22.7 5.0
Detail detection Ability to detect details in image (small objects or text size) 40.9 20.0 4.8 2.4
Doubling back Impression that the same image goes back and forward over time 27.3 2.4 9.5
Fragmentation Spatial impairments with a detectable structure (broken down into pieces, mixed,
pixilated, grainy)
68.2 52.5 9.5 2.4 2.4
Pattern Pattern of audio impairment(s) (location in sequence (at the beginning/end),
rhythmic, continuous, time-varying)
22.7 2.5 4.8 2.4 2.4
AUDIOVISUAL (AV) Relative importance or annoyance of one media over another and their temporal
synchronism
Audio more important Audio has a relatively more important role than video (information is in audio,
visual media is not appropriate)
54.5 10.0 4.8 2.4 2.4
Synchronism Temporal synchronicity of the audio and video media (how well audio and video fit
together)
43.2 7.5 7.1 4.8
Audio quality more
annoying
Audio errors are relatively more annoying than visual errors 34.1 10.0 4.8 2.4
Video more important Visual video has a relatively more important role than audio (information is in
video, audio media is not appropriate)
18.2 2.5 2.4
Video quality more
annoying
Visual errors are relatively more annoying than audio errors 15.9 2.4 2.4
Audio and video equal Audio and visual impairments are equally annoying or their importance is the same 15.9 2.5
Simultaneous AV cut
off
Audio and video cut offs appear at the same time in both media 43.2 12.5 16.7 11.9 14.3
Non-simultaneous AV
cut off
Audio and video cut offs do not appear at the same time in both media 15.9 4.8 2.4 9.5
Audio ahead of video Audio is presented before video 27.3 2.4 7.1 2.4

109
MEDIA
INDEPENDENT (M)
Describes the media independent factors of excellence or inferiority of quality
Cut offs in general General descriptions of quality where the certain uni- or multimodal quality factor
cannot be further identified (cut off)
43.2 5.0 9.5 7.1
Total number of errors Total number of errors and variance in quality 56.8 7.5 11.9 16.7 9.5
General quality
descriptions
Excellence or inferiority of quality (clarity, erroneousness) and its comparisons to
the existing systems (TV, internet)
20.5 5.0 2.4
Duration of errors Duration of impairments in general 36.4 5.0 14.3 9.5 4.8
Trade off Trade off between system quality factors (e.g. AV quality, different visual quality
factors)
38.6 2.5 9.5 7.1 4.8
Pattern Pattern of serie(s) of impairment(s) (location in sequence (at the beginning/end),
rhythmic, continuous, time-varying)
25.0 2.5 2.4 7.1 4.8
USAGE (U) Describes the factors regarding to user‟s viewing task and her/his relation to
content
Ability to follow content Ability to follow content (to understand, watch and get the message, fitness to
purpose of use, easy to view)
88.6 27.5 31.0 21.4 23.8
Relation to content Relevance of content consumption, familiarity or interests in viewing content has
been mentioned
11.4 2.4 9.5
CONTENT (C) Describes the associations to different contents
Animation Animation content 72.7
Music video Music video content 72.7
News News content 75.0
Sport Sport content 86.4
Content dependency Quality depends on content or it is described in comparison between contents, can
also depend on the shot type or its characteristics
59.1 22.5 9.5 16.7 9.5
HEDONISTIC (H) Describes the different hedonistic levels associated to quality
Obstructive Strong negative expressions (annoying, irritating, kills the viewing experience,
cannot be used, hard to use)
97.7 65.0 45.2 35.7 38.1
Important Very important aspects 38.6 7.5 7.1 9.5 7.1
Acceptable Mild negative expressions of quality, but still acceptable for viewing 97.7 47.5 40.5 26.2 38.1
Pleasant Positive descriptions of quality (good, pleasant, easy) 27.3 2.4 4.8 2.4
Total number of descriptions 1088
Discussion
In the results of this study, the main categories (cut offs and ability to follow) remain similar to
the studies where only the error rates were compared (Appendix 1-2). However, the finer
granularities for describing the errors were identified only in a few new minor categories compared
to other studies (e.g. number or length of errors). Furthermore, descriptions of the number of errors
were more commonly mentioned than their length. These results indicate that 1) cut offs in playback
act as the main evaluation criteria and give further support to why the error rate acted as a more
significant factor in quality excellence ratings over the error control methods. 2) Human temporal
evaluations are limited as suggested in (Fredrickson & Kahneman, 1993) and, therefore, further work
needs to address the methods to reduce the number of detectable errors. Finally, the results of stimuli-
assisted descriptive task underlined the expected media-dependent characteristics for different error
control methods and were in line with the quantitative results.

110
Appendix 4: Descriptive components for 2D mobile video quality of experience.
The goal of this appendix is to summarize the general descriptive components for 2D mobile video
quality of experience. The analysis of descriptive components of the quality of experience for 2D
audiovisual video was based on the results of four studies (P8, Appendices 1-3). These studies
compared produced quality factors independently and jointly on media and transmission levels. The
procedure applying a grounded theory framework (Strauss & Gorbin, 1998) was similar to (P12). To
identify the general components over the studies, a new data set was constructed from the sub-
components of all studies, including their definitions. As the data driven analysis was used in
independent studies to identify the most common study dependent characteristics of quality, it
resulted in a different way to group quality factors. When the definition contained clearly two
different characteristics, e.g. unclear colors and blurriness; it was split into two independent parts.
Otherwise, equal importance between subcomponents was considered as the aim was to identify the
general quality factors. The term ―component‖ refers to any element of quality to combine the earlier
terms of factors, components, dimensions, categories and aspects. The identified concepts were
categorized into initial subcategories and major categories by one researcher and reviewed by another
researcher. The components, subcomponents, their definitions and the studies they were mentioned in
are listed in Table 12.
The results show that there are six main components of experienced quality: 1) audio, 2) video, 3)
audiovisual, 4) usage, 5) media independent quality, 6) content, and one supplementary component
called 7) hedonistic quality to define the excellence of the components. Audio quality means
constructed impressions of overall audio quality, its fluency, naturalness and error patterns including
the number and the duration of errors. Video quality is composed of the impressions of overall visual
quality, its fluency, clarity, block-freeness, error patterns including number and duration of errors and
the delectability of objects. Audiovisual quality combines the relative importance between media for
presenting content, annoyance of impairments in different media and synchronicity between media
and errors. Media independent quality factors are composed of an overall impression of quality and
characteristics of media independent error patterns. These three groups represent mainly low-level
quality characteristics. At the higher abstraction level, viewing experience describes the ease of
user‘s viewing task, the impression of suitability to the purpose of use, relation to content and
knowledge about the existing quality level. Quality depends also on content; it is described in relation
to different contents or pieces of it (e.g. certain shot type, moment, cut). Finally, the components of
quality can be described in the hedonistic dimension from pleasurable to obstructive.

111
Table 12 General descriptive quality components: the major categories and subcategories, their
definitions and their appearance in different studies.
COMPONENTS
(major and sub)
DEFINITION (examples)
REFERENCE
P8
Appen
dix
1
Appen
dix
2
Appen
dix
3
AUDIO (A) Impressions of overall audio quality, its fluency, naturalness and error patterns
including number and duration of errors
Overall impression of audio Overall impression of audio or quality is somehow audio related √ √ √ √
Fluency of audio
Fluent/Influent
Excellence of natural fluency of audio – Fluent (clear, accurate, smooth, error-free)
vs. Influent (cut offs, missing audio, jumpy, omissions, pauses)
√ √ √
Naturalness of audio
Natural/Unnatural
Excellence of clarity of audio - Natural (clear, accurate) vs. Unnatural (unclear,
metallic, echoes, detectable background sounds) √ √
Audio error pattern Time-varying characteristics of (series of) audio impairment (s) (e.g. location,
rhythmic, continuous, time-varying nature of quality)
√
Number of errors Amount or number of errors (e.g. cut offs) √ √
Few/Several errors
Duration of errors Duration of audio impairments (e.g. cut offs) √ √
Short/Long
VISUAL (V) Impressions of overall visual quality, its fluency, clarity, block-freeness, error
patterns including number and duration of errors, and detectability of objects
Overall impression of visual
quality
Overall impression of visual video or quality is somehow video related √ √ √ √
Fluency of motion
Fluent/Influent
Excellence of natural fluency of motion – Fluent (smooth, fluidity, mobility) vs.
Influent (cut offs, frozen video, jerky, stops, doubling back)
√ √ √
Clarity of video
Clear/Blur
Overall clarity of image – Clear (accuracy, fidelity, sharpness) vs. Blur (foggy,
inaccuracy, not sharp) √ √ √ √
Block-free video
Block-free/visible blocks
Existence of impairments with detectable structure (e.g. pixelated, grainy, image is
broken into pieces or blocks) √ √ √ √
Color and sharpness Excellence of colors and sharpness √ √ √ √
Motion in content Nature of motion in content (e.g. slow or fast) √ √
Visual error pattern Time-varying characteristics of (series of) video impairment (s) (e.g. location,
rhythmic, continuous, time-varying nature of quality)
√
Number of errors Amount or number of video errors (e.g. cut offs) √ √
Few/Several errors
Duration of errors Duration of video impairments (e.g. cut offs) √ √
Short/Long
Delectability of objects
Easy to detect/Hard to detect
Ability to detect meaningful details in video (e.g. objects, people, text) with selected
shooting angle and distance and screen size – Easy to detect - (visibility, accuracy)
vs. Hard to detect (too small, inaccurate, invisible)
√ √ √ √
AUDIOVISUAL (AV) Relative importance between media for presenting content, annoyance of
impairments in different media and synchronicity between media and errors
Importance of media Audio/Video
One media has relatively more important role for presenting content √ √ √
Synchronism between media Synchronous/Asynchronous
Temporal synchronism between media in presentation of content √ √ √
Annoyance of errors in
different media Audio/Video
Errors in one modality are relatively more annoying than in another
modality
√ √ √ √
Error pattern, synchronism Synchronous/Asynchronous
Temporal synchronism between audio and video errors
√
USAGE (U) Describes ease of user‟s viewing task, impression of fitness to purpose of
use, relation to content and knowledge about existing quality level
Ability to follow content Easy/Difficult
User‘s ability to concentrate on viewing content (to understand, watch
and get the message)
√ √ √ √
Fitness to purpose of use Fit/Not fit
Fitness to purpose of use √ √ √ √
Relation to content
User‘s relation to content - Relevance of content consumption, familiarity or interests in viewing content
√ √ √ √
Comparison to existing technology
User uses knowledge about quality level of existing technology in descriptions (e.g. TV, internet)
√ √ √

112
MEDIA INDEPENDENT
(M)
Overall impression of quality and error patterns media independently
Overall impression of quality Pleasurable/Disturbing
Overall hedonistic impression of quality – Pleasurable (good, error-free) – Disturbing (annoying, irritating)
√ √ √
Overall error pattern
Time-varying characteristics of (series of) impairment (s) (e.g. location, rhythmic,
continuous, or overall time-varying nature of quality, quality fluctuation)
√ √ √
Number of errors Amount or number errors in general (e.g. cut offs in general) √ √
Few/Several errors
Duration of errors Duration of errors in general (e.g. cut offs in general) √
Short/Long
CONTENT (C) Quality is depends on content, it is described in relation to different
contents or piece of it (e.g. certain shot type, moment, cut)
√ √ √ √
HEDONISTIC (H) Pleasurable/Obstructive
Hedonistic levels associated to different components of quality
Pleasurable (positive, good) vs. Obstructive (negative, annoying)
√ √ √ √

113
Appendix 5: Descriptive components for quality in the context of use
The goal of this appendix is to summarize the general descriptive components for experienced quality
in the context of use based on independent studies published in (P5). The main common components
(Table 13) are 1) context characteristics (physical and social, temporal, technical and media, task
context), 2) usage, 3) system quality, 4) context and system quality and 5) hedonistic dimensions.
Table 13 Descriptive components for experienced quality in the context of use in three
experiments.
COMPONENTS
(major and sub) DEFINITION (examples)
REFERENCE - P5
Exp 1 Exp 2 Exp 3
PHYSICAL AND SOCIAL CONTEXT, The factors of perceived physical context
Impression of surroundings Impressions of surroundings and its activities. Calm (peaceful inferiority-
free, natural) vs. Disturbing (busy, unpleasant, inferior, artificial)
√ √ √
Audio Surrounding audio environment (noise) √ √ √
Visual Surrounding visual environment (light conditions, reflections to screen) √ √ √
Vibration Vibrations and movements of bus (trembling, swinging, stops, movements) √ √
Social Presence of other people √ √
TEMPORAL CONTEXT, The factors in relation to time
Viewing time Duration of (expected) viewing time, fitness for viewing with certain
duration
√ √
TECHNICAL AND MEDIA CONTEXT, The presence of other media or devices in surrounding
Other media/devices Presence of other media/devices for accessing similar type of content √ √
TASK CONTEXT, The multiple tasks which are competing for user‟s attention
Parallel tasks Existence of parallel task, where attention is shared between or relatively
more on content or context
√ √
USAGE, The factors related to user‟s viewing task, user-context, user-content-context relations and fatigue
Ability to follow content Ability to concentrate on viewing content √ √ √
Relation to context Relevance of context, its familiarity or interests for viewing situation √ √
Fitness of context to purpose of use Fitness of context to purpose of use √ √
Fitness for viewing certain content
type in context Context fit for viewing entertaining or informational content
√ √
Fatigue Experienced fatigue (e.g. hand) due to the holding a device √ √
SYSTEM QUALITY, Audio and video quality of system and content related mentions
Audio quality Audio loudness, audio more important than video, need for error-free audio √
Visual quality Visual quality, small display size and detectability of details, objects, text,
viewing angle
√ √ √
Contents Quality depends on content or it is described in comparison between contents √ √
CONTEXT AND SYSTEM QUALITY, The relation between context and system quality
Overall quality Overall quality when taking into account context and system quality √ √
Trade off Trade of between system or context quality (e.g. busy context need higher
quality)
√
√
√
Quality detection Ability to detect the difference between system qualities in context √ √ √
HEDONISTIC, The different affective levels associated to quality
E.g. Pleasant / Obstructive, Strong positive/negative expressions(annoying,
irritating, kills the viewing experience)
√ √ √

114
Appendix 6: Equipment
Table 14 The devices used in the experiments.
Experiment
Device or
manufacturer Screen
Resolution in
pixels
Diagonal
size in inch Pixels per inch (PPI)
1 Nokia 6600 TFT - LCD 176x208 2.1 126
2 Nokia 7700 TFT - LCD 640x320 3.5 204
3,4,5 Nokia 6630 TFT - LCD 176x208 2.1 130
1
Sony-Ericsson P800 TFT - LCD 208x320 2.9 132
Dots per inch (DPI)
(Presentation mode)
6, 7
Master image prototype device
3D LCD, parallax barrier (Stereoscopic 3D LCD
Display, 2009)
400x480
3.3
218 (2D) 109 (3D)*
8, 10, 11
Prototype NEC
HDDP, lenticular sheet (Uehara et al., 2008)
427x240
3.5
157 (2D) 157 (3D)*
9
Sharp laptop
ACTIUS AL-3DU, parallax
barrier (Actius AL-3DU, 2005)
512x768
15
85 (2D)
42.5 (3D)*
* For 3D, DPI is expressed per channel, recalculated based on Boev & Gotchev (2011).

115
Appendix 7: Co-authors’ contribution to the publications
The contribution of the co-authors per publications is following:
P1 – Produced quality is partly co-authored by all the authors of the publication. Dr. Hannuksela and
Mr. Malamal Vadakital have written the network level characteristics and the test material production
process and the simulations. Dr. Hannuksela had also an advisory role in the paper and his comments
helped to make significant improvements for it.
P2 – Did not have co-authors.
P3 – The original research problem was identified by both authors. The responsibility in writing was
shared between the authors in the sections ‗Context of use‘,‘ Research method‘ and ‗Discussion‘.
P4 – The original idea for the paper was developed by the first two authors. The abstract,
introduction, discussion and conclusions were solely written by the candidate. The section on
experiment 3 is mainly written by Mr. Strohmeier. In all other sections the work was shared between
the authors.
P5 – The section on multimedia quality was written together by both authors. The reporting of the
research method and the results for experiments 2 and 3 was shared between the authors.
P6 – Dr. Häkkinen had an advisory role to improve the paper.
P7 – Dr. Korhonen and Mr. Malamal Vadakital shared the responsibility of writing the sections
‗Errors in the wireless channels‘ and ‗Material production process - simulations‘.
P8 – Prof. Nyman and Dr. Häkkinen commented on the content of the paper to improve it and Prof.
Nyman presented the paper at the conference.
P9 - Dr. Häkkinen has shared the idea of data-analysis, commented on the paper and made a
presentation at the conference.
P10 - Dr. Hannuksela had an advisory role in the paper and his comments helped to make significant
improvements for the finalization of the paper. He also wrote the section ‗Production of test material
– simulations‘.
P11 – Mr. Utriainen wrote the abstract and introduction while the methods and the results were
written by both of us. The candidate wrote the discussion of the paper.
P12 – The original idea for the paper was proposed by the candidate and the sections of abstract,
introduction, discussion and conclusions are written by her. Related work was mainly written by Mr.
Strohmeier and Ms. Kunze. The research method was co-authored by Mr. Strohmeier, Mr. Utriainen
and the candidate. The results per experiments have the contribution of all the authors. The model
(DQoE – mobile 3D video) was developed by the candidate and Mr. Strohmeier. All authors had a
significant contribution to finalize the paper.

116
Original publications


![[ACM-ICPC] 0 - ACM-ICPC](https://img.dokumen.tips/doc/110x75/555603ead8b42a3f168b4838/acm-icpc-0-acm-icpc.jpg)