Embed Size (px)
Citation preview

Chapter 5 – Detection, Mapping, and Monitoring of the Mountain Pine Beetle 123
Chapter 5
Detection, Mapping, and Monitoring of the Mountain Pine Beetle1
Michael A. Wulder, Caren C. Dymond, Joanne C. White, and Bob Erickson
Natural Resources Canada, Canadian Forest Service, Pacific Forestry Centre, 506 West Burnside Road, Victoria, British Columbia, V8Z 1M5
Abstract
Forest management decisions regarding the mountain pine beetle (Dendroctonus ponderosae Hopk. [Coleoptera: Scolytidae]) are generally driven by the location, size, and impact of the beetle population, and a variety of survey techniques are used to collect this information. The methodology used and the scale (level of detail) of the survey are determined by the management objectives. The survey may be done on a tree-by-tree basis on the ground, from an airborne platform, or with satellite-based sensors. As a result, the extent of the survey may range from a few hectares to millions of hectares. This chapter reviews the tools and approaches available to forest managers for the detection, mapping, and monitoring of mountain pine beetle. The information content and limitations associated with each survey method are provided to facilitate informed choices between available survey methods and information sources. Also presented in this chapter is the concept of an information hierarchy, whereby multiple sets of survey data may be nested for any given area of interest. For example, a lower-cost overview survey may be used to guide the selection of locations requiring more intensive (and more expensive) surveys. Survey recommendations, based upon the information hierarchy, are also provided.
Résumé
La prise de décisions concernant la gestion des forêts touchées par le dendroctone du pin ponderosa (Dendroctonus ponderosae Hopk. [Coleoptera: Scolytidae]) est généralement guidée par les éléments que sont l’emplacement des secteurs affectés, la taille de la population de dendroctones et les conséquences de son passage. Divers types de relevés peuvent être utilisés pour recueillir ces données. La méthode utilisée et la portée (niveau de précision recherché) du relevé dépendent des objectifs de gestion. Le relevé peut être effectué sur le terrain, arbre par arbre, ou à partir d’un aéronef, ou encore à l’aide de capteurs satellitaires. La superficie couverte par un relevé peut donc varier de quelques hectares à plusieurs millions d’hectares. Dans le présent chapitre, on examine les outils
1This chapter is an update of material previously published as: Wulder, M.A.; Dymond, C.C.; Erickson, B. 2004. Detection and monitoring of the mountain pine
beetle. Natural Resources Canada, Canadian Forest Service, Pacific Forestry Centre. Information Report BC-X-398. 28p.

124 The Mountain Pine Beetle – A Synthesis of Biology, Management, and Impacts in Lodgepole Pine
et les mèthodes dont disposent les gestionnaires des forêts en matière de dètection, de cartographie et de surveillance du dendroctone du pin ponderosa. On y expose la teneur et les limitations des données associées à chaque type de relevé afin d’aider les gestionnaires à faire un choix éclairé parmi les méthodes de relevés et les sources de données disponibles. On y présente également le concept de hiérarchie de l’information, selon lequel de multiples jeux de données de relevés peuvent être imbriqués pour s’appliquer à n’importe quel champ d’intérêt. Il peut être utile, par exemple, d’effectuer un premier relevé général, moins coûteux, pour délimiter les endroits nécessitant des relevés plus détaillés (et plus coûteux). Enfin, on y retrouve des recommandations fondées sur le concept de hiérarchie de l’information pour effectuer des relevés.
Introduction
Forest management decisions regarding the mountain pine beetle (Dendroctonus ponderosae Hopk. [Coleoptera: Scolytidae]) (Belton and Eidt 1999) are generally driven by the location, size, and impact of the beetle population. For example, small groups of timber infested with mountain pine beetle may not be considered for mitigation in an endemic population condition. However, if monitoring of the beetle across the landscape indicates a population increase, action may be taken to address these patches of infestation to prevent or reduce future losses. Without control action, infestations within susceptible forests can expand until large numbers of trees are killed (Safranyik et al. 1974). Generally, the most severe infestations occur in mature stands of lodgepole pine (Pinus contorta Dougl. ex Loud. var. latifolia Engelm.), but other pine species, such as ponderosa pine (P. ponderosa Lawson) and white pine (P. monticola Douglas), may also be attacked.
Information regarding the location, size, and impact of mountain pine beetle populations is collected using a variety of survey techniques. The survey method is selected based on the information required for a particular aspect of forest management. The survey may be done on a tree-by-tree basis on the ground, from an airborne platform, or using satellite-based sensors. As a result, the extent of the survey may range from a few hectares to millions of hectares. Each survey method has limitations, with the collected data being applicable to different management situations.
The methodology and scale of a survey is defined by the management question being addressed. Questions regarding tree- or stand-level characterization of beetle impacts require different support data than required at the landscape level. Mountain pine beetle infestations are detected with systematic surveys conducted at regular time intervals. Surveys must locate the infestations as quickly as possible in order to contain and reduce beetle populations (Safranyik et al. 1974). In this chapter, detection is defined as the identification and documentation of locations of previously affected trees and probable locations of currently attacked trees. Detection information may be used to position field crews for infestation assessments or to facilitate mitigation options (Safranyik et al. 1974). Mapping is defined as spatially explicit estimates of the number of trees affected, or of the volume affected, for a particular management unit (e.g., at the forest stand level). Monitoring is

Chapter 5 – Detection, Mapping, and Monitoring of the Mountain Pine Beetle 125
defined as repeatable, comparable estimation of beetle populations and impacts over time in order to detect trends in population dynamics and spatial pattern. Under all population conditions, monitoring enables forest managers to anticipate possible risks associated with the infestation.
Federal, provincial, and state governments are primarily interested in the broad-scale detection of red attack trees across their political jurisdictions. Aerial overview survey operations are used to satisfy this information need (Wiart 2003). The information is used to monitor and report on overall forest health (e.g., USDA Forest Service 2003). Government agencies concerned with forestry or environmental protection also use the red attack detection information for strategic planning (e.g., British Columbia Ministry of Forests 2001), which includes identifying areas for more intensive information gathering, mitigation resources, timber sales, and targeted protection. In addition, locations of red attack trees are used to identify probable locations for green attack trees, thereby facilitating more aggressive mitigation activities.
Forestry companies and government agencies work together during timber supply reviews and in planning for land and resource management. Sub-provincial- or county-level monitoring, typically from aerial sketch mapping, is used to alter volumes and areas, which in turn are used to adjust the annual allowable cut and refine timber supply forecasts (British Columbia Ministry of Forests 2003). Maps of forest damage also may be used to adjust land use plans and provide information of ecological interest. Forest licensees and private landholders require detection of red attack trees at a larger scale, with more detailed information about attack locations and intensities across their land bases (Wiart 2003). These general locations are then used to direct additional, more detailed detection and mapping efforts. Results from local area mapping of red attack are used to guide surveys for associated green attack trees, and to aid in the design of logging and sanitation plans.
Information needs may require different survey techniques in order to provide the appropriate level of detail. Survey techniques also vary with timing of the survey relative to expression of attack in tree-crown foliage. In general, green attack is not operationally detectable without direct physical contact with the trees in question. Red attack is operationally detectable with a broad range of survey techniques (field, airborne, and satellite). While currently less reliable than red attack survey, grey attack may also be detected with a range of survey techniques. The red attack stage is the focus of the detection methods presented in this chapter.
Anecdotal accounts of mountain pine beetle-induced mortality in lodgepole pine stands have been recorded by early explorers of British Columbia. Today, the provincial government conducts annual systematic surveys of forest damage and mortality. The native range of mountain pine beetle includes southern and central British Columbia where pine species grow (Amman 1978). Populations of mountain pine beetle are also historically present in southwestern Alberta. Insect-induced mortality of mature pine in British Columbia is largely a result of attack by mountain pine beetle. For example, surveys conducted by the Canadian Forest Service, Forest Insect and Disease Survey (FIDS) estimated average annual

126 The Mountain Pine Beetle – A Synthesis of Biology, Management, and Impacts in Lodgepole Pine
Figure 1. Comparison of annual area burned by forest fires to annual area killed by mountain pine beetle (Canadian Council of Forest Ministers 2003).
loss to mountain pine beetle infestations to be 7.8 million mature pine trees (over a 34-year time period ending in 1995), with losses peaking in 1983 at 80.4 million mature pine trees (Wood and Unger 1996). The spatial extent of the current infestation in British Columbia is increasing annually, with areas reported to be approximately 2 million ha in 2002 (Westfall 2003), and estimated at more than 4 million ha in 2003 (British Columbia Ministry of Forests 2003). In Figure 1, the total area impacted by mountain pine beetle in each year between 1975 and 1996 is compared to the total area burned by forest fires each year during the same period.
The impact of mountain pine beetle is evident throughout its biological range, beetle being the second greatest contributor to tree mortality within the national forests of Colorado, South Dakota, and Wyoming. Over 300 000 trees were killed during 1997, 1998, and 1999 within the Rocky Mountain region of the United States (Harris et al. 2001). The number of trees killed increased each year from 1996 to 2001, with more than 800 000 trees killed over a 142 410-ha area (converted from a reported 300 000 acres) (Johnson 2002).
Insect disturbances are systematically monitored on an annual basis to assess extent and impact on forest resources. Mountain pine beetle impacts are observed and recorded as a component of insect-monitoring surveys. Detection and mapping of mountain pine beetle provide a record of tree mortality and, thus, a record of the beetle’s impact. These records are carried out using a range of techniques, each with its own advantages and disadvantages. Ground-based surveys are the most reliable source of information about the agent responsible for forest damage. Field surveys are undertaken judiciously due to their high per-hectare cost. Aerial surveys have the advantages of lower cost per hectare and reliable recognition of the damage agent. However, the points and polygons noted by aerial surveyors tend to be problematic in terms of positional accuracy and estimation of attack magnitude. Both

Chapter 5 – Detection, Mapping, and Monitoring of the Mountain Pine Beetle 127
ground and aerial surveys produce data that must be digitized to facilitate further analysis or for integration with forest inventory data or decision support systems. Alternatively, digital remote sensing produces data that may be quickly integrated with forest inventory databases and models. Some digital remote sensing instruments can also offer high positional accuracy (Dial et al. 2003; Tao et al. 2004). However, depending on the sensor and type of processing used, costs per hectare can be low or high. The choice of detection method must, therefore, be considered in the context of the value of the information to the forest manager.
When considering different approaches to detection – whether analogue or digital – it must be noted that the fading of foliage in response to mountain pine beetle attack is not uniform among all attacked trees. The foliage of a host tree changes gradually. Twelve months after being attacked, more than 90% of killed trees have red needles (red attack). Three years after being attacked, most trees have lost all needles (grey attack) (British Columbia Ministry of Forests 1995). Generally, foliage fades from green to yellow to red during the first spring and summer after attack (Amman 1982; Henigman et al. 1999); leaves gradually desiccate, and pigment molecules break down. Initially, green chlorophyll pigments are lost, then yellow carotenes and red anthocyanins (Hill et al. 1967). Needles drop gradually until the tree is defoliated. In Figure 2, we present the rate at which sampled trees faded in response to attack by mountain pine beetle. During the base year, all trees were at green attack stage. When the same trees were inspected during the summer following the initial attack, some still appeared to be in the green attack stage, while others had faded to red attack. Similarly, red attack and grey attack co-occurred during the second and third summers following attack.
The general trend in fade rates is captured in Figure 3, where the fading of 15 lodgepole pine trees is indicated with the overlap between the expressions of attack stages in crown foliage. Fade trends that should be noted include no trees appearing as green stage after 12 months, all trees reaching red stage by 12 months, and grey stage initially evident after 13 months. Overlap of red and grey stages subsequent to a successful mountain pine beetle attack is also evident. Although this is a limited sample, additional samples support the same trends (refer to Figure 2 error bars for an indication of the range of variability by attack stage). The variability in the rate of change is greater across larger areas as more variability in tree characteristics and environments occurs. In general, red attack surveys should occur from mid-July to mid-September in most of British Columbia. Exact dates depend on local conditions; appropriate dates for other jurisdictions may differ. The implication of variable fade rates is that any non-field-based survey technique, even if it is highly accurate, may not detect all attacked trees, as the attack may not yet be evident in foliage.
In this chapter, we present a summary of the different survey approaches for characterizing mountain pine beetle across a range of scales. The scale, or detail, of a survey is linked to the type of forest management that the data are intended to support (after Shore 1985; British Columbia Ministry of Forests 1995; British Columbia Ministry of Forests 2000). Current operational survey methods include both aerial and ground surveys. Aerial surveys capture the infestation extent and intensity. Ground surveys are conducted on a sample basis to confirm insect species, to evaluate timber killed, to locate and identify trees currently under

128 The Mountain Pine Beetle – A Synthesis of Biology, Management, and Impacts in Lodgepole Pine
48
42
36
30
24
18
12
6
0
Mo
nth
s si
nce
att
ack
(mea
n +
SD
)
Green Red Grey
Ponderosa pineLodgepole pineWestern white pine
Figure 2. Foliage changes following mass attack at 12 sites in the Kamloops Forest District between 1962 and 1967. The foliage conditions of 134 individuals from three different tree species were monitored. Illustrated are the number of months for a sample of mass-attacked trees to reach 100% of a given attack stage; variability is demonstrated between stands (1 standard deviation error bars) and between species.
���
��
��
��
��
�� � �� �� �� �� ��
�������������������
���
����
�����
�����
�����
���
������������
Figure 3. The variability in foliage-fade rate within a sample lodgepole pine stand, post-mass attack (Fountain Valley Site 2, Kamloops Forest District, between 1962 and 1967). This example stand was composed of 15 attacked trees.
Chapter 5 – Detection, Mapping, and Monitoring of the Mountain Pine Beetle 129
attack (green attack), and to collect mensurational data. Survey methods that use digital remote sensing technology (airborne and satellite-based sensors) are emerging. Although not yet in widespread use, some of these data sources are operationally viable and should be considered within the hierarchy of mountain pine beetle-survey methods.
This chapter reviews tools and approaches available to forest managers for the detection, mapping, and monitoring of mountain pine beetle. Survey recommendations, based upon the above survey hierarchy, are also included. The methods presented here are generalizations of techniques currently in use. The types of surveys, or the specific methods used to implement the surveys, may vary by jurisdiction (Churcher and Carlson, 1984).
Aerial survey
Aerial surveys allow observers in fixed- or rotary-wing aircraft to detect red attack trees. Aerial survey methods considered in this chapter include:
• aerial overview sketch mapping;• helicopter-based global positioning systems surveys; and• aerial photography (analogue).
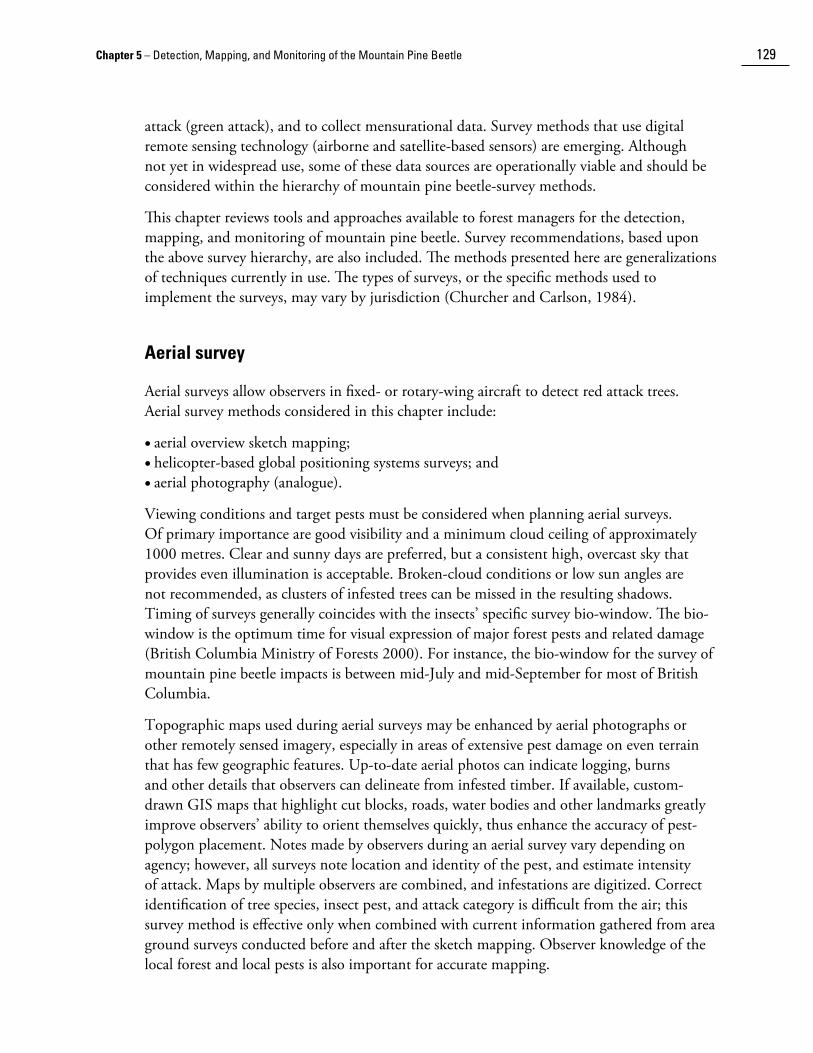
Viewing conditions and target pests must be considered when planning aerial surveys. Of primary importance are good visibility and a minimum cloud ceiling of approximately 1000 metres. Clear and sunny days are preferred, but a consistent high, overcast sky that provides even illumination is acceptable. Broken-cloud conditions or low sun angles are not recommended, as clusters of infested trees can be missed in the resulting shadows. Timing of surveys generally coincides with the insects’ specific survey bio-window. The bio-window is the optimum time for visual expression of major forest pests and related damage (British Columbia Ministry of Forests 2000). For instance, the bio-window for the survey of mountain pine beetle impacts is between mid-July and mid-September for most of British Columbia.
Topographic maps used during aerial surveys may be enhanced by aerial photographs or other remotely sensed imagery, especially in areas of extensive pest damage on even terrain that has few geographic features. Up-to-date aerial photos can indicate logging, burns and other details that observers can delineate from infested timber. If available, custom-drawn GIS maps that highlight cut blocks, roads, water bodies and other landmarks greatly improve observers’ ability to orient themselves quickly, thus enhance the accuracy of pest-polygon placement. Notes made by observers during an aerial survey vary depending on agency; however, all surveys note location and identity of the pest, and estimate intensity of attack. Maps by multiple observers are combined, and infestations are digitized. Correct identification of tree species, insect pest, and attack category is difficult from the air; this survey method is effective only when combined with current information gathered from area ground surveys conducted before and after the sketch mapping. Observer knowledge of the local forest and local pests is also important for accurate mapping.

130 The Mountain Pine Beetle – A Synthesis of Biology, Management, and Impacts in Lodgepole Pine
Aerial survey maps must be supplemented with ground-survey assessments to estimate extent of the beetle population and impact of the infestation. The exact number of affected trees or precise area cannot be efficiently assessed using aerial surveys alone (Harris and Dawson 1979). This limitation results in survey maps on which estimates of intensity are noted as classes, rather than as exact values. Furthermore, location errors due to off-nadir (not directly beneath the satellite) viewing may render some surveys unreliable for dispatching ground crews (Aldrich et al. 1958). For a given area, assessment of aerial-survey accuracy and presence of bias is best determined using a multi-stage sampling procedure where aerial sketch mapping, global positioning system (GPS) point data, aerial photography, and ground plot data are collected and compared, thereby enabling cross-validation.
Aerial overview sketch mapping
The most general approach to detection of an infestation is to sketch map red trees that are visible from a fixed-wing aircraft. Notations are made on topographic maps at scales from 1:100 000 to 1:250 000 over millions of hectares, although provincial agencies in British Columbia occasionally use 1:50 000-scale base maps. While potentially providing greater spatial precision, map scales that are too large result in logistical problems in the aircraft, as too many maps are required to characterize the large territories typically mapped.
Sketch maps provide timely information for strategic planning during epidemics (Heller et al. 1955; Aldrich et al. 1958; Waters et al. 1958). Consistency between observers can be verified with a small number of check flights that repeat sampling of an area. If mapping has been consistent, cumulative mortality in specific stands can be estimated by overlaying successive years of damage (with interpretation, including consideration of photo-acquisition dates and variability in fade rates). Care must be taken to ensure that the above-mentioned scales are considered when undertaking additional analyses, especially if the analyses are spatial in nature. Sketch-map data are collected to represent large areas, often at the regional or provincial level. As a result, disturbance characteristics over the large area are well characterized, but issues related to the accuracy of polygon boundaries may emerge when attempting to integrate the information with spatial datasets representing smaller areas.
Sketch mapping of forest disturbances has a long history in North America. Archival data exists for much of British Columbia and the Pacific Northwest to aid in understanding disturbance activity over time. For instance, there are more than 2100 different maps depicting mountain pine beetle infestations from 1959 to 1995. Other sketch maps of infestations, scanned from archival reports dating back to 1928, have been added to the historical collection on the beetle. Due to the nature of the data collection and digital conversion, positional accuracy is variable and must be considered by users. An additional issue to consider regarding archival data is spatial extents of surveys. For instance, absence of infestation noted at a particular location or time may be due to lack of a spatially exhaustive survey. Flight-line information to accompany sketch-map survey results would ameliorate this issue.
Chapter 5 – Detection, Mapping, and Monitoring of the Mountain Pine Beetle 131
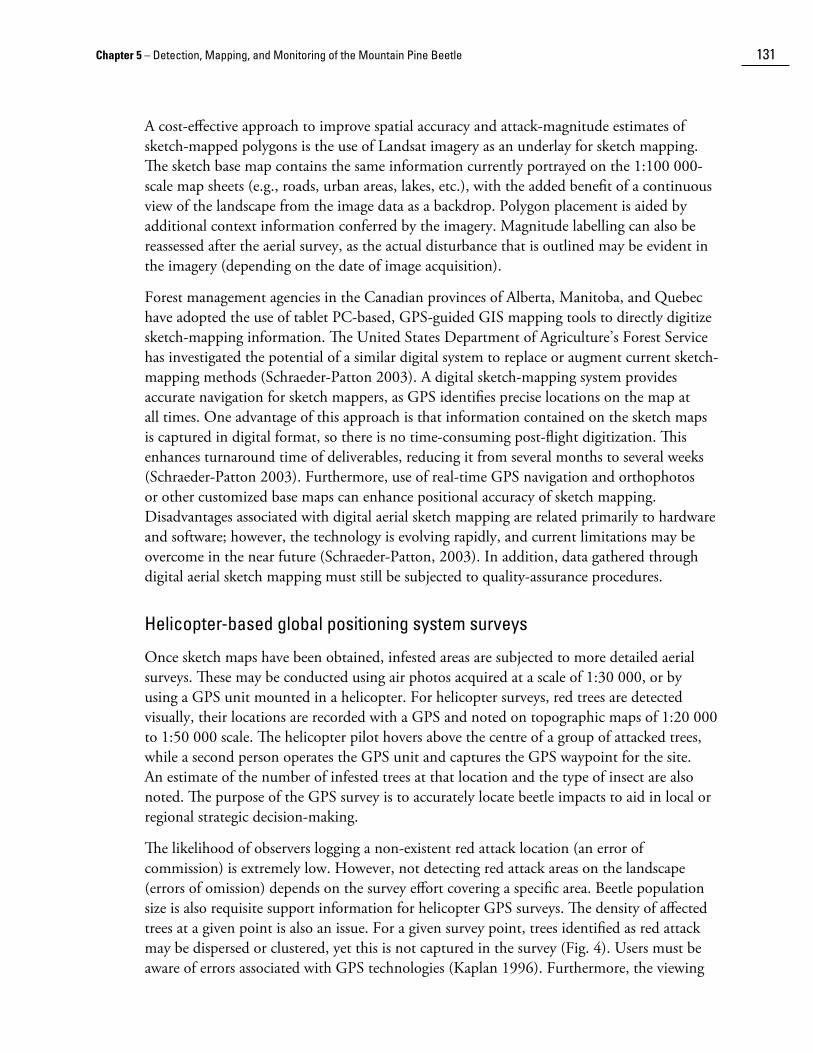
A cost-effective approach to improve spatial accuracy and attack-magnitude estimates of sketch-mapped polygons is the use of Landsat imagery as an underlay for sketch mapping. The sketch base map contains the same information currently portrayed on the 1:100 000-scale map sheets (e.g., roads, urban areas, lakes, etc.), with the added benefit of a continuous view of the landscape from the image data as a backdrop. Polygon placement is aided by additional context information conferred by the imagery. Magnitude labelling can also be reassessed after the aerial survey, as the actual disturbance that is outlined may be evident in the imagery (depending on the date of image acquisition).
Forest management agencies in the Canadian provinces of Alberta, Manitoba, and Quebec have adopted the use of tablet PC-based, GPS-guided GIS mapping tools to directly digitize sketch-mapping information. The United States Department of Agriculture’s Forest Service has investigated the potential of a similar digital system to replace or augment current sketch-mapping methods (Schraeder-Patton 2003). A digital sketch-mapping system provides accurate navigation for sketch mappers, as GPS identifies precise locations on the map at all times. One advantage of this approach is that information contained on the sketch maps is captured in digital format, so there is no time-consuming post-flight digitization. This enhances turnaround time of deliverables, reducing it from several months to several weeks (Schraeder-Patton 2003). Furthermore, use of real-time GPS navigation and orthophotos or other customized base maps can enhance positional accuracy of sketch mapping. Disadvantages associated with digital aerial sketch mapping are related primarily to hardware and software; however, the technology is evolving rapidly, and current limitations may be overcome in the near future (Schraeder-Patton, 2003). In addition, data gathered through digital aerial sketch mapping must still be subjected to quality-assurance procedures.
Helicopter-based global positioning system surveys
Once sketch maps have been obtained, infested areas are subjected to more detailed aerial surveys. These may be conducted using air photos acquired at a scale of 1:30 000, or by using a GPS unit mounted in a helicopter. For helicopter surveys, red trees are detected visually, their locations are recorded with a GPS and noted on topographic maps of 1:20 000 to 1:50 000 scale. The helicopter pilot hovers above the centre of a group of attacked trees, while a second person operates the GPS unit and captures the GPS waypoint for the site. An estimate of the number of infested trees at that location and the type of insect are also noted. The purpose of the GPS survey is to accurately locate beetle impacts to aid in local or regional strategic decision-making.
The likelihood of observers logging a non-existent red attack location (an error of commission) is extremely low. However, not detecting red attack areas on the landscape (errors of omission) depends on the survey effort covering a specific area. Beetle population size is also requisite support information for helicopter GPS surveys. The density of affected trees at a given point is also an issue. For a given survey point, trees identified as red attack may be dispersed or clustered, yet this is not captured in the survey (Fig. 4). Users must be aware of errors associated with GPS technologies (Kaplan 1996). Furthermore, the viewing

132 The Mountain Pine Beetle – A Synthesis of Biology, Management, and Impacts in Lodgepole Pine
Healthy
Red Attack
A B
Figure 4. An illustration of (a) concentrated attack, and (b) dispersed attack (adapted from British Columbia Ministry of Forests 2003).
View Angle
Horizontal Distance from Nadir (m)
500 m flying height 1000 m flying height
0° 0.0 0.01° 8.7 17.52° 17.5 34.93° 26.2 52.44° 35.0 69.95° 43.7 87.56° 52.6 105.17° 61.4 122.88° 70.3 140.59° 79.2 158.410° 88.2 176.3
500
to 1
000
m
10
Figure 5. An illustration of how flying height and view angle can affect positional accuracy of aerially surveyed GPS points.
platform (helicopter) itself is a source of error; slight angles between viewing location and the perceived centre of infestation can affect positional accuracy (Fig. 5). The advantages of helicopter GPS survey over aerial photography are a wider window of survey opportunity, the short turnaround time for mapping survey results, and a wider weather window (more flexible opportunities) than afforded by traditional photography. Another advantage of helicopter GPS surveys is that they allow better identification of the pest agent than photos do, because helicopter surveying permits observers to see the entire tree crown at oblique viewpoints.

Chapter 5 – Detection, Mapping, and Monitoring of the Mountain Pine Beetle 133
Aerial photography
Aerial photography is the most common imagery used in forest inventories for the purposes of characterizing forest attributes and meeting management objectives. Surveys that use aerial photography can be grouped into classes based upon the type of information collected (after Wear et al. 1966):
• damage detection;• damage location; • damage amount; and • estimation of relative size of insect population and its capacity for future damage.
Aerial photography is not as suitable for initial damage detection as visual aerial survey methods are, such as overview sketch mapping. Information regarding the current status of insect populations and potential of the insects to cause future damage is best collected through field surveys. However, aerial photography can be used to generate mortality estimates and precisely locate infested areas. Either normal-colour or colour-infrared photos can be visually interpreted for signs of mountain pine beetle red attack (Murtha 1972). Photos are collected at scales ranging from 1:1 000 to 1:65 000. At a scale of 1:8 000, individual trees can be identified; whereas, at a scale of 1:19 000, only the proportion of forest damage can be estimated (Gimbarzevsky et al. 1992). However, the total area covered by a 1:8 000 photo is much less. Furthermore, results may be affected by the experience of interpreters (Klein 1973). Ground surveys can be used to define confidence limits around mortality estimates generated from aerial photos (Aldrich and Drooz 1967; Harris et al. 1982). For instance, Sharpnack and Wong (1982) present an approach where photos are used to calibrate damage estimates made from attack areas depicted on sketch maps. Photos may also be used independently to sample an area to estimate mortality rates (Hamilton 1981).
In 2004, British Columbia implemented the use of 1:30 000 aerial photography for more detailed detection and mapping of red attack. Photos were acquired in areas that had been identified for suppression in the province’s strategic beetle management plan (British Columbia Ministry of Forests 2001). The air photos were collected between July and mid-September, and were then digitized (scanned). Red attack damage was visually interpreted from the photos using digital photogrammetric software (softcopy), and an output “measle map” of red attack areas was generated (Fig. 6). The photos provide a permanent record of the survey and may be used for other applications, such as updating topographic base maps.
Air photos may be used to generate estimates of damage (or mortality) and to locate infested trees for salvage or to aid in mitigation activities. Air photos may be combined with field data samples to reduce field costs, while still generating robust estimates of infestation location and magnitude (Sharpnack and Wong 1982). A procedure for combining the two data types is double sampling with regression (Wear et al. 1966). The method is based upon the premise that field measurements of damage or mortality are related to what can be interpreted from photos. Where field data is sampled and extrapolated with a regression-based approach using photo measurements, cost savings can be realized when appropriate conditions are met. If the

134 The Mountain Pine Beetle – A Synthesis of Biology, Management, and Impacts in Lodgepole Pine
photo plots are not completed at a substantially lower cost than the collection of field data, such an approach may not be warranted. The general approach, when using double sampling with regression to characterize damage or mortality, is to sample field conditions within a predefined population area. Procedures for combining field- and photo-based estimates are provided in Wear et al. (1966). To compute the area damaged using this regression-based approach, measurements must be made both on the ground and from photographs. The nature of the field sample (i.e., number and distribution of plots) and definition of the population area (i.e., size and shape) must also be correctly specified for robust estimates of damage to be generated. Meeting all statistical and operational requirements of this regression-based approach enables the final calculation of an estimate for total amount of mountain pine beetle damage. Integration of field and photo data in a sampling and regression framework to facilitate estimates of damage over large areas is analogous to the use of field data to calibrate damage estimates made from remotely sensed data.
Figure 6. A sample of a red attack “measle map” generated from the manual interpretation of 1:30 000 colour aerial photography. Individual red points indicate clusters of individual red attack trees. Large polygons indicate areas of more spatially extensive red attack damage. This mapsheet is located near Merritt, British Columbia (092H087), and was provided courtesy of Tim Ebata, British Columbia Ministry of Forests, Victoria, British Columbia.

Chapter 5 – Detection, Mapping, and Monitoring of the Mountain Pine Beetle 135
Ground survey
The objective of ground surveys depends on the management strategy designated for an area. Where precise information on location and number of trees requiring treatment is needed to direct single-tree treatments, ground surveys are designed to pinpoint green attacked trees. This method of ground survey exploits current knowledge of mountain pine beetle behaviour at sub-outbreak levels; this knowledge indicates that mountain pine beetle is most likely to re-attack in close proximity to the red attacked trees. The level of precision that is necessary to determine the status of individual trees requires the most accurate information possible and is usually employed where beetle attacks are at their lowest density. Where the objective is to determine the infestation rate at stand level, systematic surveys – grid lines or cruise plots – are used to obtain an average level of attack per hectare. This information is used in “holding and salvage beetle management units” where harvesting priorities are determined based on the level of new and old attack. Inventory and planning require estimates of average attack (green, red, and grey attack) at the stand and forest levels; therefore, the required precision of ground-survey data is lower.
Ground surveys assess population size, or degree of forest infestation, within a local area. Sample plots are generally less than one hectare in size. Population estimates indicate whether a local beetle population is increasing, static, or decreasing. These estimates provide a coarse index of population trend based on beetle probe surveys conducted across the landscape. Infestation estimates, or damage estimates, indicate the impact of a particular beetle population. Both types of estimates (population and damage) are used to drive selection of the most appropriate management response.
Population assessments may be based upon field surveys or aerial surveys. Field surveys enable brood assessments to be undertaken. Brood assessments are carried out in the late summer to fall, and in the spring. Beginning in mid-July, population surveys with sketch mapping may be undertaken. These aerial surveys influence placement of subsequent ground surveys. Aerial survey data collected during consecutive years may also be compared to indicate population trends.
Brood assessment ground surveys may be done in September to October based upon a timber cruising technique. The timber cruising operation records information such as tree species, diameter at breast height, and pest status (healthy, currently attacked, or partially attacked, pitch outs, and foliage colour) (Shore 1985; British Columbia Ministry of Forests 1995). In the spring following attack, assessment surveys account for overwintering brood mortality and losses to natural enemies such as parasites and predators – particularly woodpeckers (British Columbia Ministry of Forests 1995). A fixed-size bark area (typically 900 cm2) is removed and examined to form a statistically valid sample of trees to determine the stand average trend ratio (Equation 1) and the percent overwintering mortality (Equation 2) (Shore 1985).

136 The Mountain Pine Beetle – A Synthesis of Biology, Management, and Impacts in Lodgepole Pine
The average trend ratio (r) for each stand is determined as follows:
[1]
Where,
y = number eggs and larvae o = number pupae and adults g = number of galleries t = number of sampled trees
Percent of overwintering mortality may subsequently be computed for each stand as:
[2]
The results are used to indicate population trend. For instance, average population trend ratios can be interpreted as follows: if the result of r is less than 2.6, the population is decreasing; if the value of r ranges from 2.6 to 4.0, the population is static, and; if r is greater than 4.0, the population is increasing. These values are heuristic in nature and should be used to support interpretation, not to act as the sole source of information on trends of a given population. Population trends may also be inferred from aerial photographs, with the area, or count, of red attacked trees compared over successive years. This relationship is useful as an indicator of general population trend; however, this relationship should not supplant brood assessments.
Brood assessments are carried out in the months following fading of foliage to red, which indicates trees attacked in the previous year (the survey should begin approximately mid-July). The survey locates green attacked trees containing mountain pine beetle broods that will be the source of future infestations. Any survey system similar to prism or strip cruising will usually work. Surveys start near red trees, and progress outward in a grid or other systematic pattern to locate currently attacked trees. Crews must be well trained before they begin, and their work must be checked periodically; the extra time needed to properly train and check crews cannot be neglected, as correct identification of both pest and attack category (Table 1) is critical to the success of the ground survey effort.
Infestation-assessment techniques range from simple identification of trees under attack to a complete mensuration of the infestation. Walk-throughs are used largely as initial ground-reconnaissance surveys to determine characteristics of attacked stands and to contribute towards identifying information needs for more intensive surveys. Probes are systematic strip surveys that collect more detailed information than do walk-through surveys.

Chapter 5 – Detection, Mapping, and Monitoring of the Mountain Pine Beetle 137
Table 1. Definition of mountain pine beetle attack categories
Attack Category Definition
Endemic Mountain pine beetles attack and kill stressed trees, often in concert with secondary bark beetle species.
Incipient Mountain pine beetle population within a stand is sufficiently large that healthy trees are killed. The killed trees usually occur in patches of various sizes and are generally confined to limited areas (e.g., stands).
Outbreak or Epidemic Mountain pine beetle population and tree mortality occur at the landscape level.
Probe information is compiled on a polygon basis and includes attributes such as: location on map; size of beetles under bark; relative brood success; percentage of attack category; rate of spread; and stems per hectare (British Columbia Ministry of Forests 1995). Although useful, these survey techniques do not provide sufficient information for assessment of volume or area infested. Prism cruises, on the other hand, are used for detection and impact assessment, in which volume affected can be estimated on a stand-level basis. Line transects are also used for detection and impact assessment, and are more efficient than prism cruising (Safranyik and Linton 2002). With these data, affected volume and area can be estimated from the survey, and may be statistically extrapolated to represent larger areas. An additional means to characterize the population trend of a mountain pine beetle infestation is by calculating a green-to-red ratio. A green-to-red ratio is the estimated number of currently attacked trees compared to the number of red attacked trees. This ratio provides a rough indication of population growth.
Digital remote sensing
Digital remote sensing involves the use of sensors (mounted on either airborne or satellite platforms) that collect digital imagery of various spatial and spectral resolutions. Extensive research has been conducted into the use of digital remote sensing for detection and mapping of various stages of mountain pine beetle infestation. This chapter presents both airborne-based and satellite-based sensors, and then summarizes mapping methods for green, red, and grey attack. One advantage of using digital images in mapping red attack stage trees is that the images represent continuous data across a landscape. In this way, all areas in the image are examined for possible red attack, independent of accessibility or position in a watershed. Another advantage of mapping from remotely sensed digital imagery is the reduction or elimination of interpreter bias afforded by automated classification algorithms. By avoiding visual interpretation, products have greater consistency and reliability between different areas or dates. Increased reliability also results from the high positional accuracy

138 The Mountain Pine Beetle – A Synthesis of Biology, Management, and Impacts in Lodgepole Pine
of image data compared to aerial survey data. The standard geometric pre-processing of satellite images results in data that can be confidently integrated with forest inventory polygons and other spatial data sets (e.g., elevation data, road access). Results of analyses of remotely sensed data are typically subjected to accuracy-assessment protocols, and this is an element unique to remote sensing analyses compared to the more heuristic assessments of aerial survey products. Accuracy of an attribute, such as red attack, may be characterized in relation to an independent validation dataset. Use of an independent validation dataset allows for characterization of accuracy, in terms of correct identification and distribution of error. Infested areas that are missed and, conversely, locations that are falsely indicated, may also be characterized (for theory, see Congalton 1991; for an example, see Franklin, S.E. et al. 2003).
Issues to be considered when planning to map mountain pine beetle red attack using digital imagery include the spatial, temporal, spectral, and radiometric resolution of the imagery. Spatial resolution, or pixel size, ranges from less than one metre to more than one kilometre for different sensors. Similar to the collection of aerial photography, there is a trade-off between improving spatial resolution and both reducing image extent and increasing costs (Franklin et al. 2002). An understanding of the link between sensor acquisition characteristics and subsequent image-information content is critical to the success of a mapping exercise (Lefsky and Cohen 2003). For instance, the ability to discern differing objects on a landscape is linked to spatial resolution (Franklin, J. et al. 2003). If a single pixel is composed of more than one element (e.g., part tree crown, part shadow, part ground vegetation), the pixel represents the collective spectral characteristics of those elements. Spectral signatures that are developed in such instances have suppressed variances that diminish the power of predictive algorithms. However, when a single pixel represents only one element (e.g., a portion of a tree crown), the spectral signature is unique to that pixel (e.g., Wulder and Dymond 2004). The sensitivity to spectral differences between red attack and healthy trees (spectral resolution) also varies between different sensors. However, sensitivity to the condition of vegetation is a high priority for developers of satellite sensors, resulting in many detection options for the end user.
Temporal resolution, or image-acquisition frequency, affects the sensor’s ability to collect information regarding a particular attack stage. Airborne digital sensors can capture image data on cloud-free days that correspond to the bio-window for red attack detection, when feasible or possible. Typically, satellite sensors have fixed revisit rates, such as 16 days between acquisitions of Landsat scenes over an area. The revisit cycle is based upon factors such as sensor elevation, orbit characteristics, and scene footprint. New high spatial resolution space-borne satellites, such as IKONOS and QuickBird, have directable sensor heads, which enable capture of images for areas other than those located directly below the sensors. Imagery collected off-nadir (not directly beneath the satellite) should be inspected and used with caution as the altered view angle affects how the forest is characterized.
The key to employing digital data for mapping mountain pine beetle impacts is to match the information needs of forest managers with image information content and resolution characteristics. For example, under endemic conditions, information needs are for detection

Chapter 5 – Detection, Mapping, and Monitoring of the Mountain Pine Beetle 139
of single and small clusters of red attack trees. To produce this information, the imagery must have sufficiently high spatial and spectral resolution. In contrast, under epidemic conditions, information needs are for quantifying the impact of large groups of red attack trees over large areas. Therefore, less expensive imagery with medium spatial resolution and moderate spectral resolution would be sufficient.
One advantage of digital imagery is that it may be geocorrected (two dimensions) or orthorectified (three dimensions); these corrections facilitate integration of the remotely sensed imagery with other spatial datasets, such as forest inventory polygons or GPS point data. These corrections also make it possible to compare images collected over multiple years, thereby providing an important monitoring tool. Additional strengths supporting the use of digital data are that objective, repeatable analyses of the data are carried out with equal effort across the landscape, and that digital techniques are applied in a systematic, consistent, and transparent manner. These features help reduce inconsistencies that may result from visual interpretation. Main impediments to widespread use of digital data are sophisticated processing needs, costs per hectare, and a mismatch between user needs and results generated. The use of aircraft results in similar considerations for airborne imagery collection as for aerial surveys. Days that are best for data collection have even-light conditions, without clouds or with high, overcast cloud. Timing of flights would occur when trees are in the red attack stage.
Airborne platforms
Digital images may be collected from airborne platforms above areas identified as infested during aerial surveys. The key differences between digital airborne imagery or aerial photography and aerial overview sketch mapping or ground surveys are that the spectral characteristics of the entire forest are permanently captured in the imagery for that particular location and time, and the data can later be re-examined if uncertainties occur. Digital airborne imagery includes traditional air photos scanned into digital format (Nelson et al. 2001), digital camera images, videography, multispectral scanners, and imaging spectrometers. Airborne images may be used to map the location of small clusters or scattered red trees. The results are used to direct ground surveys or to dispatch ground crews for sanitation treatment. The airborne digital imagery may be subjected to enhancements that highlight locations of red attacked trees (Fig. 7). Digital camera technology is sufficiently sophisticated for direct image capture. Most high-quality digital cameras are based on modified 35-mm or medium-format cameras. The spatial and spectral resolutions of these cameras match the quality of medium-speed film (Graham and Koh 2002). The digital format eliminates the developing and scanning necessary for film-based photographs to be analyzed in softcopy format.
Airborne scanners and imaging spectrometers collect digital images directly, similar to digital cameras. The spatial resolution (from less than 1 m to greater than 10 m) and the sensitivity to different wavelengths of energy can be adjusted to address particular information needs. Red attack trees can be successfully detected, and the digital nature of the data provides for rapid integration with other digital datasets (Kneppeck and Ahern 1989; Ahern et al. 1986).

140 The Mountain Pine Beetle – A Synthesis of Biology, Management, and Impacts in Lodgepole Pine
Figure 7. Red attack trees depicted on a high spatial resolution digital colour aerial photograph (collected with a 30-cm pixel). This photo was acquired by Terrasaurus Ltd. on September 24th, 2004 at a site near Merritt, British Columbia. Photo provided courtesy of Jamie Heath, Terrasaurus Ltd., Vancouver, British Columbia.
Airborne scanners have not found wide operational implementation for mapping mountain pine beetle red attack, due largely to high per-hectare costs.
Aerial videography provides some operational advantages over air photos: lower cost; no delay for photographic development; the option to include audio commentary; and high light sensitivity (Ciesla 2000). Additionally, camera settings can be adjusted as the imagery is acquired during data collection. Similar to most airborne sensors, the disadvantages are primarily associated with image extent and resolution characteristics. Otherwise, planning and processing options that are available are similar to those of the digital camera systems described above.
Satellite platforms
Satellite images may be collected to map infested areas over a range of scales. Satellite imagery is similar to airborne imagery in that the data is continuous across the extent of the sampled area. In general, the comparatively high orbits of satellite systems result in a more favourable viewing geometry when compared to the low altitudes of airborne systems. Airborne systems often generate data requiring sophisticated processing to compensate for aircraft motion, view angles, and variable illumination conditions throughout the acquisition period. Satellite images are available across a range of spatial, spectral, and temporal scales. Therefore, they can be used to address a variety of strategic and tactical planning decisions. The large image extents of satellite imagery enable economies of scale (based on cost per hectare).

Chapter 5 – Detection, Mapping, and Monitoring of the Mountain Pine Beetle 141
Mapping of red attack trees under epidemic conditions has been documented using satellite imagery. Due to the large cluster sizes and landscape-scale extent associated with epidemic conditions, low-cost imagery from Landsat Thematic Mapper (TM) (single date) has been used to successfully map mountain pine beetle infestations (Franklin, S.E. et al. 2003). However, higher accuracy of red attack mapping resulted when multi-temporal Landsat TM and Enhanced Thematic Mapper (ETM+) datasets were used (Skakun et al. 2003). Although the Landsat mapping efforts have generated products representative of landscape-level characteristics, the higher spatial resolution satellites capture characteristics at the stand or tree level, and have potential for surveying under incipient population conditions. Wulder et al. (2005a) demonstrated that the ability to detect red attack with multi-temporal Landsat data decreases with increasing time since attack. By using one Landsat image collected in 1996 and another in 2001, a multi-temporal classification of the image was completed, as per methods described in Franklin, S.E. et al. (2003). Helicopter GPS data collected annually from 1995 to 2001 were used to validate the classification. The results (Table 2) indicate that recent red attack was more successfully detected than older red attack, suggesting that monitoring surveys that examine long-term impacts and forest change resulting from an infestation of mountain pine beetle have a limited temporal window for completion. The strong spectral signal of the red attack stage of mountain pine beetle infestation diminishes over time as foliage of infested trees gradually fades from red to grey.
Commercially delivered, high spatial resolution satellite data are a potential source for cost-effective collection of accurate, consistent, and timely data regarding mountain pine beetle red attack. IKONOS provides global coverage, a consistent acquisition schedule, and near-nadir viewing angles. The resolution of the sensor is suitable for high-accuracy photogrammetric processing and mapping applications (Tao et al. 2004). In addition, the IKONOS 4-metre multispectral channels have similar spectral properties in the visible and near-infrared wavelengths as the Landsat ETM+ channels (Goward et al. 2003). The IKONOS sensor has four 4-metre multispectral bands centred at 480.3 nm, 550.7 nm, 664.8 nm, and 805.0 nm, respectively. Average bandwidth of these multispectral bands is 80 nm. In contrast, the single IKONOS 1-metre panchromatic band is centred at 727.1 nm, and has a bandwidth of 403 nm. The large bandwidth of the panchromatic channel results in lower spectral sensitivity. The implications of this are that, despite its high spatial resolution, this band cannot be used to detect mountain pine beetle red attack. Other high spatial resolution sensors, which offer both panchromatic and multispectral bands, have similar limitations.
White et al. (2004) investigated the merits of using IKONOS 4-metre multispectral data at a study site near Prince George, British Columbia (Fig. 8). The project examined use of an unsupervised clustering of image spectral values to detect mountain pine beetle red attack at susceptible sites (i.e., with known risk factors for infestation) that were considered to be lightly infested (1% to 5% of trees red attacked) or moderately infested (greater than 5% and less than 20% trees red attacked). A 4-metre buffer (analogous to a single IKONOS pixel) was applied to the red attack pixel identified on the IKONOS imagery in order to account for positional error. When compared to an independent set of validation data, it was found that 70.1% (lightly infested sites) and 92.5% (moderately infested sites) of the red attack

142 The Mountain Pine Beetle – A Synthesis of Biology, Management, and Impacts in Lodgepole Pine
trees existing on the ground were identified correctly through classification of remotely sensed IKONOS imagery. Analysis of red attack trees missed in the classification of the IKONOS imagery indicated detection of red attack was most effective for larger tree crowns (diameter >1.5 metres) that were less than 11 metres from other red attack trees.
Other high spatial resolution satellite data, such as QuickBird, may offer potential for red attack mapping. New commercial high spatial resolution satellites are scheduled for deployment over the next 5 to 10 years – further increasing options for the detection and mapping of red attack (Glackin and Peltzer 1999).
Table 2. The characterization of red attack detection accuracy using multi-temporal Landsat TM (1996) and ETM+ (2001) imagery. Validation data was collected each year from 1995 to 2001. Generally, measures of producers’ and users’ accuracies decrease with increasing time since the initial attack.
Time since trees turned
red
Year of validation
points
Number of red attack validation
points
Number of correctly classified points
Producers accuracy
(%) 1 (90% confidence intervals)
Users accuracy (%) 2
(90% confidence intervals)
1– 2 months 2001 204 162 79 (73 84) 76 (70 81)1 year 2000 213 172 81 (75 86) 77 (71 82)2 years 1999 215 165 77 (71 82) 76 (70 81)3 years 1998 193 140 73 (66 79) 73 (66 79)4 years 1997 290 215 74 (70 78) 81 (77 85)5 years 1996 221 146 66 (59 72) 74 (67 80)6 years 1995 164 112 68 (61 74) 68 (61 74)
Totals 1500 1112 74 (73 76) 75 (74 77)
1 A measure of the accuracy of a particular classification scheme, this shows what percentage of a particular ground class was correctly classified. Accuracy is calculated by dividing the number of correct pixels for a class by the actual number of ground truth pixels for that class.
2 A measure of the reliability of an output map generated from a classification scheme. This statistic can tell the user of the map what percentage of a class corresponds to the ground-truthed class. Users accuracy is calculated by dividing the number of correct pixels for a class by the total pixels assigned to that class.

Chapter 5 – Detection, Mapping, and Monitoring of the Mountain Pine Beetle 143
Figure 8. A portion of an IKONOS image acquired near Prince George, British Columbia (approximately 64 km2). Mountain pine beetle red attack is visible in the image. ©2002 Space Imaging Inc. All rights reserved.
Mapping methods
Green attack stage
Detecting green attack trees is a sought-after, yet elusive goal for remote sensing researchers. Water stress in mass-attacked trees has been detected at the leaf and branch scales (Murtha 1985; Ahern 1988; Rock et al. 1988). However, some studies have found detection difficult when other image elements were integrated into the analysis (foliage, branches, and other background objects) (Puritch 1981). The key issue in mapping green attack is the subtle change in the spectral signal of the foliage. In order to detect this change, the number of objects within a pixel must be minimized and the relative differences maximized; this requires a sensor with both high-spatial and high-spectral resolution. To objectively classify such data, calibration data collected in the field must be precisely located and be representative of the green attack stage. The spatial resolution of the sensor must be sufficiently high that individual pixels represent only sunlit foliage in a tree crown. In turn, the spectral resolution of the sensor must also be sufficiently fine, with sufficiently sensitive optics, to enable a unique spectral signature to emerge that represents the green attack stage.

144 The Mountain Pine Beetle – A Synthesis of Biology, Management, and Impacts in Lodgepole Pine
Regardless of the technical limitations of successfully detecting green attack, there are substantial logistical limitations to the operational feasibility of undertaking a survey intended to capture the green attack stage of a mountain pine beetle infestation. Current methods of identifying green attack use known locations of existing red attack as a starting point to search for probable locations of green attack. Therefore, for a green attack survey method to be significantly better than the current method, large areas of healthy forest would have to be surveyed annually to identify green attack trees. These surveys would require the use of data that has both high-spatial and high-spectral resolution, and the data would have to be collected at the appropriate time of year. Selecting an appropriate time to conduct a survey is difficult, because the rate at which foliage of a tree crown shows symptoms of a mountain pine beetle attack is variable (this applies across all stages of attack, not to only the green stage). The fading of foliage in the crown of a tree infested with mountain pine beetle is not a consistent, linear process (Fig. 2). Additional insights on variability in fade rates and associated detection possibilities can be found in Roberts et al. (2003).
The earlier the detection of attack is attempted, the higher the omission rate of actual green attack trees will likely be. This variability in timing requirements for green attack surveys necessitates continuous monitoring of an area for a set period of time each year, if the survey is to be effective. Environmental aspects such as cloud cover, drought stress or snow accumulations may further impair detection capabilities. In addition to these data-collection constraints, field calibration, data processing, product development (maps of known areas of green attack), and product delivery must all occur within a time period that enables the forest manager to act upon the information generated. Furthermore, accuracy of green attack detection must be high if it is to be useful in a management context. The costs of remotely sensed green attack surveys must also be lower than the costs of existing field survey methods. Given the current high cost of high-spatial and high-spectral resolution data, and the large areas and periods of time involved, it is unlikely that such a survey method would be cost effective in an operational context.
Red attack stage
Detecting and mapping red attack trees has been successful at various scales and with a variety of digital sensors. However, research has been largely targeted towards a specific set of conditions, and accuracy-assessment protocols have been inconsistent. Therefore, the ability to map red attack with different tools, under different conditions and attack intensities, requires additional research before being considered operational.
A key issue in mapping red attack trees is the size of clusters of red trees. The spectral difference between red attack and healthy trees is detectable under some conditions with some spectral mixing of pixels (Franklin, S.E. et al. 2003). If the cluster of red attacked trees is large, with attacked trees concentrated, ability to map the attack accurately is improved. The larger the cluster, the lower the spatial and spectral resolution required of the sensor. This relationship translates into low per-hectare costs for mapping epidemic conditions.

Chapter 5 – Detection, Mapping, and Monitoring of the Mountain Pine Beetle 145
The highest accuracy in digitally mapping red attack has resulted when multi-temporal data were used. For the most accurate results, multi-temporal sets of images should be taken from the same sensor view angle and under similar illumination conditions. Otherwise, differences between two images may be an artifact of the data collection process, and may obscure subtle changes in the landscape. For the same reason, similar radiometric and other corrections must be applied to each image (Peddle et al. 2003). It is common practice to geometrically correct a master image, then register all subsequent images to it, with an error of less than one pixel (also known as rubber-sheeting). This approach optimizes the likelihood that detected changes reliably indicate the situation on the ground.
Assigning agents to areas of detected change within a landscape can be the most difficult aspect of the remote sensing project. Foliage fading (appearing red or yellow) can occur for many reasons, including mountain pine beetle, other pests and diseases, drought, or senescence. Additional data can help at this point; a digital elevation model and an inventory of forest species can eliminate forests not susceptible to mountain pine beetle (Shore and Safranyik 1992). Furthermore, ground-validation or forest inventory data can help eliminate other agents.
Spatial processing of the image or ancillary data can help improve the accuracy of mapping of red attack. One approach is to stratify the area into susceptible and non-susceptible stands or trees, based on entomological pest-host models (Shore and Safranyik 1992). This enhances spectral differences between non-attacked and red attack areas. Franklin, S.E. et al. (2003)Franklin, S.E. et al. (2003) found that damage caused by mountain pine beetle was not confounded by uncontrolled natural stand variability or the relatively small spectral influence of a few damaged crowns within a small area. Another key element of satellite-image processing is to incorporate the temporal aspect of the change. This means using multi-date or multi-temporal imagery where detection of change is based on differences in the forest from year to year. An example of this analysis approach for mapping red attack incorporates multi-temporal data with a transformation of spectral data in calculating the Enhanced Wetness Difference Index (EWDI) (Skakun et al. 2003).
Grey attack stage
Detection and mapping of grey attack trees has been as accurate as mapping of red attack when it is included in the study design (Klein 1973; Harris et al. 1982; Gimbarzevsky et al. 1992). However, these studies tested only air-photo interpretation. Extensive research indicates that techniques developed for assessing forest impacts similar to grey attack (but caused by defoliators) may be used for assessing the magnitude of impact of a mountain pine beetle infestation (as indicated by the presence of grey attack trees). The primary issue for mapping grey attack is the time between attack and when data are collected. If grey attack trees are not harvested, impediments to their detection may include blow-down, development of neighbouring crowns of healthy trees, development of understory species, and vigorous growth of ground cover. Intuitively, use of data from a single date may be adequate for grey attack mapping because the difference between healthy and defoliated

146 The Mountain Pine Beetle – A Synthesis of Biology, Management, and Impacts in Lodgepole Pine
trees is relatively large; however, in practice, the range of spectral variability representing grey attack stage is large, and often impedes robust algorithm development. Multi-temporal imagery may be required to consistently map grey attack stage. Care must be taken to differentiate changes due to mountain pine beetle from other changes occurring on the landscape in the intervening time. The mapping of red attack and the later inference of grey attack may be a more robust approach because of the unique spectral signature of red attack (single date) and the greater multi-date spectral differences. When mapping or accounting for areas that have been impacted by mountain pine beetle, access to salvage harvest records will also be required. Grey attack is not captured by the annual aerial overview surveys, so other methods to detect grey attack may be important for studies looking at the long-term consequences of the current epidemic.
Data integration
Forest inventory datasets are developed over a timeframe that allows for photo commissioning, collection, interpretation, and digitization (Gillis and Leckie 1996). Data capture for a forest inventory often happens on a 10-year cycle. Forest disturbance, such as that caused by mountain pine beetle, can occur within an inventory cycle. A forest inventory database requires maintenance over time or the data can quickly become outdated. Polygon decomposition was developed as a tool to integrate different data layers, such as aerial survey data or satellite image classifications, with existing GIS data to provide timely and accurate estimates of forest change (Wulder and Franklin 2001). Remotely sensed estimates of red attack are easily integrated with the forest inventory data (Fig. 9). Integration facilitates the polygon-specific accounting of areas or proportions of individual forest stands (Wulder et al. 2005b;). Other products generated from remotely sensed data that may be useful for beetle management include inventory updates, change detection, and performance monitoring of harvesting (i.e., how much of the infestation was cut per year by the licensee).
Detection and mapping of mountain pine beetle impacts can also be integrated into decision support systems. Various models exist to aid managers in the planning and treatment of forests with mountain pine beetle populations. One type of model assesses the infestation risk of different forest stands (Shore and Safranyik 1992; Chojnacky et al. 2000). Spatially explicit models, such as that developed by Fall et al. (2002), may also capitalize on input of remotely sensed estimates of infestation locations, to aid in providing baseline data for course projections of future outbreaks. These models require information on the current locations of attacked trees to predict possible future risk. The attack maps generated through remote sensing can be used as input to these models. For example, the forest inventory and digital elevation data provide a rating of susceptibility for each stand (Shore and Safranyik 1992). Overlaying the point data from a detailed aerial survey provides intuitive information, but additional utility is found by integrating this detailed data into the model to generate a relative risk index (Fig. 10).

Chapter 5 – Detection, Mapping, and Monitoring of the Mountain Pine Beetle 147
Figure 9. An illustration of the integration of mountain pine beetle maps into forest management information systems. Undisturbed forest management stands are shaded by site index. Stands disturbed by mountain pine beetle are shaded by the area of red attack in the stand (number of hectares), shown in the upper tile; or proportion of red attack in the stand (percent polygon area), depicted in the lower tile. As indicated in the legend shared by both tiles, harvested stands are shaded grey.
Management options and recommendations
Field-based methods for detection of mountain pine beetle are well established and routinely undertaken by forest managers. Mitigation and harvest-planning decisions are based upon these field surveys. Intensive field surveys benefit from more spatially extensive survey techniques, operating in an information hierarchy, that enable stratification of the landscape which can be used to focus field surveys in areas most likely to be impacted by mountain pine beetle.

148 The Mountain Pine Beetle – A Synthesis of Biology, Management, and Impacts in Lodgepole Pine
Figure 10. An illustration of the integration of global positioning data with the Shore and Safranyik (1992) mountain pine beetle risk rating system.
Provincial and state governments are interested primarily in detection of red attack trees within their political boundaries (Wiart 2003). This information is used for reporting and strategic planning. At this scale, aerial sketch mapping is the recommended approach. To provide additional information regarding attack intensity and location of red attack, mapping approaches based upon medium-resolution satellite imagery may be used. Additionally, to determine attack date in order to aid shelf-life studies, a change-detection framework may be used that incorporates time-series analyses of multiple images. Also of interest at provincial or state levels is the use of samples of high-spatial resolution satellite data or aerial photography to provide accurate and independent estimations of red attack over large population areas. These samples of red attack locations may be used to validate disturbance magnitude and estimates of affected area on a management-unit level (following an approach akin to the double sampling procedure previously described for air photos).
Forest licensees and government agencies require detection and mapping of infestations (red attack and grey attack trees) across their land bases. Aerial sketch maps do not capture areas of grey attack, and at the landscape scale, sketch maps may not offer sufficient detail regarding red attack. Medium- to high-spatial resolution satellite or airborne imagery is recommended for red attack mapping at the landscape level. Medium spatial resolution imagery is recommended under epidemic conditions, whereas high spatial resolution imagery is more appropriate for non-epidemic conditions. Aerial photographs, which are often collected to meet other management needs, are also an appropriate source of information for red attack mapping. Integration of red attack locations into the forest inventory is useful as new attributes, such as the area or proportion of a polygon expected to be at red attack stage, enable synergistic applications with forest inventory data and models.

Chapter 5 – Detection, Mapping, and Monitoring of the Mountain Pine Beetle 149
For instance, other attributes in the forest inventory database may be used to validate results of red attack mapping. Layout, access, and operability are examples of elements that may be combined with red attack information to aid forest managers. Integration of red attack mapping data with forest inventory data is a low-cost approach to updating or auditing the forest inventory data within forest inventory measurement cycles.
At the individual forest stand scale, forest licensees require detailed maps of red attack to determine locations where field crews should be deployed to conduct detailed ground surveys. At this scale, high-spatial resolution imagery – either satellite or airborne – is required to map areas affected by red attack with sufficient degree of detail. Field crews conduct ground surveys in identified red attack areas in order to confirm estimates of red attack and to identify trees that are currently infested (green attack). Established field techniques are appropriate for in situ determination of mountain pine beetle attack; it is the only method that provides reliable estimates of green attack.
Conclusions
For any survey methodology intended to meet forest management needs induced by mountain pine beetle activity, it is critical to link information needs to the type of survey undertaken. Survey data are inherently tied to scales of information, with attendant expectations of both attribute and spatial accuracies. Higher-order information needs (e.g., detailed counts of trees attacked per stand for volume-impact estimation) may require an information hierarchy in which multiple sets of survey data, collected with increasing levels of detail, are nested together. For example, using lower-cost, coarse-level overview survey information to guide more-intensive survey sites enables cost efficiencies. Understanding the information content of a range of data sources, as presented in this chapter, increases the ability to judiciously select the most appropriate data source to populate the information hierarchy. Ultimately, this information hierarchy is used to meet the mandates of mountain pine beetle mitigation and management.
Many new survey options are available, including an array of sensors mounted on both airborne and satellite platforms. These options for detecting and mapping impacts of mountain pine beetle infestation must be considered in relation to the information needs and business drivers of forest managers. These new technologies are populating the information hierarchy at levels between the data provided by coarse aerial overview surveys and the data collected through detailed field surveys. Limitations of the technologies must be acknowledged and considered within an operational framework; in particular, forest managers must be aware of the technical and logistical limitations associated with using remotely sensed data for green attack detection. Finally, integration of survey data, regardless of its origin, within existing forest inventory data in a GIS environment generates value-added information for forest managers. The forest inventory also provides a context and a source of validation data for information extracted from remotely sensed data.

150 The Mountain Pine Beetle – A Synthesis of Biology, Management, and Impacts in Lodgepole Pine
Acknowledgements
We are grateful to Les Safranyik, of the Canadian Forest Service, for provision of the data used to develop Figures 2 and 3, and to Tim Ebata, of the British Columbia Ministry of Forests, for providing the data used to generate Figure 6. Figure 7 was provided courtesy of Jamie Heath, of Terrasaurus Ltd.
References
Ahern, F.J. 1988. The effects of bark beetle stress on the foliar spectral reflectance of lodgepole pine. International Journal of Remote Sensing 9:1451–1468.
Ahern, F.J.; Bennett, W.J.; Kettela, E.G. 1986. An initial evaluation of two digital airborne images for surveying spruce budworm defoliation. Photogrammetric Engineering and Remote Sensing 52:1647–1654.
Aldrich, R.C.; Drooz, A.T. 1967. Estimated Fraser fir mortality and balsam woolly aphid infestation trend using aerial colour photography. Forest Science 13:300–313.
Aldrich, R.C.; Heller, R.C.; Bailey, W.F. 1958. Observation limits for aerial sketch-mapping southern pine beetle in the southern Appalachians. Journal of Forestry 56:200–202.
Amman, G.D. 1978. Biology, ecology and causes of outbreaks of the mountain pine beetle in lodgepole pine forests. Pages 39–53 in A.A. Berryman, G.D. Amman and R.W. Stark, eds. Theory and practice of mountain pine beetle management in lodgepole pine forests, Symposium proceedings, April 25-27, 1978, Pullman, WA. University of Idaho, Moscow, WA.
Amman, G.D. 1982. The mountain pine beetle – identification, biology, causes of outbreaks, and entomological research needs. Pages 7-12 in D.M. Shrimpton, ed. Proceedings of the Mountain Pine Beetle Problem Review, November 3-4, 1981, Fairmont Hot Springs, BC. Canadian Forest Service, Victoria, BC, Information Report BC-X-230.
Belton, E.M.; Eidt, D.C., eds. 1999. Common names of insects in Canada. The Entomological Society of Canada, Ottawa, ON. Also available online at http://esc-sec.org/menu.htm.
British Columbia Ministry of Forests. 1995. Bark beetle management guidebook (Forest Practices Code). Forest Practices Branch, Victoria, BC, 45 p.
British Columbia Ministry of Forests. 2000. Forest health aerial overview survey standards for British Columbia, Version 2.0. Forest Practices Branch and Canadian Forest Service, Victoria, BC, 48 p.
British Columbia Ministry of Forests. 2001. West-Central BC mountain pine beetle action plan 2001. Forest Practices Branch, Victoria, BC, 15 p.
British Columbia Ministry of Forests. 2003. Timber supply and the mountain pine beetle infestation in British Columbia. Forest Analysis Branch, Victoria, BC. 27 p.
Canadian Council of Forest Ministers. 2003. Compendium of Canadian forestry statistics. National Forestry Database: http://nfdp.ccfm.org/.

Chapter 5 – Detection, Mapping, and Monitoring of the Mountain Pine Beetle 151
Chojnacky, D.C.; Bentz, B.J.; Logan, J.A. 2000. Mountain pine beetle attack in ponderosa pine: Comparing methods for rating susceptibility. USDA Forest Service, Rocky Mountain Research Station, Fort Collins, CO. RMRS-RP-26. 10 p.
Ciesla, W.M. 2000. Remote sensing in forest health protection. USDA Forest Service, Rocky Mountain Research Station, Fort Collins, CO. FHTET Report No. 00-03. 266 p.
Congalton, R. 1991. A review of assessing the accuracy of classifications of remotely sensed data. Remote Sensing of Environment 37:35–46.
Churcher, J.J.; Carlson, J.A. 1984. A study of methods currently in use in Canada to harvest or salvage or treat lodgepole pine stands affected by the mountain pine beetle. Progressive Forest Management Systems Ltd., Vancouver, BC, 87 p.
Dial, G.; Bowen, H.; Gerlach, F.; Grodecki, J; Oleszczuk, R. 2003. IKONOS satellite, imagery and products. Remote Sensing of Environment 88(1–2):23–36.
Fall, A.; Sachs, D.; Shore, T.; Safranyik, L.; Riel, B. 2002. Application of the MPB/SELES landscape-scale mountain pine beetle model in the Lakes Timber Supply Area Final Report. British Columbia Ministry of Forests, Forest Practices Branch, Victoria, BC, 29 p.
Franklin, J.; Phinn, S.R.; Woodcock, C.E.; Rogan, J. 2003. Rationale and conceptual framework for classification approaches to assess forest resources and properties. Pages 279–300 in M.A. Wulder and S.E. Franklin, eds. Remote sensing of forest environments: Concepts and case studies. Kluwer Academic Publishers, Boston, MA.
Franklin, S.E.; Wulder, M.A.; Skakun, R.S.; Carroll, A.L. 2003. Mountain pine beetle red attack damage classification using stratified Landsat TM data in British Columbia, Canada. Photogrammetric Engineering and Remote Sensing 69:283–288.
Franklin, S.E.; Lavigne, M.; Wulder, M.; Stenhouse, G. 2002. Forest change detection and landscape structure mapping in Canada’s model forests: The role of satellite remote sensing. Forestry Chronicle 78(5):618–625.
Gillis, M.; Leckie, D. 1996. Forest inventory update in Canada. Forestry Chronicle 72(2):138–156.
Gimbarzevsky, P.; Dawson, A.F.; Van Sickle, G.A. 1992. Assessment of aerial photographs and multi-spectral scanner imagery for measuring mountain pine beetle damage. Forestry Canada, Pacific Forest Research Centre, Victoria, BC, Information Report BC-X-333. 31 p.
Glackin, D.L.; Peltzer, G.R. 1999. Civil, commercial, and international remote sensing systems and geoprocessing. The Aerospace Press, El Segundo, CA.
Goward, S.N.; Davis, P.E.; Fleming, D.; Miller, L.; Townshend, J.R. 2003. Empirical comparison of Landsat 7 and IKONOS multispectral measurements for selected Earth Observation System (EOS) validation sites. Remote Sensing of Environment 88:80–99.
Graham, R.; Koh, A. 2002. Digital aerial survey: Theory and practice. CRC Press LLC, Boca Raton, FL.
Hamilton, D. 1981. Large-scale color aerial photography as a tool in sampling for mortality rates. USDA Forest Service, Intermountain Forest and Range Experiment Station, Missoula, MT. Research Paper INT-269. 8 p.
Harris, J.W.E.; Dawson, A.F. 1979. Evaluation of aerial forest pest damage survey techniques in British Columbia. Environment Canada, Canadian Forest Service, Pacific Forest Research Centre, Victoria, BC, Information Report BC-X-198. 22 p.

152 The Mountain Pine Beetle – A Synthesis of Biology, Management, and Impacts in Lodgepole Pine
Harris, J.W.E.; Dawson, A.F.; Brown, R.G. 1982. Evaluation of mountain pine beetle damage using aerial photography, Flathead River, BC. 1980. Environment Canada, Canadian Forest Service, Pacific Forest Research Centre, Victoria, BC, Information Report, BC-X-228. 10 p.
Harris, J.L.; Frank, M.; Johnson, S. eds. 2001. Forest insect and disease conditions in the Rocky Mountain Region 1997-1999. USDA Forest Service, Rocky Mountain Region, Renewable Resources and Forest Health Management, Lakewood, CO. 39 p.
Heller, R.C.; Coyne, J.F.; Bean, J.L. 1955. Airplanes increase effectiveness of southern pine beetle surveys. Journal of Forestry (July):483–487.
Henigman, J.; Ebata, T.; Allen, E.; Holt, J.; Pollard, A., eds. 1999. Field guide to forest damage in British Columbia. British Columbia Ministry of Forests, Victoria, BC. 348 p.
Hill, J.B.; Popp, H.W.; Grove, A.R. Jr. 1967. Botany: A textbook for colleges. 4th ed. McGraw-Hill Book Co., Toronto, ON.
Johnson, E. 2002. 2001 Aerial detection survey of the Rocky Mountain Region. USDA Forest Service, Rocky Mountain Region, Renewable Resources and Forest Health Management, Lakewood, CO. R2-02-09. 20 p.
Kaplan, E.D., ed. 1996. Understanding GPS: Principles and applications. Artech House Inc., Boston, MA.
Klein, W.H. 1973. Beetle-killed pine estimates. Photogrammetric Engineering 39:385–388.
Kneppeck, I.D.; Ahern, F.J. 1989. A comparison of images from a pushbroom scanner with normal color aerial photographs for detecting scattered recent conifer mortality. Photogrammetric Engineering and Remote Sensing 55:333–337.
Lefsky, M.A.; Cohen, W.B. 2003. Selection of remotely sensed data. Pages 13–46 in M.A. Wulder and S.E. Franklin, eds. Remote sensing of forest environments: Concepts and case studies. Kluwer Academic Publishers, Boston, MA.
Murtha, P.A. 1972. A guide to air photo interpretation of forest damage in Canada. Canadian Forest Service, Ottawa, ON. Publication No. 1292. 62 p.
Murtha, P.A. 1985. Interpretation of large-scale color-IR photographs for bark beetle incipient attack detection. Pages 209–219 in PECORA 10 Symposium Proceedings, August 20–22, 1985, Fort Collins, CO. American Society for Photogrammetry and Remote Sensing, Falls Church, VA.
Nelson, T.; Wulder, M.; Niemann, K.O. 2001. Spatial resolution implications of digitising aerial photography for environmental applications. Journal of Imaging Science 49:223–232.
Peddle, D.R.; Teillet, P.M.; Wulder, M.A. 2003. Radiometric image processing. Pages 181–208 in M.A. Wulder and S.E. Franklin, eds. Remote sensing of forest environments: Concepts and case studies. Kluwer Academic Publishers, Boston.
Puritch, G.S. 1981. Nonvisual remote sensing of trees affected by stress: A review. Environment Canada, Canadian Forest Service, Pacific Forest Research Centre, Victoria, BC. Forestry Technical Report 30. 38 p.
Roberts, A.; Dragicevic, S.; Northrup, J.; Wolf, S.; Li, Y.; Coburn, C. 2003. Mountain pine beetle detection and monitoring: remote sensing evaluations. (Forestry Innovation Investment) Operational Report with Reference to Recipient Agreement R2003-0205, April 10, 2003. 45 p.

Chapter 5 – Detection, Mapping, and Monitoring of the Mountain Pine Beetle 153
Rock, B.N.; Hoshizaki, T.; Miller, J.R. 1988. Comparison of in situ and airborne spectral measurements of blue shift associated with forest decline. Remote Sensing of Environment 24:109–127.
Safranyik, L.; Shrimpton, D.; Whitney, H.S. 1974. Management of lodgepole pine to reduce losses from the mountain pine beetle. Canadian Forest Service, Pacific Forest Research Centre, Victoria, BC. Forestry Technical Report 1. 24 p.
Safranyik, L.; Linton, D.A. 2002. Line transect sampling to estimate the density of lodgepole pine currently attacked by mountain pine beetle. Natural Resources Canada, Canadian Forest Service, Pacific Forestry Centre, Victoria, BC. Information Report BC-X-392. 10 p.
Schraeder-Patton, C. 2003. Digital aerial sketchmapping: Interim project report. USDA Forest Service, Remote Sensing Applications Centre, Fort Collins, CO. Report No. RSAC-1202-RPT2. 14 p.
Sharpnack, N.; Wong, J. 1982. Sampling designs and allocations yielding minimum cost estimators for mountain pine beetle loss assessment surveys. USDA Forest Service, Forest Pest Management, Fort Collins, CO. Report Number 83-3. 11 p.
Shore, T. 1985. Forest Insect and Disease Survey, Pacific Region: General Instruction Manual. Canadian Forest Service, Pacific Forest Research Centre, Victoria, BC, 125 p.
Shore, T.; Safranyik, L. 1992. Susceptibility and risk rating systems for the mountain pine beetle in lodgepole pine stands. Canadian Forest Service, Pacific Forest Research Centre, Victoria, BC, Information Report BC-X-336. 12 p.
Skakun, R.S.; Wulder, M.A.; Franklin, S.E. 2003. Sensitivity of the Thematic Mapper Enhanced Wetness Difference Index (EWDI) to detect mountain pine needle red attack damage. Remote Sensing of Environment 86:433–443.
Tao, C.V.; Hu, Y.; Jiang, W. 2004. Photogrammetric exploitation of IKONOS imagery for mapping applications. International Journal of Remote Sensing 25(14):2833–2853.
USDA Forest Service. 2003. America’s forests: 2003 health update. USDA, Washington, DC. Agriculture Information Bulletin 776. 19 p. http://www.fs.fed.us/publications/documents/forest-health-update2003.pdf
Waters, W.E.; Heller, R.C.; Bean, J. L. 1958. Aerial appraisal of damage by the spruce budworm. Journal of Forestry (April):269–276.
Wear, J.; Pope, R.; Orr, P. 1966. Aerial photographic techniques for estimating damage by insects in western forests. USDA Forest Service, Pacific Northwest Research Station, Portland, OR. 79 p.
Westfall, J. 2003. 2002 Summary of forest health conditions in British Columbia. British Columbia Ministry of Forests, Forest Practices Branch, Victoria, BC, 29 p.
White, J.C.; Wulder, M.A.; Brooks, D.; Reich, R.; Wheate, R.D. 2004. Mapping the impacts of mountain pine beetle infestation with high spatial resolution satellite imagery. Forestry Chronicle 80:743–745.
Wiart, R.J. 2003. Detecting and mapping mountain pine beetle infestations: Defining the role of remote sensing and establishing research priorities. Workshop Summary Report, June 26-27, 2003, Vancouver, British Columbia, 27 p.

154 The Mountain Pine Beetle – A Synthesis of Biology, Management, and Impacts in Lodgepole Pine
Wood, C.; Unger, L. 1996. Mountain pine beetle: A history of outbreaks in pine forests in British Columbia, 1910 to 1995. Natural Resources Canada, Canadian Forest Service, Pacific Forest Research Centre, Victoria, BC. 61 p.
Wulder, M.A.; Dymond, C.C. 2004. Remote sensing technologies for mountain pine beetle surveys. Pages 146–153 in T.L. Shore, J.E. Brooks and J.E. Stone, eds. Proceedings of the mountain pine beetle symposium: Challenges and solutions, Oct. 30–31, 2003, Kelowna, BC. Natural Resources Canada, Canadian Forest Service, Pacific Forest Research Centre, Victoria, BC. Information Report BC-X-399. 298 p.
Wulder, M.A.; Franklin, S.E. 2001. Polygon decomposition with remotely sensed data: Rationale, methods, and applications. Geomatica 55:11–21.
Wulder, M.A.; Skakun, R.S.; Dymond, C.C.; Kurz, W.A. 2005a. Characterization of the diminishing accuracy in detecting forest insect damage over time. Canadian Journal of Remote Sensing 31:421-431.
Wulder, M.A.; Skakun, R.S.; Franklin, S.E; White, J.C. 2005b. Enhancing forest inventories with mountain pine beetle infestation information. Forestry Chronicle 81(1):149–159.
![Phillips, Kim (NRCan/RNCan) · From: Phillips, Kim (NRCan/RNCan) [mailto:kim.phillips@canada.ca] Sent: Thursday, October 05, 2017 10:26 AM To: Phillips, Kim (NRCan/RNCan) Subject:](https://img.dokumen.tips/doc/110x75/5ad08ac87f8b9a6c6c8e6906/phillips-kim-nrcanrncan-phillips-kim-nrcanrncan-mailtokimphillips-.jpg)