Embed Size (px)
Citation preview
Abstract
Use of Oral Language General Outcome Measures to Describe Children According to
Language Status
By Alicia Strein
April 2011
Director: Laura J. Ball, Ph.D
Major Department: Communication Sciences and Disorders
The purpose of the study was to determine if short language samples can effectively
distinguish children with language impairments from those who are typically developing. Four
elicitation methods (individual picture descriptions, multi-scene picture description, narrative,
and interview) were administered to 14 typically developing children and 3 children with
language impairments in Chapel Hill, NC as well as to 16 typically developing children in
Greenville, NC. Each task was administered 3 times and lasted 1 minute. All samples were
collected and transcribed by the principal investigator and then analyzed using 5 general
language sample measures (Number of Total Words, Number of Different Words, Number of
Total Utterances, Mean Length of Utterance, Errors/Omissions). Intercorrelations between the
elicitation tasks were found for each measure and then the effect size was determined comparing
the typically developing children and children with language impairments in Chapel Hill, NC.
Significant correlations were observed between most measures. A review of the correlation
strength revealed the strongest relationships between the descriptions of individual pictures and
multi-scene picture description tasks. Notable differences were observed between children with
language impairments and typically developing children. The largest group differences were
observed for the Number of Different Words measure. The results suggest that the short
language samples produce meaningful information and are clinically feasible.
Use of Oral Language General Outcome Measures to Classify Children According to Language
Status
A Thesis Presented to the Faculty of the Department of Communication Sciences and Disorders
of East Carolina University
In Partial Fulfillment
of the Requirements for the Degree
Master of Science in Communication Sciences and Disorders
by
Alicia Strein
April 2011
Under the Direction of Laura Ball and John Heilmann

© Copyright 2011 Alicia Strein
Use of Oral Language General Outcome Measures to Classify Children According to Language
Status
By
Alicia Strein
Approved By:
Director of Thesis: __________________________________________
Laura J. Ball, Ph.D
Committee Member: __________________________________________
John Heilmann, Ph.D
Committee Member: ___________________________________________
Chris Riley-Tillman, Ph.D Committee Member:
___________________________________________
Marianna Walker, Ph.D Chair of the Department of Communication Sciences and Disorders:
__________________________________________
Gregg D. Givens, Ph.D Dean of the Graduate School:
__________________________________________ Paul J. Gemperline, Ph.D
Acknowledgement
I would like to thank the participants and their families for their participation in this study
as well as Chapel-Hill Carrboro City Schools and Beth Burns, the district’s lead speech-language
pathologist. Their support and assistance along the way was greatly appreciated. Thank you to
my thesis committee members for their input and support throughout this process. I would
especially like to thank my thesis directors, Dr. Heilmann and Dr. Ball. I am grateful for their
support and encouragement and taking the time to provide me with this exceptional learning
experience. I would like to thank my parents for their encouragement throughout this process.
Last but not least, I would also like to thank my husband, Jason, for his continued love and
support throughout all life's endeavors.
Table of Contents
LIST OF TABLES ………...…………………………………...……………………….... i
CHAPTER 1: INTRODUCTION ………………………………………………………... 1
Standardized Measures ……………................................………….…………...... 1
Observations of Change in Language ………………………………………….... 2
Performance of Specific Therapy Tasks ………………………………………..... 2
General Outcome Measures …………………………………………………… 3
History of General Outcome Measures …………………………………………. 4
General Outcomes Measures in Speech-Language Pathology …………………... 5
Development of Oral Language Curriculum Based Measures …………………... 6
CHAPTER 2: METHODS ……………………………………………………………… 8
Participants ……………………………………...………………………………. 8
Elicitation Procedure …………………………………………………….……... 11
Data Collection and Analysis ……………………………………….………….. 14
CHAPTER 3: RESULTS …………………………………………………………….... 16
Properties of Measures from Typically Developing Children …...……………... 16
Comparison of Children with Language Impairments and Typically Developing
Children ……………………………………………………………………….... 23
CHAPTER 4: DISCUSSION …………………………………………………………... 27
Properties of Measures from Typically Developing Children ……...…...…….. 27
Comparison of Children with Language Impairments and Typically Developing
Children …………………………………………………………...……………. 29
Limitations …………………………………………………….……………….. 30
Conclusions …………………………………………………………………...... 31
REFERENCES ………………………………………………………………………… 32
APPENDIX A: INSTITUTIONAL REVIEW BOARD APPROVAL ….……………... 35
APPENDIX B: ELICITATION PROTOCOL ………………………………………….. 38
i
List of Tables
1. Demographics of Study Participants ………………………………………………… 16
2. Intercorrelations for total utterances between four experimental elicitation
contexts …………………………………………………………………………….... 17
3. Intercorrelations for total words between four experimental elicitation contexts …. 18
4. Intercorrelations for MLU between four experimental elicitation contexts ...………. 20
5. Intercorrelations for number of different words between four experimental elicitation
contexts …………………………………………………………………………...…. 21
6. Intercorrelations for errors/omissions between four experimental elicitation
contexts …………………………………………………………………………..... 22
7. Mean performance (SD) and effect sizes documenting differences between the children
with language impairments and the typically developing children .………………… 25
Chapter 1: Introduction
Speech-language pathologists are required to document the effectiveness of treatment
within all settings that services are provided. Major stakeholders, including third party payers,
family members, and school administrators, are entitled to accountability and require
documentation of the progress made (or lack thereof) on established goals. In addition, ASHA’s
position statement on evidence based practice states that treatments should be based on empirical
evidence from the literature and through one’s own clinical experiences. Effective outcome
measures are required for researchers completing the efficacy studies that influence clinical
practice. Furthermore, clinicians require strong outcome measures to validate their own practice,
which in turn strengthens their clinical knowledge. Unfortunately, there are limited data
supporting valid, reliable, and clinically feasible outcomes measures for children’s oral language
skills (Ukrainetz, 2006).
Methods of Documenting Outcomes
Standardized measures. Speech-language pathologists (SLPs) use assessment as a
means of identifying children with speech and language impairments. Typically SLPs teach their
clients new skills and then document outcomes by administering an assessment after a
predetermined length of time, usually at the end of each grading period. The assessment is
aimed at summarizing the learned information and to determine the child’s current level of
performance. If the child scores poorly, the material is taught again and then assessed once
more. These measures are standardized and each child is given the same test (Harlen & James,
1997).
Reliability and validity are reasons for choosing many standardized measures. Using
reliable and valid measures is important because it allows clinicians to be confident in the child’s
2
score, or the amount of change measured throughout their time in therapy as being reliable and
meaningful. In reality, these tests do not provide enough detail to determine if change has
occurred over time. Standardized tests are designed to generate stable data that is not sensitive to
subtle changes in language characteristics that are present in the language profile of the child
who has an impairment (McCauley, 2001).
McCauley and Swisher (1984) identified another drawback to standardized tests.
Situations must be avoided in which test items are explicitly taught to the child. Also the test
should not be administered a second time in too short of a time period. Both of these situations
could lead to the child scoring higher because of the specific items being examined were
memorized or learned without generalization. Researchers and clinicians find standardized
measures to be useful during examination of children, but these tests should be used cautiously
and with recognition of their shortcomings.
Observations of change in language. Another way of assessing the child’s change is to
determine if the people who interact with the child, such as a parent, a teacher, or a SLP,
consider the changes made by the child as substantial (Kazdin, 1977). That is, for meaningful
change to occur in a child’s language, someone must notice it. These methods range from
informal questioning of significant others in the child’s life to panels of naive listeners that make
judgments about the child’s speech productions. Subjective judgments provide both qualitative
and quantitative data about the child’s language changes but may not be practical in many
clinical settings (McCauley, 2001). Furthermore, there is limited empirical data documenting the
reliability and validity of such judgments.
Performance of specific therapy tasks. Instead of asking for observations about the
child’s language changes, researchers and clinicians often measure outcomes of specific skills
3
using performance on therapy tasks. These measures are not standardized and cannot be used to
compare among children; they simply reveal how the child performed on a specific task during a
particular therapy session. This information is helpful but may not be reliable. Variability in
procedures used in therapy tasks can occur depending on both the clinician’s elicitation and the
child’s performance on any given day. Because of this, such measures cannot be compared to
other children’s performance and norms cannot be created. Furthermore, variability in
administration procedures and/or stimuli used can introduce substantial measurement error.
These outcomes are typically restricted to a limited set of skills and do not address the overall
changes in the child’s ability to effectively use language to communicate.
General outcome measures. Methods for documenting outcomes must be reliable,
valid, and sensitive to measuring change within a given child. Instead of addressing specific
skills or using standardized measures that may not be sensitive, researchers and clinicians may
consider using general outcome measures. These measures use standardized procedures to
monitor progress as the child continues to learn new skills (Deno, 1985). General outcome
measures should provide educationally related information that allows for decisions to be made
about education and the curriculum for the overall student population and at the individual
student level. Instead of measuring outcomes based on the sub-skills learned in therapy sessions,
general outcome measures can be used to observe overall skills required to perform in a
particular subject area.
To monitor progress, the data on a child’s performance and acquisition of learned
information should be collected on a regular basis. If progress on the measurements occurs
throughout the learning process, then the method of treatment is judged to be effective. On the
other hand, if the child is not making progress at the same rate as other students or as quickly as
4
expected then the SLP can adapt the teaching methods to meet that child’s specific needs (Deno,
1985; Harlen & James, 1997). Rather than waiting for quarterly or annual assessment of
progress towards treatment goals, the SLP could briefly assess the child’s oral language skills by
completing short assessments on a more frequent basis. Overall, using this type of assessment
approach leads to improved learning and provides immediate feedback to the student and the
SLP on progress.
History of general outcome measures. The focus of general outcome measures over the
past twenty-five years has centered predominately on reading. Previously, only mastery
measurements or standardized tests were used to evaluate a child’s reading. These measures
tested a small number of skills, and once a satisfactory score was achieved, a new skill set would
be introduced. Research by Fuchs and Deno (1991) found that if the test used to measure
students’ progress contained a larger, mixed group of problems or concepts not limited to skills
just learned, the children did not score as well. This issue motivated a comprehensive line of
research examining the inherent problems associated with mastery measurement (Fuchs & Deno,
1991; Deno, 1985).
General outcome measures were suggested as the alternative to the mastery measures in a
variety of subject areas. School psychologists have used general outcome measures to screen
children, identify problems, make educational decisions about intervention plans, and monitor
the child’s progress towards goals and response to intervention (Hintze, Christ, & Methe, 2006).
In reading, fluency serves as an overarching goal of early reading skills by integrating many
individual skills into one central task. To read fluently, one must be able to access lexical
information, understand sound-letter correspondence, combine individual sounds into whole
words, process the meaning of words, and relate the current reading with background knowledge
5
(Fuchs, Fuchs, Hosp, & Jenkins, 2001). Reading fluency has been observed to exhibit the
highest criterion validity compared to other general outcome measures including cloze, question
answering, and recall (Fuchs, Fuchs, & Maxwell, 1988).
General Outcome Measures in Speech-Language Pathology
The principles of General Outcome Measures, as listed above, can be applied within
speech-language pathology. Language sample analysis (LSA) is well suited for monitoring
process of children’s oral language skills (Miller & Chapman, 1981; Tager-Flusberg & Cooper,
1999). LSA can be related to the general curriculum; children must use oral language in
conversations and narratives to be successful in the classroom. A language sample documents a
child’s language in naturalistic. Thus, the clinician can be confident in deducing that language
sample data is a true representation of the child’s language abilities and this therefore verifies
LSA as a valid tool. Measures from language samples are stable over time (Heilmann, Miller,
Iglesias, Fabiano-Smith, Nockerts, & Andriacchi, 2008) and can identify language impairments
in children (Dunn, Flax, Sliwinski, & Aram, 1996; Heilmann, Miller, & Nockerts, 2010).
The effectiveness of LSA for tracking progress is the professional standard in the
research community, as LSA is the primary means for documenting outcomes in research studies
on treatment (Balason & Dollaghan, 2002; Fletcher & Peters, 1984; Watkins, Kelly, Harbers, &
Hollis, 1995).
Though LSA is a valid reliable tool that can be used to identify language impairments
and track progress, it lacks clinical feasibility. A traditional language sample requires at least a
5-minute sample, which then requires about 5 minutes of transcription for each minute of spoken
(recorded) language. This, at least 25 minutes is needed to transcribe a brief 5-minute sample,
increasing the total amount of time for collection and transcription to 30 minutes. Because of
6
this time commitment, LSA has limited feasibility for use in regular monitoring of child’s
progress in most clinical settings.
Researchers have sought to find more practicable ways of using language samples for
diagnostic purposes and tracking progress. There is limited evidence that some LSA measures
are reliable when using 1-minute samples (Heilmann, Miller, & Nockerts, 2010; Tilstra &
McMaster, 2007). However, additional research needs to examine reliability and validity of such
short samples as well as to evaluate the optimal context for the language sample collection.
Development of oral language curriculum based measures. Fuchs (2004) stated that
the first stage of curriculum based measurement research is to examine the properties of the
static score. This component is important when evaluating validity and reliability of the
measures in comparison with traditional psychometric measures (Fuchs, 2004). Work is
currently underway documenting the reliability and validity of measures from a series of short
language samples (Heilmann, 2011). In addition to documenting reliability and validity, general
outcome measures must effectively distinguish between children with impairments and children
who are typically developing. While comprehensive LSA has been shown to be effective in
identifying children with language impairments, research must be completed to determine if
short samples are equally as effective as the long samples. If short language samples distinguish
typically developing children from those with impaired language, this provides additional
evidence that the measures are in fact valid. Therefore, the purpose of this study is to identify
whether short language samples can effectively distinguish children based on language status.
This study will address the following questions:
1. Are language sample measures (Number of Different Words, Number of Total Words,
Number of Total Utterances, Mean Length of Utterance, Errors/Omissions) significantly
7
related to each other when comparing across elicitation contexts in typically developing
children?
2. Does a subset of language sample measures generate the strongest group correlations
between typically developing children?
3. Do measures of language sample taken from short language samples significantly
differ between typically developing children and children with language impairment?
4. Does a subset of elicitation contexts generate the group differences between typically
developing children and children with language impairment?
Chapter 2: Methods
Participants
The participants for the primary sample were recruited from public schools in Chapel
Hill, North Carolina. The goal of questions 1 and 2 was to document the properties of the
measures when collected from typically developing children. Additional samples from
Greenville, North Carolina were used from another research project under the direction of Dr.
John Heilmann, to add statistical power to the analyses.
Chapel Hill sample. All participants were children enrolled in kindergarten or first grade
at local elementary schools in Chapel Hill, North Carolina. Children from the early school-age
years (kindergarten and first grade) were chosen for participation given the importance of oral
language skills in their curricula (Justice, 2007). There is a strong relationship between
children’s oral language skills and reading (Roth, Speece, & Cooper, 2002), the other major
component of young school-age children’s curricula. The children were recruited from
elementary schools in the Chapel Hill- Carrboro City School District in North Carolina through
district speech-language pathologists (SLP) and letters to families. After obtaining Institutional
Review Board permission through East Carolina University, the principal investigator worked
with the district’s lead SLP to gain Institutional Review Board permission through the school
district. The lead SLP assisted the principal investigator in contacting school personnel to obtain
permission to complete the study with students onsite at that particular school, and to assist with
contacting potential participants’ families and in completing the informed consent process. As
part of the consent process, the parents provided permission for the researchers to review school
records for hearing and vision screening information and previous language assessment scores
for the children with language impairments.
9
Seventeen children were recruited for this study: 3 children with language impairments
and 14 typically developing children with no history of language impairments. Originally, the
recruitment goal was 20 children with language impairments. However two principals did not
approve of the study taking place in their school and one child did not pass the hearing screening
and another child moved out of the school district. Lastly, several parents did not grant
permission for their child to participate or failed to return the consent form after two copies were
provided leading to only 3 children with language impairments included in the study.
For both groups of children, participants were excluded if they had a documented hearing
or visual impairment or if English was not their first language. These criteria were established
through records review – children must have passed a hearing and vision screening in the past
year and not be enrolled in English as a second language services. If children had not passed a
hearing screening, the investigator completed a screening using the guidelines of the American
Speech-Language-Hearing Association (American Speech-Language-Hearing Association,
1997).
The three children with language impairments had been diagnosed by an ASHA certified
speech-language pathologist. They all had a current Individual Education Plan (IEP) primarily
addressing language goals. In addition, the child must have scored below 85 on a comprehensive
language assessment (e.g., Preschool Language Scales, Fourth Edition) in the past year based on
record review. The Total Language standard scores for each child were as follows: 74, 72, and
68 on the Preschool Language Scales, Fourth Edition. The 14 typically developing children were
recruited from the regular classroom. Each participant’s teacher completed a questionnaire to
document that there were no concerns regarding the child’s language skills.
10
The researchers chose to rely primarily on a clinical diagnosis as a means for identifying
children with language impairments. The primary criterion for inclusion in this study was
identification of language impairment by an ASHA certified speech-language pathologist. While
children must score one standard deviation below the mean standard score on a language test,
there must also be an identified concern of the child’s language skills. Using standardized test
criteria alone may not be sensitive to the variability that is characteristic of language impairment.
Many standardized tests are biased against children of diverse backgrounds and may not be
sensitive to classification of impairment (Campbell, Dollaghan, Needleman, & Janosky, 1997;
Fazio, Naremore, & Connell, 1996; Plante & Vance, 1994). In addition, there is no gold
standard for diagnosing children with language impairments and there is variability in what
features determine language impairment classification (Aram, Morris, & Hall, 1993; Dunn, Flax,
Sliwinski, & Aram, 1996; Lahey, 1990; Tomblin, Records, & Zhang, 1996). By using clinician
diagnosis, the concerns that the SLP, classroom teacher, and parents may have for a child’s
development of language were taken into account (Dollaghan & Campbell, 1998). This
approach allows the clinician to use theoretical background knowledge and allows for improved
diagnosis of children with diverse backgrounds in a more sensitive way.
Greenville sample. To increase the power for the first set of analyses documenting the
relationship between the potential outcomes measures, 16 additional samples were collected
from data obtained for another research project completed in the Child Language Lab at East
Carolina University (Heilmann, 2011). These samples were part of a larger project documenting
the reliability and validity of outcome measures. All participants were between 4;6 – 6;0 years of
age and were typically developing, per parent report. Each child completed the same protocol as
the children in the Chapel Hill sample.
11
Elicitation Procedure
Four oral language elicitation tasks were used throughout this study. The tasks ranged
from highly structured to less structured as listed: a single picture description task, a multi-scene
picture description task, a narrative picture task, and a structured interview. It was predicted that
the highly structured tasks would be more reliable, as these tasks inherently facilitate consistency
during administration and should generate similar complex language from each child. However,
validity may be weaker with these tasks if they are unable to compel the child to use complex
language or if the child produces responses unrelated to the presented stimuli.
Each task was timed to last between one to two minutes. Before the elicitation tasks were
presented to the child, the examiner provided a detailed description of what was expected during
each task, as well as examples of detailed responses. At the beginning of each task, the child
was reminded to use as much detail as possible when talking. By using highly structured
elicitation procedures and clearly describing the expectations for the child’s performance,
previous studies using similar tasks (Heilmann, 2010) have shown that responses were typically
2-3 minutes in length and have verified that children comprehended the tasks and that they
facilitated sufficient amounts of talk for analyses.
Single picture description. For the single picture description task, children were
presented with a picture and asked to provide a description of the presented actions. The child
completed training using three sample pictures. First the examiner told the child what a shorter
description sounds like (“The boy is reading.”) based on a provided picture and then was cued to
produce an longer, more detail description (“The young boy is reading a book with a yellow
flashlight.”). Ten different picture cards were presented to elicit each language sample of 1-2
minutes. As each picture was presented, the child was told, “Tell me a long sentence about this
12
picture.” This task was modeled after the Fluharty Preschool Speech and Language Screening
Test (Fluharty, 2000), where a child is asked to describe an action based on a picture of a
character completing the action. The pictures were collected from the Super Duper Story Starter
cards (Webber, 2005) and each picture presented a 4-inch by 6-inch color photograph that
depicted one to three characters engaged in an action.
Multi-scene picture description. Next, the children were given three separate pictures
containing five scenes with multiple characters participating on each. These were used to obtain
a 1-minute language sample and thereby complete the multi-scene picture description task. The
child was asked to “tell about as many things that are happening in the picture as possible”.
During the sample tasks, the participant was provided with examples of how to expand sentences
and cued to talk about each part of the picture. After the directions were stated, the examiner
started a stopwatch and if the child paused for more than three seconds during the task, they were
cued to expand their utterance. After 1-minute of verbal description of each picture, the child
was asked to stop and a new picture was presented. Unlike the single picture description task,
these pictures were black and white line drawings from the SPARC Picture Series that depicted
six to eight characters engaged in a variety of actions (LinguiSystems, 1993) and the pictures
were matched for the number of characters, objects, and actions.
Narrative picture task. In the narrative picture task, the examiner presented the child
with a sample narrative and the child was cued to tell a story based on a target picture after being
provided one minute to think about a story and examine the picture (Tilstra & McMaster, 2007).
This procedure was adapted from the Test of Narrative Language (Gillam & Pearson, 2004).
The examiner provided a sample story that included a description of actions prior to the picture,
in the picture, and after the picture. The child was reminded to make the story as long as
13
possible and if the child failed to begin telling the story within five seconds, the examiner cued
with “tell me how this story starts”. If the child failed to respond after another five seconds then
the test was discontinued and the examiner moved onto to another picture. The child was cued
with “tell me what else happened” if they paused for more than five seconds after they had
started their narrative and they moved onto another picture after one minute.
Structured interview . Last, a 1-minute structured interview was conducted with the
child (Evans & Craig, 2002). Each of the questions related to the activities or knowledge of the
personal experiences of the child. The child spoke about each set of standardized questions
(listed in Appendix B) and then the examiner moved to the next set after 1-minute. If needed,
the child was cued to think about a recent event at school or home and once the child began
describing the event, the examiner asked open-ended questions to assist the child in expanding
the details and information presented (e.g., “Tell me more about …”). After five cues had been
provided, the examiner moved on to the next question.
Data Collection and Analysis
The elicitation tasks were each administered three times to each child and the order of
presentation was randomized to reduce order bias. All of the tasks were audio recorded for later
transcription. The elicitation task responses were transcribed using the standard conventions for
the systematic analysis of language transcripts (SALT; Miller & Iglesias, 2010). The principal
investigator transcribed the responses after completing training in the rules of transcription and
practicing transcription for 10 hours. Utterances were segmented using conservational units (C-
units), which define an utterance as all independent and dependent clauses (Loban, 1976).
Transcription accuracy. Upon completion of the language transcription by the principal
investigator, 100 percent of samples were checked for accuracy by a second transcriber trained in
14
completing language sample analysis. The second transcriber listened to the original oral
samples and confirmed the original transcription. All discrepancies were resolved by the second
transcriber correcting minor changes and major discrepancies were brought to the attention of the
project manager for the final decision.
Language sample measures. The following measures were analyzed using the first
minute of each language sample:
1. Number of total words (NTW) is a measure of productivity in which the total number
of words spoken by the child will be examined.
2. Number of total utterances (NTU) is a productivity measure that includes all utterances
produced by the child through the task including independent and dependent clauses.
3. Number of different words (NDW) is a semantic measure that looks at the variety of
words produced by the child.
4. Mean length of utterance in morphemes (MLU) is a measure of overall expressive
language skills of a child (Miller & Chapman, 1981) measuring syntax. MLU can
identify child with language impairments (Aram, Morris, & Hall, 1993).
5. Numbers of errors and omissions (ErrOmit) were calculated by summing the total
number of word-level errors, utterance-level errors, and omissions of words and
morphemes that occur in obligatory contexts.
Chapter 3: Results
Properties of Measures from Typically Developing Children
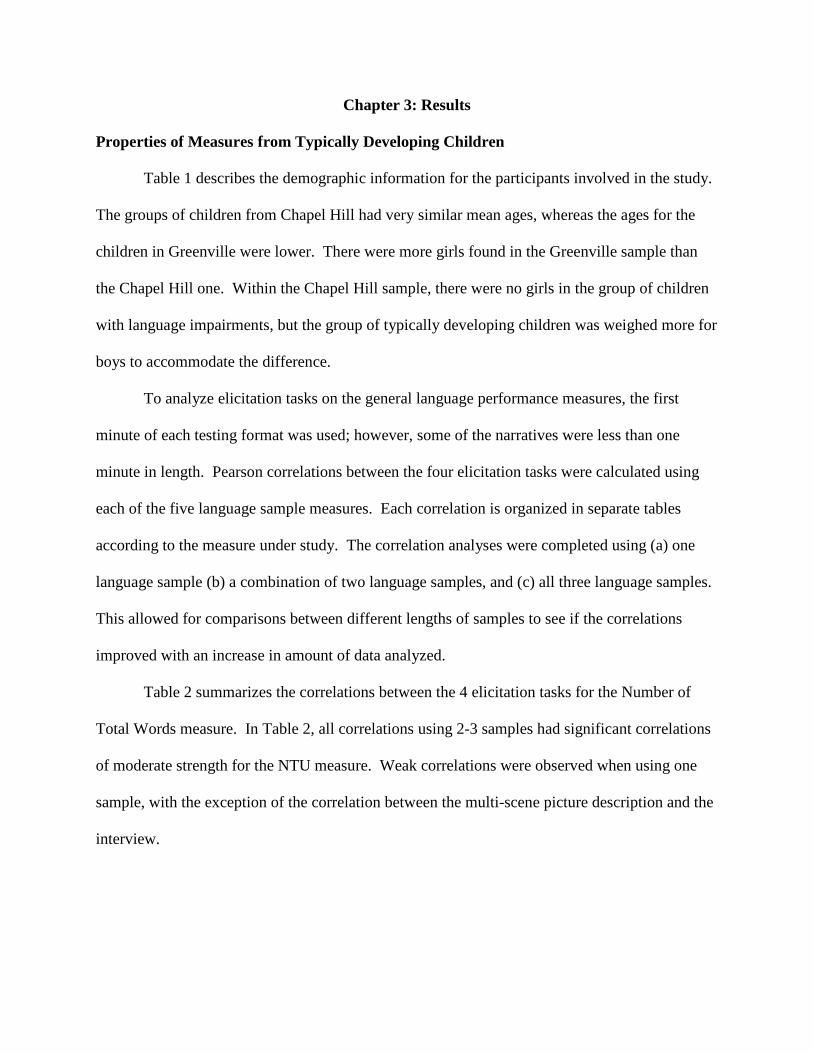
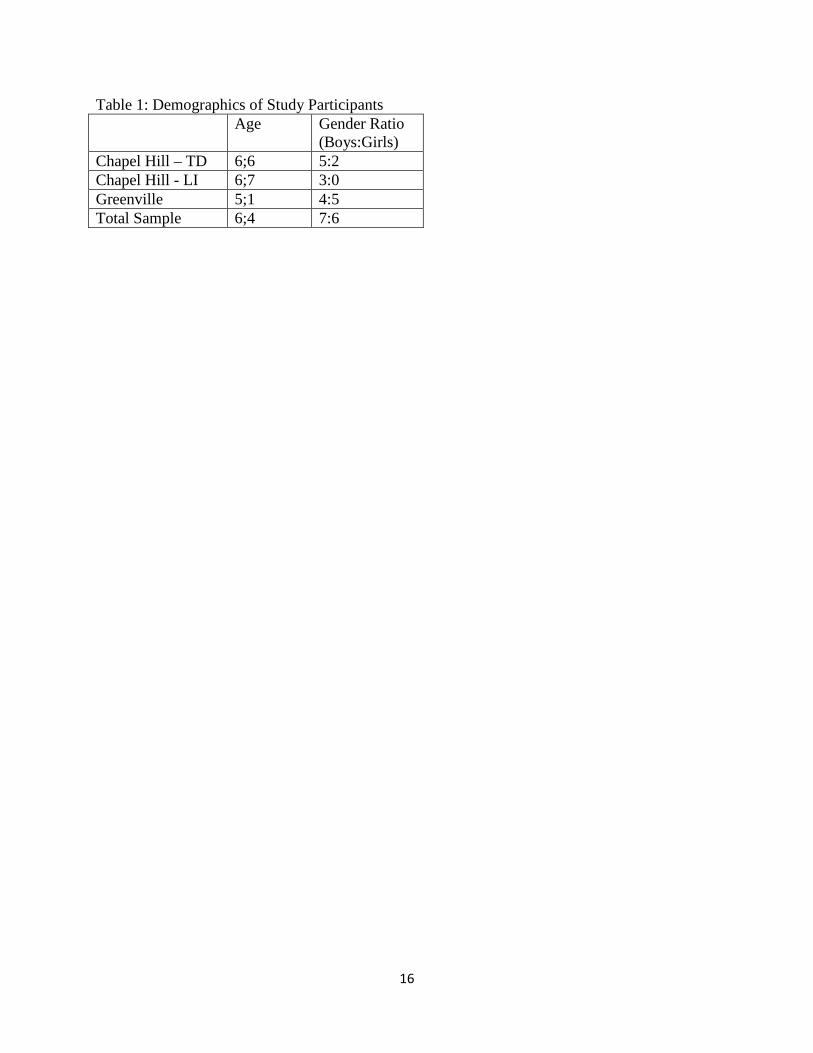
Table 1 describes the demographic information for the participants involved in the study.
The groups of children from Chapel Hill had very similar mean ages, whereas the ages for the
children in Greenville were lower. There were more girls found in the Greenville sample than
the Chapel Hill one. Within the Chapel Hill sample, there were no girls in the group of children
with language impairments, but the group of typically developing children was weighed more for
boys to accommodate the difference.
To analyze elicitation tasks on the general language performance measures, the first
minute of each testing format was used; however, some of the narratives were less than one
minute in length. Pearson correlations between the four elicitation tasks were calculated using
each of the five language sample measures. Each correlation is organized in separate tables
according to the measure under study. The correlation analyses were completed using (a) one
language sample (b) a combination of two language samples, and (c) all three language samples.
This allowed for comparisons between different lengths of samples to see if the correlations
improved with an increase in amount of data analyzed.
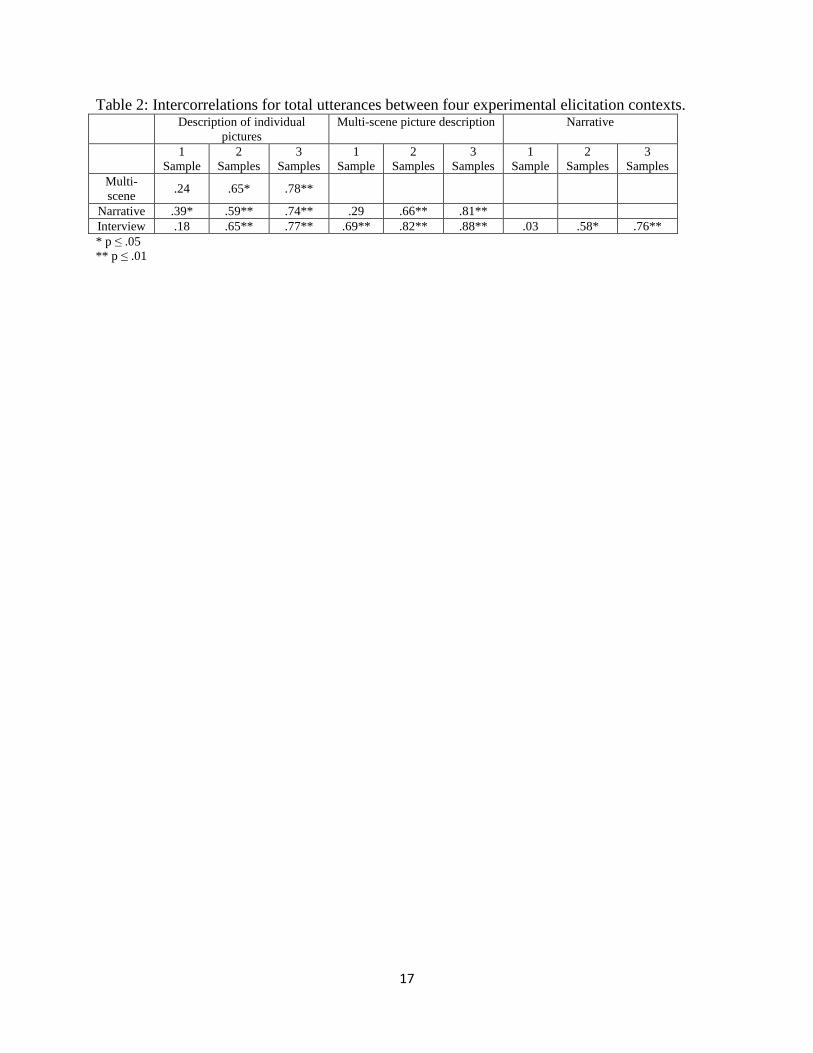
Table 2 summarizes the correlations between the 4 elicitation tasks for the Number of
Total Words measure. In Table 2, all correlations using 2-3 samples had significant correlations
of moderate strength for the NTU measure. Weak correlations were observed when using one
sample, with the exception of the correlation between the multi-scene picture description and the
interview.
16
Table 1: Demographics of Study Participants Age Gender Ratio
(Boys:Girls) Chapel Hill – TD 6;6 5:2 Chapel Hill - LI 6;7 3:0 Greenville 5;1 4:5 Total Sample 6;4 7:6
17
Table 2: Intercorrelations for total utterances between four experimental elicitation contexts. Description of individual
pictures Multi-scene picture description Narrative
1 Sample
2 Samples
3 Samples
1 Sample
2 Samples
3 Samples
1 Sample
2 Samples
3 Samples
Multi-scene
.24 .65* .78**
Narrative .39* .59** .74** .29 .66** .81** Interview .18 .65** .77** .69** .82** .88** .03 .58* .76** * p ≤ .05 ** p ≤ .01
18
Table 3: Intercorrelations for total words between four experimental elicitation contexts.
Description of individual pictures Multi-scene picture description Narrative 1
Sample 2 Samples
3 Samples
1 Sample
2 Samples
3 Samples
1 Sample
2 Samples
3 Samples
Multi-scene picture description
.54* .73** .85**
Narrative .59* .72** .83** .43* .64** .83** Interview .23 .69** .81** .66** .77** .84** .20 .62** .80** * p ≤ .05 ** p ≤ .01
19
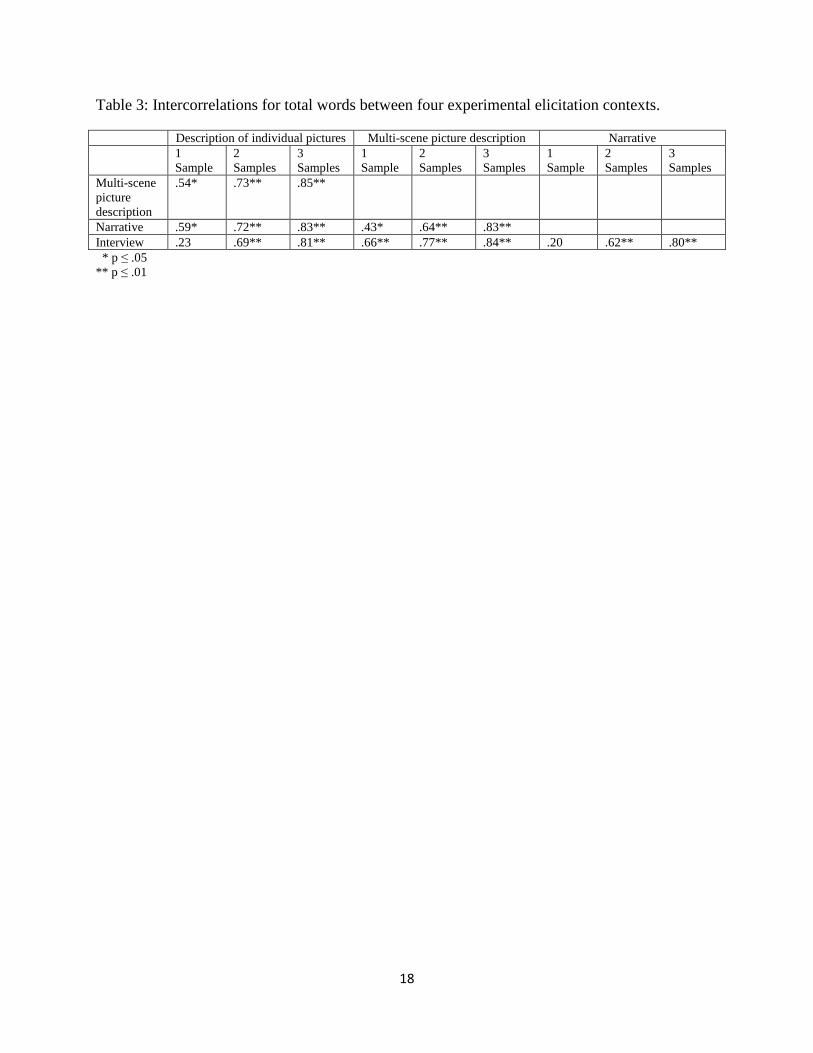
Strong correlations were observed between all measures using three samples for the
NTW measure (Table 3). When a single sample was used, strong correlations were observed on
the description of individual pictures and multi-scene picture descriptions,
description of individual pictures and narrative, and multi-scene picture description and
interview tasks. The correlation strength increased for all measures when using two samples and
then further increased when using three samples. Overall, stronger intercorrelations for NTW
compared to NTU were seen.
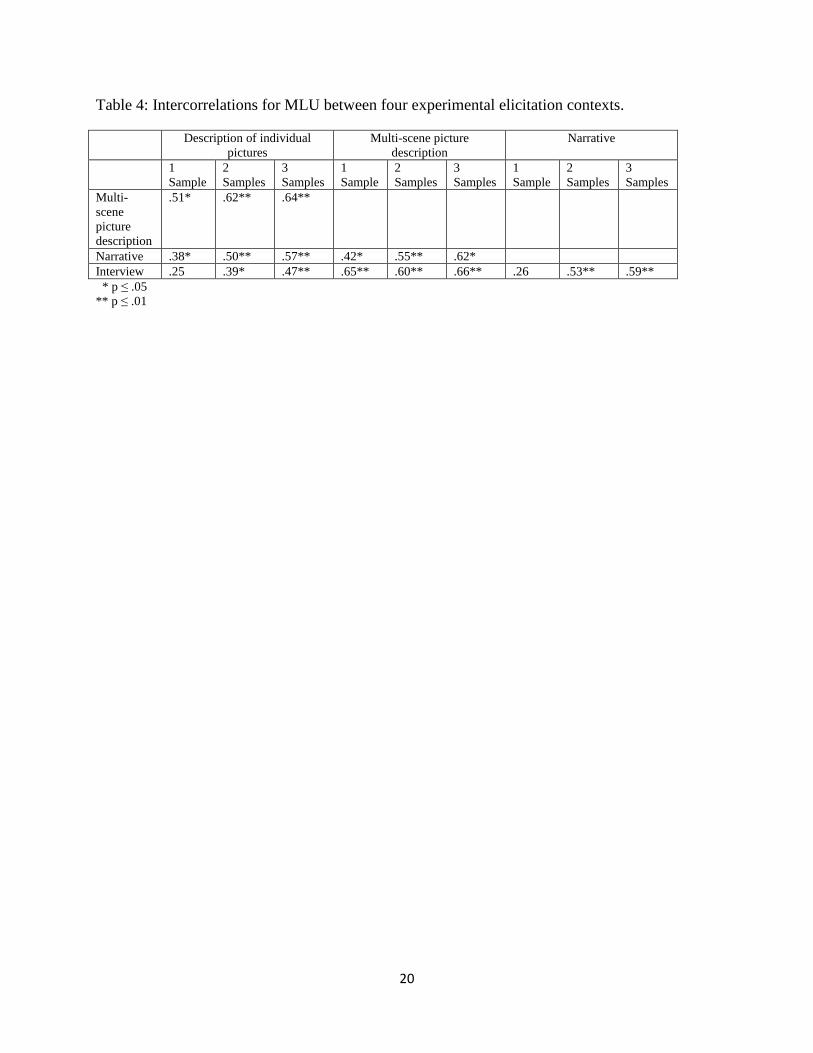
In the MLU analysis, significant correlations were observed between the multi-scene
picture description and interview tasks as well as the descriptions of individual pictures and
multi-scene picture descriptions when using only one sample. As the number of samples
increased the correlations did not improve as much for the MLU analysis as they did in the other
measures (Table 4).
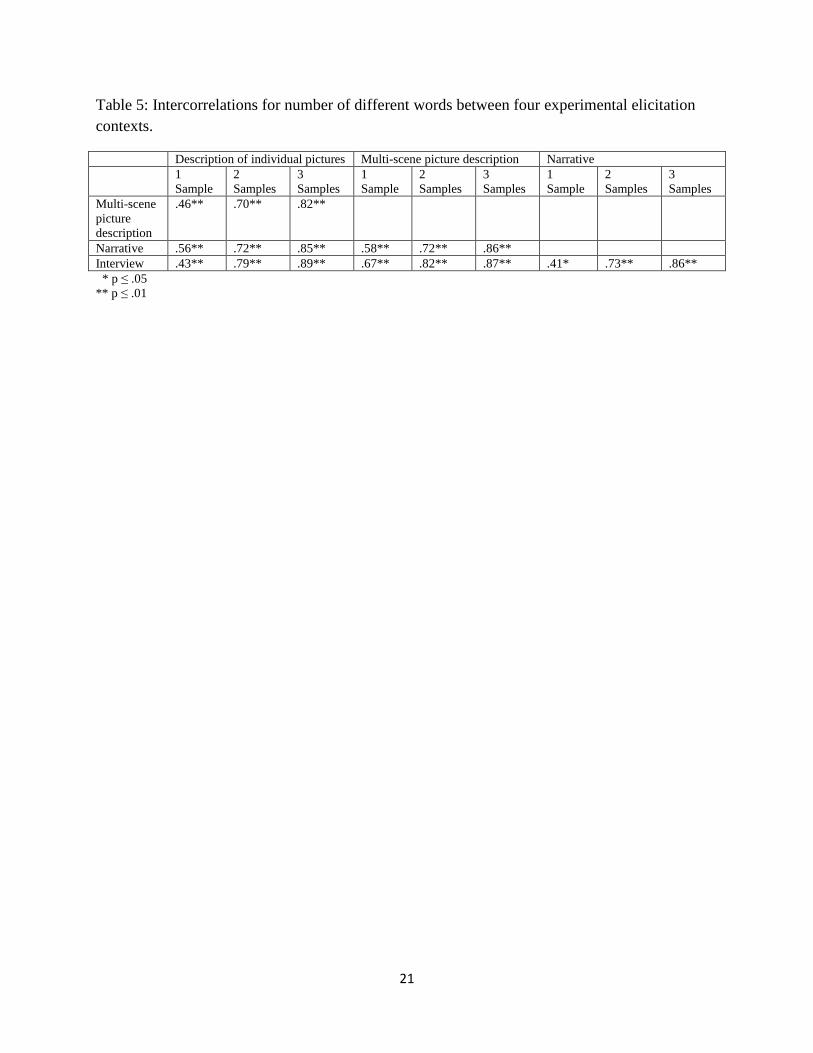
In Table 5, strong correlations were observed on all samples except when comparing one
sample of the description of individual pictures and multi-scene picture description, the
description of individual pictures and interview, and the narrative and interview tasks on the
NDW measure.
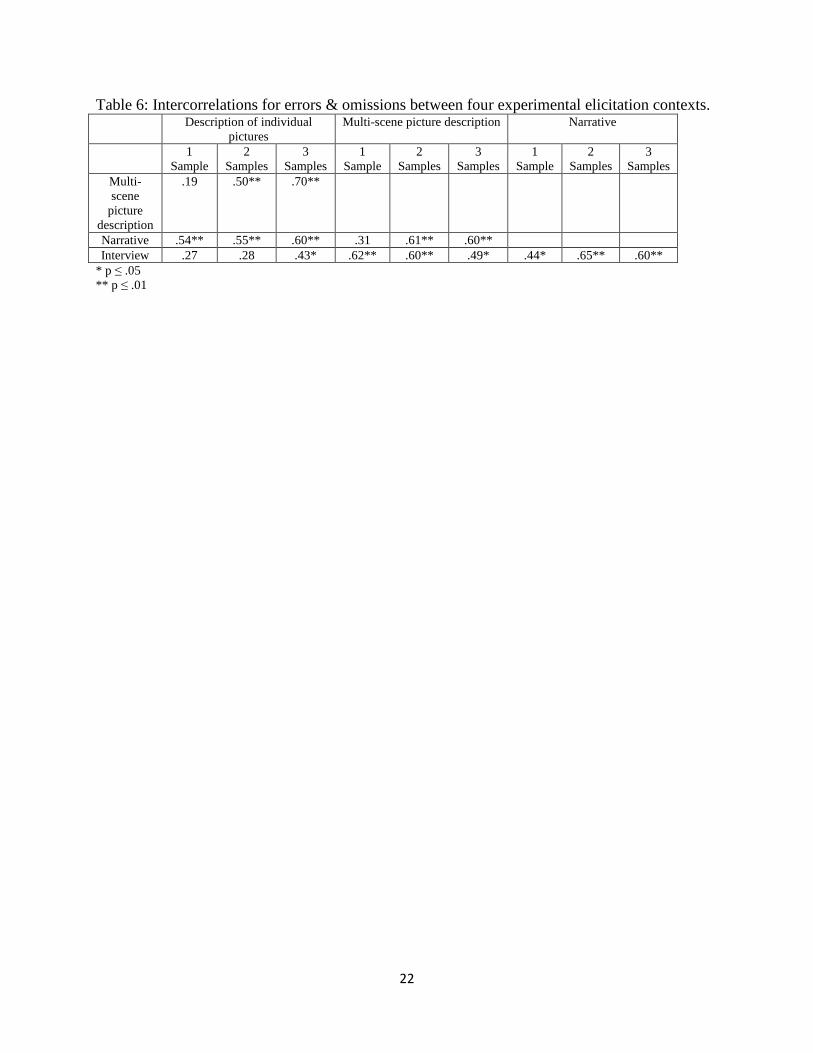
There was variability in the intercorrelations found when the number of samples
increased on the ErrOmit measure as shown in Table 6. With the exception of the description of
individual pictures and narratives, multi-scene picture description, and interview tasks, relatively
weak correlations were noted on one sample measures. The correlations improved with an
increase in number of samples for all comparisons except the description of individual pictures
and interview tasks. There were weak correlations when three samples were used for comparing
the individual picture descriptions and
20
Table 4: Intercorrelations for MLU between four experimental elicitation contexts.
Description of individual pictures
Multi-scene picture description
Narrative
1 Sample
2 Samples
3 Samples
1 Sample
2 Samples
3 Samples
1 Sample
2 Samples
3 Samples
Multi-scene picture description
.51* .62** .64**
Narrative .38* .50** .57** .42* .55** .62* Interview .25 .39* .47** .65** .60** .66** .26 .53** .59** * p ≤ .05 ** p ≤ .01
21
Table 5: Intercorrelations for number of different words between four experimental elicitation contexts.
Description of individual pictures Multi-scene picture description Narrative 1
Sample 2 Samples
3 Samples
1 Sample
2 Samples
3 Samples
1 Sample
2 Samples
3 Samples
Multi-scene picture description
.46** .70** .82**
Narrative .56** .72** .85** .58** .72** .86** Interview .43** .79** .89** .67** .82** .87** .41* .73** .86** * p ≤ .05 ** p ≤ .01
22
Table 6: Intercorrelations for errors & omissions between four experimental elicitation contexts. Description of individual
pictures Multi-scene picture description Narrative
1 Sample
2 Samples
3 Samples
1 Sample
2 Samples
3 Samples
1 Sample
2 Samples
3 Samples
Multi-scene
picture description
.19 .50** .70**
Narrative .54** .55** .60** .31 .61** .60** Interview .27 .28 .43* .62** .60** .49* .44* .65** .60**
* p ≤ .05 ** p ≤ .01
23
interview. An increase in the number of samples did not lead to an increase in the correlations
for the interview and multi-scene picture descriptions.
General trends across measures and contexts. The multi-scene picture description and
interview tasks had higher correlations when using one, two, or three samples than the other task
comparisons. Across all measures, NDW, NTW, NTU, and MLU had the strongest correlations
(in that order). The description of individual pictures and multi-scene pictures had the strongest
intercorrelations throughout the sampling contexts.
The positive intercorrelations of tasks using various measures were found to increase in
strength with an increase in the number of samples analyzed in all conditions except on the
multi-scene picture description and interview on the MLU measure as well as the multi-scene
picture description task and interview, the multi-scene picture description and narrative, and
narrative and interview on the ErrOmit.
Comparison of Children with Language Impairments and Typically Developing Children
The group of children with language impairments was compared to the group of
typically developing children from Chapel Hill to determine if there were group differences on
the elicitations tasks and the language performance measures. Only the children from Chapel
Hill were included in this analysis because they were age-matched. A series of analysis of
variance (ANOVA) tests were completed with the language sample measure as the dependent
variable and the group (typically developing children versus children with language
impairments) as the between groups variable. ANOVAs were calculated for each measure and
elicitation context for a total of 60 comparisons. The significance is not reported, as it was not
meaningful, due to the small number of children with language impairments, the uneven sample
size, and the large number of comparisons. Rather, the principal investigator was more
24
interested in examining at the amount of difference between the two groups in these pilot
analyses. Eta squared (η2) values were calculated for each ANOVA to document effect size.
The effect sizes were compared to determine which measures and/or context resulted in the
largest group differences. The differences between the groups and the effect sizes are
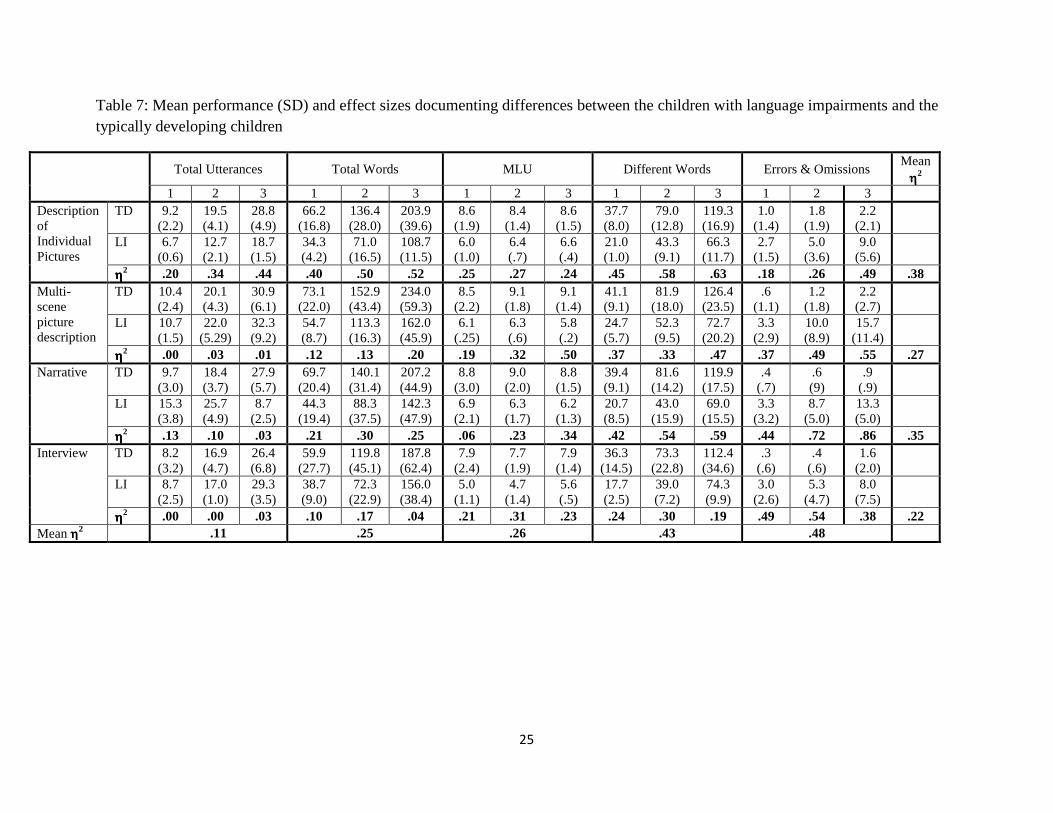
summarized in Table 7.
There were notable differences between the two groups for most of the measures and
elicitation contexts. The smallest group differences were found on the interview task and the
largest group differences were found on the description of individual pictures and the narrative.
The largest variations were with the NDW and ErrOmit measures for individual pictures
descriptions. The smallest differences appeared with the NTU measure for the narrative task.
Only 11 of the 20 effect sizes yielded an increase as the number of samples analyzed increased
for the language performance measures. On all measures, the children with language
impairments had lower average scores than the typically developing children. The one exception
was with the NTU measure on the multi-scene picture description, interview, and narrative in
which scores were relatively equal.
The effect sizes across the measures and contexts were averaged together to demonstrate
general trends. When comparing language performance measures, larger group differences were
found in the mean effect sizes for the NDW measure and ErrOmit measures. The NDW measure
presented the smallest group differences on the interview task. The smallest group differences
were found with the NTU measure overall, with the
25
Table 7: Mean performance (SD) and effect sizes documenting differences between the children with language impairments and the typically developing children
Total Utterances Total Words MLU Different Words Errors & Omissions
Mean ηηηη
2 1 2 3 1 2 3 1 2 3 1 2 3 1 2 3
Description of Individual Pictures
TD 9.2 (2.2)
19.5 (4.1)
28.8 (4.9)
66.2 (16.8)
136.4 (28.0)
203.9 (39.6)
8.6 (1.9)
8.4 (1.4)
8.6 (1.5)
37.7 (8.0)
79.0 (12.8)
119.3 (16.9)
1.0 (1.4)
1.8 (1.9)
2.2 (2.1)
LI 6.7 (0.6)
12.7 (2.1)
18.7 (1.5)
34.3 (4.2)
71.0 (16.5)
108.7 (11.5)
6.0 (1.0)
6.4 (.7)
6.6 (.4)
21.0 (1.0)
43.3 (9.1)
66.3 (11.7)
2.7 (1.5)
5.0 (3.6)
9.0 (5.6)
ηηηη2 .20 .34 .44 .40 .50 .52 .25 .27 .24 .45 .58 .63 .18 .26 .49 .38
Multi-scene picture description
TD 10.4 (2.4)
20.1 (4.3)
30.9 (6.1)
73.1 (22.0)
152.9 (43.4)
234.0 (59.3)
8.5 (2.2)
9.1 (1.8)
9.1 (1.4)
41.1 (9.1)
81.9 (18.0)
126.4 (23.5)
.6 (1.1)
1.2 (1.8)
2.2 (2.7)
LI 10.7 (1.5)
22.0 (5.29)
32.3 (9.2)
54.7 (8.7)
113.3 (16.3)
162.0 (45.9)
6.1 (.25)
6.3 (.6)
5.8 (.2)
24.7 (5.7)
52.3 (9.5)
72.7 (20.2)
3.3 (2.9)
10.0 (8.9)
15.7 (11.4)
ηηηη2 .00 .03 .01 .12 .13 .20 .19 .32 .50 .37 .33 .47 .37 .49 .55 .27
Narrative TD 9.7 (3.0)
18.4 (3.7)
27.9 (5.7)
69.7 (20.4)
140.1 (31.4)
207.2 (44.9)
8.8 (3.0)
9.0 (2.0)
8.8 (1.5)
39.4 (9.1)
81.6 (14.2)
119.9 (17.5)
.4 (.7)
.6 (9)
.9 (.9)
LI 15.3 (3.8)
25.7 (4.9)
8.7 (2.5)
44.3 (19.4)
88.3 (37.5)
142.3 (47.9)
6.9 (2.1)
6.3 (1.7)
6.2 (1.3)
20.7 (8.5)
43.0 (15.9)
69.0 (15.5)
3.3 (3.2)
8.7 (5.0)
13.3 (5.0)
ηηηη2 .13 .10 .03 .21 .30 .25 .06 .23 .34 .42 .54 .59 .44 .72 .86 .35
Interview TD 8.2 (3.2)
16.9 (4.7)
26.4 (6.8)
59.9 (27.7)
119.8 (45.1)
187.8 (62.4)
7.9 (2.4)
7.7 (1.9)
7.9 (1.4)
36.3 (14.5)
73.3 (22.8)
112.4 (34.6)
.3 (.6)
.4 (.6)
1.6 (2.0)
LI 8.7 (2.5)
17.0 (1.0)
29.3 (3.5)
38.7 (9.0)
72.3 (22.9)
156.0 (38.4)
5.0 (1.1)
4.7 (1.4)
5.6 (.5)
17.7 (2.5)
39.0 (7.2)
74.3 (9.9)
3.0 (2.6)
5.3 (4.7)
8.0 (7.5)
ηηηη2 .00 .00 .03 .10 .17 .04 .21 .31 .23 .24 .30 .19 .49 .54 .38 .22
Mean ηηηη2 .11 .25 .26 .43 .48
26
largest differences in description of individual pictures and the smallest group differences on the
interview tasks.
When comparing language performance measures, there were larger group differences in
mean effect size for the NDW and Err/Omit measures. The NDW measure had the smallest
group differences on the interview task. The smallest group differences were found with the
NTU measure, with the largest group differences in the description of individual pictures and the
smallest group differences on the interview tasks.
Chapter 4: Discussion
The purpose of this study was to document the properties of short language samples and
to determine if short language samples can distinguish between typically developing children and
those with language impairments. This study examined the differences found between typically
developing children on general language performance measures including Number of Different
Words, Number of Total Words, Number of Total Utterances, Mean Length of Utterances, and
Errors/Omissions. Four elicitation tasks were completed with 14 study participants in the Chapel
Hill cohort and 16 participants from the Greenville cohort. Each task was administered three
times, generating three separate 1-minute language samples that were used in the final analyses.
The tasks included descriptions of individual pictures, multi-scene picture description, narrative
and interviews ranging from the most structured to least structured (as listed here). Language
sample analysis, the recommended standard for differentiation between children with language
impairments and those who are typically developing, can be a time consuming endeavor. This
study investigates the use of short samples to thereby make LSA a more clinically feasible means
of documenting treatment progress. Several measures and elicitations methods have the
potential to distinguish those with language impairments from children with typically developing
language.
Properties of Measures from Typically Developing Children
A positive correlation was seen on all elicitation tasks in analyses of the linguistic
utterances from typically developing children on a variety of measures. For most task
intercorrelations of elicitation tasks, the increased number of samples led to an increase in
correlation. For most of the measures, there was greater variability across the measures when
examining one sample (r=.18-.69) and two samples (r=.28-.82) than when analyzing three
28
samples (r = .43-.89) suggesting that when more data is available, more meaningful information
is found. This implies that clinicians need to collect multiple samples to achieve validity, a task
that is not often feasible in a single diagnostic session. However, multiple language samples
could be collected to monitor progress of children enrolled in a treatment program. Because the
samples are one minute in length, they could be administered more frequently than a traditional
language sample analysis. Several samples could be collected over the course of a few therapy
sessions and the data could be combined, presumably increasing the validity of the language
data. Conversely, these data suggest that sample collection time could be increased to three
minutes in length to be valid on their own; this would still be much shorter than many
recommendations in the literature (e.g., 10 minutes or 100 utterances) (Leadholm & Miller,
1992; Miller, Long McKinley, Thornman, Jones, & Nockerts, 2005).
Across the measures and listed in descending order, the Number of Different Words,
Number of Total Words, Number of Total, and Mean Length of Utterance had the strongest
correlations. Though the NDW measure had the strongest correlation, another measure might be
selected for implementation with various children. For example, there was very little difference
in the intercorrelation strength of the NDW measure and the others, so there would be minimal
loss from choosing among these measures. Language transcription is required to use the NDW
measure, because it requires examining the language sample in its entirety. A transcription of
the language sample may not be needed for the NTW measure, the NTU measure, or the MLU
since these measures can be calculated without full orthographic transcription. Emerging
evidence has shown that examiners can calculate these measures in real time with a good level of
accuracy, which is a substantial benefit to clinical feasibility (Naylor & Heilmann, 2011).
29
The errors and omissions measure yielded the weakest intercorrelations and produced
inconsistent correlations as the number of samples analyzed increased. The likely rationale for
this is that the specific errors and omissions did not occur frequently; the children did not
produce many errors or omissions during the tasks.
Of the sampling contexts, the description of individual and multi-scene picture context
had the strongest intercorrelations overall. These tasks provided the most structure, requiring
that the child talk about what was presented in the picture without formulating a story to go with
the picture or answer questions to an interview. Because of the structure, there is potentially less
variability in the vocabulary available to the child and the response also requires the least amount
of discourse organization. Also, the child must organize the structure of the story in a narrative
and must respond to the examiner’s cues and responses during a conversation. These variables
are not a factor in the 1-sentence responses of the individual picture descriptions.
Comparison of Children with Language Impairments and Typically Developing Children
Typically developing children were compared with children with language impairments
to investigate differences between groups by comparing the effect sizes from ANOVA tests. It
should be noted that these measures are exploratory and should be examined with caution due to
the small number of participants used in the study.
Larger the effect sizes found between groups are the result of larger group differences on
the elicitation tasks and language sample measures. The largest group differences were found
with NDW and ErrOmit measures. Watkins (1995) found that children with language
impairments produce significantly fewer different words than typically developing children.
Children with language impairments tend to produce more grammatical errors as well as omit
more words and morphemes than age-equivalent peers (Bedore & Leonard, 1998). Thus the
30
results of this study are consistent with previous research findings of children with specific
language impairments. The large group differences provide information on measures that can
discriminate between those with language impairments and those that do not.
The smallest group differences were seen with the NTU measure, with the typically
developing children and children with language impairments producing almost the same number
of utterances on the less structured tasks. In addition, the smallest group differences were noted
on the interview task when comparing elicitation methods. These small group differences did
not distinguish the children with language impairments from typically developing children as
much as measures and tasks with larger group differences.
The typically developing children had higher average on MLU. This was expected
because research has shown that children with language impairments produce shorter utterances
(Watkins, Kelly, Harbers, & Hollis, 1995). Moreover, there were less errors/omissions produced
by the typically developing children. NTW had strong intercorrelations on the elicitation task
comparisons, but this measure did not prove effective in discriminating between the two groups
in the effect size analysis. This is an important factor when searching for measures that can be
used to differentiate those with language impairments and those who do not.
Limitations
There were some limitations to this study. The primary limitation was the small number
of children in the group with language impairments. Because of the small sample size, the data
is representative of the children studied and may not reflect the overall trends of children with
language impairments. Studies including larger groups of children with language impairments
are needed in the future to account for the heterogeneity of children with such impairments.
Furthermore, studies are needed that compare the short language sample measures with well-
31
established measures like comprehensive language samples and standardized tests. This external
comparison measure would improve validity of the short samples.
Conclusions
This study demonstrated that short language samples can provide meaningful information
to clinicians. These samples can improve clinical feasibility since they take less time to
administer and analyze. They can assist clinicians in making data-based decisions for the
purposes treatment planning and progress.
REFERENCES
American Speech-Language-Hearing Association. (1997). Guidelines for Audiologic Screening [Guidelines]. Available from www.asha.org/policy.
Aram, D. M., Morris, R., & Hall, N. E. (1993). Clinical and research congruence in identifying children with specific language impairment. Journal of Speech, Language and Hearing Research, 36(3), 580.
Balason, D. V., & Dollaghan, C. A. (2002). Grammatical morpheme production in 4-year-old children. Journal of Speech, Language & Hearing Research, 45(5), 961.
Bedore, L. M., & Leonard, L. B. (1998). Specific language impairment and grammatical morphology: A discriminant function analysis. Journal of Speech, Language, and Hearing Research, 41(5), 1185.
Campbell, T., Dollaghan, C., Needleman, H., & Janosky, J. (1997). Reducing bias in language assessment: Processing-dependent measures. Journal of Speech, Language, and Hearing Research, 40(3), 519.
Deno, S. L. (1985). Curriculum-based measurement: The emerging alternative. Exceptional Children, 52(3), 219-232.
Dollaghan, C., & Campbell, T. F. (1998). Nonword repetition and child language impairment. Journal of Speech, Language, and Hearing Research, 41(5), 1136.
Dunn, M., Flax, J., Sliwinski, M., & Aram, D. (1996). The use of spontaneous language measures as criteria for identifying children with specific language impairment: An attempt to reconcile clinical and research incongruence. Journal of Speech, Language and Hearing Research, 39(3), 643.
Fazio, B. B., Naremore, R. C., & Connell, P. J. (1996). Tracking children from poverty at risk for specific language impairment: A 3-year longitudinal study. Journal of Speech and Hearing Research, 39(3), 611.
Fletcher, P., & Peters, J. (1984). Characterizing language impairment in children: An exploratory study. Language Testing, 1(1), 33.
Fluharty, N. B. (2000). Fluharty-2 preschool speech and language screening test - second edition Super Duper Publications.
Fuchs, L. S. (2004). The past, present, and future of curriculum-based measurement research. School Psychology Review, 33(2), 188-193.
Fuchs, L. S., & Deno, S. L. (1991). Paradigmatic distinctions between instructionally relevant measurement models. Exceptional Children, 57(6), 488-500.
Fuchs, L. S., Fuchs, D., Hosp, M. K., & Jenkins, J. R. (2001). Oral reading fluency as an indicator of reading competence: A theoretical, empirical, and historical analysis. Scientific Studies of Reading, 5(3), 239-256.
Fuchs, L. S., Fuchs, D., & Maxwell, L. (1988). The validity of informal measures of reading comprehension. Remedial and Special Education, 9(2), 20-28.
Harlen, W., & James, M. (1997). Assessment and learning: Differences and relationships.. Assessment in Education: Principles, Policy & Practice, 4(3), 365.
Heilmann, J. (2011). [Identification of Potential General Outcome Measures for Children's Oral Language Skills]. Unpublished raw data.
Heilmann, J, Miller, J. F., Iglesias, A., Fabiano-Smith, L., Nockerts, A., & Andriacchi, K. D. (2008). Narrative transcription accuracy and reliability in two languages. Topics in Language Disorders, 28(2), 178.
Heilmann, J, Miller, J. F., & Nockerts, A. (2010). Using language sample databases. Language, Speech, and Hearing Services in Schools, 41(1), 84.
Hintze, J. M., Christ, T. J., & Methe, S. A. (2006). Curriculum-based assessment. Psychology in the Schools, 43(1), 45-56. doi:10.1002/pits.20128
Kazdin, A. E. (1977). Assessing the clinical or applied importance of behavior change through social validation. Behavior Modification, 1(4), 427-452.
Lahey, M. (1990). Who shall be called language disordered? some reflections and one perspective. Journal of Speech and Hearing Disorders, 55(4), 612.
Leadholm, B. J., & Miller, J. F. (1992). Language sample analysis: The Wisconsin guide. Madison: Wisconsin Dept. of Public Instruction.
LinguiSystems. (1993). SPARC picture scenes LinguiSystems.
Loban, W. (1976). Language development: Kindergarten through grade twelve Natl Council of Teachers.
McCauley, R. J. (2001). Examining change: Is this child's language changing? In Assessment of language disorders in children (pp. 293). Mahwah, NJ: Lawrence Erlbaum Associates.
Miller, J. F., & Chapman, R. S. (1981). The relation between age and mean length of utterance in morphemes. Journal of Speech, Language and Hearing Research, 24(2), 154.
Miller, J. F., Long, S., McKinley, N., Thornman, S., Jones, M., & & Nockerts, A. (2005). Language sample
analysis II: The Wisconsin guide. Madison: Wisconsin Dept. of Public Instruction.
Naylor, J. & Heilmann, J. (2011). [Feasibility of efficient scoring procedure for oral language general outcomes measures]. Unpublished raw data.
Plante, E., & Vance, R. (1994). Selection of preschool language tests: A data-based approach. Language, Speech, and Hearing Services in Schools, 25(1), 15.
Tager-Flusberg, H., & Cooper, J. (1999). Present and future possibilities for defining a phenotype for specific language impairment. Journal of Speech, Language & Hearing Research, 42(5), 1275.
Tilstra, J., & McMaster, K. (2007). Productivity, fluency, and grammaticality measures from narratives: Potential indicators of language proficiency? Communication Disorders Quarterly, 29(1), 43.
Tomblin, J. B., Records, N. L., & Zhang, X. (1996). A system for the diagnosis of specific language impairment in kindergarten children. Journal of Speech, Language and Hearing Research, 39(6), 1284.
Ukrainetz, T. A. (2006). The implications of RTI and EBP for SLPs: Commentary on LM justice. Language, Speech, and Hearing Services in Schools, 37(4), 298.
Watkins, R. V., Kelly, D. J., Harbers, H. M., & Hollis, W. (1995). Measuring children's lexical diversity: Differentiating typical and impaired language learners. Journal of Speech, Language and Hearing Research, 38(6), 1349.
Webber, S. G. (2005). Webber photo cards - story starters. Greenville, SC: Super Duper Publications.
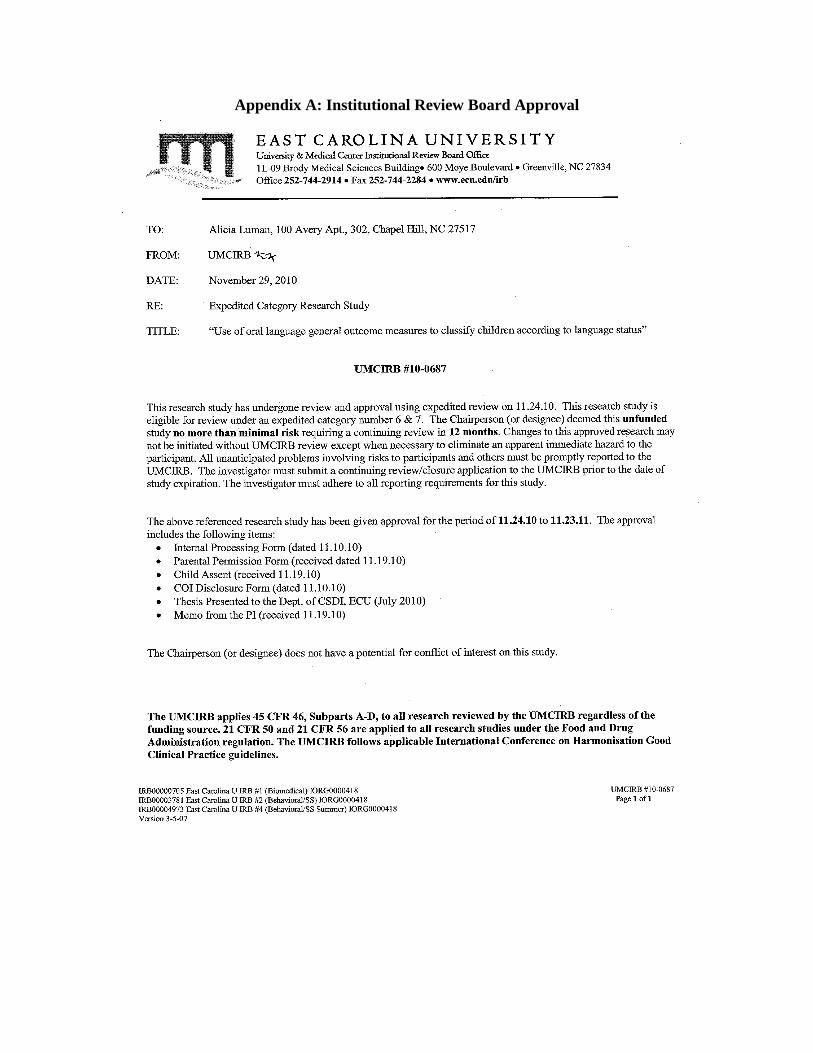
Appendix A: Institutional Review Board Approval
Appendix B: Elicitation Protocol
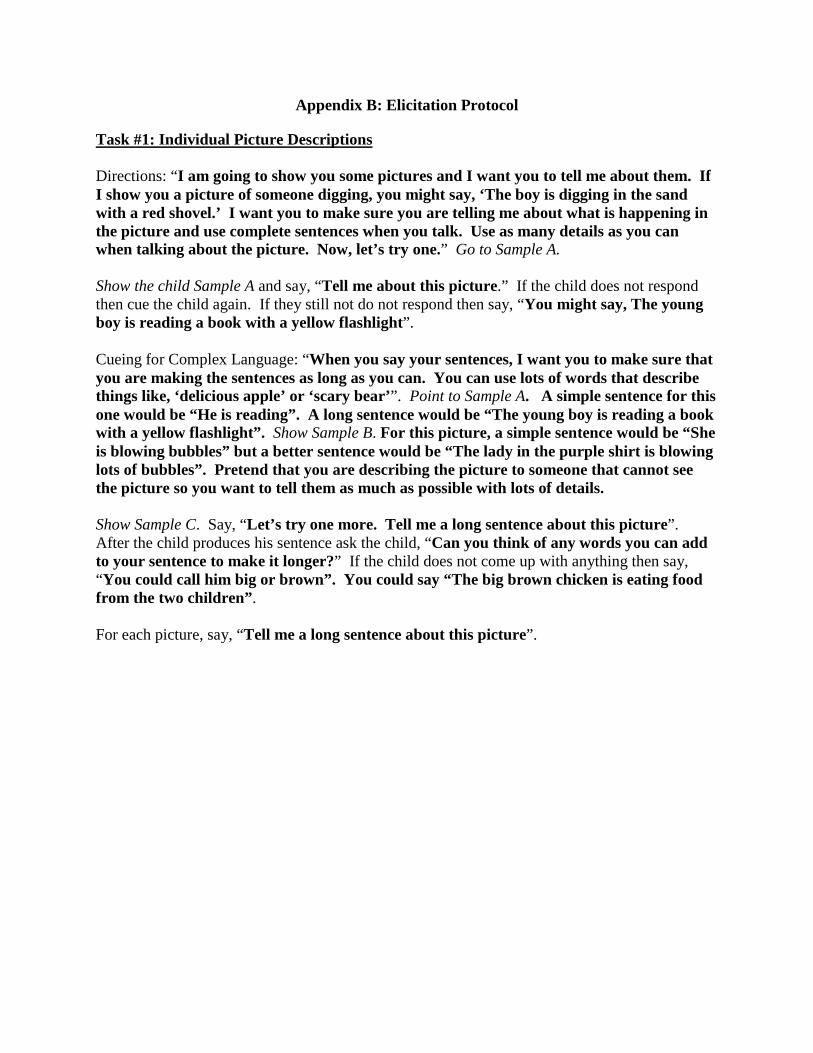
Task #1: Individual Picture Descriptions
Directions: “I am going to show you some pictures and I want you to tell me about them. If I show you a picture of someone digging, you might say, ‘The boy is digging in the sand with a red shovel.’ I want you to make sure you are telling me about what is happening in the picture and use complete sentences when you talk. Use as many details as you can when talking about the picture. Now, let’s try one.” Go to Sample A. Show the child Sample A and say, “Tell me about this picture.” If the child does not respond then cue the child again. If they still not do not respond then say, “You might say, The young boy is reading a book with a yellow flashlight”. Cueing for Complex Language: “When you say your sentences, I want you to make sure that you are making the sentences as long as you can. You can use lots of words that describe things like, ‘delicious apple’ or ‘scary bear’”. Point to Sample A. A simple sentence for this one would be “He is reading”. A long sentence would be “The young boy is reading a book with a yellow flashlight”. Show Sample B. For this picture, a simple sentence would be “She is blowing bubbles” but a better sentence would be “The lady in the purple shirt is blowing lots of bubbles”. Pretend that you are describing the picture to someone that cannot see the picture so you want to tell them as much as possible with lots of details. Show Sample C. Say, “Let’s try one more. Tell me a long sentence about this picture”. After the child produces his sentence ask the child, “Can you think of any words you can add to your sentence to make it longer?” If the child does not come up with anything then say, “You could call him big or brown”. You could say “The big brown chicken is eating food from the two children” . For each picture, say, “Tell me a long sentence about this picture”.
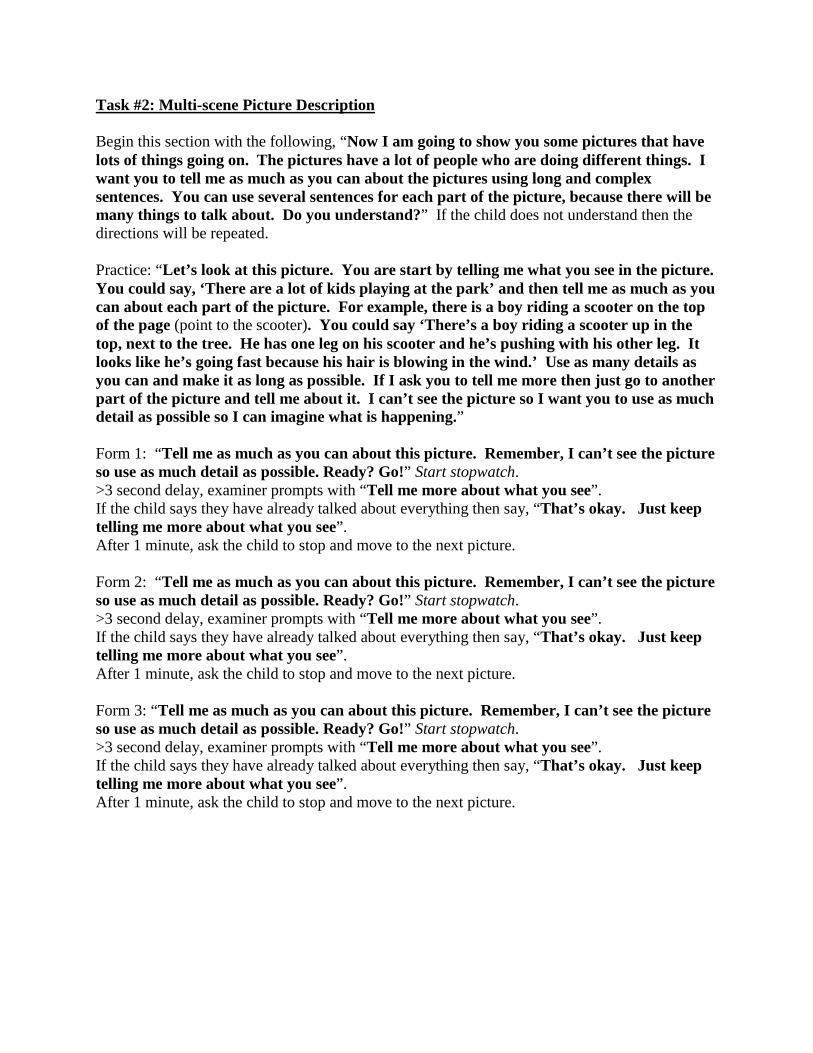
Task #2: Multi-scene Picture Description
Begin this section with the following, “Now I am going to show you some pictures that have lots of things going on. The pictures have a lot of people who are doing different things. I want you to tell me as much as you can about the pictures using long and complex sentences. You can use several sentences for each part of the picture, because there will be many things to talk about. Do you understand?” If the child does not understand then the directions will be repeated. Practice: “Let’s look at this picture. You are start by telling me what you see in the picture. You could say, ‘There are a lot of kids playing at the park’ and then tell me as much as you can about each part of the picture. For example, there is a boy riding a scooter on the top of the page (point to the scooter). You could say ‘There’s a boy riding a scooter up in the top, next to the tree. He has one leg on his scooter and he’s pushing with his other leg. It looks like he’s going fast because his hair is blowing in the wind.’ Use as many details as you can and make it as long as possible. If I ask you to tell me more then just go to another part of the picture and tell me about it. I can’t see the picture so I want you to use as much detail as possible so I can imagine what is happening.” Form 1: “Tell me as much as you can about this picture. Remember, I can’t see the picture so use as much detail as possible. Ready? Go!” Start stopwatch. >3 second delay, examiner prompts with “Tell me more about what you see”. If the child says they have already talked about everything then say, “That’s okay. Just keep telling me more about what you see”. After 1 minute, ask the child to stop and move to the next picture. Form 2: “Tell me as much as you can about this picture. Remember, I can’t see the picture so use as much detail as possible. Ready? Go!” Start stopwatch. >3 second delay, examiner prompts with “Tell me more about what you see”. If the child says they have already talked about everything then say, “That’s okay. Just keep telling me more about what you see”. After 1 minute, ask the child to stop and move to the next picture. Form 3: “Tell me as much as you can about this picture. Remember, I can’t see the picture so use as much detail as possible. Ready? Go!” Start stopwatch. >3 second delay, examiner prompts with “Tell me more about what you see”. If the child says they have already talked about everything then say, “That’s okay. Just keep telling me more about what you see”. After 1 minute, ask the child to stop and move to the next picture.
Task #3: Narrative Picture Description
Show Sample picture. Say, “Now I’m going to tell a story that goes with the picture you see here (point to Sample). I want to you listen very carefully to my story and listen to all of the parts. I’m going to tell you about things that happened before this picture, in this picture, and after this picture. Good stories have exciting characters that do interesting things. I want you to listen carefully because when I am finished, you are going to make up a story about another picture.” “I’m going to call this story “The Grocery Problem”. Now I’m going to start by telling you about things that happened before the picture. Once upon a time, there was a woman named Hannah. She was always busy with her job and taking care of her children. One day she needed to go to the store and get some groceries. Next I’m going to tell you about things that are happening in the picture. Hannah found all of the different things she needed to make dinner that night. She got in line to pay for her groceries. The man at the cash register put all of the groceries in a big paper bag. The bag was very full and it was heavy. Hannah paid the man for the groceries and started to leave. Right before she walked out the door, her bag ripped and all of the food she bought fell onto the floor. The eggs and milk broke and made a huge mess. She was not sure what to do. Last, I’m going to tell you about things that I think happened after the picture. The man working at the store didn’t want anyone to slip and fall on the mess so he went to get a broom to clean it up. Another man at the store helped Hannah replace all of the groceries that had broken. Hannah was so happy that someone helped her get more groceries and clean up the mess. Did you hear how I described all the important parts that you need when you tell a good story? My story has all of the important parts: a setting, characters, events, a problem, and a resolution.” Form 1: “Here is a picture that I want you to tell a story about. In the picture, there is some sort of problem. I want you to look at it carefully and think of a story to tell. Think about what happened before the scene in the picture, what happened in the picture, and what happened afterward. Try to tell the best story and include as many details as you can think of. Make your story as long and as complete as you can. Think about your story now.” (Start stopwatch). After 30 seconds say, “Now I would like you to tell me a story about the picture. Remember to tell me about things that happened before the picture, in the picture, and after the picture. Make it as long and as interesting as possible.” If the child fails to begin speaking after 5 seconds, then tell the child “Tell me how this story begins.” If the child fails to respond after another 5 seconds then rephrase the question into “How does the story begin?” If there is still no response then discontinue testing. Extending the narrative 1. If the child pauses for more than 5 seconds and has not finished his story, ask for more information by using an open ended statement like “Tell me about what happened next”. 2. 3 elicitation cues can be given, if needed.
Form 2: “Here is a picture that I want you to tell a story about. In the picture, there is some sort of problem. I want you to look at it carefully and think of a story to tell. Think about what happened before the scene in the picture, what happened in the picture, and what happened afterward. Try to tell the best story and include as many details as you can think of. Make your story as long and as complete as you can. Think about your story now.” (Start stopwatch). After 30 seconds say, “Now I would like you to tell me a story about the picture. Remember to tell me about things that happened before the picture, in the picture, and after the picture. Make it as long and as interesting as possible.” If the child fails to begin speaking after 5 seconds, then tell the child “Tell me how this story begins.” If the child fails to respond after another 5 seconds then rephrase the question into “How does the story begin?” If there is still no response then discontinue testing. Extending the narrative 1. If the child pauses for more than 5 seconds and has not finished his story, ask for more information by using an open ended statement like “Tell me about what happened next”. 2. 3 elicitation cues can be given, if needed. Form 3: “Here is a picture that I want you to tell a story about. In the picture, there is some sort of problem. I want you to look at it carefully and think of a story to tell. Think about what happened before the scene in the picture, what happened in the picture, and what happened afterward. Try to tell the best story and include as many details as you can think of. Make your story as long and as complete as you can. Think about your story now.” (Start stopwatch). After 30 seconds say, “Now I would like you to tell me a story about the picture. Remember to tell me about things that happened before the picture, in the picture, and after the picture. Make it as long and as interesting as possible.” If the child fails to begin speaking after 5 seconds, then tell the child “Tell me how this story begins.” If the child fails to respond after another 5 seconds then rephrase the question into “How does the story begin?” If there is still no response then discontinue testing. Extending the narrative 1. If the child pauses for more than 5 seconds and has not finished his story, ask for more information by using an open ended statement like “Tell me about what happened next”. 2. 3 elicitation cues can be given, if needed.
Task #4: Structured Interview
Begin this task by saying, “Now I’m going to ask you about things that you like to do and I want you to tell me as much as you can and I want your answers to be full of details. For example, if someone asked my pets, I would tell them all about my dog. (Pause for 2 seconds). My dog’s name is Buddy. He’s a big dog with soft yellow fur. My mom got him for me. We went to the pet store and there were a lot of dogs outside. They were dogs that needed new homes. Before we brought him home, we had to make sure we had everything he needs. We built him a fence and got him a dog house. He loves to go for walks and I take him out every morning.” “You just heard me tell you about something that I really like. Now I’m going to ask you about things you do. I want you to tell me as much as you can. Do you understand?” Prompting Initiating the story: Start stopwatch after asking the first scripted question. After 5 seconds with no response then rephrase the question. If there is still no response after another 5 seconds then rephrase the question again. Expanding the Conversation: Allow the child to talk about the topic at hand. After a 3 second pause, ask for more information by using an open ended statement like “Tell me more about ____”. 5 elicitation cues can be provided. After 5 cues, move on to the next question. After 1 minute, go to the next question set. Form 1 What can you tell me about your family? Tell me about a time when you got hurt. What do you like to do outside? Form 2 Tell me about some TV shows or movies you watch? What can you tell me about your friends? Can you tell me about a trip or vacation your family took? Form 3 Tell me about where you live. What do you do when it’s raining outside? What does your family do for dinner?