Embed Size (px)
Citation preview

Influence of Geometrical Parameters of Open-Cell Aluminum Foam on
Thermo-Hydraulic Performance
Peter De Jaeger1,2, Christophe T’Joen1, Henk Huisseune1, Bernd Ameel1, Sven De Schampheleire1, Michel De Paepe1
1 Department of Flow, Heat and Combustion Mechanics, Ghent University, Ghent, Belgium2 NV Bekaert SA, Zwevegem, Belgium
Address correspondence to Peter De Jaeger, Department of Flow, Heat and Combustion Mechanics, Ghent University, Sint-Pietersnieuwstraat 41, 9000 Ghent, BelgiumE-mail: [email protected]. : +32 (0)9 264 32 94, Fax. : +32 (0)9 264 35 76
1

ABSTRACT
The influence of the geometry of open-cell aluminum foam on the thermo-hydraulic
behavior in channel flow is investigated. The mean cell diameter and the strut cross-sectional
surface area are chosen as geometrical parameters, ranging respectively between 1.2-5.2 mm
and 0.0125-0.17 mm2. The flow arrangement, as well as the operating conditions are fixed. A
numerical model is implemented in a commercial solver, based on volume averaging theory. The
model is validated against experimental data. The porous properties, which take the sub-REV
scaled physics in account, are written as a function of both the geometrical parameters. The
thermo-hydraulic characteristics of sixteen, well-chosen foams, are used to build a surrogate
model. An ordinary Kriging model is used for this, indicating that the root mean square error of
interpolated results are lower than 0.6 and 3% for respectively heat transfer and total pressure.
The resulting heat transfer and total pressure difference is non-dimensionalized by
dividing them with the results obtained from an empty channel. The relative increment of the
pressure drop is an order of magnitude higher than the increment observed for heat transfer.
Consequently, the applied performance evaluation criterion (defined as the ratio of
dimensionless heat transfer versus total pressure) is mainly influenced by the hydraulic
performance. For the given application, a clear optimum is found. The proposed method allows
to perform the parameter study with acceptable computational cost with a sufficient level of
detail from an engineering perspective.
2

INTRODUCTION
Foams are well known in our day to day lives, such as soap froths, bread... The foams
discussed in this paper shows great resemblance with soap froth, where gas bubbles start to grow
in a liquid and form cells. During a typical foaming process, excess fluid drains along channels at
the cell borders, which obey to the Plateau rules[1]. When an equilibrium is reached, a well-
defined structure is formed. A first detailed description of the structure of foams was given in the
19th century by Joseph Plateau [2], resulting in four laws which bore his name. The involved
hydrodynamics are determined by an interplay of gravity, diffusion, viscous forces and surface
tension [3]. It has been proven that the Plateau rules are a necessary consequence of surface
energy minimization in this system of interacting forces [4]. This minimization was earlier
conjectured by Sir Thomson [5], while asking: what is the space-filling arrangement which
divides space in equal-volume cells with minimum surface area? He conjectured that the solution
is a truncated octahedron, i.e. a tetrakaidecahedron, which is periodically repeated on a body-
centered cubic (BCC) lattice. Till today, this is still believed to be the optimal single-cell
structure.
By using a liquid which solidifies after the aforementioned equilibrium is reached, a solid
foam matrix is formed. This procedure results in a so-called closed-cell foam. The cell walls
consist of a thin film. Typically, an organic material (commonly polyurethane) is used to
manufacture such closed-cell foams. The resulting films bare significantly less material than the
cell borders, formed during the foaming process, contain. It allows to remove these films in an
efficient manner (i.e. reticulate). This yields an open-cell foam. Both foam types are depicted in
Fig.1. The structure of an open-cell foam consists of the remaining material. Note that if this
remaining material accounts for more than 1% of the total foam external dimensions volume, the
structure is called a `wet' foam, and `dry' foam otherwise [6].
The foaming process is affected by gravity, typically resulting in a non-uniform drainage
in the wet foam, creating a heterogeneous and orthotropic structure. This results in a stochastic
nature of open-cell foam. Nevertheless, it is possible to distinguish characteristic geometrical
features. The bubbles can be regarded as non-overlapping sub-units, i.e. the cells. Each cell is
surrounded by 13.6 faces on average[7]. For open-cell foams, an opening in such a face is called
a pore. A pore allows for penetration of fluid to neighboring cells. The cell borders are typically
3

named struts or ligaments. According to the Plateau laws, four struts have to meet in a vertex,
which is called a node. This ensures an interconnected solid phase, which spans the entire foam
domain. The introduced terminology is illustrated in Fig. 1.
An organic foam (e.g. polyurethane) is commonly used as preform for reproduction of
other material open-cell foams, such as graphite, ceramics or metals. Focusing on the latter, two
manufacturing techniques can be distinguished: deposition and replication. From a heat transfer
perspective, the main difference in the resulting open-cell metal foam is that the former consists
of hollow struts, while the latter has completely filled solid struts. Therefore, the transport of
thermal energy in the solid phase will be influenced significantly, indeed resulting in a
substantially higher effective thermal conductivity in case of completely filled struts [8].
Therefore, replicated open-cell foams are more suited for thermal applications, and these are
considered in this work.
The resulting metal foam structure possesses interesting properties, such as low weight
because of the high porosity (> 0:85), large interfacial surface area between solid and fluid phase
(between 300 and 1500 m2/m3) and tortuous flow paths [9]. The combination of these properties
and the high thermal conductivity of aluminum makes this a promising structure for heat transfer
applications, such as e.g. for rocket jacket cooling [10], compact heat exchangers [11, 12, 13],
diesel exhaust cooling [14], direct tube cooling [15], small-scale refrigerators [16], high heat flux
cooling [17], heat sinks for electronics [18], LED cooling in automotive applications [19], to
name a few.
Following Shah and Sekulic [20], the thermo-hydraulic performance of an application
depends on the application specific flow arrangement and operating conditions, and on its
geometrical characteristics, in case of the foam. This paper deals with the latter and provides a
computationally effective method to relate thermal and hydrodynamic characteristics of an
application to the foam’s geometrical characteristics. The influence of the cell and strut
dimensions is investigated for foams with porosity above 0.8. The flow direction is kept constant
and consists of a conventional channel flow, which is discussed in next section. The third section
of this paper discusses the thermo-hydraulic model, where the relevant porous properties are
linked with the geometric parameters. This results in an appropriate physical model which links
thermo-hydraulic performance to geometrical parameters. The parametric study is dealt with via
a surrogate model. The fourth section discusses the results.
4

FOAM SAMPLES, EXPERIMENTAL SET-UP AND ANALYSIS
Foam samples
The open-cell aluminum foams used in this paper are in-house manufactured via the
replication method (which is also referred to as investment casting). Details of this process are
scarce. A notable source of information can be found in two patents, submitted by Walz and
Cordova [21] and Walz [22]. The process basically starts with choosing a polyurethane (PU)
foam preform. This determines the final cell dimensions of the well-defined foam structure. The
PU foam gets a controlled wax coating, resulting in the template. The coating is commonly
applied by dipping the PU preform foam in a molten wax bath and subsequently removing any
wax excess mechanically by squeezing the foam and/or blowing hot air through the structure.
The resulting strut geometry consequently does not obey the surface energy minimization
principles, and thus, nor will the replicated metal foam. After filling the template with a plaster,
it gets a controlled heat treatment to harden the plaster and subsequently remove the template.
The result is a casting mould, which gets filled with liquid aluminum. After a controlled cooling
cycle, the plaster is removed from the solidified aluminum, leaving a replicate of the template in
aluminum.
Two types of commercially available PU foams are used as preform in this paper,
designated by the vendor as 10 and 20 PPI foams, with PPI expressing the number of pores per
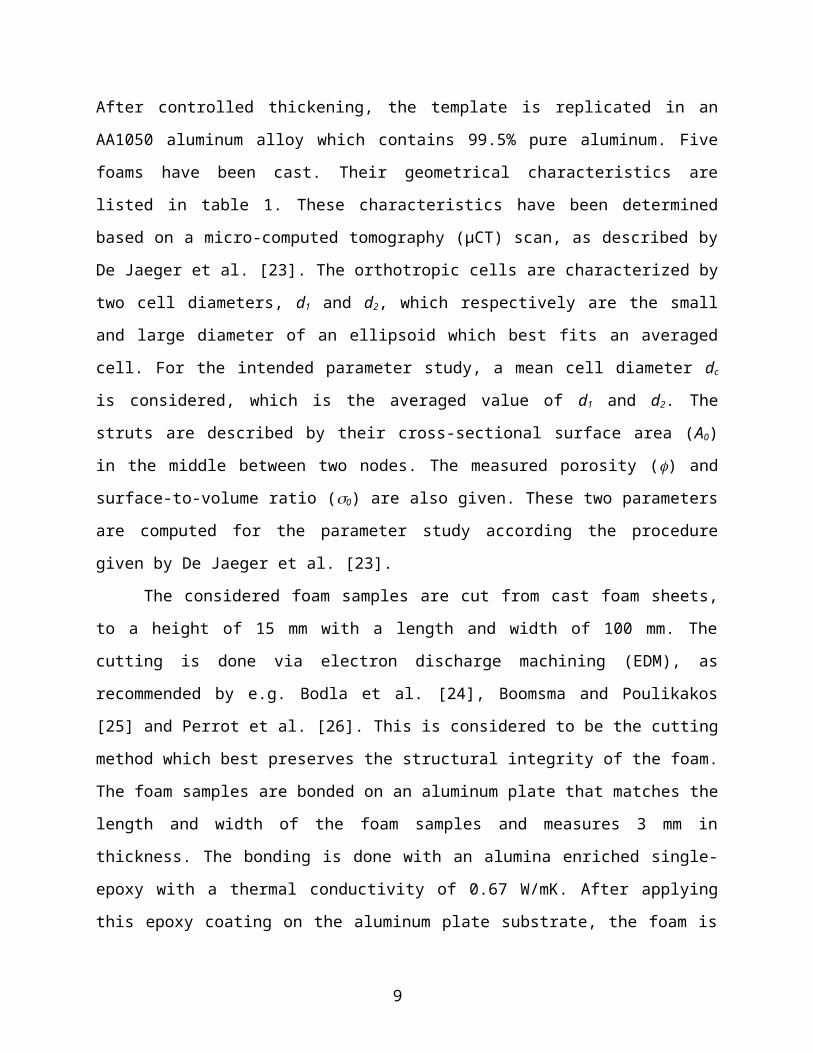
linear inch. After controlled thickening, the template is replicated in an AA1050 aluminum alloy
which contains 99.5% pure aluminum. Five foams have been cast. Their geometrical
characteristics are listed in table 1. These characteristics have been determined based on a micro-
computed tomography (µCT) scan, as described by De Jaeger et al. [23]. The orthotropic cells
are characterized by two cell diameters, d1 and d2, which respectively are the small and large
diameter of an ellipsoid which best fits an averaged cell. For the intended parameter study, a
mean cell diameter dc is considered, which is the averaged value of d1 and d2. The struts are
described by their cross-sectional surface area (A0) in the middle between two nodes. The
measured porosity () and surface-to-volume ratio (0) are also given. These two parameters are
computed for the parameter study according the procedure given by De Jaeger et al. [23].
The considered foam samples are cut from cast foam sheets, to a height of 15 mm with a
length and width of 100 mm. The cutting is done via electron discharge machining (EDM), as
5

recommended by e.g. Bodla et al. [24], Boomsma and Poulikakos [25] and Perrot et al. [26]. This
is considered to be the cutting method which best preserves the structural integrity of the foam.
The foam samples are bonded on an aluminum plate that matches the length and width of the
foam samples and measures 3 mm in thickness. The bonding is done with an alumina enriched
single-epoxy with a thermal conductivity of 0.67 W/mK. After applying this epoxy coating on
the aluminum plate substrate, the foam is pressed into the epoxy. Following the appropriate
instructions of the vendor, this foam assembly is then cured during 1 hour in an oven at 150 °C.
Epoxy has been used previously by Bhattacharya and Mahajan [18], to manufacture their
heat sinks. Experimental data was obtained and compared with modeled results. In their model,
the authors did not take the resulting thermal contact resistance (TCR) in account. This however
resulted in a significant deviation between the theoretical and experimental results. The same
epoxy as used in this paper was applied by T'Joen et al. [15]. They applied an epoxy coating
around tubes of various diameters, after which thin foam layers (ranging from 1.15 to 2.35 times
the cell diameter) were wrapped around the tubes. These foam covered tubes were then used to
design a single tube row heat exchanger, and its thermal performance was explored for a varying
inlet velocity and tube pitch. From their results, these authors also concluded that the epoxy
resulted in a significant contribution of TCR on the overall thermal resistance (ranging between 5
and 55%, depending on the tube pitch, mass flow rate, foam type...). This assessment was made
by assuming a cylindrical layer of epoxy around the tube with a conservative estimate of its
thickness (between 0.3 and 0.6 mm).
Although the resulting TCR is significant, epoxy bonding remains a viable alternative
because it is readily available for prototyping and research purposes. It however requires a good
assessment of the TCR value. A detailed investigation on the resulting TCR is done by De Jaeger
et al. [27]. Independent of pore size, porosity, aluminum alloy, foam height, air mass flow rate or
air inlet temperature, the TCR of the applied epoxy bonding in this paper equals 1.21x10 -3
m²K/W with an uncertainty of 11%.
Experimental setup
The test rig basically blows hot air through the foam assembly. The attached aluminum
plate is cooled with water from below. The aim is to measure the transferred heat, as well as the
pressure drop over the foam sample. To do so, the samples are placed in a rectangular duct with
6

height 15 mm and width 100 mm. Compressed air is taken from the available facilities and -after
drying- blown through a calibrated nozzle. Careful measurement of the pressure drop over this
nozzle (accurate to 2 Pa) allows to determine the air mass flow rate ma [kg/s], with ma = ±3%
uncertainty, according ISO5167. A pressure regulator on the compressed air supply allows to
vary ma. For the parameter study in this paper, the air mass flow rate is set to 0.002 kg/s.
After determining the air mass flow rate, the air is heated to the desired temperature (1),
which is 523K in this paper, in order to keep the operating conditions constant. The heating is
done electrically, based on the Joule effect. This can be considered 100% efficient as it has
negligible losses on the current carrying copper wires and electrical contacts. Therefore, the
amount of heat transferred to the air is the product of current and voltage, which results in an
uncertainty of Pe = ±1.5% on the electrical power.
The heated air now enters a rectangular duct with a length of 0.55 m (2), which is more
than 20 times its hydraulic diameter (Dh = 26.1 mm) assuring a fully developed flow when
entering test section (3) [28]. The temperature difference over the sample is determined from the
average value of the inlet and exit temperature. These averages are both based on five K-type
thermocouples mounted upstream and downstream of the test section respectively. The
calibration is done using a class A PT100, for temperatures reaching up to 575 K, resulting in a
maximum uncertainty of 0.5K. During a steady state measurement, all five thermocouple
readings fall within the maximum uncertainty. The heat losses along the heated duct and the test
section are minimized by insulating it with Microtherm standard block (k in < 0.025W/mK), prior
to each run.
The aluminum substrate, which is bonded underneath the foam sample, fits exactly on top
of a movable cup (4). For each test, a new sample is placed on top of this cup, after lowering it.
By subsequently moving the cup upwards, the aluminum foam slides in the rectangular duct and
gets pressed against the ceiling of the duct with a controllable pressure (6). This ensures a tight
sealing between the aluminum plate and cup, avoiding any bypass air flow.
A water supply and discharge is present on the cup via two flexible tubes (5). This allows
water to flow into the cup, underneath the aluminum plate in a channel of 5 mm height. A fully
turbulent flow is ensured by setting the average water velocity in the channel at approximately 1
m/s. The water side Reynolds number, based on the hydraulic diameter of the water channel
underneath the aluminum substrate, is 10005. By keeping this flow rate sufficiently high, the
7

temperature increase of the water is less than 0.1 K. After leaving the test rig, the water is fed to
a chiller to maintain a constant temperature at the inlet of the movable cup (290 K). As a
consequence, the water side of the test-rig can be considered isothermal.
An Agilent data logger is installed (7), allowing to automate the data processing. When
steady state condition is reached (i.e. when temperature vary within their measurement
accuracy), a reading of each sensor is registered every second during two minutes. Further
processing is done with the resulting Ndp = 120 data points. The resulting uncertainty is
calculated by taking twice the standard deviation of the 120 values and is added to the
measurement accuracy via an RMS approach [29]. The uncertainties of the thermocouples are
found to be equal and show no significant correlation with each other. Therefore, the resulting
uncertainty on the average inlet and outlet temperature (i.e. respectively Ti and To) is given by:
δT i=δ T√5
, (1)
with T being the average temperature of one sensor, for the recorded 120 data points. The
uncertainty amounts to δT i=0.34K. The same holds for the outlet temperature T0.
The thermo-physical properties of air are evaluated at the average temperature between
in- and outlet of the test section. The measured data allows to determine the heat transfer on the
air side:
Qa=mac p ∆ T , (2)
with T=Ti-To [K], c p [J/kgK] specific heat and Qa [W] the transferred heat. The resulting
uncertainty is less than 3% for all measurements.
The pressure drop over the test section is also transmitted to the Agilent data logger. The
accuracy is 0.25%, when measuring between 20 and 500 Pa.
Physical Model
In most engineering applications, heat transfer is significantly influenced by the
hydrodynamics which occur in the fluid phase. This largely depends on the flow regime, which
8
is quantified via the Reynolds number Re. In this paper, the Reynolds number is based on the
strut thickness ds and superficial velocity v. The strut thickness is determined as the equivalent
diameter of a disc with A0 as surface area. Reynolds numbers from sources in the open literature,
are converted to ensure proper evaluation. This allows to distinguish five flow regimes:
1. Creeping flow (Re < 1). This is reported by Magnico [30], based on the results of a Direct
Numerical Simulation (DNS) on a 20 PPI ( = 0.873) foam.
2. Steady laminar flow (1 < Re < 21-25). The mentioned DNS approach [30] was applied till Re
32, which indicated that the flow became unsteady near Re = 21. Local velocity
measurements were performed by Seguin et al. [31], by means of electrochemical probes in a
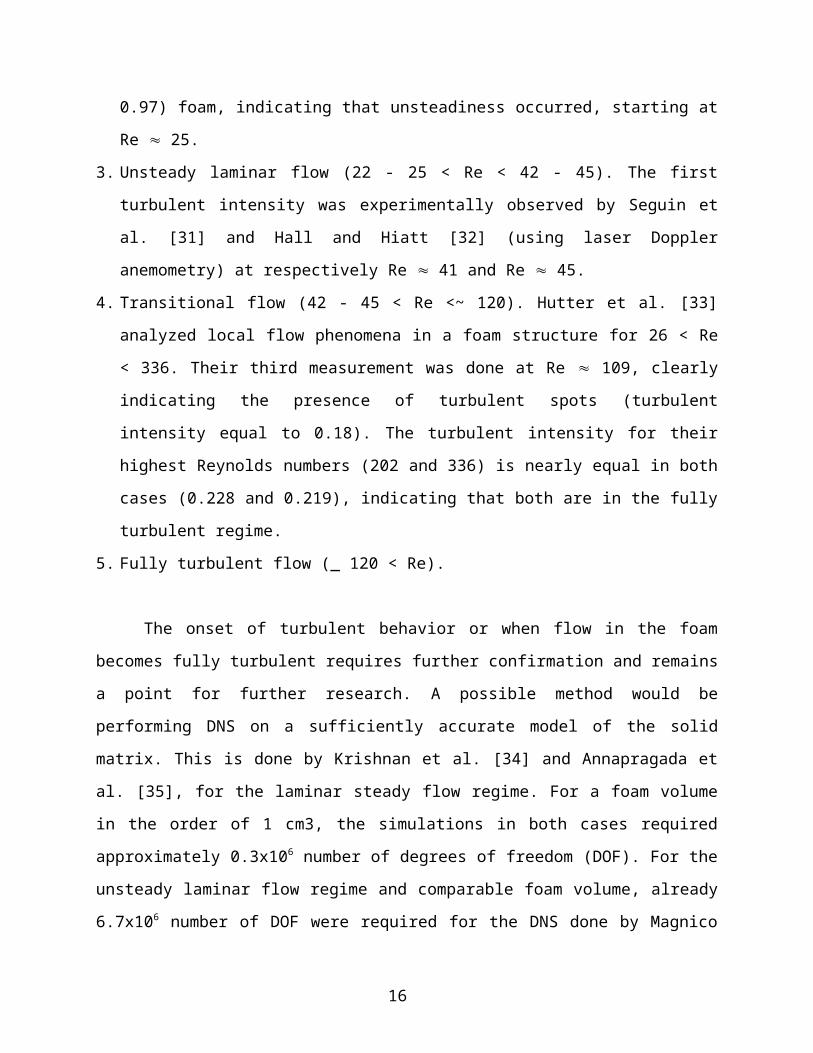
10 PPI ( = 0.971) and 20 PPI ( = 0.97) foam, indicating that unsteadiness occurred, starting
at Re 25.
3. Unsteady laminar flow (22 - 25 < Re < 42 - 45). The first turbulent intensity was
experimentally observed by Seguin et al. [31] and Hall and Hiatt [32] (using laser Doppler
anemometry) at respectively Re 41 and Re 45.
4. Transitional flow (42 - 45 < Re <~ 120). Hutter et al. [33] analyzed local flow phenomena in
a foam structure for 26 < Re < 336. Their third measurement was done at Re 109, clearly
indicating the presence of turbulent spots (turbulent intensity equal to 0.18). The turbulent
intensity for their highest Reynolds numbers (202 and 336) is nearly equal in both cases
(0.228 and 0.219), indicating that both are in the fully turbulent regime.
5. Fully turbulent flow (_ 120 < Re).
The onset of turbulent behavior or when flow in the foam becomes fully turbulent
requires further confirmation and remains a point for further research. A possible method would
be performing DNS on a sufficiently accurate model of the solid matrix. This is done by
Krishnan et al. [34] and Annapragada et al. [35], for the laminar steady flow regime. For a foam
volume in the order of 1 cm3, the simulations in both cases required approximately 0.3x10 6
number of degrees of freedom (DOF). For the unsteady laminar flow regime and comparable
foam volume, already 6.7x10⁶ number of DOF were required for the DNS done by Magnico
[30]. When the fluid flow becomes transitional, or is fully turbulent, no DNS solution can be
found in the open literature. A dynamic large eddy simulation (LES) is performed by Hutter et al.
[36] on a foam volume of 0.25 cm³, up to Re 201. This still required 3 x10⁶ DOF, to achieve a
9

sufficiently accurate solution. The resolved large scale vortices in the wakes behind struts,
provide valuable insight into the influence of the strut size and shape on the pressure drop and
induced turbulent kinetic energy. It remains however an open question if the applied sub-grid
dynamic Smagorinsky model is applicable for the small-scale eddies induced by the foam
structure. The same question holds for when turbulence is modeled via Reynolds-Averaged
Navier Stokes (RANS) models. Nevertheless, this seems currently the only possible approach
when larger foam volumes are dealt with, based on computational cost. Chung et al. [37] used a
k- SST turbulence model, allowing to solve a computational domain consisting of
approximately 6 foam cells with 1x10⁶ DOF. The range of Reynolds numbers that was covered is
between 10 and 238. The resulting pressure drop, however, underestimated experimental data
with nearly 30%. The Reynolds number range, considered in this paper, is based on the applied
superficial velocity of 2m/s. Depending on the geometrical parameters, the resulting Reynolds
number varies between 9 and 33.
It is clear that the available computational resources limit the applicability of a direct
numerical approach, to foam volumes which are considerable smaller than what is used in an
application. A possible solution is recognizing that open-cell foams are hierarchical materials
[38] with a discrete character, according the classification of porous media as outlined by
Cushman et al. [39]. This means that foams have a natural length scale which allows to make a
distinction between the physical phenomena with either smaller or larger length scales [40]. The
foam volume which matches this natural length scale is a representative elementary volume
(REV) [41]. The natural length scale of open-cell foams is approximately three cells in each
direction [42]. The resulting length-scale separation allows to average the small scaled
phenomena which occur in the REV. The information contained by these phenomena is taken in
account on a super-REV scale by introducing porous properties. This approach is theoretically
treated by Whitaker [43] and for incompressible flow, the conservation of mass, momentum,
fluid phase energy and solid phase energy are in their simplest form respectively given by:
∇ . v=0 (3)
ρf
ϕv .∇ v=−ϕ∇P+μe∇2 v−μ
κv− ρf β‖v‖v (4)
( ρ c p ) f v .∇T f=∇ . K fe∇ T f−A sf hsf (T f−T s ) (5)
10

0=∇ . K se∇T s−A sf hsf (T s−T f ), (6)
where v is the superficial averaged fluid velocity, is density of either the solid or fluid phase
(respectively denoted with subscript s or f), P is the intrinsically averaged pressure, µ is dynamic
viscosity, cp the specific heat and T is an intrinsically averaged temperature. Note that the
averaging (superficial or intrinsic) depends on the experimentally determined quantity. It is for
example easier to measure the superficial average velocity and the intrinsically averaged pressure
than their counterparts. The remaining terms in the averaged equations are porous properties
which are introduced to account for the sub-REV scale physical phenomena.
Porous Properties
Three properties are introduced in the momentum equation: effective viscosity µe,
permeability and inertial coefficient . They account for respectively the influence of the solid
matrix on the flow behavior near a confining boundary, the viscous force at the solid-fluid
interface and the form drag of the obstacles formed by the solid matrix. Magnico [30] computed
the effective viscosity by matching the boundary layer thickness to their DNS result. This way,
they obtained a value between 1.75 and 2 times the molecular viscosity, for the creeping flow
regime till unsteady laminar flow occurred. The Reynolds numbers used by Magnico [30] are
very similar to these used in this paper, making their effective viscosity model applicable. Using
either of these values, will result in a different boundary layer thickness in the foam volume
which most significantly affects the heat transfer rate. However, this difference is found to be
less than 1.5%. On pressure drop, the impact is even smaller, i.e. less than 0.05Pa. Therefore, a
constant intermediate value of 1.875 is applied in this work.
A detailed study concerning the permeability of fibrous materials is published by
Tamayol and Bahrami [45]. They performed experiments in the Darcy regime (Re << 1), which
allowed them to propose a correlation between permeability and geometrical parameters.
Furthermore, their data showed excellent agreement with the data of Bhattacharya et al. [46]
which was published almost a decade earlier. The resulting equation is given by:
11

κ=0.08 d s2 (d p−ds)
4
d p2 ds
2 ϕ0.3 , (7)
with dp the pore diameter and ds the equivalent strut diameter. As shown by Brun [47], the pore
diameter is half a cell diameter dc, while ds is derived from the cross-sectional surface area A0.
The proposed empirical relation is valid for > 0.8 [45], and will be used here.
Following Lacroix et al. [48], it is believed that the inertial coefficient can be modeled via an
empirical relation which was proposed by Ergun [49] for packed granular media. To apply this
relation, an appropriate length scale of open-cell foam is required. It is found that the equivalent
strut diameter (ds) is a representative measure. The resulting equation for the inertial coefficient
is then given by:
β=E 1−ϕds ϕ3 , (8)
where E is the Ergun constant. For the foams studied in this paper, E = 0.72. The same type of
correlation is used by Dukhan et al. [50], achieving good agreement for foams with porosity
ranging between 0.68 (after compression) and 0.92.
The term on l.h.s. and the second term on the r.h.s. of equation (4) vanish under the
condition of steady state, fully developed flow. Under this condition, it is possible to validate the
previously introduced models for and . These conditions can be obtained by measuring a
complete foam sheet, prior to cutting them to the desired dimensions. These sheets measure 450
mm in length, by 450 mm in width and a variable depth depending on the averaged cell diameter.
Measuring these sheets in a dedicated wind tunnel with channel dimensions equal to the foam
sheet length and width allows to neglect the influences of the no-slip boundaries confining the
foam volume, as reported by Dukhan and Patel [51]. The resulting pressure drop of three types of
foam is compared to the proposed model in Fig. 4. The constant E is obtained via a least-squares
minimization between modeled and measured data of foam 1 and kept constant for both other
foams. It clearly shows a good agreement. The geometrical data of the three foams was given in
table 1. Based on the study of Dukhan and Patel [51] and considering a superficial velocity of 2
12

m/s, it can be concluded that the proposed model also is applicable for the earlier described test
rig.
Additional porous properties are required for the energy equations. The solid phase effective
thermal conductivity K se in equation (6) takes the porosity into account, as well as the highly
tortuous path which is followed by the solid phase. Much work has been done in the past to
model this property (see e.g. [52, 53, 54, 55] amongst others). An often cited work is that of
Bhattacharya et al. [46]. They found excellent agreement with a simple correlation and their
experimental data for foams with porosity ranging from 0.9 to 0.98. Recalling that two separate
energy equations will be solved and the fact that the thermal conductivity of air is 4 orders of
magnitude smaller than that of the used aluminum, it allows to approximate the proposed
correlation of Bhattacharya et al. [46] as:
K se ≈ 0.35(1−ϕ)ks (9)
The data presented by Paek et al. [56] also fits very well the proposed model. Their data is
obtained for porosities ranging from 0.88 to 0.98. However, note that the empirical factor 0.35
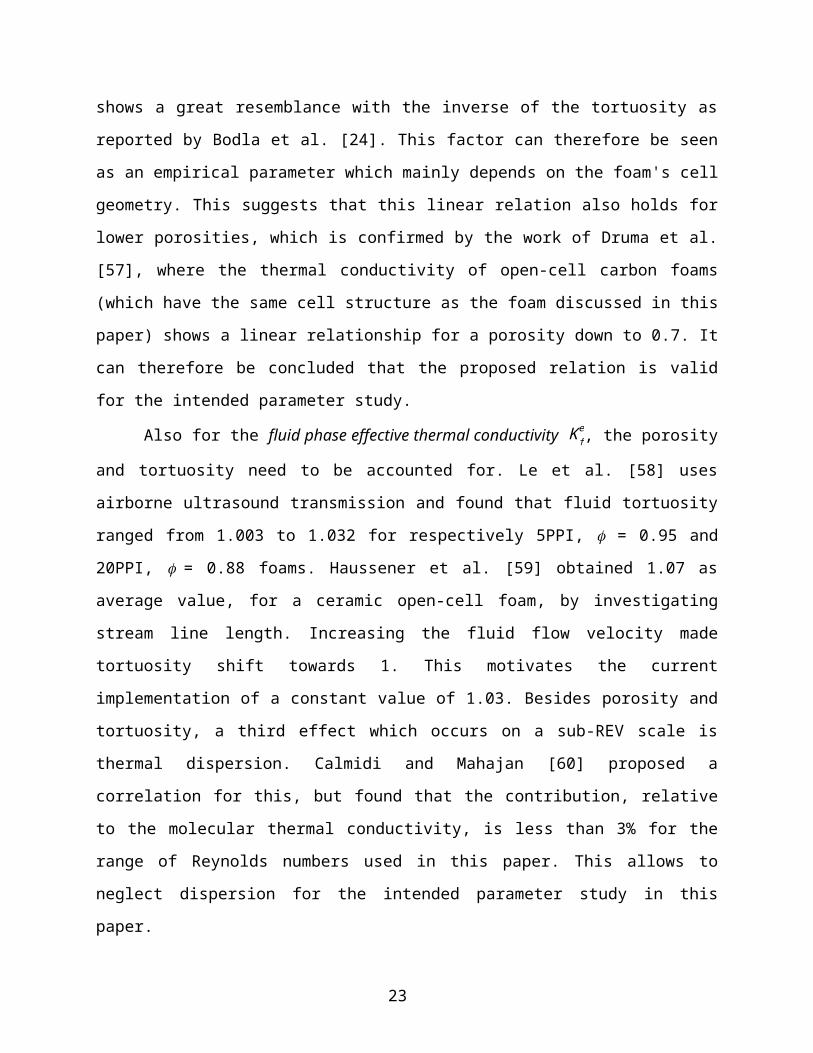
shows a great resemblance with the inverse of the tortuosity as reported by Bodla et al. [24]. This
factor can therefore be seen as an empirical parameter which mainly depends on the foam's cell
geometry. This suggests that this linear relation also holds for lower porosities, which is
confirmed by the work of Druma et al. [57], where the thermal conductivity of open-cell carbon
foams (which have the same cell structure as the foam discussed in this paper) shows a linear
relationship for a porosity down to 0.7. It can therefore be concluded that the proposed relation is
valid for the intended parameter study.
Also for the fluid phase effective thermal conductivity K fe, the porosity and tortuosity
need to be accounted for. Le et al. [58] uses airborne ultrasound transmission and found that fluid
tortuosity ranged from 1.003 to 1.032 for respectively 5PPI, = 0.95 and 20PPI, = 0.88 foams.
Haussener et al. [59] obtained 1.07 as average value, for a ceramic open-cell foam, by
investigating stream line length. Increasing the fluid flow velocity made tortuosity shift towards
1. This motivates the current implementation of a constant value of 1.03. Besides porosity and
tortuosity, a third effect which occurs on a sub-REV scale is thermal dispersion. Calmidi and
Mahajan [60] proposed a correlation for this, but found that the contribution, relative to the
13

molecular thermal conductivity, is less than 3% for the range of Reynolds numbers used in this
paper. This allows to neglect dispersion for the intended parameter study in this paper.
The heat transfer between both phases is accounted for via an interstitial heat transfer
coefficient hsf. Many correlations have been proposed in the past. Most often this is an averaged
value, derived from a black-box analysis of a given application, see e.g. [61, 62]. In this case,
however, the local heat transfer coefficient is required. Following the work of Calmidi and
Mahajan [60], a correlation which strongly resembles the correlation for a staggered tube bank
[63] is found appropriate. The same is confirmed by Ghosh [64]. Tamayol and Hooman [65] also
used this correlation, with good agreement with their own experimental data. The appropriate
correlation of Zukauskas and Ulinskas [63] is given by:
Nuf =1.04 ℜd s
0.4 Pr0.36( PrPr sf )
0.25
(10)
Following Nakayama et al. [66], however, the proportionality constant 1.04 depends on the solid
matrix. These authors propose a dependency with porosity. Applying this recommendation
results in following dimensionless interstitial heat transfer coefficient:
Nuf =0.2( ϕ1−ϕ)
2/3
ℜds
0.4 Pr0.36( PrPr sf )
0.25
(11)
Numerical approach
A numerical approach is applied to solve the governing equations. A two-dimensional
approximation is used here. This neglects the influence of the no-slip wall boundaries on the
front and on the back of the test section. The resulting geometry is depicted in Fig. 3. Remark
that the equations can be written as classical transport equations, allowing them to be applied
into well-established computational fluid dynamics (CFD) code. The commercial solver Fluent
was used here, with the classical velocity inlet and pressure outlet boundary conditions, as
depicted in Fig. 3. All walls are considered adiabatic, except for the bottom of the substrate,
where a convective cooling towards the constant water temperature is specified. The convection
coefficient is determined via the well-established Gnielinski correlation [69]. At the interface
14

between a free fluid and porous zone, velocity, shear stress and heat flux are considered
continuous. A user defined scalar field is solved as the solid phase in the foam volume (i.e.
equation (6)). The coupling between fields, boundary conditions and properties are implemented
via user defined functions. Special care is taken to model the TCR. Two temperature jumps are
introduced at the interface between the substrate and respectively the foam's solid and fluid
phase. Indeed, a different behavior for both phases is to be expected, as the contact with the solid
phase not only depends on the filler material but also on the amount of struts which make contact
[27, 44]. Following the results of T'Joen et al. [15], an epoxy layer thickness of 0.3 mm is
assumed. This allows to determine the fluid phase TCR. The TCR value for the solid phase was
mentioned earlier and kept constant at 1.21x10⁻³ m2K/W. The resulting temperature jumps
between substrate and the foam’s solid phase, respectively air, is computed by multiplying the
local heat transfer with the appropriate thermal contact resistance.
The segregated solver is used because it does not include the pressure work term or
kinetic energy contribution by default when solving incompressible flow. The pressure
correction is obtained via the SIMPLE algorithm. The convective terms are discretized via a
second order upwind scheme, while diffusion terms are second order accurate central
differenced. Convergence is reached if the residuals of continuity, momentum, solid and fluid
phase energy are respectively below 1x10⁻⁶, 1x10⁻⁸, 1x10⁻¹⁰ and 1x10-11. For all computed cases,
the heat balance is closed well within 0.01 %. Grid independence is checked for three grids, by
each time halving the linear dimension of a control volume. The resulting heat transfer, pressure
drop and outlet temperature are given in table 2. Based on these results, the grid with 19200
number of DOF is chosen. Clearly, the outlined approach requires significantly less DOF then
direct numerical simulation to obtain a solution, but it introduces the additional difficulty of
modeling the porous properties.
The resulting velocity and temperature fields for the first foam, given in table 1, is
depicted in Fig. 5. Fully developed flow (i.e. a parabolic velocity profile) enters the foam
volume, but changes within 3 cell diameters to a much more uniform profile. This entrance effect
and the boundary layer profile in the porous volume is influenced by the effective viscosity. Note
that the viscous boundary layer in the foam is considerable smaller than the average cell
diameter. The temperature of the solid phase, near the interface with the aluminum substrate is
considerably higher than the temperature of the substrate itself, because of the TCR.
15
The predicted heat transfer of the five foams given in table 1 was compared with
experimental data, which is published by De Jaeger et al. [27]. In this work 14 cases with a
channel height of 15 mm were experimentally characterized, for all five the foams mentioned in
table 1 and under varying operating conditions. A maximum deviation of 7% is observed for heat
transfer rates between 133 and 513W. There is, however, no uncertainty analysis done on the
numerical model. Therefore, it is not possible to indicate if this deviation is significant.
Nevertheless, the model is found to be sufficiently accurate to correctly predict the influence of
geometrical parameters for the covered range of porosities. A comparison between experimental
and computed data is depicted in Fig. 6.
Surrogate Model
Despite the significantly reduced number of DOF in the discussed numerical model, it
still requires approximately 15 minutes to compute the thermo-hydraulic performance of a given
foam for this configuration. For this reason, only a limited number of foam structures have been
computed, serving as learning sites for a metaphysical or surrogate model. A suitable surrogate
modeling technique is called Kriging [67], more particularly an ordinary Kriging model is used
here. It is a best linear unbiased predictor which allows to define the interpolation uncertainty in
the predicted values. Furthermore, the sensitivity of the result to the studied parameters can be
derived.
The previously discussed physical model is treated as a black box, which is fed with an
input vector comprising of averaged cell diameters dc and strut cross-sectional surface areas A0.
The output, or observation, is the computed heat transfer Q or the total inlet pressure P. One
learning site, or one set of input parameters, is denoted as x(i)=(dc( i) , A0
(i)), with the accompanying
observations being y(i )=(Q (i) ,P(i)). The Kriging model is built upon i = 1…n learning sites, with
in this case l = 2 parameters (with j = 1…l). The Kriging model assumes that the underlying
physical process is stationary and that a data set comprising the outputs resulting from the
possible input vectors is Gaussian, with a certain mean value μ j and variance σ j.
Based on the available set of learning sites, with accompanying observations, the Kriging
method tries to find the best approximation of the presumed Gaussian process. It is found
convenient to assume that the correlation between a site x in the parameter space and a learning
site x(i) is given by following radial basis function:
16

ψ (i) ( x , x(i ))=exp (−∑j=1
l
θ j|x j−x j(i)|pj), (12)
with θ j and p j the so called hyper-parameters, which need to be determined for both input
parameters. These hyper-parameters determine respectively how far the influence of an observed
value at a given learning site can be felt in the resulting field, and how fast this influence decays
when moving away from the learning site. For the Kriging model used in this paper, p j= 2 is
implemented, i.e. a Gaussian correlation function is assumed. Both the parameters θ j are found
by maximizing the likelihood to predict the observed values when considering them unknown.
The predicted output y by at a site x in the parameter space can now be described as a weighted
sum of the n radial basis functions according:
y ( x )=μl+∑i=1
n
w (i )ψ (i) ( x , x(i )) , (13)
where the weights w(i) are found by introducing the known n observations in the above equation.
The selection of the learning sites (i.e. the sampling plan) is done by optimizing a space-
filling Latin hypercube for uniform coverage of the parameter space. The parameter space is
constrained for porosity between 0.8 and 0.98. This is shown in Fig. 7, where no data is
considered for foams with respectively too small dc and high A0 or too large dc and small A0. In
order to limit the number of computations of the physical model, n = 12 learning sites are
initially chosen. This however resulted in a relative maximum predicted root mean square error
(RMSE) of 30%. This relative maximum RMSE value is used as infill criterion to improve the
Kriging prediction accuracy. Four additional sites are computed, totaling 16 learning sites which
are indicated as black dots in Fig. 7. The resulting relative RMSE value of the predictions is less
than 0.6% and 3.5% for respectively the heat transfer and the pressure drop surrogate models
(with the relative pressure drop RMSE depicted in Fig. 7). Remark that these values indicate the
additional introduced uncertainty, resulting from the surrogate model. It however does not
resemble the overall accuracy as the uncertainty on the observed values is not taken in account.
17

INFLUENCE OF GEOMETRICAL PARAMETERS
The thermo-hydraulic results are non-dimensionalized, to be able to determine a
performance evaluation criterion (PEC). This is done by dividing the obtained results (heat
transfer Q and total pressure P at the inlet) with the corresponding heat transfer (Q0) and total
pressure (P0) of a reference case. For the latter, an empty channel with no additional thermal
contact resistance is considered, resulting in respectively Q0= 35.39 W and P0 = 2.2 Pa. The total
inlet pressure (static and dynamic) is considered as it is a measure for the required energy to
pump the air through the computational domain (because the volumetric flow rate is fixed). A
PEC can now be defined as the ratio of dimensionless heat transfer to dimensionless total
pressure, given by:
PEC=
QQ0
PP0
(14)
The resulting heat transfer is depicted in Fig. 8. Compared to an empty channel, foam
allows to transfer 6.5 to 11.5 times more heat from the hot air into the cold water. The θ values
of respectively dc and A0 are -0.51 and 0.5. It indicates that the cell diameter most significantly
influences heat transfer. This can be seen from the depicted results when looking to the iso-lines
which are more parallel to A0 than to dc. The largest heat transfer for the given application and
operating conditions can be obtained with a foam with small cell diameter and strut cross-
sectional surface area, i.e. largest surface-to-volume ratio and effective thermal conductivity.
The resulting total pressure at the inlet of the computational domain is shown in Fig. 9.
Also for this quantity, the cell diameter has the largest influence (θ = -0.82 while 0.6 is observed
for A0). Decreasing the cell diameter clearly results in a dramatic increase in the required
pressure to maintain the mass flow rate. This is consistent with the observations made by Bonnet
et al. [68], who proposed an empirical relation of permeability and inertial coefficient with
respectively the square and the inverse of the pore diameter. The same dependency can be seen
in the proposed models which are used in this paper (see equations (7) and (8)). The increment of
the total pressure, compared to an empty channel, is an order of magnitude higher than what was
found for the heat transfer. Consequently, it significantly determines the resulting PEC, as
18

depicted in Fig. 10. The optimal foam for the intended application (according to the defined
PEC) has a cell diameter of 5 mm, with the strut cross-sectional surface area 0.027 mm2.
CONCLUSIONS
The influence of the geometrical characteristics of open-cell aluminum foam is studied.
This is done for a fixed -channel flow- test rig and under constant operating conditions (i.e.
constant mass flow rate, inlet air temperature, water temperature and water-side convection
coefficient). A numerical model is implemented in a commercial CFD solver and validated
against experimental data. The required porous properties in this model are given as functions of
the geometrical parameters. To minimize the computational cost, a surrogate model is built,
based on the results of 16 foam geometries. The combination of a numerical- and surrogate
model is found a very cost-effective method to investigate the influence of geometrical
characteristics on the thermo-hydraulic results.
The results are made dimensionless by normalizing them against a reference case, i.e. an
empty channel. The relative gain of heat transfer (compared to the empty channel) is an order of
magnitude less than the relative increment of the required pressure to maintain the mass flow
rate. This has an outspoken influence on the PEC (defined as the ratio of dimensionless heat
transfer versus total pressure). When optimizing for this PEC, a foam with large cell diameter
and small strut diameter shows a clear optimum. The applied method allows to optimize the
foam structure for a given engineering application at an acceptable computational cost.
NOMENCLATUREcp Specific heat J/kgKx Process input vector -y Process output vector -A0 Strut cross-sectional surface area m²Asf Interfacial surface area m²d1 Small cell diameter md2 Large cell diameter mdc Mean cell diameter mds Equivalent strut diameter mE Ergun constant -h Interstitial heat transfer coefficient W/m²KK Effective thermal conductivity W/mK
19

l Number of parameters -n Number of learning sites -Nu Nusselt number, Eq. ( 11) -Pe Electrical power WPr Prandtl number -
Re Reynolds number: ℜds=
ρv ds
μ-
T Temperature Kv Superficial velocity m/sw Weighing factor -m Mass flow rate kg/sQa Air-side heat transfer Wk Thermal conductivity W/mK
AbbreviationsµCT Micro Computed TomographyBCC Body Centered CubicDNS Direct Numerical SimulationDOF Degrees Of FreedomEDM Electron Discharge MachiningPPI Pores Per InchREV Representative Elementary VolumeTCR Thermal contact resistance
Greek Symbols Inertial coefficient - Uncertainty Permeability m²µ Dynamic viscosity Pa.s Porosity - Radial basis function - Density kg/m³0 Surface-to-volume ratio m²/m³ Hyper parameter -
Subscriptsa Airf Fluid phasei Inletin Insulationo Outlets Solid phase
20

ACKNOWLEDGEMENTThe authors express their gratitude to Bekaert for the close cooperation. The institute for the
Promotion of Innovation by Science and Technology (IWT Vlaanderen) is greatly acknowledged
for their financial support (IWT-090273).
21

REFERENCES[1] Breward C.J.W., Darton R.C., HowellP.D., Ockendon J.R., Modelling foam drainage, International Chemical Engineering Symposium Series, vol. 142, pp. 1009-1019, 1997.[2] Plateau J., Statique expérimentale et théorique des liquides soumis aux seules forces moléculaires, vol. 2, Gauthier-Villars, 1873.[3] Kraynik A.M., Reinelt D.A., Foam microrheology: from honeycombs to random foams, Proceedings of the 15th Annual Meeting Polymer Processing Society, 1999.[4] Taylor J.E., The structure of singularities in soap-bubble-like and soap-film-like minimal surfaces, Annals of Mathematics, vol. 103, no. 3, pp. 489-539, 1976.[5] Sir Thomson W., On the division of space with minimum partitional area, Philosophical Magazine, vol. 24, no. 151, pp. 503-514, 1887.[6] Weaire D., Foam physics, Advanced Engineering Materials, vol. 4, no. 10, pp. 723-725, 2002.[7] Kose K., 3D NMR imaging of foam structures, Journal of Magnetic Resonance, vol. 118, no. 27, pp. 195-201, 1996.[8] Zhao C., Lu T., Hodson H., Jackson J., The temperature dependence of effective thermal conductivity of open-celled steel alloy foams, Materials Science and Engineering, vol. 367, no. 1-2, pp. 123-131, 2004.[9] Ashby M.F., Evans A.G., Fleck N.A., Gibson L.J., Hutchinson J.W., Wadley H.N.G., Metal Foams: A Design Guide, Butterworth-Heinemann Publications, 2000.[10] Avenall R. J., Use of metallic foams for heat transfer enhancement in the cooling jacket of a rocket propulsion element, Master's thesis, University of Florida, 2004.[11] Boomsma K., Poulikakos D., Zwick F., Metal foams as compact high performance heat exchangers, Mechanics of Materials, vol. 35, no. 12, pp. 1161-1176, 2003.[12] Kim S.Y., Paek J.W., Kang B.H., Flow and heat transfer correlations for porous fin in a plate-fin heat exchanger, Journal of Heat Transfer, vol. 122, no. 3, pp. 572-578, 2000.[13] Klein J.F., Arcas N., Gilchrist G.W., Shields Jr W.L., Yurman R., Whiteside J.B., Thermal management of airborne early warning and electronic warfare systems using foam metal fins, Technology Review, vol. 13, no. 1, 103-127, 2005.[14] Mavridou S., Mavropoulos G.C., Bouris D., Hountalas D.T., Bergeles G., Comparative design study of a diesel exhaust gas heat exchanger for truck applications with conventional and state of the art heat transfer enhancements, Applied Thermal Engineering, vol.30, no. 8-9, pp. 935-947, 2010.[15] T'Joen C., De Jaeger P., Huisseune H., Van Herzeele S., Vorst N., De Paepe M., Thermo-hydraulic study of a single row heat exchanger consisting of metal foam covered round tubes, International Journal of Heat and Mass Transfer, vol. 53, no. 15-16, pp. 3262-3274, 2010.[16] Ribeiro G.B., Barbosa Jr. J.R., Prata A.T., Metal foam condensers for miniature-scale refrigeration systems, In: Proceedings of 7th World Conference on Experimental Heat Transfer, Fluid Mechanics and Thermodynamics, Poland, pp. 483-491, 2009.[17] Agostini B., Fabbri M., Park J.E., Wojtan L., Thome J.R., Michel B., State of the art of high heat flux cooling technologies, Heat Transfer Engineering, vol. 28, no. 4, pp. 258-281, 2007.[18] Bhattacharya A., Mahajan R.L., Finned metal foam heat sinks for electronics cooling in forced convection, Journal of Electronic Packaging, vol. 124, no. 3, pp. 155-163, 2002.[19] Morkos B., Shankar P., Teegavarapu S., Michaelraj A., Summers J., Obieglo A., Conceptual Development of Automotive Forward Lighting System Using White Light Emitting Diodes, SAE
22
International Journal of Passenger Cars-Electronic and Electrical Systems, vol. 2, no. 1, pp. 201-213, 2009.[20] Shah R.K., Sekulic D.P., Fundamentals of Heat Exchanger Design, John Wiley & Sons, Inc., 2003.[21] Walz D.D., Cordova R., Method of making an inorganic reticulated foam structure, U.S. Patent - 3616841, 1971.[22] Walz D.D., Reticulated foam structure, U.S. Patent - 3946039, 1976.[23] De Jaeger P., T'Joen C., Huisseune H., Ameel B., De Paepe M., An experimentally validated and parameterized periodic unit-cell reconstruction of open-cell foams, Journal of Applied Physics, vol. 109, no. 10, 103519, 2011.[24] Bodla K.K., Murthy J.Y., Garimella S.V., Microtomography-based simulation of transport through open-cell metal foams, Numerical Heat Transfer, vol. 58, no. 7, pp. 527-544, 2010.[25] Boomsma K., Poulikakos D., The effects of compression and pore size variations on the liquid flow characteristics in metal foams, Journal of Fluids Engineering, vol. 124, no. 1, pp. 263-272, 2002.[26] Perrot C., Panneton R., Olny X., Periodic unit cell reconstruction of porous media: Application to open-cell aluminum foams, Journal of Applied Physics, vol. 101, no. 11, 113538, 2007.[27] De Jaeger P., T'Joen C., Huisseune H., Ameel B., De Paepe M., Assessing the influence of four bonding methods on the thermal contact resistance of open-cell aluminum foam, International Journal of Heat and Mass Transfer, UNDER REVIEW, 2011.[28] Paul A.R., Mukherjee A., Roy P., Engineering thermodynamics and fluid mechanics, Prentice-Hall of India Private Limited, 2005.[29] Moffat R.J., Describing the uncertainties in experimental results, Experimental Thermal and Fluid science, vol. 1, no. 1, pp. 3-17, 1988.[30] Magnico P., Analysis of permeability and effective viscosity by CFD on isotropic and anisotropic metallic foams, Chemical Engineering Science, vol. 64, no. 16, pp. 3564-3575, 2009.[31] Seguin D., Montillet A., Comiti J., Experimental characterisation of flow regimes in various porous media-I: Limit of laminar flow regime, Chemical Engineering Science, vol. 53, no. 21, pp. 3751-3761, 1998.[32] Hall M., Hiatt J., Measurements of pore scale flows within and exiting ceramic foams, Experiments in Fluids, vol. 20, no. 6, pp. 433-440, 1996.[33] Hutter C., Allemann C., Kuhn S., Rudolf von Rohr P., Scalar transport in a milli-scale metal foam reactor, Chemical Engineering Science, vol. 65, no. 10, pp. 3169-3178, 2010.[34] Krishnan S., Murthy J.Y., Garimella S.V., Direct simulation of transport in open-cell metal foam, Journal of Heat Transfer, vol. 128, no. 8, pp. 793-799, 2006.[35] Annapragada S.R., Murthy J., Garimella S., Permeability and thermal transport in compressed open-celled foams, Numerical Heat Transfer, vol. 54, no. 1, pp. 1-22, 2008.[36] Hutter C., Zenklusen A., Kuhn S., Rudolf von Rohr Ph., Large eddy simulations of flow through a streamwise-periodic structure, Chemical Engineering Science, vol. 66, no. 3, pp. 519-529, 2011.[37] Chung J., Tully L., Kim J., Jones G., Watkins W., Evaluation of open cell foam heat transfer enhancement for liquid rocket engines, In: Proceedings of the 42th AIAA Joint Propulsion Conference, pp. 1-22, 2006.[38] Lakes R., Materials with structural hierarchy, Nature, vol. 361, pp. 511-515, 1993.
23

[39] Cushman J.H., Bennethum L.S., Hu B.X., A primer on upscaling tools for porous media, Advances in Water Resources, vol. 25, no. 8-12, pp. 1043-1067, 2002.[40] De Jaeger P., T'Joen C., Huisseune H., Ameel B., De Paepe M., Open-cell metal foams and heat transfer: technological, characterization and application challenges, Progress in Materials Science, UNDER REVIEW , 2011.[41] Bear J., Dynamics of fluids in porous media, Dover Publications, 1988.[42] Brun E., Vicente J., Topin F., Occelli R., Clifton M., Microstructure and transport properties of cellular materials: Representative volume element, Advanced Engineering Materials, vol. 11, no. 10, 805-810, 2009.[43] Whitaker S., The method of volume averaging, Kluwer Academic Publishers, 1998.[44] De Jaeger P., T'Joen C., Huisseune H., Ameel B., De Paepe M., Assessing the influence of four cutting methods on the thermal contact resistance of open-cell aluminum foam, International Journal of Heat and Mass Transfer, UNDER REVIEW, 2011[45] Tamayol A., Bahrami M., Transverse permeability of fibrous porous media, Physical Review, vol. 83, no. 4, 046314, 2011.[46] Bhattacharya A., Calmidi V.V., Mahajan R.L., Thermophysical properties of high porosity metal foams, International Journal of Heat and Mass Transfer, vol. 45, no. 5, pp. 1017-1031, 2002.[47] Brun E., De l'imagerie 3D des structures a l'étude des mécanismes de transport en milieux cellulaires, Ph.D. Thesis, Aix Marseille Université, 2009.[48] Lacroix M., Nguyen P., Schweich D., Pham Huu C., Savin-Poncet S., Edouard D., Pressure drop measurements and modeling on SiC foams, Chemical Engineering Science, vol. 62, no. 12, pp. 3259-3267, 2007.[49] Ergun S., Fluid flow through packed columns, Chemical Engineering Progress, vol. 48,no. 2, pp. 89-94, 1952.[50] Dukhan N., Picón-Feliciano R., Álvarez-Hernández Á.R., Air flow through compressed and uncompressed aluminum foam: measurements and correlations, Journal of Fluids Engineering, vol. 128, no. 5, pp. 1004-1013, 2006.[51] Dukhan N., Patel K., Effect of samples length on flow properties of open-cell metal foam and pressure-drop correlations, Journal of Porous Materials, vol. 18, no. 6, pp. 655-665, 2011.[52] Wang M., Pan N., Modeling and prediction of the effective thermal conductivity of random open-cell porous foams, International Journal of Heat and Mass Transfer, vol. 51, no. 5-6, pp. 1325-1331, 2008.[53] Kanaun S., Tkachenko E., Effective conductive properties of open-cell foams, International Journal of Engineering Science, vol. 46, no. 6, pp. 551-571, 2008.[54] Krishnan S., Garimella S.V., Murthy J.Y., Simulation of thermal transport in open-cell metal foams: Effect of periodic unit-cell structure, Journal of Heat Transfer, vol. 130, no. 2, 024503, 2008.[55] Zhao C.Y., Lu T.J., Hodson H.P., Jackson J.D., The temperature dependence of effective thermal conductivity of open-celled steel alloy foams, Materials Science and Engineering, vol.367, no. 1-2, pp. 123-131, 2004.[56] Paek J.W., Kang B.H., Kim S.Y., Hyun J.M., Effective thermal conductivity and permeability of aluminum foam materials, International Journal of Thermophysics, vol. 21, no. 2, pp. 453-464, 2000.[57] Druma A., Alam M., Druma C., Surface area and conductivity of open-cell carbon foams, Journal of Materials & Materials Characterization & Engineering, vol. 5, no. 1, 73-86, 2006.
24

[58] Le L.H., Zhang C., Ta D., Lou E., Measurement of tortuosity in aluminum foams using airborne ultrasound, Ultrasonics, vol. 50,no. 1, pp. 1-5, 2010.[59] Haussener S., Coray P., Lipinski W., Wyss P., Steinfeld A., Tomography-based heat and mass transfer characterization of reticulate porous ceramics for high-temperature processing, Journal of Heat Transfer, vol. 132,no. 2, 023305, 2010.[60] Calmidi V.V., Mahajan R.L., Forced convection in high porosity metal foams, Journal of Heat Transfer, vol. 122, no. 3, pp. 557-565, 2000.[61] Kurtbas I., Celik N., Experimental investigation of forced and mixed convection heat transfer in a foam-filled horizontal rectangular channel, International Journal of Heat and Mass Transfer, vol. 52, no. 5-6, pp. 1313-1325, 2009.[62] Jeng T.M., Tzeng S.C., Hung Y.H., An analytical study of local thermal equilibrium in porous heat sinks using fin theory, International Journal of Heat and Mass Transfer, vol. 49,no. 11-12, 1907-1914, 2006.[63] Zukauskas A., Ulinskas R., Heat transfer in tube banks in crossflow, Hemisphere Publ. Corp., 1988.[64] Ghosh I., Heat transfer correlation for high-porosity open-cell foam, International Journal of Heat and Mass Transfer, vol. 52, no. 5-6, 1488-1494, 2009.[65] Tamayol A., Hooman K., Thermal assessment of forced convection through metal foam heat exchangers, Journal of Heat Transfer, vol. 133, no. 11, 111807, 2011.[66] Nakayama A., Ando K., Yang C., Sano Y., Kuwahara F., Liu, J. A study on interstitial heat transfer in consolidated and unconsolidated porous media, Heat and Mass Transfer, vol. 45, no. 11, 1365-1372, 2009.[67] Forrester A., Sóbester A., Keane A., Engineering design via surrogate modelling: a practical guide, Wiley, 2008.[68] Bonnet J.P., Topin F., Tadrist L., Flow laws in metal foams: Compressibility and pore size effects, Transport in Porous Media, vol. 73, no. 2, pp. 233-254, 2008.[69] Gnielinski V., New Equations for Heat and Mass Transfer in Turbulent Tube and Channel Flow, Forschung im Ingenieurwesen, vol. 41, no. 1, pp. 8-16, 1975.
25

Table 1 Structural data of five in-house cast foam samplesFoam[PPI]
d1
[mm]d2
[mm]A0
[x10-1mm²][-]
0
[m-1]10 4.22±0.1
86.23±0.18 0.998±0.08 0.932±0.00
2440±35
10 4.28±0.13
6.42±0.13 0.615±0.13 0.951±0.002
380±30
20 2.77±0.05
4.15±0.05 0.377±0.05 0.937±0.002
720±51
20 2.81±0.05
3.78±0.05 0.250±0.02 0.955±0.002
630±48
20 2.60±0.05
3.67±0.05 0.126±0.02 0.967±0.002
580±46
Table 2 Grid independence of the applied solution procedure for 3m/s maximal inlet velocity and a foam with A0 = 0.06mm² and d1, d2 respectively 2.2 and 2.7 mm.
Grid [DOF] Q[W]
ΔP[Pa]
Tout
[K]4800
19200
76800
328
3319
85
76
82
85
358
359
359
26

List of FiguresFigure 1. Description of the geometrical components in foam.
Figure 2. Experimental setup: hot air flowing through the foam, which is single-sided cooled from underneath using water. The arrows indicate air flow direction, going from ambient temperature () to heated by the in-line heater (), to cooled after passing the foam (). (1): In-line heater, (2): Rectangular duct, (3) Test section, (4): Movable cup, (5): Water tubes, (6): Pressure regulator and (7): Data logger. The positions where the inlet- (Ti) and outlet (To) temperatures are measured, are indicated.
Figure 3.Computational domain with coarse grid and the appropriate boundary conditions.
Figure 4. Comparison of measured and predicted pressure drop for foams 1, 3 and 4, given in table 1.
Figure 5. (a) Velocity profile (in m/s), (b) fluid phase temperature contour plot (in K) and (c) solid phase temperature contour plot (in K) for the first foam given in table 1.
Figure 6. Comparison between experimental and computed heat transfer, validating the physical model.
Figure 7. Relative root mean square error of the Kriging prediction for pressure drop. The black dots resemble the 16 learning sites.
Figure 8. Non-dimensional heat transfer for the investigated parameter space and fixed operating conditions.
Figure 9. Non-dimensional pressure variation at the inlet for the investigated parameter space and fixed operating conditions.
Figure 10. PEC, defines as the ratio of dimensionless heat transfer versus total pressure.
27

Figure 1
28

Figure 2
29

Figure 3
Figure 4
30
y

Figure 5
31

Figure 6
Figure 7
32

Figure 8
Figure 9
33

Figure 10
34

AUTHORS BIOGRAPHY
Peter de Jaeger received his master degree in mechanics and
electronics from the university college West Flanders, Kortrijk,
Belgium (2006) and followed a pre-doctoral training program at
Ghent University, Gent (2009). For his master's dissertation he
was honored with the `Barco' price. Currently he holds a position
as researcher at nv Bekaert sa. Starting from April 2009, he is also
active as a Ph.D. student in the research group Applied
Thermodynamics and Heat Transfer at Ghent University. His
research activities include thermal and hydraulic characterization
of open-cell aluminum foams and hyper-porous materials in
general.
T’Joen Christophe is a Postdoctoral Researcher at the
Department of Flow, Heat and Combustion Mechanics, Ghent
University-Ugent, Belgium. He received his Master’s degree in
Electromechanical Engineering from the Ghent University in 2004
and his Ph.D. in 2008. Currently his main research topic is
interrupted fin designs for compact heat exchangers. For his
Master’s dissertation he was honored with the ‘Marcel Herman’
price.
Henk Huisseune is a postdoctoral researcher at the Department of
Flow, Heat and Combustion Mechanics, Ghent University,
Belgium. He obtained his Ph.D. from Ghent University in 2011
and his master's degree in electromechanical engineering from the
same university in 2007. For his master's dissertation, he was
honored with the `Umicore Award'. Currently he is doing research
on the combination of interrupted n designs and vortex
35

generators.
Bernd Ameel received his B.S. and M.Sc. in Mechanical
Engineering from Ghent University, Belgium. He is currently a
Ph.D. student in the flow, heat and combustions mechanics
department at the same university. His main research interest is
the numerical optimization of compact tube and fin heat
exchangers.
Sven De Schampheleire is a Ph.D. student at the Department of
Flow, Heat and Combustion Mechanics, Ghent University,
Belgium. He received his master's degree in mechanical
engineering from Ghent University in 2011. His master's
dissertation investigates the thermo-hydraulic aspects of metal
foam as alternative for louvered ns in heat exchangers and was
honored with the `Atlas Copco Airpower' price 2011. Current
interests are Organic Rankine Cycles and compact heat
exchangers.
Michel De Paepe (°1972) is professor of Thermodynamics in the
Faculty of Engineering at Ghent University. He graduated as
Master of Science in Electro-Mechanical Engineering at the Gent
University in 1995. In 1999 he obtained the PhD in Electro-
Mechanical Engineering at the Gent University, graduating on
`Steam Injected Gas Turbines with water Recovery´. In 2005 he
spend 3 months as a visiting professor at the University of Pretoria
(South Africa), doing research on flow regime detection. He is
currently heading the Research Group Applied Thermodynamics
and Heat Transfer at the Faculty of Engineering at the Ghent
36

University. Research focuses on: thermodynamics of new energy
systems, performance of HVAC systems and energy in buildings
and complex heat transfer phenomena in industrial applications, as
in compact heat exchangers, refrigerant two-phase flow and
electronics cooling. Michel De Paepe is (co)author of 40 papers
published in international peer reviewed journals and more than
150 conference papers. For his master thesis and his PhD he
received the WEL price Energy.
37