Embed Size (px)
Citation preview

15
Estimating relative abundance and species richness from video surveys of reef fishes
Nathan M Bacheler (contact author)Kyle W Shertzer
Email address for contact author natebachelernoaagov
Beaufort LaboratorySoutheast Fisheries Science CenterNational Marine Fisheries Service NOAA101 Pivers Island RoadBeaufort North Carolina 28516
Manuscript submitted 30 July 2013Manuscript accepted 13 November 2014Fish Bull 11315ndash26 (2015)doi 107755FB11312
The views and opinions expressed or implied in this article are those of the author (or authors) and do not necessarily reflect the position of the National Marine Fisheries Service NOAA
AbstractmdashUnderwater video sam-pling has become a common ap-proach to index fish abundance and diversity but little has been pub-lished on determining how much video to read We used video data collected over a period of 6 years in the Gulf of Mexico to examine how the number of video frames read af-fects accuracy and precision of fish counts and estimates of species rich-ness To examine fish counts we fo-cused on case studies of red snapper (Lutjanus campechanus) vermilion snapper (Rhomboplites aurorubens) and scamp (Mycteroperca phenax) Using a bootstrap framework we found that fish counts were unbi-ased when at least 5 of 1201 video frames within a 20-min video were read The relative patterns of coeffi-cients of variation (CVs) were nearly identical among species and declined as an inverse power function Initial decreases in CVs were rapid as the number of frames read increased from 1 to 50 However subsequent declines were modest decreasing only by ~50 when the number of frames read increased by 300 Es-timated species richness increased asymptotically as the number of frames read increased from 25 to 200 frames and reading 50 frames documented 86 of the species ob-served across all 1201 frames Last-ly we used a generalized additive model to show that the most likely species to be missed were fast-swim-ming fishes that are solitary or form relatively small schools Our results indicate that the most efficient use of resources (ie maximum informa-tion gained at the lowest cost) would be to read ~50 frames from each video
Underwater video sampling has be-come a ubiquitous approach around the world to index the abundance of marine fish and invertebrate spe-cies and to quantify marine biodiver-sity (see reviews by Somerton and Gledhill 2005 Murphy and Jenkins 2010) Although numerous underwa-ter video approaches and techniques have been used to index abundance many researchers now employ some version of a stationary point-count method with baited remote underwa-ter video stations (BRUVS) (Willis et al 2000 Cappo et al 2004) BRU-VS sampling has many advantages 1) it is nonextractive and therefore preferred in no-take areas 2) is less size- or species-selective than other baited gears 3) can sample deeper waters more easily than diver sur-veys and do so at lower costs than can autonomous underwater vehi-cles 4) provides a permanent record available to be reviewed for accuracy by multiple readers and 5) can cap-ture habitat characteristics of a sur-vey site and behavioral interactions among species (Silveira et al 2003 Wells et al 2008 Langlois et al 2010 Bacheler et al 2013)
Nearly all BRUVS studies now use an approach called MinCount (or MaxN or MaxNo) to index the number of indi-viduals of various species present at a site (Ellis and DeMartini 1995 Mur-
phy and Jenkins 2010) MinCount is defined as the maximum number of individuals (of each species) present in a single frame during a viewing interval and this approach is popu-lar because it provides a conservative estimate of the number of individuals of each species present at a site (Ellis and DeMartini 1995 Willis and Bab-cock 2000 Merritt et al 2011) How-ever MinCount may be nonlinearly related to actual abundance because it measures a smaller and smaller proportion of individuals present at a site as abundance increases (Conn 2011 Schobernd et al 2014) Instead Conn (2011) proposed an alternative approach MeanCount which is calcu-lated as the mean number of individu-als observed in a series of frames over a viewing interval Schobernd et al (2014) found that MeanCount tracked true abundance linearly with levels of precision similar to that of MinCount A linear relationship is highly desir-able for developing indices of abun-dance in stock assessment models (Kimura and Somerton 2006)
A logical next step in the devel-opment of the MeanCount approach for indexing fish abundance as well as in estimating species richness is to determine the optimal number of frames to be read over a given time interval Previous studies have shown a strong relationship between
16 Fishery Bulletin 113(1)
the time spent surveying and the number of taxa en-countered for a wide variety of fish and wildlife species (Fuller and Langslow 1984 St John et al 1990 Bark-er et al 1993 Gledhill 2001) and new methods can account for detection probabilities of lt1 when estimat-ing species richness (Nichols et al 1998 Johnson et al 2013) Reading more frames will certainly provide more information but will also bring increased costs associated with the additional time and effort required (Rotherham et al 2007 Al-Chokhachy et al 2009)
Our objective was to examine the tradeoff between minimizing the effort needed to read videos and maxi-mizing the information obtained We focused our analy-ses on 2 primary response variables each as a function of the number of video frames read First we exam-ined potential bias and precision of MeanCount for 3 economically important reef fish species in the Gulf of Mexico Second we examined estimates of species rich-ness defined here as the number of species observed in a video The results provide general guidance regarding the amount of effort that should be expended to read underwater videos in diverse aquatic systems
Materials and methods
Data
We analyzed video data from a long-term reef fish monitoring program conducted within US waters of the Gulf of Mexico These data were collected by the Southeast Fisheries Science Center National Marine Fisheries Service in 2001ndash2002 and 2004ndash2007 A 4-camera array was deployed with a soak time of 40 min on hard-bottom habitats throughout the sampling range (Table 1) during the reef fish video survey of the Southeast Area Monitoring and Assessment Program Four Sony DCR-VX20001 (Sony Corp Tokyo) camcord-ers were mounted orthogonally on a metal array fac-
1 Mention of trade names or commercial companies is for iden-tification purposes only and does not imply endorsement by the National Marine Fisheries Service NOAA
ing outward at a height of 30 cm above the bottom (for more details see Gledhill2) Each array was bait-ed with approximately 05 kg of squid (Illex spp) in a mesh bag and deployed during daylight hours only These particular years were selected because they were the most recent years for which data were available before a significant methodological change occurred in video reading procedures
The reef fish video survey was developed to index reef fish populations and was typically conducted in the spring and summer on shelf-edge reefs from south Texas to the Dry Tortugas in Florida (Fig 1) A 2-stage sampling design was used to minimize travel time be-tween stations because the survey area was large For the first stage we used a stratified random sampling design of randomly selected blocks each of which was 10prime of latitude by 10prime of longitude in size Blocks were stratified by 4 geographic regions and by the amount of reef habitat (low or high) present in each block each block was subdivided into a grid of cells that were 019 km by 019 km For the second stage of sampling cells were randomly selected from within each block The number of grid cells available for random selection varied depending on how much known reef area was contained in the sampled block
From each 40-min deployment 1 of 4 videos was randomly selected and 20 min of that video was ana-lyzed beginning at the point when video visibility was sufficiently clear for identification of taxa Fish shape anatomical features coloration and swimming behav-iors were used to identify individuals to genus and spe-cies levels by using field guides (eg Hoese and Moore 1998 McEachran and Fechhelm 1998 Carpenter 2002 Humann and Deloach 2002 McEachran and Fechhelm 2005) Video frames were examined every second dur-
2 Gledhill C T G W Ingram Jr K R Rademacher P Felts B Trigg and L Lombardi-Carlson 2006 SEAMAP reef fish survey of offshore banks yearly indices of abundance of red grouper (Epinephelus morio) SEDAR 12-DW-6 12 p [Available from httpwwwsefscnoaagovsedardown-loadS1220DW0620Video-surveypdfid=DOCUMENT ac-cessed 31 March 2014]
Table 1
Number of video samples (N) included in the analyses of reef fishes in the northern Gulf of Mexico as well as the range of dates latitudes and longitudes covered by the samples in 2001ndash2002 and 2004ndash2007
Year N Date range Latitude range (degN) Longitude range (degW)
2001 42 614ndash622 2779ndash2835 9103ndash93822002 260 222ndash530 2450ndash3000 8426ndash96782004 169 48ndash622 2459ndash3013 8297ndash96302005 350 420ndash729 2451ndash3013 8277ndash96532006 333 416ndash84 2453ndash3014 8277ndash96782007 389 422ndash813 2450ndash3013 8277ndash9677
Bacheler and Shertzer Estimating relative abundance and species richness from video surveys of reef fishes 17
REVIEW
ing the interval from t=0 to t=20 min resulting in anal-ysis of 1201 frames Species were recorded if they were listed in the fishery management plans of the Gulf of Mexico or South Atlantic Fishery Management Council or if commercial or recreational landings were known to exist The resulting list of observed taxa included 210 species (a group hereafter called priority species) The time each individual fish swam into and out of view (ie time inndashtime out) was recorded for each pri-ority species Our analysis included only those video samples in which at least one priority species was seen at some point during the 20 min On the basis of these criteria 1543 videos were included in our analyses
MeanCount bias and precision
For a single video v the MeanCount of a species across video frames was defined with the following equation
MeanCountvF =nff =1
Fsum( )F
(1)
where n = the number of individuals observed in frame f and
F = the total number of frames read
To examine how MeanCount relates to the number of frames read we chose as case studies 3 ecologically and commercially important focal species red snapper (Lut-janus campechanus) vermilion snapper (Rhomboplites
aurorubens) and scamp (Mycteroperca phenax) These species were chosen because they vary substantially in terms of body size and schooling behavior Scamp are generally solitary red snapper often form small groups and vermilion snapper often form large groups Vermil-ion snapper are also much smaller than red snapper or scamp Misidentification of these species is very un-likely because of their distinct body shapes and swim-ming behaviors Of the 1543 videos examined in our study red snapper were observed in 375 videos ver-milion snapper in 217 and scamp in 466 MeanCount was computed only from those videos in which the focal species was observed
For each species the true MeanCount for each video (MeanCountvtrue) was computed from the full sampling universe of 1201 frames That true value was then esti-mated with a subset of frames with a possible sample size (F) from the interval [1 200] The sampling was conducted as follows First a list of frames (n=200) was drawn at random and without replacement from the full set of 1201 frames Then the first frame of the list (F=1) was used to compute MeanCountv1 Next the second frame (F=2) was included along with the first to compute MeanCountv2 and so forth until all 200 frames (F=200) were used to compute MeanCountv200
We quantified bias and precision in estimates of MeanCount with a bootstrap procedure In the boot-strap the previously described sampling approach was repeated 1000 times That is for each bootstrap iteration b a new set of 200 frames was drawn to com-
Figure 1Sampling locations (o) where video was collected during the National Marine Fisheries Servicersquos reef fish video survey in the Gulf of Mexico in 2001ndash2002 and 2004ndash2007 as part of its Southeast Area Monitoring and Assessment Program The light gray bathymetric contour lines indicate depths of 50 and 100 m respectively Note that symbols overlap in many cases
Gulf of Mexico
Latit
ude
(degN
)
Longitude (degW)
18 Fishery Bulletin 113(1)
pute MeanCount for every value of F=[1 2 hellip 200] frames Therefore we computed 1000 values for every MeanCountvF a choice that expanded our previous nomenclature to MeanCountbvF where b represents a single bootstrap replicate v represents a particular video sampling event and F represents the number of frames read
For each species we quantified error in estimation using mean relative error (MRE) On the basis of 1000 bootstrap replicates we computed the MRE for each video in which a species was observed and for each number of frames read with the following equation
MREvF =
MeanCountbvF minusMeanCountvtrue
MeanCountvtrue
⎛
⎝⎜⎜⎜⎜
⎞
⎠
⎟⎟⎟⎟⎟B=11000sum
1000
(2)
In addition to their use in determining MRE we used the bootstrap replicates to compute the coefficient of variation (CV) for each video and for each number of frames read CVvF For graphical presentation these CVs were scaled to their minima (which occurred at the largest sample size F=200) to demonstrate the pro-portional decline in variability in estimates as sample size increased To quantify the expected response mean CVs across videos ( CVF) were related to the number of frames through the use of a power function CV F=aFb where a and b are parameters These parameters were estimated in logndashlog space through linear regression with the following equation
log(CV F ) = primea +b log(F) (3)
where primea = log(a)
Then the power function could be inverted to provide the number of frames necessary to achieve a desired mean CV
F = CV F ab (4)
Species richness
The procedure for estimating species richness for pri-ority species was similar to the one for estimating MeanCount However when estimating species rich-ness we used all 1543 videos We first computed the true species richness observed in each video (Rvtrue) as the total number of priority species observed across all 1201 frames Note that Rvtrue is not necessarily the true species richness at a particular site but rather is the species richness observed in an entire 20-min video That true value was then estimated by tabulat-ing the species richness observed during each incre-ment of the number of frames read F=[1 2 hellip 200] As before uncertainty in the estimation was quantified with a bootstrap procedure with 1000 replicates where each replicate (b) contained a set of 200 frames drawn at random and without replacement from the original 1201 frames Therefore for each video we generated
1000 estimates of species richness for each number of frames read RbvF
Once computed the estimates of species richness were used to evaluate how increasing the number of frames read (F) affected the detection of species known to be present in a video For this evaluation we used the average number of species detected across boot-strap replicates scaled to the true value with the fol-lowing equation
PvF =
RbvFb=11000sum( ) 1000
Rvtrue
(5)
Therefore PvF is a proportion equal to zero if no spe-cies known to be present were detected on average or equal to one if all possible species were detected on average
To better understand the estimates of species rich-ness we related the probability of being observed to behavioral characteristics of those species in videos Specifically we considered 2 characteristics of each priority species (s) 1) the mean number of individuals (Ns) seen in a video and 2) the mean duration (Ds in seconds) each individual was observed in the videos These mean values for each species were taken across videos in which a particular species was present To re-move rare species for which mean characteristics may be poorly estimated species were included in this anal-ysis only if observed in at least 10 videos We then used a generalized additive model (GAM) to relate Ns and Ds and their interaction to the proportion of bootstrap replicates (Ys) in which species s was observed from all videos where the species was present and where the number of frames read was F=25 We used 25 frames in this study to provide a meaningful contrast across families in the probability of being observed making such distinctions is important for detecting the ef-fects of predictor variables All priority species were included in this analysis Before fitting the GAM the response variable Ys was transformed from probability space by using the arcsin squareroot transformation to achieve approximate normality and predictor variables were taken in log space
arcsin Ys( )=g1(log(Ns)) + g2(log(Ds))+ g3(log(Ns) (log(Ds))
(6)
where g1 g2 and g3 represent spline functions
The GAM approach strikes a balance between more simple and more complicated models and it was chosen for its flexibility and for providing a straightforward interpretation of results The GAM was implemented in the R programming language vers 2151 (R Core Team 2012) with the mgcv library (Wood 2006) For presentation the fitted response was transformed back into probability space by squaring the sine of the response
Lastly we summarized the mean duration in a 20-m video segment mean number of individuals in each vid-
Bacheler and Shertzer Estimating relative abundance and species richness from video surveys of reef fishes 19
REVIEW
eo segment and probability of being observed in each video for each of the families of fishes included in the analysis described previously in this section (Table 2) The purpose of including this table is to inform read-ers working in tropical and subtropical oceans about those groups of species they are likely to see and those groups that they are likely to miss if adopting a Mean-Count approach where a subset of frames is read
Results
MeanCount bias and precision
The MeanCount estimator behaved similarly for the 3 species that we used as case studies The central tendency across bootstrap replicates represented by mean MeanCount converged rapidly for red snapper vermilion snapper and scamp as the number of frames read increased (Fig 2) MeanCount values for scamp and red snapper were less variable than the results for vermilion snapper (on the basis of 5th and 95th percen-
tiles) and variability for all 3 species decreased when more frames were read (Fig 2)
Across all sampling events (ie all 20-min videos analyzed) in which the focal species was observed there were no obvious biases in MeanCount for red snapper vermilion snapper or scamp at any level of sampling intensity for 25 to 200 frames read (Fig 3) The variance for each species decreased as the number of frames read increased a finding consistent with the results of the individually selected video analysis pre-viously described (Fig 3) Furthermore the variance surrounding MeanCount was approximately 50 lower for scamp than for either red snapper or vermilion snapper (Fig 3)
The relative patterns of MeanCount CVs were near-ly identical among the 3 species (Fig 3) As the num-ber of frames increased from 1 to 200 the decrease in CV was initially rapid and then more gradual as more frames were read (Fig 3) Because of this pat-tern the largest reduction in CVs for all 3 species oc-curred as the number of frames read increased from 1 to 50 When frames read increased from 50 to 200 (ie
Table 2
Mean duration and standard error of the mean (SE) measured in seconds (s) of individual fishes in video mean number of individuals in videos and mean probability that a fish species would be seen in a video segment (for those videos in which that species occurred) summarized by family for only those species seen in at least 10 videos from footage collected during the National Marine Fisheries Servicersquos reef fish video survey conducted in the Gulf of Mexico in 2001ndash2002 and 2004ndash2007 as part of its Southeast Area Monitoring and Assessment Program Mean probability of being seen in a video was calculated for each species as the mean proportion of videos in which a species was observed (on the basis of 25 randomly selected frames) over all videos in which that species was present Note that the family names for Labridae Serranidae and Scaridae follow the Integrated Taxonomic Information System (httpwwwitisgov) Standard errors of the means (SE) are provided in parentheses
Number of Mean duration Mean number Probability of being Family Common name species (s) of individuals seen in video
Opistognathidae jawfishes 1 504 22 100 Priacanthidae bigeyes 2 921 (SE 127) 3 (SE 1) 099 (SE 001)Holocentridae squirrelfishes 1 132 10 096Pomacanthidae angelfishes 5 44 (SE7) 16 (SE 9) 085 (SE 003)Balistidae triggerfishes 3 66 (SE 40) 11 (SE 4) 084 (SE 007)Pomacentridae damselfishes 5 35 (SE 6) 23 (SE 7) 084 (SE 004)Labridae wrasses 7 15 (SE 2) 31 (SE 8) 080 (SE 006)Serranidae sea basses and groupers 23 30 (SE 2) 12 (SE 2) 078 (SE 002)Chaetodontidae butterflyfishes 3 31 (SE 3) 11 (SE 2) 077 (SE 003)Malacanthidae tilefishes 2 28 (SE 11) 8 (SE 0) 076 (SE 005)Sparidae porgies 6 14 (SE 2) 22 (SE 10) 075 (SE 003)Acanthuridae surgeonfishes 3 26 (SE 6) 6 (SE 1) 073 (SE 002)Haemulidae grunts 4 25 (SE 8) 22 (SE 6) 073 (SE 005)Lutjanidae snappers 7 12 (SE 1) 37 (SE 9) 073 (SE 004)Scaridae parrotfishes 4 23 (SE 2) 13 (SE 5) 071 (SE 005)Tetraodontidae puffers 2 25 (SE 7) 4 (SE 1) 064 (SE 013)Mullidae goatfishes 2 11 (SE 4) 14 (SE 6) 060 (SE 000)Muraenidae morays 2 40 (SE 4) 4 (SE 2) 060 (SE 007)Carangidae jacks 6 6 (SE 1) 14 (SE 2) 040 (SE 004)Sphyraenidae barracudas 1 18 4 034 Scombridae mackerels 1 5 2 017
20 Fishery Bulletin 113(1)
300 increase in frames read) CVs only declined by approximately 50 for all 3 species
In all cases the relationship between mean CVs and number of frames read was described well by power functions (coefficient of determina-tion [r2]gt099 Plt00001 for F-statistics) Among the 3 species the estimated relationships show differences in scale (a) but similar rates of de-cline (b) The mean estimates of parameters and standard errors of the mean (SE) were a=1324 (SE 0004) and b=ndash0525 (SE 0001) for red snap-per a=1585 (SE 0004) and b=ndash0524 (SE 0001) for vermilion snapper and a=0981 (SE 0004) and b=ndash0525 (SE 0001) for scamp Because the rates of decline were similar across species the same number of frames could be read for each if the goal is to achieve a proportional reduction in CV from each speciesrsquo maximum (which occurred at F=1) However if the goal is to achieve a par-ticular CV then each species would require a dif-ferent number of frames read For example a CV of 04 would require F=71 for red snapper F=119 for vermilion snapper and F=37 for scamp
Species richness
For illustration we chose 3 example videos with varying levels of species richness to show general patterns in estimates of species richness In these example videos the estimated species richness (number of species observed) increased asymptoti-cally as more frames were read (Fig 4) Although these 3 videos were chosen simply as examples they show that the estimates of species richness increased stepwise as the number of frames read was incremented That is with the inclusion of each additional frame read the species count ei-ther remained the same if that frame contained no new species or it increased by the number of new species observed In these examples the me-dian estimate captured 100 of the species pres-ent by around 50 frames for the videos with 3 or 7 species observed but not until around 100 frames for the video that contained 17 species (Fig 4)
Across all 1543 videos the proportion of spe-cies observed increased with sampling intensity Most species (median proportion=075) were ob-served in each video when only 25 of the 1201 frames were read and the median proportion in-creased when 50 frames (086) 100 frames (095) or 200 frames (099) were read (Fig 5) On the ba-sis of the interquartile range however there was substantial variability among videos particularly when fewer than 100 frames were read (Fig 5) When 100 or more frames were read the vari-ability was lower but some rare species in some videos were still missed
The GAM explained 872 of the deviation in the probability that a species would be observed
Figure 2MeanCount which is calculated as the mean number of in-dividual fish observed in a series of frames over a viewing interval of a single sampling event (ie a 20-min video seg-ment) in the northern Gulf of Mexico as a function of the number of video frames that were read for (A) red snapper (Lutjanus campechanus) (B) vermilion snapper (Rhombop-lites aurorubens) and (C) scamp (Mycteroperca phenax) In each panel the heavy solid line represents the mean of 1000 bootstrap replicates the lower dotted line represents the 5th percentile the upper dotted line represents the 95th percen-tile the thin solid line is a single bootstrap iteration and the filled circle on the right is the true MeanCount across all 1201 frames that were analyzed for this study
A
B
C
Bacheler and Shertzer Estimating relative abundance and species richness from video surveys of reef fishes 21
REVIEW
in 25 frames on the basis of the mean duration of each species in a video (estimated degrees of freedom [edf]=15 F=366 Plt00001) mean number of indi-viduals in a video (edf=10 F=439 Plt00001) or their interaction (edf=78 F=07 P=0004) Species were ob-served with higher probability as their mean time in the videos increased however this probability saturat-ed near 10 for mean times of 100 s or more (Fig 6A) Similarly the probability of being observed increased as the mean number of individuals increased but the trend was nearly linear over the range of the predictor (Fig 6B) The families of fishes that were most likely to be observed in 25 frames of video were the generally sedentary groups like jawfishes bigeyes squirrelfishes angelfishes and triggerfishes and those families most likely to be missed were fast-moving groups like tunas and mackerels barracudas and jacks (Table 2)
Discussion
In many places around the world underwater video has become a common approach to monitor the abun-dance and distribution of marine fish and invertebrate species and to quantify marine biodiversity (eg Heag-ney et al 2007 Stobart et al 2007 Brooks et al 2011 Merritt et al 2011 Gladstone et al 2012) For many such studies BRUVS have been used and have provided an index of the abundance of various species through the use of a stationary point-count with the MinCount method (Ellis and DeMartini 1995 Willis et al 2000 Murphy and Jenkins 2010) Recent re-search has indicated that MeanCount is more linearly related to true abundance than is MinCount (Conn 2011 Schobernd et al 2014) To provide the next logi-cal step in the evaluation of the MeanCount approach
Figure 3Top row mean relative error (MRE) of MeanCount the mean number of individual fish observed in a series of frames over a viewing interval across all videos analyzed in this study from the northern Gulf of Mexico in 2001ndash2002 and 2004ndash2007 as a function of the number of video frames read for (A) red snapper (Lutja-nus campechanus) (B) vermilion snapper (Rhomboplites aurorubens) and (C) scamp (Mycteroperca phenax) Boxes represent the interquartile range thick solid lines represent medians and whiskers extend to the most extreme data point within 15 times the interquartile range from the box Bottom row coefficient of variation (CV) of MeanCount as a function of the number of video frames read for (D) red snapper (Lutjanus campechanus) (E) vermilion snapper (Rhomboplites aurorubens) and (F) scamp (Mycteroperca phenax) In each panel curves represent CVs from each sampling event (ie each 20-min video collection) computed from 1000 bootstrap replicates Each CV curve is scaled to its minimum
A B C
D E F
CV
sca
led
to
the
min
imum
MR
E o
f M
eanC
oun
t
Number of frames Number of frames Number of frames
22 Fishery Bulletin 113(1)
we examined the tradeoff between time spent reading videos and the information obtained In this study we found that reading more frames decreased variability surrounding MeanCount for 3 reef fish species and in-
Figure 4Examples of species richness (total number of species) observed as a function of the number of video frames that were read for this study of the use of video surveys to index abundance and diversity of reef fishes in the northern Gulf of Mexico in 2001ndash2002 and 2004ndash2007 Each panel is from a different 20-min video segment that was analyzed and selected to represent a relative-ly (A) low (B) medium or (C) high number of species In each panel the solid line is the median value from bootstrap replicates the lower dashed line is the lower 5th percentile the upper dashed line is the 95th percen-tile and the dotted horizontal line is the total number of species observed in the full video (across all 1201 video frames)
B
A
C
Number of frames
Sp
ecie
s ri
chne
ss o
bse
rved
Figure 5Proportion of species observed across all 20-min videos analyzed in this study as a function of the number of video frames that were read for this study of the use of video surveys to index abundance and diversity of reef fishes in the northern Gulf of Mexico in 2001ndash02 and 2004ndash2007 A value from each 20-min video was computed as the mean estimate of species richness (ie mean of the number of species observed across 1000 bootstrap replicates) divided by the total number of species known to be present in that video segment (ie observed in any of the 1201 video frames) Boxes represent the interquartile range thick heavy lines represent medians and whiskers extend to the most extreme data point within 15 times the interquartile range from the box
Number of frames
Pro
po
rtio
n o
f sp
ecie
s o
bse
rved
creased the total number of species observed but bias was negligible even when a small number of frames were read (eg F=25) These results will be useful to researchers in designing and tailoring their underwa-ter video surveys to incorporate MeanCount for estima-tion of relative abundance or species richness
Previous studies have shown that the number of taxa encountered in a wide variety of fisheries and wildlife monitoring studies is related to the spatial or temporal extent of sampling (Fuller and Langslow 1984 St John et al 1990 Barker et al 1993 Gled-hill 2001) We observed an inverse power relationship between CVs and number of frames read and an as-ymptotic relationship between the number of species observed and the number of frames read Therefore CVs decreased and the number of species observed in-creased dramatically as the number of frames read in-creased from 1 to 50 but gains in precision were much more modest after that point These results are simi-lar to results from studies of stream fishes that have documented a threshold of sites sampled beyond which the increase in species observed was negligible (Anger-meier and Smogor 1995 Cao et al 2001 de Freitas Terra et al 2013) The number of frames that should
Bacheler and Shertzer Estimating relative abundance and species richness from video surveys of reef fishes 23
REVIEW
Figure 6Relationship between the probability of a species being observed in a video segment and (A) its mean time in video or (B) the mean number of individuals of that species observed in each video Included in the analysis were 90 reef fish species present in at least 10 videos in the National Marine Fisheries Servicersquos reef fish video survey conducted in the northern Gulf of Mexico in 2001ndash2002 and 2004ndash2007 as part of its Southeast Area Monitoring and Assessment Program The solid black lines indicate fitted relationships from a gener-alized additive model the dashed lines are 95 confi-dence intervals and the tick marks on the x-axis show the distribution of values from the 90 species that were included in this analysis
Mean number in video
Mean time in video (s)
Pro
bab
ility
of
bei
ng o
bse
rved
in
vid
eo
A
B
be read is likely study-specific and would depend on the total number of videos to be read the relative im-portance of rare species the total resources available for video reading and time constraints for video read-
ing (Gledhill 2001) Our results indicate that reading approximately 50 frames from each video may provide a reasonable compromise between costs and informa-tion gained if one can accept that about 14 of species would be missed at each site compared with a reading of all frames in an entire 20-min video segment
As shown by our GAM results behavioral character-istics largely determined how likely a species was to be observed or missed in a subset of video frames Wheth-er a species is observed in a subset of video frames is almost entirely dependent on 2 behavioral character-istics 1) the mean duration of time spent by each fish in the video viewing area and 2) the mean number of individuals present in each video Fast-swimming and relatively infrequent fishes such as tunas mackerels barracudas and jacks were the ones most likely to be missed and therefore tended to be underrepresented in estimates of species richness These same taxa also had higher absolute CVs around indices of abundance than those for fishes like groupers and snappers that were observed more frequently We also showed that CVs from observations of a fast-moving schooling species (vermilion snapper) were more than twice as high as CVs for a slow-moving nonschooling species (scamp) but the relative pattern of CVs was the same for both species Clearly researchers must carefully consider the behavior of their target species when de-signing a BRUVS sampling strategy with a MeanCount approach for instance by allocating significantly more video-reading effort if fast-moving infrequently en-countered species are targeted
We estimated the proportion of species observed in a subset of frames compared with the number observed in all frames of a 20-min video segment but note that reading all frames in a 20-min video segment likely underestimates all the species present at a site For instance Gledhill (2001) showed that approximately 68 of reef fish taxa in the Gulf of Mexico that were observed in a continuous 60-min video segment were observed in analysis of a 20-min segment Further-more given the exclusively diurnal sampling in our study nocturnal fishes were likely poorly detected as were small cryptic species (Collette et al 2003 Smith-Vaniz et al 2006 Williams et al 2006) Therefore our results (from an approach for which a subset of frames was read) should be interpreted as a reduction in spe-cies observed compared with results from reading of a 20-min video segment not a comparison with the true species richness at a site
Researchers could consider approaches that account for the fact that all video reading methods likely miss some reef fish species that are actually present at a site First occupancy or N-mixture modeling approach-es can estimate detection or capture probabilities sepa-rately from the underlying distribution or abundance of a species (MacKenzie et al 2002 Royle 2004) but multiple site visits may be necessary each year (Issaris et al 2012) unless spatial autocorrelation is modeled (Johnson et al 2013) Second if the emphasis is on es-
24 Fishery Bulletin 113(1)
timation of species richness over an entire study area species accumulation (ie rarefaction) curves may be a useful approach (eg Nichols et al 1998 Thompson et al 2003) Species accumulation curves and related ap-proaches (Angermeier and Smogor 1995) may be espe-cially useful in diverse systems with many rare species (Green and Young 1993 Gotelli and Colwell 2001)
Our study design included several simplifications First with our bootstrap procedure frames were se-lected at random for analysis Alternative approaches may select frames systematically either with fixed intervals (eg one frame every 30 s Bacheler et al 2013) or through adaptive sampling Second we esti-mated the proportion of species observed in a subset of frames in relation to all of the species observed in each 20-min video segment Ideally our estimates would have been compared with the total number of species occupying the site but true species richness at each site was unknown (Gotelli and Colwell 2001) Third we lacked information on current direction or magni-tude therefore we were unable to estimate the size or shape of the bait plume information that can be impor-tant in determining the catch or counts of fishes made through the use of baited gears (Collins et al 2002 Jamieson et al 2006) Fourth we did not account for temporal autocorrelation (ie samples taken closer in time are likely more similar than those taken further apart Strachan and Harvey 1996) when analyzing frames within a particular video Temporal autocorre-lation violates the standard statistical assumption of independence among observations and when present may affect the estimated CVs Temporal correlation is problematic for characterization of diel or seasonal variability but not for quantification of the density or number of species captured in a video Temporal cor-relation could be minimized or avoided in practice by not choosing frames clustered in time Fifth our study would have been more informative if the costs of read-ing video frames were known allowing for explicit cost-benefit analyses related to optimum sample sizes (Cochran 1977 Thompson 1992) However these video data were recorded in a time inndashtime out format and not by individual frames and therefore the costs of reading each frame could not be estimated
MeanCount computed from a sequence of video frames has been shown to track linearly with true abundance at a site (Conn 2011 Schobernd et al 2014)mdasha critically important issue when standard-izing survey data to produce abundance indices for use in stock assessment models (Maunder and Punt 2004) Our study is the first however to document how the number of frames read can relate to CVs around MeanCount for reef fish species and the proportion of reef fish species observed at a site Previous research has documented the general relationship between the spatial or temporal extent of sampling and CVs or the number of species observed (Fuller and Langslow 1984 St John et al 1990 Barker et al 1993 Gledhill 2001) Similarly we showed that the number of frames
read was negatively related to CVs and positively re-lated to the proportion of species observed More impor-tant however both relationships were nonlinear and indicate that the information gain slowed substantially after reading approximately 50 frames Video studies that apply the MeanCount approach to other systems could use our GAM results to help broadly understand how many frames to read accounting for the behaviors of the species of interest
Acknowledgments
We thank M Campbell C Gledhill A Pollack and the Pascagoula laboratory of the NOAA Southeast Fisheries Science Center for providing access to the Gulf of Mexico reef fish video data the staff and crew members who participated in data collection and the Southeast Area Monitoring and Assessment Program for funding We also thank M Campbell A Chester P Conn A Hohn T Kellison P Marraro Z Schobernd and 3 anonymous reviewers for comments on previous versions of this manuscript
Literature cited
Al-Chokhachy R P Budy and M Conner 2009 Detecting declines in the abundance of a bull trout
(Salvelinus confluentus) population understanding the accuracy precision and costs of our efforts Can J Fish Aquat Sci 66649ndash658 doi 101139F09-026
Angermeier P L and R A Smogor 1995 Estimating number of species and relative abun-
dances in stream-fish communities effects of sampling effort and discontinuous spatial distributions Can J Fish Aquat Sci 52936ndash949 doi 101139f95-093
Bacheler N M C Schobernd Z Schobernd W A Mitchell D Berrane G T Kellison and M J M Reichert
2013 Comparison of trap and underwater video gears for indexing reef fish presence and abundance in the southeast United States Fish Res 14381ndash88 doi 101016jfishres201301013
Barker R J J R Sauer and W A Link 1993 Optimal allocation of point-count sampling ef-
fort Auk 110752ndash758Brooks E J K A Sloman D W Sims and A J Danylchuk
2011 Validating the use of baited remote underwater video surveys for assessing the diversity distribution and abundance of sharks in the Bahamas Endang Spec Res 13231ndash243 doi 103354esr00331
Cao Y D P Larsen and R M Hughes 2001 Evaluating sampling sufficiency in fish assem-
blage surveys a similarity-based approach Can J Fish Aquat Sci 581782ndash1793 doi 101139f01-120
Cappo M P Speare and G Drsquoeath 2004 Comparison of baited remote underwater video
stations (BRUVS) and prawn (shrimp) trawls for as-sessments of fish biodiversity in inter-reefal areas of the Great Barrier Reef Marine Park J Exp Mar Biol Ecol 302123ndash152 doi 101016jjembe200310006
Bacheler and Shertzer Estimating relative abundance and species richness from video surveys of reef fishes 25
REVIEW
Carpenter K E (ed)2002 The living marine resources of the Western Cen-
tral Atlantic Vol 1 introduction molluscs crustaceans hagfishes sharks batoid fishes and chimaeras FAO species identification guide for fishery purposes and American Society of Ichthyologists and Herpetologists Special Publication 5 600 p FAO Rome
Cochran W G1977 Sampling techniques 3rd ed 428 p Wiley New
York Collette B B J T Williams C E Thacker and M L Smith
2003 Shore fishes of Navassa Island West Indies a case study on the need for rotenone sampling in reef fish biodiversity studies Aqua 689ndash131
Collins M A C Yau F Guilfoyle P Bagley I Everson I G Priede and D Agnew
2002 Assessment of stone crab (Lithodidae) density on the South Georgia slope using baited video cam-eras ICES J Mar Sci 59370ndash379 doi 101006jmsc20011167
Conn P B 2011 An evaluation and power analysis of fishery in-
dependent reef fish sampling in the Gulf of Mexico and US south Atlantic NOAA Tech Memo NMFS- SEFSC-610 32 p
de Freitas Terra B R M Hughes and F G Arauacutejo 2013 Sampling sufficiency for fish assemblage sur-
veys of tropical Atlantic forest streams south-eastern Brazil Fisheries 38150ndash158 doi 101080036324152013775572
Ellis D M and E E DeMartini 1995 Evaluation of a video camera technique for index-
ing the abundances of juvenile pink snapper Pristipo-moides filamentosus and other Hawaiian insular shelf fishes Fish Bull 9367ndash77
Fuller R J and D R Langslow 1984 Estimating numbers of birds by point counts how
long should counts last Bird Study 31195ndash202 doi 10108000063658409476841
Gladstone W S Lindfield M Coleman and B Kelaher 2012 Optimisation of baited remote underwater video
sampling designs for estuarine fish assemblages J Exp Mar Biol Ecol 42928ndash35 doi 101016jjembe201206013
Gledhill C T 2001 Reef fish assemblages on the Gulf of Mexico shelf-
edge banks PhD diss 193 p Univ South Alabama Mobile AL
Gotelli N J and R K Colwell 2001 Quantifying biodiversity procedures and pit-
falls in the measurement and comparison of spe-cies richness Ecol Lett 4379ndash391 doi 101046j 1461-0248200100230x
Green R H and R C Young 1993 Sampling to detect rare species Ecol Appl
3351ndash356 Heagney E C T P Lynch R C Babcock and I M Suthers
2007 Pelagic fish assemblages assessed using mid-water baited video standardising fish counts using bait plume size Mar Ecol Prog Ser 350255ndash266 doi 103354meps07193
Hoese H D and R H Moore 1998 Fishes of the Gulf of Mexico Texas Louisiana
and adjacent waters 2nd ed 416 p Texas AampM Univ Press College Station TX
Humann P and N Deloach 2002 Reef fish identification Florida Caribbean Baha-
mas 3rd ed 512 p New World Publ Jacksonville FLIssaris Y S Katsanevakis M Salomidi K Tsiamis N Kat-
siaras and G Verriopoulos 2012 Occupancy estimation of marine species deal-
ing with imperfect detectability Mar Ecol Prog Ser 45395ndash106 doi 103354meps09668
Jamieson A J D M Bailey H J Wagner P M Bagley and I G Priede
2006 Behavioural responses to structures on the sea-floor by the deep-sea fish Coryphaenoides armatus im-plications for the use of baited landers Deep-Sea Res (I Oceanogr Res Pap) 531157ndash1166 doi 101016jdsr200604002
Johnson D S P B Conn M B Hooten J C Ray and B A Pond
2013 Spatial occupancy models for large data sets Ecology 94801ndash808 doi 10189012-05641
Kimura D K and D A Somerton 2006 Review of statistical aspects of survey sampling
for marine fisheries Rev Fish Sci 14245ndash283 doi 10108010641260600621761
Langlois T J E S Harvey B Fitzpatrick J J Meeuwig G Shedrawi and D L Watson
2010 Cost-efficient sampling of fish assemblages com-parison of baited video stations and diver video tran-sects Aquat Biol 9155ndash168 doi 103354ab00235
MacKenzie D I J D Nichols G B Lachman S Droege J A Royle and C A Langtimm
2002 Estimating site occupancy rates when de-tection probabilities are less than one Ecology 832248ndash2255 doi 1018900012-9658(2002)083[2248 ESORWD]20CO2
Maunder M and A Punt 2004 Standardizing catch and effort data a review
of recent approaches Fish Res 70141ndash159 doi 101016jfishres200408002
McEachran J and J D Fechhelm 1998 Fishes of the Gulf of Mexico vol 1 1120 p Univ
Texas Press Austin TX2005 Fishes of the Gulf of Mexico vol 2 1014 p Univ
Texas Press Austin TXMerritt D M K Donovan C Kelley L Waterhouse M
Parke K Wong and J C Drazen 2011 BotCam a baited camera system for nonextrac-
tive monitoring of bottomfish species Fish Bull 10956ndash67
Murphy H M and G P Jenkins 2010 Observational methods used in marine spatial
monitoring of fishes and associated habitats a re-view Mar Freshw Res 61236ndash252 doi 101071MF09068
Nichols J D T Boulinier J E Hines K H Pollock and J R Sauer
1998 Inference methods for spatial variation in species richness and community composition when not all spe-cies are detected Conserv Biol 121390ndash1398
R Core Team2012 R A language and environment for statistical
computing R Foundation for Statistical Computing Vienna Austria [Available from httpwwwR-projectorg accessed 31 March 2014]
26 Fishery Bulletin 113(1)
Rotherham D A J Underwood M G Chapman and C A Gray
2007 A strategy for developing scientific sampling tools for fishery-independent surveys of estuarine fish in New South Wales Australia ICES J Mar Sci 641512ndash1516 doi 101093icesjmsfsm096
Royle JA 2004 N-mixture models for estimating population
size from spatially replicated counts Biometrics 60108ndash115
Schobernd Z H N M Bacheler and P B Conn 2014 Examining the utility of alternative video moni-
toring metrics for indexing reef fish abundance Can J Fish Aquat Sci 71464ndash471 doi 101139cjfas-2013-0086
Silveira L A T A Jacomo and J A F Diniz-Filho 2003 Camera trap line transect census and track sur-
veys a comparative evaluation Biol Conserv 114 351ndash355 doi 101016S0006-3207(03)00063-6
Smith-Vaniz W F H L Jelks and L A Rocha 2006 Relevance of cryptic fishes in biodiversity assess-
ments a case study at Buck Island Reef National Mon-ument St Croix Bull Mar Sci 7917ndash48
Somerton D A and C T Gledhill 2005 Report of the National Marine Fisheries Service
Workshop on Underwater Video Analysis NOAA Tech Memo NMFS-FSPO-68 69 p
St John J G R Russ and W Gladstone 1990 Accuracy and bias of visual estimates of numbers
size structure and biomass of a coral reef fish Mar Ecol Prog Ser 64253ndash262 doi 103354meps253253
Strachan I B and L E Harvey 1996 Quantifying the effects of temporal autocorrela-
tion on climatological regression models using geostatis-tical techniques Can J Forest Res 26864ndash871 doi 101139x26-094
Stobart B J A Garciacutea-Charton C Espejo E Rochel R Gontildei
O Rentildeones A Herrero R Crecrsquohriou S Polti C Marcos S Planes and A Peacuterez-Ruzafa
2007 A baited underwater video technique to assess shallow-water Mediterranean fish assemblages meth-odological evaluation J Exp Mar Biol Ecol 345158ndash174 doi 101016jjembe200702009
Thompson S K1992 Sampling 1st ed 343 p Wiley-Interscience New
YorkThompson G G P C Withers E R Pianka and S A
Thompson 2003 Assessing biodiversity with species accumulation
curves inventories of small reptiles by pit-trapping in Western Australia Austral Ecol 28361ndash383 doi 101046j1442-9993200301295x
Wells R J D K M Boswell J H Cowan Jr and W F Pat-terson III
2008 Size selectivity of sampling gears targeting red snapper in the northern Gulf of Mexico Fish Res 89294ndash299 doi 101016jfishres200710010
Williams J T L Wantiez C Chauvet R Galzin M Harme-lin-Vivien E Jobet M Juncker G Mou-Tham S Planes and P Sasal
2006 Checklist of the shorefishes of Wallis Island (Wal-lis and Futuna French Territories south-central Pacif-ic) Cybium 30247ndash260
Willis T J and R C Babcock 2000 A baited underwater video system for the determi-
nation of relative density of carnivorous reef fish Mar Freshw Res 51755ndash763 doi 101071MF00010
Willis T J R B Millar and R C Babcock 2000 Detection of spatial variability in relative density
of fishes comparison of visual census angling and bait-ed underwater video Mar Ecol Prog Ser 198249ndash260 doi 103354meps198249
Wood S N2006 Generalized additive models an introduction with
R 392 p CRC Press Boca Raton FL
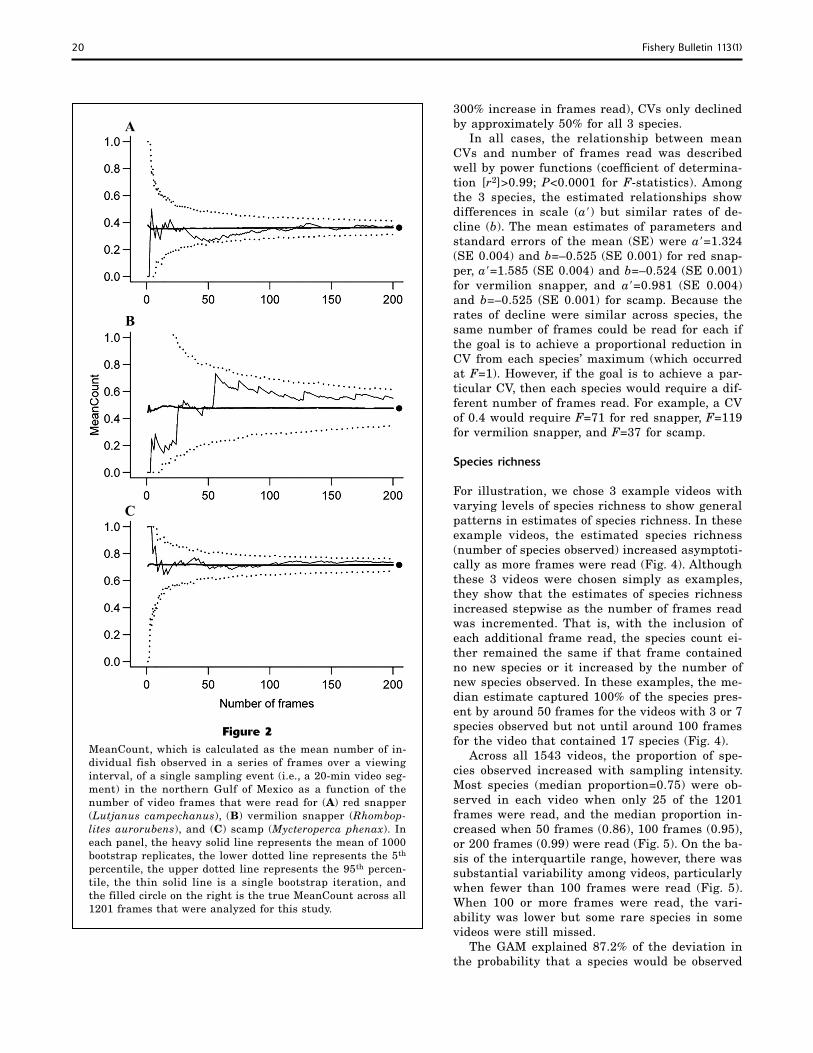
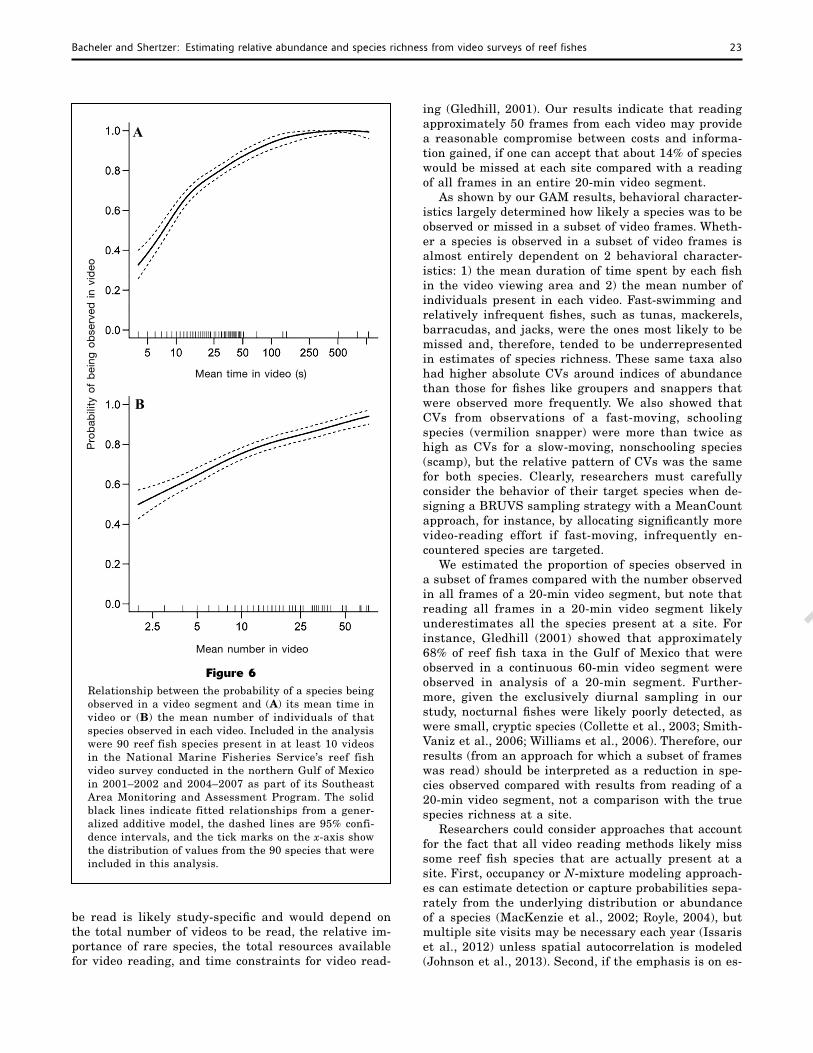