Embed Size (px)
Citation preview

High-K states in the odd-odd nuclide 180Re
H.M. El-Masri,1 P.M. Walker,1, ∗ G.D. Dracoulis,2 T. Kibedi,2 A.P. Byrne,2 A.M. Bruce,3
J.N. Orce,3 A. Emmanouilidis,3 D.M. Cullen,4 C. Wheldon,5 and F.R. Xu6
1Department of Physics, University of Surrey,
Guildford, Surrey GU2 7XH, United Kingdom
2Department of Nuclear Physics, RSPhysSE,
Australian National University, Canberra, ACT 0200, Australia
3School of Engineering, University of Brighton,
Brighton, BN2 4GJ, United Kingdom
4Department. of Physics and Astronomy,
University of Manchester, M13 9PL, United Kingdom
5SF7 Hahn-Meitner Institute, Glienicker Straße 100, D-14104 Berlin, Germany
6Department of Technical Physics, Peking University, Beijing 100871, China
(Dated: September 14, 2005)
Abstract
The structure of the deformed, doubly odd nuclide 180Re has been studied by γ-ray and
conversion-electron spectroscopy using the 174Yb(11B,5n) reaction with a pulsed 71 MeV beam
of 11B ions. Several of the previously known intrinsic states have been given revised spin and
parity assignments. Rotational bands are observed with Kπ = (4+), (5−), (7+), 8+, 9−, 13+, 14−,
15−, 16+, 21− and (22+). Among these, a 4-quasiparticle t-band is identified, which is already
energetically favored at its bandhead compared to the corresponding two-quasiparticle band; and
two 6-quasiparticle bands are identified and associated with a τ = 13 µs isomer. The observed
structures, including g-factors and alignments, are interpreted with the aid of Nilsson-plus-BCS cal-
culations and configuration-constrained potential-energy-surface calculations. Reduced hindrance
values are obtained for K-forbidden transitions, illustrating the important role of the K quantum
number for near-yrast isomers.
PACS numbers: 23.20.Lv, 27.70.+q, 21.10.Tg
∗Electronic address: [email protected]
1

I. INTRODUCTION
The odd-odd deformed nuclide 18075Re105 is located in the high-Z part of the well deformed
A∼160−180 region of the Segre chart. Nuclei in this region have high-K orbitals close
to the Fermi surface (where K is the spin projection on the symmetry axis). Broken-pair
states at modest excitation energies can have high K values and are able to compete with
collective rotation in the formation of the yrast line (the locus of states with lowest energy
as a function of spin) [1, 2]. The approximate conservation of the K quantum number
then leads to long-lived isomers, exemplified by the τ = 45-year mean-life of a Kπ = 16+, 4-
quasiparticle isomer in 17872Hf106 [3]. However, for different nucleon numbers the mean-lives of
multi-quasiparticle states are seen to decrease rapidly, due to a combination of less-favorable
energetics and increased K mixing [2]. Considering quasiparticle numbers ≥4 in the Z=76
osmium isotopes, for example, the longest-lived isomers have mean-lives in the ns range,
while µs isomers are known in the Z=75 rhenium isotopes 179Re [4] and 181Re [5]. The
present work is concerned with the study of isomers and associated structures in their odd-
odd neighbor 180Re, which could give additional information about the robustness of the K
quantum number.
Low-spin states in 180Re have been studied previously through the electron-capture decay
of 180Os [6–9]. The 180Re ground state is unstable, with τ = 3.5 minutes and a tentative
spin and parity of (1)−. It decays by electron capture to the stable nuclide 180W. The
high-spin states of 180Re have been investigated twice [10, 11] in the past two decades,
but the experiments failed to agree on common spin, parity and configuration assignments,
even for the low-lying states. The first experiment [10] used the 176Yb(10B,6n) reaction and
obtained a level scheme up to high spin in which five rotational bands were identified and
interpreted as being part of 180Re, even though there were no connections with the low-spin
part of the level scheme [8, 9]. A 4-quasiparticle isomer was also reported, with associated
rotational bands. The second high-spin experiment [11] used two different beam and target
combinations, 181Ta(α,5n) and 170Er(14N,4n), and established the existence of six strongly
coupled rotational bands and a seventh band which showed a significant energy splitting
between the sequences of different signature. The 4-quasiparticle isomer was confirmed and
higher-lying isomers were reported but not characterised. Again, connections with the low-
spin states were not identified, and spin assignments remained tentative. The interpretations
2

of the two data sets [10, 11] differed substantially.
The structures of the 2-quasiparticle bands have been reinterpreted by Jain et al. [12].
The present work builds on this, reports new connections between the known bands, extends
those bands to higher spin, and identifies two 6-quasiparticle bands for the first time. Despite
these successes, connections with the low-spin states, populated in electron-capture decay,
remain unidentified. Nevertheless, a consistent understanding of the high-spin level structure
is provided, up to spin values of almost 30 h. The highest-lying isomer, with τ=13±1 µs, is
assigned an Iπ=Kπ=21− six-quasiparticle structure. Its K-forbidden decay provides insight
into the persistence of the K quantum number. The present work supersedes a preliminary
report [13] of the 4- and 6-quasiparticle results.
II. EXPERIMENTAL PROCEDURE
The nuclide 180Re was populated up to spin ∼30 h with a 71 MeV beam of 11B ions
incident on a self-supporting 174Yb target of thickness 5 mg/cm2. The choice of beam energy
was based on calculations using the code PACE [14], and by inspection of the experimental γ-
ray spectra at different beam energies. Although the evaporation of five neutrons constituted
the main channel at 71 MeV, γ rays from other nuclides were also observed, principally 181Re
and 179Re, via the 4n and 6n channels, respectively. The γ-ray measurements were made
using the CAESAR detector array [15], consisting of six Compton-suppressed n-type coaxial
HPGe detectors (with a BGO shield surrounding each detector) mounted at angles of ±48o,
±97o and ±145o with respect to the beam axis, and two small-volume unsuppressed planar
Ge detectors (LEPS) at ±45o used for enhanced sensitivity to low-energy γ rays and X-rays.
The array was operated in both singles and coincidence mode.
For measuring conversion electrons, the Super-e electron spectrometer [16] was used, con-
sisting of a superconducting magnet transporter and a Si(Li) detector with an antipositron
baffle. This was operated in lens mode, with the baffle system restricting the momentum
acceptance. In the current work, two electron-energy ranges were studied, 200−900 keV,
and 400−600 keV. To measure the γ-ray spectrum simultaneously with the conversion elec-
trons, a Compton-suppressed HPGe detector was installed at 135o to the beam direction.
Efficiency and energy calibrations were performed for each of the two experimental arrange-
ments (CAESAR and Super-e) using a 152Eu radioactive source at the target position.
3

A. Gamma-ray Measurements
Gamma-gamma coincidence measurements were performed with 1 ns beam pulses, 1.7 µs
apart. A total of 3×10⁸ coincidence events were sorted into a variety of 4096×4096-channel
matrices. For example, one matrix had the requirement that the γ rays occur within ± 40
ns of each other. Another had the time relationship relaxed to ± 170 ns, thus including
low-energy γ rays and X-rays, which can experience considerable time walk. Additional
conditions that the events occur during the beam pulses, or between beam pulses, have been
used. To study across-isomer correlations early-delayed matrices were constructed in two
time-difference regimes, 40-170 ns and 170-800 ns. Projection of those events that precede
an isomer was achieved by gating on transitions that follow it, and vice versa.
Two three-dimensional matrices (cubes) were sorted for detailed time analysis. For states
depopulated by low-energy γ rays, a γ-X-∆t cube was constructed, with HPGe-detector
events on one axis, LEPS events on the second axis, and the time difference between them
on the third axis. A corresponding γ-γ-∆t cube was also constructed. The background-
subtracted spectra were then obtained by projecting onto the time axis with gates on the
γ-rays which populated and depopulated the levels of interest. This enabled lifetimes in the
ns → µs range to be associated with specific states.
In order to measure longer lifetimes, separate measurements were performed with two
different µs-pulsing ranges. One was with the beam on for 7 µs and off for 107 µs, and the
other with the beam on for 53 µs and off for 802 µs. Gamma-ray energies and their times
relative to the beam pulses were recorded in event-by-event mode, and two-dimensional
γ-time matrices were created.
The DCO (Directional Correlation of Oriented states) technique was used to aid spin
determinations. The DCO ratio may be defined as [17]:
RDCO =Iγ2
θ1(Gateγ1
θ2)
Iγ2
θ2(Gateγ1
θ1)
(1)
where I represents the γ-ray intensity, and θ1 and θ2 are the angles between each detector
and the beam axis. DCO ratios were extracted for the present geometry with θ1 = 1450, and
θ2 = 970. If the two transitions in the cascade have the same multipolarity, then gating on
either of them gives RDCO≈1. However, gating on a stretched quadrupole transition gives
RDCO≈0.56 for a stretched dipole transition, and values ranging from RDCO≈0.3 to ≈1.2
4

for mixed M1/E2 transitions, depending on the spin change and the size and sign of the
mixing ratio. Measured DCO ratios are included in table I.
B. Conversion-electron Measurements
The conversion-electron experiment was carried out using a pulsed beam, with 7 µs pulses
separated by 107 µs. Data were collected only in the off-beam period with the Si(Li) and
HPGe detectors, and sorted into two matrices, one with electron energy against the time of
arrival relative to the beam pulse, and the other with the γ-ray energy against time.
The electron events were subjected to momentum-selection criteria [16]. After recording
the full electron spectrum from the Si(Li) detector, events were selected which satisfy the de-
fined relationship between the electron energy and the solenoid field. The energy-dependent
time response of electrons and γ rays was corrected, and matched spectra were produced.
Conversion coefficients were obtained directly from the ratios of efficiency-corrected electron
and γ-ray intensities.
III. EXPERIMENTAL RESULTS
Eleven rotational bands have been identified in the present work, based on 2-, 4-, and
6-quasiparticle configurations. The level scheme is presented in two parts. Figure 1 shows 2-
quasiparticle bands 1, 2 and 3, and Figure 2 shows 2-quasiparticle bands 3, 4 and 11 together
with the 4- and 6-quasiparticle bands. For clarity, band 3 is reproduced in both figures. The
γ-ray energies and intensities for transitions assigned to 180Re are listed in Table I, while
conversion coefficients are listed in Table II. Representative singles spectra for conversion
electrons and γ-rays are shown in Figure 3. In addition to the conversion coefficients obtained
directly from the ratio of the electron and γ-ray intensities, for low-energy transitions the
total conversion coefficients have been extracted from transition intensity balances. The
coefficients are compared with theoretical values [18] to distinguish between electric and
magnetic characters. According to the general behavior of γ-ray transition probabilities, only
E1, M1 and E2 multipolarities need to be considered, except for transitions depopulating
bandheads where significant lifetimes are measured. Strongly populated bands are assumed
to be closer to yrast than more weakly populated bands. The K value of a rotational band
5

is usually taken to be the spin of the bandhead. An exception to this rule arises for bands
1 and 2, where the K value is taken to be lower than the bandhead spin by 2 h and 1 h,
respectively (see later).
The level scheme presented in Figures 1 and 2 takes as its starting point bands 4 and
11, interpreted by Jain et al. [12] to have Kπ = 8+ and Kπ = 9−, respectively. In ref. [12] a
series of arguments was used to modify assignments given previously [10, 11]. Jain et al. [12]
considered signature splittings, g-factors, systematics from neighboring nuclei, bandhead
energies (including residual interactions) and quasiparticle alignments, to establish reliable
and consistent configurations for these 2-quasiparticle bands. Our experimental and theo-
retical results (see Section IV) for bands 4 and 11 are in good accord with the conclusions
of Jain et al., and hence these two bands used as the foundation for constructing the rest
of the level scheme. Although they do not have experimental spin assignments, their struc-
tures and spins are considered to be on firm ground, and parentheses are not used for their
spins and parities in the following presentation. Rather, parentheses are used to distinguish
assignments that are tentative relative to bands 4 and 11.
Nilsson configuration assignments are suggested in the following sections for each of the
observed rotational bands. These are proposed with the aid of multi-quasiparticle calcu-
lations (discussed later) and in each case care is taken that the configuration should be
consistent both with the degree of rotational alignment and with the experimental g-factors.
Plots of alignment as a function of rotational frequency are shown in Figure 4. Configura-
tions which involve i 13
2
, 9/2+[624] neutrons and h 9
2
, 1/2−[541] protons are strongly affected
by the Coriolis force and have relatively large alignments at low rotational frequency.
The in-band γ-ray branching ratios have been used to determine gK values from the
rotational-model expressions:
δ2
1 + δ2=
2K2(2I − 1)
(I + 1)(I + K − 1)(I − K − 1)
(
E1
E2
)5
λ, (2)
gK − gR
Q0
=0.933E1
δ√
I2 − 1(3)
where δ is the E2/M1 mixing ratio, E is the transition energy in MeV, λ is the (∆I =
2)/(∆I = 1) γ-ray transition intensity ratio, and gR is the rotational g-factor. Q0 is the
intrinsic quadrupole moment given in units of e.b. For all bands in 180Re, Q0=5.6±0.5 e.b
6

TABLE I: Gamma-ray energy, relative intensity, initial and final level energy, initial and final
spin and parity, and DCO ratio, for transitions assigned to 180Re. Tentative assignments and
uncertainties are given in parentheses.
Eγ (keV) I aγ Ei E b
f K, Iπi → K, Iπ
f R cDCO
42.4(3) 73(27) 205.3 163.0 8, 8+ (7, 8+)
45.8(5) 177(29) 45.8 0.0 (4, 6+) (4, 5+)
54.8(5) 56(28) 1755.2 1700.4 15, 15− 14, 14−
(62.9) wd 3471.3 3408.4 21, 21− (18, 20+)
77.5(2) 36(12) 123.3 45.8 (4, 7+) (4, 6+)
79.1(2) 20(4) 284.4 205.3 9, 9− 8, 8+
(85.4) wd 1755.2 1669.8 15, 15− (13, 13−)
88.5(2) 70(17) 266.3 177.8 (5, 8−) (5, 7−)
92.2(6) 85(12) 163.0 70.8 (7, 8+) (7, 7+) 0.87(12)
102.2(1) 21(10) 3471.3 3369.1 21, 21− (19, 19−)
104.1(1) 79(18) 370.9 266.3 (5, 9−) (5, 8−) 0.96(14)
106.3(5) 72(20) 230.1 123.3 (4, 8+) (4, 7+)
120.5(1) 334(73) 1875.7 1755.2 16, 16+ 15, 15−
121.4(2) 766(218) 284.4 163.0 9, 9− (7, 8+)
(132.0(3) 45(14) 177.8 45.8 5, 7− 4, 6+)
133.2(2) 24(5) 362.9 230.1 (4, 9+) (4, 8+)
134.1(4) 160(17) 1700.4 1566.3 14, 14− 13, 13+
134.3(4) 99(29) 418.7 284.4 9, 10− 9, 9− 0.89(1)
134.5(2) 605(148) 205.3 70.8 8, 8+ (7, 7+)
141.4(2) 38(10) 1566.3 1424.8 13, 13+ 8, 13+
145.3(1) 37(8) 672.6 526.6 (5, 11−) (5, 10−)
149.5(4) 218(22) 312.5 163.0 (7, 9+) (7, 8+) 0.96(3)
155.7(1) 248(15) 526.6 370.9 (5, 10−) (5, 9−)
159.8(1) 22(5) 523.1 362.9 (4, 10+) (4, 9+)
163.1(8) 60(8) 1566.3 1403.2 13, 13+ (12, 12−)
173.4(3) 17(8) 696.2 523.1 (4, 11+) (4, 10+)
7

TABLE I CONTINUED
Eγ (keV) I aγ E b
i Ef K, Iπi → K, Iπ
f R cDCO
176.8(2) 211(17) 595.4 418.7 9, 11− 9, 10− 0.96(4)
177.1(6) 51(6) 1079.8 902.4 (5, 13−) (5, 12−)
182.5(6) 154(29) 495.0 312.5 (7, 10+) (7, 9+) 1.04(4)
184.3(1) 34(11) 230.1 45.8 (4, 8+) (4, 6+) 1.01(4)
193.1(2) 47(10) 370.9 177.8 (5, 9−) (5, 7−)
199.8(3) 31(13) 1586.3 1387.0 (5, 15−) (5, 14−)
201.2(8) 60(6) 696.2 495.0 (4, 11+) (7, 10+)
208.6(2) 377(14) 413.9 205.3 8, 9+ 8, 8+ 0.85(4)
209.9(4) 319(13) 805.3 595.4 9, 12− 9, 11− 0.91(5)
210.6(4) 26(13) 523.1 312.5 (4, 10−) (7, 9+)
220.5(1) 28(4) 715.5 495.0 (7, 11+) (7, 10+)
228.4(4) 347(29) 642.3 413.9 8, 10+ 8, 9+ 1.07(2)
229.1(2) 68(11) 1929.5 1700.4 (14, 15−) (14, 14−) 0.95(12)
229.9(1) 133(28) 902.4 672.6 5, 12− 5, 11−
231.4(3) 55(25) 2160.9 1929.5 14, 16− 14, 15− 0.83(14)
233.6(2) 32(6) 949.1 715.5 (7, 12+) (7, 11+)
237.4(2) 207(16) 1042.7 805.3 9, 13− 9, 12−
239.6(1) 74(10) 362.9 123.3 (4, 9+) (4, 7+) 0.96(8)
241.8(1) 55(5) 312.5 70.8 (7, 9+) (7, 7+)
245.9(5) 293(26) 888.2 642.3 8, 11+ 8, 10+ 0.95(2)
252.9(3) 23(10) 949.1 696.2 (7, 12+) (4, 11+)
255.5(1) 82(13) 1204.6 949.1 (7, 13+) (7, 12+)
259.5(2) 87(37) 2420.4 2160.9 14, 17− 14, 16−
260.3(2) 124(33) 526.6 266.3 (5, 10−) (5, 8−)
261.1(4) 96(9) 1303.9 1042.7 9, 14− 9, 13− 0.85(6)
261.4(5) 308(35) 1149.6 888.2 8, 12+ 8, 11+ 0.96(3)
262.4(2) 38(7) 1566.3 1303.9 13, 13+ 9, 14−
263.9(1) 299(15) 2139.6 1875.7 16, 17+ 16, 16+ 0.94(2)
275.2(1) 139(23) 1424.8 1149.6 8, 13+ 8, 12+ 1.20(4)
8
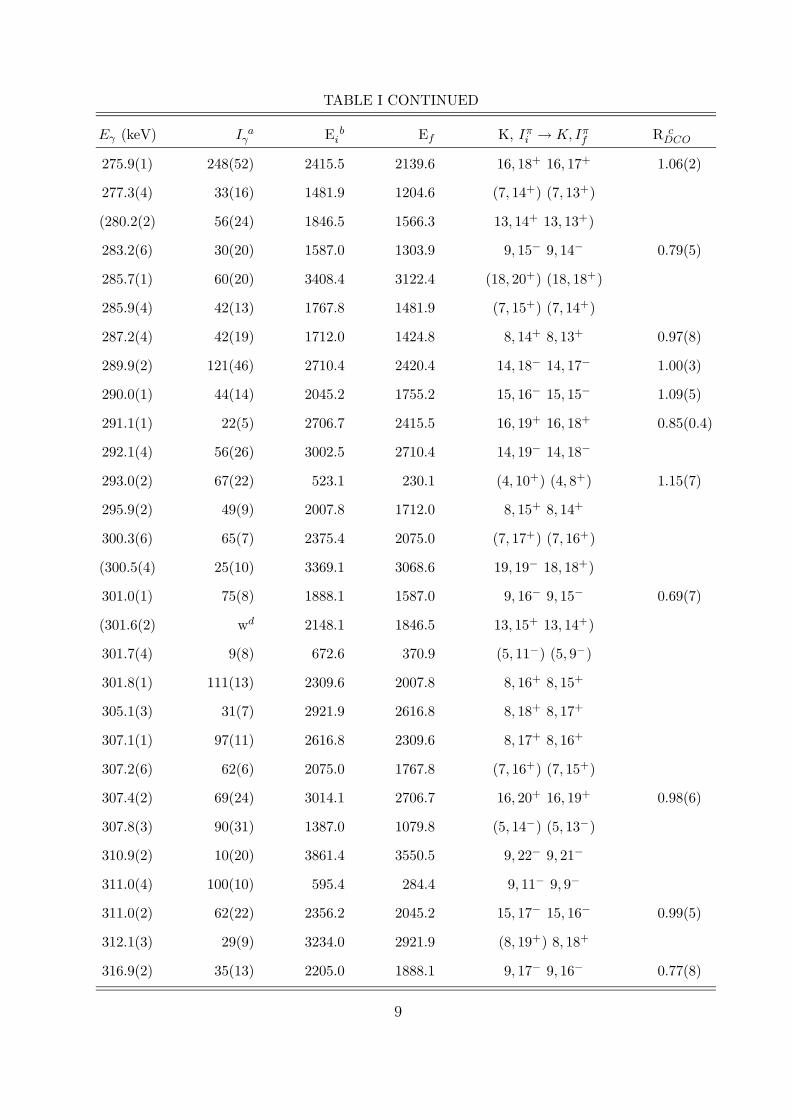
TABLE I CONTINUED
Eγ (keV) I aγ E b
i Ef K, Iπi → K, Iπ
f R cDCO
275.9(1) 248(52) 2415.5 2139.6 16, 18+ 16, 17+ 1.06(2)
277.3(4) 33(16) 1481.9 1204.6 (7, 14+) (7, 13+)
(280.2(2) 56(24) 1846.5 1566.3 13, 14+ 13, 13+)
283.2(6) 30(20) 1587.0 1303.9 9, 15− 9, 14− 0.79(5)
285.7(1) 60(20) 3408.4 3122.4 (18, 20+) (18, 18+)
285.9(4) 42(13) 1767.8 1481.9 (7, 15+) (7, 14+)
287.2(4) 42(19) 1712.0 1424.8 8, 14+ 8, 13+ 0.97(8)
289.9(2) 121(46) 2710.4 2420.4 14, 18− 14, 17− 1.00(3)
290.0(1) 44(14) 2045.2 1755.2 15, 16− 15, 15− 1.09(5)
291.1(1) 22(5) 2706.7 2415.5 16, 19+ 16, 18+ 0.85(0.4)
292.1(4) 56(26) 3002.5 2710.4 14, 19− 14, 18−
293.0(2) 67(22) 523.1 230.1 (4, 10+) (4, 8+) 1.15(7)
295.9(2) 49(9) 2007.8 1712.0 8, 15+ 8, 14+
300.3(6) 65(7) 2375.4 2075.0 (7, 17+) (7, 16+)
(300.5(4) 25(10) 3369.1 3068.6 19, 19− 18, 18+)
301.0(1) 75(8) 1888.1 1587.0 9, 16− 9, 15− 0.69(7)
(301.6(2) wd 2148.1 1846.5 13, 15+ 13, 14+)
301.7(4) 9(8) 672.6 370.9 (5, 11−) (5, 9−)
301.8(1) 111(13) 2309.6 2007.8 8, 16+ 8, 15+
305.1(3) 31(7) 2921.9 2616.8 8, 18+ 8, 17+
307.1(1) 97(11) 2616.8 2309.6 8, 17+ 8, 16+
307.2(6) 62(6) 2075.0 1767.8 (7, 16+) (7, 15+)
307.4(2) 69(24) 3014.1 2706.7 16, 20+ 16, 19+ 0.98(6)
307.8(3) 90(31) 1387.0 1079.8 (5, 14−) (5, 13−)
310.9(2) 10(20) 3861.4 3550.5 9, 22− 9, 21−
311.0(4) 100(10) 595.4 284.4 9, 11− 9, 9−
311.0(2) 62(22) 2356.2 2045.2 15, 17− 15, 16− 0.99(5)
312.1(3) 29(9) 3234.0 2921.9 (8, 19+) 8, 18+
316.9(2) 35(13) 2205.0 1888.1 9, 17− 9, 16− 0.77(8)
9

TABLE I CONTINUED
Eγ (keV) I aγ E b
i Ef K, Iπi → K, Iπ
f R cDCO
317.7(4) 30(10) 3369.1 3051.4 (19, 19−) 18, 18+
317.9(1) 65(20) 2693.3 2375.4 (7, 18+) (7, 17+)
319.2(4) wd 3002.5 2683.3 14, 19− 15, 18−
319.6(5) 7(4) 4524.4 4204.8 9, 24− 9, 23−
323.8(3) 69(24) 3337.9 3014.1 16, 21+ 16, 20+ 0.90(12)
(324.5(2) wd 2472.6 2148.1 13, 16+ 13, 14+)
325.1(3) 76(30) 3327.6 3002.5 14, 20− 14, 19−
327.1(2) 62(10) 2683.3 2356.2 15, 18− 15, 17− 1.14(14)
327.3(1) 33(7) 2532.3 2205.0 9, 18− 9, 17− 0.79(16)
331.9(8) 65(7) 495.0 163.0 (7, 10+) (7, 8+)
333.3(1) 65(15) 696.2 362.9 (4, 11+) (4, 9+) 1.01(7)
336.9(6) 23(8) 3209.0 2872.1 9, 20− 9, 19−
339.8(2) 23(4) 2872.1 2532.3 9, 19− 9, 18− 0.79(16)
340.9(2) 42(22) 3668.4 3327.6 14, 21− 14, 20−
341.0(8) 88(32) 3678.9 3337.9 16, 22+ 16, 21+ 0.82(11)
341.5(1) 32(5) 3550.5 3209.0 9, 21− 9, 20−
343.4(6) 24(9) 4204.8 3861.4 9, 23− 9, 22−
352.6(2) 21(5) 715.5 362.9 (7, 11+) (4, 9+)
356.6(2) 62(25) 4025.1 3668.5 14, 22− 14, 21−
357.8(2) 38(22) 4036.7 3678.9 16, 23+ 16, 22+ 1.31(33)
(363.0(2) wd 4887.4 4524.4 9, 25− 9, 24−)
366.3(3) 23(12) 4391.4 4025.1 14, 23− 14, 22−
374.0(1) 48(13) 4269.3 3895.3 (22, 23+) (22, 22+) 0.94(9)
375.8(1) 142(28) 902.4 526.6 (5, 12−) (5, 10−)
375.8(1) 70(5) 4412.5 4036.7 16, 24+ 16, 23+ 1.02(2)
380.0(4) 41(8) 3851.3 3471.3 21, 22− 21, 21−
381.9(1) 30(11) 4651.2 4269.3 (22, 24+) (22, 23+) 1.08(18)
382.4(1) 174(30) 905.5 523.1 (4, 12+) (4, 10+) 1.09(5)
382.5(3) 74(25) 1969.2 1586.3 (5, 16−) (5, 15−)
10
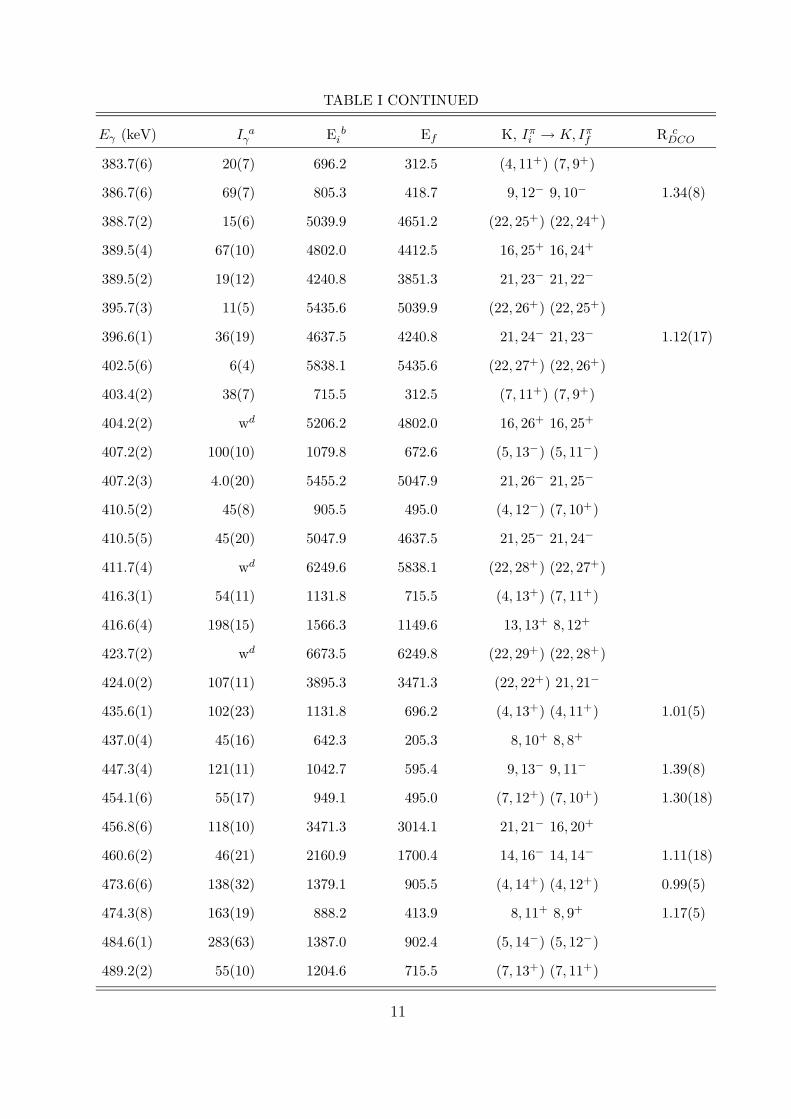
TABLE I CONTINUED
Eγ (keV) I aγ E b
i Ef K, Iπi → K, Iπ
f R cDCO
383.7(6) 20(7) 696.2 312.5 (4, 11+) (7, 9+)
386.7(6) 69(7) 805.3 418.7 9, 12− 9, 10− 1.34(8)
388.7(2) 15(6) 5039.9 4651.2 (22, 25+) (22, 24+)
389.5(4) 67(10) 4802.0 4412.5 16, 25+ 16, 24+
389.5(2) 19(12) 4240.8 3851.3 21, 23− 21, 22−
395.7(3) 11(5) 5435.6 5039.9 (22, 26+) (22, 25+)
396.6(1) 36(19) 4637.5 4240.8 21, 24− 21, 23− 1.12(17)
402.5(6) 6(4) 5838.1 5435.6 (22, 27+) (22, 26+)
403.4(2) 38(7) 715.5 312.5 (7, 11+) (7, 9+)
404.2(2) wd 5206.2 4802.0 16, 26+ 16, 25+
407.2(2) 100(10) 1079.8 672.6 (5, 13−) (5, 11−)
407.2(3) 4.0(20) 5455.2 5047.9 21, 26− 21, 25−
410.5(2) 45(8) 905.5 495.0 (4, 12−) (7, 10+)
410.5(5) 45(20) 5047.9 4637.5 21, 25− 21, 24−
411.7(4) wd 6249.6 5838.1 (22, 28+) (22, 27+)
416.3(1) 54(11) 1131.8 715.5 (4, 13+) (7, 11+)
416.6(4) 198(15) 1566.3 1149.6 13, 13+ 8, 12+
423.7(2) wd 6673.5 6249.8 (22, 29+) (22, 28+)
424.0(2) 107(11) 3895.3 3471.3 (22, 22+) 21, 21−
435.6(1) 102(23) 1131.8 696.2 (4, 13+) (4, 11+) 1.01(5)
437.0(4) 45(16) 642.3 205.3 8, 10+ 8, 8+
447.3(4) 121(11) 1042.7 595.4 9, 13− 9, 11− 1.39(8)
454.1(6) 55(17) 949.1 495.0 (7, 12+) (7, 10+) 1.30(18)
456.8(6) 118(10) 3471.3 3014.1 21, 21− 16, 20+
460.6(2) 46(21) 2160.9 1700.4 14, 16− 14, 14− 1.11(18)
473.6(6) 138(32) 1379.1 905.5 (4, 14+) (4, 12+) 0.99(5)
474.3(8) 163(19) 888.2 413.9 8, 11+ 8, 9+ 1.17(5)
484.6(1) 283(63) 1387.0 902.4 (5, 14−) (5, 12−)
489.2(2) 55(10) 1204.6 715.5 (7, 13+) (7, 11+)
11

TABLE I CONTINUED
Eγ (keV) I aγ E b
i Ef K, Iπi → K, Iπ
f R cDCO
491.7(5) 18(19) 2420.4 1929.5 14, 17− 14, 15− 0.81(8)
498.6(4) 117(11) 1303.9 805.3 9, 14− 9, 12−
506.5(2) 158(44) 1586.3 1079.8 (5, 15−) (5, 13−)
507.4(3) 92(22) 1149.6 642.3 8, 12+ 8, 10+
508.4(2) 8(2) 1204.6 696.2 (7, 13+) (4, 11+)
511.3(1) 72(17) 1643.1 1131.8 (4, 15+) (4, 13+) 0.99(5)
523.5(1) 60(9) 1566.3 1042.7 13, 13+ 9, 13−
532.7(2) 51(10) 1481.9 949.1 (7, 14+) (7, 12+)
536.6(2) 66(13) 1424.8 888.2 8, 13+ 8, 11+
539.7(3) 40(22) 2415.5 1875.7 16, 18+ 16, 16+ 1.25(16)
544.3(4) 128(10) 1587.0 1042.7 9, 15− 9, 13−
547.3(1) 95(24) 1926.4 1379.1 (4, 16+) (4, 14+)
548.2(1) 26(21) 2710.3 2160.9 14, 18− 14, 16− 1.06(13)
562.3(3) 38(13) 1712.0 1149.6 8, 14+ 8, 12+
563.2(2) 73(4) 1767.8 1204.6 (7, 15+) (7, 13+)
567.0(3) 28(16) 2706.7 2139.6 16, 19+ 16, 17+ 1.18(25)
579.4(2) 52(16) 2222.5 1643.1 (4, 17+) (4, 15+)
581.5(1) 46(19) 3002.5 2420.4 14, 19− 14, 17− 1.39(44)
(581.8(2) wd 2148.1 1566.3 13, 15+ 13, 13+)
582.2(4) 96(53) 1969.2 1387.0 (5, 16−) (5, 14−) 1.38(19)
583.0(3) 67(16) 2007.8 1424.8 8, 15+ 8, 13+
584.2(1) 89(13) 1888.1 1303.9 9, 16− 9, 14−
593.2(3) 47(11) 2075.0 1481.9 (7, 16+) (7, 14+) 1.37(17)
597.7(4) 80(20) 2309.6 1712.0 8, 16+ 8, 14+
599.7(3) 64(33) 3014.1 2415.5 16, 20+ 16, 18+ 0.92(22)
600.2(2) 155(61) 2186.5 1586.3 (5, 17−) (5, 15−)
601.0(2) wd 2356.2 1755.2 15, 17− 15, 15−
607.6(6) 107(13) 2375.4 1767.8 (7, 17+) (7, 15+) 1.25(18)
609.0(1) 167(22) 2616.8 2007.8 8, 17+ 8, 15+
12

TABLE I CONTINUED
Eγ (keV) I aγ E b
i Ef K, Iπi → K, Iπ
f R cDCO
610.6(2) 83(28) 2537.0 1926.4 (4, 18+) (4, 16+)
612.2(2) 123(18) 2921.9 2309.6 8, 18+ 8, 16+
616.9(4) 40(33) 3327.6 2710.4 14, 20− 14, 18− 1.24(16)
617.2(1) 158(21) 3234.0 2616.8 (8, 19+) 8, 17+
618.2 2) wd 2693.3 2075.0 (7, 18+) (7, 16+)
618.3(8) 97(10) 2205.0 1587.0 9, 17− 9, 15−
(626.1(2) wd 2472.6 1846.5 13, 16+ 13, 14+)
631.9(5) 50(47) 3337.9 2706.7 16, 21+ 16, 19+ 0.85(18)
638.1(1) 28(11) 2683.3 2045.2 15, 18− 15, 16−
638.2(2) 39(15) 2860.7 2222.5 (4, 19+) (4, 17+)
644.5(6) 70(7) 2532.3 1888.1 9, 18− 9, 16−
651.6(6) 23(4) 3861.4 3209.0 9, 22− 9, 20−
654.8(2) 21(4) 4204.8 3550.5 9, 23− 9, 21−
663.0(4) 20(9) 4524.4 3861.4 9, 24− 9, 22−
664.1(2) 49(29) 2633.3 1969.2 (5, 18−) (5, 16−)
665.5(1) 74(34) 3678.9 3014.1 16, 22+ 16, 20+ 1.02(18)
665.9(2) 69(20) 3202.9 2537.0 (4, 20+) (4, 18+)
666.0 4) wd 3668.4 3002.5 14, 21− 14, 19− 1.18(7)
667.1(1) 62(7) 2872.1 2205.0 9, 19− 9, 17−
676.9(4) 45(8) 3209.0 2532.3 9, 20− 9, 18−
678.1(1) 169(23) 1566.3 888.2 13, 13+ 8, 11+
679.3(2) 44(5) 3550.5 2872.1 9, 21− 9, 19−
681.2(3) 55(33) 2867.7 2186.5 (5, 19−) (5, 17−)
(682.6(4) 10(4) 4887.4 4204.8 9, 25− 9, 23−)
689.1(2) wd 3549.8 2860.7 (4, 21+) (4, 19+) 0.97(5)
696.5(1) 48(33) 4025.1 3327.6 14, 22− 14, 20− 1.24(12)
698.7(2) wd 4036.7 3337.9 16, 23+ 16, 21+ 0.94(16)
707.6(6) 22(10) 3910.5 3202.9 (4, 22+) (4, 20+)
720.0(2) wd 3353.3 2633.3 (5, 20−) (5, 18−)
13

TABLE I CONTINUED
Eγ (keV) I aγ E b
i Ef K, Iπi → K, Iπ
f R cDCO
724.1(5) 56(28) 4391.3 3668.4 14, 23− 14, 21− 1.08(25)
731.8(2) wd 4412.5 3678.9 16, 24+ 16, 22+ 0.98(17)
732.7(5) 20(10) 4643.2 3910.5 (4, 24+) (4, 22+) 0.98(17)
748.4(2) wd 3616.1 2867.7 (5, 21−) (5, 19−)
750.1(2) wd 4299.9 3549.8 (4, 23+) (4, 21+)
756.1(3) 7(4) 4651.2 3895.3 (22, 24+) (22, 22+)
761.0(1) 38(5) 1566.3 805.3 13, 13+ 9, 12−
764.2(2) wd 4802.0 4036.7 16, 25+ 16, 23+
768.3(5) 12(10) 4240.8 3471.3 21, 23− 21, 21−
771.2(4) 7(4) 5039.9 4269.3 (22, 25+) (22, 23+)
784.2(4) 7(3) 5435.6 4651.2 (22, 26+) (22, 24+)
786.8(3) 7(5) 4637.5 3851.3 21, 24− 21, 22−
794.1(2) wd 5206.2 4412.5 16, 26+ 16, 24+
796.0(2) wd 4412.1 3616.1 (5, 23−) (5, 21−)
797.7(3) 8(4) 5838.1 5039.9 (22, 27+) (22, 25+)
799.2(4) 4(3) 5047.9 4240.8 21, 25− 21, 23−
(802.7(2) wd 5102.6 4299.9 4, 25+ 4, 23+)
807.8(6) 19(7) 1403.2 595.4 (12, 12−) 9, 11−
809.2(4) 4(3) 5455.2 4637.5 21, 26− 21, 24−
813.5(6) 6(2) 6249.8 5435.6 (22, 28+) (22, 26+)
835.6(6) 3(2) 6673.5 5838.1 (22, 29+) (22, 27+)
895.3(8) 8(2) 1700.4 805.3 14, 14− 9, 12−
912.2(3) 13(3) 3051.4 2139.6 18, 18+ 16, 17+
929.0(2) 15(2) 3068.6 2139.6 (18, 18+) 16, 17+
982.8(2) 13(3) 3122.4 2139.6 (18, 18+) 16, 17+
984.5(1) 87(13) 1403.2 418.7 (12, 12−) 9, 10−
1074.4(3) 23(10) 1669.8 595.4 (13, 13−) 9, 11−
1164.1(3) 7(2) 3369.1 2205.0 (19, 19−) 9, 17−
1175.8(1) 48(16) 3051.4 1875.7 18, 18+ 16, 16+
14

TABLE I CONTINUED
Eγ (keV) I aγ E b
i Ef K, Iπi → K, Iπ
f R cDCO
1192.9(2) 15(4) 3068.6 1875.7 (18, 18+) 16, 16+
1246.7(1) 41(10) 3122.4 1875.7 (18, 18+) 16, 16+
a Relative γ-ray intensity with arbitrary normalisation.
b All energies of levels are relative to the Iπ=(5+) bandhead of band 2.
c DCO ratios (see text).
d w indicates that the γ-ray intensity is low.
and gR=0.30±0.05 were used, as adopted by Venkova et al. [11]. The subscripts 1,2 refer to
∆I=1,2 transitions. The experimental values are compared with Nilsson-model estimates,
using:
KgK =∑
(ΛgΛ + ΣgΣ) (4)
where Λ and Σ are projections of the orbital and intrinsic spins, respectively, with gΛ=0 for
neutrons and 1 for protons. The free nucleon values of gΣ=−3.83 for neutrons and +5.59
for protons are attenuated by a factor of 0.6 [19], and Nilsson-model wavefunctions are used
to determine the expectation values of the intrinsic-spin projections. Equation 2 assumes
a well defined K value and only yields the magnitude of δ and not its sign. In this work
the sign of (gK − gR) has not been determined, though positive signs have been previously
obtained [11] from γ-ray angular distributions for bands 3, 4, 8 and 11 (with Kπ = 7+, 8+,
16+ and 9−, respectively). Nevertheless, it is not straightforward to make a quantitative
comparison with the resulting g-factors from ref. [11] on account of the different K values
that have been used.
The measured | gK − gR | values are listed in Table III and compared with corresponding
theoretical values. There is reasonable agreement for all assigned bands (though not the
unassigned Kπ = 4− option) providing support for the suggested configurations. The last
column in Table III lists cases where gK = 0.08 is used for i 13
2
neutrons [19], and gK = −1.0
is used for h 9
2
protons [20]. These values allow for alignment effects, and typically lead to
improved agreement with experimental values. At least part of the remaining discrepancies
can be attributed to the assumption of fixed gR = 0.30. As observed for multi-quasiparticle
bands in, for example, 178W [21] and 179W [19], there is evidence that the neutron-proton
15

TABLE II: Conversion coefficients for selected transitions in 180Re
Eγ Shell αexp αth Multipolarity
42.4 TOT a) 13(4) M1: 11.5 M1
54.8 TOT a) 7(2) M1: 5.40 M1
77.5 TOT a) 8.3(3) M1: 11.3 M1
102.2 TOT a) 2.5(9) E2: 3.84 E2
120.5 TOT a) 0.6(3) E1: 0.24; M1: 3.17 E1
141.4 TOT a) 1.9(2) M1: 2.01 M1
245.9 K 0.231(50) M1: 0.355; E2: 0.0981 M1/E2
275.9 K 0.190(25) M1: 0.258; E2: 0.0725 M1/E2
285.7 K 0.077(12) E2: 0.0662 E2
307.4 K 0.107(20) M1: 0.194; E2: 0.0547 M1/E2
416.6 K 0.054(6) M1: 0.0860; E2: 0.0256 M1/E2
447.3 K 0.023(10) E2: 0.0216 E2
456.8 K 0.0084(10) E1: 0.00759 E1
474.3 K 0.026(6) E2: 0.0188 E2
507.4 K 0.020(3) M1: 0.0514; E2: 0.0161 E2
L 0.005(2) M1: 0.00797; E2: 0.00394
599.7 K 0.012(2) E2: 0.0112 E2
678.1 K 0.008(1) E2: 0.00857 E2
1175.8 K 0.003(1) E2: 0.00287 E2
1192.9 K 0.005(2) M1: 0.00593; E2: 0.00280 M1 or E2
a) Total conversion coefficient obtained from intensity-balance considerations.
balance in the configuration has a significant influence on gR. The effect was quantified for
the more extensive 178W data set [21], but is not accounted for in the present work.
It is also informative to make comparisons of 180Re band properties (g-factors and align-
ments) with corresponding bands known [20] in the isotone 178Ta. It is found, for example,
that the 180Re low-frequency alignments are systematically ∼2 h greater than their 178Ta
counterparts, a difference which may be understood qualitatively as arising from the smaller
β2 deformation of 180Re, which leads to stronger Coriolis mixing. Specific comparisons are
16

made in the following sections.
TABLE III: Configurations and average g-factors for 2-, 4- and 6-quasiparticle bands in 180Re.
Band Kπ Energy Configuration a) gK − gR
(keV) Expt. b) Calc. c) Calc. d)
4− e) 178 ν9/2+⊗π1/2− 0.45(5) −0.63 −0.09
1 5− e) 178 ν9/2+⊗π1/2− 0.35(4) −0.40 −0.33
2 4+ 0 ν7/2−⊗π1/2− 0.14(2) +0.01 −0.22
3 7+ 71 ν9/2+⊗π5/2+ 0.25(3) +0.09 +0.27
4 8+ 205 ν7/2−⊗π9/2− 0.45(5) +0.50 +0.50
11 9− 284 ν9/2+⊗π9/2− 0.25(3) +0.22 +0.36
5 13+ 1566 ν7/2−,9/2+,5/2−⊗ π5/2+ −0.09 +0.01
6 14− 1700 ν7/2−,9/2+,7/2+⊗ π5/2+ 0.21(8) −0.10 +0.06
7 15− 1755 ν7/2−,9/2+,5/2−⊗ π9/2− 0.18(9) +0.01 +0.09
8 16+ 1876 ν7/2−,9/2+,7/2+⊗ π9/2− 0.16(3) −0.01 +0.14
9 21− 3471 ν7/2−,9/2+,5/2−⊗ π5/2+,9/2−,7/2+ 0.16(8) +0.21 +0.27
10 22+ 3895 ν7/2−,9/2+,7/2+⊗ π5/2+,9/2−,7/2+ 0.12(6) +0.19 +0.30
a) ν: 7/2−[514], 7/2+[633], 9/2+[624], 5/2−[512]; π: 1/2−[541], 5/2+[402], 9/2−[514], 7/2+[404].
b) Average values from, at most, the six lowest-spin branching ratios in each band, assuming
Q0=5.6±0.5 e.b. The sign of gK − gR is not specified experimentally in the present work.
c) Calculated Nilsson-model values with gΣ = 0.6gfreeΣ and gR = 0.30±0.05.
d) Calculated with gK=0.08 for 7/2+ and 9/2+ neutrons, and gK=−1.0 for 1/2− protons.
e) Alternative couplings of the same two quasiparticles.
A. Two-quasiparticle Bands
1. Band 4, Kπ=8+, based on the 205 keV level
Band 4 was observed up to spin (19+) at 3234 keV. The corresponding bandhead reported
in ref. [11] was given a spin assignment of 6−, in contrast to the 7+ assignment of Kreiner
et al. [10] and the 8+ assignment of Jain et al. [12]. As indicated above, the Jain et al. 8+
17

assignment is adopted here. There are two possible configurations: ν7/2−[514] ⊗ π9/2−[514],
and ν9/2+[624] ⊗ π7/2+[404]. Of these quasiparticles, only the 9/2+[624] neutron gives
substantial alignment. Therefore, the low aligned angular momentum of the observed band
at low frequency (ix = 2h at hω ≈ 0.1 MeV, see Figure 4) favors the former configuration,
which has no aligned quasiparticles. The adopted configuration is the same as for the
Kπ=8+ band in 178Ta, which has | gK − gR |= 0.47 ± 0.05 [20], compared to the 180Re
value of 0.45 ± 0.05. The alignment shows an initial upbend below hω ≈ 0.3 MeV, which
is typically observed in this mass region [22] for i 13
2
neutron pair breaking. However, a
complete alignment was not observed due to the lack of data on higher-spin states for this
band. Note that band 8 (Kπ=16+), which is discussed later, has a related neutron (i 13
2
)2
alignment.
2. Band 11, Kπ=9−, based on the 284 keV level
Band 11 is assigned a bandhead spin of 9−, based on the discussion of Jain et al. [12], which
is consistent with our results. (Kreiner et al. [10] gave an 8− assignment, and Venkova et
al. [11] gave a 7+ assignment.) Note that there is a 79 keV transition, assigned E1 character
[11], from the 9− bandhead of band 11 to the 8+ bandhead of band 4, and all authors agree
on the relative spin and parity assignments of bands 4 and 11. Band 11 is now extended to
spin (25−). The bandhead is isomeric with a measured mean-life of 109±2 ns (see Figure
5). This is consistent with previous results [10, 11], though the uncertainty is now reduced.
Jain et al. [12] gave a configuration assignment of ν9/2+[624]⊗ π9/2−[514], which is
supported by the present work. The initial alignment (Figure 4) of ix = 3.5h at hω ≈ 0.1
MeV is consistent with the presence of an i 13
2
neutron in the configuration. We note that
there is competition between the 9/2+[624] and 7/2+[633] i 13
2
neutron orbitals, which are
mixed by the Coriolis interaction. However, it is evident from the odd-N isotones 179W
[19, 23] and 181Os [24] that the 9/2+[624] neutron is at slightly lower energy for N=105. The
band in 178Ta with the same configuration has | gK − gR |= 0.29 ± 0.03 [20], similar to the
180Re value of 0.25 ± 0.03.
The alignment (Figure 4) shows a backbend at hω ≈0.3 MeV, which is presumably due
to the alignment of a pair of i 13
2
neutrons. Due to blocking, this alignment should be delayed
in frequency relative to bands without an i 13
2
neutron in the initial configuration. In 180Re,
18

there is no good test of this behavior. However, it can be seen that the alignment gain in
band 4 (Kπ = 8+) begins at a lower frequency, as would be expected. Furthermore, these
8+ and 9− bands in 180Re have properties that are similar to the corresponding 8+ and 9−
bands in 178Ta [20].
Additional excited states, found to decay into lower members of band 11, are at 1403 keV
(12−) and 1670 keV (13−), the latter being newly placed in this work. The 1670 keV state
decays via a 1074 keV transition to the 595 keV, Iπ=11− level. The Iπ=(13−) assignment is
implied because, when gating on the 1074 keV transition in the γ−γ matrix, transitions are
seen that feed the 1755 keV, Iπ=15− level, which suggests that there is an unobserved and
highly converted (E2) 85 keV transition between the Iπ=15− state and the state in question.
The quasiparticle structures of the 1403 and 1670 keV levels are considered in Section IV.
3. Band 2, Kπ=(4+), based on the ground state, and Band 3, Kπ=(7+), based on the 71 keV
level
Bands 2 and 3 were previously reported in ref. [11]. These two structures are connected
by strong interband transitions which help in determining the energy and spin differences.
An unobserved 25 keV transition is implied [11], depopulating the bandhead of band 3. Non-
observation as a γ-ray is not surprising since an M1, 25 keV transition has a large conversion
coefficient (αTOT=55). In the present work, a 45.8 keV transition has been established at
the bottom of band 2 (see Figure 6). This transition was reported in ref. [10] but not placed
in their level scheme.
Band 3 was assigned a 3− bandhead by Venkova et al. [11]. This clearly conflicts with
our connection (see Figure 2) to band 4, which was not identified by Venkova et al. [11],
although they inferred the existence of a 42 keV transition on the basis of γ-ray coincidence
relationships. Intensity considerations for the 42.4 and 134.5 keV transitions from band 4
to band 3 imply M1 multipolarities, and hence a 7+ bandhead for the latter. Furthermore,
the transitions between bands 2 and 3 can be explained as being due to a crossing of
the bands at ≈700 keV excitation energy, characterised by chance near degeneracies and
wavefunction mixings, as discussed in more detail in Section IV. The crossing requires equal
spin and parity values for the 696 and 716 keV levels in the respective bands, and Iπ=11+
is therefore specified for these two levels to give consistency with the band 3 assignment
19

already discussed.
Band 2 forms two separate signatures (E2 sequences) above spin 10+, in the sense that
the ∆I=1 transitions are of too low intensity to be observed. In band 3 on the other
hand, the mixed dipole-quadrupole transitions are more intense relative to the stretched E2
transitions. Several additional transitions have been observed in these bands, compared to
previous work [10, 11].
Band 3 is assigned the Kπ=7+, ν9/2+[624] ⊗ π5/2+[402] configuration in accord with
ref. [10]. The configuration for band 2 is suggested to be ν7/2−[514] ⊗ π1/2−[541] with a K
value (4+), which is less than the bandhead spin (5+) on account of the aligned 1/2−[541]
proton that is involved. The initial alignment value of 4 h (see Figure 4) supports the
presence of this orbital.
In ref. [12], bands 2 and 3 were assigned different configurations, with Kπ = 3+ and
Kπ = 4+ respectively, but this was largely due to incomplete experimental information. It is
further noted that for band 2 there is a corresponding structure in 178Ta, which was assigned
Kπ=4+ [20], with | gK − gR |= 0.18 ± 0.02. This compares well with the 180Re value of
0.14 ± 0.02.
The lowest level identified in band 2 forms the effective ground state of the high-spin
part of the 180Re level structure, as elaborated in the present work. There is no connection
found with the level structure determined from β decay [6–9]. Furthermore, the assigned
5+ member of the band is not necessarily the bandhead, as there could be an additional
transition from the 5+ state with a low energy (∼30 keV) to which the present experiment
is insensitive. Nevertheless, this would have no direct impact on the other spin, parity and
configuration assignments discussed in this work, which use bands 4 and 11 as their basis.
4. Band 1, Kπ=(5−), based on the 178 keV level
Two linked sequences of γ-ray transitions, corresponding to the present band 1, were
previously identified [11] up to the 582 keV (16 → 14) and 748 keV (21 → 19) transitions.
The bandhead de-excitation, however, was not established. In ref. [11], this band was
assigned to 180Re on the basis that it could not be associated with either of the neighboring
isotopes 181Re [24] and 179Re [25], although the strongest transitions from this band were
unresolved from γ rays emitted from both isotopes. In the present work, band 1 is confirmed
20

as belonging to 180Re on the basis of coincidences observed with the 45.8 keV transition in
band 2, and the lowest member of band 1 decays to band 2 through a tentatively identified
132.0 keV transition. This transition was observed in prompt coincidence with the strong
transitions in band 1, see Figure 7. However, with five transitions assigned to 180Re in the
energy range 132.0-134.5 (see Table I) a firm placement of the 132.0 keV transition has
not been possible. (Figure 7 also shows the presence of a 324.1 keV transition which was
reported in ref. [11], and is still unplaced in the present level scheme.)
It remains problematical to determine the spin for the lowest level, at 178 keV, identified
in band 1, because it might not be the bandhead, i.e. there could be additional unobserved
transitions that are at low energy and highly converted. In this circumstance, transition
intensity balancing cannot be used to determine the multipolarity of the 132 keV transition.
Nevertheless, a spin change of one unit is implied, giving band 1 spins that are consistent
with those of Venkova et al. [11]. However, we note that the systematics discussed more
recently by Venkova et al. [26] favor assignments that are one spin unit higher. This could
be made consistent with the present work by the insertion of a low-energy (unobserved)
in-band transition at the bottom of the band, which would require the whole band to be
shifted up by that transition energy.
Band 1 in ref. [11] was given a νi 13
2
⊗ πh 9
2
assignment, i.e. ν9/2+[624] ⊗ π1/2−[541].
These two nucleons can couple to Kπ=4− or 5−, the former being energetically favored by
the Gallagher-Moszkowski rules [27], although both nucleons are strongly affected by Coriolis
mixing. Figure 4 shows that the alignment of this band is the largest of the 2-quasiparticle
bands in 180Re, about 5 h at hω ≈ 0.1 MeV. Due to the strong Coriolis mixing, the K value
is not well defined. However, the label Kπ=(5−) is adopted since the simple g-factor analysis
favors this value (see Table III). The K value is less than the apparent bandhead spin of 7−,
a feature that may be associated in particular with the h 9
2
, 1/2−[541] proton, as with band
2.
B. Four-quasiparticle Bands
Four rotational bands (numbers 5, 6, 7 and 8) built on 4-quasiparticle intrinsic states
have been observed in 180Re. These bands were also reported in ref. [11], but, with the
exception of band 8, they were not extended to high spin, and there are differences in the
21

bandhead decays. Due also to the reassignments of bands 4 and 11 (discussed above) new
spin, parity and configuration assignments for the 4-quasiparticle bands are proposed in the
present work. The four bands decay mainly via the 13+ isomeric level at 1566 keV, the
bandhead of band 5, into both bands 4 and 11. In optimising the statistical accuracy for
the 13+ bandhead lifetime, double energy gates were set (see Figure 8) on γ-ray transitions
below the 13+ bandhead and above the 16+, 1876 keV bandhead. It was found that, in
addition to the 107±2 ns mean-life for the 13+ bandhead (see next section) it was necessary
to include an additional component with a mean-life of 7±1 ns. However, it was not possible
to determine to which one or more of the three intermediate bandheads (14−, 15− or 16+)
this should be ascribed. Accordingly, we consider that each intermediate bandhead has
τ < 8 ns.
1. Band 5, Kπ=13+, based on the 1566 keV level
Band 5 has an isomeric bandhead with a mean-life of 107±2 ns (see Figure 8). The
isomer was previously identified in both refs. [10, 11], with consistent lifetimes, though the
present measurement has a smaller uncertainty. The multipolarities of some of the isomeric
transitions are listed in Table II. The conversion coefficient of the 678.1 keV transition
is measured to be αK=0.008(1), which establishes its E2 character and leads to the Iπ =
Kπ = 13+ assignment for the isomer. At least four quasiparticles are needed to provide such
a high K value, and the excitation energy of 1566 keV is consistent with the energy required
to break one additional nucleon pair relative to the 2-quasiparticle states. The associated
rotational sequence (band 5) is very weakly populated and is tentatively placed in the level
scheme (Figure 2).
Band 5 is suggested to have the configuration ν7/2−[514],9/2+[624],5/2−[512] ⊗π5/2+[402]. The alignment value (Figure 4) ix = 3.5h at hω ≈ 0.15 MeV, is consistent
with the involvement of a single i 13
2
neutron. This relatively low alignment and non-yrast
location, compared to the higher-K 4-quasiparticle bands, can explain its weak population.
22

2. Band 6, Kπ=14−, based on the 1700 keV level
Band 6 decays by a 134.1 keV transition to the 13+ bandhead, and by an 895.3 keV
transition to the 12− state of band 11. The total conversion coefficient for the 134.1 keV
transition indicates E1 character [11], hence Iπ=14− for the bandhead. The band is assigned
the configuration ν7/2−[514],9/2+[624],7/2+[633] ⊗ π5/2+[402]. The alignment of ix = 5.5h
at hω ≈ 0.15 MeV (Figure 4) is consistent with the involvement of two i 13
2
neutrons.
3. Band 7, Kπ=15−, based on the 1755 keV level
The assignment of Kπ=15− to band 7 is based on the new placement of the 54.8 keV
transition, which was reported in ref. [11] and tentatively identified as coming from an iso-
lated isomeric level, though the lifetime was not measured and the band associated with it
was not seen. It is now established that band 7 is associated with the 54.8 keV transition
(see Figure 9). It was not possible to establish a lifetime associated specifically with the 54.8
keV transition but an upper limit of τ < 8 ns can be set. The isomeric nature previously
attributed to the corresponding level in ref. [11] is understood to be due to a higher-lying
long-lived isomer (see later for more details). From intensity balancing, the 54.8 keV tran-
sition has αTOT=7±2 which strongly suggests M1 (αTOT =5.4) rather than E2 (αTOT=59.4)
or E1 (αTOT=0.38) character, thereby establishing a bandhead spin of 15−.
The proposed configuration is ν7/2−[514],9/2+[624],5/2−[512] ⊗ π9/2−[514]. Another
Kπ=15− state is also possible, from the ν7/2−[514],9/2+[624],7/2+[633] ⊗ π7/2+[404] con-
figuration. In this case the relatively small alignment of ix = 4h at hω ≈ 0.15 MeV favors
the former configuration, involving a single i 13
2
neutron. The relatively low alignment is
consistent also with the weak population of the band. A comparable Kπ=15− band has
also been observed in 178Ta [20] with a similar | gK − gR |= 0.16 ± 0.02 (compared with
0.18 ± 0.09 for 180Re). A different configuration mixing was discussed in that case, though
with the same dominant structure.
It is also notable that band 7 is crossed by band 6, and the unfavored members of band 7
are not identified above the crossing. Further discussion of the crossing is given in Section IV.
This interpretation provides additional evidence in support of the proposed level structure
and the relative spin and parity assignments. Indeed, in our preliminary report [13] bands
23

6 and 7 were swapped (relative to what is now presented) but the identification of the 319
keV γ-ray as an interband transition now removes the ambiguity.
4. Band 8, Kπ=16+, based on the 1876 keV level
Band 8 decays to the 15− bandhead by a 120.5 keV transition with αTOT =0.6±0.3 (see
Table II) which implies an E1 assignment (αTOT=0.24) hence Iπ=16+ for the bandhead
of band 8. A configuration assignment of ν7/2−[514],9/2+[624],7/2+[633] ⊗ π9/2−[514] is
suggested. The presence of two i 13
2
neutrons is consistent with the high initial bandhead
alignment of ix = 5.5h at hω ≈ 0.15 MeV (see Figure 4). The adopted configuration is the
same as for the Kπ=16+ band in 178Ta, which has | gK − gR |= 0.10 ± 0.01 [20], compared
to the 180Re value of 0.16 ± 0.03.
The structure of band 8 is related to that of band 4 with the addition of a neutron
(i 13
2
)2 excitation, where the 9/2+[624] and 7/2+[633] neutrons are coupled to K≈8. This is
the so-called t-band structure, which was first identified in 179W [19], an isotone of 180Re.
While in 179W the 3-quasiparticle t-band crosses its respective 1-quasiparticle g-band, in
180Re the 4-quasiparticle, Kπ=16+ t-band is already energetically favored compared to its
corresponding 2-quasiparticle, Kπ=8+ “g-band”, so that no crossing can take place. In
principle, given sufficient interaction between these two bands, a 164-keV, E2 transition
might be observable from the Kπ=16+ bandhead to the 14+ member of the Kπ=8+ band,
but this has not been identified in the present work. A remarkably similar situation exists
in 178Ta [20], where the corresponding E2 interband transition would have an energy of 190
keV.
The energy differences between the t- and g-bands in the N=105 isotones 178Ta and 180Re,
compared to 179W, can be understood to arise from two factors. First, due to the higher
spins in the odd-odd isotones from the additional quasiparticle, the rotational energies are
greater, favoring the ∆K≈8, t-band excitation. Second, the residual interactions with the
odd proton give additional favoring to the t-band configuration. Hence, it may be concluded,
the g− t bandcrossing observed in 179W is absent in 178Ta and 180Re, because the respective
t-bands are already energetically favored at their bandheads.
24

C. Six-quasiparticle Bands
Two new bands, numbers 9 and 10, are assigned to 180Re. These are associated with a
high-lying isomer for which initial evidence was reported in ref. [11]. A mean-life of 13±1
µs has now been measured, as illustrated in Figure 10. The principal decay path of the
isomer is by a 456.8 keV transition (see Figure 9) to band 8. The isomer decays through two
other routes. One is to a state at 3408.4 keV via an unobserved 62.9 keV transition. (This
transition could not be separated from the intense 61.1 keV Kα1 X-rays of 180Re.) The other
decay route is via a 102.2 keV transition, illustrated in Figure 11, to a state at 3369.1 keV
which decays in turn via an 1164.1 keV transition to the Iπ=17− member of band 11.
1. Band 9, Kπ=21−, based on the 3471 keV level
Band 9 is built on the 13 µs isomeric state and decays to the 20+ state of band 8 via a
456.8 keV transition (see Figure 9) which is found to be of E1 character from its directly
measured conversion coefficient of αK = 0.0084 ± 0.0010. Deduction of this conversion
coefficient was complicated by the fact that 177Ta [28], which was significantly populated,
has a 456.7 keV transition below an isomeric level of comparable mean-life (8.6±0.3 µs) to
that of the 456.8 keV transition in 180Re. However, the K binding energy differences result
in conversion lines which are partially resolved, hence component electron intensities can be
obtained, see Figure 12. The corresponding γ-ray intensities can be determined with the aid
of γ-γ-coincidences. With implied E1 character for the 456.8 keV transition, the bandhead
of band 9 is assigned Iπ=Kπ=21−.
Multi-quasiparticle calculations (see Section IV) indicate that there are two competing
configurations, with the required spin and parity, which could be assigned to the 21− state
at 3471 keV:
ν 9/2+[624] ⊗ π 5/2+[402], 9/2−[514], 7/2+[404], 1/2−[541], 11/2−[505]; and
ν 7/2−[514], 9/2+[624], 5/2−[512] ⊗ π 5/2+[402], 9/2−[514], 7/2+[404].
The second of these involves only one aligning quasiparticle and is favored by the relatively
low alignment of the band, ix = 5h at hω ≈ 0.15 MeV, as seen in Figure 4. The weak
population of the band is also consistent with its low alignment.
25

2. Band 10, Kπ=(22+), based on the 3895 keV level
Band 10 feeds into the 13±1 µs isomer via a 424.0 keV transition (see Figure 13). In
the absence of a significant lifetime, the 424 keV transition is tentatively assigned dipole
character, and the bandhead of band 10 is assigned I=(22). Consequently, there is a crossing
between bands 9 and 10 at I=25, with close-lying states of equal spin. The lack of interband
transitions or significantly perturbed energy levels suggests that the two bands have opposite
parities, hence band 10 is tentatively assigned positive parity.
Multi-quasiparticle calculations predict a low-lying 22+ state with the configuration
ν7/2−[514],7/2+[633],9/2+[624] ⊗ π5/2+[402],9/2−[514],7/2+[404]. The involvement of two
i 13
2
neutrons gives extra alignment compared to band 9 and is consistent with the observed
value of ix = 6h at hω ≈ 0.15 MeV (see Figure 4). This leads to the crossing with band 9,
despite band 10 being unfavored at its bandhead, and it furthermore explains the relatively
strong population of band 10. Indeed, band 10 extends to the highest spin, I=(29), identified
in 180Re.
A similar band has been found in 178Ta [20] with the same configuration assignment. As
with the other corresponding bands in these two isotones, the alignment in the 180Re band is
about 2 h higher than in the 178Ta band. However, the g-factors seem to differ significantly.
The 178Ta band has | gK − gR |= 0.25 ± 0.04, compared to 0.12 ± 0.06 for the 180Re band.
The latter value has a large percentage uncertainty arising from the band’s weak population,
and improved accuracy would clearly be needed for a more discriminating comparison.
D. Other States
The ability to measure γ-γ coincidences in between beam pulses gives great sensitivity
to transitions that follow isomeric decays. Combined with the high spin, I=21, of the 6-
quasiparticle isomer in 180Re, the method enables several non-yrast high-spin states to be
identified, as illustrated Figure 2. In the absence of rotational bands associated with these
states, the possible configuration assignments cannot be reliably determined.
The 62.9 keV transition from the 21− bandhead (band 9) and the 84.5 keV transition from
the 15− bandhead (band 7) are not themselves observed, but their existence is required by the
γ-ray coincidence relationships. The spins and parities of the various states are determined
26
through their connections to the bands already discussed, by intensity flow considerations
with corresponding conversion-coefficient constraints, and by directly measured conversion
coefficients.
IV. DISCUSSION
The level scheme for 180Re is discussed in a selective way in the following sections. After
an analysis of the low-spin bandcrossing, bandhead excitation energies are compared with
multi-quasiparticle calculations, and finally the hindrances of the K-forbidden decays are
examined.
A. Bandcrossings
It has been established that there are several γ-ray transitions between bands 2 and 3,
indicating an interaction between the two bands. Figure 14 depicts the crossing in a plot of
excitation energy versus spin, including also the other 2-quasiparticle bands. The interaction
matrix element, V, is evaluated with the usual two-band-mixing approach (see, for example,
ref. [21]) making use of the in-band/out-of-band B(E2) ratios. The intrinsic (unperturbed)
transition matrix elements are taken from the rotational model. The interaction has been
calculated for two cases, see Table IV, first with equal K for both bands, and second with
different K values. It is clear that the different-K assumption gives better consistency for
the calculated interaction strengths, with an average value of V=7.3±0.4 keV. This is in
accord with the assigned K values discussed earlier. Figure 15 illustrates the level energy
differences ∆E(I→I−1)/2I versus spin, showing both the perturbed (experimental) values
and the unperturbed values (with the interaction removed). This representation is sensitive,
in the form of odd-even staggering, to interactions between bands. It is seen that a constant
interaction matrix element of V=7.3 keV produces smooth curves for the unperturbed bands
in the I=11 crossing region. This analysis thus provides a good description of the crossing
between bands 2 and 3, including the interband transition strengths, and gives support to
the validity of the relative spin and parity assignments.
There is another bandcrossing. Band 6 crosses band 7, but the continuation of band 7
is not observed. Mixing is indicated by the presence of the 319.2 keV transition from the
27

TABLE IV: Mixing matrix elements between bands 2 and 3 in 180Re.
Iπi Eγ (keV) Iγ V (keV) a) V (keV) b)
13+ 416.4 54(11) − c) − c)
435.6 102(23)
13+ 508.3 8(2) 7.23(5) 7.71(5)
489.2 55(10)
12+ 410.6 45(20) 6.59(12) 7.34(12)
382.4 174(36)
11+ 383.7 86(15) 9.08(14) 6.91(14)
333.3 65(15)
11+ 352.5 11(3) 4.90(12) 7.59(12)
403.4 38(7)
a) Calculated with equal K for both bands.
b) Calculated with K=7 for band 3 and K=4 for band 2.
c) No solution found.
Iπ=19− member of band 6 to the Iπ=18− member of band 7 (see Figure 2). Figure 16 shows
the energy-versus-spin diagram for the 4- and 6-quasiparticle bands in 180Re, including bands
6 and 7, for which the approach to bandcrossing is evident. However, the weak population
of bands 6 and 7, and the non-observation of the unfavored states above the crossing, make
the mixing strength difficult to quantify.
B. Nilsson-plus-BCS calculations
The proposed quasiparticle configurations for the bands in 180Re have been calculated
using two separate methods. The first method, discussed in this section, is that of K. Jain
et al. [32], based on the Nilsson model and BCS pairing with blocking by quasiparticle
excitations. A full set of near-yrast multi-quasiparticle states was calculated. In this process,
empirical single-particle energies were used for states close to the Fermi surface, estimated
from 1-quasiparticle energies, where available, in neighboring odd-mass nuclei (179Re, 181Re
28

for protons, and 179W, 181Os for neutrons [33]). In order to produce the correct average
particle number the Fermi level was recalculated for each configuration. The monopole
pairing force was Gν = 21.5A
= 0.119 MeV for neutrons and Gπ = 22.5A
= 0.125 MeV for
protons, and the deformation parameters were ǫ2 = 0.232 and ǫ4 = 0.047 [31]. The proton
and neutron levels were treated separately to create their multi-quasiparticle states, and
then the two were combined. Residual interactions were also taken into account, using the
empirical 2-quasiparticle Gallagher-Moszkowski splittings [27, 34] according to the method
of K. Jain et al. [32]. The resultant multi-quasiparticle energies can then be compared with
the experimental values.
Generally good agreement is found between theoretical and experimental 2-, 4- and 6-
quasiparticle energies as seen in Table V (compare the columns “Calc.III” and “Expt.”)
with the notable exception of the Kπ=21− state. The energy calculated for this level (resid-
ual interactions included) is higher than the experimental energy by 378 keV. (In the case
of 178Ta, the corresponding calculated energy, with Lipkin-Nogami pairing, was in good
agreement [20].) The reason for the discrepancy in 180Re may be partly due to the simple
BCS treatment of pairing, and partly due to the fixed-deformation constraint in the calcu-
lations. There is a significant discrepancy (>200 keV) also for the 2-quasiparticle Kπ=5−
bandhead. Both of these cases are predicted (see next section) to have large quadrupole
deformations. The Kπ=5− configuration could be a special case due to large Coriolis mixing
and the proximity of the favored Kπ=4− coupling (see also Section III). The configurations
are summarised in Table III.
A graphical comparison between calculated and experimental energies is given in Figure
17, including additional low-lying multi-quasiparticle states. The following observations can
be made:
(i) Calculated Kπ = 13− and 12− states have reasonable correspondence with the experi-
mental states at 1670 and 1403 keV, respectively (see Figure 2). These both have the config-
uration ν7/2−[514],9/2+[624],1/2−[521] ⊗π9/2−[514], with maximal K=13 in one case, and
K=12 from the opposed orientation of the 1/2−[521] neutron in the other.
(ii) Additional calculated states with Kπ = 14+ and 15− are illustrated, with no correspond-
ing experimental states. These predictions appear to be reasonable, in that their higher
excitation energies are consistent with their non-observation experimentally.
(iii) A Kπ = 19− state is calculated at 2704 keV, with the configuration
29

ν7/2−[514],9/2+[624],7/2+[633] ⊗π9/2−[514],5/2+[402],1/2−[541]. This might possibly cor-
respond to the higher-energy experimental level at 3369 keV (see also next section).
C. Potential Energy Surface Calculations
Potential-energy-surface (PES) calculations using the configuration-constrained method
of Xu et al. [35] have been used as a second approach for understanding the multi-
quasiparticle states. In this approach, the Woods-Saxon potential (with no adjustment
of single-particle energies) and Lipkin-Nogami pairing were used. For each quasiparticle
configuration, the occupied orbitals were fixed and the quadrupole and hexadecapole defor-
mations, β2, γ and β4, were varied in order to minimise the excitation energy. (Note that
ǫ2 ≈ 0.94β2.) The neutron and proton monopole pairing strengths were determined by the
average gap method [36] with a 10% enhancement [35]. Due to the additional complexity
of this method, only selected 180Re multi-quasiparticle states were calculated, with results
given in Tables III and V. The calculated excitation energies agree satisfactorily with the
experimental results, and are broadly consistent with the Nilsson-plus-BCS calculations.
The variable-shape PES method gives substantially better agreement for the experimental
Kπ = 5− and 21− energies, with large calculated β2 values. Furthermore, the Kπ = 19−
state that has a low energy of 2704 keV from the Nilsson-plus-BCS calculations (discussed
above) has also been calculated with the PES method. It is predicted to lie at 3340 keV,
which is close in energy to the observed (19−) level at 3369 keV.
Overall, the combination of a more realistic potential, a better treatment of pairing, and
variable shape, combine to make the PES calculations more reliable than the Nilsson-plus-
BCS calculations.
D. K-Forbidden Transitions
The projection, K, of the total angular momentum on the symmetry axis is approximately
a good quantum number for deformed axially symmetric nuclei. This defines the K-selection
rule for electromagnetic transitions, ∆K ≤ l, for multipolarity l. In practice, transitions
which violate this selection rule are hindered rather than forbidden, due to K-mixing mecha-
nisms. A measure of the inhibition can be expressed by the hindrance factor, FW = τγ/τW ,
30

TABLE V: Properties of 180Re bandheads (see also Table III).
Band Kπ Deformations a) Energy (keV)
β2 β4 |γ◦| Calc.I a) Calc.II b) Calc.III c) Expt.d)
1 5− 0.246 −0.031 0.0 270 468 503 178
2 4+ 0.215 −0.030 0.0 60 253 178 0
3 7+ 0.224 −0.044 0.2 60 214 111 71
4 8+ 0.240 −0.034 0.6 80 167 217 205
11 9− 0.224 −0.033 0.2 190 382 311 284
5 13+ 0.242 −0.040 0.2 1560 1697 1558 1566
6 14− 0.229 −0.043 0.0 1600 1661 1567 1700
7 15− 0.239 −0.030 0.2 1670 1864 1722 1755
8 16+ 0.224 −0.033 0.3 1710 1829 1751 1876
9 21− 0.247 −0.025 0.1 3350 4187 3849 3471
10 22+ 0.267 −0.027 0.2 3740 4152 3890 3895
a) PES calculations using the method of Xu et al. [35].
b) Fixed-shape calculations (β2 ≈ 0.25) using the method of K. Jain et al. [32] without residual
interactions.
c) Fixed-shape calculations including residual interactions [34].
d) Experimental energies are given relative to the bandhead of band 2 (Kπ = 4+).
which is the ratio of the partial γ-ray mean-life to the Weisskopf single-particle estimate [37].
The hindrance per degree of K forbiddenness, also call the reduced hindrance, is fν = F1/νW ,
where ν = ∆K − l is the degree of forbiddenness. In refs [37, 38] it was found that fν≈100
for a range of ν and l, so that for each additional unit of ∆K, transitions are hindered by an
additional factor of about 100. This situation is well illustrated [39] by the decay of high-K
isomers in 178Hf, which is arguably located at the center of the K-isomer region [2]. However,
many transitions have also been found in the same region with fν<<100, see for example
refs [19, 40–45], giving valuable information about the way that K mixing takes place. Since
180Re is on the high-Z side of this K-isomer region, the reduced hindrance values may shed
further light on the K-mixing mechanisms.
One transition of particular note with regard to K-forbidden transitions is the 1164 keV,
31

(19−) to 17− transition from the 3369 keV level. Although of low intensity it is well estab-
lished, as demonstrated in Figure 11. Considering, tentatively, the (19−) level as an intrinsic
state with Kπ=19−, the 1164 keV transition would have E2 character and change the K value
by 10 units, i.e. it would be highly K forbidden, with ν=8, bypassing the intermediate-K
structures. Due to the low population intensity and the feeding through the 13 µs isomer,
the lifetime of the 3369 keV level has a relatively poor constraint of τ<100 ns, obtained
from the observed coincidence between the 1164 keV transition and the 102 keV feeding
transition. Nevertheless, this limit indicates a significantly small reduced hindrance value,
fν<4.4. Such a low value may be related to the location of the (19−) level relatively far
from the yrast line, which is broadly consistent with the systematic behavior discussed by
Walker et al. [2, 46].
More definite information can be obtained for K-forbidden transitions with known (par-
tial) half-lives. Table VI lists the transitions in 180Re from the 4- and 6-quasiparticle isomers
with Kπ=13+ and 21−, respectively. Note that for E1 transitions two values are given, the
second with τW multiplied by 104 before recalculating fν , to account for the generally strong
E1 hindrance compared with other multipolarities [47, 48]. The final reduced-hindrance val-
ues vary between 17 and 66.
The E2 reduced-hindrance value for the 678 keV transition from the Kπ=13+ isomer,
fν = 17, may now be compared with systematic behavior in the A≈180 region. In previous
work, K-forbidden E2 and E3 reduced hindrances from 4- and 5-quasiparticle isomers have
been compared, through their inverse correlation with excitation energy relative to a rigid
rotor, indicating a level-density dependence in the degree of K mixing [2, 46, 49]. The data
are shown in Figure 18, with the odd-odd nuclides [20, 50–52] specifically indicated. It has
been suggested [53] that the large reduced hindrance for 178Ta may be related to neutron-
proton configuration mixing. In any case, the 180Re value is in relatively good agreement
with the trend of the other data. This supports the proposition that level density plays a
critical role in K mixing, though the sizeable scatter of the data also indicates the importance
of other degrees of freedom [2].
In Figure 19, the yrast line is compared with the excitation energies of intrinsic states.
Following from the above discussion, states which lie well above the yrast line are expected
to have more K admixtures than the near-yrast states, and hence lower fν values. In 180Re,
both the Kπ = 13+ and 21− isomers are not too far from yrast and the fν values are
32

TABLE VI: K-forbidden transitions in 180Re.
Kπi τ Eγ l Iγ αTOT B(σl) ν fν
(keV) a) (e2fm2l for El) b)
(µ2◦fm2l−2 for Ml)
21− 13(1) µs 62.9 E1 53(18)c) 0.260 3.6(15) ×10−8
102.2 E2 21(10) 3.84 4.2(25) ×10−3
456.8 E1 118(10) 0.009 2.1(6) ×10−10 4 315(19) 31.5(19)
13+ 107(2) ns 141.4 M1 38(10) 2.01 2.0(6) ×10−5 4 20.5(14)
163.1 E1 60(8) 0.109 1.15(17) ×10−6
262.4 E1 38(7) 0.033 1.7(4) ×10−8 3 490(40) 22.7(15)
416.6 M1 198(15) 0.103 2.1(2) ×10−6 4 30.5(8)
523.5 E1 60(9) 0.007 3.5(6) ×10−9 3 840(50) 38.9(22)
678.1 E2 169(23) 0.011 1.3(2) ×10−2 3 16.8(9)
761.0 E1 38(5) 0.003 7.1(11) ×10−10 3 1420(70) 66(4)
aFrom Table I.bIncluding an additional factor of 104 in hindrance before the evaluation of fν
cFrom 285.7 keV transition intensity.
substantial.
It is notable that 180Re is the only odd-odd rhenium isotope known to display K isomerism
for a 6-quasiparticle state. Neighboring 179Re has recently been found to contain a 7-
quasiparticle isomer [4]. While this also decays by transitions with substantial fν values,
uncertainty in the isomer spin assignment makes the interpretation ambiguous in that case.
V. SUMMARY
In the present work, eleven rotational bands in 180Re have been observed and characterised
by γ-ray and electron spectroscopy. The bands have been extended to higher spin compared
to previous studies. Amongst the 2-quasiparticle bands, new connecting transitions have
enabled significant improvements to be made in the organisation of the level scheme, leading
to revised spin and parity assignments, and hence to a revised interpretation. This builds
33

on the theoretical analysis of the 2-quasiparticle bands by Jain et al. [12].
The present work provides a new and detailed bandcrossing analysis of 2-quasiparticle
bands 2 and 3. The properties of a 4-quasiparticle t-band are compared with related struc-
tures in the N=105 isotones. Two bands are identified above a 6-quasiparticle, τ=13 µs iso-
mer. Configuration assignments are given for all the bands, supported by multi-quasiparticle
calculations, alignments and g-factors.
The 4- and 6-quasiparticle isomers in 180Re are found to decay by K-forbidden transitions.
The substantial reduced-hindrance values, 17≤fν≤66, are most likely related to the near-
yrast location of the isomers.
Acknowledgements: The ANU technical staff are thanked for their excellent support.
This work has been performed under an ANU−EPSRC agreement. JNO and AE were
funded by EPSRC project studentships.
[1] M.J.A. de Voigt, J. Dudek, and Z. Szymanski, Rev. Mod. Phys. 55, 949 (1983).
[2] P.M. Walker, and G.D. Dracoulis, Hyperfine Interact. 135, 83 (2001).
[3] R.G. Helmer, and C.W. Reich, Nucl. Phys. A211, 1 (1973).
[4] C. Thwaites, C. Wheldon, A.M. Bruce, P.M. Walker, G.D. Dracoulis, A.P. Byrne, T. Kibedi,
F.G. Kondev, C.J. Pearson and C.S. Purry, Phys. Rev. C66, 054309 (2002).
[5] C.J. Pearson, P.M. Walker, C.S. Purry, G.D. Dracoulis, S. Bayer, A.P. Byrne, T. Kibedi, and
F.G. Kondev, Nucl. Phys. A674, 301 (2000).
[6] K.J. Hofstetter, and P.J. Daly, Phys. Rev. 152, 1050 (1966); ibid 159, 1000 (1967).
[7] P.F.A. Goudsmit, J. Konijn, and F.W.N. de Boer, Nucl. Phys. A104, 497 (1967).
[8] B. Harmatz, and T. H. Handley, Nucl. Phys. A121, 481 (1968).
[9] J. Konijn, P.F.A. Goudsmit, F.W.N. De Boer, and B.J. Meijer, Nucl. Phys. A114, 602 (1968).
[10] A. J. Kreiner, J. Davidson, D. Abriola, C. Pomer, and P. Thieberger, Phys. Rev. C37, 1338
(1988).
[11] Ts. Venkova, R. M. Lieder, T. Morek, W. Gast, G. Hebbinghaus, A. Kramer-Flecken,
J. Schaffler-Krah and W. Urban, Nucl. Phys. A514, 87 (1990).
[12] A.K. Jain, P.C. Sood, and R.K Sheline, Pramana J. Phys. 43, 339 (1994).
[13] H.M. El-Masri, P.M. Walker, Z. Podolyak, M. Caamano, G.D. Dracoulis, A.P. Byrne,
34

T. Kibedi, A.M. Baxter, J. Hazel, A.M. Bruce, J.N. Orce, A. Emmanoulidis, D.M. Cullen,
and C. Wheldon, Acta Phys. Pol. B34, 2301 (2003).
[14] F. Puhlhofer, Nucl. Phys. A280, 267 (1977).
[15] G.D. Dracoulis and A.P. Byrne, ANU-P/1052 (1995), unpublished.
[16] T. Kibedi, G.D. Dracoulis, and A.P. Byrne, Nuc. Instr. and Meth. A294, 523 (1990).
[17] A. Karamer-Flecken, T. Morek, R.M. Lieder, W. Gast, G Hebbinghaus, H.M. Jager, and
W.Urban, Nuc. Instr. and Meth. A275, 333 (1989).
[18] F. Rosel, H.M. Fries, K.Alder, and H.C. Pauli, At. Nucl. Data Table 21, 291 (1978).
[19] P.M. Walker, G.D. Dracoulis, A.P. Byrne, B. Fabricius, T. Kibedi, A.E. Stuchbery, and N.
Rowley, Nucl. Phys. A568, 397 (1994).
[20] F.G. Kondev, G.D. Dracoulis, A.P. Byrne and T. Kibedi, Nucl. Phys. A632, 473 (1998).
[21] C.S. Purry, P.M. Walker, G.D. Dracoulis, T. Kibedi, F.G. Kondev, S. Bayer, A.M. Bruce,
A.P. Byrne, W. Gelletly, P.H. Regan, C. Thwaites, O. Burglin, and N. Rowley, Nucl. Phys.
A632, 229 (1998); C.S. Purry, PhD thesis, University of Surrey, (1997).
[22] R.A. Bark, G.B. Hagemann, B.Herskind, H.J. Jensen, W. Korten, J. Wrzesinski, H. Carlsson,
M.Bergstrom, A. Brockstedt, A. Nordlund, H. Ryde, P.Bosetti, S. Leoni, F. Ingebretsen,
P.O. Tjom, Nucl. Phys. A591, 265 (1995).
[23] T. Lindbland, H. Ryde, and P.Kleiheinz, Nucl. Phys. A201, 369 (1973).
[24] A. Neskakasi, R.M. Reider, M. Muller-Veggian, H. Beuscher, W.F. Davidson, and C. Mayer-
Boriche, Nucl. Phys. A261, 189 (1976).
[25] Ts. Venkova, T. Morek, R.M. Leider, W. Gast, G. Hebbinghaus, A. Krammer-Flecken,
J. Schaffler-Krah, W. Urban, G. Sletten, and K.H. Maier, Z. Phys. A334, 385 (1989).
[26] Ts. Venkova et al., Eur. Phys. J. A20, 375 (2004).
[27] C.J.Gallagher, and S.A.Moskowski, Phys. Rev. 111, 1282 (1958).
[28] M. Dasgupta, G.D. Dracoulis, P.M. Walker, A.P. Byrne, T. Kibedi, F.G. Kondev, G.J. Lane,
and P.H. Regan, Phys. Rev. C61, 044321 (2000).
[29] P.M. Walker, K.C. Yeung, G.D. Dracoulis, P.H. Regan, G.J. Lane, P.M. Davidson and
A.E. Stuchbery, Phys. Lett. B309, 17 (1993).
[30] P.M. Walker, Proceedings of the Crete Conference on The Future Of Nuclear Spectroscopy,
edited by W. Gelletly, C.A. Kalfas, R. Vlastou, S. Harissopulos and D. Loukas, Institute of
Nuclear Physics (Greece), 134 (1993).
35
[31] R. Bengtsson, S. Frauendorf, and F.R. May, At. Nucl. Data Tables 35, 15 (1986).
[32] K. Jain, O. Burglin, G.D. Dracoulis, B. Fabricius, N. Rowley, and P.M. Walker, Nucl. Phys.
A591, 61 (1995).
[33] R.B. Firestone, and V.S. Shirley (Eds.), Table of Isotopes, 8th edition (Wiley, 1996).
[34] F.G. Kondev, PhD thesis, Australian National University, (1996).
[35] F.R. Xu, P.M. Walker, J.A. Sheikh and R. Wyss, Phys. Lett. B435, 257 (1998).
[36] P. Moller, J.R. Nix, Nucl. Phys. A536, 120 (1992).
[37] K.E.G. Lobner, in The electromagnetic interaction in nuclear spectroscopy, W.D. Hamilton
(Ed.) (North-Holland, Amesterdam, 1975) p. 141.
[38] K.E.G. Lobner, Phys. Lett. B26, 369 (1968).
[39] M.B. Smith, P.M. Walker, G.C. Ball, J.J. Carroll, P.E. Garrett, G. Hackman, R. Propri, F.
Sarazin, and H.C. Scraggs, Phys. Rev. C68, 031302(R) (2003).
[40] P. Chowdhury, B. Fabricius, C. Christensen, F.Azgui, S.Bjornholm, J. Borggreen, A. Holm,
J.Pedersen, G. Sletten, M.A. Bentley, D. Howe, A.R. Mokhtar, J.D. Morrison, J.F. Sharpey-
Schafer, P.M. Walker, and R.M. Lieder, Nucl. Phys. A485, 136 (1988).
[41] P.M. Walker, G. Sletten, N.L. Gjørup, M.A. Bentley, J. Borggreen, B. Fabricius, A. Holm,
D. Howe, J. Pedersen, J.W. Roberts, and J. F. Sharpey-Schafer, Phys. Rev. Lett. 65, 416
(1990).
[42] N.L. Gjørup, P.M. Walker, G. Sletten, M.A. Bentley, B. Fabricius, and J.F. Sharpey-Schafer,
Nucl. Phys. A582, 369 (1995).
[43] P.M. Walker, G.D. Dracoulis, A.P. Byrne, B. Fabricius, T. Kibedi, and A.E. Stuchbery, Phys.
Rev. Lett. 67, 433 (1991).
[44] B. Crowell, P. Chowdhury, S.J. Freeman, C.J. Lister, M.P. Carpenter, R.G. Henry,
R.V.F. Janssens, T.L. Khoo, T. Lauritsen, Y. Liang, F. Soramel, and I.G. Bearden, Phys.
Rev. Lett. 72, 1164 (1994).
[45] B. Crowell, P. Chowdhury, D.J. Blumenthal, S.J. Freeman, C.J. Lister, M.P. Carpenter,
R.G. Henry, R.V.F. Janssens, T.L. Khoo, T. Lauritsen, Y. Liang, F. Soramel, and I.G. Bear-
den, Phys. Rev. C53, 1173 (1996).
[46] P.M. Walker, D.M. Cullen, C.S. Purry, D.E. Appelbe, A.P. Byrne, G.D. Dracoulis, T. Kibedi,
F.G. Kondev, I.Y. Lee, A.O. Macchiavelli, A.T. Reed, P.H. Regan, and F. Xu, Phys. Lett.
B408, 42 (1997); P.M. Walker, Acta Phys. Polonica B36, 1055 (2005).
36

[47] N.L. Gjørup, M.A. Bently, B. Fabricius, A. Holm, J.F. Sharpey-Schafer, G. Sletten, and
P.M. Walker, Z. Phys. A337, 353 (1994).
[48] T. Venkova, T. Morek, G.V. Marti, H. Schnare, A. Krammer-Flecken, W. Gast, A. Georgiev,
G. Hebbinghaus, R.M. Lieder, G. Sletten, K.M. Spohr, K.H. Maier, and W. Urban, Z. Phys.
A344, 417 (1993).
[49] P.M. Walker, Hyperfine Interact. 143, 143 (2002).
[50] G.D. Dracoulis, S.M. Mullins, A.P. Byrne, F.G. Kondev, T. Kibedi, S. Bayer, G.J. Lane, T.R.
McGoram, and P.M. Davidson, Phys. Rev. C58, 1444 (1998).
[51] F.G. Kondev, M.A. Riley, D.J. Hartley, R.W. Laird, T.B. Brown, M. Lively, K.W. Kemper,
J. Pfohl, S.L. Tabor, and R.K. Sheline, Phys. Rev. C59, R575 (1999).
[52] T.R. McGoram, G.D. Dracoulis, T. Kibedi, A.P. Byrne, R.A. Bark, A.M. Baxter, and S.M.
Mullins, Phys. Rev. C62, 031303(R) (2000).
[53] F.G. Kondev, G.D. Dracoulis, A.P. Byrne, T. Kibedi, S. Bayer, and G.J. Lane, Phys. Rev.
C54, R459 (1996).
37

(8 ) 230.1
(10 ) 523.1
(12 ) 905.5
(14 ) 1379.1
(16 ) 1926.4
(18 ) 2537.0
(20 ) 3202.9
(22 ) 3910.5
(24 ) 4643.2
(7 ) 123.3
(9 ) 362.9
(11 ) 696.2
(13 ) 1131.8
(15 ) 1643.1
(17 ) 2222.5
(19 ) 2860.7
(21 ) 3549.8
(23 ) 4299.9
(25 ) 5102.6
(7 ) 177.8
(9 ) 370.9
(11 ) 672.6
(13 ) 1079.8
(15 ) 1586.3
(17 ) 2186.5
(19 ) 2867.7
(21 ) 3616.1
(23 ) 4412.1
(8 ) 266.3
(10 ) 526.6
(12 ) 902.4
(14 ) 1387.0
(16 ) 1969.2
(18 ) 2633.3
(20 ) 3353.3
(7 ) 70.8(8 ) 163.0
(9 ) 312.5
(10 ) 495.0
(11 ) 715.5
(12 ) 949.1
(13 ) 1204.6
(14 ) 1481.9
(15 ) 1767.8
(16 ) 2075.0
(17 ) 2375.4
(18 ) 2693.3
(5 ) 0.0(6 ) 45.8
293.0
382.4
473.6
547.3
610.6
665.9
707.6
732.7
239.6
333.3
435.6
511.3
579.4
638.2
689.1
750.1
(802.7)
193.1
301.7
407.2
506.5
600.2
681.2
748.4
(796.0)
260.3
375.8
484.6
582.2
664.1
(720.0)
106.3133.2
159.8
173.4
88.5104.1
155.7
145.3
229.9
177.1
307.8
199.8
(382.5)
92.2149.5
182.5
220.5
233.6
255.5
277.3
285.9
307.2
300.3
241.8
331.9
403.4
454.1
489.2
532.7
563.2
593.2
607.6
416.3
410.5
383.7201.2
210.6
252.9
352.6
317.9
618.2
45.877.5
184.3(132.0)(25.0)
508.4
Band 1a
Band 1b
Band 2a
Band 2b
Band 3
K =(5-) K =(4+) K =(7+)9/2[624]x5/2[402]7/2[514]x1/2[541]9/2[624]x1/2[541]
FIG
.1:
Partial
levelsch
eme
(part
1of
2)of
180R
eas
ded
uced
inth
ecu
rrent
work
.
38

(7 ) 70.8(8 ) 163.0
(9 ) 312.5
(10 ) 495.0
(11 ) 715.5
(12 ) 949.1
(13 ) 1204.6
(14 ) 1481.9
(15 ) 1767.8
(16 ) 2075.0
(17 ) 2375.4
8 205.3
9 413.9
10 642.3
11 888.2
12 1149.6
13 1425
14 1712.0
15 2007.8
16 2309.6
17 2616.8
18 2921.9
(19 ) 3234.0
13 1566.3
(14 ) 1846.5
(15 ) 2148.1
(16 ) 2472.6
14 1700.415 1755.2
16 1875.7
17 2139.6
18 2415.5
19 2706.7
20 3014.1
21 3337.9
22 3678.9
23 4036.7
24 4412.5
25 4802.0
21 3471.3
22 3851.3
23 4240.8
24 4637.5
25 5047.9
26 5455.2
(22 ) 3895.3
(23 ) 4269.3
(24 ) 4651.2
(25 ) 5039.9
(26 ) 5435.6
(27 ) 5838.1
(28 ) 6249.6
(29 ) 6673.5
9 284.4
10 418.7
11 595.4
12 805.3
13 1042.7
14 1303.9
15 1587.0
16 1888.1
17 2205.0
18 2532.3
19 2872.1
20 3209.0
21 3550.5
223861.4
23 4204.8
24 4524.4
(12 ) 1403.2
(13 ) 1669.8
18 3051.4
(19 ) 3369.1
(18 )3068.6
(18 ) 3122.4
(20 ) 3408.4
26 5206.2
(25 ) 4887.4
(18 ) 2693.3
15 1929.5
16 2160.9
17 2420.4
18 2710.4
19 3002.5
20 3327.6
21 3668.5
22 4025.1
23 4391.4
16 2045.2
17 2356.2
18 2683.3
92.2149.5
182.5
220.5
233.6
255.5
277.3
285.9
307.2
300.3
241.8
331.9
403.4
454.1
489.2
532.7
563.2
593.2
607.6
208.6
228.4
245.9
261.4
275.2
287.2
295.9
301.8
307.1
305.1
312.1
437.0
474.3
507.4
536.6
562.3
583.0
597.7
609.0
612.2
(617.2)
(280.2)
(301.6)
(324.5)
(581.8)
(626.1)
141.4
416.6
678.1
134.154.8
263.9
275.9
291.1
307.4
323.8
341.0
357.8
375.8
389.5
120.5
539.7
567.0
599.7
631.9
665.5
698.7
731.8
764.2
380.0
389.5
396.6
410.5
407.2
456.8
768.3
786.8
799.2
809.2
374.0
381.9
388.7
395.7
402.5
411.7
423.7
424.0
756.1
771.2
784.2
797.9
813.5
835.6
134.3
176.8
209.9
237.4
261.1
283.2
301.0
316.9
327.3
339.8
336.9
341.5
310.9
343.4
319.6
311.0
386.7
447.3
498.6
544.3
584.2
618.3
644.5
667.1
676.9
679.3
651.6
654.8
663.0
262.4
523.5761.0
984.5807.8
1074.4
163.1
79.1
317.7
1164.1
1175.8
912.21192.9
929.01246.7
982.8
285.7
(62.9)
404.2
794.1(363.0)
(682.6)
317.9
618.2
134.542.4 121.4
895.3
102.2
229.1
231.4
259.5
289.9
460.6
491.7
548.2
292.1
325.1
340.9
356.6
366.3
581.5
616.9
666.0
696.5
724.1
290.0
311.0
327.1
601.0
638.1
(85.4)
319.2
Band 3
Band 4
Band 5
Band 6
Band 7
Band 8
Band 9
Band 10
Band 11
K =9_
K =21_
K =13+ K =14_
K =8+K =(7+)=107(2) ns
K =15_
K =16+
=13(1) sK =(22+)
=109(2) ns
9/2[624]x5/2[402] 7/2[514]x9/2[514] 9/2[624]x9/2[514]
FIG
.2:
Partial
levelsch
eme
(part
2of
2)of
180R
eas
ded
uced
inth
ecu
rrent
work
.
39

180Re
counts
Energy [keV]
electrons (1.2-4.3 Amps)
200 300 400 500 600 7000
500
1000
1500
2000
2500
x2
237238
246
255261/264
276
286
311
329
367
417
457
457474
494
507 550
584
600 678
0
4000
8000
x2
Ta
-raysγ
177
Re181
208/209
218
224
237/238
246
255 261/264
276 28
6292
301307
311
318 329
342
353(?)
367
374
399(?)
406(?)413
417
447453
457(180Re/ )
461 474
494
507 511
550
584
600
608(?)
618 678
736(?)
FIG. 3: Spectra for γ rays (top) and electrons (bottom) from the wide sweep of the magnetic
field. The electron spectrum has been shifted so that the K-shell transitions in rhenium align with
the corresponding γ-ray transitions. Labeled transitions are assigned to 180Re unless indicated
otherwise.
40

0
2
4
6
8
10
12
14
i x (
h)
_
K=5_ (1)K=4+ (2)K=7+ (3)K=8+ (4)K=9_ (11)
0 100 200 300 400 500h
_ ω (keV)
0
2
4
6
8
10
12
14
i x (
h)
_
K=13+ (5)K=14_ (6)K=15_ (7)K=16+ (8)K=21_ (9)K=22+ (10)
FIG. 4: (Color online) Aligned angular momentum as a function of rotational frequency for the
2-quasiparticle bands (top) and 4- and 6-quasiparticle bands (bottom) in 180Re. The band numbers
are given in parentheses. The parameters of the Harris expansion of the reference are ℑ0=24.1
MeV −1h2 and ℑ2=91.1 MeV −3h4.
41

180Recounts
time [ns]
-700 -600 -500 -400 -300 -200 -100 0 100 200010
110
210
{121}start-{210,237,261,283}stop
τ =109(2)
FIG. 5: Summed time-difference spectrum gated across the 284 keV level in 180Re. The mean-life
of the isomer is 109±2 ns.
100 200 300 400 500 600Channels
0
1000
2000
Cou
nts 59
.7 /
61.1
Re
X–r
ays
51.4
/ 52
.4 Y
b X
–ray
s
69.2
Re
X–r
ays
121.
4
134.
1
42.4 45
.8
71.2 88
.8 1
78H
f
213.
3 17
8Hf
149.
5
176.
818
2.5
208.
6 / 2
09.9
79.1
228.
4
245.
923
7.4
220.
5
201.
2
54.8
FIG. 6: Coincidence spectrum gated on the 92 keV transition of band 3 in the HPGe detectors to
display the 46 keV transition in the LEPS detectors.
42

0 50 100 150 200 250 300 350 400 450 500 550 600 650 700γ–Energy [keV]
0
2000
4000
6000C
ount
s
60.6
Re
X–r
ays
52.1
Yb
X–r
ays
69.7
Re
X–r
ays
88.5 10
4.1
145.
3
229.
9
177.
1
307.
8132.
0
375.
8
407.
2
484.
650
6.5
582.
260
0.2
681.
2
124.
2 17
9Re
186.
1 17
9Re
211.
1 17
9Re
238.
8 17
9Re
252.
7 17
9Re
277.
6 17
9Re
324.
1 ?
367.
5 17
9Re
387.
5 17
9Re
397.
7 17
9Re
FIG. 7: In-beam γ-γ coincidence spectrum gated on the 156 keV transition to illustrate transitions
in band 1, and the 132 keV transition.
counts
time [ns]
0 100 200 300 400 500 600010
110
210
{264,276,291}start-{246,261,417}(stop)
=107(2) nsτ
FIG. 8: Summed time-difference spectrum gated across the 1566 keV level in 180Re. The mean-life
of the isomer is 107±2 ns, and a feeding component of 7±1 ns is required for the fit (see text).
43
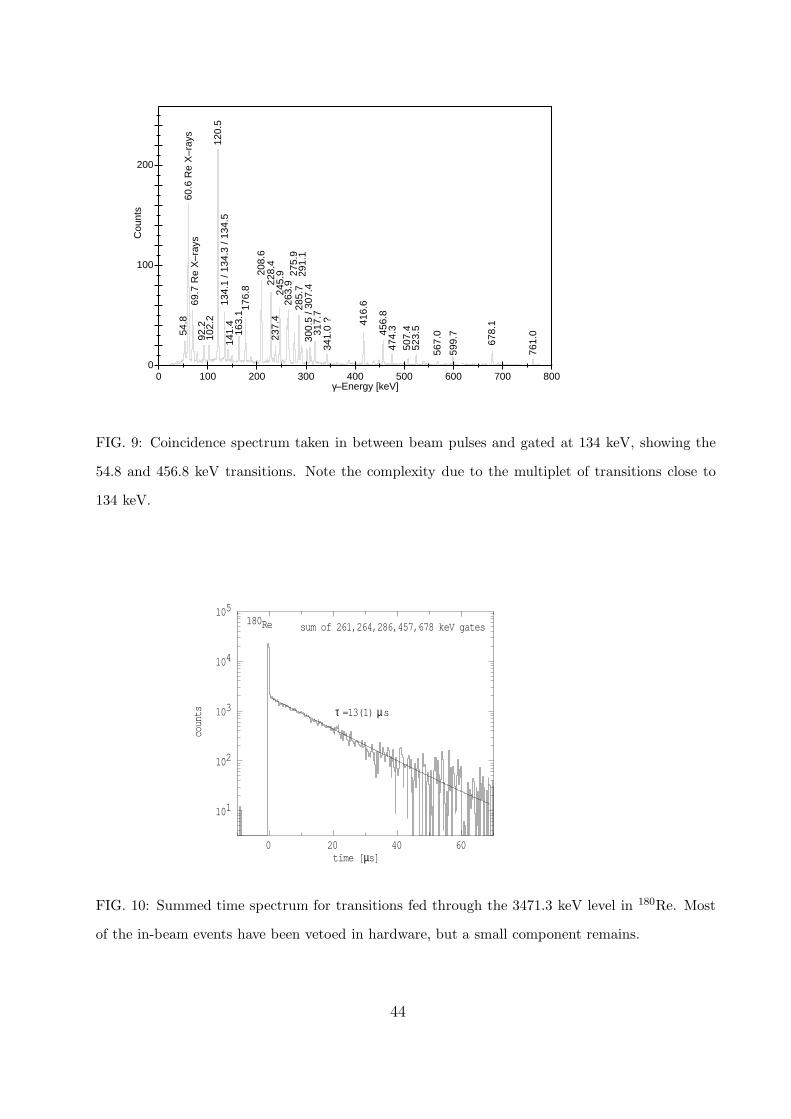
0 100 200 300 400 500 600 700 800γ–Energy [keV]
0
100
200
Cou
nts
60.6
Re
X–r
ays
69.7
Re
X–r
ays
120.
513
4.1
/ 134
.3 /
134.
5
92.2
163.
1 176.
8
208.
622
8.4
245.
926
3.9
275.
929
1.1
300.
5 / 3
07.4
341.
0 ? 41
6.6
456.
847
4.3
567.
0
599.
7
678.
1
761.
0
507.
452
3.5
285.
7
317.
7
141.
4
237.
4
102.
2
54.8
FIG. 9: Coincidence spectrum taken in between beam pulses and gated at 134 keV, showing the
54.8 and 456.8 keV transitions. Note the complexity due to the multiplet of transitions close to
134 keV.
180Re
counts
0 20 40 60
110
210
310
410
510sum of 261,264,286,457,678 keV gates
µ time [ s]
τ µ =13(1) s
FIG. 10: Summed time spectrum for transitions fed through the 3471.3 keV level in 180Re. Most
of the in-beam events have been vetoed in hardware, but a small component remains.
44

0 100 200 300 400 500 600γ–Energy [keV]
0
10
20
30C
ount
s
60.6
Re
X–r
ays
69.7
Re
X–r
ays
102.
212
1.4
134.
3 176.
8 209.
9
237.
426
1.1
283.
2
316.
9
618
.3
FIG. 11: Out-of-beam γ-γ coincidence spectrum gated by the 1164 keV transition.
180Re
counts
Energy [keV]400 500 600
0
200
400
600electrons (1.90-2.77 Amps)
417
457(177Ta)
457
474
507
549(177Ta)
584(181Re)
600
FIG. 12: The electron spectrum for the narrow-sweep magnetic-field measurement showing fits of
the 457 keV line in both 180Re and 177Ta.
45

350 400 450 500 550 600 650 700 750 800 850 900γ–Energy [keV]
0
50
100
150
200
250
300C
ount
s
374
.2 3
81.9
388
.7 3
95.7
402
.5
756
.2
784
.2 7
97.9
813
.5
771
.2
FIG. 13: Coincidence spectrum gated on the 424 keV transition. The labeled peaks are assigned
to band 10, Kπ=(22+).
0.6
0.8
1.0
1.2
1.4
0 200 400 600
E-0
.009
I(I+
1)+
1.5
[MeV
]
I(I+1)
11
4
32 1
FIG. 14: Energy versus spin diagram of the 2-quasiparticle bands in 180Re. An arbitrary rigid-rotor
reference is subtracted from the excitation energies. The following band numbers (and Kπ values)
are included: 1 (5−), 2 (4+), 3 (7+), 4 (8+), and 11 (9−).
46

3
4
5
6
7
8
9
10
11
0 100 200 300 400 500 600 700
(E(I
)-E
(I-1
))/2
I [ke
V]
I(I+1)
K=4
K=7
FIG. 15: A plot of ∆E/2I versus I(I+1) for band 2 (K=4) and band 3 (K=7). The bands cross at
I=11. The perturbed (experimental) trajectories in the crossing region can be smoothed by using
an interaction matrix element of 7.3 keV to estimate the unperturbed trajectories.
0.2
0.4
0.6
0.8
1.0
1.2
1.4
200 400 600 800
E-0
.009
I(I+
1)+
1.5
[MeV
]
I(I+1)
10
98
7
6
5
FIG. 16: Energy vs. spin diagram of the 4-, 6-quasiparticle bands in 180Re. An arbitrary rigid-rotor
reference is subtracted from the excitation energies. The following band numbers (and Kπ values)
are included: 5 (13+), 6 (14−), 7 (15−), 8 (16+), 9 (21−), and 10 (22+).
47

5 10 15 20K
-400
-200
0
200
400
600
800
E -
7K
(K+
1) (
keV
)
FIG. 17: Comparison, as a function of bandhead spin, between calculated and experimental multi-
quasiparticle energies, with a rotor reference subtracted. Open (filled) symbols represent exper-
imental (calculated) states, and circles (squares) represent positive (negative) parity. For each
experimental state, the configuration assignment (see text) corresponds to the lowest calculated
state of the same spin and parity. Some additional calculated sates are shown for comparison.
48
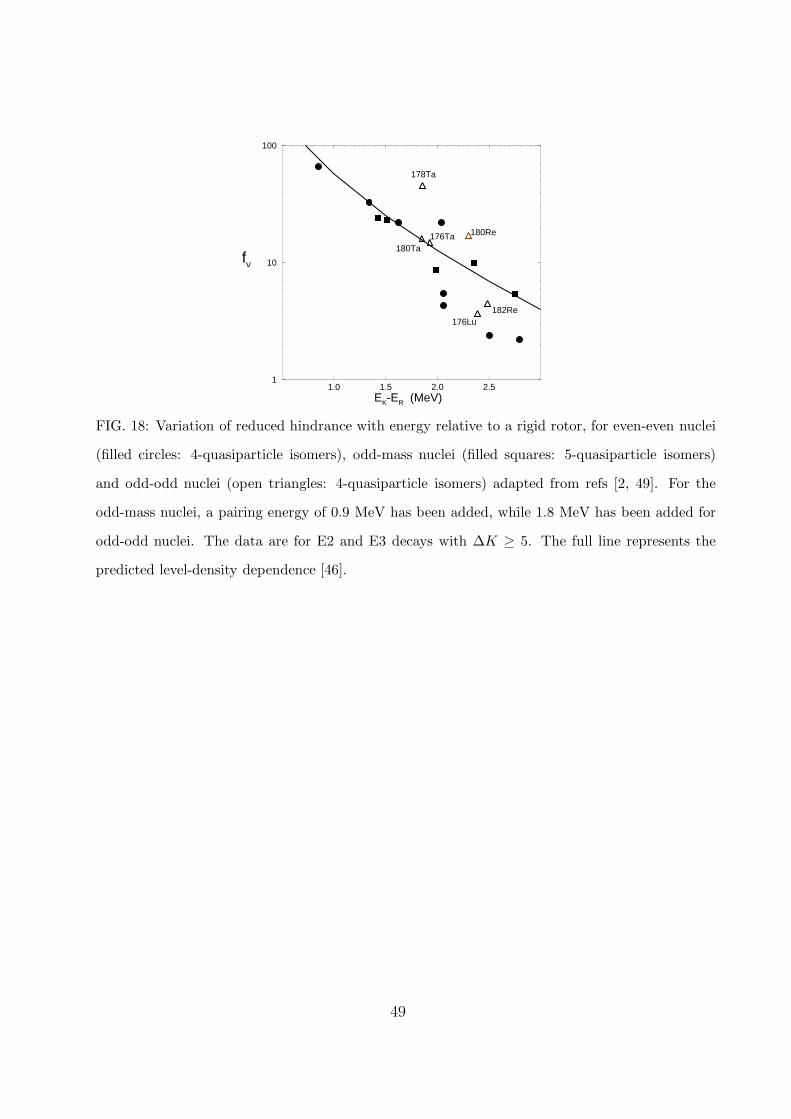
1.0 1.5 2.0 2.5EK-ER (MeV)
1
10
100
fν
178Ta
180Ta176Ta
176Lu182Re
180Re
FIG. 18: Variation of reduced hindrance with energy relative to a rigid rotor, for even-even nuclei
(filled circles: 4-quasiparticle isomers), odd-mass nuclei (filled squares: 5-quasiparticle isomers)
and odd-odd nuclei (open triangles: 4-quasiparticle isomers) adapted from refs [2, 49]. For the
odd-mass nuclei, a pairing energy of 0.9 MeV has been added, while 1.8 MeV has been added for
odd-odd nuclei. The data are for E2 and E3 decays with ∆K ≥ 5. The full line represents the
predicted level-density dependence [46].
49

0 100 200 300 400 500 600 700 800I(I+1)
0
1000
2000
3000
4000
5000
6000
Exc
itatio
n E
nerg
y (k
eV)
21_
13+
FIG. 19: (Color online) Excitation energy plotted against I(I+1) for the yrast line and intrinsic
states in 180Re. Squares denote bandheads. The 4- and 6-quasiparticle isomers are indicated by
their Kπ values.
50