Embed Size (px)
Citation preview
ABSTRACT
Title of Document: FEASIBILITY OF BINDING
ANTIOXIDATIVE FOOD PIGMENTS USING
RIBULOSE-1,5-BISPHOSPHATE
CARBOXYLASE OXYGENASE.
Sarah Michelle Yachetti, Master’s in Science,
2010
Directed By: Y. Martin Lo, Ph.D.
Nutrition and Food Science
Antioxidative food pigments during manufacturing are subjected to harsh conditions
that can attenuate the antioxidant benefits and alter its color significantly. Thus,
stabilization of these pigments is desired to increase the product’s nutritional and
commercial value. Ribulose-1, 5-bisphosphate carboxylase oxygenase (RuBisCO), an
abundant protein with a balanced amino acid profile, may serve as a good binding
agent to increase stability of pigments due to the fact that it is naturally bound to
chlorophyll in plants besides its highly stable structure. This research investigated the
binding capacity of purified RuBisCO to riboflavin, annatto extract, and beta-
carotene. Protein-pigment complexes were promoted with mixing, sonicating, heating
and freeze thawing techniques. Raman spectroscopy, surface plasmon resonance, and
UV-Vis were used to measure binding potential. A method to extract RuBisCO from
tobacco with paramagnetic antibody-coated beads was also investigated. Not only
does this exploratory research provide the baseline understanding of the challenges
and hurdles in forming a protein-pigment complex, but the detection techniques
established could also be of value for developing quantitative measurements of such
complexes. While further research is still needed to elucidate the interaction between
the pigments and RuBisCO, it was confirmed that the binding ability of RuBisCo to
the pigments investigated could be greatly hindered by the structural conformation of
RuBisCo.
FEASIBILITY OF BINDING ANTIOXIDATIVE FOOD PIGMENTS USING
RIBULOSE-1,5-BISPHOSPHATE CARBOXYLASE OXYGENASE
By
Sarah Michelle Yachetti.
Thesis submitted to the Faculty of the Graduate School of the
University of Maryland, College Park, in partial fulfillment
of the requirements for the degree of
Master’s in Science
2010
Advisory Committee:
Dr. Y. Martin Lo, Chair
Dr. Jeffrey DeGrasse
Dr. Stacey DeGrasse
Dr. Mark Kantor
Dr. Betsy Jean Yakes

© Copyright by
Sarah Michelle Yachetti
[2010]
ii
Acknowledgements
I would like to acknowledge the support and guidance of Dr. Y. Martin Lo,
committee chair, without whose support I would never have finished my degree. I
also thank the members of my graduate committee for their guidance and suggestions.
This thesis would not have been possible without the generous use of instruments and
supplies from the Food and Drug Administration (FDA), provided with support and
direction by Stacey Degrasse, Jeffrey Degrasse, and Betsy Jean Yakes. I am in debt
and thankful of the mentorship all three of you have provided to me over the years.
To Stacey I am truly grateful for the dedication to help me become a better scientist. I
am thankful to Betsy for teaching me that there are no problems, but only challenges
to be overcome. And thanks to Jeff for teaching me that something in the lab can
always be done faster, but understanding what is going on behind it is what counts. I
also want to thank John Callahan for his help in securing my ability to complete my
research at the FDA. Thanks to Kevin Reuter for help in processing tobacco samples.
A special thanks to my lab mates who helped keep me sane through all of this.
Finally, I would like to thank family members and friends for encouraging me every
step along the way and making sure that I knew I can accomplish anything I set my
mind to.
iii
Table of Contents
Acknowledgements ....................................................................................................... ii
Table of Contents ......................................................................................................... iii
List of Tables ............................................................................................................... iv
List of Figures ............................................................................................................... v
Chapter 1: Introduction ................................................................................................. 1
Chapter 2: Literature Review ........................................................................................ 4
2.1 Antioxidative Pigments ....................................................................................... 4
2.1.1 Riboflavin .................................................................................................... 7
2.1.2 Annatto Extract .......................................................................................... 10
2.1.3 Beta-Carotene ............................................................................................ 12
2.2 RuBisCO ........................................................................................................... 15
2.2.1 Properties and Interest................................................................................ 15
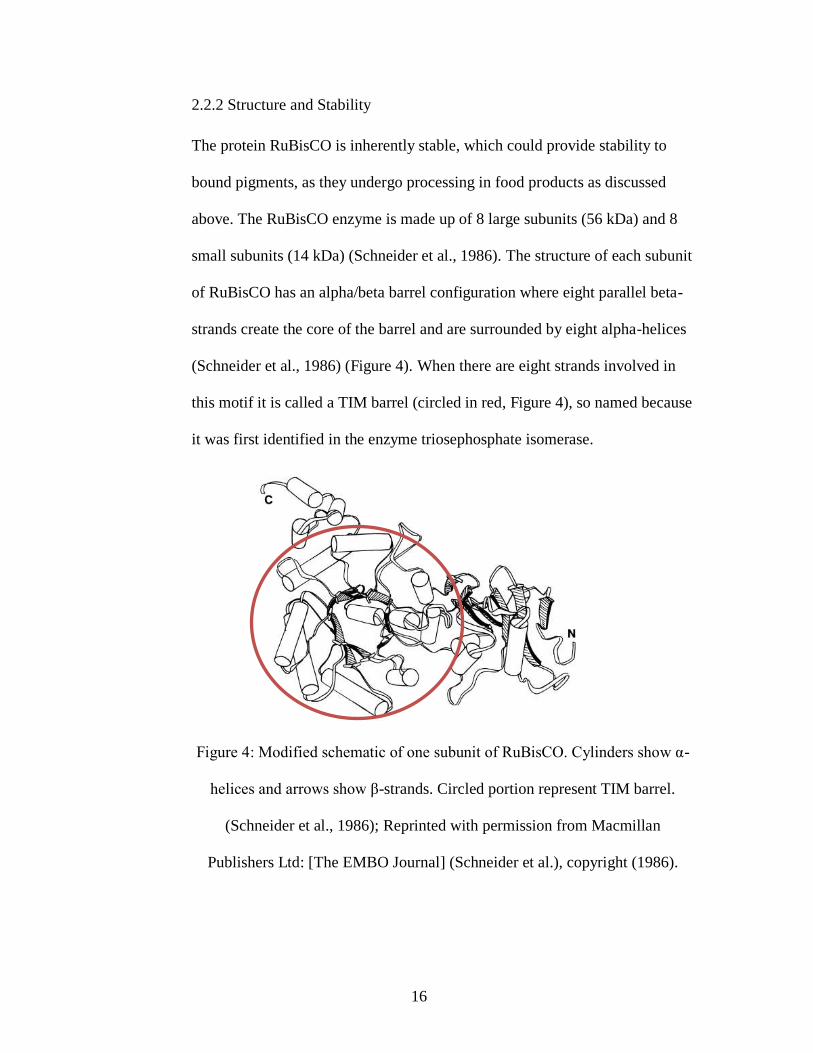
2.2.2 Structure and Stability................................................................................ 16
2.2.3 Extraction and Purification Methods ......................................................... 17
2.3 Tools to Assess Binding.................................................................................... 19
2.3.1 Raman Spectroscopy .................................................................................. 19
2.3.2 Surface Plasmon Resonance ...................................................................... 23
2.3.3 UV-Vis ....................................................................................................... 26
Chapter 3: Objectives .................................................................................................. 30
Chapter 4: Materials and Methods .............................................................................. 31
4.1: Materials .......................................................................................................... 31
4.1.1 Antioxidative Pigments and Standard RuBisCO ....................................... 31
4.1.2: Tools to Assess Binding ........................................................................... 31
4.1.3 Tobacco RuBisCO Extraction.................................................................... 33
4.2 Methods............................................................................................................. 39
4.2.1 Evaluation of Binding ................................................................................ 39
4.2.2 Extraction ................................................................................................... 48
4.2.3 Purification of Protein ................................................................................ 49
Chapter 5: Results and Discussion .............................................................................. 63
5.1 Binding Effectiveness ....................................................................................... 63
5.1.1 Raman Spectroscopy .................................................................................. 63
5.1.2 Surface Plasmon Resonance ...................................................................... 69
5.1.3 UV-Vis ....................................................................................................... 89
5.2 Extraction ........................................................................................................ 111
5.3 Purification ...................................................................................................... 112
5.3.1 Confirmation of Protein using Paramagnetic Antibody Beads ................ 112
5.4 Recommendations to Continue Research ....................................................... 126
5.4.1 Binding Promotion ................................................................................... 126
5.4.2 Completion of Protein Purification .......................................................... 127
Chapter 6: Conclusion............................................................................................... 129
Bibliography ............................................................................................................. 130
iv
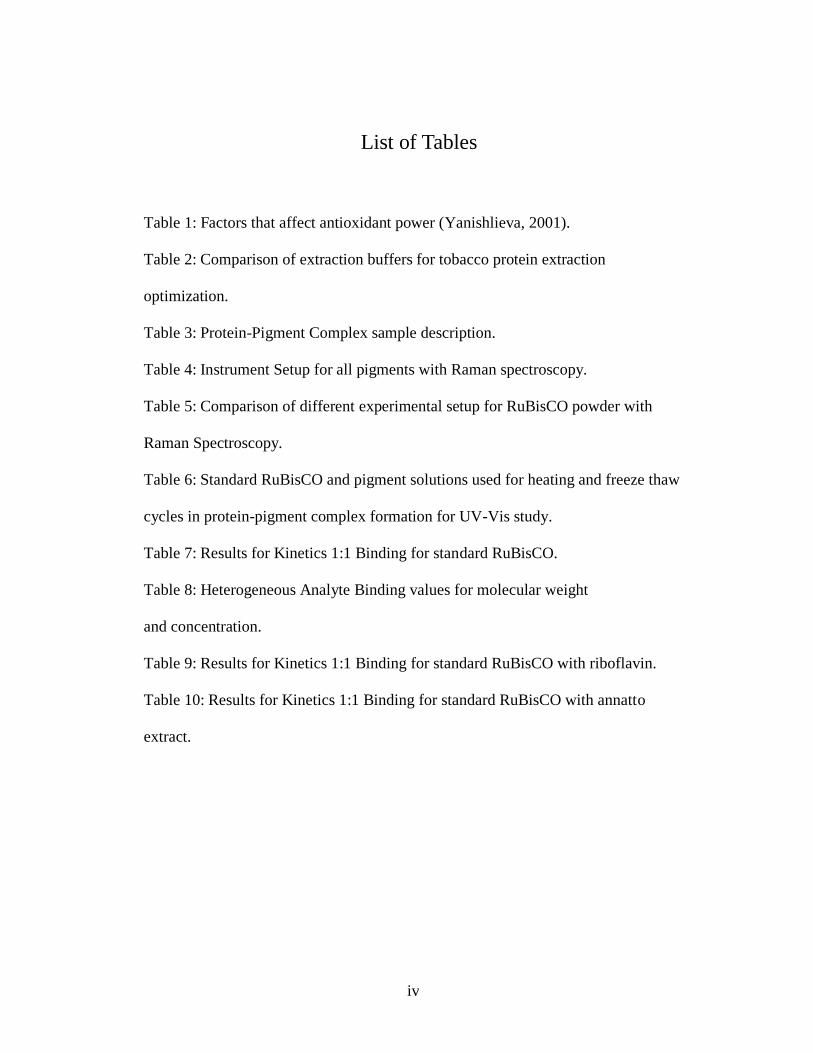
List of Tables
Table 1: Factors that affect antioxidant power (Yanishlieva, 2001).
Table 2: Comparison of extraction buffers for tobacco protein extraction
optimization.
Table 3: Protein-Pigment Complex sample description.
Table 4: Instrument Setup for all pigments with Raman spectroscopy.
Table 5: Comparison of different experimental setup for RuBisCO powder with
Raman Spectroscopy.
Table 6: Standard RuBisCO and pigment solutions used for heating and freeze thaw
cycles in protein-pigment complex formation for UV-Vis study.
Table 7: Results for Kinetics 1:1 Binding for standard RuBisCO.
Table 8: Heterogeneous Analyte Binding values for molecular weight
and concentration.
Table 9: Results for Kinetics 1:1 Binding for standard RuBisCO with riboflavin.
Table 10: Results for Kinetics 1:1 Binding for standard RuBisCO with annatto
extract.
v
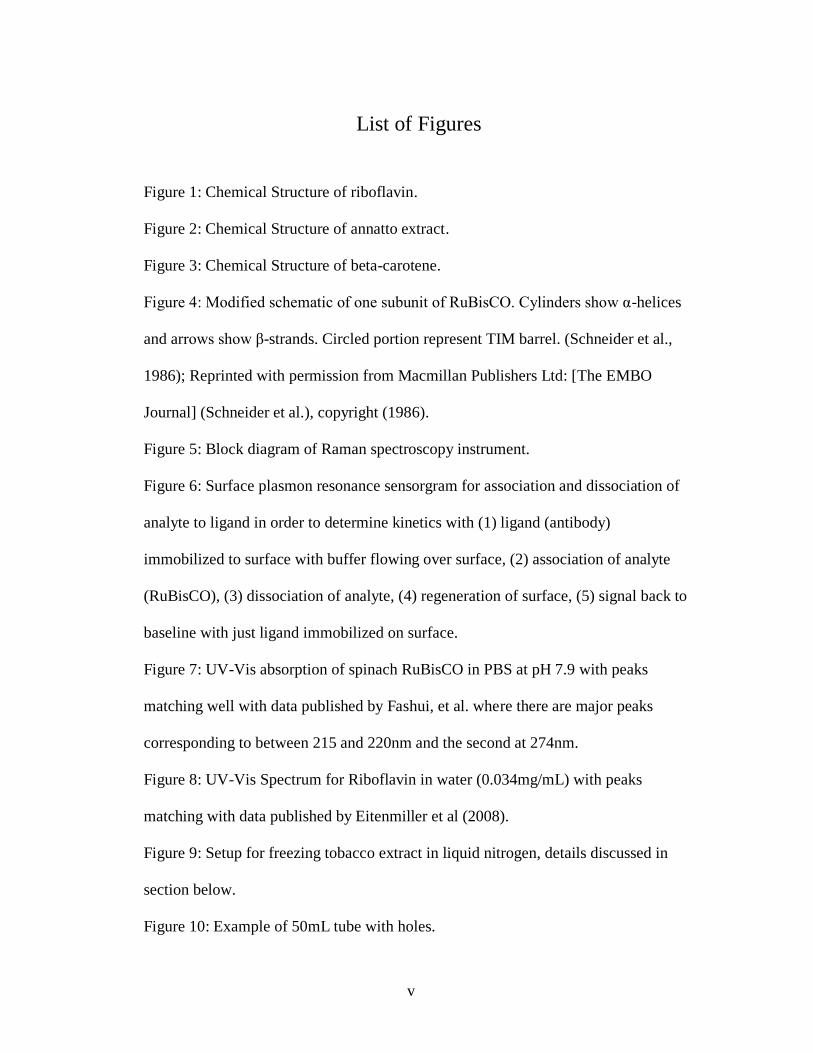
List of Figures
Figure 1: Chemical Structure of riboflavin.
Figure 2: Chemical Structure of annatto extract.
Figure 3: Chemical Structure of beta-carotene.
Figure 4: Modified schematic of one subunit of RuBisCO. Cylinders show α-helices
and arrows show β-strands. Circled portion represent TIM barrel. (Schneider et al.,
1986); Reprinted with permission from Macmillan Publishers Ltd: [The EMBO
Journal] (Schneider et al.), copyright (1986).
Figure 5: Block diagram of Raman spectroscopy instrument.
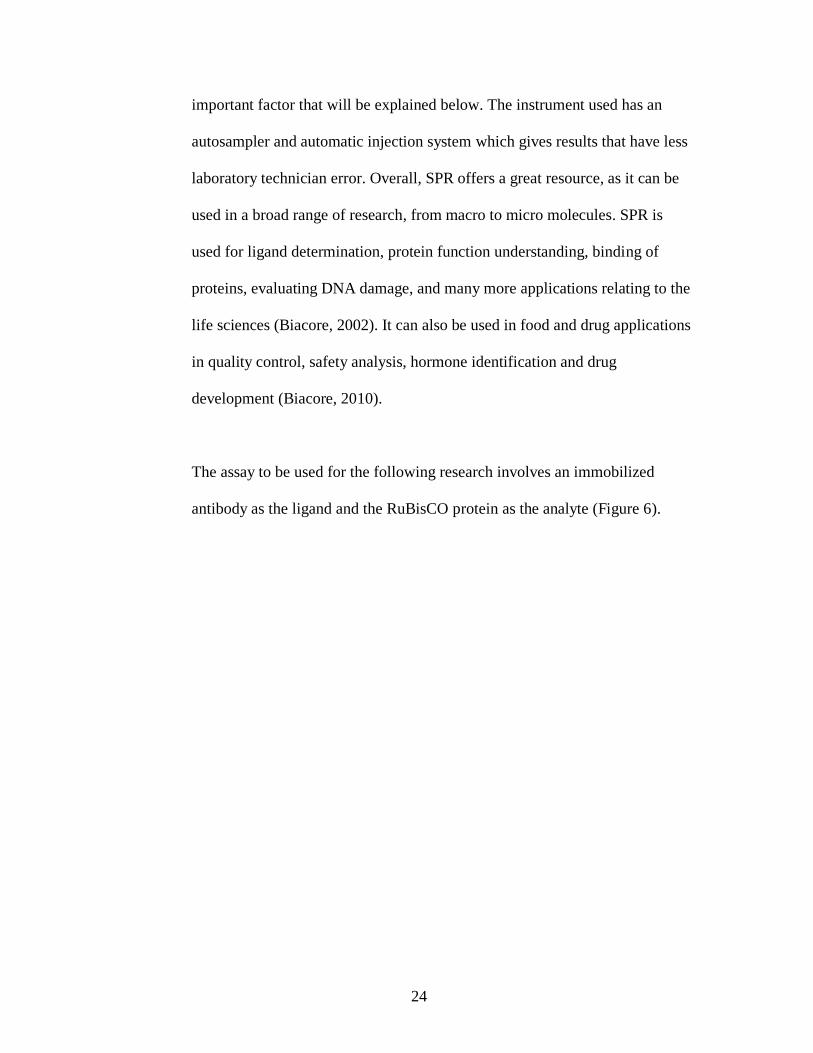
Figure 6: Surface plasmon resonance sensorgram for association and dissociation of
analyte to ligand in order to determine kinetics with (1) ligand (antibody)
immobilized to surface with buffer flowing over surface, (2) association of analyte
(RuBisCO), (3) dissociation of analyte, (4) regeneration of surface, (5) signal back to
baseline with just ligand immobilized on surface.
Figure 7: UV-Vis absorption of spinach RuBisCO in PBS at pH 7.9 with peaks
matching well with data published by Fashui, et al. where there are major peaks
corresponding to between 215 and 220nm and the second at 274nm.
Figure 8: UV-Vis Spectrum for Riboflavin in water (0.034mg/mL) with peaks
matching with data published by Eitenmiller et al (2008).
Figure 9: Setup for freezing tobacco extract in liquid nitrogen, details discussed in
section below.
Figure 10: Example of 50mL tube with holes.

vi
Figure 11: Final Tobacco Extract Pellets to be stored at -80°C.
Figure 12: Setup for grinding of tobacco pellets into fine powder for further use in
extraction.
Figure 13: Example of beads on magnetic rack to aid in washing and removal of
solution.
Figure 14: RuBisCO spectrum with no baseline adjustment and an exposure time of 1
second with 3 total exposures and following experiment setup seen in Table 5, value
A (780nm).
Figure 15: Riboflavin image, Raman microscope (10X, light field).
Figure 16: Beta carotene image, Raman microscope (10X, light field).
Figure 17: Annatto Extract image, Raman microscope (10X, light field).
Figure 18: Standard RuBisCO image, Raman microscope (10X, dark field).
Figure 19: Riboflavin spectrum with baseline adjustment and an exposure time of 5
seconds with 3 total exposures and following experiment setup seen in Table 4
(780nm).
Figure 20: Beta-carotene spectrum with no baseline adjustment and an exposure time
of 0.1 seconds with 3 total exposures and following experiment setup seen in Table 4
(780nm).
Figure 21: Annatto Extract spectrum with baseline adjustment and an exposure time
of 1 second with 3 total exposures and following experiment setup seen in Table 4
(780nm).
Figure 22: General sensorgram information with antibody binding, RuBisCO
injection for association and dissociation measurements, followed by regeneration to
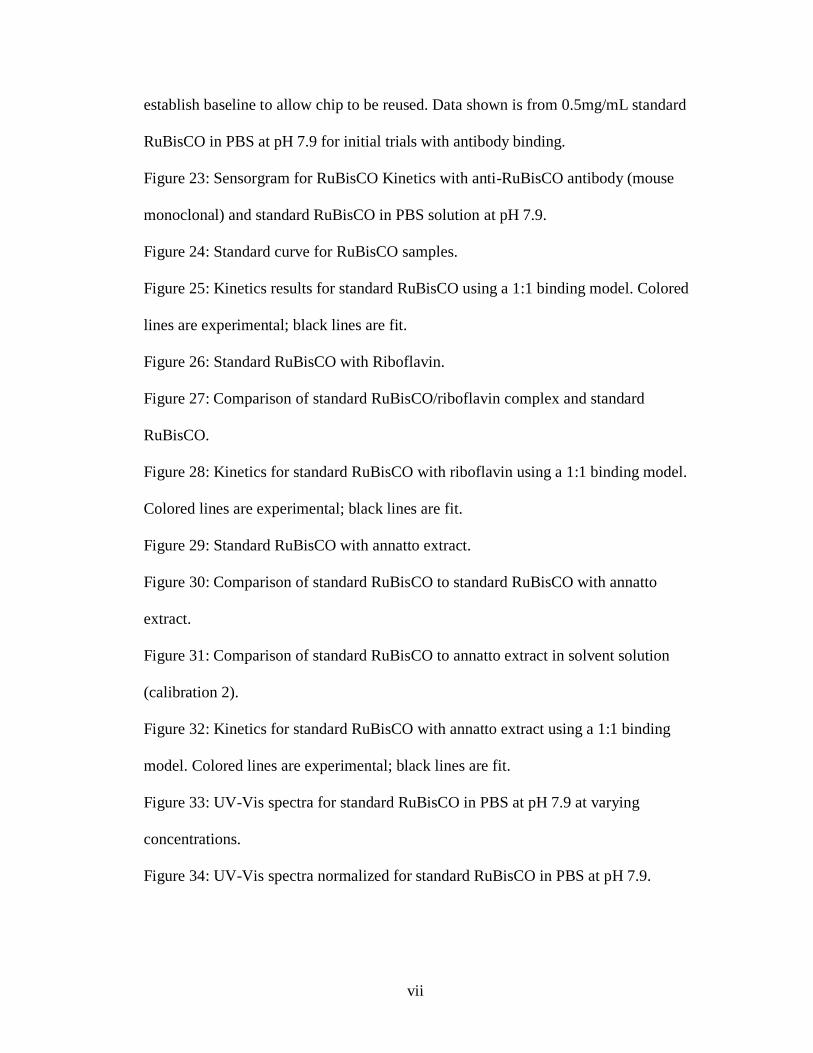
vii
establish baseline to allow chip to be reused. Data shown is from 0.5mg/mL standard
RuBisCO in PBS at pH 7.9 for initial trials with antibody binding.
Figure 23: Sensorgram for RuBisCO Kinetics with anti-RuBisCO antibody (mouse
monoclonal) and standard RuBisCO in PBS solution at pH 7.9.
Figure 24: Standard curve for RuBisCO samples.
Figure 25: Kinetics results for standard RuBisCO using a 1:1 binding model. Colored
lines are experimental; black lines are fit.
Figure 26: Standard RuBisCO with Riboflavin.
Figure 27: Comparison of standard RuBisCO/riboflavin complex and standard
RuBisCO.
Figure 28: Kinetics for standard RuBisCO with riboflavin using a 1:1 binding model.
Colored lines are experimental; black lines are fit.
Figure 29: Standard RuBisCO with annatto extract.
Figure 30: Comparison of standard RuBisCO to standard RuBisCO with annatto
extract.
Figure 31: Comparison of standard RuBisCO to annatto extract in solvent solution
(calibration 2).
Figure 32: Kinetics for standard RuBisCO with annatto extract using a 1:1 binding
model. Colored lines are experimental; black lines are fit.
Figure 33: UV-Vis spectra for standard RuBisCO in PBS at pH 7.9 at varying
concentrations.
Figure 34: UV-Vis spectra normalized for standard RuBisCO in PBS at pH 7.9.

viii
Figure 35: UV-Vis spectra for standard RuBisCO in PBS at pH 7.9 and solvent
solution for riboflavin (water).
Figure 36: UV-Vis spectra comparing standard RuBisCO in PBS at pH 7.9, riboflavin
in solvent solution, standard RuBisCO with riboflavin, and the additive values of
standard RuBisCO in PBS at pH 7.9 and riboflavin in solvent solution.
Figure 37: UV-Vis spectra comparing the normalization of standard RuBisCO with
riboflavin and the additive values of standard RuBisCO in PBS at pH 7.9 with
riboflavin in solvent solution.
Figure 38: UV-Vis spectra for annatto extract in solvent solution.
Figure 39: UV-Vis spectra comparing standard RuBisCO in PBS at pH 7.9, annatto
extract in solvent solution, standard RuBisCO with annatto extract, and the additive
values of standard RuBisCO in PBS at pH 7.9 and annatto extract in solvent solution.
Figure 40: UV-Vis spectra comparing the normalization of standard RuBisCO with
annatto extract and the additive values of standard RuBisCO in PBS at pH 7.9 with
annatto extract in solvent solution.
Figure 41: UV-Vis spectra for beta-carotene in solvent solution.
Figure 42: UV-Vis spectra for standard RuBisCO in PBS at pH 7.9 with and without
sonication.
Figure 43: UV-Vis spectra for riboflavin in solvent solution with and without
sonication.
Figure 44: UV-Vis spectra comparing standard RuBisCO and riboflavin with
sonication (normalized) to the additive value of standard RuBisCO in PBS at pH 7.9
with sonication plus riboflavin in solvent solution with sonication (normalized).

ix
Figure 45: UV-Vis spectra comparing normalization values of standard RuBisCO
with riboflavin with heating to additive values of standard RuBisCO in PBS at pH 7.9
and riboflavin in solvent solution both with heating.
Figure 46: Solutions for final trial of heating and freeze thaw cycles with pigments
added directly to standard RuBisCO in PBS at pH 7.9 for a final concentration of
1:100 mole ratio (protein: pigment), with (1) beta-carotene, (2) beta-carotene with
MgCl2, (3) bixin, (4) bixin with MgCl2, (5) riboflavin, (6) riboflavin with MgCl2, and
(7) standard RuBisCO .
Figure 47: UV-Vis spectra comparing normalized values of standard RuBisCO with
riboflavin after heating and freeze thaw cycles to additive values of standard
RuBisCO in PBS at pH 7.9 plus riboflavin in solvent solution.
Figure 48: UV-Vis spectra comparing normalized values of standard RuBisCO with
beta-carotene after heating and freeze thaw cycles to additive values of standard
RuBisCO plus beta-carotene in PBS at pH 7.9.
Figure 49: UV-Vis spectra comparing normalized values of standard RuBisCO with
bixin after heating and freeze thaw cycles to additive values of standard RuBisCO
plus bixin in PBS at pH 7.9.
Figure 50: Comparison of bixin and beta-carotene in PBS at pH 7.9 and ethanol with
(1) beta-carotene in ethanol, (2) beta-carotene in PBS, (3) bixin in ethanol, (4) bixin
in PBS.
Figure 51: (a) UV-Vis results for beta-carotene in ethanol, (b) UV-Vis results for
bixin in ethanol.

x
Figure 52: UV-Vis results comparing standard RuBisCO with riboflavin after heating
and freeze thaw cycles with and without MgCl2.
Figure 53: Results for Western Blot and stained membrane, (A) standard RuBisCO
(1mg/mL); (B) molecular weight marker; (C) standard RuBisCO with beads before
wash; (D) standard RuBisCO with beads after, no wash; (E) standard RuBisCO with
beads after, with wash; (F) standard RuBisCO with beads, final; (G) tobacco
supernatant with beads after, no wash; (H) tobacco supernatant with beads after, with
wash; (I) tobacco supernatant with beads, final; (J) molecular weight marker; (K)
molecular weight marker.
Figure 54: Results for Western Blot and stained membrane A molecular weight
marker; (B) standard RuBisCO control (0.5µL); (C) standard RuBisCO control
(1µL); (D) Pellet A; (E) Pellet B; (F) Molecular weight marker; (G) supernatant A;
(H) supernatant B.
Figure 55: Poncaeu stain of samples from tobacco powder extraction with methanol
extraction: (A) standard RuBiSCO; (B) supernantant A; (C) pellet A; (D) supernatant
B; (E) pellet B.
Figure 56: Silver stain comparison of supernatant from extraction buffer B with
methanol extraction and dilutions, (A) supernatant from extraction with buffer B; (B)
standard RubisCO; (C) supernatant with methanol extraction; (D) 15µL supernatant
with methanol extraction in loading buffer (1X) plus 5µL loading buffer (1X); (E)
10µL supernatant with methanol extraction in loading buffer (1X) plus 10µL loading
buffer (1X); (F) 5µL supernatant with methanol extraction in loading buffer (1X) plus

xi
15µL loading buffer (1X); (G) 1µL supernatant with methanol extraction in loading
buffer (1X) plus 19µL loading buffer (1X).
Figure 57: Western results for (A) standard RubisCO; (B) 15µL supernatant with 5µL
loading buffer (1X); (C) 15µL supernatant with 3µL loading buffer (1X) and 2µL
reducing agent (10X); (D) 10µL supernatant with 10µL loading buffer (1X); (E)
10µL supernatant with 8µL loading buffer (1X) and 2µL reducing agent (10X); (F)
5µL supernatant with 15µL loading buffer (1X); (G) 5µL supernatant with 13µL
loading buffer (1X) and 2µL reducing agent (10X); (H) 1µL supernatant with 19µL
loading buffer (1X); (I) 1µL supernatant with 17µL loading buffer (1X) and 2µL
reducing agent (10X).
Figure 58: (a) Western blot results for standard RuBisCO followed by dilutions of
beads and supernatant not incubated in beads and (b) Silver stain results. (A) standard
RuBisCO; (B) 20µL beads incubated in supernatant; (C) 15µL beads incubated in
supernatant with 5µL loading buffer, 1X; (D) 10µL beads incubated in supernatant
with 10µL loading buffer, 1X; (E) 5µL beads incubated in supernatant with 15µL
loading buffer 1X; (F) supernatant from ground tobacco powder.
Figure 59: Silver stain results for bead conjugation study, (A) supernatant with beads
conjugated ( 10mg/mL RbcL anti-rabbit, polyclonal for RuBisCO); (B) PBS at pH 7.9
with beads conjugated (10mg/mL RbcL anti-rabbit, polyclonal for RubisCO); (C)
PBS at pH 7.9 with non-conjuaged beads.
Figure 60: (a) Western blot results for final bead and supernatant trials and (b) silver
stain results. (A) standard RuBisCO; (B) supernatant with conjugated beads
(10mg/mL anti-rabbit, polyclonal for RuBisCO); (C) PBS at pH 7.9 with conjugated

xii
beads (10mg/mL anti-rabbit, polyclonal for RuBisCO); (D) PBS at pH 7.9 with non-
conjugated beads; (E) supernatant; (F) supernatant 1:10; (G) supernatant 1:100; (H)
supernatant 1:1000.
Figure 61: Western blot results from (1) Spinacia oleracea; (2) Synechococcus PCC
7942; (3) Cyanophora paradoxz; (4) Heterosigma akashiwo; (5) Thalassiosira
pseudonana; (6) Euglena gracilis; (7) Micromonas pusila (8) Chlamydomanas
reinhardtii (9) Prophyra sp; (10) Gonyaulax polyedra; (11) Emiliania huxleyi.
Premission from www.agrisera.com.
1
Chapter 1: Introduction
The health benefits of dietary antioxidants have been extensively investigated,
in particular their role in reducing oxidative stress in biological systems (Liu,
2003). Higher consumption of antioxidant-rich fruits and vegetables has been
associated with lower risk of coronary heart disease, diabetes, and other
chronic diseases (Liu, 2003). Growing knowledge about the health promoting
properties of dietary antioxidants has driven a strong interest in supplementing
or enhancing these bioactive compounds in the human diet.
Antioxidative pigments such as riboflavin, annatto extract (bixin), and beta-
carotene are common, natural additives found in a variety of foods including
dairy, baked goods, and beverages. Riboflavin, or vitamin B2, is a member of
the flavin group associated with protection against cardiovascular disease by
reducing oxidation of low density lipoproteins additional to anti-carcinogenic
effects in the intestine (Yanishlieva et al., 2001). Both beta-carotene and
annatto extract are carotenoids known to provide cell communication
components and macular protection besides acting as immune function
enhancers and UV skin protectants (Rao et al., 2007). However, these three
pigments are unstable in food products (Delgado-Vargas et al., 2003;
Yanishlieva et al., 2001). Riboflavin, annatto extract, and beta-carotene may
degrade due to high heat, oxygen exposure, or interactions with other
compounds in food (Nisha et al., 2005; Delgado-Vargas et al., 2003; Agte et
2
al., 2002; Ranhotra et al., 1995). Therefore, there is growing interest in the
food industry to identify an effective binding agent capable of stabilizing
these antioxidative pigments.
Ribulose 1,5-bisphosphate carboxylase oxygenase (RuBisCO), an enzyme
involved in the Calvin cycle and the most abundant protein on earth (Reinhard
and Höcker, 2005), is found in the chloroplast of plants in nature and makes
up at least 50% of all proteins in plant leaves (Scheneider et al., 1992). To
date, many methods exist for extracting RuBisCO from various plant sources,
such as the use of Sephadex extraction or high performance liquid
chromatography (HPLC) separation (Holler et al. 2007; Wang et al., 2006 and
2003; Chang 1972). RuBisCO can be purchased commercially as a partially
purified powder from spinach (Sigma-Aldrich). It is our hypothesis that such a
natural pigment-binding protein, as seen in similar complexes found in
invertebrates as well as in plants (Zhang et al., 2008; Heras et al., 2007;
Mimuro et al., 2004), could serve as an ideal binder for the antioxidative
pigments of interest.
Additionally, along with the possibility of providing stability, RuBisCO could
also be employed as a protein source for a variety of food applications. Over
the last 20 years, leaf concentrates and isolates have been viewed as
nonconventional protein sources, and with a balanced amino acid profile,
ubiquitous nature, and abundance, RuBisCO could provide a good source of

3
protein (Pedone et al., 1995). Montanari et al. (1993) demonstrated a crude
extraction process that shows fraction I (precipitated at pH 5.6) of RuBisCO
from tobacco to provide good nutritional characteristics which are defined
below.
In the present study, various attempts were made to facilitate the formation of
RuBisCO-pigment complexes using mixing, sonicating, heating, and freeze-
thaw techniques. The properties of RuBisCO-pigment complexes were
investigated using Raman spectroscopy, surface plasmon resonance
biosensors, as well as UV-VIS spectroscopy. If binding proved successful, the
next step would be to determine the bioavailability of the antioxidative
pigments once bound, as well as establish information on the potentially
improved stability of the protein-pigment complexes. A protocol for
extracting a highly proteinaceous supernatant from tobacco leaves was
established in hope that RuBisCO could be extracted from this abundant
source while providing a value-added application for such an ill-imaged crop
in dire needs of alternative uses (Fu et al., 2010; Yancy, 2004). An
exploratory research assessing the challenges and hurdles in forming a stable
protein-pigment complex will enable further development in stabilizing
antioxidative pigments, whereas the detection techniques established could be
of value for quantitative measurements of such complexes.
4
Chapter 2: Literature Review
2.1 Antioxidative Pigments
The consumer associates the color of his or her food with safety and quality,
as well as a measure of good processing (Delgado-Vargas et al., 2003).
Currently there is a trend toward the use of natural colorants because of public
concern that synthetic colorants are potentially harmful (Wissgott et al.,
1996). Most natural colorants or pigments used in food products are also
antioxidants and provide benefits to human health. An antioxidant is a
substance that is capable of delaying, retarding, or preventing the development
of rancidity in food or other flavor deterioration due to oxidation (Yanishlieva
et al., 2001). Antioxidants occur in or can be extracted from plant and animal
tissues (Yanishlieva et al., 2001). Some of these natural colorants can be
created in the lab, but they must be completely identical to those found in the
natural environment in order to be allowed in food products. Synthetic
colorants are used in foods but are limited by the federal government due to
safety concerns. While synthetic colorants are less expensive then natural
colorants and pigments, the benefits offered by natural colorants as
antioxidants offer a reason for use and possible growing interest among
industry and consumers.
It has been shown that nearly 75% of all food in developed countries is
processed in some form before it reaches the consumer (Delgado-Vargas et
al., 2003). It is because of this processing and transportation that additives are

5
needed. Overtime degradation and loss of normal appearance may occur in the
food product, so pigments and stabilizers are attractive (Delgado-Vargas et al.,
2003). There are several common reasons why pigments and antioxidants are
added to foods. These reasons include the restoration of foods original
appearance, assurance of color uniformity, protection of other components
with antioxidants, and preservation of food appearance and characteristics. It
is important to note that color additives can never be used to mask poor
processing or manipulation of a product during processing (Delgado-Vargas et
al, 2003). There are also several factors that affect the ability of antioxidants
to function (Table 1).
Table 1: Factors that affect antioxidant power (Yanishlieva, 2001).
Factor Antioxidant Power
↑ Concentration ↑ power
↑ Oxygen ↓ power
↑ Light ↓ power
Specific pigments or antioxidants are chosen to be added to a food product for
various reasons. When considering a natural color additive, one must take into
account the color or hue required, the physical form of the food (liquid, solid,
emulsion), the properties of the food to be colored (oil or water based, pH,
etc.), and the processing conditions (heating and storage) (Delgado-Vargas et
al., 2003). Also, each pigment or antioxidant has specific regulations
determining what food it can be used in and for what purpose. Because of
these considerations the three pigments of riboflavin, annatto extract, and
6
beta-carotene were chosen, as they are commonly used antioxidants. They
impart specific colors (mainly yellow or orange hues) and are used in a wide
variety of products ranging from dairy to bakery goods to beverages and
snacks.
As already mentioned, color is one of the most important first impressions to a
consumer; however, natural colorants can be unstable in food products.
Generally, antioxidants are thought to be products that stabilize foods, as they
can help prevent oxidation by destroying free radicals. However, these
antioxidants are prone to degradation and deterioration themselves, thus a
stabilizer would be beneficial in certain food products.
There are several ways that antioxidants can undergo degradation. A major
disadvantage of natural antioxidants is that they have low resistance to
oxygen, especially when also exposed to light, high temperature, and dry
conditions (Yanishlieva et al., 2001). Unfortunately these are all possible
conditions that the food may be exposed to during storage or use by the
consumer. In addition, there is relatively little information on how an
antioxidant might change as it interacts with other food components and how
these changes affect the foods’ ability to resist oxidation (Yanishlieva et al.,
2001). In addition it is important that a food is protected against oxidation, as
this process can result in rancidity and off flavors.

7
Overall, there is a desire to provide stability to these colorants to enhance the
likelihood that their antioxidant capabilities remain intact and stable
throughout the processing of foods. To address this issue, RuBisCO was
selected for evaluation as a pigment stabilizer given that it is an inherently
stable protein (Reinhard and Höcker, 2005). RuBisCO is not only investigated
as a possible binder to pigments, but also as a supplemental protein enhancer
in foods.
2.1.1 Riboflavin
Riboflavin is part of the family of flavonoids or flavins. These compounds are
efficient antioxidants and have been proposed to protect against
cardiovascular disease by the reduction of oxidation of low density
lipoproteins (Yanishlieva et al., 2001). Flavonoids have also been found to
show anti-carcinogenic effects in the intestine (Yanishlieva et al., 2001).
Overall, flavonoids are found in various foods naturally and provide not only
the health benefits as listed above, but also nutrients that are precursors to
vitamins.
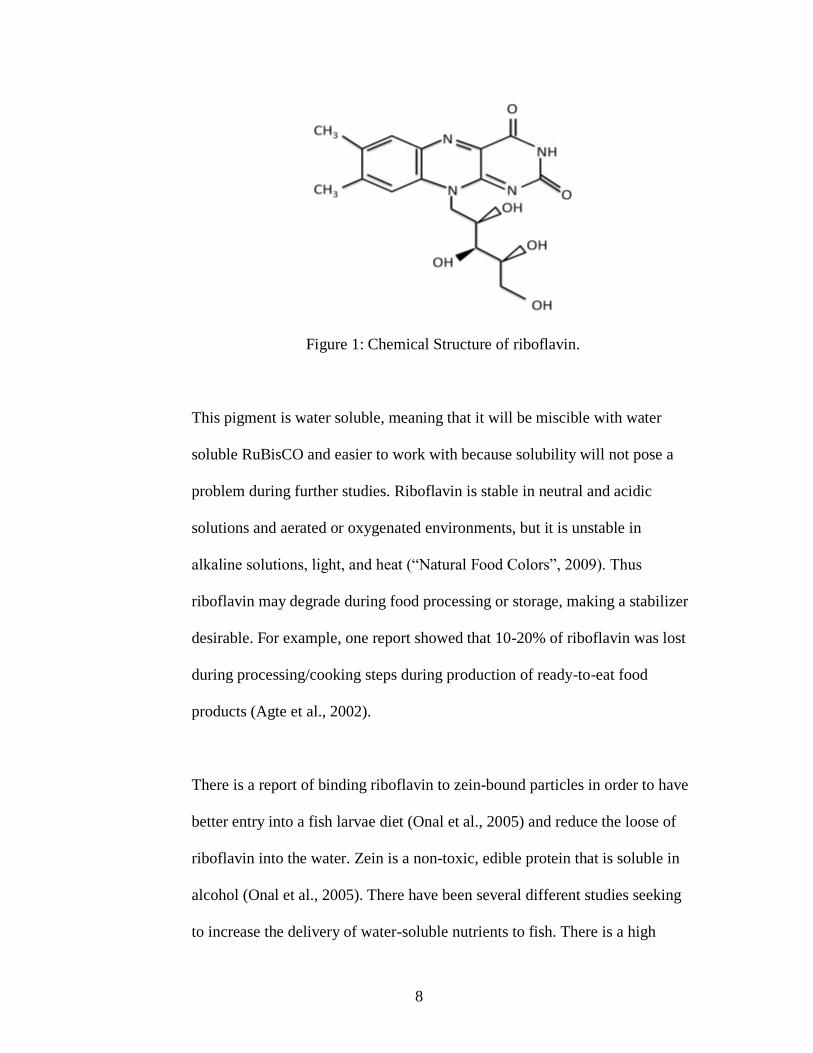
Riboflavin, or vitamin B2, is normally an orange-yellow color (Figure 1). It is
commonly used in baby foods, cereals, sauces, processed cheeses, and fruit
drinks (“Natural Food Colors”, 2009).
8
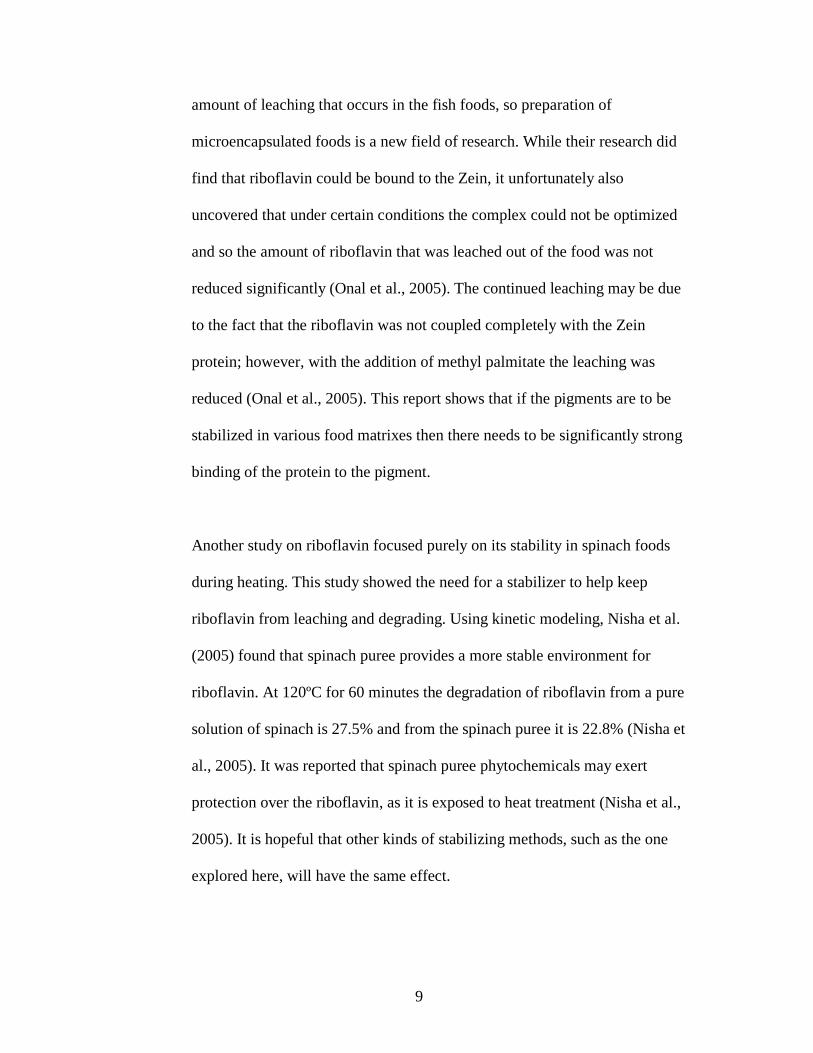
Figure 1: Chemical Structure of riboflavin.
This pigment is water soluble, meaning that it will be miscible with water
soluble RuBisCO and easier to work with because solubility will not pose a
problem during further studies. Riboflavin is stable in neutral and acidic
solutions and aerated or oxygenated environments, but it is unstable in
alkaline solutions, light, and heat (“Natural Food Colors”, 2009). Thus
riboflavin may degrade during food processing or storage, making a stabilizer
desirable. For example, one report showed that 10-20% of riboflavin was lost
during processing/cooking steps during production of ready-to-eat food
products (Agte et al., 2002).
There is a report of binding riboflavin to zein-bound particles in order to have
better entry into a fish larvae diet (Onal et al., 2005) and reduce the loose of
riboflavin into the water. Zein is a non-toxic, edible protein that is soluble in
alcohol (Onal et al., 2005). There have been several different studies seeking
to increase the delivery of water-soluble nutrients to fish. There is a high
9
amount of leaching that occurs in the fish foods, so preparation of
microencapsulated foods is a new field of research. While their research did
find that riboflavin could be bound to the Zein, it unfortunately also
uncovered that under certain conditions the complex could not be optimized
and so the amount of riboflavin that was leached out of the food was not
reduced significantly (Onal et al., 2005). The continued leaching may be due
to the fact that the riboflavin was not coupled completely with the Zein
protein; however, with the addition of methyl palmitate the leaching was
reduced (Onal et al., 2005). This report shows that if the pigments are to be
stabilized in various food matrixes then there needs to be significantly strong
binding of the protein to the pigment.
Another study on riboflavin focused purely on its stability in spinach foods
during heating. This study showed the need for a stabilizer to help keep
riboflavin from leaching and degrading. Using kinetic modeling, Nisha et al.
(2005) found that spinach puree provides a more stable environment for
riboflavin. At 120ºC for 60 minutes the degradation of riboflavin from a pure
solution of spinach is 27.5% and from the spinach puree it is 22.8% (Nisha et
al., 2005). It was reported that spinach puree phytochemicals may exert
protection over the riboflavin, as it is exposed to heat treatment (Nisha et al.,
2005). It is hopeful that other kinds of stabilizing methods, such as the one
explored here, will have the same effect.
10
Overall, riboflavin is an important nutrient in the consumers’ diet, but it can
leach out or degrade in foods easily when exposed to high water content or
heating. There have been several efforts to stabilize riboflavin in foods as
discussed above, but both studies discussed had limited success. The goal of
this project is to stabilize riboflavin with the protein RuBisCO for the purpose
of making it less susceptible to degradation during food processing so that it
would be present to provide antioxidant benefits to consumers.
2.1.2 Annatto Extract
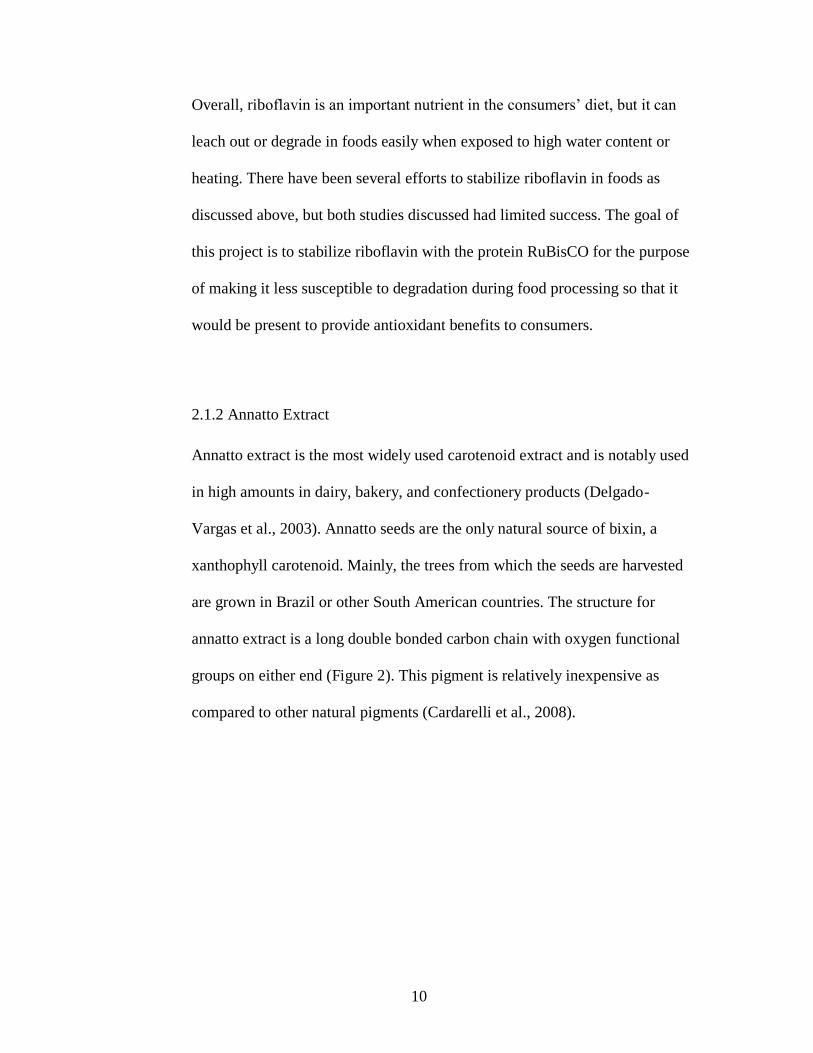
Annatto extract is the most widely used carotenoid extract and is notably used
in high amounts in dairy, bakery, and confectionery products (Delgado-
Vargas et al., 2003). Annatto seeds are the only natural source of bixin, a
xanthophyll carotenoid. Mainly, the trees from which the seeds are harvested
are grown in Brazil or other South American countries. The structure for
annatto extract is a long double bonded carbon chain with oxygen functional
groups on either end (Figure 2). This pigment is relatively inexpensive as
compared to other natural pigments (Cardarelli et al., 2008).
11
Figure 2: Chemical Structure of annatto extract.
Annatto extract is an approved pigment for general use as a food colorant;
virtually any yellow to orange food product available may be successfully
colored with annatto (Delgado-Vargas et al., 2003). Most annatto extracts are
oil soluble when containing bixin, but water soluble forms are available and
contain norbixin as its potassium salt, made from bixin saponification
(Delgado-Vargas et al., 2003). Generally, powdered forms made by industry
are soluble in water and slightly soluble in ethanol (Delgado-Vargas et al.,
2003). Overall, annatto preparations usually have good stability but are
sensitive to acidic pH values. Furthermore, annatto pigments degrade and lose
brightness as they are exposed to light over time.
There have been several studies about the stability of bixin in annatto extract.
Hernandez & Rusig studied the effects of light exposure and found that there
was a loss of 82.1% for water-soluble microencapsulated bixin, 98.3% for free
bixin and 4.0% for unexposed bixin (Prentice Hernandez, 1999). This shows
that bixin is susceptible to degradation during storage in the open or in non-
light sensitive packaging. In a study by Knjilal et al. (1995) it was found that

12
bixin dispersed in vegetable oil and stored at temperatures below freezing had
a loss of about 20-25%. Balaswamy et al. (2006) studied the stability of bixin
in annatto oleoresin and dye powder during storage. The annatto pigment was
stored in the form of dye powder or annatto oleoresin, which is a mixture of
both oil and resin from plants, in glass jars for 360 days in three different
conditions: cold (5-8°C) temperatures in the dark, room temperature in the
dark, and room temperature in daylight (Balaswamy et al., 2006). Data
showed that the dye powder form had much higher losses than oleoresin for
all forms of storage. Overall, degradation of bixin was seen, demonstrating
concern for its stability during the application of food processing and storage
(Balaswamy et al., 2006).
2.1.3 Beta-Carotene
This carotenoid is the most abundant of all, as it is highly involved in the
photosynthesis process and is found in most plant species. Beta-carotene was
first isolated in 1817 and is a precursor to vitamin A (Bartley et al., 1995). An
oil soluble pigment, beta-carotene is used to color a variety of foods ranging
from beverages to baked goods to frozen foods to candies. This pigment is
stable through variable heat and light conditions and also has a large pH range
of 2.0 to 14.0. The structure of beta-carotene is similar to annatto extract as
they are both from the carotenoid family (Figure 3).

13
Figure 3: Chemical Structure of beta-carotene.
As a precursor to vitamin A, beta-carotene, is beneficial to the healthy
development of individuals and promotes disease prevention (Yanishlieva et
al., 2001). Several epidemiological studies which provided higher amounts of
beta-carotene than normal have been completed and only one found that beta-
carotene had protective effects against cancer (Yanishlieva et al., 2001). Other
studies indicated that smokers are at a higher risk for cancer with the use of
beta-carotene (van de Berg et al., 2000). These results suggest a possible
biphasic response to beta-carotene, in that it promotes health when consumed
at normal dietary levels, but may have adverse affects when consumed at an
increased amount (Rao et al., 2007). Regardless, it is still advisable to provide
stability to beta-carotene for better control of the amount used to supplement
foods.
A study completed in 1999 reviewed the stability and antioxidant activity of
beta-carotene in different cooking oils. Beta-carotene has been shown to
protect lipids from free radical autoxidation, since it can inhibit propagation
with the termination of oxidation chain reactions by reacting with peroxyl
radicals (Goulson et al., 1999). The stability of beta-carotene was measured
14
using normal phase HPLC. Data showed that in either oil, conventional canola
oil, or high oleic canola oil, the rate of beta-carotene loss was lower with
increasing concentrations of the pigment (Goulson et al., 1999). These results
show that at higher concentrations beta-carotene is a more efficient quencher
of oxygen.
Finally, the stability of beta-carotene in whole wheat bread and crackers can
be used as an example of this pigment in food products. In wheat and most
other grains there are very low levels of beta-carotene, but through
fortification these grain foods, a dietary staple, can become a good source of
carotene in the diet (Ranhotra et al., 1995). The study by Ranhotra and
coworkers was completed with an interesting goal in mind: by adding beta-
carotene to whole wheat products, the already impressive nutritional profile of
many bakery products can be enhanced, provided the supplemented beta-
carotene remains stable (Ranhotra et al., 1995). It was found that the beta-
carotene stability was reduced during the baking process for whole wheat
bread and crackers. The losses for the bread ranged from 4.3% to 14.8% and
for the crackers there was a loss of 17.9% to 22.8% (Ranhotra et al., 1995).
The resulting higher loss in the crackers may be due to a greater surface area
and therefore more heat reaching the cracker than the bread. Overall, it can be
seen that there needs to be a better way to provide stability for beta-carotene if
it is to fortify foods such as bread or crackers.

15
2.2 RuBisCO
2.2.1 Properties and Interest
As the most abundant protein on earth, RuBisCO is a significant protein of
interest. This protein makes up at least 50% of all proteins in plant leaves
(Reinhard and Höcker, 2005). RuBisCO is involved in the Calvin Cycle to
help the leaf produce energy during photosynthesis. As such, this protein is
linked with chlorophyll, the main pigment of photosynthesis, in the
chloroplast of the plant, meaning that during extraction processes it is difficult
to remove chlorophyll from the protein. The activation of RuBisCO occurs on
the carboxyl end of the β-strand of the barrel of one of the large subunits
(Scheneider et al., 1992). Both CO2 and Mg2+
are required in order to activate
the protein (Reinhard and Höcker, 2005) which indicates that a metal ion may
be needed in order to allow RuBisCO to bind to other pigments.
Fraction I, precipitated at pH 5.6, of RuBisCO from tobacco provides good
nutritional characteristics (Montanari et al., 1993). RuBisCO protein is
tasteless and offers good palatability; furthermore, the RuBisCO fraction does
not contain sugars, fats, or salt (Montanari et al., 1993). It is also a well
defined protein molecule with a complete amino acid profile (Montanari et al.,
1993). Containing a balanced amino acid profile, RuBisCO can enhance the
protein content of a product and may possibly be used to provide protein
fortification to a product.
16
2.2.2 Structure and Stability
The protein RuBisCO is inherently stable, which could provide stability to
bound pigments, as they undergo processing in food products as discussed
above. The RuBisCO enzyme is made up of 8 large subunits (56 kDa) and 8
small subunits (14 kDa) (Schneider et al., 1986). The structure of each subunit
of RuBisCO has an alpha/beta barrel configuration where eight parallel beta-
strands create the core of the barrel and are surrounded by eight alpha-helices
(Schneider et al., 1986) (Figure 4). When there are eight strands involved in
this motif it is called a TIM barrel (circled in red, Figure 4), so named because
it was first identified in the enzyme triosephosphate isomerase.
Figure 4: Modified schematic of one subunit of RuBisCO. Cylinders show α-
helices and arrows show β-strands. Circled portion represent TIM barrel.
(Schneider et al., 1986); Reprinted with permission from Macmillan
Publishers Ltd: [The EMBO Journal] (Schneider et al.), copyright (1986).
17
The TIM barrel is one of the most common enzyme folds and offers stability
due to the interactions in the secondary structure, such as hydrogen bonds
between the main chains of the beta-strands, between the intra-helical strands,
and between the side chains and salt bridges, along with the dipole-dipole
interactions between the alpha-helical structures and the beta-strands (Yang et
al., 2009 and Reinhard and Höcker, 2005). Also, the TIM barrel offers
enhanced thermo-stability to proteins (Reinhard and Höcker, 2005).
2.2.3 Extraction and Purification Methods
RuBisCO can be extracted into various forms including crystals or precipitates
from the green biomass of the leaves. The first crystallographic studies to
understand the structure of RuBisCO were completed in protein extracted
from tobacco plants (Schneider et al., 1992). The protein is normally
categorized into two fractions and each will elute at different pH levels. The
first fraction has a pH of around 5.6 and the second a pH of 3.5 (Fu et al.,
2009), with this first fraction offering a pure form without lipids,
carbohydrates or salts (Pedone et al., 1993).
There are numerous methods in the literature for extracting and purifying
RuBisCO and other plant proteins from various sources (Holler et al. 2007;
Wang et al., 2006 and 2003; Chang 1972); most of the techniques involve
heating, harsh chemicals, expensive equipment, and time consuming
procedures. The aims of all these protocols are to remove other proteins,
18
carbohydrates, nucleic acids, phenolics, alkaloids, phytic acid, starch, salt, and
any other impurities (Holler et al., 2008). Wang et al. (2005) have developed a
universal and rapid method for protein extraction from plant tissues which
could prove to be a useful extraction method for this research. However, this
procedure uses harsh chemicals (i.e. phenol) as does many of the above
mentioned methods, which denature proteins. So, while this and other recent
protocols may provide a purified protein, they are not beneficial to this project
due to the possible reduction in protein activity. Our goal is to maintain
RuBisCO structure and folding capability or not irreversibly denature the
protein, in order to provide the stability offered in motifs such as the TIM
barrel.
Chlorophyll, along with other proteins, starches, and fats, can be somewhat
difficult to remove from RuBisCO samples. If RuBisCO is interacting tightly
to chlorophyll or other impurities, even after extraction, then it might inhibit
the binding of the pigments being investigated here. As such, the purest form
of RuBisCO possible is sought for further analysis. Furthermore, the crude
extraction process, used initially in our work, that avoided harsh chemicals
and used pH precipitation of fractions (Fu et al., 2009) did not yield the purest
form product, and chlorophyll could not be removed completely from the
fractions. Because of this lack purified protein a different method was used for
the research of this project.

19
An alternate use of the tobacco crop is needed, due to the tobacco buyout of
the 90s, which meant that more than half of farmers in the state of Maryland
switched to more life sustaining crops (Holler et al., 2007). However, for the
farmers still growing tobacco the possibility of extracting this protein from
tobacco leaves to bind to pigments may provide usefulness to the crop.
Tobacco is a non-food/non-feed crop, so using this plant imposes no problems
in subverting the regular food supply (Holler et al., 2007). The tobacco crop is
only harvested during the summer and fall months, yet harvested material can
be stored to preserve the tissue without degradation or microbial
contamination. A buffer using salts, magnesium, Tris (pH 8.0), and protease
inhibitor complex (to reduce denaturation) was used to store the homogenized
tissue in liquid nitrogen at -80ºC from tobacco plants that were harvested in
the summer of 2009.
2.3 Tools to Assess Binding
2.3.1 Raman Spectroscopy
Raman spectroscopy was first discovered in 1928 by Sir C. V. Raman and has
since developed into a powerful method of analysis in all fields of science
(Ingle, 1988). This technique allows one to determine detailed and specific
information about a sample at a molecular level with non-destructive results
and minimum sample preparation (Schmitt, 2006). It is an emerging tool for
the food industry because of these attributes in combination with the ability to
interrogate aqueous samples. Raman can be used on a wide range of foods,

20
including macrocomponents (proteins, lipids, carbohydrates, and water),
minor components (carotenoid pigments or synthetic dyes), microorganisms,
or even packaging materials that may contact food (Li-Chan, 1996).
The Raman phenomenon is based on the scattering of electromagnetic
radiation when an incident photon is absorbed by a molecule and the
subsequent relaxation of an electron occurs inelastically (Ingle and Crouch,
1988). Raman scattering comprises frequency shifts that are independent of
scattering angle and are caused by rotational and vibrational transitions in
molecules (Ingle and Crouch, 1988). In order for Raman scattering to occur,
there needs to be a change in polarizability in the molecule at the equilibrium
bond distance (Ingle and Crouch, 1988). The overall intensities obtained in
Raman scattering are based on the source of irradiance and wavelength, and
spectra give information as to the vibrational structure of the molecules
interrogated (Ingle and Crouch, 1988). Figure 5 shows a block diagram of a
general Raman spectroscopy instrument.
Figure 5: Block diagram of Raman spectroscopy instrument.

21
Raman is a vibrational spectroscopy technique and is a complementary
method to infrared (IR) spectroscopy (Li-Chan, 1996). For Raman, non-polar
groups that are in nonsymettric molecules, such as C=C, C-C, and S-S, have
strong intensity bands, while in IR polar groups like C=O, N-H, and O-H have
strong stretching (Li-Chan, 1996). It is because of these selection criteria that
Raman spectroscopy can be used to evaluate aqueous solutions, as the water
bands are extremely weak in Raman. As water bands in IR can obscure other
vibrational bands, IR normally uses samples that are dry or non-aqueous (Li-
Chan, 1996). This makes Raman useful for studies of biological systems as
well as for food products which normally have an increased water activity
level content.
There are several other benefits to Raman spectroscopy, along with a few
limitations that must be mentioned. First, this technique can be used to study
samples in aqueous solutions, non-aqueous liquids, fibrous forms, films,
surfaces, powders, precipitates, gels, and crystals (Li-Chan, 1996). While high
concentrations are needed to provide strong bands, only small quantities are
required to analyze samples (Li-Chan, 1996); as little as 1µL of solution or
1mg of solid sample may be needed. Also, Raman samples require little to no
preparation before data collection can begin. Some of the limitations
surrounding Raman spectroscopy include the fact that fluorescence may occur
and obscure the weaker Raman scattering bands (Li-Chan 1996). This is
especially common in large macromolecular samples such as proteins or

22
sugars. While generally a nondestructive technique, some samples may be
photodegraded due to the intense power of the laser at the sample. This
limitation is easily overcome by reducing laser power or increasing the laser
spot size, but it is important to watch for degradation to ensure correct spectra
are acquired and to enable further sample analysis.
Overall, Raman spectroscopy has been shown to provide reliable analytical
results when studying proteins as well as smaller molecules such as pigments
and antioxidants. The most beneficial aspect of Raman for this project is that
it can be used to analyze aqueous or other types of solutions. The samples of
RuBisCO and pigments will be either created in water or oil suspensions, so
Raman could be an advantageous analytical tool for studying binding. Each
sample measured under Raman spectroscopy will offer a unique spectrum
based on structural components.
The major challenges that may occur in the studies herein will be the
fluorescence and potential photodegradation of the RuBisCO sample;
however, this may be avoided with extraction and purification methods that
provide a pure form for study. Raman will also possibly help provide an
intricate look at the binding process of the molecules in RuBisCO and
pigments to be used, as the vibrational spectra may yield information on
binding based on possible shift or change in spectra.
23
2.3.2 Surface Plasmon Resonance
In 1902 surface plasmon resonance (SPR) was discovered, but the physical
interpretation of this phenomenon was not fully refined until 1968 by Otto,
Kretschmann, and Raether who reported on the excitation of surface plasmons
on metal surfaces (Schasfoort et al., 2008). The development of SPR
biosensors has allowed for the study of proteins, nucleic acids, lipids,
carbohydrates, whole cells such as microorganism, and complex mixtures of
samples with little purification (Biacore, 2002).
In simple terms, SPR is based on polarized light being reflected off a thin
metal film. Upon changing the angle of incidence, there is a decrease in
intensity of reflected light where the surface plasmons are excited. The
wavelength of this SPR dip is dependent on the refractive indices of the
substrate and the biosensor surface/solution. The SPR dip can be tracked over
time to create a sensorgram that provides information (e.g., concentration and
kinetics) about analyte binding to the biosensor surface (Schasfoort et al.,
2008).
While there are a variety of companies offering SPR instruments, this research
was performed on a Biacore T100. Biacore sensor chips provide a variety of
benefits that include: reproducible results, stable baselines, high chemical
stability, and low non-specific binding (Biacore, 2002). The fact that the chips
are stable means that regeneration can be provided over many cycles, an
24
important factor that will be explained below. The instrument used has an
autosampler and automatic injection system which gives results that have less
laboratory technician error. Overall, SPR offers a great resource, as it can be
used in a broad range of research, from macro to micro molecules. SPR is
used for ligand determination, protein function understanding, binding of
proteins, evaluating DNA damage, and many more applications relating to the
life sciences (Biacore, 2002). It can also be used in food and drug applications
in quality control, safety analysis, hormone identification and drug
development (Biacore, 2010).
The assay to be used for the following research involves an immobilized
antibody as the ligand and the RuBisCO protein as the analyte (Figure 6).
25
Figure 6: Surface plasmon resonance sensorgram for association and
dissociation of analyte to ligand in order to determine kinetics with (1) ligand
(antibody) immobilized to surface with buffer flowing over surface, (2)
association of analyte (RuBisCO), (3) dissociation of analyte, (4) regeneration
of surface, (5) signal back to baseline with just ligand immobilized on surface.
First the buffer flows over the chip to provide a baseline; at this point the
ligand is already bound to the surface (in this case, the antibody for RuBisCO)
(Schasfoort et al., 2008). Next, association of the analyte occurs (RuBisCO)
causing a measurable change in response units as the angle changes depending
on what is bound to the surface (Schasfoort et al., 2008). The analyte then
dissociates as buffer is again injected over the chip, thus creating a decrease in
signal response and providing information on the kinetics of the system
(Schasfoort et al., 2008). The SPR system then provides the ability to

26
regenerate, which is the removal of the analyte by breaking the bond to the
ligand and essentially clearing to the original surface made, so each chip can
be used multiple times. SPR was used in this project to determine the binding
of RuBisCO to antibody as well as the potential binding of protein to pigment
based on a change in kinetics cause by the creation of a protein pigment
complex.
2.3.3 UV-Vis
Ultraviolet-visible spectrometry (UV-Vis) measures the transmittance, T, (or
absorbance, A) of a solution in a transparent cell of a given length. This
method is used for qualitative and quantitative analysis in various aspects of
research. In UV-Vis the photons give energy to the electron of the sample and
in turn promote them to a higher energy level. The energy obtained from the
light provides the wavelength for absorption.
In order to measure the difference in power there is a reference blank, which
is the solution alone that the analyte is then measured in. For UV-Vis the
wavelength from the light source can either be set to a specific wavelength or
scan the range from 200 nm to 800 nm. When running UV-Vis, there are
several factors that may influence the results including: the solvent used the
pH of solution, the temperature, electrolyte concentration, as well as the
presence of interfering substances (Skoog et al., 2007).
27
In proteins there are three different distinguishable absorption bands: the
peptide bond that links amino acids at 220 nm, several aromatic amino acid
bands from 230-300 nm, and absorption in the visible region of the spectrum
due to the possible presence of metal ions and prosthetic groups such as
chlorophylls, flavins, and heme groups (Nienhaus et al., 2005). UV-Vis
provides an excellent method to study the concentration of proteins (Nienhaus
et al., 2005) and when working at room temperature in aqueous solutions with
a pH ~ 7.0, physiological conditions can be mimicked (Nienhaus et al., 2005).
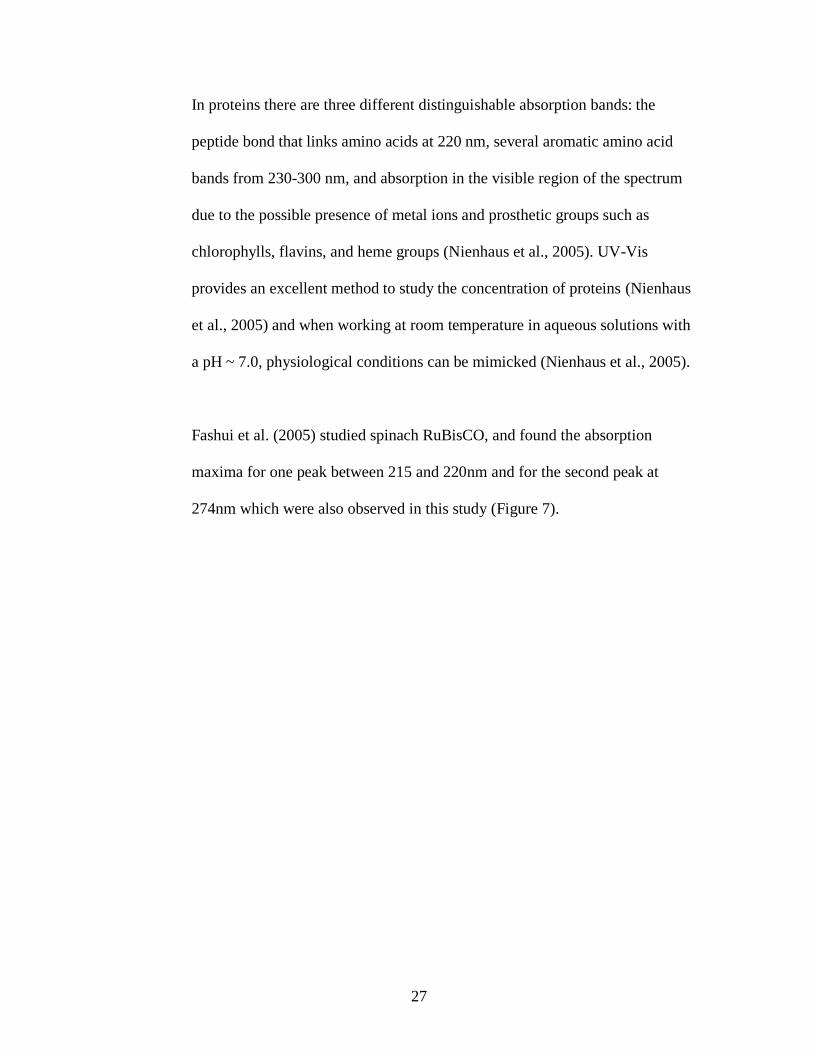
Fashui et al. (2005) studied spinach RuBisCO, and found the absorption
maxima for one peak between 215 and 220nm and for the second peak at
274nm which were also observed in this study (Figure 7).
28
Figure 7: UV-Vis absorption of spinach RuBisCO in PBS at pH 7.9 with
peaks matching well with data published by Fashui, et al. where there are
major peaks corresponding to between 215 and 220nm and the second at
274nm.
Light absorption spectra are an incredibly useful tool for indentifying and
categorizing pigments. Carotenoids contain a long conjugated double-bond
structure, as seen in Figures 4 and 5 (Britton et al., 2004). Carotenoids absorb
light strongly and show intense absorption bands around the 400-500 nm
region (Britton et al., 2004). While most carotenoids absorb strongly in this
range, it is important to note that spectral shape differs between carotenoids
(Britton et al., 2004). Also, solvents play a key role in the transitional energy
and resulting absorbance of a carotenoid, as the maximum peak may vary
depending on what solvent is used (Britton et al., 2004). In addition, a shift in
absorbance may result due to polarity of solvent (Socaciu et al., 2008). For

29
riboflavin in aqueous solutions there are several key maximum absorption
peaks at 223, 266, 373, and 445 nm (Eitenmiller et al., 2008) as shown in
Figure 8.
Figure 8: UV-Vis Spectrum for Riboflavin in water (0.034mg/mL) with peaks
matching with data published by Eitenmiller et al (2008).
UV-Vis provides identifiable signals for both pigments and proteins. This
detection method was used to potentially provide information on the binding
of pigments to protein. It was anticipated that if a protein-pigment complex
was formed, it would result in a shift in absorption maxima and/or changes in
the spectral profile. Also, UV-Vis offers reliable, reproducible results with
little sample preparation.
30
Chapter 3: Objectives
The ultimate goal of this project was to explore the feasibility of binding
antioxidative food pigments using ribulose 1-5, bisphosphate carboxylase
oxygenase (RuBisCO). In order to achieve the goal, three specific objectives were
investigated:
To promote the formation of protein-pigment complex between RuBisCO and
the pigments using mixing, sonication, heating, and freeze-thaw techniques.
To evaluate the potential binding between RuBisCO and the pigments using
Raman spectroscopy, Surface plasmon resonance, and UV-Vis spectroscopy.
To extract and purify RuBisCO from tobacco, promoting an alternative source
of protein, using paramagnetic antibody-coated beads.
31
Chapter 4: Materials and Methods
4.1: Materials
4.1.1 Antioxidative Pigments and Standard RuBisCO
The pigments used were powder beta-carotene (MP Biomedicals, LLC, Solon,
OH, Cat. No. 101287), powder riboflavin (Spectrum Chemical, MFG, Corp.,
Gardena, CA, R1032) and a liquid form of annatto extract (Colorcon.com,
Harleysville, PA, Annatto Extract WL 28, Lot no. 081110). The standard
RuBisCO was from spinach, 95% pure (Sigma, St. Louis, MO). The solvent
solutions used were MilliQ water for riboflavin, 20% methanol (Sigma) for
annatto extract and acetone (Sigma) for beta-carotene.
4.1.2: Tools to Assess Binding
Raman Spectroscopy
The Nicolet Almega XR Dispersive Raman Confocal Microscope (Thermo
Scientific, Pittsburg, PA) was used for all research with Raman spectroscopy.
An aluminum spot slide (Aluminum EZ-Spot Micro Mounts, Thermo Electron
North America LLC, Madison, WI) was used to hold all samples and avoid
Raman background from a glass slide.
32
Surface Plasmon Resonance
The Biacore T100 (GE Healthcare, Piscataway, NJ) was used for all research
with surface plasmon resonance. Series S sensor chips CM5 along with the
Amine Coupling Kit and Mouse Antibody Capture Kit were used for
experiments (GE Healthcare). The antibody for SPR was monoclonal, mouse
anti-RuBisCO antibody (anti-Spinach RuBisCO Large subunit mAb, 50 µg
from COSMOBIO (Carlsbad, CA)). Standard protocol and buffers from GE
Healthcare were used for conjugation of the antibodies to the chip and
immunoassay conditions, except where noted. The solutions needed to
complete this were NHS/EDC, anti-mouse at 30µg/mL in acetate buffer at pH
5, 10mM glycine-HCl pH 1.7, ethanolamine, and running buffer. The running
buffers employed in these studies included 1M Tris HCl buffer pH 8.0, HBS-
EP+ (10X, 0.01M HEPES, 0.15M NaCl, and 3mM EDTA, pH 7.4) HBS-N
(10X, 0.1M HEPES and 1.5M NaCl, pH 7.4) and PBS, phosphate buffered
saline, at pH 7.9. The HEPES buffers were purchased from GE Healthcare,
and the PBS (Sigma) pH was adjusted from a pH of 7.4 to 7.9 with NaOH and
HCl. The Tris buffer (BioRad, Philadelphia, PA) was adjusted with HCl to pH
8.0.
Ultraviolet-Visible Spectrometry
A NanoDrop UV-Vis Spectrometer (Thermoscientific, Waltham, MA) was
employed, and the detection was full spectrum (220 to 750 nm). A Sonicor
water bath sonicator (7 gal, Wallingford, CT) was used for sonication of

33
samples. A microwave system (Discover CEM Focused microwave system,
Matthews, NC) was used in order to heat samples. The solvent solutions used
were water for riboflavin, 20% methanol (Sigma) for annatto extract and
acetone (Sigma) for beta-carotene. Bixin (MP biomedicals, LLC, Cat. No.
205371) was also used. Magnesium chloride hexahydrate (Sigma, ACS
reagent) was used to promote binding. All samples were made up in 1.5mL
Eppendorf tubes.
4.1.3 Tobacco RuBisCO Extraction
Tobacco
The tobacco used for this research was a low alkaloid tobacco (Nicotiana
tabacum cv. MD-609LA) provided by the University of Maryland Central
Maryland Research and Education Center in Upper Marlboro, MD. This
tobacco plant contained an average nicotine level of 0.6-0.8 mg/g dry weight
(Fu et al. 2010).
Freezing Tobacco Tissues
The tobacco leaves were minced upon receiving using a cutting board and a
knife. Windex was used to clean the board between batches. A 50mL conical
centrifuge tube with flat standing bottom was used for holding 10mL of plant
tissues, and 10mL total of 100mM Tris-HCl, pH 8.0, 300mM NaCl, and 5mM
MgCl2 (freezing buffer) were added (buffer from Whitney, SM. 2001. The
Plant Cell.). A Polytron was used to break apart the plant tissue. Plant

34
protease inhibitor cocktail (PIC, Sigma P9599) [cytotoxic] was used to help
prevent denaturation of proteins. PIC was added just before use to the buffer
(dilute stock 1:100 into buffer (40mL buffer plus 400µL of PIC)). The buffer
was kept on ice, and 1mL was used for 30g of tissue. Cheese cloth was used to
remove plant tissue from the solubalized protein. A Dewar of liquid nitrogen
was used to freeze the tobacco liquid (Figure 9).
Figure 9: Setup for freezing tobacco extract in liquid nitrogen, details
discussed in section below.
A 60mL luer-lock syringe with a 20 gauge needle was used to drip the tobacco
liquid into the liquid nitrogen in a 50mL flat bottom tube. A spatula was used
to separate the pellets formed, and the liquid nitrogen was stored in a
CryoCooler (Product Number: CG 08-07, OPS Diagnostics, LLC, Lebanan,

35
NJ). A cap from a 50mL tube was poked with 8 to 10 holes using the needle,
in order to expel liquid nitrogen from the tube before final storage (Figure 10).
Figure 10: Example of 50mL tube with holes.
Sample Preparation
The frozen tobacco liquid was ground using a drill, ceramic mortar, and
ceramic pestle attached to drill (CryoGrinderTM
Kit, Product Number: CG 08-
01, OPS Diagnostics, LLC, Lebanan, NJ). A spatula was used to scrape the
inside of the mortar to ensure the formation of a fine powder. Tongs with a
protected end were used for holding anything in liquid nitrogen, especially
supporting the mortar during grinding. The powder formed was stored in a
50mL polystyrene flat bottom tube with cap.
Antibody Paramagnetic Beads
Dynal Dynabeads, M270 Epoxy, paramagnetic beads were used with anti-
RuBisCO antibody (Ab1: anti-Spinach RuBisCO Large subunit mAb, 50ug

36
from COSMOBIO, monoclonal, mouse and Ab2: RbcL, RuBisCO large
subunit, form I and form II (100µg) polyclonal rabbit Anti-RuBisCO,
Agrisera, Vännäs , Sweden).
For the conjugation of the beads, 0.1M sodium phosphate at pH 7.4 (Sigma),
antibody, 3M ammonium sulfate (Sigma), Stripping buffer (Seppro), 10mM
Tris buffer pH 8.8 (Sigma), 10mL dionzied water with 114µL triethylamine
(Sigma) made fresh, PBS (Sigma), and PBS plus 0.5% Triton (Sigma) were
used. The solutions from Dynabeads® Antibody Coupling Kit, Cat. No.
143.11D, Rev 100 (C1, C2, HB, LB, and SB) were also used to create
antibody coated beads.
To prepare the tobacco RuBisCO powder extraction buffer with 100mM Tris
pH 8.0 (Sigma), 100mM NaCl (Sigma), 0.1% Triton (100X, Sigma), and
0.5mL PIC (EDTA-free, 100X, Thermo Scientific) was added. There were
two different extraction buffers used (Table 2).
Table 2: Comparison of extraction buffers for tobacco protein extraction
optimization.
Materials Extraction Buffer A Extraction Buffer B
Tris 100mM, pH 8.0 100mM, pH 8.0
NaCl 100mM 500mM
Triton 0.1% 0.5%
PIC 0.1mL 0.1mL
pH Adjusted to 7.9 Adjusted to 7.9

37
The standard RuBisCO was used as 1mg/mL in PBS adjusted to pH 7.9 with
HCl and NaOH. For the RuBisCO extraction and binding to the beads, the
dilution, stripping, and neutralization buffer was from the GenWay, Inc. (San
Diego, CA) SEPPRO extraction protocol. To prevent nonspecific binding the
beads may be washed with 0.01M PBS (Sigma) + 0.05% Tween 20 (Sigma).
For samples run on SDS-PAGE, samples were placed in LDS Loading Buffer
(4X, Invitrogen NUPAGE ®). Reducing agent, Dithiothreitol (DTT), was also
used to prepare samples (10X, Invitrogen NUPAGE ®). Methanol
precipitation was used to determine if protein is present and used 100%
methanol (Sigma) and 90% methanol (Sigma).
SDS-PAGE
The NuPAGE® MES or MOPS buffer (Invitrogen) was made up with 475mL
of distilled water plus 25mL of NuPAGE® MES of MOPS at 10 X. From this
solution 50mL were reserved and 500µL of NuPAGE® antioxidant were
added. The running gels used were NUPAGE 10% Bis-Tris gel (1.0mm X
10well) (Invitrogen) and NUPAGE 4-12% Bis-Tris gel (1.0mm X 12well)
(Invitrogen). A microwave (Discover CEM Focused microwave system) was
used to denature samples at 90°C for 10 minutes. For samples from the pellet
of the tobacco extract, centrifugation at 16000×g for 2 minutes was
performed. The molecular weight standard used was SeeBlue® plus 2 pre-
stained standard (1X, Invitrogen, Carlsbad, CA). A total of 20µL of each
sample was added to each well. The gel was placed in a XCell Surelock
38
Eletrophoresis cell, and the voltage was run at 200V with a programmed
method (Fisher Scientific FB1000 power source).
Western Blot
The wash buffer contains 45mL of distilled water plus 5mL of Fast Western
10 X Wash Buffer (Thermo Scientific). The primary antibody was made of
10mL of Fast Western Antibody Diluent (Thermo Scientific) or 10mL of milk
solution with 10µL of antibody for RuBisCO at 1mg/mL (1:1000) regardless
of the antibody used. The milk solution was made of 5g of instant nonfat dry
milk in 75mL of MilliQ water with 10mL of TBS-T (Tris buffered saline
solution with Tween 20, pH 8.0, Sigma, T-9039). The secondary antibody was
9mL of Fast Western Antibody Diluent (Thermo Scientific) plus 1mL mouse
or rabbit optimized HRP reagent, PICO (Thermo Scientific). The exposure
solution was made of Super Signal West PICO Stable Peroxide Solution
(Thermo Scientific) and Super Signal West PCIO Luminol/enhancer Solution
(Thermo Scientific) at a ratio of 50/50 to a total of 10mL. The Invitrogen iBlot
with iBlot gel transfer PVDF, mini was used to transfer the gel to the
membrane.
Silver Stain
The silver staining was conducted using the Pierce Silver Stain Kit available
through Thermo Scientific. The fixing solution was made up of 30% ethanol
with 10% acetic acid in MilliQ water. The ethanol wash contained 10%
39
ethanol in MilliQ water. MilliQ water was used to rinse the gel in between
washes. The solutions used include SilverSNAP® Sensitizer, Enhancer, Stain,
and Developer. The sensitizer working solution was made up of 50µL
Sensitizer with 25mL of water. The stain solution was made up of 0.25mL
enhancer with 25mL stain. The working developing solution was 0.25mL
enhancer with 25mL developer. The stop solution was 5% acetic acid in
water.
4.2 Methods
4.2.1 Evaluation of Binding
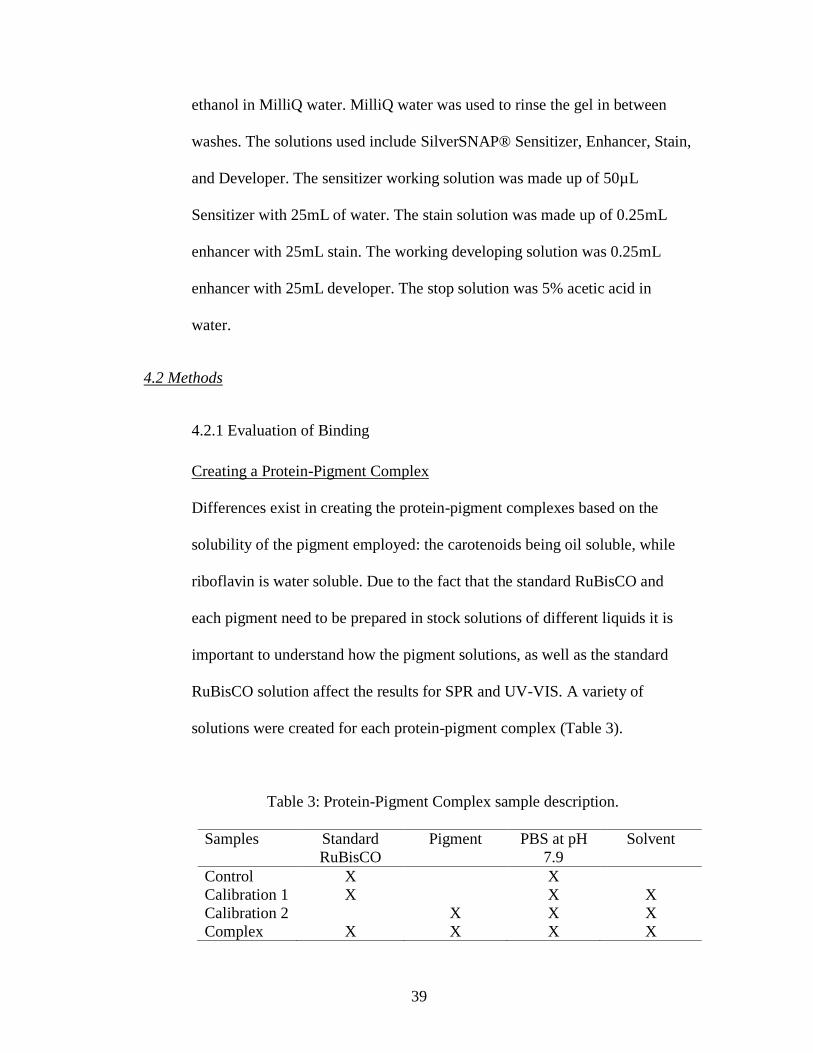
Creating a Protein-Pigment Complex
Differences exist in creating the protein-pigment complexes based on the
solubility of the pigment employed: the carotenoids being oil soluble, while
riboflavin is water soluble. Due to the fact that the standard RuBisCO and
each pigment need to be prepared in stock solutions of different liquids it is
important to understand how the pigment solutions, as well as the standard
RuBisCO solution affect the results for SPR and UV-VIS. A variety of
solutions were created for each protein-pigment complex (Table 3).
Table 3: Protein-Pigment Complex sample description.
Samples Standard
RuBisCO
Pigment PBS at pH
7.9
Solvent
Control X X
Calibration 1 X X X
Calibration 2 X X X
Complex X X X X
40
The control contained standard RuBisCO in the PBS at pH of 7.9. The first
calibration was half standard RuBisCO in PBS at pH 7.9 and half solubalizing
solution (MilliQ water, 20% methanol, or acetone) depending on the pigment
used. The second calibration was half the pigment in solubalizing solution and
half PBS at pH 7.9. The complex contained half RuBisCO in PBS at pH 7.9
with half pigment in its solubalizing solution. The samples in both PBS at pH
of 7.9 and the solubalizing solutions from here on will be described as the
solvent solution (calibrations 1, 2, and complex). All of the concentrations of
protein to pigment were made at a molar ratio of 1:100 to allow for excessive
pigments being available to bind to the large RuBisCO protein molecule. The
solutions were made in a total of 1mL final volume from stock solutions of
established concentrations based on the final molarity needed for each sample
and pigment. The solvent solution also varied depending on which pigment
was used.
Raman Spectroscopy
All spectra obtained for riboflavin, annatto extract, and beta-carotene followed
the instrument setup shown in Table 4.
41
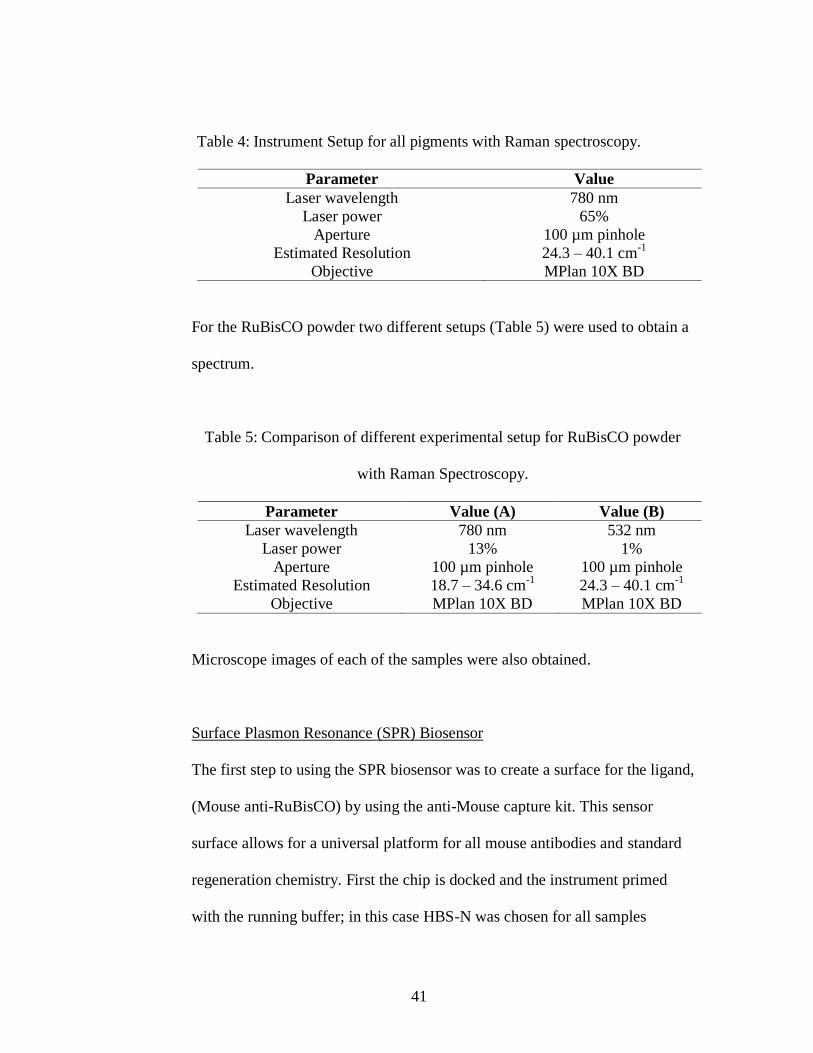
Table 4: Instrument Setup for all pigments with Raman spectroscopy.
Parameter Value
Laser wavelength 780 nm
Laser power 65%
Aperture 100 µm pinhole
Estimated Resolution 24.3 – 40.1 cm-1
Objective MPlan 10X BD
For the RuBisCO powder two different setups (Table 5) were used to obtain a
spectrum.
Table 5: Comparison of different experimental setup for RuBisCO powder
with Raman Spectroscopy.
Parameter Value (A) Value (B)
Laser wavelength 780 nm 532 nm
Laser power 13% 1%
Aperture 100 µm pinhole 100 µm pinhole
Estimated Resolution 18.7 – 34.6 cm-1
24.3 – 40.1 cm-1
Objective MPlan 10X BD MPlan 10X BD
Microscope images of each of the samples were also obtained.
Surface Plasmon Resonance (SPR) Biosensor
The first step to using the SPR biosensor was to create a surface for the ligand,
(Mouse anti-RuBisCO) by using the anti-Mouse capture kit. This sensor
surface allows for a universal platform for all mouse antibodies and standard
regeneration chemistry. First the chip is docked and the instrument primed
with the running buffer; in this case HBS-N was chosen for all samples

42
because it was most compatible with RuBisCO samples. Next, the instrument
was normalized using the standard protocol provided by the vendor. In order
to create the anti-Mouse surface, the standard Biacore procedure was followed
for amine coupling, anti-Mouse conjugation, ethanolamine blocking, and
glycine pH 1.7 chip conditioning. The flow rate of 10µL/min was used with
each step being performed for seven minutes. Flow cell 1 was set as a
reference surface (no anti-Mouse) while flow cell 2 was coupled with the anti-
Mouse IgG.
The next step was to check for any non-specific binding (NSB) to make sure
that the anti-RuBisCO did not bind to the reference surface and was only
bound specifically to the anti-Mouse capture sites. In these experiments, NSB
was not seen for the RuBisCO antibody or the RuBisCO samples. Next, 150-
300 Response Units (RU) of the anti-RuBisCO was captured on the anti-
Mouse platform, and it was verified that the surface can be regenerated using
10 mM glycine-HCl at pH 1.7. During these experiments the reference
channel was not exposed to the anti-RuBisCO. One mL of each 1µg/mL of
anti-RuBisCO in the running buffer and glycine was placed into the reagent
rack, and the flow rate was set to 10µL/min. The procedure began with short
time injections of the anti-RuBisCO (12 seconds) in order to determine the
rate of binding, and thus the level needed to reach 150-300 RU. The time was
increased if the target RU was not obtained, and the values were recorded
43
until the target value was reached. If the target level was overshot then the
surface was regenerated and the studies performed again.
Once the capture time was determined, and the glycine regenerated the surface
back to a stable baseline, surface ligand activity was measured. For these
experiments, the anti-RuBisCO surface is exposed to standard RuBisCO
protein and binding was evaluated. A Wizard was created using the Biacore
software. Three major steps were involved: capture, sample, and regeneration.
This was conducted over flow cells 1 and 2, again with flow cell 1 as a
reference channel. The ligand (anti-RuBisCO) capture had a contact time of
20 seconds with a flow rate of 10µL/min and a stabilization period of 60
seconds. The sample (standard RuBisCO in PBS at pH 7.9) had a contact time
of 120 seconds with a flow rate of 30µL/min and a stabilization period of 180
seconds. The regeneration (glycine HCl with a pH of 1.7) had a contact time
of 180 seconds with a flow rate of 20µL/min and a stabilization period of zero
seconds. The analysis temperature and sample compartment temperature were
both at 25°C. If the chip had not been used recently it was important to prime
the system following standard protocols. The concentrations run for the
standard RuBisCO in PBS at pH 7.9 were in the following order: 0.0, 0.005,
0.01, 0.05, 0.1, 0.5, 1, 0.05, and 0.0mg/mL.
The Method for each pigment was created using the Biacore software. All
trials were completed with the pigments after they had been added to protein

44
in solution. It is important to note that the beta-carotene was not run with SPR
because there were no solvents to dissolve this pigment that are compatible
with the instrument fluidics. The first method was for riboflavin. The assay
steps included the samples listed in Table 3. For each of these four samples
there were three steps: capture, sample, and regeneration. The contact time for
the capture solution (anti-RuBisCO) was 90 seconds with a flow rate of
10µL/min followed by a stabilization period of 30 seconds. This was only
over flow cell 2 as flow cell 1 remained as a reference channel. Next was the
sample where the solutions listed in Table 3 were run over the chip with a
contact time 180 seconds at 10µL/min and a dissociation time of 300 seconds.
The sample step was run over both flow cells 1 and 2. The final step was
regeneration with glycine HCl at a pH of 1.7 with a contact time of 180
seconds at a flow rate of 10µL/min again over both flow cells. There was a
stabilization period for regeneration of 20 seconds. The analysis temperature
and sample compartment temperature were both at 25°C. The concentrations
of standard RuBisCO for each step were 0.5, 0.1, 0.05, and 0.0mg/mL, while
the concentrations of riboflavin were 0.034, 0.0068, 0.0034, and 0.0mg/mL in
order to reach the mole ratio of 1:100 (protein:pigment).
The second method created was for the annatto extract. The assay steps were
the same as the riboflavin method with the only difference being the use of
annatto extract for pigment with its given solubalizing solution, 20%
methanol, and concentrations of 0.035, 0.007, 0.0035, and 0.0mg/mL.
45
The final step was to evaluate the kinetics using various concentrations of the
standard RuBisCO and pigments with the Kinetics/Affinity assay.
Ultraviolet-visible Spectrometry
All of the solutions shown in Table 3 were evaluated by UV-Vis spectrometry
to determine if spectral shifts were observed, indicating protein-pigment
complex formation. The NanoDrop was used to obtain spectra and 2µL of
each sample were added. Deionized water was needed to clean and initiate the
instrument. Blanks were used, based on the solution used (Table 3) to
establish a zero reading for the baseline. Each of the pigments was made in
the following solutions: riboflavin in water, beta-carotene in acetone, and
annatto extract in 20% methanol (as described in Table 3).
Further studies were completed with riboflavin to evaluate if sonication or
heating and freeze thaw cycles could facilitate binding of the pigments to the
protein. All three of the pigments were later tested with heating and freeze
thaw. The riboflavin solutions (Table 3) were sonicated for 10 minutes in a
water bath sonicator, vortexed, and then sonicated again for 10 minutes.
Samples were then measured with the NanoDrop. The heating of the sample
was done at 100°C for one minute with just the standard RuBisCO and then
the pigment was added, here only riboflavin, and again heated for one minute
(100°C). Then the samples went through two freeze thaw cycles, following
the methods of Paulson et al. (1990). The samples were frozen for 20 minutes
46
at -40°C and thawed for 20 minutes, with vortexing in between to ensure
mixing. Repeatedly freezing and thawing of pigments with lipid-extracted
proteins in lithium dodecyl sulfate resulted in the formation of a protein-
pigment complex that is similar to that found in plants, but it is unclear how
the binding occurs and what factors need to be present to promote binding
(Paulsen et al., 1990) and if this method will promote formation or protein
pigment complexes between RuBisCO and the pigments chosen here.
All of the pigments were then tested under heating and freeze thaw cycles
with UV-Vis as a final study. For this portion, the pigments were added
directly to the standard RuBisCO in PBS at pH 7.9 (1mg/mL, stock). The goal
was to overcome solubility issues with heating and freeze thaw cycles, so the
pigments were not previously dissolved in solution and instead were directly
added to RuBisCO in solution. Table 6 shows the variety of solutions used.
MgCl2 was also added to each pigment in order to possibly promote binding
since Mg2+
is needed in order to activate RuBisCO in plants (Reinhard and
Höcker, 2005).
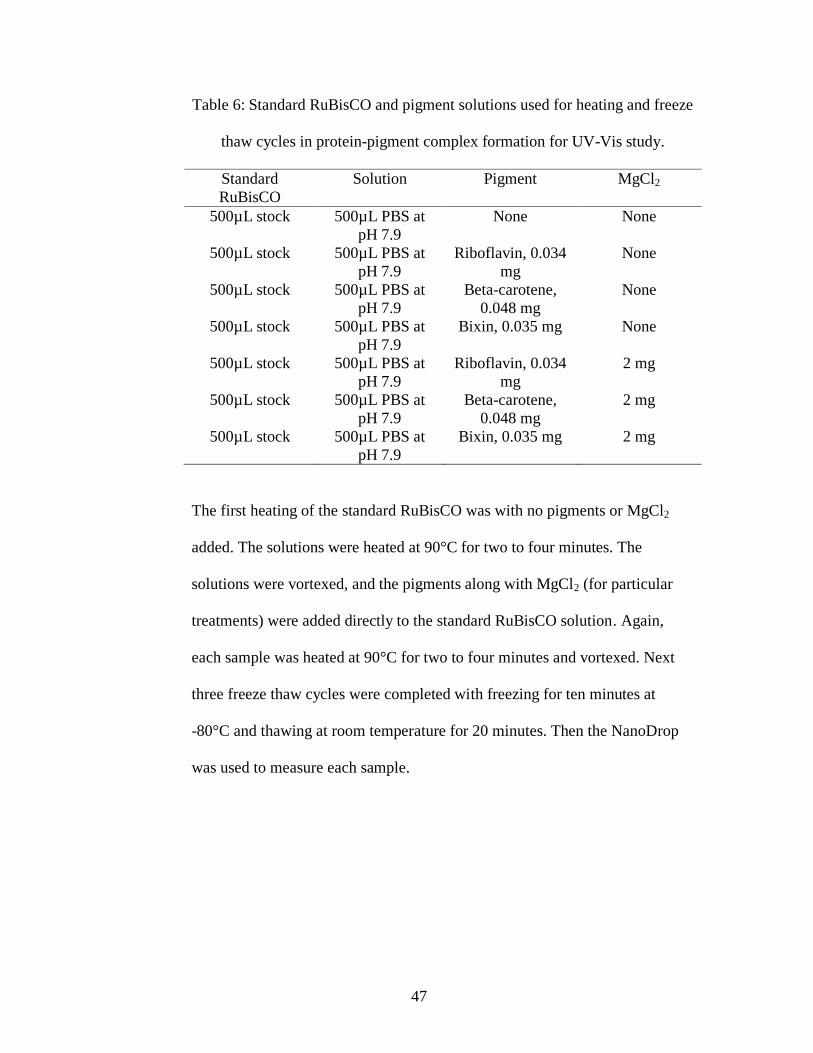
47
Table 6: Standard RuBisCO and pigment solutions used for heating and freeze
thaw cycles in protein-pigment complex formation for UV-Vis study.
Standard
RuBisCO
Solution Pigment MgCl2
500µL stock 500µL PBS at
pH 7.9
None None
500µL stock 500µL PBS at
pH 7.9
Riboflavin, 0.034
mg
None
500µL stock 500µL PBS at
pH 7.9
Beta-carotene,
0.048 mg
None
500µL stock 500µL PBS at
pH 7.9
Bixin, 0.035 mg None
500µL stock 500µL PBS at
pH 7.9
Riboflavin, 0.034
mg
2 mg
500µL stock 500µL PBS at
pH 7.9
Beta-carotene,
0.048 mg
2 mg
500µL stock 500µL PBS at
pH 7.9
Bixin, 0.035 mg 2 mg
The first heating of the standard RuBisCO was with no pigments or MgCl2
added. The solutions were heated at 90°C for two to four minutes. The
solutions were vortexed, and the pigments along with MgCl2 (for particular
treatments) were added directly to the standard RuBisCO solution. Again,
each sample was heated at 90°C for two to four minutes and vortexed. Next
three freeze thaw cycles were completed with freezing for ten minutes at
-80°C and thawing at room temperature for 20 minutes. Then the NanoDrop
was used to measure each sample.

48
4.2.2 Extraction
Freezing Tobacco Tissues
Approximately 10g of finely minced tobacco leaves was placed into a 50mL
centrifuge tube and 10mL of freezing buffer with PIC was added. All samples
were kept on ice throughout processing. The tissue was homogenized with
buffer using a Polytron (Kinematic AG, system Polytron ® PT-K/PT-G,
dispersing aggregate ø 12 mm, coupling type A, 9110024, PT A 10S) to break
down cell walls, until the sample reached a soupy texture. Next, a labeled
centrifuge tube was secured with a Styrofoam rack in an insulated container,
and then liquid nitrogen was poured into the container.
The minced tobacco tissue in buffer was filtered with cheese cloth, and the left
over tissue was saved in a labeled tube. Next, the filtered liquid was
transferred into a chilled 50mL centrifuge tube with syringe needle attached
(See Figure 10 for set up). The tobacco juice was allowed to drip into the
liquid nitrogen filled centrifuge tube. If drops slowed down, a higher gauge
needle was used. It was important to make sure that the tobacco juice did not
clump together in large beads, but rather formed 0.5 – 1.0 cm diameter pellets,
so that the pellets can later fit into the mortar and be ground down into a
powder. The liquid nitrogen in the centrifuge tube was refilled as necessary.
Once the tube was filled with pellets, the tube was carefully removed from
liquid nitrogen and capped off with the ventilated cap (Figure 10). The tube

49
was inverted to expel liquid nitrogen, then recapped with a non-ventilated cap
before immediate storage of the pellets at -80°C (Figure 11).
Figure 11: Final Tobacco Extract Pellets to be stored at -80°C.
4.2.3 Purification of Protein
Sample Preparation
Liquid nitrogen was poured into the Cryo Cooler container at a level just
below the top of the mortar. It was critical to ensure that everything was cold
at all times to avoid liquefaction of the frozen pellets and maintain formation
of a powder; therefore all supplies were placed in liquid nitrogen. The pellets
of previously extracted tobacco tissue were taken out and 1 or 2 pellets were
placed into the mortar. Tongs were used to hold the mortar in place. The pellet

50
was ground with the pestle attached to a drill for approximately 30 seconds,
and the pestle was placed back into liquid nitrogen (Figure 12).
Figure 12: Setup for grinding of tobacco pellets into fine powder for further
use in extraction.
By using a spatula, the inside of the mortar was scraped to loosen the powder
formed. The grinding and scraping were repeated two more times to create a
well homogenized powder. The powder was stored in a 50mL polystyrene
tube filled with liquid nitrogen at all times. The grinding process continued
until about 20mL of powder had been formed. Again, liquid nitrogen was
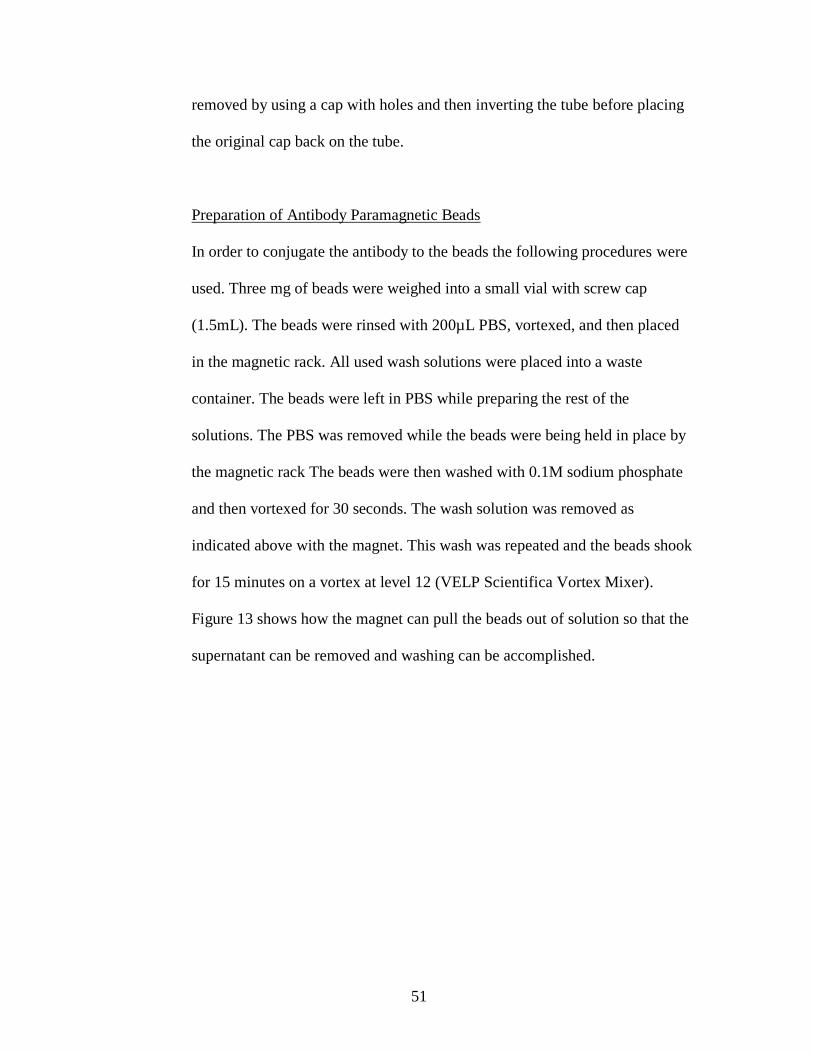
51
removed by using a cap with holes and then inverting the tube before placing
the original cap back on the tube.
Preparation of Antibody Paramagnetic Beads
In order to conjugate the antibody to the beads the following procedures were
used. Three mg of beads were weighed into a small vial with screw cap
(1.5mL). The beads were rinsed with 200µL PBS, vortexed, and then placed
in the magnetic rack. All used wash solutions were placed into a waste
container. The beads were left in PBS while preparing the rest of the
solutions. The PBS was removed while the beads were being held in place by
the magnetic rack The beads were then washed with 0.1M sodium phosphate
and then vortexed for 30 seconds. The wash solution was removed as
indicated above with the magnet. This wash was repeated and the beads shook
for 15 minutes on a vortex at level 12 (VELP Scientifica Vortex Mixer).
Figure 13 shows how the magnet can pull the beads out of solution so that the
supernatant can be removed and washing can be accomplished.
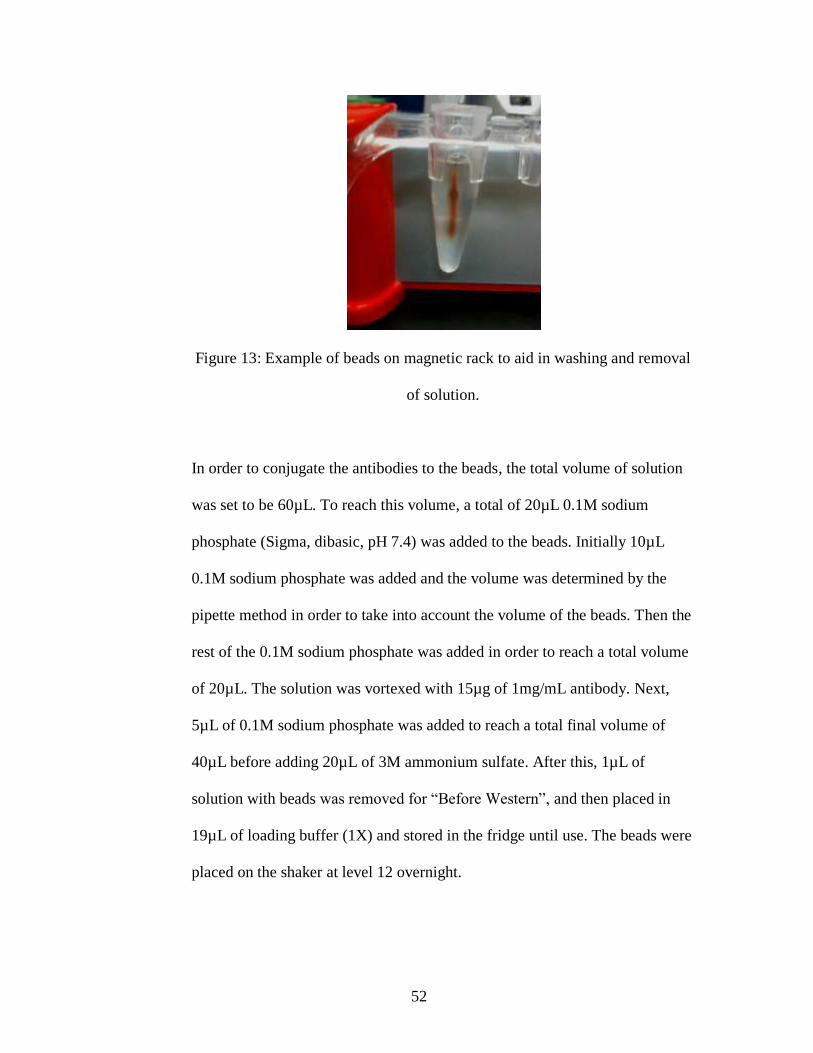
52
Figure 13: Example of beads on magnetic rack to aid in washing and removal
of solution.
In order to conjugate the antibodies to the beads, the total volume of solution
was set to be 60µL. To reach this volume, a total of 20µL 0.1M sodium
phosphate (Sigma, dibasic, pH 7.4) was added to the beads. Initially 10µL
0.1M sodium phosphate was added and the volume was determined by the
pipette method in order to take into account the volume of the beads. Then the
rest of the 0.1M sodium phosphate was added in order to reach a total volume
of 20µL. The solution was vortexed with 15µg of 1mg/mL antibody. Next,
5µL of 0.1M sodium phosphate was added to reach a total final volume of
40µL before adding 20µL of 3M ammonium sulfate. After this, 1µL of
solution with beads was removed for “Before Western”, and then placed in
19µL of loading buffer (1X) and stored in the fridge until use. The beads were
placed on the shaker at level 12 overnight.

53
The supernatant was removed with the magnetic rack and washing method.
The beads were washed with 200µL of the stripping solution (gylcine at pH
2.5), which was removed as quickly as possible in order to reduce the
possibility of denaturing the protein due to the low pH. Then 200µL 10mM
Tris at pH 8.8 was used to wash the beads and vortexed before removing the
solution. Next 200µL of the triethylamine was used to wash the beads. Then
the beads were washed four times with 200µL of PBS buffer followed by one
wash with 200µL of PBS plus 0.5% Triton to reduce non-specific binding.
The beads were shook again for 15 minutes at setting 12 before being rinsed
with 200µL PBS. The actual volume was measured by pipette method and
recorded. For this extraction a concentration of 1000µg/µL beads and the
appropriate volume of PBS were used to achieve this concentration. One µL
of “After Western” was removed and placed in 19µL of loading buffer (1X)
for SDS-PAGE. Both the “After Western” and the beads were stored in 30µL
of PBS in the refrigerator until use.
The second method to conjugate the antibody to beads was to use the
Dynabeads® Antibody Coupling Kit. On the first day 100µL of beads (3mg)
were taken out and washed once with 1mL of C1. The tube was placed on the
magnetic rack and the beads allowed to collect so that the supernatant could
be easily removed. Then 140µL C1 was added with 10µL of antibody and the
solutions mixed by pipetting. Next, C2 (150µL) was added to reach a total
volume of 300µL. The solution was incubated overnight at 37°C while

54
mixing. On day two the tube was placed on a magnetic rack and the beads
allowed to collect. The supernatant was removed and washed with 800µL
each of HB, LB, and SB. Incubation in SB was conducted for 15 minutes at
room temperature and then the solution removed and stored under
refrigeration in 300µL of SB for a final amount of 10mg/mL of beads coupled
to antibody.
Antibody Paramagnetic Beads with Protein Extraction
The initial trials with the antibody coated beads used standard RuBisCO (95%
purity, Sigma). Fifty µL of extraction buffer with 10µg of 1mg/mL standard
RuBisCO in PBS was added to the beads. The appropriate volume of beads
for 1000µg/µL was placed in a new tube. The beads were resuspended in
50µL of standard RuBisCO in extraction buffer. Then 1µL of beads with
RuBisCO were taken out for “Before Western RuBisCO” and put in 19µL of
loading buffer (1X), and stored in the refrigerator until use. Incubation at
room temperature was conducted while shaking at setting 12 for 15 minutes.
The beads were washed with 50µL of dilution buffer four times with the
magnetic rack as well as with one wash of 0.01 M PBS + 0.05% Tween 20 in
between each dilution buffer rinse to reduce non-specific binding. For
standard RuBisCO samples, 20µL of loading buffer (1X) was added for SDS-
PAGE.

55
Two different extraction buffers (Table 2) were used with the tobacco powder
to optimize the protocol of extraction with beads. Five mL of extraction
buffers were added to tobacco RuBisCO powder (1g) and the extraction
samples were homogenized with the Polytron on ice, at setting five for five
minutes at one minute intervals. Centrifugation was conducted at 9,500 RPM
for 30 minutes at 4°C. The pellet was stored in LDS loading buffer (1X) to be
run on the gel. This was completed for each pellet from buffers A and B. To
the supernatant for both A and B, the determined amount of beads was added
after conjugation (1000 µg/µL). The supernatant was incubated for 15 minutes
on a 50mL tube rotator. The beads were transferred with supernatant to
smaller Eppendorf tubes that can be used on the magnetic rack and washed
with 200µL of dilution buffer, followed by a 0.01M PBS + 0.05% Tween 20
wash. This procedure was repeated four times. To run on the gel, 20µL of
loading buffer (1X) to dry final beads (this will be supernatant “After A and
After B”) was added. A control of standard RuBisCO was also used. The
stock was made up at 1mg/mL PBS at pH 7.9. Then 0.5µL with 20µL of
loading buffer (1X) were added and run with 1µL of stock in 19µL of loading
buffer (1X).
After initial trials with standard RuBisCO and extraction buffers the protocol
was optimized and methanol precipitation was used to understand how much
protein was present so that RuBisCO could be successfully and efficiently
extracted from the tobacco leaves. The final procedure used 10mL of

56
extraction buffer plus the ground tobacco powder (1g) in a 50mL centrifuge
tube (on ice). Both extraction buffer A and B were used to provide two
different samples. Each mixture was homogenized with the Polytron, to break
up the plant components further and release the protein (six to seven setting
for five minutes at one minute intervals on ice). Then the samples were
centrifuged at 4,700 RPM for 30 minutes at 4°C. The supernatant was
removed and 40mL of methanol were added, followed by centrifugation at
4,700 RPM for one hour at 4°C. The pellets from the original spin were saved
and stored in 1mL of loading buffer (1X) in the refrigerator for further use.
After the second spin the supernatant was removed and 5mL of 90% methanol
were added to each pellet, and the mixture was vortexed. The samples were
again centrifuged at 4,700 RPM for 30 minutes at 4°C. The supernatant was
decanted and the final pellet was stored in 1mL of loading buffer (1X). The
final pellet was called either supernatant A or B since it began as the
supernatant after the initial spin before methanol extract. In order to run the
pellet from the original spin and the supernatant after methanol precipitation
that were stored in 1mL of loading buffer (1X), 10µL of the pellet or
supernatant in loading buffer were added to 10µL of loading buffer (1X) to
create a final volume of 20µL. The stock standard RuBisCO was run with the
supernatant and pellet samples. For standard RuBisCO 1µL of stock (standard
RuBisCO at 1mg/mL in PBS at pH 7.9) in 19µL of loading buffer (1X) was
prepared. The results from this methanol precipitation with the pellet and
57
supernatant for extraction buffers A and B were developed with Ponceau
stain.
Standard RuBisCO was created as a final stock solution in loading buffer to
be used for further experiments: 30µL of stock (standard RuBisCO at 1mg/mL
in PBS at pH 7.9) plus 570µL of loading buffer (4X) and stored at - 40°C. The
supernatant from extraction buffer B, Polytroned at level 6 to7 and
centrifuged, was also stored in aliquots for further use.
Next, the supernatant from extraction buffer B was compared to methanol
precipitation of supernatant with dilutions. The stored supernatant (15µL) was
added to loading buffer (4X, 5µL) to prepare for the gel run. The final stock
solution of standard RuBisCO in loading buffer was used, and the supernatant
was run through the methanol precipitation procedure as described previously,
this time starting with only 500µL of supernatant. The final pellet was
resuspended in 100µL of loading buffer (1X) and dilutions were created
starting at 20µL serially to 1µL of resuspended pellet in 19µL of loading
buffer (1X) with a total volume always of 20µL.
The final selected antibody, RbcL, anti-rabbit polyclonal (Agrisera) needed to
be confirmed for specificity to the tobacco RuBisCO. In order for this to be
accomplished the standard RuBisCO final stock solution in loading buffer was
compared to dilutions of the supernatant (previously homogenized and
58
centrifuged) with reducing agent added to help promote migration. The
dilutions were used to establish the correct amount of supernatant to not
overload lanes. The reducing agent was 10X, so 2µL were needed for each
total 20µL loading sample.
The final step was to incubate the supernatant with the conjugated beads. For
this 1mL of supernatant (previously homogenized and centrifuged) was
incubated with 25µL of beads at 10mg/mL RbcL anti-rabbit polyclonal
antibody for RuBisCO for 30 minutes while shaking at level 12 (VELP
Scientifica Vortex Mixer). Next, the supernatant was removed (saved and run
on gel at 10µL with 10µL loading buffer, 1X), and the beads were washed
three times with 1mL of 0.01 M PBS with 0.05% Tween 20 to reduce
nonspecific binding. To the final beads, 50µL of loading buffer (1X) was
added in order to run on the gel at dilutions.
The beads were interrogated to ensure the antibody was conjugated to the
surface. This was completed by comparing three different sets of beads. The
first was 500µL of supernatant, previously homogenized and centrifuged,
incubated with 25µL of beads at 10mg/mL (RbcL, anti-rabbit polyclonal for
RuBisCO). The second bead set was 500µL of PBS at pH 7.9 with 25µL of
beads at 10mg/mL (RbcL, anti-rabbit, polyclonal for RuBisCO). The final set
was again 500µL of PBS at pH 7.9, but this time with 25µL of beads that had
not been conjugated. All were incubated for 30 minutes while shaking on

59
setting 12 (VELP Scientifica Vortex Mixer). Each set of beads were washed
three times with 1mL of 0.01M PBS with 0.05% Tween 20 to reduce
nonspecific binding. The final beads were prepared in 23µL of loading buffer
(1X) with 2µL of reducing agent.
After confirmation of bead conjugation, the final samples to be run in several
sets were the standard RuBisCO, the beads with and without conjugation and
incubation in supernatant, along with supernatant dilutions. For this the beads
sets mentioned above were used but instead of a final volume of 23µL of
loading buffer (1X) the beads were placed in 6.25µL of loading buffer (4X)
with 2.5µL reducing agent and 16.25µL of water. The standard RuBisCO had
reducing agent added with a final volume of 20µL. Supernatant with no
dilutions was run with 5µL of supernatant and 5µL loading buffer (4X) with
2µL reducing agent and 8µL water. The dilutions created were 1:10, 1:100,
and 1:1000 in PBS at pH 7.9 and then the same amount of each was used to
create the running solution in loading buffer as listed for supernatant with no
dilutions.
SDS-PAGE
The purpose of SDS-PAGE was to separate out proteins based on size and
charge. This process was completed using NuPAGE Novex Tris-Acetate Mini
Gels system. First the samples were prepared with NuPage LDS Sample
Buffer, Tris-Glycine Native Sample Buffer and deionized water. The total

60
volume for these amounts can be found in the NuPage Novex Instructions and
should have a total volume of 20µL. Next the sample with buffers was heated
at 90°C for ten minutes. A hard spin was added for final trials at 16,000×g for
2 minutes. The 1X running buffer was then prepared by adding 50mL 20X
NuPage Tris-Acetate SDS Running Buffer to 950mL deionized water. The
sample was then loaded onto the gel, and the upper and lower buffer chambers
were filled with the 1X running buffer. The protocol used a programmed
method for approximately 30 minutes. It was also important to include a
ladder with standard protein sizes to measure and find the protein of interest,
in this case RuBisCO at 56 kDa.
Western Blot
The procedures from the Fast Western Kit were followed (iBlot). First the
wash buffer was prepared so that it was available when the membrane was
complete done. The filter paper was placed in distilled water to soak. The
bottom attachment was placed in the iBlot, then gel with filter paper on top.
The top portion was added and all air was removed with a roller before the
sponge was placed in the lid. The lid was closed to the iBlot, and the 6 minute
transfer started. Once the transfer was done the membrane was quickly
removed and placed into the wash buffer. The membrane was then placed into
the primary antibody solution and shook for 30 minutes. Next, the membrane
was rinsed in the wash solution and then placed into the secondary antibody
solution for 10 minutes. It was rinsed again with the wash solution and finally
61
put into the exposure solution. The image was acquired using the Kodak
Image Station 2000R (Carestream Health, Inc., Rochester, NY) and
Carestream MI image software (Carestream Health, Inc., Rochester, NY).
Silver Stain
For silver staining, the gel was washed for five minutes with MilliQ water
after SDS-PAGE. The gel was washed for another five minutes after replacing
the water. Next, the water was decanted before adding the fixing solution. The
gel was incubated in this solution for 15 minutes at room temperature. The
fixing solution was replaced and again the gel incubated in new fixing
solution for 15 minutes. The gel was then washed twice with ethanol for five
minutes. The next step was to rinse the gel in ultrapure water for five minutes
(2x). Just before use, the sensitizer working solution, which is 1 part
SilverSNAP® Sensitizer with 500 parts ultrapure water, was prepared.
Incubation of the gel in sensitizer working solution for exactly one minute was
conducted before it was washed with two changes of ultrapure water for one
minute each. Next, incubation for five minutes in one part SilverSNAP®
Enhance with 100 parts SilverSNAP® Stain was performed. The developer
working solution was created with one part SilverSNAP® Enhancer and 100
parts SilverSNAP® Developer. The gel was washed with two changes of
ultrapure water for 20 seconds after the gel had been in the stain for five
minutes. Then the developer working solution was immediately added and the
gel was incubated until protein bands appeared (approximately 2-3 minutes).

62
When the necessary band intensity was reached, the stop solution was added
before obtaining the gel image.

63
Chapter 5: Results and Discussion
Overall, the scope of this project encompassed two aspects, the first being the
possibility of binding the chosen pigments to a RuBisCO standard; the second
creating an efficient extraction and purification of RuBisCO from tobacco
leaves using paramagnetic antibody coated beads. Both objectives were
developed in order to promote the use of alternative products of the tobacco
crop. The research on binding used a RuBisCO standard instead of tobacco-
isolated RuBisCO due to several challenges in optimizing the extraction and
purification steps which overlapped with the binding studies. The results of
each aspect of the project are discussed in full below.
5.1 Binding Effectiveness
5.1.1 Raman Spectroscopy
While it was initially anticipated that Raman spectroscopy would provide
useful and relevant data for evaluating whether pigment binding had occurred,
it was seen that the standard RuBisCO powder sample was too fluorescent to
provide useful information, meaning no identifying peaks are measured. The
fluorescence of the standard RuBisCO powder was seen as a large sweeping
arch (Figure 14).

64
Figure 14: RuBisCO spectrum with no baseline adjustment and an exposure
time of 1 second with 3 total exposures and following experiment setup seen
in Table 5, value A (780nm).
While Raman spectroscopy could potentially be used to understand if there
were any peak shifts or the development of new peaks due to binding as
compared to original peaks of pigments and RuBisCO, the fact that the
RuBisCO spectrum does not offer information means that Raman cannot be
used to understand binding. The fluorescence overwhelmed any Raman bands
that could be seen in the RuBisCO sample. However, the spectra of the
individual pigments were measured with ease and compared well to literature.
An image using the Raman microscope was taken of each sample (Figures 15
through 18). These images show the various color of each sample. While all

65
three pigments offer yellow to orange color in solution and food products,
they are very different in powder and liquid forms. Beta-carotene is a reddish
color in powder form, while riboflavin is most similar to the color it produces
in solution. The annatto extract, in liquid form, dried on the slide, and as a
result shows cracking and little color. The RuBisCO powder is crystalline and
not as dense as the pigment powders.
Figure 15: Riboflavin image, Raman microscope (10X, light field).
Figure 16: Beta carotene image, Raman microscope (10X, light field).
Figure 17: Annatto Extract image, Raman microscope (10X, light field).
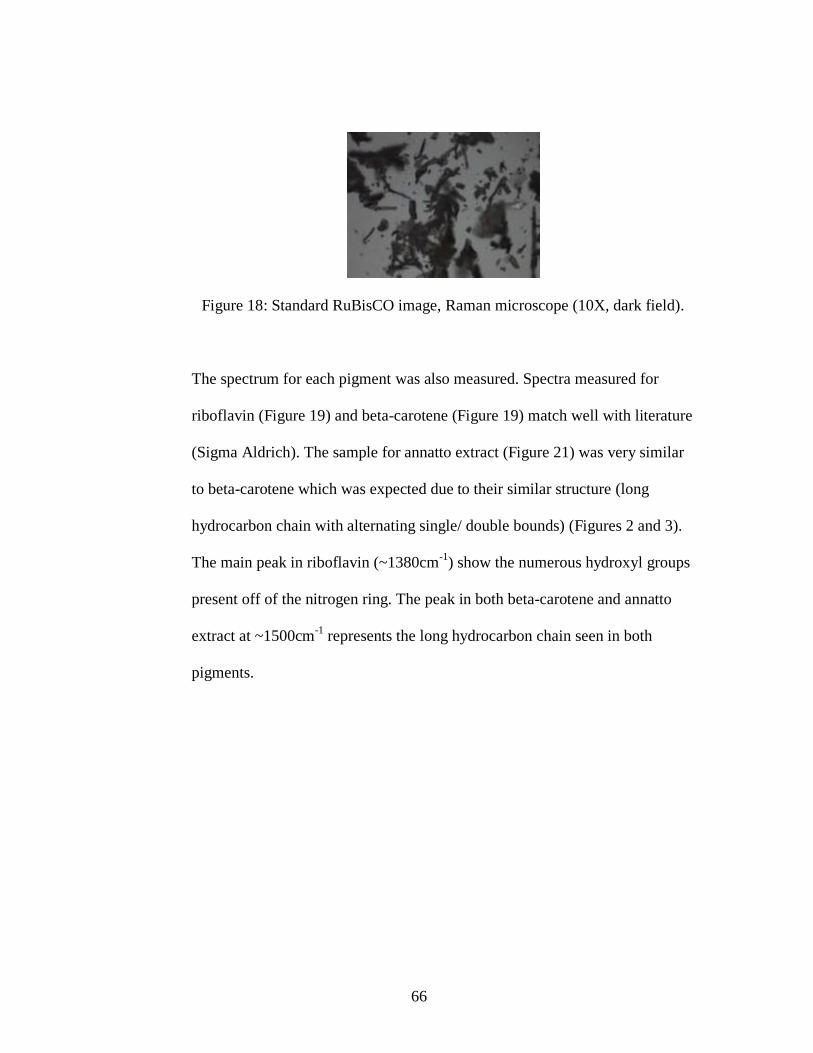
66
Figure 18: Standard RuBisCO image, Raman microscope (10X, dark field).
The spectrum for each pigment was also measured. Spectra measured for
riboflavin (Figure 19) and beta-carotene (Figure 19) match well with literature
(Sigma Aldrich). The sample for annatto extract (Figure 21) was very similar
to beta-carotene which was expected due to their similar structure (long
hydrocarbon chain with alternating single/ double bounds) (Figures 2 and 3).
The main peak in riboflavin (~1380cm-1
) show the numerous hydroxyl groups
present off of the nitrogen ring. The peak in both beta-carotene and annatto
extract at ~1500cm-1
represents the long hydrocarbon chain seen in both
pigments.

67
Figure 19: Riboflavin spectrum with baseline adjustment and an exposure
time of 5 seconds with 3 total exposures and following experiment setup seen
in Table 4 (780nm).

68
Figure 20: Beta-carotene spectrum with no baseline adjustment and an
exposure time of 0.1 seconds with 3 total exposures and following experiment
setup seen in Table 4 (780nm).

69
Figure 21: Annatto Extract spectrum with baseline adjustment and an
exposure time of 1 second with 3 total exposures and following experiment
setup seen in Table 4 (780nm).
Unfortunately, the pigments with RuBisCO were not studied due to the fact
that no distinct peaks were observed in the RuBisCO powder spectrum
because of fluorescence. Even though the pigments offer useful spectra, the
fact that RuBisCO does not show any peaks means that binding cannot be
understood or evaluated with Raman spectroscopy.
5.1.2 Surface Plasmon Resonance
SPR was used to study the kinetics of standard RuBisCO as it binds to the
antibody (anti-RuBisCO, spinach, monoclonal) on the gold substrate. The
70
preliminary studies for standard RuBisCO used several different buffers
including: 1M Tris HCl buffer pH 8.0, HBS-EP+, HBS-N, and PBS at pH 7.4.
However, these buffer systems resulted in large amounts of protein
aggregation which caused the kinetic data to be difficult to interpret. Even
when solubalized, RuBisCO is a large protein and causes a high change in RU
without surface binding due to refractive index change. This “solution
matching” also caused challenges when fitting data, as the algorithm does not
account fully for this refractive index change seen at the injection of RuBisCO
analyte.
To overcome the challenge of protein aggregation and therefore loss of useful
kinetic information, the standard RuBisCO was solubalized in PBS with a pH
of 7.9. At this pH the standard RuBisCO completely dissolved into solution
and there was no aggregation seen overnight.
The following figure provides general information on the shape of all
sensorgrams to follow, as well as key points during the assay.
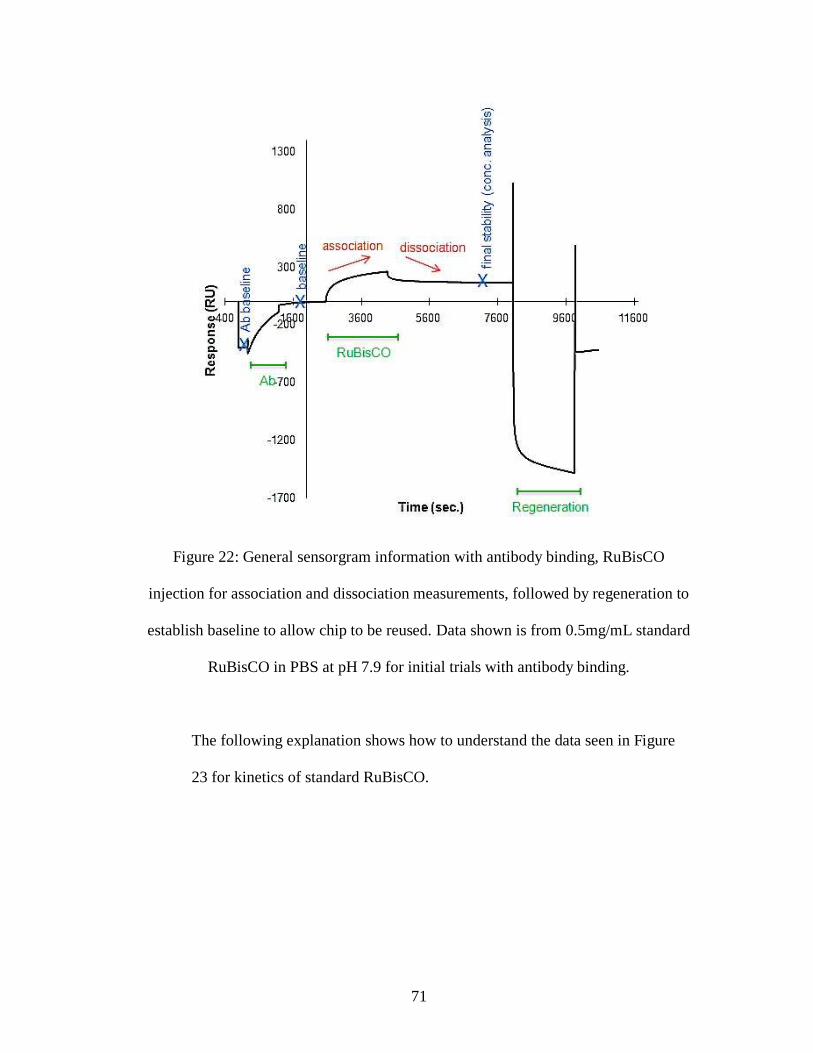
71
Figure 22: General sensorgram information with antibody binding, RuBisCO
injection for association and dissociation measurements, followed by regeneration to
establish baseline to allow chip to be reused. Data shown is from 0.5mg/mL standard
RuBisCO in PBS at pH 7.9 for initial trials with antibody binding.
The following explanation shows how to understand the data seen in Figure
23 for kinetics of standard RuBisCO.
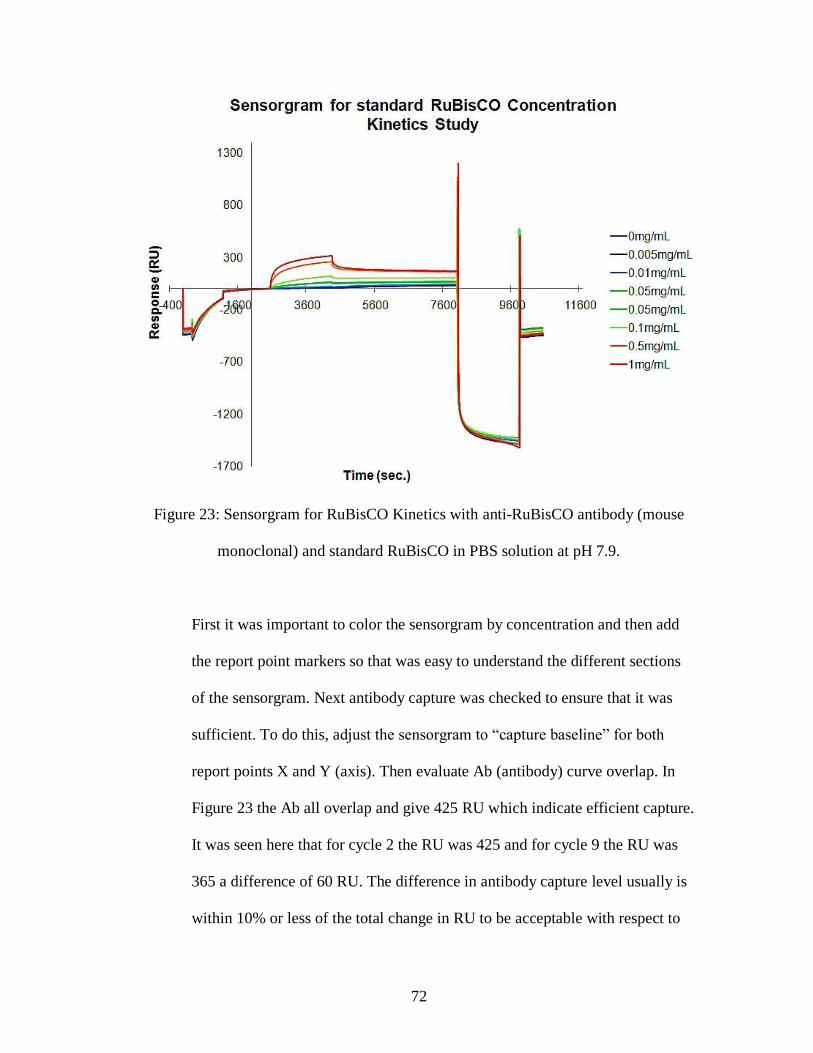
72
Figure 23: Sensorgram for RuBisCO Kinetics with anti-RuBisCO antibody (mouse
monoclonal) and standard RuBisCO in PBS solution at pH 7.9.
First it was important to color the sensorgram by concentration and then add
the report point markers so that was easy to understand the different sections
of the sensorgram. Next antibody capture was checked to ensure that it was
sufficient. To do this, adjust the sensorgram to “capture baseline” for both
report points X and Y (axis). Then evaluate Ab (antibody) curve overlap. In
Figure 23 the Ab all overlap and give 425 RU which indicate efficient capture.
It was seen here that for cycle 2 the RU was 425 and for cycle 9 the RU was
365 a difference of 60 RU. The difference in antibody capture level usually is
within 10% or less of the total change in RU to be acceptable with respect to
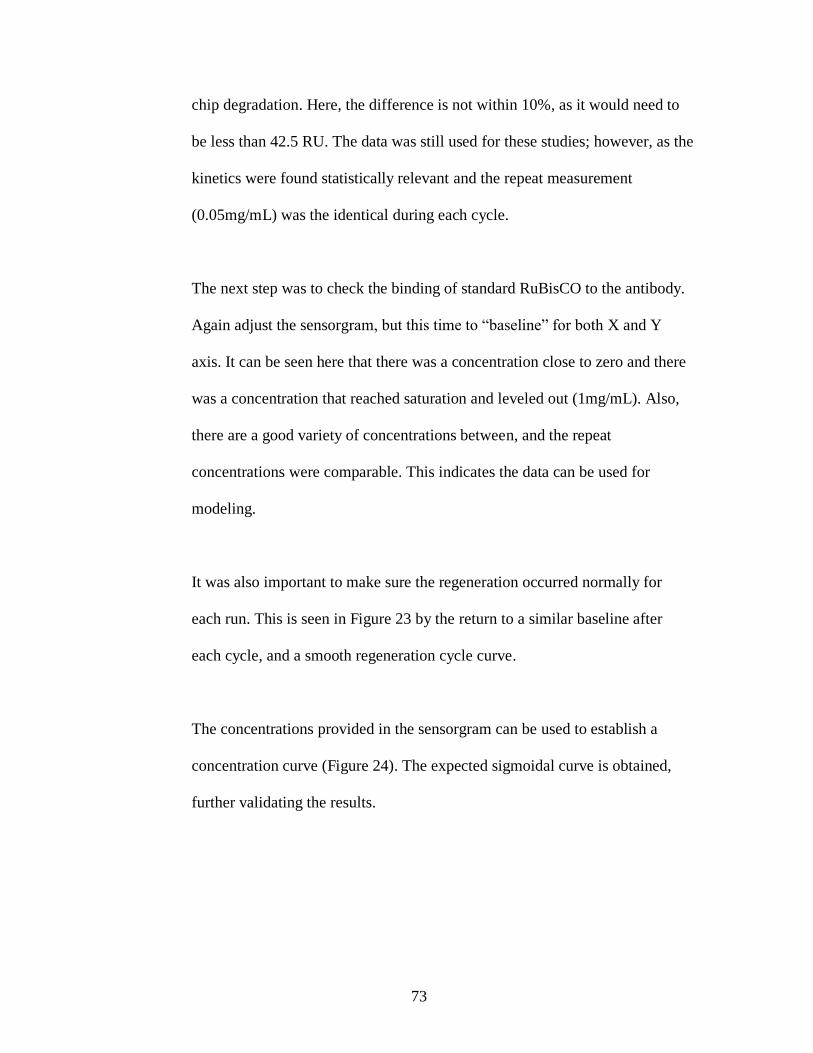
73
chip degradation. Here, the difference is not within 10%, as it would need to
be less than 42.5 RU. The data was still used for these studies; however, as the
kinetics were found statistically relevant and the repeat measurement
(0.05mg/mL) was the identical during each cycle.
The next step was to check the binding of standard RuBisCO to the antibody.
Again adjust the sensorgram, but this time to “baseline” for both X and Y
axis. It can be seen here that there was a concentration close to zero and there
was a concentration that reached saturation and leveled out (1mg/mL). Also,
there are a good variety of concentrations between, and the repeat
concentrations were comparable. This indicates the data can be used for
modeling.
It was also important to make sure the regeneration occurred normally for
each run. This is seen in Figure 23 by the return to a similar baseline after
each cycle, and a smooth regeneration cycle curve.
The concentrations provided in the sensorgram can be used to establish a
concentration curve (Figure 24). The expected sigmoidal curve is obtained,
further validating the results.
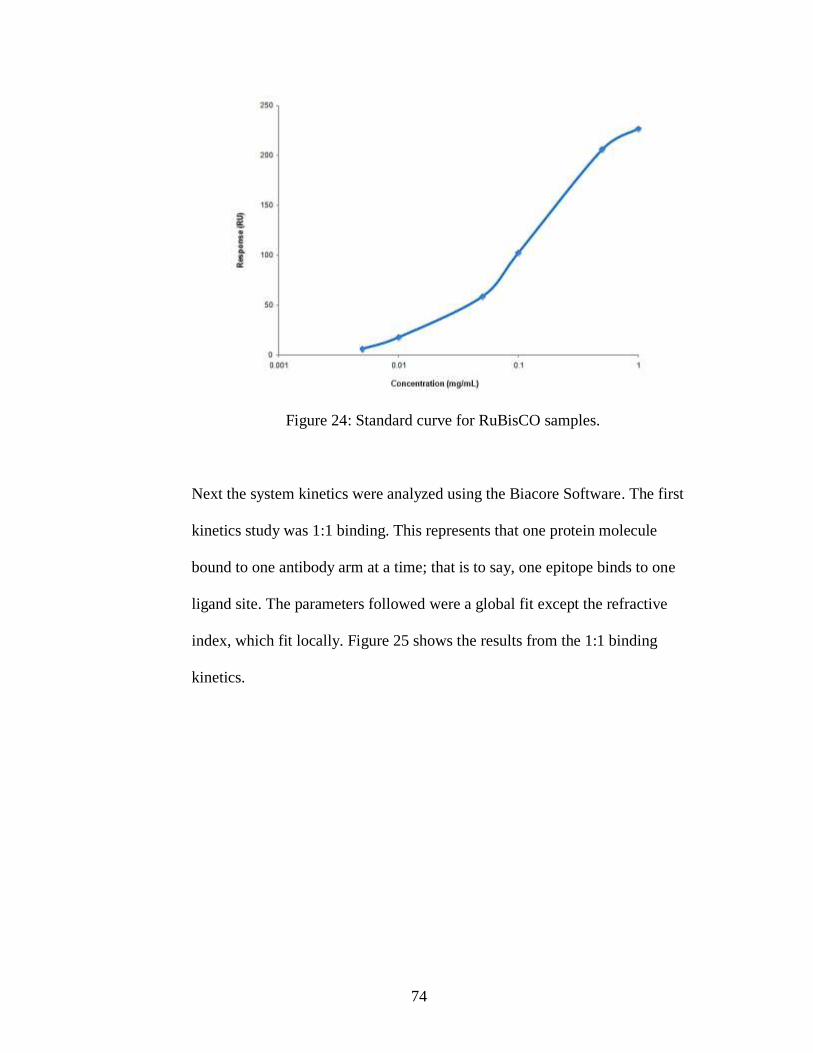
74
Figure 24: Standard curve for RuBisCO samples.
Next the system kinetics were analyzed using the Biacore Software. The first
kinetics study was 1:1 binding. This represents that one protein molecule
bound to one antibody arm at a time; that is to say, one epitope binds to one
ligand site. The parameters followed were a global fit except the refractive
index, which fit locally. Figure 25 shows the results from the 1:1 binding
kinetics.
75
Figure 25: Kinetics results for standard RuBisCO using a 1:1 binding model. Colored
lines are experimental; black lines are fit.
The 1:1 binding showed good fit in that the black lines follow the colored
sensogram curves well. The residuals (a measure of how far fit is from
experimental data) found for this set of data were between 20 and -20,
whereas a good fit is usually between 10 and -10. The residuals were large,
but this is to be expected as RuBisCO is a large molecule with large refractive
index change that hinders proper fit at the start and end of the injection as seen
in Figure 25. Table 7 shows the results from the kinetic study for 1:1 binding.

76
Table 7: Results for Kinetics 1:1 Binding for standard RuBisCO.
Value Result General Guidelines Explanation
Uniqueness 3 Under 10 Means the data is relevant
Rmax 202.3 RU Between 100-500 RU Within the limits of the instrument
Chi2 39.9 Under 1% of Rmax, here
<2.023
How well does theoretical curve
(black) fit experimental curve
(colors)
Standard Error SEka = 1.9E2
SEkd = 7.5E-6
Standard Error values
should be 10% or less of
their ka or kd value to
indicate significance of
fit
Reasonable response
Tc (Mass
Transfer
Coefficient)
7.16E6 No mass transport at 109
to 1012
, >107 may have
mass transport
Mass transport expected with
RuBisCO due to large size and
aggregation
Kinetic Values ka = 2.368E+4
(1/Ms)
kd = 0.001422 (1/s)
KD = 6.002E-8 M
Monoclonal antibodies
show values between 10-
7 to 10
-10
KD provides an appropriate value
for a monoclonal antibody
There were two values given that need to be discussed further: Chi2 and the
Mass Transfer value. The Chi2 value tells how well the theoretical data
matches your experimental results. In general, if the residual values are high,
which they are here, then the Chi2 value will be high as well. The Chi
2 value
was high as compared to the target, but this was acceptable due to the high
residuals found, and the large refractive index produced from RuBisCO. The
Mass Transfer Coefficient measured the possibility of mass transport, which is
how well an analyte can reach the surface to bind the ligand. Having mass
transport limitations means that the analyte has difficulty in penetrating the
diffuse layer, thus not efficiently reaching the surface. This can result in
decreased binding. For SPR no mass transport limitations are better, but it was
acceptable here if there were some mass transport limitations. Mass transport
77
was expected in these experiments as RuBisCO is quite large and prone to
aggregation.
The kinetics software was also used to run two other binding models, Bivalent
and Heterogeneous Analyte. Bivalent binding means that the analyte binds
twice and therefore does not provide a KD since it cannot be determined which
ka of the two values is associated with a single (or dual) kd value. This model
is only relevant if there is a biological explanation for binding and here the
RuBisCO was not assumed to bind twice to the antibody. The Heterogeneous
Analyte Binding model occurs when there are two different size or two
different affinity binders in the analyte solution and each has different kinetic
values. For Heterogeneous Analyte Binding the values for a second
concentration and molecular weight are used (Table 8). The 557,000
molecular weight is for the intact RuBisCO and the 55,000 represents the
large subunit molecular weight. The concentrations are stated as entire
solution concentrations.
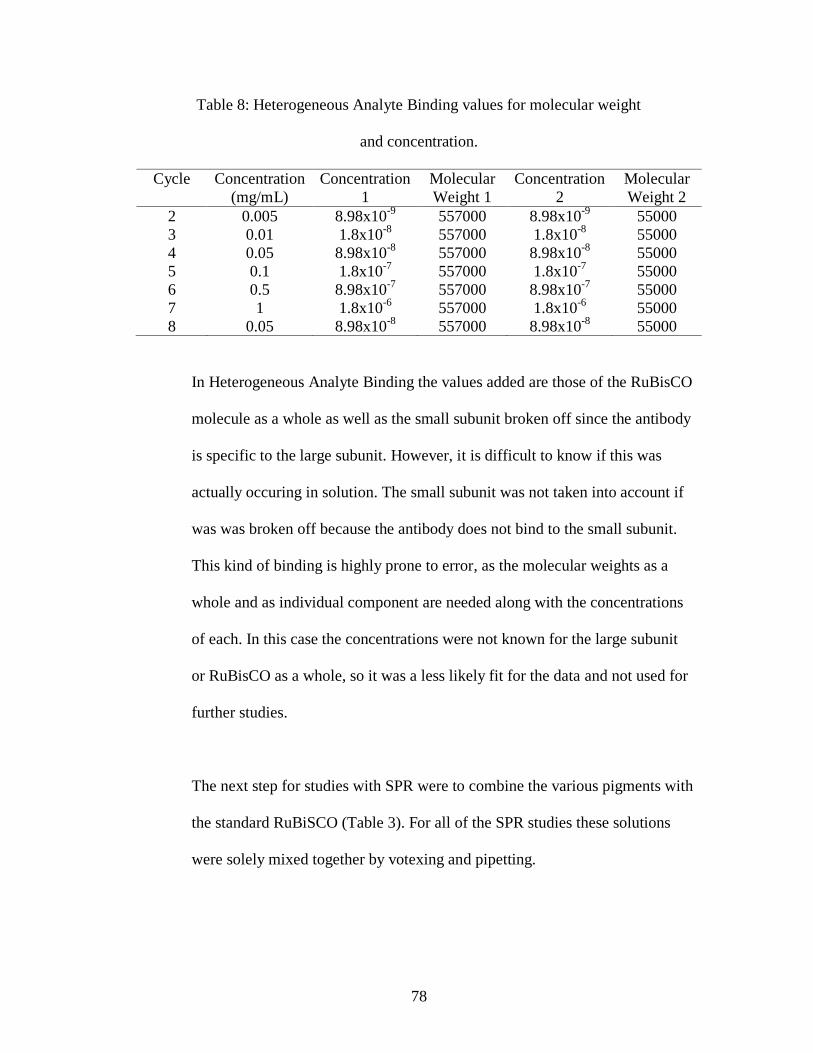
78
Table 8: Heterogeneous Analyte Binding values for molecular weight
and concentration.
Cycle Concentration
(mg/mL)
Concentration
1
Molecular
Weight 1
Concentration
2
Molecular
Weight 2
2 0.005 8.98x10⁻⁹
557000 8.98x10⁻⁹
55000
3 0.01 1.8x10⁻⁸
557000 1.8x10⁻⁸
55000
4 0.05 8.98x10⁻⁸
557000 8.98x10⁻⁸
55000
5 0.1 1.8x10⁻⁷
557000 1.8x10⁻⁷
55000
6 0.5 8.98x10⁻⁷
557000 8.98x10⁻⁷
55000
7 1 1.8x10⁻⁶
557000 1.8x10⁻⁶
55000
8 0.05 8.98x10⁻⁸
557000 8.98x10⁻⁸
55000
In Heterogeneous Analyte Binding the values added are those of the RuBisCO
molecule as a whole as well as the small subunit broken off since the antibody
is specific to the large subunit. However, it is difficult to know if this was
actually occuring in solution. The small subunit was not taken into account if
was was broken off because the antibody does not bind to the small subunit.
This kind of binding is highly prone to error, as the molecular weights as a
whole and as individual component are needed along with the concentrations
of each. In this case the concentrations were not known for the large subunit
or RuBisCO as a whole, so it was a less likely fit for the data and not used for
further studies.
The next step for studies with SPR were to combine the various pigments with
the standard RuBiSCO (Table 3). For all of the SPR studies these solutions
were solely mixed together by votexing and pipetting.

79
The first pigment study was with riboflavin, and Figure 26 shows the results
from the various concentrations.
Figure 26: Standard RuBisCO with Riboflavin.
This graph shows general trends in binding with first, antibody binding to
reach a baseline followed by second, RuBisCO and/or pigment binding. The
RuBisCO and pigment solutions show assication and dissociation and the
regeneration is not shown. The large changes in RU were due to the different
solutions used with varying refractive indexes created.
This data set goes through the same analysis as the original sensorgram
(Figure 23). The antibody capture was evaluated and for cycle 12 the RU was
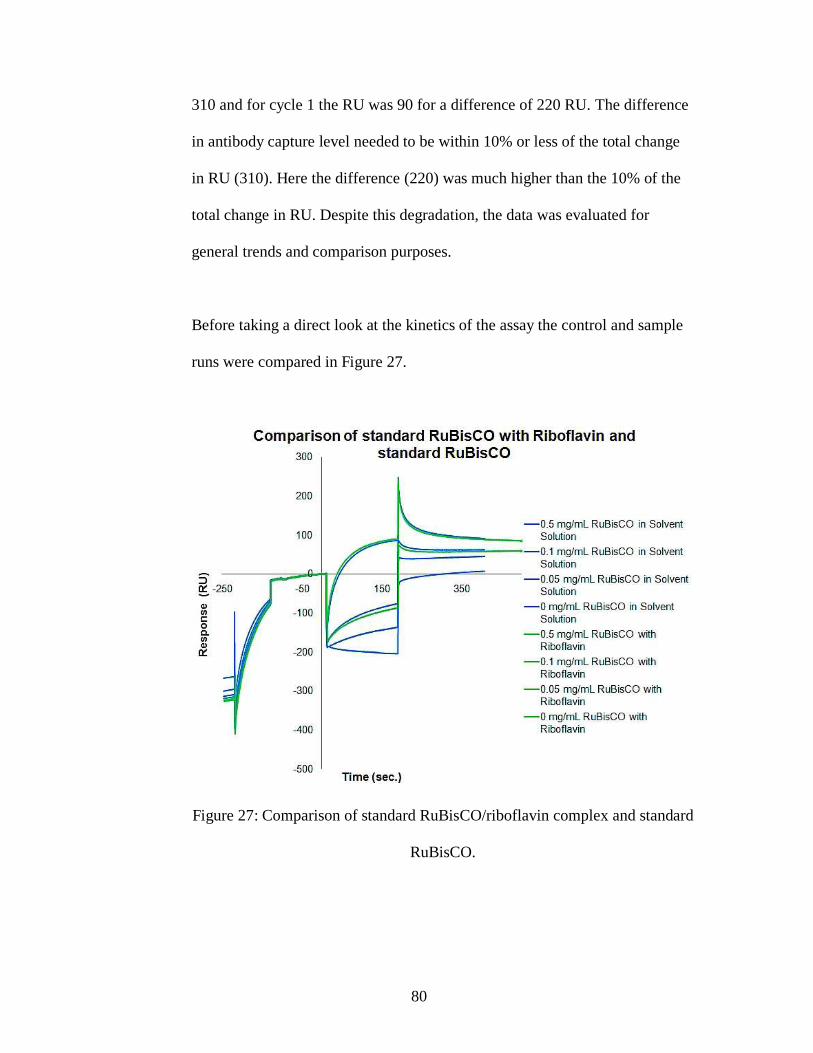
80
310 and for cycle 1 the RU was 90 for a difference of 220 RU. The difference
in antibody capture level needed to be within 10% or less of the total change
in RU (310). Here the difference (220) was much higher than the 10% of the
total change in RU. Despite this degradation, the data was evaluated for
general trends and comparison purposes.
Before taking a direct look at the kinetics of the assay the control and sample
runs were compared in Figure 27.
Figure 27: Comparison of standard RuBisCO/riboflavin complex and standard
RuBisCO.

81
This sensorgram shows that there was no difference between the standard
RuBisCO alone and the standard RuBisCO with the pigment in the solvent
solution. The curve shapes for binding provided information even before
further analysis. There was no significant change in the curve shapes, meaning
that the kinetic results will be similar. Due to these findings it was seen that
SPR was not helpful in determining if the pigment was bound or not to the
standard RuBisCO. Either there was no binding and thus no change in kinetic
values or there was binding, but no change to kinetics. In addition, if there
was binding, the pigment does not change the inherent binding of the standard
RuBisCO, and therefore there is no structural stability lost.
The RuBisCO and riboflavin trial was completed with 1:1 binding as seen in
Figure 28.

82
Figure 28: Kinetics for standard RuBisCO with riboflavin using a 1:1 binding model.
Colored lines are experimental; black lines are fit.
It was determined previously that 1:1 binding provides the most useful
analysis of data. The 1:1 binding showed good fit with the black lines fitting
the color sensorgram curves closely. The residuals found for the standard
RuBisCO with riboflavin were between 25 and -25, which is large compared
to the goal. The residuals were accepted as explained previously. Table 9
shows the results from the kinetic study for 1:1 binding for the standard
RuBisCO with riboflavin.
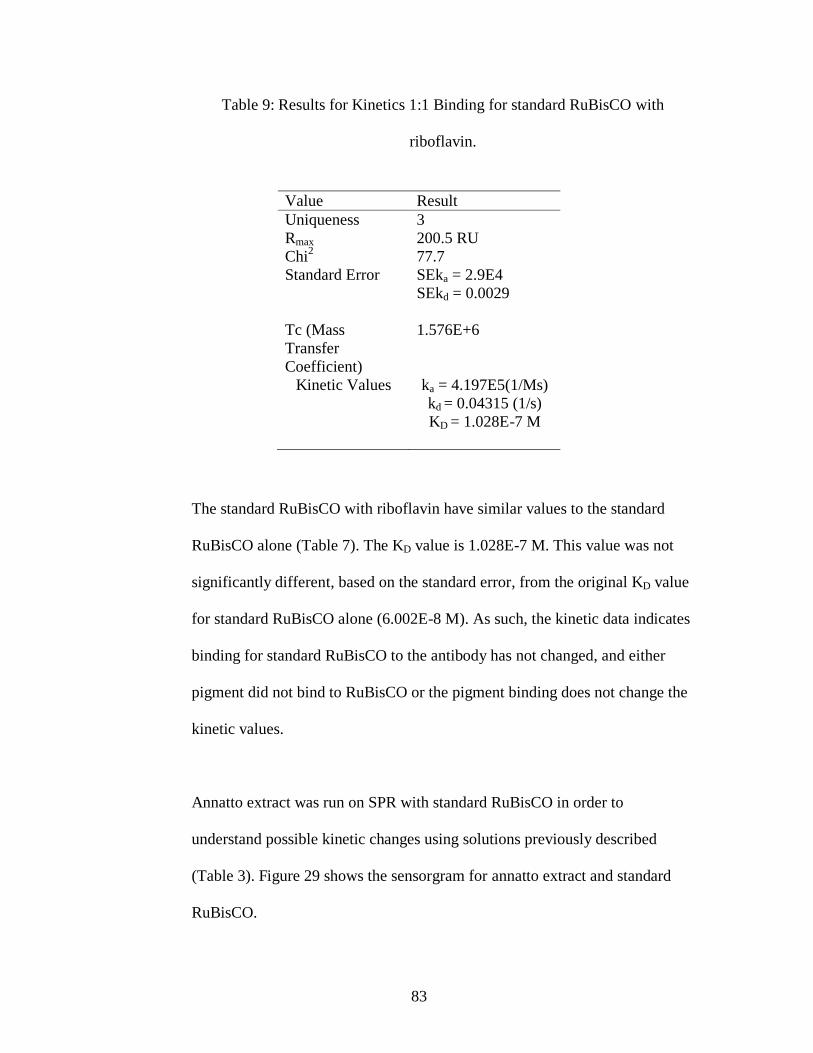
83
Table 9: Results for Kinetics 1:1 Binding for standard RuBisCO with
riboflavin.
The standard RuBisCO with riboflavin have similar values to the standard
RuBisCO alone (Table 7). The KD value is 1.028E-7 M. This value was not
significantly different, based on the standard error, from the original KD value
for standard RuBisCO alone (6.002E-8 M). As such, the kinetic data indicates
binding for standard RuBisCO to the antibody has not changed, and either
pigment did not bind to RuBisCO or the pigment binding does not change the
kinetic values.
Annatto extract was run on SPR with standard RuBisCO in order to
understand possible kinetic changes using solutions previously described
(Table 3). Figure 29 shows the sensorgram for annatto extract and standard
RuBisCO.
Value Result
Uniqueness 3
Rmax 200.5 RU
Chi2 77.7
Standard Error SEka = 2.9E4
SEkd = 0.0029
Tc (Mass
Transfer
Coefficient)
1.576E+6
Kinetic Values ka = 4.197E5(1/Ms)
kd = 0.04315 (1/s)
KD = 1.028E-7 M
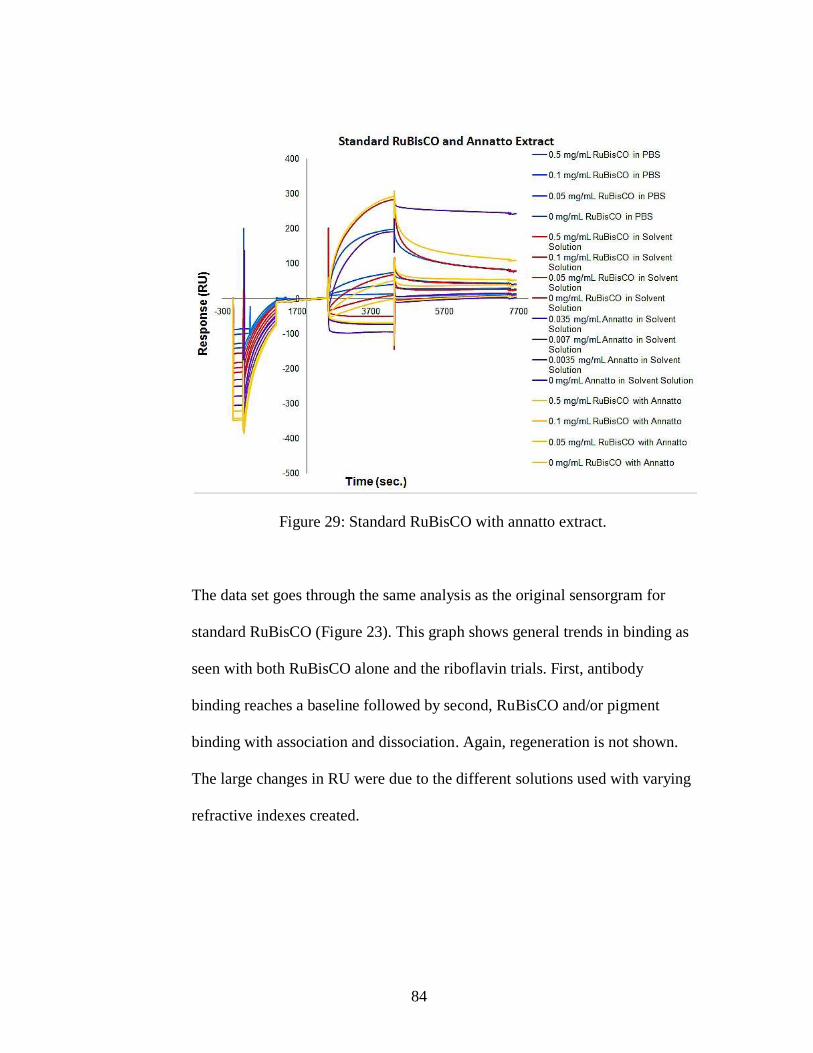
84
Figure 29: Standard RuBisCO with annatto extract.
The data set goes through the same analysis as the original sensorgram for
standard RuBisCO (Figure 23). This graph shows general trends in binding as
seen with both RuBisCO alone and the riboflavin trials. First, antibody
binding reaches a baseline followed by second, RuBisCO and/or pigment
binding with association and dissociation. Again, regeneration is not shown.
The large changes in RU were due to the different solutions used with varying
refractive indexes created.

85
Before taking a direct look at the kinetics, the control and sample runs are
compared in Figure 30 and the control and calibration 2 are compared in
Figure 31.
Figure 30: Comparison of standard RuBisCO to standard RuBisCO with
annatto extract.

86
Figure 31: Comparison of standard RuBisCO to annatto extract in solvent
solution (calibration 2).
In Figure 30 there was no significant change in the curves for binding of
standard RuBisCO (control) when compared to the standard RuBisCO with
annatto extract. In Figure 31 there was an interesting curve shape for the
highest concentration of annatto extract (0.035mg/mL). This curve has an
increase RU which could indicate non-specific binding of the annatto to the
surface. Note that this trial was completed twice (data not shown) to ensure
that the varying curve shape was a realistic factor of the data and not an
anomaly. The high concentration for annatto extract showed the same curve
shape each time. A factor that might be involved in the curve shape is that the
annatto sample provided was in an unknown liquid and this might cause non-

87
specific binding at higher concentrations. Furthermore, the concentration of
annatto extract may be incorrect due to the liquid evaporating during weighing
and so accurately weighing out the annatto extract proved challenging.
The RuBisCO and annatto extract trial was completed with 1:1 kinetic
modeling (Figure 32).
Figure 32: Kinetics for standard RuBisCO with annatto extract using a 1:1 binding
model. Colored lines are experimental; black lines are fit.
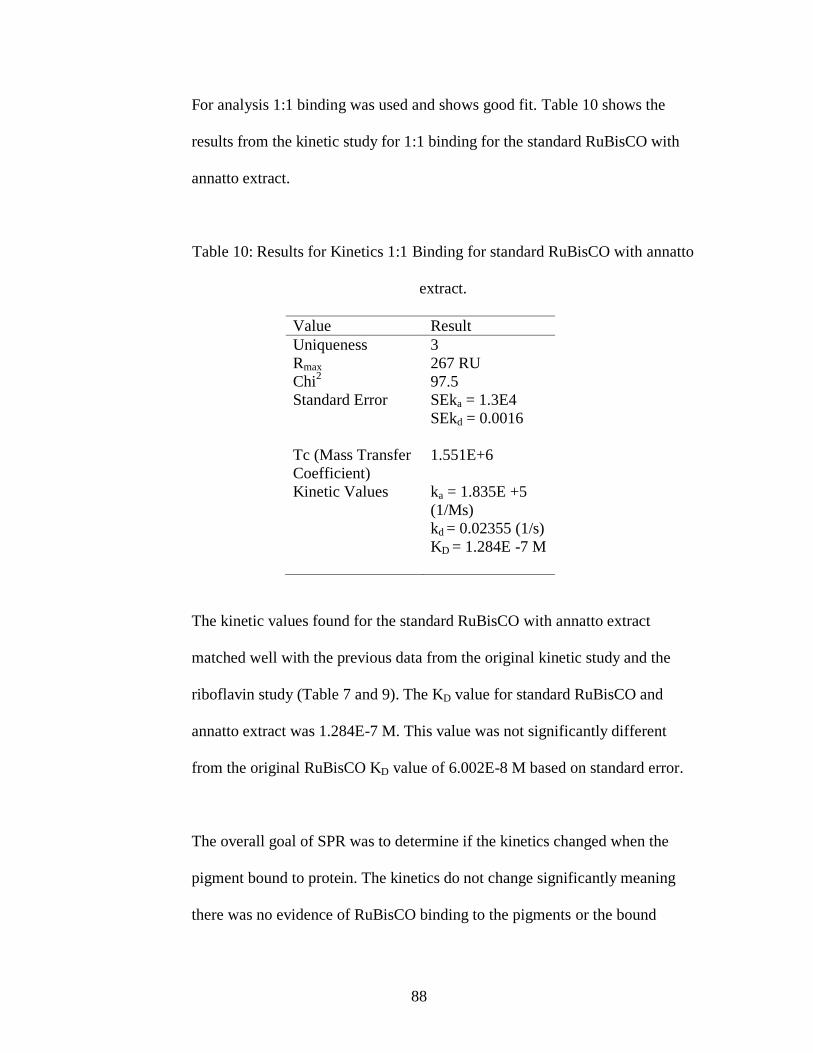
88
For analysis 1:1 binding was used and shows good fit. Table 10 shows the
results from the kinetic study for 1:1 binding for the standard RuBisCO with
annatto extract.
Table 10: Results for Kinetics 1:1 Binding for standard RuBisCO with annatto
extract.
The kinetic values found for the standard RuBisCO with annatto extract
matched well with the previous data from the original kinetic study and the
riboflavin study (Table 7 and 9). The KD value for standard RuBisCO and
annatto extract was 1.284E-7 M. This value was not significantly different
from the original RuBisCO KD value of 6.002E-8 M based on standard error.
The overall goal of SPR was to determine if the kinetics changed when the
pigment bound to protein. The kinetics do not change significantly meaning
there was no evidence of RuBisCO binding to the pigments or the bound
Value Result
Uniqueness 3
Rmax 267 RU
Chi2 97.5
Standard Error SEka = 1.3E4
SEkd = 0.0016
Tc (Mass Transfer
Coefficient)
1.551E+6
Kinetic Values ka = 1.835E +5
(1/Ms)
kd = 0.02355 (1/s)
KD = 1.284E -7 M

89
pigments does not change the kinetics of RuBisCO and antibody binding. The
KD values for each assay, standard RuBisCO (6.002E-8 M), standard
RuBisCO with riboflavin (1.028E-7 M), and standard RuBisCO with annatto
extract (1.284E-7 M) were all similar within standard error. This was also
exemplified in the fact that the curve shapes were similar when comparing the
standard RuBisCO control to the samples with each pigment added.
Since SPR cannot provide confirmation of binding, UV-VIS was also used, as
an independent means for assessment, to understand if binding to pigments
has or has not occurred with standard RuBisCO to each pigment.
5.1.3 UV-Vis
The goal of UV-Vis was to determine if binding occurred between the
standard RuBisCO and the pigments. The solutions used are expressed in
Table 3. For the heating and freeze thaw cycles the pigments were added
directly to standard RuBisCO in PBS at pH 7.9 after the first heating and in
the same 1:100 mole ratio. This means that no solubalizing solutions were
needed during those experiments. UV-Vis provides a spectrum for each
compound studied here and if a protein-pigment complex is formed there may
be a shift in spectra or addition/subtraction of a peak, which could represent
the binding of protein with pigment. In all of the results presented there was
no change in spectra shape, further evidence that binding was not confirmed.
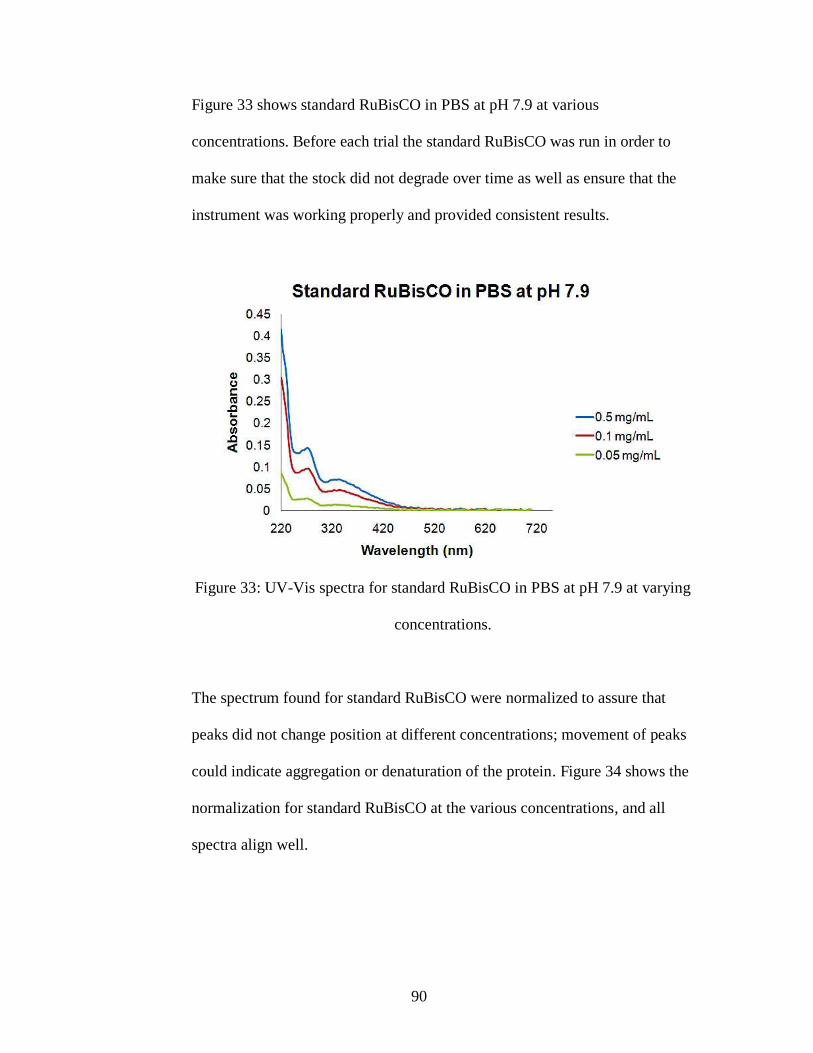
90
Figure 33 shows standard RuBisCO in PBS at pH 7.9 at various
concentrations. Before each trial the standard RuBisCO was run in order to
make sure that the stock did not degrade over time as well as ensure that the
instrument was working properly and provided consistent results.
Figure 33: UV-Vis spectra for standard RuBisCO in PBS at pH 7.9 at varying
concentrations.
The spectrum found for standard RuBisCO were normalized to assure that
peaks did not change position at different concentrations; movement of peaks
could indicate aggregation or denaturation of the protein. Figure 34 shows the
normalization for standard RuBisCO at the various concentrations, and all
spectra align well.
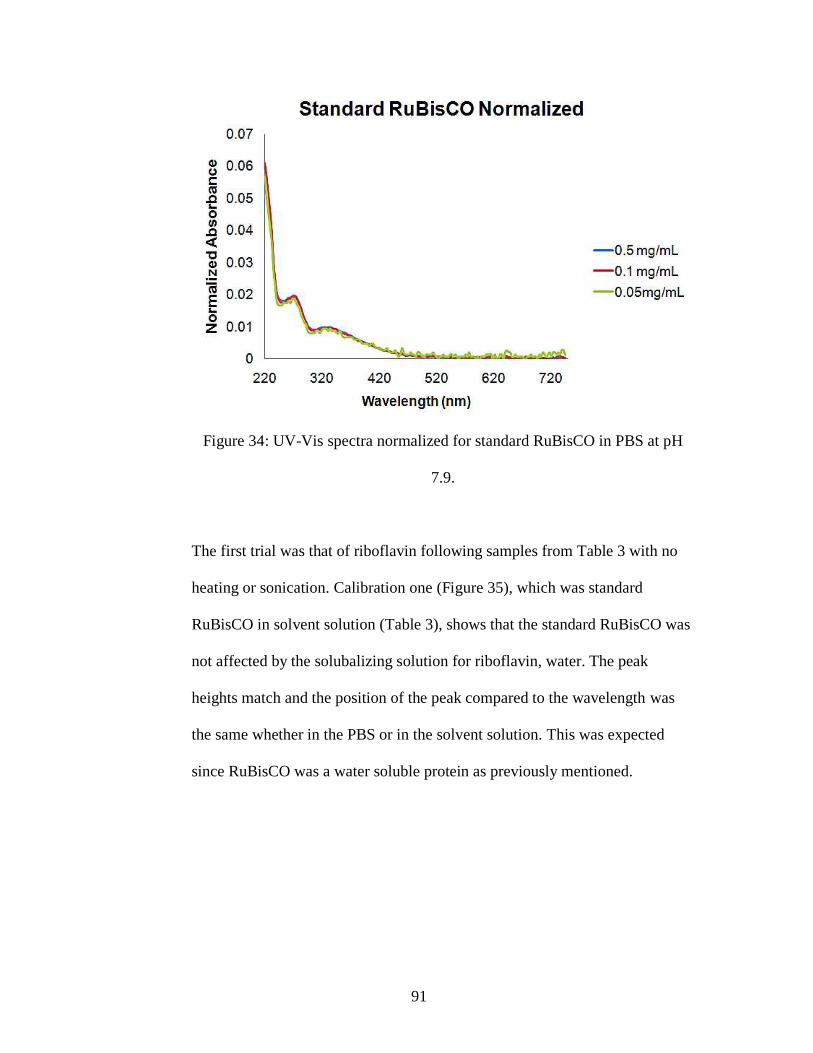
91
Figure 34: UV-Vis spectra normalized for standard RuBisCO in PBS at pH
7.9.
The first trial was that of riboflavin following samples from Table 3 with no
heating or sonication. Calibration one (Figure 35), which was standard
RuBisCO in solvent solution (Table 3), shows that the standard RuBisCO was
not affected by the solubalizing solution for riboflavin, water. The peak
heights match and the position of the peak compared to the wavelength was
the same whether in the PBS or in the solvent solution. This was expected
since RuBisCO was a water soluble protein as previously mentioned.

92
Figure 35: UV-Vis spectra for standard RuBisCO in PBS at pH 7.9 and
solvent solution for riboflavin (water).
A comparison of standard RuBisCO with riboflavin in solvent solution to the
additive values of standard RuBisCO in PBS at pH 7.9 plus riboflavin in
solvent solution (Figure 36 and 37) shows no significant difference in spectra;
results were additive.

93
Figure 36: UV-Vis spectra comparing standard RuBisCO in PBS at pH 7.9,
riboflavin in solvent solution, standard RuBisCO with riboflavin, and the
additive values of standard RuBisCO in PBS at pH 7.9 and riboflavin in
solvent solution.
In Figure 36 the resulting spectrum from standard RuBisCO and riboflavin in
solvent solution is seen, with a mole ratio of 1:100 (Table 3). The spectrum of
standard RuBisCO in PBS at pH 7.9 (red) was added to the spectrum of
riboflavin in solvent solution (green) to produce the additive value (purple).
The purpose of creating the additive value spectrum was to understand if there
was a shift in spectrum produced by binding or if the solutions are both being
measured in solution with no binding. The additive values and the spectrum
values of standard RuBisCO and riboflavin in solvent solution (complex) were
normalized for comparison (Figure 37).
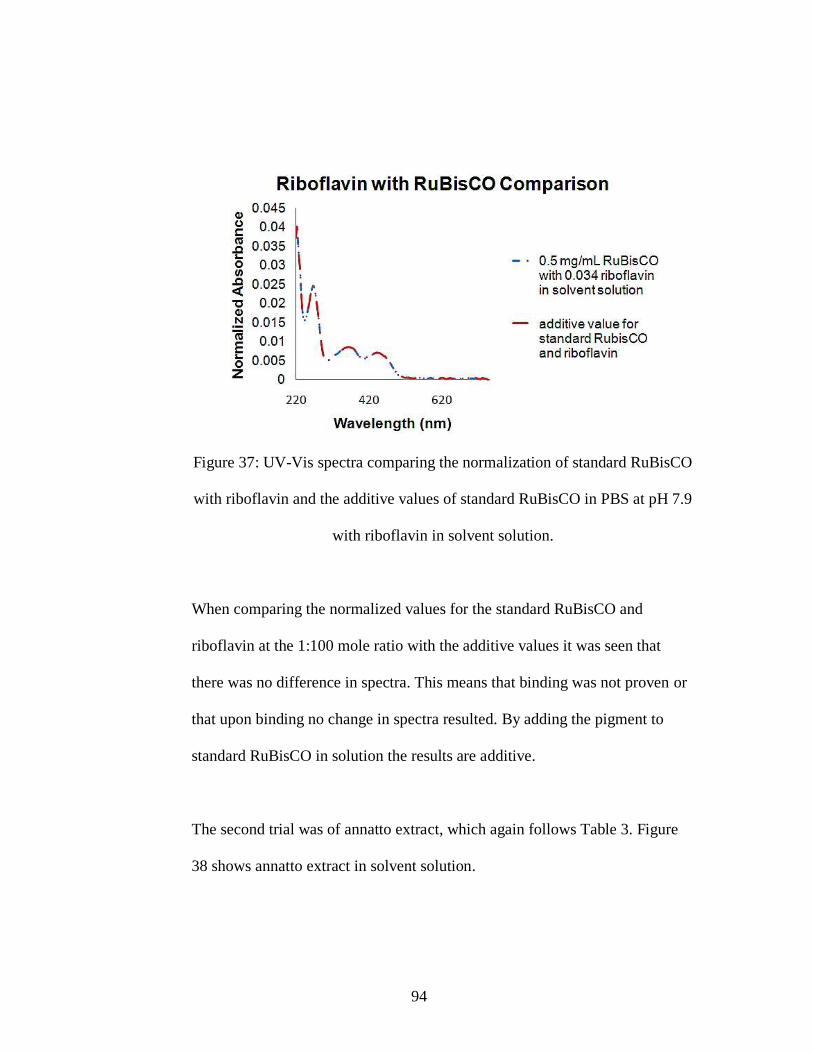
94
Figure 37: UV-Vis spectra comparing the normalization of standard RuBisCO
with riboflavin and the additive values of standard RuBisCO in PBS at pH 7.9
with riboflavin in solvent solution.
When comparing the normalized values for the standard RuBisCO and
riboflavin at the 1:100 mole ratio with the additive values it was seen that
there was no difference in spectra. This means that binding was not proven or
that upon binding no change in spectra resulted. By adding the pigment to
standard RuBisCO in solution the results are additive.
The second trial was of annatto extract, which again follows Table 3. Figure
38 shows annatto extract in solvent solution.

95
Figure 38: UV-Vis spectra for annatto extract in solvent solution.
The spectra for annatto extract in solvent solution shows extremely low
absorbance values. This may be due to the difficulty when measuring the
volume of extract, as the solution evaporated quickly. The main peak for
annatto extract, while with a low absorbance value, is at the expected
wavelength for carotenoids (400 to 500 nm (Britton et al., 2004)).
Figures 39 and 40 show a comparison of standard RuBisCO (0.5mg/mL) with
annatto extract (0.035mg/mL) in solvent solution to the additive values of
standard RuBisCO in PBS at pH 7.9 (0.5mg/mL) and annatto extract in
solvent solution (0.035mg/mL).
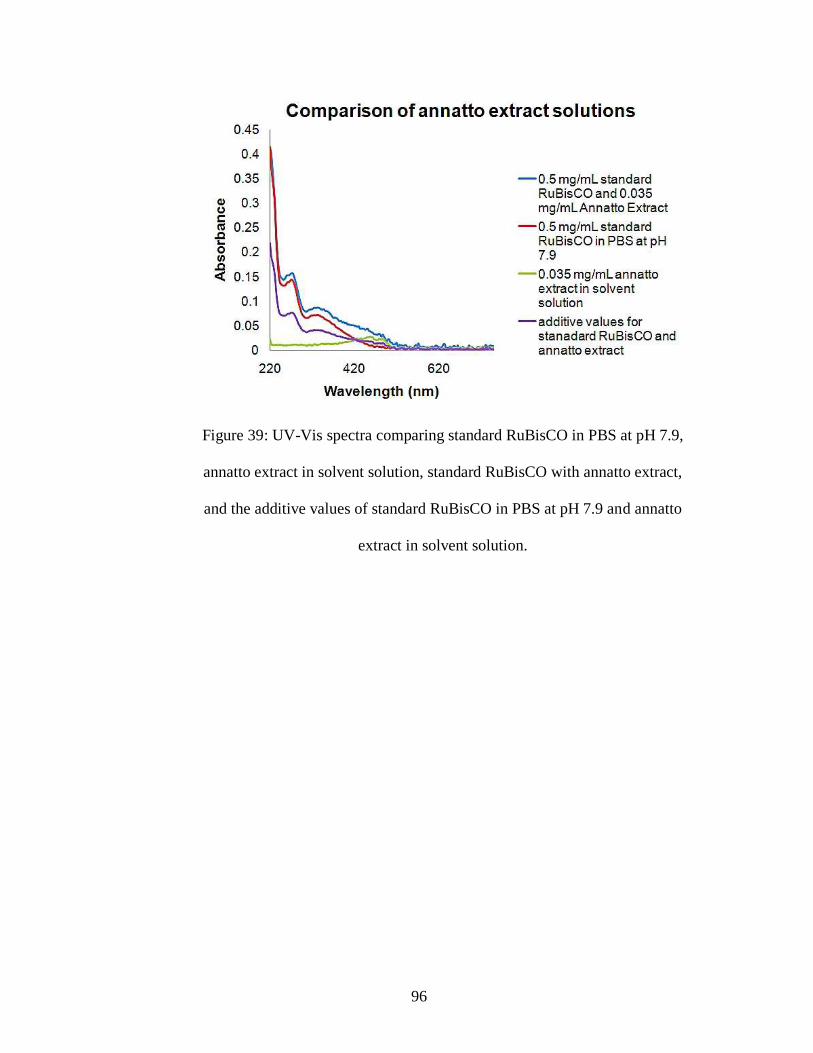
96
Figure 39: UV-Vis spectra comparing standard RuBisCO in PBS at pH 7.9,
annatto extract in solvent solution, standard RuBisCO with annatto extract,
and the additive values of standard RuBisCO in PBS at pH 7.9 and annatto
extract in solvent solution.

97
Figure 40: UV-Vis spectra comparing the normalization of standard RuBisCO
with annatto extract and the additive values of standard RuBisCO in PBS at
pH 7.9 with annatto extract in solvent solution.
There was no difference found when comparing the normalized values for the
standard RuBisCO and annatto extract at the 1:100 mole ratio with the
additive values of standard RuBisCO in PBS at pH 7.9 and annatto extract in
solvent solution. This shows that binding was not proven or upon binding no
change in spectra is obtained and that when adding the pigment to standard
RuBisCO the results are additive.
Figure 41 shows inconsistent absorbance values for beta-carotene at the same
concentration as a result of solubility properties. The spectra provided variable
results due to aggregation of beta-carotene in solution which contributed to
unreliable readings. Calibration two is beta-carotene in solvent solution which
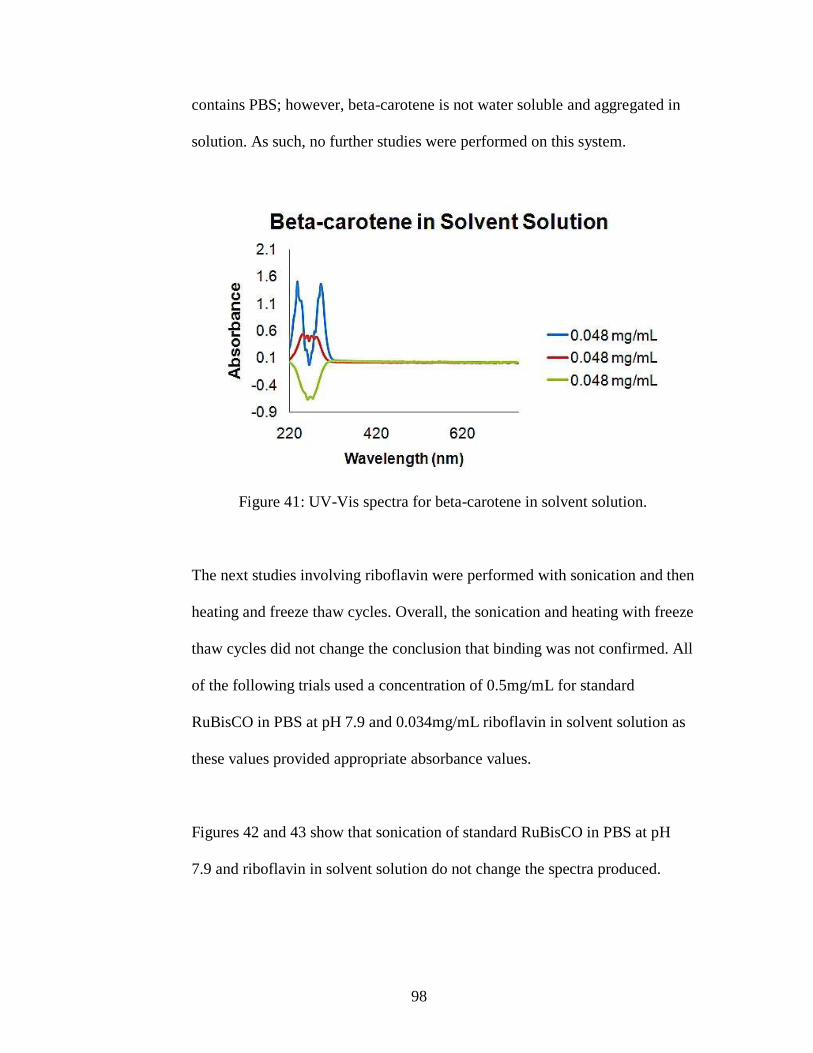
98
contains PBS; however, beta-carotene is not water soluble and aggregated in
solution. As such, no further studies were performed on this system.
Figure 41: UV-Vis spectra for beta-carotene in solvent solution.
The next studies involving riboflavin were performed with sonication and then
heating and freeze thaw cycles. Overall, the sonication and heating with freeze
thaw cycles did not change the conclusion that binding was not confirmed. All
of the following trials used a concentration of 0.5mg/mL for standard
RuBisCO in PBS at pH 7.9 and 0.034mg/mL riboflavin in solvent solution as
these values provided appropriate absorbance values.
Figures 42 and 43 show that sonication of standard RuBisCO in PBS at pH
7.9 and riboflavin in solvent solution do not change the spectra produced.
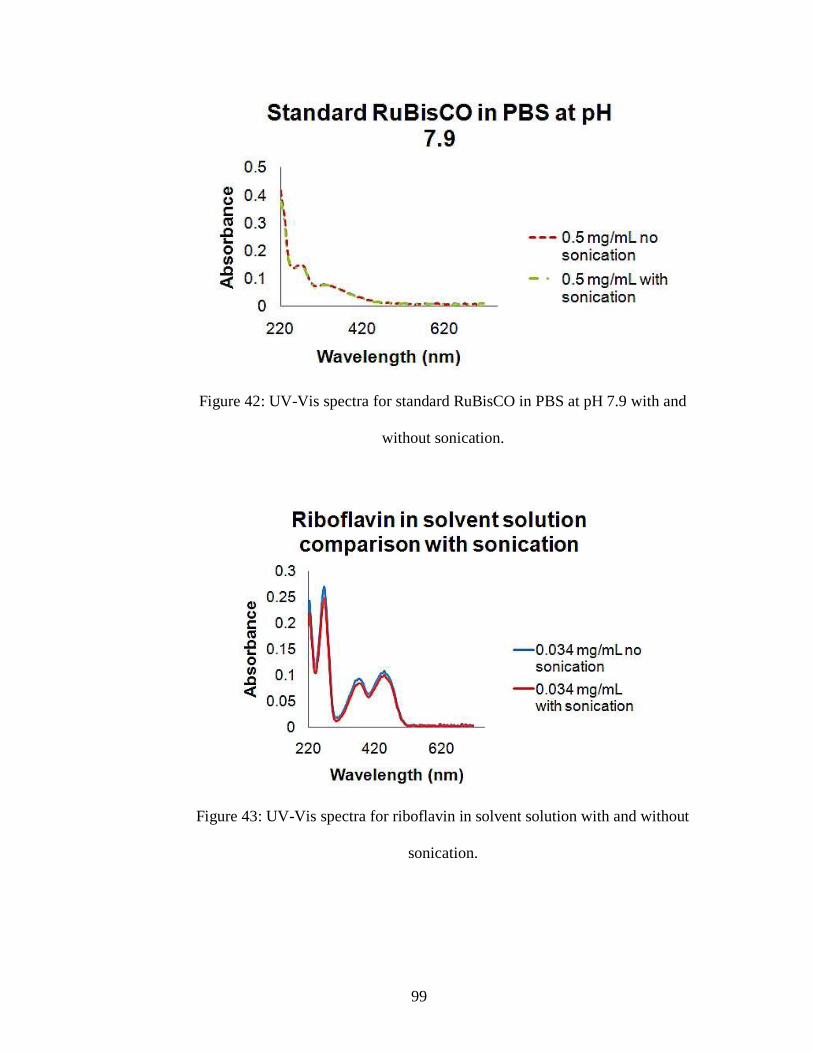
99
Figure 42: UV-Vis spectra for standard RuBisCO in PBS at pH 7.9 with and
without sonication.
Figure 43: UV-Vis spectra for riboflavin in solvent solution with and without
sonication.

100
Once it was established that sonication would not degrade the signals
produced by both standard RuBisCO and riboflavin, the next step was to look
at the standard RuBisCO with riboflavin in solvent solution and again
compare the results this to see if they were additive or if there was a
shift/change in spectra due to sonication potentially promoting binding. Figure
44 shows the comparison between standard RuBisCO with riboflavin in
solvent solution with sonication and the additive values of standard RuBisCO
in PBS at pH 7.9 with sonication plus riboflavin in solvent solution with
sonication.
Figure 44: UV-Vis spectra comparing standard RuBisCO and riboflavin with
sonication (normalized) to the additive value of standard RuBisCO in PBS at
pH 7.9 with sonication plus riboflavin in solvent solution with sonication
(normalized).

101
Sonication did not provide a change in spectra so again binding was not
proven or if binding did occur there was no visible change in spectra (Figure
44). The total sonication time was twenty minutes, and it might be that this
process was not long enough to promote binding; however, in Booth and
Paulsen (1996) sonication only involved 15 minutes of protein sonication
prior to adding pigments in order to create a protein-pigment complex of light
harvesting pigments.
The heating of riboflavin with standard RuBisCO in PBS at pH 7.9 was
experimented with prior to other pigments. The goal was that with heating and
freezing the solubility differences would be overcome to help promote binding
of pigment with protein (Paulsen et al. 1990). Figure 45 shows the comparison
of standard RuBisCO and riboflavin in solvent solution with heating to the
additive values of standard RuBisCO in PBS at pH 7.9 plus riboflavin in
solvent solution, both with heating.

102
Figure 45: UV-Vis spectra comparing normalization values of standard
RuBisCO with riboflavin with heating to additive values of standard RuBisCO
in PBS at pH 7.9 and riboflavin in solvent solution both with heating.
Figure 45 shows that heating followed by freeze thaw cycles for initial trials
of riboflavin did not provide any variation in spectra peaks; binding is not
confirmed in this method.
The final trial using UV-Vis provides the addition of pigments directly to
standard RuBisCO in PBS at pH of 7.9. The same concentrations were used to
maintain the 1:100 mole ratio. Also, MgCl2 was added in attempts to promote
binding, as a metal ion is needed to activate RuBisCO (Reinhard and Höcker,
2005). The pigments were added directly to the standard RuBisCO in PBS at
pH 7.9 to avoid variations in solvents and reduce aggregation or RuBisCO.
Also, for this study bixin was used in powder form instead of the fast
evaporating annatto extract to ensure the correct amount was used.
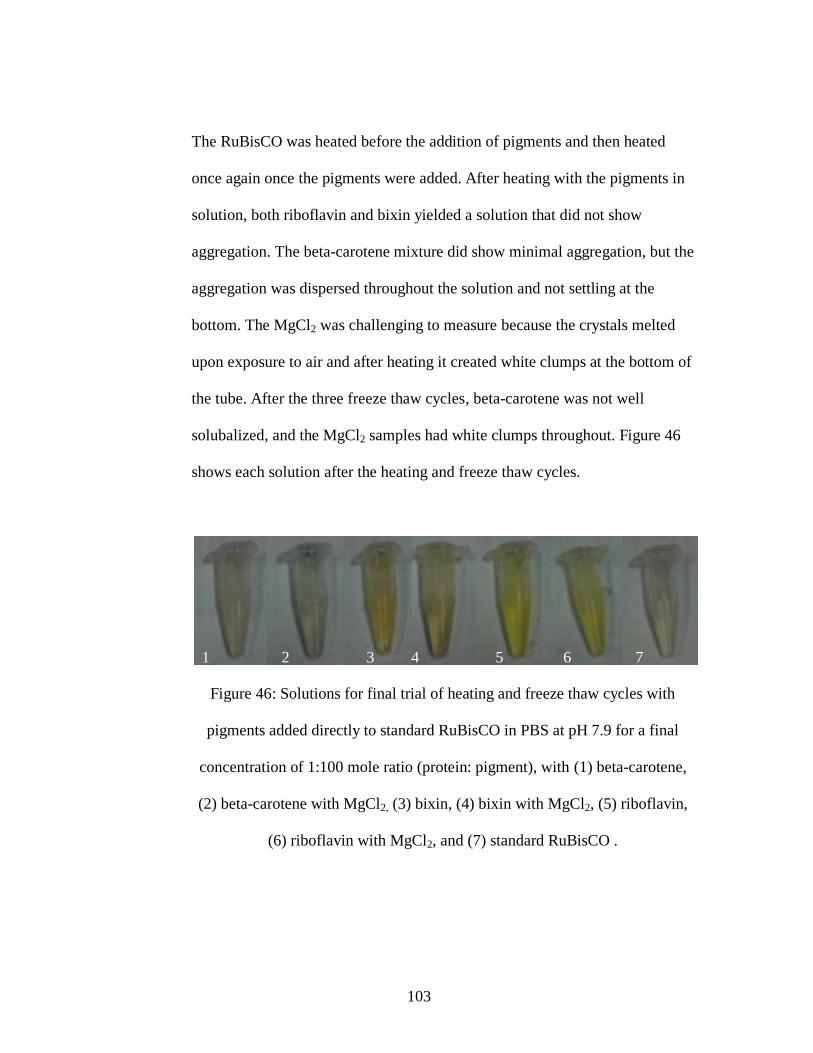
103
The RuBisCO was heated before the addition of pigments and then heated
once again once the pigments were added. After heating with the pigments in
solution, both riboflavin and bixin yielded a solution that did not show
aggregation. The beta-carotene mixture did show minimal aggregation, but the
aggregation was dispersed throughout the solution and not settling at the
bottom. The MgCl2 was challenging to measure because the crystals melted
upon exposure to air and after heating it created white clumps at the bottom of
the tube. After the three freeze thaw cycles, beta-carotene was not well
solubalized, and the MgCl2 samples had white clumps throughout. Figure 46
shows each solution after the heating and freeze thaw cycles.
Figure 46: Solutions for final trial of heating and freeze thaw cycles with
pigments added directly to standard RuBisCO in PBS at pH 7.9 for a final
concentration of 1:100 mole ratio (protein: pigment), with (1) beta-carotene,
(2) beta-carotene with MgCl2, (3) bixin, (4) bixin with MgCl2, (5) riboflavin,
(6) riboflavin with MgCl2, and (7) standard RuBisCO .
1 2 3
4
5
6 7
6 4 7
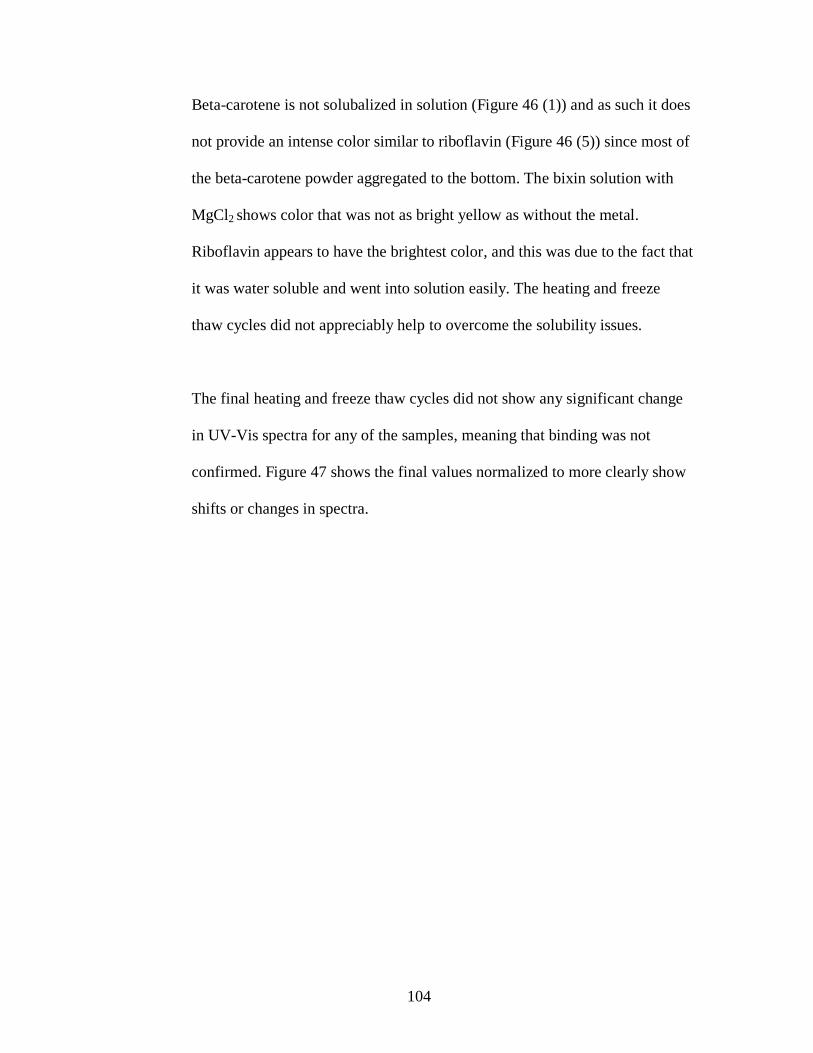
104
Beta-carotene is not solubalized in solution (Figure 46 (1)) and as such it does
not provide an intense color similar to riboflavin (Figure 46 (5)) since most of
the beta-carotene powder aggregated to the bottom. The bixin solution with
MgCl2 shows color that was not as bright yellow as without the metal.
Riboflavin appears to have the brightest color, and this was due to the fact that
it was water soluble and went into solution easily. The heating and freeze
thaw cycles did not appreciably help to overcome the solubility issues.
The final heating and freeze thaw cycles did not show any significant change
in UV-Vis spectra for any of the samples, meaning that binding was not
confirmed. Figure 47 shows the final values normalized to more clearly show
shifts or changes in spectra.
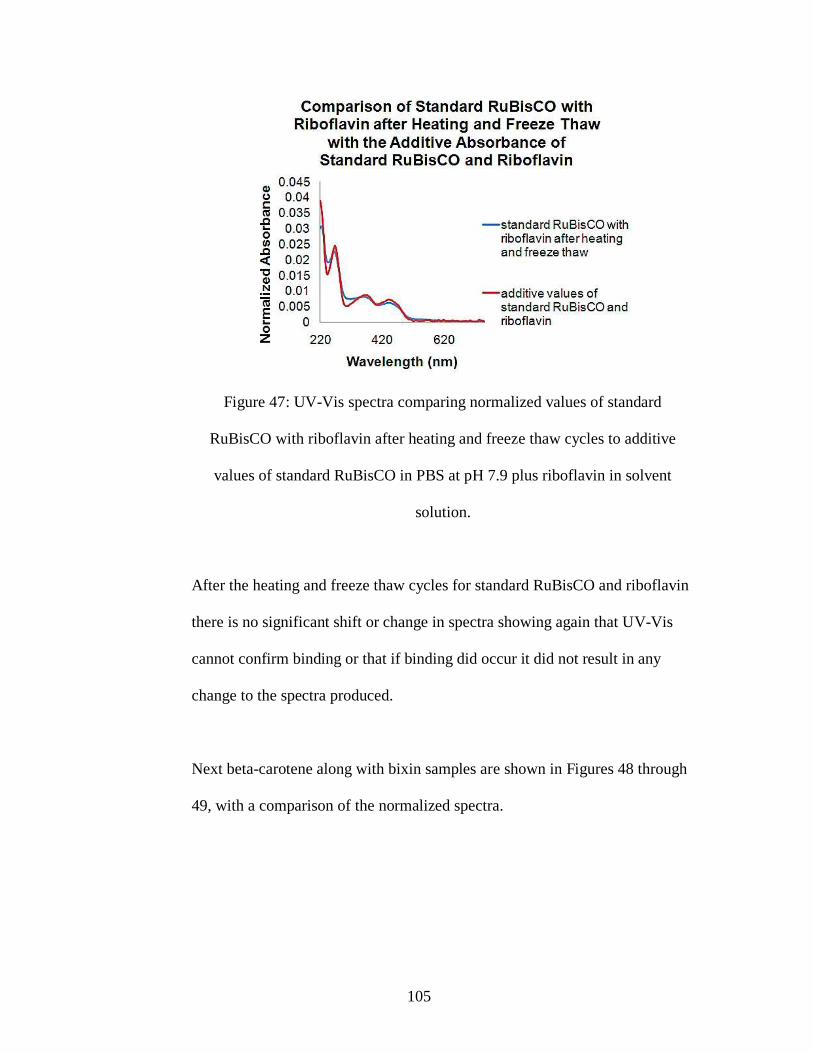
105
Figure 47: UV-Vis spectra comparing normalized values of standard
RuBisCO with riboflavin after heating and freeze thaw cycles to additive
values of standard RuBisCO in PBS at pH 7.9 plus riboflavin in solvent
solution.
After the heating and freeze thaw cycles for standard RuBisCO and riboflavin
there is no significant shift or change in spectra showing again that UV-Vis
cannot confirm binding or that if binding did occur it did not result in any
change to the spectra produced.
Next beta-carotene along with bixin samples are shown in Figures 48 through
49, with a comparison of the normalized spectra.

106
Figure 48: UV-Vis spectra comparing normalized values of standard
RuBisCO with beta-carotene after heating and freeze thaw cycles to additive
values of standard RuBisCO plus beta-carotene in PBS at pH 7.9.
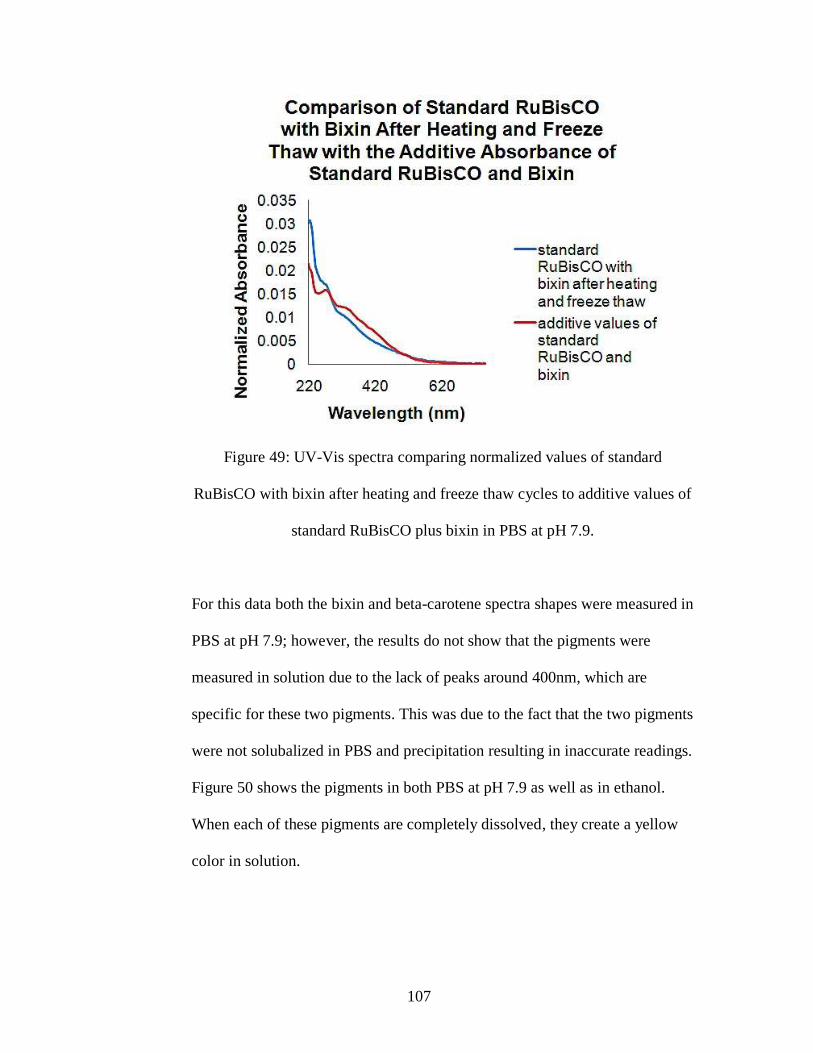
107
Figure 49: UV-Vis spectra comparing normalized values of standard
RuBisCO with bixin after heating and freeze thaw cycles to additive values of
standard RuBisCO plus bixin in PBS at pH 7.9.
For this data both the bixin and beta-carotene spectra shapes were measured in
PBS at pH 7.9; however, the results do not show that the pigments were
measured in solution due to the lack of peaks around 400nm, which are
specific for these two pigments. This was due to the fact that the two pigments
were not solubalized in PBS and precipitation resulting in inaccurate readings.
Figure 50 shows the pigments in both PBS at pH 7.9 as well as in ethanol.
When each of these pigments are completely dissolved, they create a yellow
color in solution.
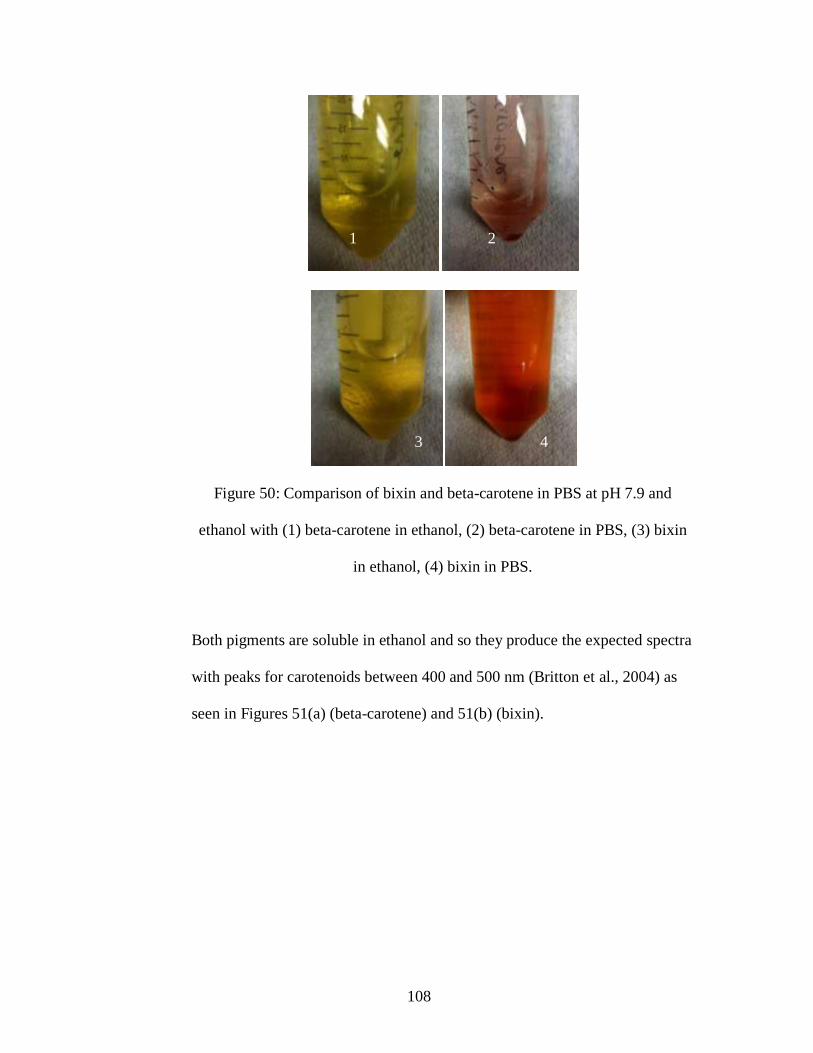
108
Figure 50: Comparison of bixin and beta-carotene in PBS at pH 7.9 and
ethanol with (1) beta-carotene in ethanol, (2) beta-carotene in PBS, (3) bixin
in ethanol, (4) bixin in PBS.
Both pigments are soluble in ethanol and so they produce the expected spectra
with peaks for carotenoids between 400 and 500 nm (Britton et al., 2004) as
seen in Figures 51(a) (beta-carotene) and 51(b) (bixin).
1 1 2
3
1
4
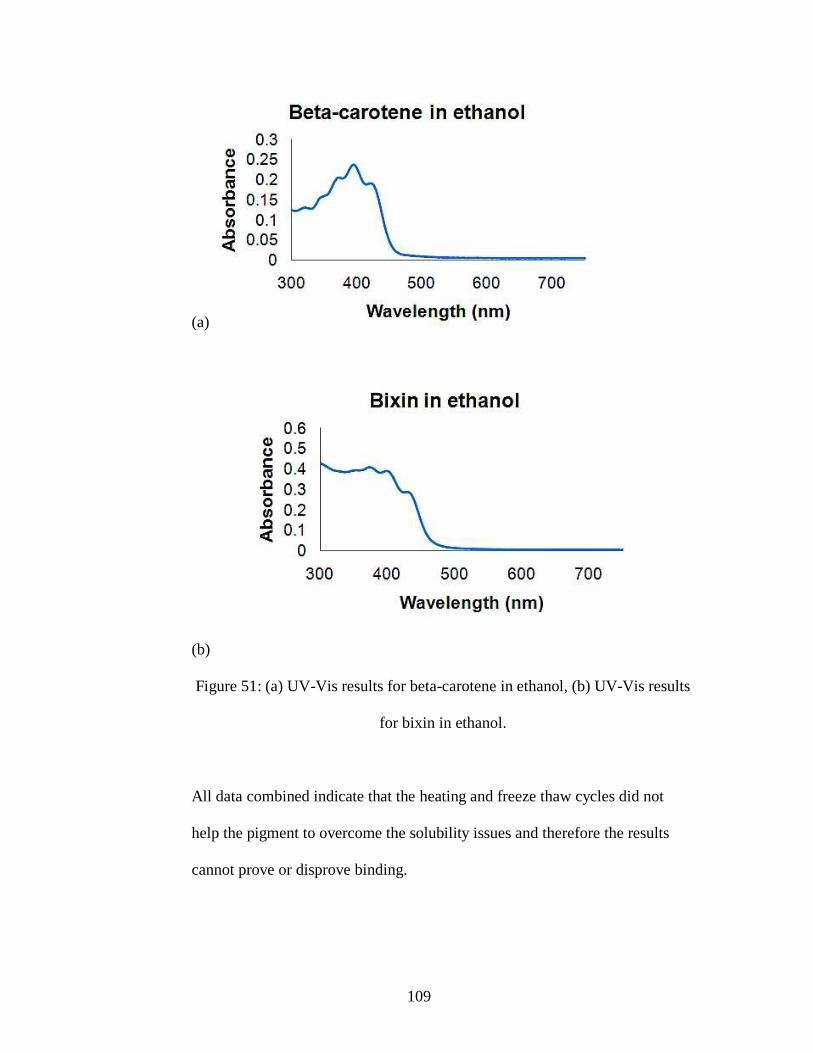
109
(a)
(b)
Figure 51: (a) UV-Vis results for beta-carotene in ethanol, (b) UV-Vis results
for bixin in ethanol.
All data combined indicate that the heating and freeze thaw cycles did not
help the pigment to overcome the solubility issues and therefore the results
cannot prove or disprove binding.
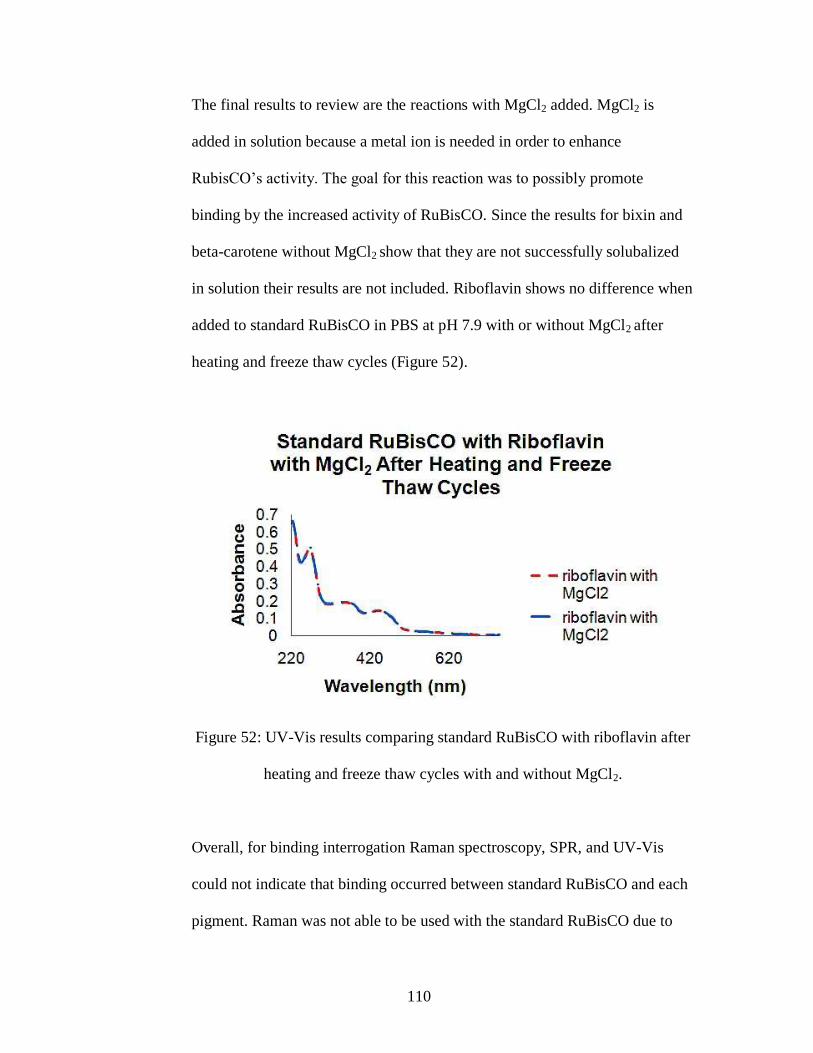
110
The final results to review are the reactions with MgCl2 added. MgCl2 is
added in solution because a metal ion is needed in order to enhance
RubisCO’s activity. The goal for this reaction was to possibly promote
binding by the increased activity of RuBisCO. Since the results for bixin and
beta-carotene without MgCl2 show that they are not successfully solubalized
in solution their results are not included. Riboflavin shows no difference when
added to standard RuBisCO in PBS at pH 7.9 with or without MgCl2 after
heating and freeze thaw cycles (Figure 52).
Figure 52: UV-Vis results comparing standard RuBisCO with riboflavin after
heating and freeze thaw cycles with and without MgCl2.
Overall, for binding interrogation Raman spectroscopy, SPR, and UV-Vis
could not indicate that binding occurred between standard RuBisCO and each
pigment. Raman was not able to be used with the standard RuBisCO due to

111
high fluoresces. SPR showed that standard RuBisCO kinetics could be
determined for binding to anti-RuBisCO (mouse monoclonal) but that when
the pigments were added in solution the kinetics did not change significantly.
UV-Vis offered results that did not confirm or deny binding or creation of
protein-pigment complex. The fact that the carotenoid pigments chosen could
not be solubalized in solution offered an increased challenge and made it
difficult to compare spectra. Riboflavin, which was soluble in water, did not
offer any information that confirmed binding even with heating and freeze
thaw trials or sonication.
5.2 Extraction
Freezing Tobacco Tissues
The tobacco plants were harvested in the August 2009 and then immediately
and successfully frozen in liquid nitrogen stored at -80°C. It was imperative
that the plant material be stored in a manner that would maintain the protein
structure so that experiments could be run throughout the year, rather than
limit research to the main harvesting time for the tobacco crop in the summer
to early fall. The frozen pellets of tobacco extract in were then ground down
to a fine powder as needed. This powder was then further used in assays to
extract protein with the paramagnetic antibody beads.
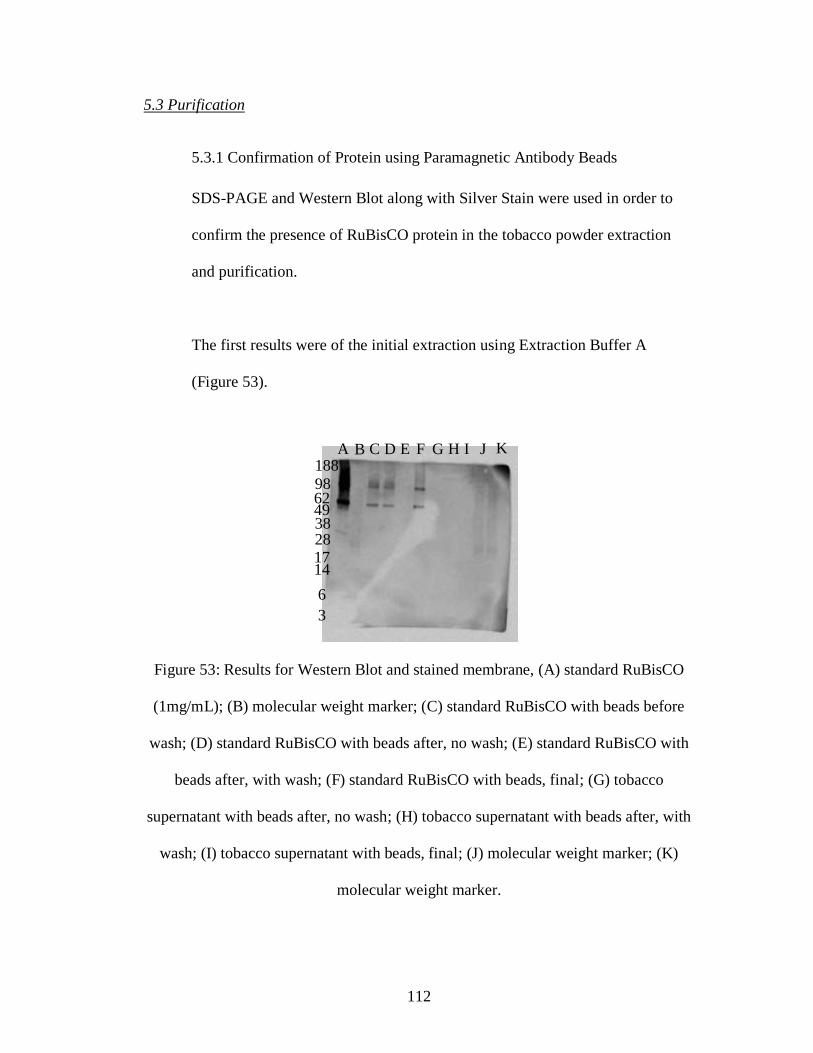
112
5.3 Purification
5.3.1 Confirmation of Protein using Paramagnetic Antibody Beads
SDS-PAGE and Western Blot along with Silver Stain were used in order to
confirm the presence of RuBisCO protein in the tobacco powder extraction
and purification.
The first results were of the initial extraction using Extraction Buffer A
(Figure 53).
Figure 53: Results for Western Blot and stained membrane, (A) standard RuBisCO
(1mg/mL); (B) molecular weight marker; (C) standard RuBisCO with beads before
wash; (D) standard RuBisCO with beads after, no wash; (E) standard RuBisCO with
beads after, with wash; (F) standard RuBisCO with beads, final; (G) tobacco
supernatant with beads after, no wash; (H) tobacco supernatant with beads after, with
wash; (I) tobacco supernatant with beads, final; (J) molecular weight marker; (K)
molecular weight marker.
B C D E F G H I J K
= A
188
98 62 49 38 28 17 14
6
3
113
For this run it can be seen that the control, lane A (Figure 53), of 1mg/mL
standard RuBisCO shows that the antibody (anti-RuBisCO, spinach,
monoclonal) used binds well to the protein of interest. Lanes B, J, and K are
the molecular weight markers. Lane F shows the final, after incubation and
washing is complete, for the standard RuBisCO with the beads, and this
provides an example that the beads do extract the standard RuBisCO protein.
Lanes C and D show standard RuBisCO on the beads with no washes, so
RuBisCO is expected to be present. Lane E shows the supernatant after
washing which should contain no RuBisCO, as all the protein should be
bound to the beads, which was accomplished. Rows G through I are the
tobacco extraction lanes, and these do not show any RuBisCO present. At this
point the Extraction Buffer B was developed in order to help optimize the
extraction and obtain RuBisCO extraction from tobacco. Extraction Buffer B
had more Triton, and more detergent can help protein solubalized into
solution. Also, there was more NaCl added to provide a net negative
environment that can make the proteins more likely to solubalized. The pH of
each extraction buffer was adjusted to 7.9, as this was the most favorable pH
to have RuBisCO in solution based on previous studies with aggregation as
well as details provided when ordering standard RuBisCO (Sigma).
The next run involves the use of both Extraction Buffers A and B (Table 2).
For this part of the experiment both the pellet and the supernatant from the
extraction were used in order to understand where the RuBisCO protein may
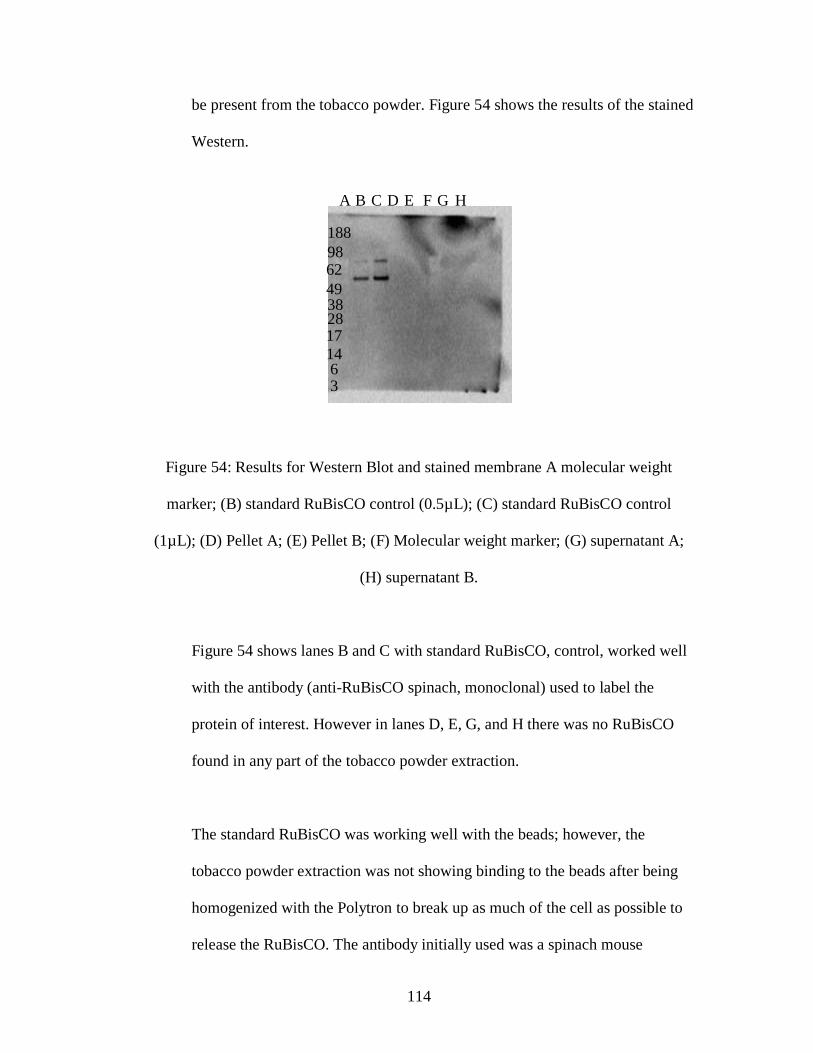
114
be present from the tobacco powder. Figure 54 shows the results of the stained
Western.
Figure 54: Results for Western Blot and stained membrane A molecular weight
marker; (B) standard RuBisCO control (0.5µL); (C) standard RuBisCO control
(1µL); (D) Pellet A; (E) Pellet B; (F) Molecular weight marker; (G) supernatant A;
(H) supernatant B.
Figure 54 shows lanes B and C with standard RuBisCO, control, worked well
with the antibody (anti-RuBisCO spinach, monoclonal) used to label the
protein of interest. However in lanes D, E, G, and H there was no RuBisCO
found in any part of the tobacco powder extraction.
The standard RuBisCO was working well with the beads; however, the
tobacco powder extraction was not showing binding to the beads after being
homogenized with the Polytron to break up as much of the cell as possible to
release the RuBisCO. The antibody initially used was a spinach mouse
A B C D E F G H
188
98 62
49 38 28 17
14 6 3
115
monoclonal antibody for the large subunit of RuBisCO. This antibody was
used for SPR and there was hope of it also working for tobacco protein;
however no cross reactivity of this antibody between species was seen due to
a in the lack of any protein bands from tobacco samples when incubated with
beads on the gel (Figure 54 (D-H)). The standard RuBisCO (spinach) samples
worked well with the beads and help to confirm the methodalogy chosen
(Figure 53, (F)). Another antibody was chosen, RbcL polyclonal anti-rabbit
because it was stated to be specific for all plant and algal samples
(www.agreseria.com).
Before the RbcL polyclonal antibody was used, the tobacco extract was run
through methanol precipitation to determine if there was in fact protein
present for the paramagnetic antibody conjugated beads to capture. The
ground tobacco powder was homogenized with the Polytron in both extraction
buffers A or B and then run through a methanol precipitation procedure with
results shown via poncaeu stain (dye electrostatically binds to protein) (Figure
55).

116
Figure 55: Poncaeu stain of samples from tobacco powder extraction with
methanol extraction: (A) standard RuBiSCO; (B) supernantant A; (C) pellet
A; (D) supernatant B; (E) pellet B.
The results from Figure 55 showed that protein was present in the ground
tobacco powder after methanol precipitation. The final ground tobacco
powder when used with the beads did not go through methanol extraction, this
method was solely used to check the protein content to ensure that the
extraction buffer with ground tobacco powder did contain protein. In lane D it
can be seen that extraction buffer B provides a higher level of overall protein,
so for all future extractions from the ground tobacco powder, extraction buffer
B was used. Also, the Polytron for these samples was used at the higher level
of 6 to 7 to help break up all ground tobacco powder and release all protein
present.
A B C D E 188
98 62
49 38 28 17
14 6 3

117
The supernatant from extraction buffer B was compared to methanol
precipitation of supernatant with dilutions (Figure 56).
Figure 56: Silver stain comparison of supernatant from extraction buffer B
with methanol extraction and dilutions, (A) supernatant from extraction with
buffer B; (B) standard RubisCO; (C) supernatant with methanol extraction;
(D) 15µL supernatant with methanol extraction in loading buffer (1X) plus
5µL loading buffer (1X); (E) 10µL supernatant with methanol extraction in
loading buffer (1X) plus 10µL loading buffer (1X); (F) 5µL supernatant with
methanol extraction in loading buffer (1X) plus 15µL loading buffer (1X); (G)
1µL supernatant with methanol extraction in loading buffer (1X) plus 19µL
loading buffer (1X).
Figure 56 shows that there were bands in the supernatant that match the
standard RuBisCO, 56 kDa (lane B), as rows A and C all have dark stains in a
similar region as the standard. The methanol precipitation was no longer
A B C D E F G
188
98 62
49 38 28 17
14 6 3
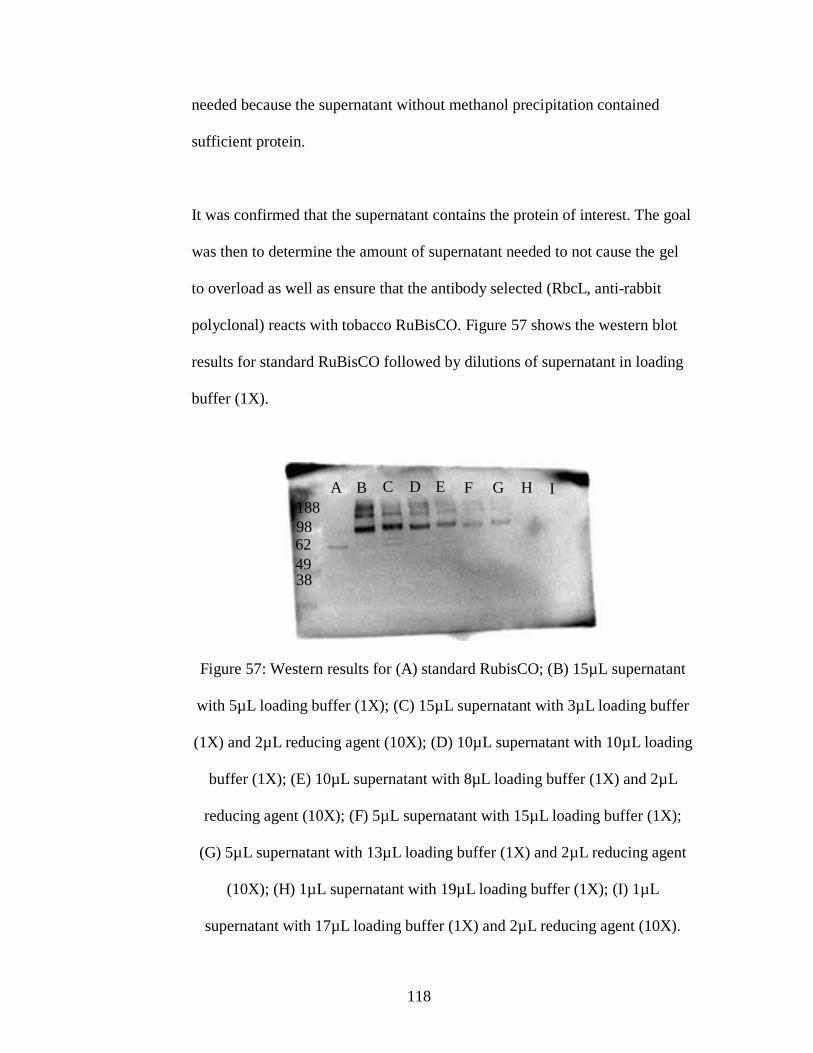
118
needed because the supernatant without methanol precipitation contained
sufficient protein.
It was confirmed that the supernatant contains the protein of interest. The goal
was then to determine the amount of supernatant needed to not cause the gel
to overload as well as ensure that the antibody selected (RbcL, anti-rabbit
polyclonal) reacts with tobacco RuBisCO. Figure 57 shows the western blot
results for standard RuBisCO followed by dilutions of supernatant in loading
buffer (1X).
Figure 57: Western results for (A) standard RubisCO; (B) 15µL supernatant
with 5µL loading buffer (1X); (C) 15µL supernatant with 3µL loading buffer
(1X) and 2µL reducing agent (10X); (D) 10µL supernatant with 10µL loading
buffer (1X); (E) 10µL supernatant with 8µL loading buffer (1X) and 2µL
reducing agent (10X); (F) 5µL supernatant with 15µL loading buffer (1X);
(G) 5µL supernatant with 13µL loading buffer (1X) and 2µL reducing agent
(10X); (H) 1µL supernatant with 19µL loading buffer (1X); (I) 1µL
supernatant with 17µL loading buffer (1X) and 2µL reducing agent (10X).
A B
A
C D E F G H I
188
98 62
49 38
119
The results from Figure 57 show that the reducing agent does not affect the
migration of the tobacco supernatant because there was no band shift. The
reducing agent, which helps to break apart proteins further, was added in order
to help migration because of all the debris present in the supernatant. Also,
this shows that the antibody was not reacting with the RuBisCO present in
tobacco, as none of the bands correspond with the standard RuBisCO band
around 56 kDa (only faint bands in lane C). This may be because the tobacco
supernatant had too much debris and other proteins present that it was not able
to migrate as fast as the standard RuBisCO. So, the dark lower band in the
dilutions could be tobacco RuBisCO, or the antibody may not be specific for
tobacco RuBisCO.
The final step in using the beads was to determine if the conjugated beads can
capture the tobacco RuBisCO, and this was determined with both Western
blot results as well as silver staining. Figures 58 shows the results of
incubating 1mL of the supernatant with 25µL of the conjugated beads (RbcL
anti-rabbit, polyclonal for RuBisCO).
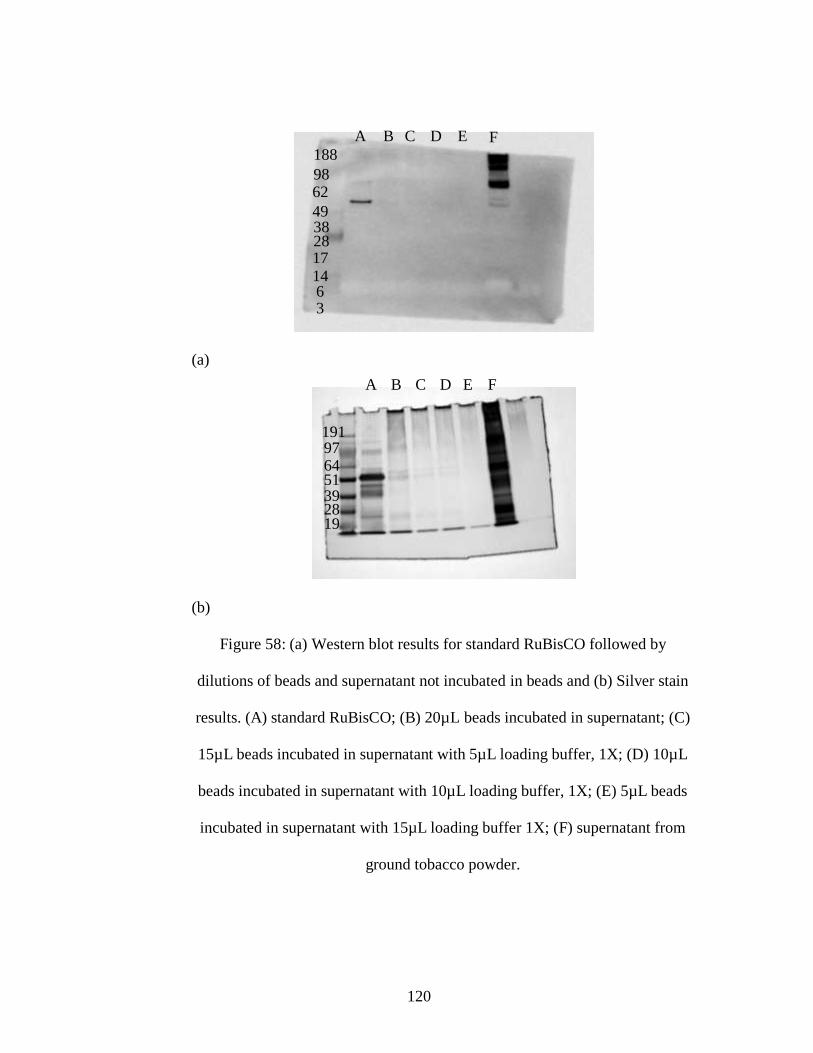
120
(a)
(b)
Figure 58: (a) Western blot results for standard RuBisCO followed by
dilutions of beads and supernatant not incubated in beads and (b) Silver stain
results. (A) standard RuBisCO; (B) 20µL beads incubated in supernatant; (C)
15µL beads incubated in supernatant with 5µL loading buffer, 1X; (D) 10µL
beads incubated in supernatant with 10µL loading buffer, 1X; (E) 5µL beads
incubated in supernatant with 15µL loading buffer 1X; (F) supernatant from
ground tobacco powder.
A B
A
C D E F 188
98 62
49 38 28 17 14 6 3
A B C D E F
39
191 97 64 51
28 19
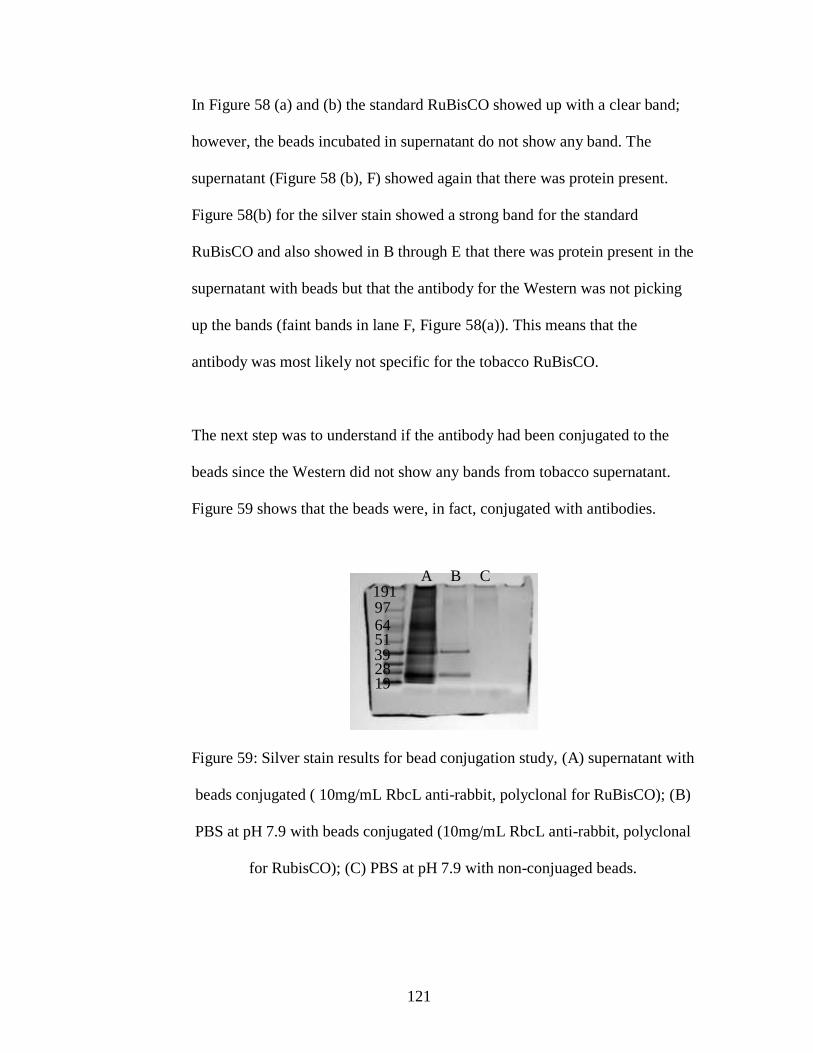
121
In Figure 58 (a) and (b) the standard RuBisCO showed up with a clear band;
however, the beads incubated in supernatant do not show any band. The
supernatant (Figure 58 (b), F) showed again that there was protein present.
Figure 58(b) for the silver stain showed a strong band for the standard
RuBisCO and also showed in B through E that there was protein present in the
supernatant with beads but that the antibody for the Western was not picking
up the bands (faint bands in lane F, Figure 58(a)). This means that the
antibody was most likely not specific for the tobacco RuBisCO.
The next step was to understand if the antibody had been conjugated to the
beads since the Western did not show any bands from tobacco supernatant.
Figure 59 shows that the beads were, in fact, conjugated with antibodies.
Figure 59: Silver stain results for bead conjugation study, (A) supernatant with
beads conjugated ( 10mg/mL RbcL anti-rabbit, polyclonal for RuBisCO); (B)
PBS at pH 7.9 with beads conjugated (10mg/mL RbcL anti-rabbit, polyclonal
for RubisCO); (C) PBS at pH 7.9 with non-conjuaged beads.
A B C 191 97 64 51
28 19
39

122
A main point from Figure 59 is that there was a difference between the
conjugated beads and non-conjugated beads. In order to understand that the
antibody had been conjugated this gel was used to show a difference between
conjugated beads and non-conjugated beads. In lanes A and B the bands (39
kDa and 25 kdA) show protein was present (antibody) and lane C there was
no protein present (no bands) meaning there was no antibody; confirming that
the conjugation of the beads worked well. This means that the antibody was
present on the beads when it was used with the supernatant from the ground
tobacco powder. Also, the supernatant was proteinaecious and with silver
staining does show a band matching with the standard RuBisCO, so it was
possible that again the antibody was not specific for tobacco RuBisCO.
The final trial with the supernatant and beads shows unique results. Figure 60
(a) shows that the antibody (RbcL, anti-rabbit, polyclonal for RuBisCO) was
not specific for tobacco RuBisCO before unfolding. Figure 60 (b) shows the
silver stain of the final trial.

123
(a)
(b)
Figure 60: (a) Western blot results for final bead and supernatant trials and (b)
silver stain results. (A) standard RuBisCO; (B) supernatant with conjugated
beads (10mg/mL anti-rabbit, polyclonal for RuBisCO); (C) PBS at pH 7.9
with conjugated beads (10mg/mL anti-rabbit, polyclonal for RuBisCO); (D)
PBS at pH 7.9 with non-conjugated beads; (E) supernatant; (F) supernatant
1:10; (G) supernatant 1:100; (H) supernatant 1:1000.
The western results for this study show the supernatant contains RuBisCO
from tobacco (Figure 60(a),(E)) and has strong bands. The antibody used for
the western showed RuBisCO present as the bands line up with the standard
RuBisCO ( 56 kDA). The main challenge was that the beads with supernatant
A B C D E F G H
191 97 64 51
28 19
39
D
191 97 64 51
28 19
39
A B E F C G H

124
do not show any bands matching with standard RuBisCO. This could be due
to the fact that the supernatant was unfolded (during heating before SDS-
PAGE) in lane E (Figure 60(a)) and then exposed to the antibody, but with the
beads the protein is folded and exposed to the antibody. The antibody (RbcL)
contains an epitope that was specific to a peptide that is burried inside the
protein (J. Porankiewicz-Asplund, personal communication) before unfolding
and thus heating and denaturation opens the tertiary structure allowing the
antibody to bind. So, when the protein was folded in the supernatant it could
not bind to the antibody on the beads because the peptide was not presented in
a manner that it could reach; however, when the supernatant was denatured
and then run on Western blot the antibody could clearly bind the peptide, and
thus the bands for the protein are seen. The company (www.agrisera.com) that
produces the antibody provides an image of Western blot results using the
antibody RbcL, anti-rabbit, polyclonal for RuBisCO that shows a vareity of
affinity to different plants (Figure 61).
Figure 61: Western blot results from (1) Spinacia oleracea; (2) Synechococcus
PCC 7942; (3) Cyanophora paradoxz; (4) Heterosigma akashiwo; (5)
Thalassiosira pseudonana; (6) Euglena gracilis; (7) Micromonas pusila (8)
Chlamydomanas reinhardtii (9) Prophyra sp; (10) Gonyaulax polyedra; (11)
Emiliania huxleyi. Premission from www.agrisera.com.
125
The Western blot shown in Figure 61 showed that the antibody has varying
affinity potentially due to the peptide sequence being burried inside of the
RuBisCO molecule. In lanes 5, 7, and 8 it was difficult to make out the bands
for RuBisCO.
The other main challenge was that there was increased background noise in
the samples with supernatant as seen in Figure 56 lanes B and E through H.
The noise (lipids, sugars, or other proteins) could result in interference with
the beads conjugated with the antibody (RbcL) and preventing binding to the
protein of interest. When the supernatant was diluted the background noise is
reduced, but it also reduced the overall level of protein that could be seen
(Figure 56 lanes E and F). This means that even if the noise is removed, it is
unlikely that the tobacco RuBisCO will be left at a high enough concentration
to detect and bind to the antibody conjugated beads.
The next step in research is to continue screening antibodies to find one that
works well with tobacco RuBisCO, to provide strong darkly color bands of
protein at 56 kDa similar to the standard RuBisCO, and can bind the protein to
the conjugated beads to provide future purification and use of the protein.
126
5.4 Recommendations to Continue Research
5.4.1 Binding Promotion
Originally it was thought that since RuBisCO is present in the chloroplast and
it is difficult to remove any green coloring completely that the protein was
actively bound to the pigment; however, chlorophyll binds and helps to fold
light harvesting proteins. In fact, denatured light harvesting protein, such as
LHC II, does not refold unless the pigment [chlorophyll] are present (Booth et
al. 2001). While RuBisCO does not bind chlorophyll itself, it may be possible
to use this similar idea to promote the refolding of the protein in order to bind
the pigments of interested by the use of a chaperone. A chaperone, while not
necessarily a protein itself, helps to organize the protein structure that it is
interacting with to provide function and correct or reorganized folding
(Sadava, 2011). It was seen that with solely RuBisCO and each pigment in
solution binding did not occur or the instruments used to measure the binding
did not show that it occurred. Sonication did not help to increase binding and
freezing and heat thaw cycles (used to create protein-pigment complexes with
chlorophyll and LHCII (Paulsen et al. 1990)) did not help to form protein-
pigment complexes with RuBisCO and the pigments chosen and overcome
solubility differences. The major challenge that needs to be addressed is the
fact that both beta-carotene and annatto extract are not water soluble, whereas
RuBisCO is water soluble. This means that if the pigments are dissolved in
solution the RuBisCO aggregates out and binding cannot occur.

127
If the issue of solubility was the only challenge then binding would have been
achieved with water soluble riboflavin, but this was not the case. Help is
needed to promote binding of these pigments. Apetri and Horwich (2008)
show that a molecular chaperon (GroEL) is needed in order to increase the
reactivity and folding of RuBisCO, and as seen before in Booth et al., (2001)
the light harvesting proteins will not fold correctly without pigments present.
Overall, the methods used of adding the pigments in solution with RuBisCO
followed by mixing, sonication, or heating and freeze thaw cycles, do not
result in binding or confirmation of binding with the instruments used and
further trials are needed to understand how these pigments interact with the
protein. By understanding how the proteins and pigments interact it might be
possible to choose a chaperon that will help to promote binding.
5.4.2 Completion of Protein Purification
A secondary focus of the research was extracting the tobacco RuBisCO
directly from tobacco leaves in a manner that provided purified protein that
was not denatured in order to keep the stability of the protein and offer a pure
sample to bind to the pigments of interest. A method to extract proteinaceous
liquid from tobacco leaves was developed; however, removing RuBisCO from
this solution was not accomplished due to a lack of cross reactivity among the
antibodies chosen. The first antibody was specific only for spinach RuBisCO
and demonstrated that the method of using paramagnetic antibody beads will
be useful to single out tobacco RuBisCO if an appropriate antibody can be
128
chosen. The second antibody used was said to have a general specificity for
plants and algae; however, this antibody also did not prove to be specific for
tobacco. The peptide of interest for this second antibody is buried inside of the
RuBisCO protein, so when the protein was unfolded it reacted well with the
antibody. The next step will be to continue screening antibodies and to start
with the antibody mentioned in Foyer et al., 1993. This article offers an
antibody that is proven to work with tobacco RuBisCO. After the antibody is
found to work with tobacco RuBisCO on the paramagnetic beads, a method to
remove the protein will need to be optimized.
129
Chapter 6: Conclusion
The foci of the present studies include the feasibility of binding RuBisCO
protein to the pigments chosen (riboflavin, beta-carotene, and annatto extract
[bixin]) as well as extracting a pure protein from tobacco to provide
alternative uses for the ill-imaged crop. The attempt to form RuBisCo-
pigment complexes was not successful or not be confirmed with the tools used
to measure the formation, due mainly to the limited sites available for binding,
which could be attributed to the folding of protein during the extraction and
purification of RuBisCO. A better understanding of how to expose the sites
responsible for pigment binding as well as how each of the pigments interacts
with RuBisCO is needed in order to promote and enhance binding. A method
to extract RuBisCO protein from tobacco crops was developed with a highly
proteinaceous solution from tobacco leaves. While such an approach was
proven feasible; however, further research with antibody screening is needed
in order to select the most effective antibody to optimize the extraction
methods that could reach a final pure protein from the tobacco plant. The
ability of RuBisCO to bind antioxidative pigments is of interest to the food
industry, if effective binding can be established. Furthermore, the stability of
the protein-pigment complex will need to be assessed to understand how it
might be utilized in food products to provide enhanced color, antioxidants,
and protein to the consumer.
130
Bibliography
Biacore (2002) An Introduction to Biacore's SPR Technology. Web. 25 June 2010.
<http://www.rci.rutgers.edu/~longhu/Biacore/pdf_files/SPR_Technology_Bro
chure.pdf>
Agte V, Kirtan T, Sangeeta M, Ashwini H, & Shashi C (2002) Vitamin profile of
cooked foods: how health is the practice of ready-to-eat foods? International
Journal of Food Sciences and Nutrition, 53, 197-208.
Andersson I, Ann-Christin T, Eila CZ, & Branden CI (1983) Crystallization and
Preliminary X-ray Studies of Spinach Ribulose 1, 5-Bisphosphate
Carboxylase/Oxygenase Complexed with Activator and a Transition State
Analogue. The Journal of Biological Chemistry, 258, 14088-4090.
Apetri AC & Horwich AL (2008) Chaperonin Chamber Accelerates Protein Folding
through Passive Action of Preventing Aggregation. Proceedings of National
Academy of Science, 105.45, 17351-7355.
Baker TS, Se WS, & Eisenberg D (1977) Structure of Ribulose-1, 5-bisphosphate
Carboxylase-oxygenase. Proceedings of National Academy of Sciences of the
USA, 74.3, 1037-041.
Britton G, Liaaen-Jensen S, & Pfander H (2004) Carotenoids Handbook. Boston:
Birkha user Verlag.
Booth PJ & Paulsen H (1996) Assembly of Light-Harvesting Chlorophyll A/b
Complex in Vitro. Time-Resolved Fluorescence Measurement. Biochemistry,
35.16, 5103-108.
Booth PJ, Templer RH, Meijberg W, Allen SJ, Rachael C, & Mark L (2001) In Vitro
131
Studies of Membrane Folding Proteins. Critical Reviews in Biochemistry and
Molecular Biology 36.6, 501-603.
Burri BJ (1997) Beta-Carotene and Human Health: A Review of Current Research.
Nutrition Research 17.3, 547-80.
Chang PH, Sakano K, Singh S, & Wildman SG (1972) Crystalline Fraction I Protein:
Preparation in Large Yield. Science, 176.4039, 1145-146.
Darago, Connie (2000) Maryland Tobacco Futures. Bay Weekly Online 8. Web 12
Jan. 2009 <http://www.bayweekly.com/year00/issue8_13/lead8_13.html>.
De La Cruz-Cañizares J, Doménech-Carbó MT, Gimeno-Adelantado JV, Mateo-
Castro R, & Bosch-Reig F (2004) Suppression of Pigment Interference in the
Gas Chromatographic Analysis of Proteinaceous Binding Media in Paintings
with EDTA. Journal of Chromatography A, 1025, 277-85.
Delgado-Vargas F & Paredes-Lopez O (2003) Natural colorants for Food and
Nutraceutical Uses. New York: CRC.
Eitenmiller RR, Ye L, & Landen WO (2008) Vitamin Analysis for the Health and
Food Sciences. Boca Raton: CRC.
Fashui H, Chao L, Lei Z, Xuefeng W, Kang W, Weiping S, Shipeng L, Ye T, &
Guiwen Z (2005) Formation of Complexes of Rubisco-Rubisco Activase from
La3+
, Ce3+
Treatment Spinach. Science in China Series B: Chemistry, 48.1,
67-74.
Fu H, Machado PA, Kratochvil RJ, Wei CI, & Lo YM (2010) Recovery of nicotine-
free proteins from tobacco leaves using phosphate buffer system under
controlled conditions. Bioresource Technology, 101(6), 2034-2042.
132
Foyer CH, Nurmi A, Dulieu H, & Parry MJ (1993) Analysis of Two Rubisco-
deficient Tobacco Mutants, H7 and Sp 25; Evidence for the Production of
Rubisco Large Subunits in the Sp25 Mutant That Forms Clusters and Are
Inactive. Journal of Experimental Botany, 44, 1445-452.
Heras H, Dreon MS, Ituarte S, & Pollero RJ (2007) Review: Egg carotenoproteins in
neotropical Ampullariidae (Gastropoda: Arquitaenioglossa). Comparative
Biochemistry and Physiology, Part C 146, 158-67.
Holler C & Zhang C (2008) Purification of an Acidic Recombinant Protein from
Transgenic Tobacco. Biotechnology and Bioengineering, 99, 902-09.
Ingle JD & Crouch SR (1988) Spectrochemical Analysis. Upper Saddle River, NJ:
Prentice Hall.
Johal S, Bourque DP, Smith WW, Suh SW, & Eisenberg D (1980) Crystallization and
Characterization of Ribulose 1, 5-Bisphosphate Carboxylase/Oxygenase from
Eight Plant Species. The Journal of Biological Chemistry, 255.18, 8873-880.
Liu RH (2003) Health benefits of fruit and vegetables are from additive and
synergistic combinations of phytochemicals. American Journal of Clinical
Nutrition, 78(3), 517S-520.
Kanjilal PB & Singh RS (1995) Agronomic evaluation of annatto (Bixa orellana L.).
Journal of Herbs, Spices, and Medicinal Plants, 3(3), 13-17.
Mimuro M & Tanaka A (2004) The in vivo and in vitro reconstitution of pigment-
protein complexes, and its implication in acquiring a new system.
Photosynthesis Research, 81, 129-37.

133
Montanari L, Fantozzi P, & Pedone S (1993) Tobacco Fraction 1 Protein (F1P)
Utilization for Oral or Enteral Feeding of Patients. I: Heavy Metal Evaluation.
Journal of Food Science and Technology, 36.3, 259-63.
Nienhaus GU (2005) Protein-ligand Interactions: Methods and Applications. Totowa,
N.J.: Humana.
Nisha P, Singhal RS, & Pandit AB (2005) A study on degradation kinetics of
riboflavin in spinach (Spinacea oleracea L.). Journal of Food Engineering, 67,
407-12.
Paulsen H, Rümler U, & Rüdiger W (1990) Reconstitution of Pigment-containing
Complexes from Light-harvesting Chlorophyll A/b-binding Protein Over
expressed in Escherichia Coli*. Planta, 181.2, 204-11.
Pedone S, Selvaggini R, & Fantozzi P (1995) Leaf Protein Availability in Food:
Significance of the Binding of Phenolic Compounds to Ribulose-1, 5-
Diphosphate Carboxylase. Food Science and Technology, 28, 625-34.
Petsko GA & Ringe D (2004) Protein Structure and Function. London: New Science.
Ranhotra GS, Gelroth JA, Langemeier J, & Rogers DE (1995) Stability and \
Contribution of Beta Carotene Added to Whole Wheat Bread and Crackers.
Cereal Chemistry, 72.2, 139-41.
Rao AV & Rao LA (2007) Carotenoids and human health. Pharmacological
Research, 55, 207-16.
Sadava DE (2010) Life: the Science of Biology. Sunderland, MA: Sinauer Associates,
9th
ed.
134
Schasfoort RBM & Tudos AJ (2008) Handbook of Surface Plasmon Resonance.
Cambridge: Royal Society of Chemistry.
Scheneider G, Lindqvist Y, & Branden CI (1992) RUBISCO: Structure and
Mechanism. Annual Review of Biophysics and Biomolecular Structure, 21,
119-43.
Skoog DA, Holler FJ, & Crouch SR (2007) Principles of Instrumental Analysis.
Belmont: Thomson, 6th
ed.
Socaciu C (ed) (2008) Food Colorants: Chemical and Functional Properties. Boca
Raton, Fla.: CRC.
Sterner R & Höcker B (2005) Catalytic Versatility, Stability, and Evolution of the
(beta-alpha)8- Barrel Enzyme Fold. Chemical Reviews, 105, 4038-055.
United States Department of Agriculture (2007) Census of Agriculture: Economics.
National Agricultural Statistics Service Web. 14 June 2010.
<http://www.agcensus.usda.gov/Publications/2007/Online_Highlights/Fact_S
heets/economics.pdf>.
Wang W, Liu QL, & Cui H (2007) Rapid desalting and protein recovery with phenol
after ammonium sulfate fractionation. Electrophoresis, 28, 2358-360.
Wang W, Vignani R, Scali M, & Cresti M (2006) A universal and rapid protocol for
protein extraction from recalcitrant plant tissues for proteomic analysis.
Electrophoresis, 27, 2782-786.
Wissgott U & Bortlik K (1996) Prospects for New Natural Food Colorants. Trends in
Food Science and Technology, 7, 298-302.

135
Worrall DM (1996) Dye-Ligand Affinity Chromatography. Protein purification
protocols, Totowa, N.J: Humana, 59.
Yancy & Cecil H (2004) Buyout brings changes to Maryland farm landscape.
Southwest Farm Press Web 12 Jan. 2009
<http://southwestfarmpress.com/news/maryland-tobacco-buyout/>.
Yang X, Kathuria SV, Vadrevu R, & Matthews CR (2009) Beta-Alpha-Hairpin
Clamps Brace Beta-Alpha-Beta Modules and Can Make Substantive
Contributions to the Stability of Time Barrel Proteins. PloS ONE, 4.9, E7179.
Yanishlieva N & Gordon M, (2001) Pokorny J (ed) Antioxidants in Food: Practical
Applications. Cambridge: Woodhead Publishing Limited.
Zees AC, Pyrpassopoulos S, & Vorgias CE (2009) Insights into the Role of the (alpha
plus Beta) Insertion in the TIM-barrel Catalytic Domain, regarding the
Stability and the Enzymatic Activity of Chitinase A Form Serratia
Marcescens. BBA - Proteins and Proteomics, 1794.1, 23-31.
Zhang K, Cascio D, & Eisenberg D (1994) Crystal Structure of the unactivated
ribulose 1, 5-bisphosphate carboxylase/oxygenase complexed with a transition
state analog, 2-carboxy-D-arabinitol 1, 5-bisphosphate. Protein Science, 3, 64-
69.
Zhang Y, Liu C, Liu S, Shen Y, Kuang T, & Yang C (2008) Structural stability and
properties of three isoforms of the major light-harvesting chlorophyll a/b
complexes of photosystem II. International Journal of Biochemistry,
Biophysics and Molecular Biology, 1777, 479-87.

136
Zhou HY & Liu CZ (2006) Microwave-assisted extraction of solanesol from tobacco
leaves. Journal of Chromatography A, 1129.1, 135-39.