Embed Size (px)
Citation preview

ABSTRACT
Title of Document:
ANALYSIS OF THE EFFECTS OF TEMPERATURE
AND VELOCITY ON THE RESPONSE TIME INDEX
OF HEAT DETECTORS.
Andrew Tom Pomeroy, Master of Science, 2010
Directed By: Professor James A. Milke
Department of Fire Protection Engineering
Recent revisions to NFPA 72, the National Fire Alarm Code, have specified the response
time index (RTI) as the sensitivity listing for heat detectors. Originally derived as a
sprinkler sensitivity rating, there has been little work performed to validate the use of the
RTI rating for heat detectors. RTI values are determined by plunging the devices into a
hot wind tunnel at 200℃ (392℉) and 1.5 m/s (4.9 ft/s). These test conditions are
unrealistically severe for the majority of expected ceiling jet profiles. While the RTI
correlation is purported to be independent of temperature and velocity, data from
previous studies indicates otherwise. This study examined the effects of low temperature
and low velocity plunge test conditions on the constancy of the RTI for several common
heat detectors. The RTI correlation was found to be inconsistent across temperature and
velocity test conditions.

ANALYSIS OF THE EFFECTS OF TEMPERATURE AND VELOCITY ON THE
RESPONSE TIME INDEX OF HEAT DETECTORS
By
Andrew Tom Pomeroy
Thesis submitted to the Faculty of the Graduate School of the
University of Maryland, College Park, in partial fulfillment
of the requirements for the degree of
Master of Science
2010
Advisory Committee:
Professor James A. Milke, Chair
Dr. Daniel T. Gottuk
Professor Peter B. Sunderland

© Copyright by
Andrew Tom Pomeroy
2010

ii
Acknowledgements
I would like to thank several people for their support in making this research
possible. First, I would like to thank Dr. Daniel Gottuk, who identified the area of
concern that became the topic of my thesis and provided me with day-to-day guidance
throughout the duration of my thesis. He was the driving force behind this study and I
cannot overstate my appreciation for everything I learned from him. I would like to thank
Professor James Milke and Professor Peter Sunderland for being on my committee and
contributing their insight into improving the quality of my work. Dr. Milke was a big
factor that led me to Fire Protection Engineering as an undergraduate, and Dr.
Sunderland’s passion for teaching along with his approachability and kindness rank him
among the best teachers I have ever had. I would also like to thank Chris Mealy at
Hughes Associates for his design and construction of the plunge test apparatus used in
this study as well as his willingness to help me whenever I faced problems in the lab.
Finally, I would like to thank my parents for their never ending support of whatever I
chose to do in my life.

iii
Contents
1.0 Introduction ....................................................................................................1
1.1 Objectives ......................................................................................................1
1.2 Background ....................................................................................................1
1.3 Response Time Index Theory ........................................................................2
1.3.1 Application of RTI for Heat Detectors .......................................................8
1.4 Plunge Test Apparatus .................................................................................11
2.0 Test Setup and Procedure .............................................................................13
2.1 Alpert’s Correlations ....................................................................................13
2.2 Test Conditions ............................................................................................18
2.3 Thermal Stratification ..................................................................................19
2.4 HAI Plunge Test Apparatus .........................................................................21
2.4.1 General Design .........................................................................................21
2.4.2 Instrumentation.........................................................................................25
2.4.3 Calculations ..............................................................................................27
2.4.4 Temperature Profile..................................................................................28
2.4.5 Velocity Profile ........................................................................................32
2.5 Heat Detectors ..............................................................................................33
2.5.1 Thermal expansion heat detector..............................................................34
2.5.2 Thermistor heat detectors .........................................................................36
2.5.3 Thermal link heat detector........................................................................37

iv
2.6 Test Procedure .............................................................................................38
3.0 Plunge Test Results ......................................................................................40
3.1 Thermal expansion heat detector test results ...............................................40
3.1.1 Third party RTI comparison .....................................................................42
3.2 Thermistor heat detector test results ............................................................44
3.2.1 Third party RTI comparison .....................................................................47
3.3 Thermal link heat detector test results .........................................................49
4.0 Analysis........................................................................................................51
4.1 Temperature and velocity effects on the RTI correlation ............................51
4.1.1 Activation failure......................................................................................51
4.1.2 Alarm processing delays ..........................................................................53
4.2 Velocity exponent ........................................................................................54
5.0 Conclusion ...................................................................................................56
5.1 Future Work .................................................................................................58
6.0 Appendix A – HAI Plunge Test Apparatus Characterization ......................59
7.0 Appendix B – RTI Test Results ...................................................................62
8.0 References ....................................................................................................66

v
List of Tables
Table 1 – Abbreviated summary of ceiling jet velocities and temperatures that
would activate ordinary heat detectors at the maximum radial distance of 10.8 m
(35.4 ft). The radial distance corresponds to heat detector spacing of 15m x 15 m
(50 ft x 50 ft). ........................................................................................................ 16
Table 2 – Abbreviated summary of ceiling jet velocities and temperatures that
would activate ordinary heat detectors at a radial distance of 3.3 m (10.7 ft). The
radial distance corresponds to heat detector spacing of 4.6 m x 4.6 m (15 ft x 15
ft) ........................................................................................................................... 18
Table 3 – Summary of test conditions .................................................................. 19
Table 4 – Summary of average temperature and standard deviation for the HAI
plunge test apparatus. ............................................................................................ 31
Table 5 - Summary of average velocities and standard deviations for the HAI
plunge test apparatus. ............................................................................................ 32
Table 6 - Summary of heat detector IDs, activation temperatures, and method of
detection. ............................................................................................................... 34

vi
Table 7 – Summary of average RTI and standard deviation for thermal expansion
heat detector A. ..................................................................................................... 42
Table 8 – Average RTI and standard deviation for detectors B and D. ................ 47
Table 9 – Average RTI and standard deviation for detector C. ............................ 50
Table 10 –Standard deviation of RTI values across all velocities for 75℃ and
200℃ using velocity exponents of 0.3, 0.4, 0.5, and 0.6. The minimum values are
displayed in bold. .................................................................................................. 55
Table 11 – Summary of the average RTIs for each detector and test condition. The
numeric designation after the detector ID indicates the individual unit tested. .... 62
Table 12 – Summary of the average activation times (s) for each detector and test
condition. The numeric designation after the detector ID indicates the individual
unit tested. ............................................................................................................. 64

vii
List of Figures
Figure 1 – Ratio of thermal conductivity to kinematic viscosity for temperatures
ranging from 17℃ (63℉) to 227℃ (441℉) .......................................................... 5
Figure 2 – Sample data showing RTI behavior that is not independent of
temperature and velocity for a thermistor heat detector (Nam 2004). .................... 9
Figure 3 – Diagram and picture of the plunge test apparatus (Heskestad & Smith,
1976). .................................................................................................................... 11
Figure 4 – Diagram of the maximum expected radial distance between a fire and a
heat detector, based on 15m x 15m (50ft x 50ft) spacing. .................................... 15
Figure 5 – Illustration of the general configuration of the HAI plunge test
apparatus. .............................................................................................................. 23
Figure 6 – HAI Plunge test apparatus ................................................................... 24
Figure 7 – Elevation diagram of temperature and velocity probe locations inside
the HAI plunge test apparatus. The image on the left displays frontal view looking
into the test section and the image on the right displays the side view. All devices
are perpendicularly mounted in the middle of the duct face. ................................ 26

viii
Figure 8 – The temperature and velocity probe locations utilizing the Log-
Chebechev method of duct traversing are shown on the left. The picture on the
right shows the constructed thermocouple grid used to characterize the duct. ..... 29
Figure 9 – Color contour of the temperature profile for test condition 7 (200℃,
1.5 m/s (392℉, 4.9 ft/s)) ....................................................................................... 31
Figure 10 - Color contour of the velocity profile for test condition 6 (200℃, 1.0
m/s (392℉, 3.2 ft/s)) ............................................................................................. 33
Figure 11 –Thermal expansion heat detector A mounted to its plunge plate ....... 36
Figure 12 – Thermistor heat detectors mounted to their plunge plates. Detector B
is shown on the left and detector D is shown on the right. ................................... 37
Figure 13 – Thermal link heat detector C mounted to the plunge plate. .............. 38
Figure 14- Average RTI value and standard deviation for rate-compensated
thermal expansion detector A (60℃ (140℉)) ....................................................... 41
Figure 15 - Average RTI value and standard deviation for rate-compensated
thermal expansion detector A (71℃ (160℉))....................................................... 41

ix
Figure 16– Comparison of RTI values for detector A (71℃ (160℉)) obtained by
three independent labs; HAI, UL, and FM Global (Nam). ................................... 43
Figure 17 – Detailed diagram of the UL test apparatus (Underwriters Laboratory,
2005) ..................................................................................................................... 44
Figure 18 – Average RTI and standard deviation of the thermistor heat detector B
(47℃ (117℉)) ...................................................................................................... 45
Figure 19 – Average RTI and standard deviation of the thermistor heat detector B
(57℃ (135℉)) ...................................................................................................... 46
Figure 20 – Average RTI and standard deviation of the thermistor heat detector D
(57℃ (135℉)) ...................................................................................................... 46
Figure 21 – Comparison of RTI values for detector C (57℃ (135℉)) obtained by
three independent labs; HAI, UL, and FM Global (Nam). ................................... 48
Figure 22 - Average RTI and standard deviation of the thermal link heat detector
C (57℃ (135℉)) .................................................................................................. 49
Figure 23 – Comparison of the physical characteristics of the thermistor heat
detectors used in this study. Detector B is located on the left and detector D is
located on the right................................................................................................ 53

x
Figure 24 – Visualization of the temperature profile for test conditions 1 – 4. .... 59
Figure 25 – Visualization of the temperature profile for test conditions 5 – 8 ..... 60
Figure 26 – Visualization of velocity profile for test conditions 2, 4, 6, and 8. ... 61
Figure 27 - Summary of all RTI data for all detectors .......................................... 63
Figure 28 - Summary of all activation time data for all detectors ........................ 65

xi
Nomenclature
A = surface area of the heat sensing element (m2)
C = constant associated with sensing element geometry
Cp = specific heat of the heat sensing element (J/g − K)
g = acceleration due to gravity = 9.8 m/s2
Gr = Grashoff number
H = ceiling height (m)
hc = convective heat transfer coefficient (W/m2K)
k = thermal conductivity of gas at the film temperature (W/mK)
L = characteristic length scale of the element (m)
m = mass of the heat sensing element (g)
Mair = molecular weight of air (kg/mol)
n = velocity exponent Nu = Nusselt number = hcL/k
ρ = density of air inside the duct (kg/m3)
P∞ = ambient pressure = 101,300 Pa
∆P = dynamic pressure measured by pitot probe (Pa) Q = heat release rate (kW)
r = radial distance from the fire (m)
Ru = universal gas constant = 8.134 J/mol K
Re = Reynolds number
τ = time constant defined as (m Cp)/hc
t = time (s)
ta = activation time (s)
Te = temperature of the detector′s heat sensing element (K)
Tg = temperature of the gas (K)
Tg = temperature of the gas inside the duct (K)
∆Ta = activation temperature minus ambient temperature (K)
∆Te = sensing element temperature minus ambient temperature (K)
∆Tg = duct temperature minus ambient temperature (K)
u = gas velocity (m/s)
ν = kinematic viscocity of the gas at the film temperature (m2/s)

1
1.0 INTRODUCTION
Recent revisions to the National Fire Alarm Code (NFPA, 2007) have mandated
the adoption of the response time index (RTI) as part of the sensitivity rating for heat
detectors. The current test method used to derive RTI values was initially developed for
sprinkler testing and subjects the heat detectors to a temperature and air velocity profile
that is far more severe than what would typically be expected in a fire scenario. These
extreme conditions are meant to optimize the performance of the tests, rather than
replicate realistic conditions based on the assumption that the RTI is independent of air
velocity and temperature. While much work has been performed to validate the use of the
RTI correlation for sprinklers, the same cannot be said for heat detectors.
1.1 Objectives
The objective of this research is to examine the current heat detector sensitivity
test and analyze the effects of low temperature and low velocity test conditions on the
constancy of the response time index for heat detectors.
1.2 Background
The prevalence of sprinkler use in fire protection systems has led to an abundance
of research performed on their response characteristics. Prior to 1976, there was no
standard method for testing sprinkler sensitivity. The two major American organizations
involved in sprinkler testing, Underwriters Laboratory (UL) and Factory Mutual (FM),
had developed proprietary sprinkler sensitivity ratings. However, differences in air

2
velocities, temperatures, and testing apparatuses between the two laboratories led to
sensitivity results that were impossible to reproduce and validate. This changed when a
report by Factory Mutual introduced the “plunge test” for determining sprinkler
sensitivity, which has since become the de facto standard for testing and classifying
sprinkler response (Heskestad & Smith, 1976). In the report, a sensitivity rating known as
the response time index (RTI) was derived from a heat balance on the sprinkler’s thermal
link. In order to predict activation times for a large number of scenarios, the RTI
correlation was intended to be independent of air velocity and temperature. This would
allow RTI values determined in the lab to predict activation times in a wide range of fire
scenarios. The RTI correlation has been extensively studied for sprinklers, and is
generally accepted for characterizing sprinkler response.
1.3 Response Time Index Theory
The RTI correlation was derived from a heat balance analysis on a sprinkler’s
thermal link during a fire. There are four main assumptions in the analysis: 1) forced
convection is the dominant mode of heat transfer, 2) the element heats isothermally, 3)
after heating, no additional energy is needed to activate the device (i.e. no activation
heat), and 4) there are no conductive heat losses (Heskestad & Smith, 1976). Assuming
that the only mode of heat transfer is through convection, the heat balance on the thermal
link is shown below in Equation 1.

3
𝑚 𝐶𝑝
𝑑𝑇𝑒𝑑𝑡
= ℎ𝑐𝐴 𝑇𝑔 − 𝑇𝑒 (1)
where
A = surface area of the heat sensing element (m2)
Cp = specific heat of the heat sensing element (J/g − K)
hc = convective heat transfer coefficient (W/m2K)
m = mass of the heat sensing element (g)
t = time (s)
Te = temperature of the detector′s heat sensing element (K)
Tg = gas temperature inside the duct (K)
By introducing a time constant τ = (m Cp )/hc and referencing temperature relative to
the ambient temperature, Equation 1 can be modified into the following form:
𝑑∆𝑇𝑒𝑑𝑡
= τ−1 ∆𝑇𝑔 − ∆𝑇𝑒 (2)
where
τ = time constant defined as (m Cp)/hc
∆Te = sensing element temperature minus ambient temperature (K)
∆Tg = duct temperature minus ambient temperature (K)
Because the mass and the specific heat of the sensing element are assumed to be
relatively unchanging with respect to temperature and velocity, the time constant is
primarily dependent on the convective heat transfer coefficient. The non-dimensional
heat transfer coefficient, known as the Nusselt number (Nu), can be expressed as a

4
function of the Reynolds number (Re) in forced convection flow. Based on experimental
data performed on the heating and cooling of spherical and cylindrical objects
(McAdams, 1954), it was determined that the Nusselt number is related to the square root
of the Reynolds number (Re) for typical fire scenarios, as shown in Equation 3 below.
(Heskestad & Smith, 1976).
Nu = C(Re1/2) (3)
where
Nu = Nusselt number = hcL/k
L = characteristic length scale of the element (m)
hc = convective heat transfer coefficient (W/m2K)
k = thermal conductivity of gas at the film temperature (W/mK) C = constant associated with sensing element geometry
Re = Reynolds number = uL/ν
u = gas velocity (m/s)
ν = kinematic viscocity of the gas at the film temperature (m2/s)
Substituting the definitions of the Nusselt number and Reynolds number into
Equation 3, Equation 4 can be derived.
hc = C ku1/2
L1/2ν1/2 (4)
Two temperature dependent variables are present in Equation 4; kinematic
viscosity and thermal conductivity. Based on tabulated thermal properties of air for
temperatures between 17℃ (63℉) and 227℃ (441℉), the ratio of thermal conductivity

5
to the square root of viscosity is nearly constant, with only a 3% difference in overall
value as seen in Figure 1 (Leinhard IV & Leinhard V, 2003).
Figure 1 – Ratio of thermal conductivity to kinematic viscosity for temperatures
ranging from 17℃ (63℉) to 227℃ (441℉)
Therefore, the convective heat transfer coefficient is directly proportional to the
square root of velocity, making the time constant τ proportional to the inverse square root
of velocity. This relationship is shown below in Equations 5 and 6.
τ ∝ 𝑢−1/2 (5)
τ𝑢1/2 = 𝑐𝑜𝑛𝑠𝑡𝑎𝑛𝑡 (6)
where
τ = time constant defined as (m Cp)/hc
u = gas velocity (m/s)
0
0.005
0.01
0.015
0.02
0.025
0 50 100 150 200 250
k / ν^
.0.5
Temperature (C)


7
2.54 m/s (0 ft/s, 2 ft/s, 5 ft/s, and 8.3 ft/s). These conditions were meant to represent the
ceiling jet velocities that could be expected for a slow growth fire located at a significant
radial distance from sprinkler heads. The tests showed a lack of constancy of the RTI
correlation in the low velocity region.
A subsequent report was released by FM that modified the RTI correlation to
include a conduction coefficient, C’, that addressed conductive losses (Heskestad & Bill
1988). Heat loss due to conduction was assumed to be directly proportional to the
temperature difference between the gas temperature and the ambient temperature.
However, a recent FM study concluded that the conduction coefficient in the revised RTI
equation was approximately equal to one for heat detectors, making it identical to the
original RTI equation (Nam 2004). In light of Nam’s report, as well as the use of the
original RTI equation in the current heat detector test standard, the original RTI equation
presented in Equation 7 was examined in this study (FM, 2008).
The use of a fixed duct temperature test condition has also been challenged by
Theobald as unrealistic in normal fire scenarios because the detectors would have
activated long before ceiling jet conditions reached the nominal test temperature of 200
℃ (392℉). Instead, a linear rate of rise (ramp) temperature profile was proposed that
would more realistically simulate the temperatures that a detector would experience in a
fire (Theobald, Westley, & Whitbread, 1988). This argument was countered by
Heskestad and Bill who said that the RTI test is meant to optimize the measurement of
the RTI rather than reproduce a realistic fire scenario (Heskestad and Bill, 1988).
Additionally, the infinite combinations of fuels and ventilation configurations for a real

8
fire make it impossible to predict a single correct fire growth profile. Therefore they
concluded that getting the temperature inside the duct to ramp at a certain rate was no
more accurate than choosing a fixed temperature for test conditions.
Ultimately, the RTI has become the dominant method of characterizing sprinklers
in the United States, culminating in the formal adoption of the RTI as the standard
sensitivity rating for heat detectors by NFPA 72 in 2007 with the addition of section
5.6.2.3.
1.3.1 Application of RTI for Heat Detectors
There have only been a limited number of reports that examine RTI use for heat
detectors. The most recent study was conducted in the mid 2000s in a series of two
reports by Nam at Factory Mutual (Nam 2004, 2006). Nam studied the effects of velocity
and temperature on the RTI value for a wide range of heat detector models. The test
conditions used in the study featured plunge tunnel velocities of 0.5 m/s, 1.0 m/s, 1.5 m/s,
and 2.5 m/s (1.6 ft/s, 3.3 ft/s, 4.9 ft/s, and 8.2 ft/s) and nominal temperatures of 200℃ and
300℃ (392℉ and 572℉). Nam concluded that the RTI correlation was an appropriate
metric to measure heat detector sensitivity. However for many of the detectors studied the
data showed wide fluctuations in measured RTI values compared to average RTI values.
There were RTI values that ranged by a factor of two over the test conditions indicating
that the average RTI value derived from the data did not accurately represent the
expected behavior for the majority of the test conditions. An example of the
inconsistency of RTI values across test conditions can be seen below in Figure 2.

9
Figure 2 – Sample data showing RTI behavior that is not independent of
temperature and velocity for a thermistor heat detector (Nam 2004).
The averaged calculated RTI values were supported by full scale test data that
showed very good correlation between calculated detector response time based on the
RTI values from the plunge test apparatus and the measured response time in the fire
tests. However, the full scale test conditions were designed to produce extreme ceiling jet
conditions. A 0.76 m (2.49 ft) diameter pan of heptane, which produced a calculated 1.1
MW fire, was placed at a radial distance of 3.4 m (11.2 ft) and a vertical distance of 3 m
(10 ft) from the heat detectors. This large fire size coupled with the close proximity of the
heat detectors introduced a measured ceiling jet velocity of approximately 3.0 m/s (9.8
ft/s) and temperatures up to 120℃ (248℉). If the full scale test conditions had placed the
detectors at a larger radial distance, the measured ceiling jet velocity would be lowered

10
and it is likely that the discrepancy between measured activation time and calculated
activation time would be much greater.
A thesis by Bissell (1988) also examined the RTI for fixed temperature heat
detectors. This report focused primarily on heat detectors that relied on eutectic metals
for activation, as well as rate compensated thermal expansion heat detectors. The test
conditions used in the study featured plunge tunnel velocities of 1.5 m/s, 2.6 m/s, and
3.47 m/s (5 ft/s, 8.4 ft/s, and 11.4 ft/s) and nominal temperatures of 126℃, 190℃, and
239℃ (260℉, 675℉, and 460℉). The RTI was found to be highly dependent on test
conditions for many different detectors, with values ranging by as much as a factor of two
for certain heat detectors. Despite the lack of constancy shown in the RTI data, Bissell
concluded that the RTI was acceptable for use as the sensitivity rating of heat detectors.
The report concedes that the RTI is not a precise representation of heat detector behavior
and recommends that a range of RTI values be listed for a particular device instead of a
single value (Bissel, 1988).
Based on the data found in the literature, the RTI is not independent of
temperature and velocity for all types of heat detectors. In addition, there is a lack of
research on the effects of low temperature, low velocity test conditions on the RTI
correlation. Despite the demonstrated inconsistencies of the RTI correlation, previous
studies have deemed the RTI appropriate for characterizing heat detector sensitivity.
11
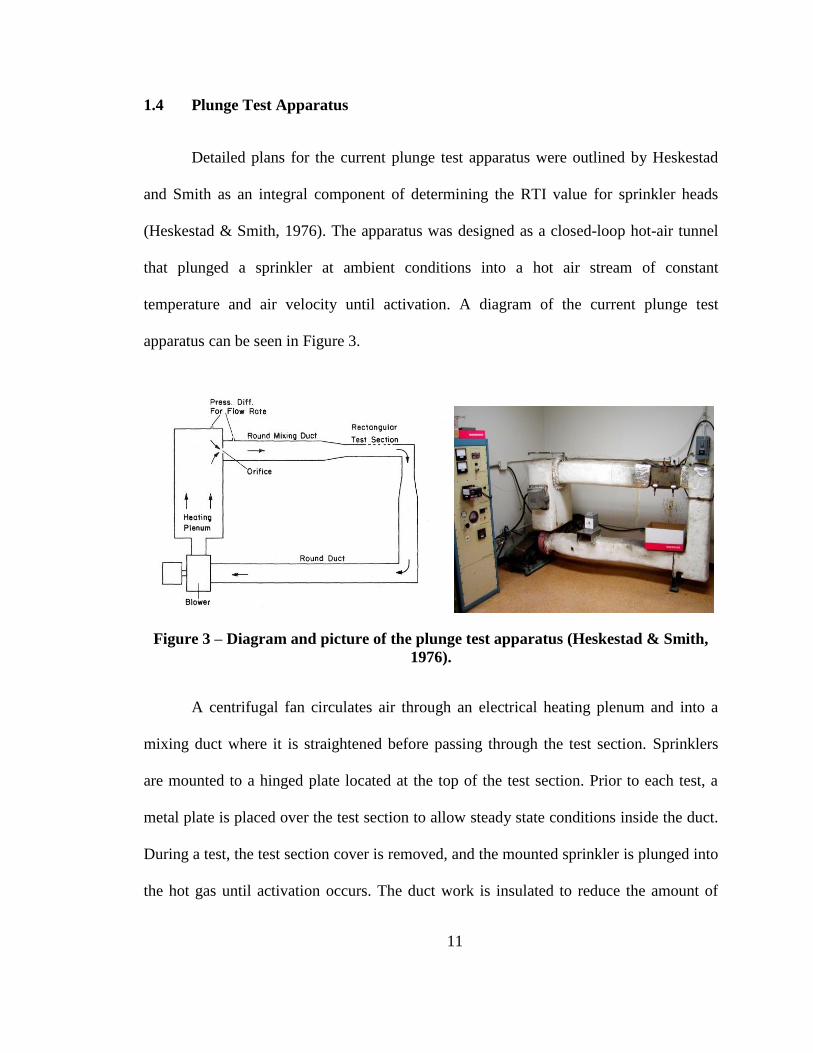
1.4 Plunge Test Apparatus
Detailed plans for the current plunge test apparatus were outlined by Heskestad
and Smith as an integral component of determining the RTI value for sprinkler heads
(Heskestad & Smith, 1976). The apparatus was designed as a closed-loop hot-air tunnel
that plunged a sprinkler at ambient conditions into a hot air stream of constant
temperature and air velocity until activation. A diagram of the current plunge test
apparatus can be seen in Figure 3.
Figure 3 – Diagram and picture of the plunge test apparatus (Heskestad & Smith,
1976).
A centrifugal fan circulates air through an electrical heating plenum and into a
mixing duct where it is straightened before passing through the test section. Sprinklers
are mounted to a hinged plate located at the top of the test section. Prior to each test, a
metal plate is placed over the test section to allow steady state conditions inside the duct.
During a test, the test section cover is removed, and the mounted sprinkler is plunged into
the hot gas until activation occurs. The duct work is insulated to reduce the amount of

12
energy required to heat the apparatus; however, the test section is left un-insulated to
minimize radiative effects from the duct walls to the sprinkler. It should be noted that the
current plunge test apparatus is different from the original apparatus Heskestad and Smith
used to derive the initial RTI data. The original apparatus was configured in a flow
through design and utilized gas burners as the heat source. While a significant effort was
undertaken to characterize the temperature and velocity profiles in the original apparatus,
the data is not applicable to the current plunge test apparatus. No subsequent report has
been published that characterizes the temperature and velocity profiles of the current
plunge test apparatus.

13
2.0 TEST SETUP AND PROCEDURE
Typical heat detectors have activation temperatures between 57℃ - 68℃ (135℉ -
155℉), which is well below the plunge test duct temperature of 200 ℃ (392℉). As
mentioned previously in Section 1.3, the use of a high temperature test condition has been
called into question because it subjects the detectors to a temperature and velocity profile
that is unlikely to occur under typical fire conditions (Theobald, Westley, & Whitbread,
1988). In order to determine realistic test conditions, ceiling jet temperatures and
velocities were determined for typical fire scenarios. Alpert’s correlations were used to
predict ceiling jet temperatures and velocities based on ceiling height and radial distance
to the fire.
2.1 Alpert’s Correlations
Alpert’s correlations, presented below in Equations 8 – 11, relate temperature and
velocity to ceiling height, radial distance, and energy output for fires under a smooth, flat
ceiling (Alpert, 1972). The correlations were derived from extensive fire test data in the
region close to the ceiling, known as the ceiling jet, where the products from combustion
are moving parallel to the ceiling. Alpert’s correlations have been shown to provide
accurate ceiling jet temperature and velocity predictions.

14
Tg − T∞ = 16.9 Q 2/3
H5/3 for
r
H≤ 0.18 (8)
Tg − T∞ = 5.38 Q 2 3 H5 3
(r/H)2 3 for
r
H> 0.18 (9)
u = 0.96 𝑄
𝐻
1/3
for r
H≤ 0.15 (10)
u = 0.195 (𝑄 /𝐻)1/3
(𝑟/𝐻)5/6 for
r
H> 0.15 (11)
where
Tg = temperature of the gas (K)
T∞ = ambient temperature (K)
Q = heat release rate (kW)
H = ceiling height (m)
r = radial distance from the fire (m)
u = gas velocity (m/s)
Alpert’s correlations are dependent on three input parameters: ceiling height,
radial distance and fire size. Heat detectors are generally installed in commercial
buildings. Ceiling heights of 3.05 m, 3.65 m, 4.57 m, and 6.10 m (10 ft, 12 ft, 15 ft, and
20 ft) were used to encompass expected ceiling heights. Heat release rates of 100 kW up
to 5 MW were used to represent fire sizes that could be expected in a room at the time of
alarm activation.

15
Section 29.7.3.1 of the 2010 edition of NFPA 72 specifies that the maximum
listed spacing for all spot heat detectors shall be 15 m (50 ft). The furthest radial distance
between a fire and a detector is 10.8 m (35.4 ft) for a square 15 m (50 ft) spacing
arrangement.
Figure 4 – Diagram of the maximum expected radial distance between a fire and a
heat detector, based on 15m x 15m (50ft x 50ft) spacing.
This study focused on heat detectors in the ordinary temperature classification,
which typically have activation temperatures of 57℃ - 68℃ (135℉ - 155℉). Thus, a
ceiling jet temperature of 70℃ (158 ℉) is a lower temperature that would be expected to
activate typical heat detectors. Calculations were performed iteratively for all possible
combinations of radial distances and fire sizes to obtain a full array of ceiling jet
temperatures and velocities that would be expected in a realistic scenario. Since ceiling
jet temperatures and velocities decrease with increasing radial distances, the results from

16
the furthest radial distance of 10.8 m (35.4 ft) were analyzed. The temperature and
velocity results from these calculations are tabulated in Table 1. The abbreviation “NA”
represents ceiling jet conditions that would not activate heat detectors because the
temperature is below 70℃ (158℉).
Table 1 – Abbreviated summary of ceiling jet velocities and temperatures that
would activate ordinary heat detectors at the maximum radial distance of 10.8 m
(35.4 ft). The radial distance corresponds to heat detector spacing of 15m x 15 m (50
ft x 50 ft).
Ceiling Heights (m)
3.0 m 3.7 m 4.6 m 6.1 m
Fir
e S
ize
(kW
)
5000 kW 0.8 m/s
125℃
0.88 m/s
108℃
0.98 m/s
90℃
1.13 m/s
73℃
4500 kW 0.77 m/s
118℃
0.85 m/s
102℃
0.95 m/s
86℃ NA
4000 kW 0.74 m/s
111℃
0.81 m/s
96℃
0.91 m/s
81℃ NA
3500 kW 0.71 m/s
103℃
0.78 m/s
89℃
0.87 m/s
75℃ NA
3000 kW 0.67 m/s
95℃
0.74 m/s
83℃
0.83 m/s
70℃ NA
2500 kW 0.64 m/s
86℃
0.7 m/s
75℃ NA NA
2000 kW 0.59 m/s
77℃ NA NA NA
1500 kW NA NA NA NA
From the calculations, it was determined that 0.5 m/s (1.6 ft/s) was the minimum
realistic ceiling jet velocity that corresponded to a temperature high enough to activate an
ordinary heat detector. The highest calculated velocity for the radial distance of 10.8 m
(35.4 ft) is 1.13 m/s (3.7 ft/s), which corresponded to a 5 MW fire under a 6.1 m (20 ft)
ceiling. All of the velocities at the maximum radial distance are lower than the current

17
plunge test apparatus gas velocity of 1.5 m/s (4.9 ft/s). Most of the ceiling jets at the
maximum radial distance had velocities that were less than 1 m/s (3.3 ft/s).
In contrast, the minimum heat detector spacing for standard heat detector testing
is 4.6 m (15 ft) according to Table 3.4.1.1 of the 2008 edition of FM 3209. The ceiling jet
conditions were also examined for the 4.6 m (15 ft) spacing, as seen below in Table 2.
The abbreviation “NA” represents ceiling jet conditions that would not activate heat
detectors because the temperature is below 70℃ (158℉). This determined the expected
limit of temperature and velocity conditions for which the detectors could be exposed in
full scale testing. For a square 4.6 m (15 ft) spacing arrangement, the farthest radial
distance between a fire and a detector is 6.5 m (21.2 ft). While there are a few conditions
that would be expected to produce ceiling jet velocities greater than 3.0 m/s (9.8 ft/s),
typical velocities are well below 2.5 m/s (8.2 ft/s).

18
Table 2 – Abbreviated summary of ceiling jet velocities and temperatures that
would activate ordinary heat detectors at a radial distance of 3.3 m (10.7 ft). The
radial distance corresponds to heat detector spacing of 4.6 m x 4.6 m (15 ft x 15 ft)
2.2 Test Conditions
Based on Alpert’s correlations, it was clear that realistic ceiling jet velocities
could be well below the nominal plunge test condition of 1.5 m/s (4.9 ft/s). Therefore, it
was determined that additional tests should be performed on the detectors using slower
air velocities in the test apparatus. The minimum air velocity in this study was 0.5 m/s
(1.6 ft/s) based on the lowest calculated ceiling jet velocity from the previous section. Air
velocities of 1.0 m/s (3.3 ft/s) and 1.5 m/s (4.9 ft/s) were also examined to encompass the
typical ceiling jet conditions up to the current plunge test settings. Finally, an air velocity
Ceiling Heights (m)
3.0 m 3.7 m 4.6 m 6.1 m
Fir
e S
ize
(kW
)
5000 kW 2.21 m/s
258℃
2.42 m/s
218℃
2.7 m/s
178℃
3.12 m/s
139℃
4500 kW 2.13 m/s
241℃
2.34 m/s
205℃
2.61 m/s
168℃
3.01 m/s
131℃
4000 kW 2.05 m/s
225 ℃
2.25 m/s
191℃
2.51 m/s
156℃
2.9 m/s
122℃
3500 kW 1.96 m/s
207℃
2.15 m/s
176℃
2.4 m/s
145℃
2.77 m/s
114℃
3000 kW 1.86 m/s
189℃
2.04 m/s
161℃
2.28 m/s
133℃
2.63 m/s
104℃
2500 kW 1.75 m/s
170℃
1.92 m/s
145℃
2.15 m/s
120℃
2.48 m/s
95℃
2000 kW 1.63 m/s
149℃
1.78 m/s
127℃
1.99 m/s
106℃
2.3 m/s
84℃
1500 kW 1.48 m/s
126℃
1.62 m/s
109℃
1.81 m/s
91℃
2.09 m/s
73℃
1000 kW 1.29 m/s
101℃
1.41 m/s
88℃
1.58 m/s
74℃ NA
500 kW 1.2 m/s
71℃ NA NA NA
100 kW NA NA NA NA

19
of 2.5 m/s (8.2 ft/s) was also tested to allow a comparison between low and high velocity
effects on the RTI correlation.
At the low velocities, the temperature of the ceiling jet is not much higher than the
activation temperature of the devices. At the radial distance of 10.8 m (35.4 ft), ceiling jet
temperatures range from 70℃ to 125℃. In order to represent the expected limit of ceiling
jet temperature while still being capable of consistently activating each device, a duct
temperature of 75℃ was used. In addition, the standard duct temperature of 200℃
was tested to allow for a comparison of RTI values to those determined by
independent labs. Therefore, a total of eight test conditions were performed in this
study, shown below in Table 3.
Table 3 – Summary of test conditions
Test Condition 1 2 3 4 5 6 7 8
Nominal Air Temperature (°C) 75 75 75 75 200 200 200 200
Air Velocity (m/s) 0.5 1 1.5 2.5 0.5 1 1.5 2.5
2.3 Thermal Stratification
The RTI correlation is based on the assumption that the temperature inside the
duct is uniform, however temperature uniformity begins to break down at low velocities
due to effects of thermal stratification. Heskestad and Smith performed an analysis to
determine the lowest velocity needed to ensure temperature consistency inside the duct
by way of the Richardson number. The Richardson number is a non-dimensional number

20
that expresses the ratio of buoyant forces to inertia forces defined below (Heskestad &
Smith, 1976).
Ri =Gr
Re 2 = 2gL∆TG
u2T∞ (12)
where
Gr = Grashoff number
Re = Reynolds number
g = acceleration due to gravity = 9.8 m/s2
L = characteristic length scale (m)
∆TG = duct temperature minus ambient temeprature (K) u = gas velocity (m/s)
T∞ = ambient temperature (K)
The transition from buoyancy driven flow to inertia driven flow occurs at the
critical Richardson number of 0.25 (Blevins, 1984). When the Richardson number is
above the critical value, the air stream begins to separate into a hot upper layer and cool
lower layer as a result of thermal stratification. A series of temperature and velocity
profile tests performed by Heskestad and Smith found that significant effect from thermal
stratification become apparent when the Richardson number is 0.62 or higher (Heskestad
& Smith, 1976). The plunge test for heat detectors exposes the device to 200℃ (392℉)
air flowing at 1.5 m/s (4.9 ft/s) inside a 15.24 cm (6 in) duct. Assuming that the
characteristic length is the height of the test section, the current duct condition used for
determining RTI values has a Richardson number of 0.81 based on characteristic values
of H = 15.24 cm (6 in), ∆TG = 180 K (324℉), u = 1.5 m/s (4.9 ft/s), and To =
293 K.(68℉). This Richardson number is higher than the limit required for temperature

21
uniformity outlined by Heskestad and Smith, implying that the effects of thermal
stratification are present in the current plunge test for heat detectors.
The test conditions used in this study feature velocities that are lower than the
current plunge velocity, producing higher Richardson numbers. The calculated
Richardson number for a test performed using the current plunge test apparatus at test
condition 5 (200℃, 0.5 m/s (392℉, 1.6 ft/s)) would be 7.33, producing unacceptable
amounts of thermal stratification. This environment would expose heat detectors of
different lengths to different temperatures inside the test section.
2.4 HAI Plunge Test Apparatus
Tests were performed at the Hughes Associates, Inc. (HAI) Laboratory in
Baltimore, Maryland on a modified plunge test apparatus designed to operate at low
velocity, low temperature settings. The test section for the HAI plunge test apparatus was
oriented vertically to negate any effects of thermal stratification that could occur in a
horizontal duct at low velocities.
2.4.1 General Design
An overview of the general configuration of the HAI plunge test apparatus can be
seen in Figure 5 and Figure 6. The apparatus is constructed of 20-gauge steel ductwork in
a flow-through configuration. Ambient air from the lab is drawn into the ductwork by a
0.250 m3/s (530 ft3/min) axial fan. The fan is powered and controlled by two direct
current regulated power supplies. Air is pushed along a 0.203 m (8 in) square duct into a
40 kW electric heater where the air is heated and then directed downward into a settling

22
chamber designed to reduce turbulence and straighten the airflow before reaching the test
section. The settling chamber was designed to specifications for wind tunnels as outlined
by Mehta and Bradshaw (Mehta & Bradshaw, 1979). It is constructed of a 61.0 cm (24
in) square duct featuring two inch aluminum honeycomb followed by two mesh screens,
each spaced 15.2 cm (6 in) apart. After passing through the settling chamber, the duct
contracts back to 20.3 cm (8 in) and leads into the test section. The contraction ratio of
the settling chamber was calculated to be 9, which is typical for small wind tunnels
(Mehta & Bradshaw, 1979). The test section consists of a 20.3 cm (8 in) square duct with
a 15.2 cm (6 in) square hole located on the side of the duct that serves as the plunge
location for the detectors. A test section cover constructed from a 20 gauge steel plate is
mounted on a hinge to the apparatus to cover the plunge hole in between tests. To reduce
the leakage between the apparatus and the test section cover, a 4.8 mm (3/16 in) thick
rubber gasket was installed around the plunge location. On the wall directly opposite the
plunge location, K-type 1.59 mm (1/16 in) sheathed, bare-bead thermocouple was
mounted to measure the test section temperature. The location of the test section
thermocouple can be seen in Figure 7. Once past the test section, air is directed away
from the apparatus and expelled into the lab. In order to minimize heat losses, the
apparatus is insulated all along the duct walls from the heater to the test section using
2.54 cm (1 in) Fiberfrax insulation blankets and 0.64 cm (1/4 in) insulation boards.

23
Figure 5 – Illustration of the general configuration of the HAI plunge test
apparatus.

24
Figure 6 – HAI Plunge test apparatus

25
2.4.2 Instrumentation
The electric heater is regulated by a Watlow Series 981 1/8 DIN microprocessor-
based ramping controller that modulated the power to the heater to match the user
specified temperature with temperature measurements taken directly upstream of the test
section. Temperature is measured by a K-type 1.59 mm (1/16 in) sheathed, bare-bead
thermocouple.
Pressure is measured by a Dwyer Series 160 Pitot tube with a 3.2 cm (1/8 in)
diameter. The Pitot tube is attached to a Setra model 264 pressure transducer with an
accuracy of ± 0.063 Pa and a range of 0 – 24.9 Pa. Directly adjacent to the Pitot tube is a
K-type 1/16” sheathed, bare-bead thermocouple that provides the instantaneous
temperature measurement. An additional NIST-traceable calibrated Omega K-type 1.59
mm (1/16 in) sheathed, bare-bead thermocouple is placed in the test section to measure
the temperature used in the RTI calculation.
A diagram of the locations of the temperature and velocity probes can be seen
below in Figure 7.

Figure 7 – Elevation diagram of temperature and velocity probe locations inside the HAI plunge test apparatus. The
image on the left displays frontal view looking into the test section and the image on the right displays the side view. All devices
are perpendicularly mounted in the middle of the duct face.
26

27
2.4.3 Calculations
Bernoulli’s equation was used to derive air velocity from pressure and
temperature measurements taken downstream of the test section. The Bernoulli equation
for air velocity is shown in Equation 13.
u = 2∆P
ρ (13)
where
∆P = dynamic pressure measured by pitot probe (Pa)
ρ = density of air inside the duct (kg/m3)
The density of air inside the duct was calculated using the ideal gas law
ρ =P∞Mair
RuT (14)
ρ =353
Tg (15)
where
Mair = molecular weight of air (kg/mol)
P∞ = ambient pressure = 101,300 Pa
Ru = universal gas constant = 8.134 J/mol K
Tg = temperature of the gas inside the duct (K)
ρ = density of air inside the duct (kg/m3)

28
Therefore, the velocity equation was determined to be
u = Tg(∆P)
176.5 (16)
where
∆P = dynamic pressure measured by pitot probe (Pa) Tg = temperature of the gas inside the duct (K)
The data is recorded at a rate of 10 Hz using a National Instruments SCXI-1000
data acquisition chassis with one SCXI-1327, 8-channel high-voltage attenuator terminal
blocks. The National Instruments hardware is interfaced with Labview 8.5 data
acquisition software using a 16-bit PCMCIA converter.
2.4.4 Temperature Profile
The original apparatus design left the walls of the test section un-insulated to
minimize the effects of radiation from the duct walls on the detectors heat sensing
element (Heskestad & Smith, 1976). However, this led to a decrease in temperature
uniformity in the test section due to a higher temperature gradient at the wall. A series of
temperature profiles was taken both with and without insulation in the test section to see
the effects of insulated walls on temperature uniformity. The temperature uniformity was
significantly improved with the presence of the insulating boards. It was determined that
any effects of radiation from the duct walls were negligible and did not outweigh benefits
of increased temperature uniformity inside the test section.

29
The temperature profile inside the duct was measured using 25 bare-bead
thermocouples arranged on a specially designed grid to employ the Log-Chebechev
method for duct traversing. The thermocouple grid frame was constructed using 20.3 cm
(8 in) steel angles with 1.27 cm (0.5 in) leg lengths to form a square. Thin wires were
strung through holes in the frame to provide the support for the thermocouples. The
thermocouples were placed at 1.5 cm, 5.4 cm, 10.2 cm, 14.5 cm, and 18.8 cm (0.59 in,
2.1 in, 4.00 in, 5.70 in, and 7.41 in) from the duct wall in both the x and y direction, as
shown below in Figure 8. Once the duct reached a steady state, measurements were taken
and averaged over 10 minutes for each test condition.
Figure 8 – The temperature and velocity probe locations utilizing the Log-
Chebechev method of duct traversing are shown on the left. The picture on the right
shows the constructed thermocouple grid used to characterize the duct.
The Log-Chebechev method allows for the most accurate measurement of the
average velocity inside of a duct, by spacing the probes at irregular intervals to account
for the slower air velocities near the wall (ASHRAE, 1993). Since the velocity traverse in

30
Section 2.4.5 requires both temperature and pressure measurements for the velocity
calculation, temperature was measured according to The Log-Chebechev method.
In general, the apparatus showed excellent temperature uniformity. As expected,
the biggest variation in temperature occurred at the locations closest to the duct walls. In
addition to the proximity to the duct walls, the thermocouples along the outer ring of the
grid were placed less than 1 cm (0.09 in) from the bracket. This proximity of the outer
thermocouples to the brackets may have affected the air flow around the thermocouple
leading to lower temperatures. The temperature profile was found to be independent of
velocity, with no significant difference in standard deviation at either of the test
temperatures.
The depth of the sensing elements for the heat detectors used in this study varied
from around 4.4 cm (1.75 in) to around 9 cm (3.6 in). Since the sensing element of heat
detectors will generally be plunged beyond the outer layer of thermocouples during a test,
a second analysis was performed on the “working section” of the duct in which the outer
layer temperatures were omitted.
A summary of the average temperature and standard deviation at each test
condition can be seen in Table 4. The color contour temperature profile for test condition
7 (200℃ 1.5 m/s) is presented in Figure 9 and the temperature profiles for all of the test
conditions are presented in Appendix A.

31
Table 4 – Summary of average temperature and standard deviation for the
HAI plunge test apparatus.
Test Condition
Nominal Temperature
(°C)
Nominal Velocity
(m/s)
Average Temperature
(°C)
Standard Deviation
(℃)
Average Temperature
Working Section
(℃)
Standard Deviation Working Section
(℃)
1 75 0.5 73.9 2.0 76.0 0.6
2 75 1.0 74.0 2.1 76.1 0.6
3 75 1.5 74.1 1.9 76.1 0.5
4 75 2.5 74.5 1.7 76.2 0.6
5 200 0.5 185.6 11.3 197.5 2.8
6 200 1.0 186.7 10.4 198.0 2.2
7 200 1.5 186.7 10.4 198.0 2.2
8 200 2.5 189.8 7.9 197.9 3.0
*The working section refers to the inner 9 thermocouples that are not near the boundary
layer.
Figure 9 – Color contour of the temperature profile for test condition 7
(200℃, 1.5 m/s (392℉, 4.9 ft/s))

32
2.4.5 Velocity Profile
A velocity profile was determined by traversing a Pitot probe across the locations
determined by the Log Chebechev method. A one minute pressure reading was taken at
each point to determine the average velocity using Equation 16. Because the velocity
equation depends on both temperature and pressure measurements, averaged
temperatures obtained from the previous section using the thermocouple grid were used.
Due to the amount of time required to traverse the duct point by point, only selected test
conditions were measured. Velocity profiles for test conditions 2, 4, 6, and 8 were taken.
The average velocities and standard deviations are shown below in Table 5. Similar to the
temperature profile analysis, a “working section” area was designated as the region in
which the detectors would be located during a test. The working section was defined as
the inner nine velocity probe locations. The color contour velocity profile for test
condition 6 (200℃ 1.0 m/s) is presented in Figure 10 and the velocity profiles for all of
the test conditions are presented in Appendix A
Table 5 - Summary of average velocities and standard deviations for the HAI
plunge test apparatus.
Test Condition
Nominal Temperature
(°C)
Nominal Velocity
(m/s)
Average Velocity
(m/s)
Standard Deviation
(m/s)
Average Velocity Working Section (m/s)
Standard Deviation Working Section (m/s)
2 75 1.0 0.76 0.24 0.80 0.11
4 75 2.5 2.25 0.32 2.42 0.09
6 200 1.0 0.86 0.24 0.91 0.11
8 200 2.5 2.22 0.32 2.46 0.11
* The working section refers to the inner 9 thermocouples that are not near the boundary layer.

33
Figure 10 - Color contour of the velocity profile for test condition 6 (200℃,
1.0 m/s (392℉, 3.2 ft/s))
Velocity profiles for each test condition are presented as a color contour in
Appendix A. The boundary layer of the duct had more of an effect on the velocity profile
than it had on the temperature profile. The extent of the boundary effects can be seen in
the reduction in standard deviation in the working section compared to the entire duct.
Overall, there was good velocity uniformity in the duct.
2.5 Heat Detectors
This report studied four different heat detector models that represented three of
the most common methods of heat detection: rate compensated thermal expansion,
fusible link, and thermistor heat detectors. Since the RTI of a device is dependent on the
activation temperature of the device, only fixed temperature detectors were evaluated in
this study. Activation temperatures ranged from 47℃ to 71℃ (117℉ - 160℉),
encompassing the low and expanded ordinary temperature class of heat detectors as

34
outlined in FM 3209. A summary of the detectors along with their detector IDs can be
seen in Table 6. Each detector ID represents several individual heat detector units of a
single heat detector model.
Table 6 - Summary of heat detector IDs, activation temperatures, and
method of detection.
Detector ID Activation
Temperature(s) (℃)
Sensing Element Notes
A 60, 71 Thermal
Expansion Rate compensated
B 47,57 Thermistor *
C 57 Thermal Link Non-restorable
D 57 Thermistor
* Activation temperature was set via the fire alarm control panel software. The same three detectors were
used for both activation temperatures.
Detectors A and B had previously had RTI values determined by UL for the
specific devices evaluated in this study. This allowed for direct comparison between the
RTI values obtained by the HAI plunge test apparatus and an alternate plunge test
apparatus.
2.5.1 Thermal expansion heat detector
The thermal expansion detectors used in this study were designated as detector A.
The detectors are constructed of two electrical contacts attached to a pair of struts housed
inside a cylindrical metal casing. When the detector is heated, the outer shell begins
expanding, pushing the electrical contacts together to activate an alarm. The inner struts
are concurrently expanding as well, but at a slower rate. If the heat detectors are rapidly

35
heated, the outer shell expands so quickly that the contacts close before the heat
penetrates the detector far enough to begin expanding the struts. In contrast, slow
growing fires that have a lower temperature allow heat to begin expanding the inner
struts, slowing the rate at which the electrical contacts come together. This response to
the rate of temperature rise makes the thermal expansion heat detectors rate compensated.
Since the devices are rate compensated, they are not true fixed temperature heat
detectors. This has been acknowledged and examined by previous studies (Nam 2004,
2006). Nam found that while the rate compensated detectors show good consistency in
RTI value across a range of test conditions, they activate well before their listed
activation temperature in full scale tests. To account for this, a virtual activation
temperature was introduced that would be applied in the RTI correlation to produce a
more accurate predictive capability (Nam 2006). However, this study is focused on the
stability of the RTI correlation for different test conditions rather than accuracy of the
predicted activation times. Therefore, for the purpose of this analysis, the nominal
activation temperature is appropriate for use in RTI calculations. Three detectors with an
activation temperature of 60℃ (140℉) and three detectors with an activation temperature
on 71℃ (160℉) were tested in this study. An example of a thermal expansion heat
detector mounted to its plunge plate is shown below in Figure 11.

36
Figure 11 –Thermal expansion heat detector A mounted to its plunge plate
2.5.2 Thermistor heat detectors
Two different models of thermistor heat detectors were examined, listed as
detectors B and D respectively. Thermistor heat detectors are often known as intelligent
heat detectors because they are usually connected to a large network of devices controlled
by a fire alarm control panel. Thermistor heat detectors use a temperature sensitive
resistor to measure the air temperature. The measurement is then reported to the control
panel, which decides whether or not to activate an alarm. For some models, the
processing of the alarm level occurs at the device.
Detector B featured a variable activation temperature of 47℃ (117℉) and 57℃
(135℉) that was controlled by the fire alarm control panel. Therefore, the same three
devices for detector B were tested at both activation temperatures. Detector D had an
activation temperature of 57℃ (135℉). An example of both models of thermistor heat
detectors are shown below in Figure 12.

37
Figure 12 – Thermistor heat detectors mounted to their plunge plates.
Detector B is shown on the left and detector D is shown on the right.
2.5.3 Thermal link heat detector
The thermal link heat detector tested in this study was designated as detector C.
Fusible link heat detectors utilize a eutectic alloy that has been designed to melt at a
specific temperature to detect the presence of heat. When the thermal link melts, a circuit
closes initiating an alarm signal. Unlike the thermistor heat detector and thermal
expansion heat detector, the fusible link detectors are non-restorable, so a new heat
detector had to be used for each test. Detector C had an activation temperature of 57℃
(135℉). An example of a thermal link heat detector mounted to its plunge plate is shown
below in Figure 13.

38
Figure 13 – Thermal link heat detector C mounted to the plunge plate.
2.6 Test Procedure
The test apparatus was allowed to run at test conditions for an hour prior to testing
to ensure a steady state temperature profile inside the duct. The heat detectors were
conditioned in the laboratory overnight. Each detector was mounted to a plunge plate
consisting of a 20.3 cm (8 inch) square piece of 20 gauge sheet metal. Three separate
plunge plates were constructed to reduce the amount of time required to run a series of
tests. The detector was centered 6.98 cm (2.75 inch) from the bottom of the plate
ensuring that the detector would be located in the middle of the test section when
plunged.
A one minute background was run for each test in which the ambient temperature,
duct temperature, and duct velocity were recorded and averaged for use in the RTI
calculation. After 60 seconds, the heat detector was plunged into the test section while
simultaneously switching the plunge switch to the on position. The plunge plate was held
in position until the device activated, signaling the end of the test. After each test

39
concluded, the detectors were allowed to return to ambient conditions before the next test
series. Since typical activation times were below one minute for the heat detectors in this
study, a test that ran for more than four minutes without activation was terminated and no
RTI value was reported for the test.

40
3.0 PLUNGE TEST RESULTS
In order for the RTI correlation to be applicable to a particular model of detectors,
it needs to be capable of demonstrating RTI values that are reasonably consistent across
many different units. Therefore, three different units for each device model were tested a
total of three times for each test condition, with the exception of the non-restorable
model. Since the non-restorable heat detector required a new unit every time one was
tested, it was decided to only run three tests for each test condition. A total of 384 tests
were performed and a summary of the RTI values and activation times can be found in
the Appendix B.
3.1 Thermal expansion heat detector test results
Six rate-compensated thermal expansion heat detectors were evaluated in this
study; three with an activation temperature of 60℃ (140℉) and three with an activation
temperature of 71℃ (160℉). The average RTI value and standard deviation for each
activation temperature are presented below in Figure 14 and Figure 15. Each heat
detector was tested three times at every test condition for a total of 144 tests.

41
Figure 14- Average RTI value and standard deviation for rate-compensated
thermal expansion detector A (60℃ (140℉))
Figure 15 - Average RTI value and standard deviation for rate-compensated
thermal expansion detector A (71℃ (160℉))
One 71℃ (160℉) detector and one 60℃ (140℉) detector failed to activate at test
condition 1 (0.5 m/s 75℃). Only two data points are used to represent test condition 1,
resulting in a very small standard deviation for the 71℃ device.
The standard deviation of RTI values for the 75℃ (167℉) test conditions were
generally larger than the standard deviation for the 200℃ (392℉) test conditions. This
suggests that the minor variations inherent in the construction of the heat detectors have a

42
more pronounced effect on activation time when the plunge test temperature is close to
the activation temperature. In addition, the RTI values determined when the test velocity
was 0.5 m/s appear to be outliers, providing both the maximum and minimum RTI values
across all test conditions. The RTIs at the remaining test conditions showed fairly good
uniformity, especially for the 71℃ (160℉) heat detector. The values for the average RTI
values with their standard deviations are tabulated below in Table 7.
Table 7 – Summary of average RTI and standard deviation for thermal
expansion heat detector A.
RTI
(𝐦𝐬)𝟏/𝟐 StDev
(𝐦𝐬)𝟏/𝟐
Detector A (60 C) 17.1 6.2
Detector A (71 C) 13.6 3.7
3.1.1 Third party RTI comparison
There were two third party studies that provided RTI values for detector A (71℃),
allowing a direct comparison among test data obtained at three laboratories using
different plunge test apparatuses. The first set of data was obtained from UL which had
previously run RTI tests on detector A (71℃) using test conditions of 200℃ (392℉) and
1.5 m/s (4.9 ft/s). The second data set was taken from Nam who also performed a series
of tests on the same model devices as detector A (71 ℃) at Factory Mutual. Nam
examined the RTI values derived from test conditions of 0.5 m/s, 1.0 m/s, 1.5 m/s, and
2.5 m/s (1.6 ft/s, 3.2 ft/s, 4.9 ft/s and 8.2 ft/s) at temperatures of 200℃ (392℉) and
300℃ (572℉) (Nam, 2004). A summary of the data can be seen below in Figure 16.
Expanding upon the naming convention introduced earlier, the test numbers 9 – 13

43
correspond to velocities of 0.5 m/s, 1.0 m/s, 1.5 m/s, and 2.5 m/s (1.6 ft/s, 3.2 ft/s,
4.9 ft/s and 8.2 ft/s) at 300℃ (572℉).
Figure 16– Comparison of RTI values for detector A (71℃ (160℉)) obtained
by three independent labs; HAI, UL, and FM Global (Nam).
The RTI values from this study were significantly lower than the RTI values from
the two third party sources. There are many possible reasons for the discrepancy between
the labs. Each lab utilized significantly different testing apparatuses. The HAI apparatus
has a vertically oriented test section while the UL and FM plunge test apparatuses use
horizontal test sections. While a significant effort has been made to characterize the
temperature and velocity profile in the HAI apparatus, there has not been any published
characterization of the FM or UL plunge test apparatus to verify uniformity of test section
temperature and velocity.
The UL plunge test apparatus, shown below in Figure 17 is significantly different
from the other apparatuses. The UL plunge test apparatus is a small bench top chamber
0
5
10
15
20
25
30
0 1 2 3 4 5 6 7 8 9 10 11 12 13
RTI
(m
s)(1
/2)
Test Conditions
RTI RTI (Nam) RTI (UL)

44
that does not utilize any form of flow straightener to ensure a laminar flow across the test
section. In addition, only one test condition was performed at UL, giving no indication of
the behavior of the RTI value at different velocities and temperatures.
Figure 17 – Detailed diagram of the UL test apparatus (Underwriters
Laboratory, 2005)
Finally, the UL and FM apparatuses use a circulating wind tunnel to test the
devices. This means that the sudden drop in temperature that occurs when the plunge
cover is opened will have a cyclical effect on the temperature of the gas during the test. A
lower gas temperature would increase the time to activation for the heat detectors, which
would also increase the RTI value.
3.2 Thermistor heat detector test results
Two different models of thermistor heat detectors were tested with three different
devices used to represent each model. Detector B had a variable activation temperature

45
and each device was tested using both a 47℃ and 57℃ (117℉ and 135 ℉) activation
temperature. Detector D had an activation temperature of 57℃ (135℉). Each detector
was tested three times at each test condition for a total of 72 tests for each activation
temperature.
Detector D failed to operate at test condition 1 despite the gas temperature being
18℃ (32 ℉) higher than the activation temperature of the device. The average RTI value
and standard deviation across the three detectors are presented in Figure 18 - Figure 20.
Figure 18 – Average RTI and standard deviation of the thermistor heat
detector B (47℃ (117℉))

46
Figure 19 – Average RTI and standard deviation of the thermistor heat
detector B (57℃ (135℉))
Figure 20 – Average RTI and standard deviation of the thermistor heat
detector D (57℃ (135℉))
In general, the standard deviation of RTI for replicate tests of different units of
each detector model was excellent. However, despite the uniformity between devices, the
thermistor heat detectors did not display constant RTI values across the test conditions.
RTI uniformity appeared to be fairly independent of velocity at the 75℃ test conditions
(test conditions 1 – 4), but at the 200℃ (test conditions 5 – 8), the RTI value fluctuated

47
greatly. Both detectors C and D showed RTI values that increase with velocity when
tested at the 200℃ (392℉) temperature.
The general relationship of RTI values at low temperatures compared to high
temperatures is different for detectors B and D, even though they share the same
operating principle. Detector C has RTI values that are significantly lower at 75℃ than at
200℃. The opposite is true for detector D, where the RTI at 75℃ is higher than the RTI
at 200℃.
The average RTI values with their standard deviations are tabulated below in
Table 8. Since the behavior of the RTI with respect to velocity appears to change
depending on the test temperature, the average RTI and standard deviation breakdown
sorted by temperature is also presented.
Table 8 – Average RTI and standard deviation for detectors B and D.
All Test Conditions
Test Conditions 1-4 Test Conditions 5-8
RTI (𝐦𝐬)𝟏/𝟐
StDev
(𝐦𝐬)𝟏/𝟐 RTI
(𝐦𝐬)𝟏/𝟐 StDev
(𝐦𝐬)𝟏/𝟐 RTI
(𝐦𝐬)𝟏/𝟐 StDev
(𝐦𝐬)𝟏/𝟐
Detector B (47 C) 49.3 25.8 27.1 5.9 71.5 16.6
Detector B (57 C) 41.1 14.8 31.1 5.0 51.1 14.6
Detector D (57 C) 102.9 15.4 114.0 4.7 94.6 15.4
3.2.1 Third party RTI comparison
There were two third party studies that provided RTI values for detector C (57℃),
allowing a direct comparison among test data obtained at three laboratories using
different plunge test apparatuses. The first set of data was obtained from UL which ran

48
RTI tests at 200℃ and 1.5 m/s. The second data set was taken from Nam who also
performed a series of tests on detector C (57 ℃) at Factory Mutual. Nam examined the
RTI values that were derived from test conditions of 0.5 m/s, 1.0 m/s, 1.5 m/s, and 2.5
m/s (1.6 ft/s, 3.2 ft/s, 4.9 ft/s and 8.2 ft/s) and temperatures of 200℃ (392℉) and
300℃ (572℉ ) (Nam, 2004). A summary of the data can be seen below in Figure 21.
Test numbers 9 – 13 correspond to velocities of 0.5 m/s, 1.0 m/s, 1.5 m/s, and 2.5 m/s
(1.6 ft/s, 3.2 ft/s, 4.9 ft/s and 8.2 ft/s) at 300℃ (572℉).
Figure 21 – Comparison of RTI values for detector C (57℃ (135℉)) obtained
by three independent labs; HAI, UL, and FM Global (Nam).
The RTI behavior across test conditions 5 – 8 reflected the results from Nam. The
RTI increases with velocity at the test temperature of 200℃. The RTI in this study was
also close in value for test condition 5, but for test conditions 6-8 became significantly
higher than those found by Nam. However, the RTI at test condition 7 is bounded by the
results obtained by Nam and the results from UL.
0
10
20
30
40
50
60
70
80
0 1 2 3 4 5 6 7 8 9 10 11 12 13
RTI
(m
s)(1
/2)
Test Condition
RTI RTI (Nam) RTI (UL)

49
3.3 Thermal link heat detector test results
Three detectors were tested at each test condition for a total of 24 total tests. Each
device had an activation temperature of 57℃ (135℉). Similar to detector D, detector C
failed to operate at test condition 1 despite the gas temperature being 18℃ (32℉) higher
than the activation temperature of the device. The average RTI as well as the standard
deviation is shown below in Figure 22. Though the consistency between detectors for
each test condition is good for detector C, it is important to note that each data point only
represents three tests due to the non-restorability of the thermal link detectors. All other
test data in this study had nine tests performed for each data point.
Figure 22 - Average RTI and standard deviation of the thermal link heat
detector C (57℃ (135℉))
Detector C showed similar behavior to detector D. The RTI was independent of
velocity at the 75℃ (167℉) test conditions, but increased with velocity at the 200℃

50
(392℉) test conditions. The average RTI values with their standard deviations are
tabulated below in Table 9.
Table 9 – Average RTI and standard deviation for detector C.
All Test Conditions Test Conditions 1-4 Test Conditions 5-8
RTI (𝐦𝐬)𝟏/𝟐
StDev
(𝐦𝐬)𝟏/𝟐 RTI
(𝐦𝐬)𝟏/𝟐 StDev
(𝐦𝐬)𝟏/𝟐 RTI
(𝐦𝐬)𝟏/𝟐 StDev
(𝐦𝐬)𝟏/𝟐
Detector C (57 C) 70.8 22.4 109.6 1.4 54.2 11.7

51
4.0 ANALYSIS
4.1 Temperature and velocity effects on the RTI correlation
Based on the test data, it was determined that the RTI is not independent of
temperature or velocity. While the RTI remains roughly constant at 75℃ (167℉) for all
velocities, the RTI appears to have a positive correlation with velocity at the 200℃
(392℉) test conditions. The RTI values range by a factor of two between test conditions
5 – 8 for detector B, which is consistent with the test data taken from Nam (2004). In
addition, the RTI values at 75℃ (167℉) were not indicative of the RTI values at 200℃
(392℉). While detectors A, C, and D had RTI values that were higher at low
temperatures, the opposite was true for detector B (thermistor heat detector).
4.1.1 Activation failure
The thermal link heat detectors (detector C) and one of the thermistor heat
detectors models (detector D) failed to activate over a four minute exposure at test
condition 1 (75℃, 0.5 m/s (167℉, 1.6 ft/s)). In addition, two individual units for the
thermal expansion heat detector model (detector A) also failed to activate over a four
minute exposure at test condition 1. Detector B was the only heat detector model that
consistently activated at the lowest test condition.
Having multiple detectors fail to activate was unexpected since the measured test
section temperature was above the listed activation temperature for every device. In
addition, while activation occurred in two out of three of the thermal expansion units with
activation temperatures of 71℃ (160℉), none of the detector C or D units activated

52
despite their lower activation temperature of 57℃ (135℉). It is presumed that all of the
detectors would have eventually activated if the test durations were extended indefinitely.
However, the RTI value derived from such a long test would not provide any additional
insight into the overall sensitivity of the detector, as the values would be orders of
magnitude higher than the RTI values from the rest of the test conditions.
There are several possible reasons for why multiple detectors failed to activate for
test condition 1. Since the convective heat transfer coefficient is proportional to the
square root of velocity, the activation time increases with decreasing test velocity. While
the assumption of negligible heat losses can be made for tests on heat detectors that have
short activation times, it is likely that conductive heat losses begin to factor into
activation times beyond a certain threshold. Both detectors C and D had significantly
higher RTI values than detectors A and B for the 75℃ (167℉) test conditions, indicating
that these detectors were exposed to significantly longer testing times. It is possible that
that the increase in activation time at the lowest velocity was enough to allow conductive
heat losses to have an effect on the activation time of the heat detectors.
Despite the fact that both detectors B and D were thermistor heat detectors,
detector B activated during all tests at test condition 1 while detector D did not. With the
test temperature only 18℃ (32℉) higher than the activation temperature, the amount of
airflow across the sensing element of the detectors is believed to be the cause of the
differences in response characteristics between detectors B and D. The outer shell of
detector D had a large conical shape compared to the shallow profile of the detector B
body. Air coming into contact near the base of detector D will be deflected to flow

53
roughly parallel to the conical surface across the opening in the sensing element guard.
This cross flow may disrupt the flow of air moving across the sensing element, lowering
the convective heat transfer to the device. In addition, the protective guard surrounding
the sensing element of detector B is much less obstructive than the protective guard
surrounding detector D. This may further restrict the flow of air across the sensing
element. With the activation times of detector D already much higher than those of
detector B at the 75℃ (167℉) test conditions, the activation time at test condition 1 may
be long enough to allow thermal losses through conduction to prevent the heat detector
from activating. A picture of the differences in physical characteristics of the two
detectors can be seen in Figure 23.
Figure 23 – Comparison of the physical characteristics of the thermistor heat
detectors used in this study. Detector B is located on the left and detector D is
located on the right.
4.1.2 Alarm processing delays
The physical properties of the thermistor heat detectors (detectors B and D) are
not the only factor in the response time. Some models of thermistor heat detectors use
algorithms to process the temperature measurement taken at the sensing element to
determine if an alarm should be activated. Therefore the original RTI correlation does not


55
Table 10 –Standard deviation of RTI values across all velocities for 75℃ and
200℃ using velocity exponents of 0.3, 0.4, 0.5, and 0.6. The minimum values are
displayed in bold.
75℃ 200℃
u0.3 u0.4 u0.5 u0.6 u0.3 u0.4 u0.5 u0.6 A (71℃) 6.25 6.02 5.95 6.03 1.82 2.26 2.83 3.49
A (60℃) 6.96 5.64 4.98 5.27 4.58 4.97 5.46 6.05
B (57℃) 6.96 5.64 4.98 5.27 15.23 16.51 18.09 19.95
B (47℃) 8.38 8.68 9.32 10.26 13.77 17.84 22.27 27.06
C (57℃) 6.24 8.86 12.03 15.50 7.25 3.86 1.37 4.73
D (57℃) 9.47 6.39 4.66 6.49 26.48 27.86 30.04 32.96
For the 75℃ (167℉) temperature settings, the standard deviation of the test results
was minimized when the velocity exponent was 0.5 for all detectors except for detector
C. This was not surprising because all detectors showed excellent RTI uniformity with
respect to air velocity at the 75℃ (167℉) temperature range. At the 200℃ (392℉)
temperature ranges, the only detector whose minimum standard deviation was at velocity
exponent equal to 0.5 was detector C. All of the other detectors had minimum standard
deviations when the velocity exponent was at 0.3.
While the velocity exponent of 0.5 used in the current RTI correlation proved to
be a decent representation of heat detector behavior when tested at 75℃ (167℉), it did
not represent the behavior of the heat detectors at 200℃ (392℉). The optimum velocity
exponent fluctuated with temperature, further indicating that the simple heat balance on
the thermal link does not represent the operating principle of the heat detector.

56
5.0 CONCLUSION
Heat detectors were tested in a modified plunge test apparatus using temperatures
of 75℃ and 200℃ (167℉ and 392℉) and velocities of 0.5m/s, 1.0m/s, 1.5m/s, 2.5m/s
(1.6 ft/s, 3.2 ft/s, 4.9 ft/s and 8.2 ft/s) to see the effects of test conditions on the
constancy of the RTI value. Of particular interest was the behavior of the RTI correlation
determined by plunge test apparatus conditions similar to the expected limit in realistic
scenarios. The bounding conditions were determined using Alpert’s correlations over a
range of expected fire sizes, ceiling heights, and radial distances. The current plunge test
apparatus was determined to be unsuitable for performing low temperature, low velocity
plunge tests due to the predicted effects of thermal stratification calculated by the
Richardson number. Therefore, all tests were performed on the HAI plunge test
apparatus. The HAI plunge test apparatus features a vertically oriented test section
designed to negate any temperature induced buoyant effects. Four detectors were tested
representing the three most common methods of heat detection on the market: rate
compensated thermal expansion, fusible link, and thermistor heat detectors.
While the standard RTI method affords some insight into the relative sensitivity
of heat detectors, it is inadequate for accurately predicting the activation time of heat
detectors over a wide range of scenarios. The RTI correlation was intended to be
independent of both temperature and velocity, allowing a single value to be capable of
predicting activation times for a range of applications. However, it has been repeatedly
demonstrated in this study, as well as others, to be inconsistent over a range of test
temperatures and velocities (Bissel, 1988, Nam 2004).

57
All of the heat detectors showed relatively constant RTI values across the test
velocities at 75℃ (167℉). However, the RTI values vary significantly with velocity
when the heat detectors are exposed to test temperatures of 200℃ (392℉). At the high
test temperature, the RTI correlation appears to have a positive relationship with velocity,
leading to large standard deviations from the average value. With the exception of
detector B, all of the heat detectors exhibited RTI values that were higher when tested at
75℃ (167℉) than at 200℃ (392℉). Since the current method for testing heat detectors
uses test conditions of 200℃ (392℉) and 1.5 m/s (4.9 ft/s), the results from this study
predict that current RTI values will underestimate the amount of time to activation for
detectors experiencing low temperature, low velocity ceiling jets.
The two thermistor heat detectors (B and D) behaved differently over the range of
test conditions, despite using the same method of heat detection. Some thermistor heat
detectors determine alarm activation using algorithms and the temperature measurements
from the detector. Therefore, the underlying heat balance present in the RTI correlation
does not necessarily represent the method of heat detection by all thermistor heat
detectors as it does not account for delays that could be introduced by sensor processing
software. The assumption of a simple convective heat balance does not represent the
operation of all heat detectors.
The use of the RTI value for characterizing the response of heat detectors does not
provide a fire protection engineer adequate insight into the performance characteristics of
the device needed to properly design a system. This report recommends that an

58
alternative sensitivity correlation be developed specifically for heat detectors that better
represents the response of the devices.
5.1 Future Work
A larger sample size of heat detectors is needed to validate behavior of each
method of heat detection. Only four total detector models were tested, with a single
detector model representing thermal expansion and thermal link heat detectors.
Additionally, there was a large difference between the two test temperatures. Further tests
are needed at intermediate temperatures to allow more insight into the effects of
temperature on the RTI value.
The wide fluctuations in RTI values across the test conditions indicate that
convective heat transfer from the gas to the sensing element is not the only mode of heat
transfer during the plunge test, as previously assumed. Tests should be performed to
quantify the conductive and radiative effects.
Based on the initial findings of this study, the RTI correlation is not constant
across all ranges of temperatures and velocity for heat detectors. Additional work should
be performed to develop a sensitivity correlation appropriate for characterizing heat
detectors.

59
6.0 APPENDIX A – HAI PLUNGE TEST APPARATUS
CHARACTERIZATION
Figure 24 – Visualization of the temperature profile for test conditions 1 – 4.

60
Figure 25 – Visualization of the temperature profile for test conditions 5 – 8

61
Figure 26 – Visualization of velocity profile for test conditions 2, 4, 6, and 8.

62
7.0 APPENDIX B – RTI TEST RESULTS
Table 11 – Summary of the average RTIs for each detector and test
condition. The numeric designation after the detector ID indicates the individual
unit tested.
Temperature
Velocity 0.5 1 1.5 2.5 0.5 1 1.5 2.5
Test Condition 1 2 3 4 5 6 7 8
A-1 (71 C) - 18.5 20.7 19.6 10.7 14.6 15.4 17.8
A-2 (71 C) 18.4 10.4 11.5 12.2 8.7 13.3 13.0 15.2
A-3 (71 C) 17.6 9.0 10.3 11.1 8.2 11.1 11.9 13.6
A-4 (60 C) 33.0 17.7 18.3 20.1 9.5 13.2 15.7 17.3
A-5 (60 C) 22.1 12.5 14.9 15.7 8.7 10.2 11.9 14.2
A-6 (60 C) - 22.7 25.3 27.6 9.3 13.9 20.2 20.2
B-1 (57 C) 33.4 25.6 30.3 32.7 32.0 53.2 58.2 79.8
B-2 (57 C) 39.4 25.9 28.9 38.5 31.5 44.9 56.0 58.5
B-3 (57 C) 34.8 23.4 29.2 30.9 31.1 47.7 62.1 58.8
B-1 (47 C) 19.4 23.5 28.2 34.7 50.5 69.5 85.0 83.8
B-2 (47 C) 29.3 22.4 25.7 37.8 52.2 69.9 70.4 97.6
B-3 (47 C) 22.4 20.1 28.9 32.6 47.4 64.6 71.9 95.4
C (57 C) - 91.9 94.6 92.7 36.9 56.7 60.9 62.1
D-1 (57 C) - 111.6 116.4 120.9 77.3 97.0 101.0 117.0
D-2 (57 C) - 113.8 108.3 106.6 76.1 92.2 103.1 108.4
D-3 (57 C) - 118.5 116.7 113.2 65.9 87.8 97.5 111.6
75 C 200 C

Figure 27 - Summary of all RTI data for all detectors
0
10
20
30
40
50
60
70
80
90
100
110
120
1 2 3 4 5 6 7 8
RTI
(m
s)(1
/2)
Test Condition
Detector A (71 C)
Detector A (60 C)
Detector B (57 C)
Detector B (47 C)
Detector C (57 C)
Detector D (57 C)
75 C 0.5 m/s
75 C 1.0 m/s
75 C 1.5 m/s
75 C 2.5 m/s
200 C 0.5 m/s
200 C 1.0 m/s
200 C 1.5 m/s
200 C 2.5 m/s
63

64
Table 12 – Summary of the average activation times (s) for each detector and
test condition. The numeric designation after the detector ID indicates the
individual unit tested.
Temperature
Velocity 0.5 1 1.5 2.5 0.5 1 1.5 2.5
Test Condition 1 2 3 4 5 6 7 8
A-1 (71 C) - 39.8 38.2 28.0 4.4 4.5 3.9 3.5
A-2 (71 C) 67.1 22.4 20.5 17.3 3.5 4.0 3.3 3.0
A-3 (71 C) 55.6 19.8 19.0 15.8 3.3 3.4 3.0 2.6
A-4 (60 C) 61.3 20.9 18.1 15.4 3.3 3.0 3.2 2.7
A-5 (60 C) 38.2 14.8 14.6 12.0 2.8 2.3 2.4 2.2
A-6 (60 C) - 27.0 24.9 21.2 3.1 3.1 4.0 3.1
B-1 (57 C) 49.8 26.4 25.3 21.3 10.2 11.2 10.3 10.7
B-2 (57 C) 60.1 26.8 24.0 25.0 9.7 9.5 9.8 7.9
B-3 (57 C) 51.3 24.2 24.5 20.0 9.7 10.0 11.0 7.9
B-1 (47 C) 18.8 15.0 14.8 14.2 10.2 10.4 10.5 7.8
B-2 (47 C) 27.7 14.2 13.5 15.4 10.5 10.7 8.7 9.0
B-3 (47 C) 21.4 12.9 15.3 13.3 9.0 9.7 8.9 8.8
C (57 C) - 93.9 80.6 61.2 12.5 12.4 11.1 8.4
D-1 (57 C) - 107.2 92.7 77.1 22.4 20.1 17.6 15.3
D-2 (57 C) - 110.0 85.5 67.7 21.6 19.0 17.8 14.1
D-3 (57 C) - 113.5 92.4 72.0 18.3 18.1 16.8 14.6
75 C 200 C

Figure 28 - Summary of all activation time data for all detectors
0
20
40
60
80
100
120
1 2 3 4 5 6 7 8
Act
ivat
ion
Tim
e (
s)
Test Condition
Detector A (71 C)
Detector A (60 C)
Detector B (57 C)
Detector B (47 C)
Detector C (57 C)
Detector D (57 C)
75 C 0.5 m/s
75 C 1.0 m/s
75 C 1.5 m/s
75 C 2.5 m/s
200 C 0.5 m/s
200 C 1.0 m/s
200 C 1.5 m/s
200 C 2.5 m/s
65

66
8.0 REFERENCES
Alpert, R. L. (1972). Calculation of Response Time of Ceiling-Mounted Fire
Detectors. Fire Technology , 8 (3).
American National Standard Institute. (2008). American National Standard
for Evaluating the Response Time Index for Fixed, Rate of Rise, and Rate
Compensated Heat Detectors.
ASHRAE. (1993). 1993 ASHRAE Handbook Fundamentals. American
Society of Heating, Refrigerating, and Air Conditioning Engineers Inc.
Bissel, W. G. (1988). An Investigation Into The Use of the Factory Mutual
Plunge Tunnel and the Resulting RTI for Fixed Temperature Fire Detectors.
Unpublished Thesis. Worchester Polytechnic Institute.
Blevins, R. D. (1984). Applied Fluid Dynamics Handbook. New York: Van
Nostrand Reinhold Company Inc.
Factorty Mutual. (2006). FM 2000 - Approval Standard for Automatic
Control Mode for Sprinklers for Fire Protection.
Factory Mutual. (2008). FM 3209 American National Standard for
Evaluating the Response Time Index for Fixed, Rate of Rise, and Rate
Compensated Heat Detectors.
Factory Mutual. (2007). FM 3210 Approval Standard for Heat Detectors for
Automatic Fire Alarm Signaling.

67
Heskestad, G., & Bill Jr., R. G. (1989). Comments on "Thermal Response of
Sprinkers. Part II. Characteristics and Test Methods and "Thermal Response of
Sprinklers-A Theoretical Approach". Fire Safety Journal , 189 - 190.
Heskestad, G., & Bill Jr., R. G. (1988). Quantification of Thermal
Responsiveness of Automatic Sprinklers Including Conduction Effects. Fire Safety
Journal , 113-125.
Heskestad, G., & Smith, H. F. (1976). Investigation of A New Sprinkler
Sensitivity Approval Test: The Plunge Test. Factory Mutual Research Corporation.
Leinhard IV, J. H., & Leinhard V, J. H. (2003). A Heat Transfer Textbook.
Cambrige MA: Phlogiston Press.
McAdams, W. H. (1954). Heat Transmission by Conduction and
Convection. New York: McGraw-Hill.
Mehta, R. D., & Bradshaw, P. (1979). Design rules for small low speed
wind tunnels. The Aeronautical Journal of the Royal Aeronautical Society , pp. 443
– 449.
Nam, S. (2006). Predicting Response Times of Fixed-Temperature, Rate of
Rise, and Rate-Compensated Heat Detectors by Utilizing Thermal Response Time
Index of Detectors. Norwood, MA: Factory Mutual.
Nam, S., Donovan, L. P., & Kim, J. G. (2004). Establishing heat detectors'
thermal sensitivity through bench-scale tests. Fire Safety Journal (39), 191-215.

68
National Fire Protection Association. (2010). NFPA 72 - National Fire
Alarm and Signaling Code. Quincy, Massachusetts: NFPA.
National Fire Protection Association. (2007). NFPA 72 - National Fire
Alarm Code. Quincy, Massachusetts: NFPA.
Pepi, J. S. (1986). Design Characteristics of Quick Response Sprinklers.
Boston: Society for Fire Protection Engineers.
Theobald, C. R., Westley, S. A., & Whitbread, S. (1988). Thermal Response
of Sprinklers Part II. Characteristics and Test Methods. Fire Safety Journal , 99-
114.
Underwriters Laboritories. (2005). UL 521 - Heat Detectors for Fire
Protective Signaling Systems. Northbrook, IL: UL.


![EFFECTS OF TEMPERATURE AND DISSOLVED LiClO4 ONradoslav/RBogoslovov_UNLV[2005].pdf · iii ABSTRACT Effects of Temperature and Dissolved LiClO4 on the Viscoelastic and Dynamic Properties](https://img.dokumen.tips/doc/110x75/5b9eb43e09d3f204248c2942/effects-of-temperature-and-dissolved-liclo4-on-radoslavrbogoslovovunlv2005pdf.jpg)