Embed Size (px)
Citation preview

DMD 29819
1
Absorption and disposition of ginsenosides
after oral administration of Panax notoginseng
extract to rats
Houfu Liu, Junling Yang, Feifei Du, Xiumei Gao, Xutao Ma,
Yuhong Huang, Fang Xu, Wei Niu, Fengqing Wang, Yu
Mao, Yan Sun, Tong Lu, Changxiao Liu, Boli Zhang,
Chuan Li
Shanghai Institute of Materia Medica (H.L., J.Y., F.D., F.X., W.N., F.W., Y.M.,
Y.S., T.L., Chu.L) and Graduate School (H.L., Chu.L), Chinese Academy of
Sciences, Shanghai, China; Tianjin University of Traditional Chinese Medicine,
Tianjin, China (X.G., X.M., Y.H., B.Z.); Tianjin State key Laboratory of
Pharmacodynamics and Pharmacokinetics, Tianjin Institute of Pharmaceutical
Research, Tianjin, China (Cha.L)
DMD Fast Forward. Published on September 28, 2009 as doi:10.1124/dmd.109.029819
Copyright 2009 by the American Society for Pharmacology and Experimental Therapeutics.
This article has not been copyedited and formatted. The final version may differ from this version.DMD Fast Forward. Published on September 28, 2009 as DOI: 10.1124/dmd.109.029819
at ASPE
T Journals on February 20, 2020
dmd.aspetjournals.org
Dow
nloaded from

DMD 29819
2
Running Title: ADME OF SANQI GINSENOSIDES
Address correspondence to: Dr. Chuan Li, Shanghai Center for DMPK
Research, Shanghai Institute of Materia Medica, SIBS, Chinese Academy of
Sciences, 555 Zuchongzhi Road, Zhangjiang Hi-Tech Park, Shanghai 201203,
China. E-mail: [email protected]
Number of Text Pages: 22
Number of Tables: 0
Number of Figures: 6
Number of References: 28
Number of Words in Abstract Section: 248
Number of Words in Introduction Section: 578
Number of Words in Discussion Section: 1389
ABBREVIATIONS: AUC, area under concentration-time curve; CLB, biliary clearance;
CLR, renal clearance; CLtot,p, total plasma clearance; Cum.Ae, cumulative amount
excreted during sampling period; ESI, electrospray ionization; i.v., intravenous; LC/MS/MS,
liquid chromatography/tandem mass spectrometry; MRP2, multidrug
resistance-associated protein 2; NROTB, number of rotatable bonds; Papp, apparent
permeability coefficient; P-gp, P-glycoprotein; PK, pharmacokinetic; p.o., peroral; S,
aqueous solubility at a given pH; t1/2, elimination half-life; TPSA, topological polar surface
area.
This article has not been copyedited and formatted. The final version may differ from this version.DMD Fast Forward. Published on September 28, 2009 as DOI: 10.1124/dmd.109.029819
at ASPE
T Journals on February 20, 2020
dmd.aspetjournals.org
Dow
nloaded from
DMD 29819
3
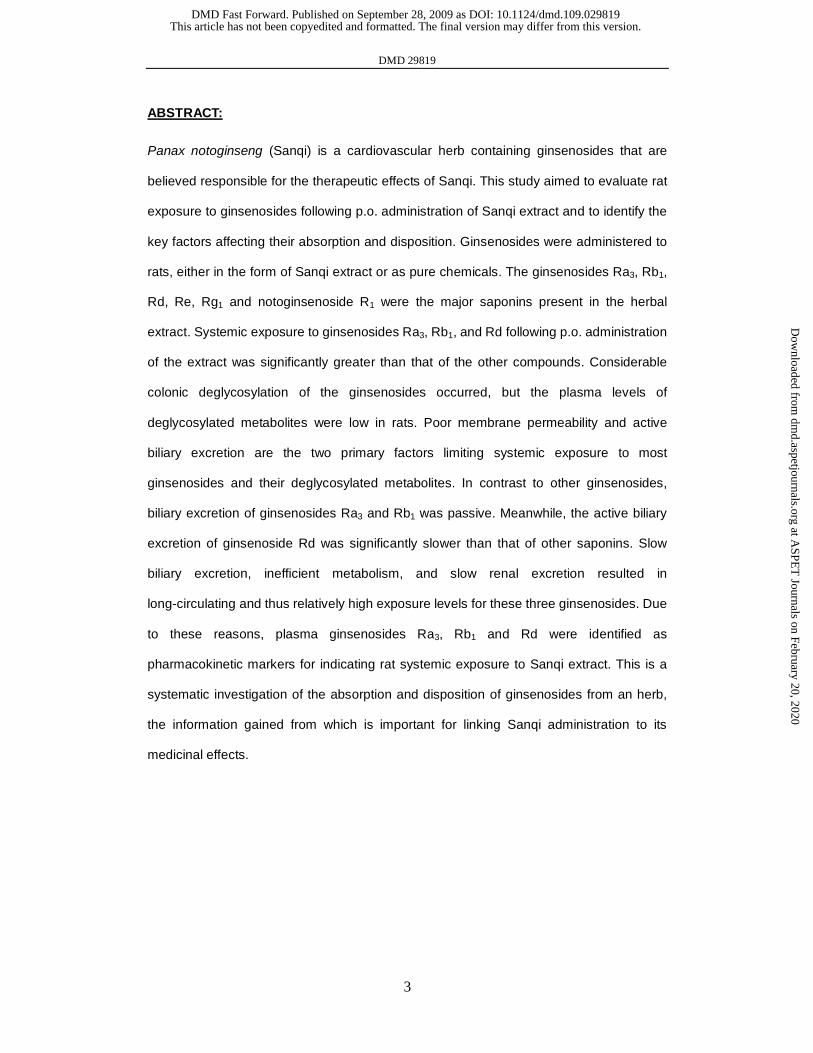
ABSTRACT:
Panax notoginseng (Sanqi) is a cardiovascular herb containing ginsenosides that are
believed responsible for the therapeutic effects of Sanqi. This study aimed to evaluate rat
exposure to ginsenosides following p.o. administration of Sanqi extract and to identify the
key factors affecting their absorption and disposition. Ginsenosides were administered to
rats, either in the form of Sanqi extract or as pure chemicals. The ginsenosides Ra3, Rb1,
Rd, Re, Rg1 and notoginsenoside R1 were the major saponins present in the herbal
extract. Systemic exposure to ginsenosides Ra3, Rb1, and Rd following p.o. administration
of the extract was significantly greater than that of the other compounds. Considerable
colonic deglycosylation of the ginsenosides occurred, but the plasma levels of
deglycosylated metabolites were low in rats. Poor membrane permeability and active
biliary excretion are the two primary factors limiting systemic exposure to most
ginsenosides and their deglycosylated metabolites. In contrast to other ginsenosides,
biliary excretion of ginsenosides Ra3 and Rb1 was passive. Meanwhile, the active biliary
excretion of ginsenoside Rd was significantly slower than that of other saponins. Slow
biliary excretion, inefficient metabolism, and slow renal excretion resulted in
long-circulating and thus relatively high exposure levels for these three ginsenosides. Due
to these reasons, plasma ginsenosides Ra3, Rb1 and Rd were identified as
pharmacokinetic markers for indicating rat systemic exposure to Sanqi extract. This is a
systematic investigation of the absorption and disposition of ginsenosides from an herb,
the information gained from which is important for linking Sanqi administration to its
medicinal effects.
This article has not been copyedited and formatted. The final version may differ from this version.DMD Fast Forward. Published on September 28, 2009 as DOI: 10.1124/dmd.109.029819
at ASPE
T Journals on February 20, 2020
dmd.aspetjournals.org
Dow
nloaded from

DMD 29819
4
Introduction
Herbs have been used for medicinal purposes in China for millennia, and
traditional Chinese medicine still plays an important role in Chinese healthcare. The
dried root of Panax notoginseng (family Araliaceae) is an important Chinese
medicinal herb known as Sanqi. In traditional Chinese medicine, Sanqi is indicated
for analgesia and hemostasis (Chinese Pharmacopoeia Commission, 2005). The herb
is also used to treat patients with angina and coronary artery disease (Mashour et al.,
1998); the pharmacological mechanism may be as a selective calcium ion antagonist
that may interact with the receptor-operated calcium ion channel (Kwan, 1995). Sanqi
also exerts protective effects on the cardiovascular system (Ng, 2006).
Most of Sanqi’s bioactivities are believed to be associated with triterpene
saponins derived mainly from the tetracyclic dammarane. These compounds, known
as ginsenosides, can be classified according to their structures as
20(S)-protopanaxadiol type (ppd-type) and 20(S)-protopanaxatriol type (ppt-type).
The ppd-type ginsenosides possess sugar moieties at the C-3 and/or C-20 positions,
while ppt-type ginsenosides have a hydroxyl group at C-3 and sugar moieties at C-6
and/or C-20. The major saponins present in Sanqi include the ppd-type ginsenosides
Ra3, Rb1 and Rd and the ppt-type ginsenosides Re and Rg1, and notoginsenoside R1.
These ginsenosides contain 2–5 sugars. Although ginsenosides are also prominent
constituents of other Panax species, the relative amounts of the saponin constituents
present in Sanqi differ from those in Asian ginseng (P. ginseng) and American ginseng
(P. quinquefolius). Sanqi contains approximately equivalent amounts of ginsenosides
Rb1 and Rg1, whereas ginsenoside Rb1 is often more abundant than ginsenoside Rg1 in
Asian and American ginsengs. In addition, Sanqi contains a substantial amount of
notoginsenoside GR1, which is also different from Asian and American ginsengs.
This article has not been copyedited and formatted. The final version may differ from this version.DMD Fast Forward. Published on September 28, 2009 as DOI: 10.1124/dmd.109.029819
at ASPE
T Journals on February 20, 2020
dmd.aspetjournals.org
Dow
nloaded from

DMD 29819
5
The pharmacological effects of ginsenosides vary and can even be oppositional.
In contrast to the anti-angiogenic effects of the ppd-type ginsenoside Rb1, the ppt-type
ginsenoside Rg1 has angiogenic properties (Sengupta et al., 2004). However, the lack
of quantitative data regarding the absorption, distribution, metabolism, and excretion
of ginsenosides has hindered investigation of the pharmacological activities. Earlier
PK studies have focused on the development of bioanalytical assays for ginsenosides
and their application to preliminary PK assessments (Xu, et al., 2003; Li et al.,
2004a,b; Li et al., 2006; Li et al., 2007a,b). The PK profiles and disposition of
ppd-type and ppt-type ginsenosides after administration of Sanqi extracts remain
largely unknown. Some studies suggested low oral bioavailability for ginsenosides
Rb1 and Rg1, only 0.1% and 2%, respectively (Odani et al., 1983a,b), whereas these
values were reported to be 4% and 18%, respectively, by others (Xu et al., 2003). The
intestinal microflora can degrade ginsenosides via cleavage of the sugar moieties
(Hasegawa et al., 1996; Akao et al., 1998; Tawab et al., 2003). However, the effects of
deglycosylation on the systemic exposure to ginsenosides are inconclusive.
The objective of this study was to gain understanding about comparative
systemic exposure and PK properties of various ginsenosides from Sanqi and about
the key factors that affect their absorption and disposition. We also investigated the
influence of colonic deglycosylation on systemic exposure to the ginsenosides. The
information gained from the study is indispensable for evaluating the contributions of
the ginsenosides to the medicinal effects of Sanqi, for assessing potential herb-drug or
herb-herb interactions, and for developing Sanqi-based pharmacotherapeutics. To this
end, ginsenosides were administered to rats, either in the form of Sanqi extract or as
pure compounds. Multiple in vivo, in vitro, and in silico approaches were integrated to
determine ginsenoside exposure, absorption, and disposition.
This article has not been copyedited and formatted. The final version may differ from this version.DMD Fast Forward. Published on September 28, 2009 as DOI: 10.1124/dmd.109.029819
at ASPE
T Journals on February 20, 2020
dmd.aspetjournals.org
Dow
nloaded from

DMD 29819
6
Materials and Methods
Chemicals and reagents. Ginsenosides Rb1 (GRb1; molecular mass: 1108), Rd
(GRd; 946), Rg3 (GRg3; 784), F2 (GF2; 784), Rh2 (GRh2; 622), Re (GRe; 946), Rg1
(GRg1; 800), Rf (GRf; 800), F1 (GF1; 638), notoginsenoside R1 (NGR1; 932),
compound-K (C-K; 622), protopanaxadiol (Ppd; 460), and protopanaxatriol (Ppt; 476)
were obtained from the National Institute for the Control of Pharmaceutical and
Biological Products (Beijing, China). Ginsenosides Ra3 (GRa3; 1240), Rc (GRc;
1078), and 20-gluco-Rf (20gRf; 962) were obtained from Fengshanjian Co., Ltd.
(Kunming, China). Ginsenoside Rh1 (GRh1; 638) was obtained from Wuhu Delta Co.,
Ltd. (Wuhu, China). Ginsenoside Rg2 (GRg2; 784) was purchased from Shanghai
Tauto Biotech Co., Ltd. (Shanghai, China). The compound purity exceeded 98%.
Hydroxypropylmethyl cellulose was obtained from Colorcon (Shanghai, China).
N,N-dimethylacetamide, Cremophor, and taurocholic acid were purchased from
Sigma-Aldrich (St Louis, MO). Dulbecco’s modified Eagle’s medium (DMEM),
penicillin-streptomycin, and MEM non-essential amino acids were obtained from
Gibco Invitrogen Cell Culture (Grand Island, NY). Fetal bovine serum was purchased
from Hyclone (Logan, UT). Hank’s balanced salts solution (HBSS), atenolol,
rhodamine123, verapamil hydrochloride, and sulfasalazine were obtained from
Sigma-Aldrich. MK571 was obtained from Calbiochem (San Diego, CA).
HPLC-grade organic solvents, antipyrine, and sodium carboxymethylcellulose
(CMC-Na) were purchased from Sinopharm Chemical Reagent Co., Ltd. (Shanghai,
China).
Preparation of Sanqi extract and individual ginsenosides. The dried roots of
P. notoginseng (Sanqi) were obtained from Shanghai Huayu Chinese Herbs Co., Ltd.
(Shanghai, China). For p.o. administration, 400 g of Sanqi were pulverized, mixed,
This article has not been copyedited and formatted. The final version may differ from this version.DMD Fast Forward. Published on September 28, 2009 as DOI: 10.1124/dmd.109.029819
at ASPE
T Journals on February 20, 2020
dmd.aspetjournals.org
Dow
nloaded from

DMD 29819
7
and steeped in 2400 ml of drinking water for 0.5 h at room temperature before 1 h
sonication-enhanced extraction. The extract was separated by filtration and the residue
was re-extracted with 1600 ml of water. The pooled extract was concentrated under
reduced pressure at 40°C and was modified with hydroxypropylmethyl cellulose at
0.3% (g/ml) before adding water to 800 ml to yield Sanqi extract. The extract was
stored at −15°C pending use.
For i.v. administration, GRa3, GRb1, GRc, GRd, GF2, GRg3, C-K, GRh2, Ppd,
20gRf, GRe, NGR1, GRg1, GRf, GRg2, GRh1, GF1, and Ppt were prepared
individually as injectable 1.0-mM solutions in 0.5% N,N-dimethylacetamide, 9.5%
Cremophor, and 90% saline.
Experimental animals. Rat studies were conducted according to protocols
approved by the Review Committee of Animal Care and Use at the Shanghai Institute
of Materia Medica (Shanghai, China). Male Sprague-Dawley rats (220–250 g;
Shanghai SLAC Laboratory Animal Co., Shanghai, China) were housed in rat cages
(48 × 29 × 18 cm3) in a unidirectional airflow room under controlled temperature
(20–24°C), relative humidity (40–70%), and a 12-h light-dark cycle. Filtered tap
water was available ad libitum, and the rodents were given commercial rat chow ad
libitum except for the overnight period prior to dosing. Rats were acclimated to the
facilities and environment for 7 days prior to the experiments.
Plasma pharmacokinetic studies in rats. Rats were randomly assigned to
different groups (3 rats/group) to receive a p.o. dose of Sanqi extract at 4, 8, or 16
ml/kg (via gavage). In addition, bolus i.v. doses of the injectable solutions of
individual ginsenosides, including GRa3, GRb1, GRc, GRd, GF2, GRg3, C-K, GRh2,
Ppd, 20gRf, GRe, NGR1, GRg1, GRf, GRg2, GRh1, GF1, and Ppt, at 5 μmol/kg were
given to rats (2 or 3 rats/compound) through the tail vein. Serial blood samples [~60
This article has not been copyedited and formatted. The final version may differ from this version.DMD Fast Forward. Published on September 28, 2009 as DOI: 10.1124/dmd.109.029819
at ASPE
T Journals on February 20, 2020
dmd.aspetjournals.org
Dow
nloaded from

DMD 29819
8
µl; 0, 5, 15 (p.o. only), 30 min, and 1 (i.v. only), 2, 4 (i.v. only), 6, 8 (p.o. only), 10, 12
(p.o. only), 15, 24, 36, and 48 h] were collected in heparinized tubes from the orbital
sinus under light ether anesthesia. The blood samples were centrifuged at 3000g for 5
min and the plasma fractions were decanted and frozen at −70°C until analysis.
In a multiple-dose study, rats received Sanqi extract at a daily p.o. dose of 4
ml/rat. Four rats per time points were chosen randomly for blood sampling on days 1,
8, 15, or 22. Serial blood samples (~60 µl; 0, 15, 30 min, and 2, 6, 8, 10, 12, 15, and
24 h post dose) were collected and centrifuged to yield plasma fractions.
Excretion studies in rats. Rats were housed in Nalgene metabolic cages (1
rat/cage) and received p.o. Sanqi extract at 8 ml/kg (via gavage). Urine and feces
samples were collected from four rats at 0–4, 4–10, and 10–24 h on day 1 and every
24 h over the next 3 days. The urine and feces collection tubes were frozen at −15°C
to keep collected samples stable. All excretory samples were weighed before storage
at −70°C. The thawed feces samples were homogenized in 9 volumes of saline for
analysis. Similar urinary/fecal excretion studies were performed for individual
ginsenosides administered in i.v. boluses of 5 μmol/kg.
For bile sampling, rats were anesthetized with ether, the bile duct was cannulated
using polyethylene tubing, and bile was collected at 0–1, 1–3, 3–6, 6–12, 12–18,
18–24, 24–30, 30–36, 36–42, and 42–48 h after a p.o. dose of Sanqi extract at 8 ml/kg
(vial gavage; 3 rats/collection interval). Sodium taurocholate solution (pH 7.4) was
infused into the duodenal cannula (~1 ml/h) during bile collection. The bile samples
were weighed and stored at −70°C. Similar biliary excretion studies were performed
for individual ginsenosides administered in i.v. boluses of 5 μmol/kg.
Tissue distribution study in rats. Rats under ether anesthesia were sacrificed
by bleeding (~10 ml blood; the resulting plasma samples used for analysis) the
This article has not been copyedited and formatted. The final version may differ from this version.DMD Fast Forward. Published on September 28, 2009 as DOI: 10.1124/dmd.109.029819
at ASPE
T Journals on February 20, 2020
dmd.aspetjournals.org
Dow
nloaded from
DMD 29819
9
abdominal aorta at 0, 5, 15 min, 1, 2, 4, 24, or 48 h (3 rats/time point) post i.v. bolus
of GRb1, GRg1, or C-K at 5 µmol/kg (via tail vein). Samples of abdominal adipose,
testicle, bladder, spleen, stomach, small intestine, large intestine, kidney, liver, lung,
heart, and brain were excised and then rinsed in ice-cold saline before gently blotting
on absorbent paper and weighing. The large tissues were homogenized in 4 volumes
of ice-cold saline, whereas the small ones were prepared in 9 volumes. The
homogenates were stored at −70°C.
Pharmacokinetic data processing. Plasma PK parameters were determined
by non-compartmental and compartmental methods using the Kinetica 2000 software
package (version 3.0; Philadelphia, PA). The Cmax and Tmax were observed values
without interpolation. The area under concentration-time curve up to the last
measured time point (AUC0→t) was calculated using the trapezoidal rule. The value of
AUC0→∞ was generated by extrapolating AUC0→t to infinity using the elimination rate
constant and the last measured concentration. The biliary clearance (CLB) and the
renal clearance (CLR) were calculated from the cumulative amount excreted (Cum.Ae)
in the bile and in the urine, respectively, divided by the plasma AUC. Dose
proportionality studies on AUC0→∞ and Cmax were conducted by the regression of
log-transformed data (power model) (Smith et al., 2000).
Cell culture and transport study in Caco-2 monolayers. Caco-2 cells
(American Type Culture Collection, Manassas, VA) were cultured as described
previously (Dai et al., 2008). Bidirectional transport experiments were conducted in
triplicate at 2–50 μM for the individual ginsenosides in HBSS. Dimethyl sulfoxide
was used as cosolvent to improve the solubility of one- or two-sugar containing
ginsenosides, Ppd, and Ppt, but its final concentration did not exceed 1% (v/v). After
incubation for 2 h at 37°C, 50-μl samples were collected from both the receiver and
This article has not been copyedited and formatted. The final version may differ from this version.DMD Fast Forward. Published on September 28, 2009 as DOI: 10.1124/dmd.109.029819
at ASPE
T Journals on February 20, 2020
dmd.aspetjournals.org
Dow
nloaded from

DMD 29819
10
donor compartments, and the compound recovery was determined. The apparent
permeability coefficient (Papp) was expressed in cm/s and the efflux ratio
(Papp(basolateral→apical)/Papp(apical→basolateral)) >3 was considered to be a positive result,
suggesting that the tested compound was an in vitro substrate for the efflux
transporter(s). The P-gp substrate rhodamine 123 exhibited substantial directional
preference with the efflux ratio of 51.6, which was significantly reduced to 2.3 in the
presence of the P-gp inhibitor verapamil. For sulfasalazine, a MRP2 substrate, the
presence of the MRP2 inhibitor MK571 caused reduction of efflux ratios from 137 to
4.8. These data suggested the normal presence of the efflux transporters in the Caco-2
cell monolayers used.
In silico assessment of permeability and solubility. Chemoinformatic
assessment of the physicochemical properties governing intestinal absorption was
performed for ginsenosides and their aglycones. Aqueous solubility (S) was calculated
with ACD/aqueous solubility v8.02 via the ACD/I-Lab service (Advanced Chemistry
Development Inc., Toronto, Canada). The octanol-water partition coefficient (LogP)
was calculated using Pallas software (Pallas 3.6, CompuDrug International, Sedona,
AZ). The total hydrogen bond count (donors and acceptors), topological polar surface
area (TPSA), and number of rotatable bonds (NROTB) were determined using
Molinspiration Property Calculator (Molinspiration Cheminformatics, Bratislava,
Slovak Republic). Lipinski’s Rule of 5 (Lipinski et al., 1997) and the molecular
surface properties (total hydrogen bond count, TPSA, and NROTB) (Veber et al.,
2002) were used to predict the permeability of the tested compounds.
LC/MS/MS bioassays. Validated bioanalytical methods were used to measure
ginsenosides and their metabolites. Biological samples (20 μL), including plasma,
tissue homogenate, excretory, and cell culture medium samples, were precipitated
This article has not been copyedited and formatted. The final version may differ from this version.DMD Fast Forward. Published on September 28, 2009 as DOI: 10.1124/dmd.109.029819
at ASPE
T Journals on February 20, 2020
dmd.aspetjournals.org
Dow
nloaded from
DMD 29819
11
with 80 μL of methanol followed by centrifugation at 21885g for 5 min before
LC/MS/MS analysis. TSQ Quantum mass spectrometer (Thermo Fisher, San Jose, CA)
was interfaced via an ESI probe with a liquid chromatograph (Agilent, Waldbronn,
Germany). The LC separation was achieved on a Phenomenex® Synergi 5 μm C18
column (Torrance, CA). The LC mobile phases were CH3OH/H2O (2:98, v/v,
containing 0.08 mM HCOONH4) for A and CH3OH/H2O (98:2, v/v, containing 0.08
mM HCOONH4) for B, which were used for pulse gradient chromatography (Wang et
al., 2007). The gradient parameters including the start proportion, the elution
proportion, the elution proportion segment, and the column equilibrium segment were
15% B, 100% B, 5.4 min, and 4.4 min, respectively, except for excretory samples
requiring a 5-min start proportion segment. ESI and collision energy were optimized
to maximize generation of the sodiated or protonated molecules and to produce the
characteristic product ions, respectively. The precursor-to-product ion pairs used for
selected reaction monitoring of GRa3, GRb1, GRc, GRd, GF2, GRg3, C-K, GRh2, Ppd,
20gRf, GRe, NGR1, GRg1, GRf, GRg2, GRh1, GF1, and Ppt were m/z 1263→497,
1131→365, 1101→335, 969→789, 807→627, 807→365, 645→203, 623→407,
461→443, 985→365, 969→789, 955→775, 823→643, 823→365, 807→349,
639→621, 661→203, and 477→109, respectively. An online motorized six-port
divert valve was used to introduce the LC eluent flow to the ion source for data
acquisition over the period of 3–9 min, except for excretory samples (8–14 min).
Matrix-matched calibration curves were constructed for the analytes (1.37 or
12.3–3000 ng/ml) using weighted linear regressions of the analyte peak area against
the corresponding nominal concentrations of the analyte (ng/ml), which showed good
linearity (r2 >0.99).
This article has not been copyedited and formatted. The final version may differ from this version.DMD Fast Forward. Published on September 28, 2009 as DOI: 10.1124/dmd.109.029819
at ASPE
T Journals on February 20, 2020
dmd.aspetjournals.org
Dow
nloaded from

DMD 29819
12
Results
Rat systemic exposure to ginsenosides from p.o. Sanqi extract. Major
ginsenosides in Sanqi extract were the ppd-type GRa3 (4.6 mM), GRb1 (23.2 mM),
and GRd (6.9 mM) and the ppt-type GRe (5.2 mM), NGR1 (7.9 mM), and GRg1 (33.1
mM). 20gRf and GRh1 were present at lower levels (2.2 mM for both). In addition,
several minor ginsenosides, including GRc, GF2, GRg3, GRf, GRg2, and GF1 were at
the levels of 0.1–0.5 mM. No other ginsenosides or aglycones were detected in Sanqi
extract.
As shown in Fig. 1, the ppd-type GRa3, GRb1, and GRd were measurable in rat
plasma up to 48 h following p.o. administration of Sanqi extract (4–16 ml/kg),
whereas the ppt-type GRe, NGR1, and GRg1 were measurable only within 24 h. Of the
other ginsenosides, the ppd-type GRc, GF2, and GRg3 were only measured in
nanomolar plasma levels at 6–10 h after dosing at 8 and/or 16 ml/kg. The ppt-type
GRf, GRg2, GRh1, and GF1, except for 20gRf, were not detected in plasma.
Compound-K (C-K; ppd-type) was also measured in rat plasma with delayed
occurrence, i.e., 6 h after dosing. C-K was not contained in the administered Sanqi
extract; it was a colonic deglycosylated product of the bulky ppd-type ginsenosides
(Hasegawa et al., 1996; Akao et al., 1998). We found that C-K could be measured in
rat feces following p.o. administration of purified GRb1 or GRd.
(Insert Figure 1 Here)
The maximal plasma concentrations of the ppd-type GRa3, GRb1, or GRd
occurred 6–10 h after dosing. The exposure levels of GRa3, GRb1, and GRd in
AUC0→∞ and Cmax increased directly with Sanqi extract dose from 4 to 16 ml/kg but
nonlinearly. However, no significant dose-exposure relationship was observed for
C-K. In addition, we also observed a strong linear relationship from a scatter plot of
This article has not been copyedited and formatted. The final version may differ from this version.DMD Fast Forward. Published on September 28, 2009 as DOI: 10.1124/dmd.109.029819
at ASPE
T Journals on February 20, 2020
dmd.aspetjournals.org
Dow
nloaded from

DMD 29819
13
logAUC0→∞ of GRa3, GRb1, and GRd versus their corresponding logarithmic
compound doses from the ingested extract (r2 = 0.96; n = 27; Fig. 1). The mean oral
bioavailability of GRa3, GRb1, and GRd after administration of the extract was quite
low: 0.1–0.2%. Due to their long t1/2, i.e., 13, 18, and 13 h for GRa3, GRb1, and GRd,
respectively, significant increases in systemic exposure were observed in the
multiple-dose study (Fig. 1). The plasma AUC0→24h and Cmax of these ppd-type
ginsenosides increased from day 1 to day 15 and the values (corrected for rat body
weight) on day 15 were 2.1–2.6-times higher than those on day 1. However, the
systemic exposure levels on day 22 increased only 1.3–1.9-fold compared with those
on day 1. The reason for these decreases remains to be explored.
Double or triple peaks occurred in the plasma-concentration time courses of the
ppt-type GRe, NGR1, and GRg1 following p.o. dose of Sanqi extract (Fig. 1). Despite
the interanimal variability, the peak appearance patterns for GRe, NGR1, and GRg1 for
a given rat were almost identical. The F values of these ppt-type ginsenosides ranged
from 0.2 to 0.6%. Dislike the preceding ppd-type compounds, the systemic exposure
levels of GRe, NGR1, and GRg1 were poorly correlated with the p.o. extract dosage.
In addition, the AUC0→t values of GRe, NGR1, and GRg1, normalized according to the
corresponding compound doses from the extract, were about 1/10 of those of the
ppd-type compounds.
Collectively, although their total amounts present in Sanqi extract were
comparable, the systemic exposure levels of the ppd-type ginsenosides GRa3, GRb1,
and GRd were significantly greater than those of the ppt-type ginsenosides GRe,
NGR1, and GRg1. The long t1/2 of these ppd-type compounds counteracted the
unfavorable effects of their poor F on the systemic exposure levels.
Permeability and solubility of ginsenosides and their deglycosylated
This article has not been copyedited and formatted. The final version may differ from this version.DMD Fast Forward. Published on September 28, 2009 as DOI: 10.1124/dmd.109.029819
at ASPE
T Journals on February 20, 2020
dmd.aspetjournals.org
Dow
nloaded from

DMD 29819
14
products. Because of the poor F, the permeability and solubility of individual
ginsenosides were assessed in vitro and in silico to gain understanding of the
mechanisms governing intestinal absorption of ginsenosides. Because it had been
reported that ginsenosides could be stripped of their sugar moieties by the colonic
microflora (Hasegawa et al., 1996; Akao et al., 1998; Tawab et al., 2003), some
monoglycosides and aglycones were also included in the assessment. As shown in Fig.
2, the Papp values of ginsenosides measured in Caco-2 monolayers suggested that the
membrane permeability of most ginsenosides was poor with the Papp values <3×10⁻⁷
cm/s. GF2, C-K, GRh2, GRh1, and GF1 possessed slightly increased Papp values
(around 1×10⁻⁶ cm/s); the Papp values of Ppd and Ppt were about 2×10⁻⁶ cm/s. The
comparable bidirectional Papp values of most the ginsenosides and their aglycones
suggested passive diffusion as the transport mechanism, except for GF2 and GF1,
which exhibited efflux ratios 10.0 and 48.7, respectively. The efflux ratio of GF2 was
significantly reduced to 2.1 and 2.2, in the presence of verapamil and MK571,
respectively, suggesting that this ginsenoside might be the substrate of both P-gp and
MRP2. Similar situation occurred for GF1, i.e., the efflux ratio was reduced to 12.0
and 9.6 with verapamil and MK571, respectively.
(Insert Figure 2 Here)
In silico assessment suggested that many ginsenosides could be defined as
soluble (Fig. 2). S values ranged from 160×10−6 to 17 000×10−6 M, which were
significantly greater than the highest initial concentrations in the Caco-2 study
(50×10−6 M). However, the solubility significantly decreased for compounds with
fewer or no sugar moieties attached. The S values of GF1 and GRh1 were 86×10−6 and
75×10−6 M, respectively, whereas those of GRg3, C-K, GRh2, Ppd, GRg2, and Ppt
ranged from 0.08×10⁻⁶ to 9×10⁻⁶ M. The S values did not vary significantly as pH
This article has not been copyedited and formatted. The final version may differ from this version.DMD Fast Forward. Published on September 28, 2009 as DOI: 10.1124/dmd.109.029819
at ASPE
T Journals on February 20, 2020
dmd.aspetjournals.org
Dow
nloaded from
DMD 29819
15
changed. On the other hand, most the ginsenosides, except C-K, GRh2, Ppd, GF1,
GRh1, and Ppt, had unfavorable traits underlying poor membrane permeability,
including high total hydrogen bond counts ranging from 22 to 44 (donors and
acceptors; favorable ≤12), high TPSA from 219 Å to 436 Å (favorable value ≤140 Å),
and high flexibility ranging from 10 to 18 (favorable value ≤10). Reducing the number
of sugar moieties decreased hydrogen-bonding capacity, molecular flexibility, and
molecular mass, but also reduced solubility significantly (Fig. 2). In addition, the
lipophilicity of the Ppd and Ppt aglycones was significantly higher (LogP, 5.4 and 4.4,
respectively) than that of the ginsenosides (LogP, −0.1–3.1).
Collectively, our in vitro observations and in silico calculations suggested that
the poor intestinal absorption of the ginsenosides could be attributed to poor
membrane permeability, which was influenced by the increased sugar number.
Although these traits were improved for the deglycosylated products, significant
increases in intestinal absorption appeared to be limited by their lowered solubility.
Structure-dependent disposition of i.v. administered ginsenosides in rats.
In order to understand the variations in the systemic exposure to ginsenosides
following p.o. administration of Sanqi extract, pure ginsenosides and their aglycones
were administered as i.v. boluses. As shown in Fig. 3, the systemic exposure levels of
the ginsenosides were directly related to their t1/2. GRa3, GRb1, GRc, and GRd had
significantly longer t1/2 values (7.5–19.8 h) than the other ginsenosides (0.2–3.2 h).
The wide variation in CLtot.p was the primary reason for the considerable differences
in t1/2. The tested ginsenosides could be divided into two groups according to CLtot.p:
(1) the 3–5 sugar-containing ppd-type ginsenosides GRa3, GRb1, GRc, and GRd
(CLtot.p, 4–20 ml/h/kg) and (2) the ppt-type (352–2718 ml/h/kg) and the minor
ppd-type ginsenosides (505–2296 ml/h/kg, except for GF2 being 66 ml/h/kg). In
This article has not been copyedited and formatted. The final version may differ from this version.DMD Fast Forward. Published on September 28, 2009 as DOI: 10.1124/dmd.109.029819
at ASPE
T Journals on February 20, 2020
dmd.aspetjournals.org
Dow
nloaded from

DMD 29819
16
contrast to CLtot.p, the Vss values for most ginsenosides fell within the range of 93
ml/kg for GRg3 to 533 ml/kg for GRg1, which was between the rat plasma volume (31
ml/kg) and the rat total body water volume (670 ml/kg) (Davies and Morris, 1993).
The Vss value of GF1 was 808 ml/kg. Ppd and Ppt had short t1/2 values of 1.5 and 0.2 h,
respectively, as well as high CLtot.p (1482 and 6960 ml/h/kg, respectively) and large
Vss (2016 and 1716 ml/kg, respectively).
Collectively, the notable differences in systemic exposure among ginsenosides
were primarily related to their variations in CLtot.p, and the clearance mechanisms
were most likely subject to structure-specific recognition. Analysis of the structural
features of the compounds suggested that the attachment of 4 for more sugar moieties
significantly reduced the rate of elimination. In addition, the sugar attachment site
appeared to be also relevant as demonstrated by the significant difference in CLtot.p
between the ppd-type GRd and the ppt-type GRe, NGR1, and 20gRf (Fig. 3).
(Insert Figure 3 Here)
Elimination pathways of ginsenosides in rats receiving Sanqi extract. To
identify the primary elimination pathways that influenced systemic exposure to the
ginsenosides, we evaluated the biliary and renal excretion profiles of the ginsenosides,
as well as and the metabolism, in rats. In addition, fecal samples were also analyzed to
monitor intestinal nonabsorption, biliary excretion, and/or colonic deglycosylation of
ginsenosides. As shown in Fig. 4, the ppd-type ginsenosides (GRa3, GRb1, and GRd)
and the ppt-type ginsenosides (NGR1, GRe, and GRg1) exhibited significant
differences in excretion profiles. In contrast to the rat systemic exposure levels (as per
AUC), the cumulative amounts of the ppt-type ginsenosides excreted intact into bile
and urine, corrected according to the corresponding compound doses from Sanqi
extract, were significantly greater than those of the ppd-type ginsenosides.
This article has not been copyedited and formatted. The final version may differ from this version.DMD Fast Forward. Published on September 28, 2009 as DOI: 10.1124/dmd.109.029819
at ASPE
T Journals on February 20, 2020
dmd.aspetjournals.org
Dow
nloaded from

DMD 29819
17
(Insert Figure 4 Here)
As shown in Fig. 4, the most abundant fecal compounds in rats were GRg1
(Cum.Ae, 39.1 μmol/kg), C-K (20.9 μmol/kg), and GF1 (7.1 μmol/kg). We speculated
that the high levels of these compounds in feces resulted from the colonic microflora
stripping the sugar moieties from the ginsenosides in the extract. Their absence (C-K)
or presence at a very low level (GF1) in Sanqi extract supports this hypothesis. The
contribution of colonic deglycosylation of major ppt-type ginsenosides to the fecal
GRg1 was supported by two lines of evidence: (1) fecal recovery of GRg1 following
p.o. administration of pure GRg1 was significantly lower than that following p.o.
administration of Sanqi extract (at the same GRg1 dose) in the same rats, and (2) p.o.
administration of pure 20gRf, GRe, and NGR1 generated fecal GRg1. Meanwhile,
poor intestinal absorption and rapid biliary excretion accounted for the relatively low
plasma levels of GRg1, C-K, and GF1. Although both of the aglycones Ppd and Ppt
were detected in fecal samples following p.o. administration of Sanqi extract, their
fecal Cum.Ae values were quite low: 0.4 and 0.2 μmol/kg, respectively. Ppd and Ppt
were not detected in plasma, bile, or urine, suggesting that they were two minor
metabolites in negligible quantities.
To further elucidate the excretion profiles of ginsenosides, individual pure
compounds were i.v. administered to rats at 5 μmol/kg. We confirmed that biliary
excretion was the major elimination route for most ginsenosides, demonstrating the
percentage of i.v. dose excreted intact into bile 43–100%. The ginsenosides were
excreted rapidly via active biliary transport, indicative of high bile-to-plasma
distribution ratios (AUCbile/AUCplasma, 22–1907). The AUCbile/AUCplasma ratio of GRd
was 4.4. However, the biliary excretion of GRa3, GRb1, and GRc were slow and their
AUCbile/AUCplasma ratios ranged from 0.2 to 0.4. As to renal excretion, most
This article has not been copyedited and formatted. The final version may differ from this version.DMD Fast Forward. Published on September 28, 2009 as DOI: 10.1124/dmd.109.029819
at ASPE
T Journals on February 20, 2020
dmd.aspetjournals.org
Dow
nloaded from

DMD 29819
18
ginsenosides were slow and passively excreted into rat urine. GRg3 and
monoglycosides were detected in negligible amounts in urine. However, when
corrected for plasma protein binding, the unbound CLR of NRG1, 20gRf, and GRg1,
497–1007 ml/h/kg, exceeded the rat glomerular filtration rate of 314 ml/h/kg (Davies
and Morris, 1993), suggesting that some active tubular secretion occurred in rats.
Figure 5 shows the excretion profiles of GRb1 and GRg1, which could represent the
two types of typical situations among the tested ginsenosides. About 10% and 40% of
i.v. administered GRb1 were excreted intact into rat bile and urine, respectively,
whereas the corresponding fractions for GRg1 were around 73% or 18%, respectively.
The CLB and CLR were 1840 and 427 ml/h/kg, respectively, for GRg1, but only 1.0
and 3.5 ml/h/kg, respectively, for GRb1.
As to the metabolism of i.v. administered GRb1, the monooxidized metabolite,
the deglycosylated metabolite (GRd), and the monooxidized metabolite of GRd were
measured in rat bile and urine (Fig. 5). These metabolic reactions were catalyzed by
enzymes in rat tissues such as the liver. About 1.8% and 1.5% of i.v. administered
GRb1 were eliminated very slowly as the tissue-deglycosylated metabolite GRd via
bile and urine, respectively, and the values would continue to increase beyond 48 h for
bile and 96 h for urine. The tissue-oxidation of GRb1 appeared to take place faster
than the tissue-deglycosylation, but to lesser extent. We estimated that in rats about
10–15% of i.v. administered GRb1 might be ultimately eliminated via these metabolic
pathways. As for i.v. administered GRg1, only one monooxidized metabolite was
detected in rat bile and urine, which accounted for about 0.2% and 0.1% of the dose,
respectively. The significantly minimal tissue-metabolism observed for GRg1 could
have resulted from, at least in part, the rapid biliary and renal excretions. Recently,
Qian et al. also detected the oxidation and deglycosylation products of GRb1 in rat
This article has not been copyedited and formatted. The final version may differ from this version.DMD Fast Forward. Published on September 28, 2009 as DOI: 10.1124/dmd.109.029819
at ASPE
T Journals on February 20, 2020
dmd.aspetjournals.org
Dow
nloaded from

DMD 29819
19
urine (2006).
(Insert Figure 5 Here)
Collectively, rapid and extensive biliary excretion was a key factor limiting the
systemic exposure to most ginsenosides from Sanqi extract, which appeared to
involve active secretion mechanisms. However, the ppd-type GRa3, GRb1, GRc, and
GRd circumvented or significantly reduced the active secretion into bile. Renal
excretion also contributed considerably to the elimination of some ginsenosides
including GRa3, GRb1, GRc, GRd, NRG1, 20gRf, and GRg1, but via different
transportation mechanisms. There was considerable deglycosylation of unabsorbed
ginsenosides by the colonic microflora, but the colonic metabolism did not
significantly improve overall systemic exposure to ginsenosides from orally
administered Sanqi extract. The relative contributions of tissue-deglycosylation and
tissue-oxidation to overall elimination of ginsenosides appeared to be poor.
Comparative tissue exposure to i.v. administered GRb1, GRg1, and C-K.
To address whether the observed differences in plasma concentration among
ginsenosides reflect well the situation in tissues, a comparative study of tissue
distribution was performed with GRb1, C-K, and GRg1, which was based on
measurements in whole rat tissue. These three compounds were selected as prototype
compounds for the study, because GRb1 and GRg1 were the ppd-type and the ppt-type
ginsenosides, respectively, present in the greatest amounts in Sanqi extract and
because their GRb1, C-K, and GRg1 were the compounds measured in large amounts
in rat plasma or excretory samples (Fig. 4). To ease comparisons, each investigational
compound was administered as an i.v. bolus of 5 μmol/kg. Following dosing, all
compounds transferred rapidly from blood to tissues with Tmax values of 0.1–2.7 h for
different tested tissues. Plasma and tissue concentrations of GRb1 at 5 min post dose
This article has not been copyedited and formatted. The final version may differ from this version.DMD Fast Forward. Published on September 28, 2009 as DOI: 10.1124/dmd.109.029819
at ASPE
T Journals on February 20, 2020
dmd.aspetjournals.org
Dow
nloaded from

DMD 29819
20
(C5min) were in the rank order of plasma (50 μM) > liver (22 μM) > kidney (19 μM) >
heart (16 μM) > lung (12 μM) > bladder (5.1 μM) > spleen (4.7 μM) > testicle (3.8
μM) > large intestine (3.2 μM) > small intestine (2.7 μM) > stomach (2.2 μM) ≈
adipose (1.9 μM) > brain (0.8 μM). The tissue AUC values of GRb1 versus the
corresponding plasma value are shown in Fig. 6.
Consistent with the differences observed for plasma, both the C5min and AUC of
GRb1 in the tissues were much greater than the corresponding levels for GRg1 or C-K.
The tissue t1/2 values of GRb1 (14–31 h) were comparable with the corresponding
plasma data (20 h), which were significantly longer than those of GRg1 (0.2–1 h;
except for the kidney 22 h) or C-K (0.3–6 h). Despite its generally low levels in tissue,
GRg1 exhibited a relatively high C5min and AUC in the liver (70 μM and 28 μM·h,
respectively) compared with the corresponding plasma data (11 μM and 2 μM·h,
respectively). Similar phenomena were observed for C-K: 276 μM and 242 μM·h,
respectively, in the liver versus 29 μM and 11 μM·h, respectively, in plasma. The
hepatic uptake of GRg1 and C-K could be associated with the active biliary secretion
mediated by the hepatic transporters. In addition, renal uptake of GRg1 was also
extensive, demonstrating a relatively high C5min (86 μM) and AUC (99 μM·h) as
compared with the corresponding plasma data. In agreement with their unfavorable
properties regarding membrane permeability, GRb1, GRg1, and C-K were poorly
delivered to the CNS.
(Insert Figure 6 Here)
Collectively, the significant differences in the plasma levels among ginsenosides
could reflect the situations in the tissues. In addition, the tissue distribution data for
GRg1 and C-K support the possible involvement of active secretion mechanisms in
the hepatic and/or renal elimination of the compounds.
This article has not been copyedited and formatted. The final version may differ from this version.DMD Fast Forward. Published on September 28, 2009 as DOI: 10.1124/dmd.109.029819
at ASPE
T Journals on February 20, 2020
dmd.aspetjournals.org
Dow
nloaded from

DMD 29819
21
Discussion
Bioactive constituents with favorable PK properties and existing in adequate
abundance in a medicinal herb are most likely to account for the pharmacological
effects of the herb and to form the basis of its therapeutic efficacy. Our current and
recent studies (Lu et al., 2008) indicate that both animals and humans are exposed
significantly to some but not all constituents of an herbal medicine after dosing and
that the PK profiles, like the pharmacological activities, can be used as a “sieve” to
assess the importance and usefulness of the individual herbal constituents. Such PK
studies are essential for understanding the link between the herb consumption and the
pharmacological effects and for identifying the medicinal principles from the
chemical constituents in an herbal medicine.
In contrast to Western medicines that normally contain only one active ingredient,
herbal medicines contain numerous chemical constituents. Multi-component PK
studies of an herbal medicine can be challenging. Such studies are complicated by the
great diversity of the constituents with regard to both chemical structure and content.
Variations in chemical structures result in different physiochemical properties and PK
profiles among the constituents, whereas the variations in content result in
dissimilarities in constituent dosages. Some important goals for PK studies of an
herbal medicine are to (1) measure systemic exposure to the administered medicine,
(2) identify suitable “PK markers” indicative of exposure to the medicine, (3)
compare the PK properties of the constituents, (4) understand the pathways that
influence their systemic exposure, (5) analyze the quantitative structure-PK
relationships for the constituents and metabolites, and (6) assess differences in PK
properties between the animal species and humans. It is worth mentioning that the
constituents in an herbal medicine are often structurally related, which may be divided
This article has not been copyedited and formatted. The final version may differ from this version.DMD Fast Forward. Published on September 28, 2009 as DOI: 10.1124/dmd.109.029819
at ASPE
T Journals on February 20, 2020
dmd.aspetjournals.org
Dow
nloaded from

DMD 29819
22
into more than one class. Analysis of quantitative structure-PK relationships (QSPKR)
of herbal chemicals may gain insight into the role of molecular properties and/or
functional group presentation in the PK of compounds, and may help understand the
PK trends within the compound series and anticipate which homologues have
favorable PK properties compatible with the pharmacological activities. The key role
that structure-based differentiation can play in the absorption and disposition of herbal
constituents highlights that the QSPKR analysis is a vital component of the
multi-component PK study. In the current study, QSPKR analysis helped us identify
key factors affecting the systemic exposure to different ginsenosides and their
deglycosylated products following administration of Sanqi extract.
The PK properties of constituents contained in an herbal medicine can be quite
different. When bioactive constituents from an herb are measurable in a biosample,
such as plasma or urine, and have favorable PK properties that could be used to
substantiate systemic exposure to the herb, they are referred to as “PK markers” of the
herb (Lu et al., 2008). Identification of PK markers for herbs could be helpful in the
design and interpretation of toxicity and clinical studies, as well as in the evaluation of
potential herb-drug or herb-herb interactions. Here, we measured rat systemic
exposure to ginsenosides and their deglycosylated products following p.o.
administration of Sanqi extract and compared their PK properties. We found that the
ppd-type GRa3, GRb1, and GRd measured in plasma were suitable PK markers of p.o.
administered Sanqi extract in rats. The conclusion was made on the basis of the
dose-dependent systemic exposures and PK properties of these ginsenosides. In
contrast, the other plasma ginsenosides, including the ppt-type GRe, NGR1, and GRg1
and the metabolite ppd-type C-K, were not the PK markers for Sanqi extract because
of their low exposure levels and poor dose proportionality. Although the ppt-type
This article has not been copyedited and formatted. The final version may differ from this version.DMD Fast Forward. Published on September 28, 2009 as DOI: 10.1124/dmd.109.029819
at ASPE
T Journals on February 20, 2020
dmd.aspetjournals.org
Dow
nloaded from

DMD 29819
23
ginsenosides were excreted into the rat urine in substantial amounts, large inter-animal
variation prevented the use of the urinary compounds as surrogate PK markers.
Meanwhile, renal excretion of GRa3, GRb1, GRd, and C-K was very slow.
Poor membrane permeability was a major factor limiting intestinal absorption of
ginsenosides, which was attributed mainly to the sugar moieties increasing the
hydrogen bond count, polar surface area, and molecular flexibility of the molecules to
unfavorable levels. Furthermore, reducing the sugar moiety content appeared not to
improve significantly intestinal absorption, because of the associated decrease in
solubility. This is supported by our rat data that the fecal Cum.Ae values of the
deglycosylated products exceeded substantially the corresponding sum of biliary and
urinary Cum.Ae. In addition, the poor permeability could also partially explain our
observations in the tissue distribution study. In most cases, the tissue concentrations of
ginsenosides were lower than the corresponding plasma levels, and the compounds
persisted in the organ capillaries and the organ interstitial fluid, rather than the organ
cells. However, the liver concentrations of most ginsenosides were significantly
higher than the plasma levels. This can most likely be attributed to some uptake
transporters mediating active transport of the ginsenosides into the hepatic cells.
Most of the ginsenosides and their deglycosylated products were subject to rapid
extensive biliary excretion through active transport, resulting in their short t1/2 values
and low systemic exposure levels. Meanwhile, renal excretion of most ginsenosides is
slow and its role in the overall elimination could be minimized by rapid extensive
biliary excretion. There were two kinds of exception, i.e., (1) slow but extensive renal
excretion because of slow biliary excretion for GRa3, GRb1, and GRc and (2) rapid
renal excretion involving active tubular secretion for NRG1, 20gRf, and GRg1. In
addition, the contribution of ginsenoside metabolism to their overall elimination was
This article has not been copyedited and formatted. The final version may differ from this version.DMD Fast Forward. Published on September 28, 2009 as DOI: 10.1124/dmd.109.029819
at ASPE
T Journals on February 20, 2020
dmd.aspetjournals.org
Dow
nloaded from
DMD 29819
24
also limited. The metabolism occurring in rat tissues, such as the liver, included
deglycosylation and oxidation. The tissue-deglycosylation was found to be quite slow,
while the tissue-oxidation was rapid. Compared with the minor tissue-deglycosylation,
the pre-absorption deglycosylation of ginsenosides mediated by the gut microflora
appeared to be relatively extensive. Our data (Fig. 4) suggested that the colonic
deglycosylation of the ppd-type ginsenosides in rats occurred at C-20 until only one
glucose remained, i.e., GRd, and then deglycosylation preferentially took place at C-3,
followed by stripping of the last glucose moiety at C-20 to yield the aglycone Ppd.
Meanwhile, the initial colonic deglycosylation of the ppt-type ginsenosides appeared
to occur preferentially at C-6 to yield GRg1. Further deglycosylation occurred at either
C-6 or C-20 to form GF1 or GRh1, respectively, which was followed by stripping of
the last glucose moiety at C-20 or C-6, respectively, to yield the aglycone Ppt.
The attachment of four and five sugar moieties in the ppd-type GRa3 and GRb1,
respectively, appeared to play a key role in blocking access to the biliary transporters
responsible, resulting in slow biliary excretion of the two compounds (CLB: 1.5 and
1.0 ml/h/kg, respectively) in rats. GRd had a significantly slower CLB value (19
ml/h/kg) than the other three-sugar containing ginsenosides, 20gRf, GRe, and NGR1
(258–775 ml/h/kg), suggesting that the sugar attachment sites also influenced the
active biliary excretion. In addition, GRa3, GRb1, and GRd underwent limited
metabolism and slow renal excretion. Slow elimination of these bulky ppd-type
ginsenosides made them long-circulating, which counteracted the unfavorable effect
of poor intestinal absorption on their systemic exposure.
GRb1 and GRd have been reported to possess activities associated with the
putative cardiovascular effects of Sanqi. GRb1 has estrogenic activity (Lee et al., 2003)
via a mechanism independent of estrogen receptor-binding (Cho et al., 2004). GRb1
This article has not been copyedited and formatted. The final version may differ from this version.DMD Fast Forward. Published on September 28, 2009 as DOI: 10.1124/dmd.109.029819
at ASPE
T Journals on February 20, 2020
dmd.aspetjournals.org
Dow
nloaded from

DMD 29819
25
also has antioxidant activity (Liu et al., 2003). GRd can dilate vascular muscle by
blocking Ca2+ influx through receptor- and store-operated Ca2+ channels in the muscle
cells (Guan et al., 2006). The pharmacological activities of GRa3 remain to be
understood.
Drug exposure is a crucial determinant of drug response, and therefore its
efficacy and safety. In the current study, we compared the systemic exposure to
putatively active ginsenosides from p.o. administered Sanqi extract and investigated
the relevant mechanisms governing exposure to ginsenosides. In summary, our data
indicate that poor membrane permeability and rapid and extensive active biliary
excretion are two primary factors limiting systemic exposure to most Sanqi
ginsenosides and their deglycosylated metabolites. The major ginsenosides measured
in the plasma of rats were long-circulating GRa3, GRb1, and GRd, because of their
slow biliary excretion. These plasma ginsenoside can be used as suitable PK markers
for Sanqi extract. Considerable colonic deglycosylation occurred but the systemic
exposure to the metabolites was low. The PK profiles of the Sanqi ginsenosides in
humans were comparable to those found in rats. Slight interspecies differences could
have resulted from humans being relatively poor biliary excretors compared with rats.
The details of the human study will be reported elsewhere.
This article has not been copyedited and formatted. The final version may differ from this version.DMD Fast Forward. Published on September 28, 2009 as DOI: 10.1124/dmd.109.029819
at ASPE
T Journals on February 20, 2020
dmd.aspetjournals.org
Dow
nloaded from

DMD 29819
26
References
Akao T, Kanaoka M, Kobashi K (1998) Appearance of compound K, a major
metabolite of ginsenoside Rb1 by intestinal bacteria, in rat plasma after oral
administration — measurement of compound K by enzyme immunoassay. Biol
Pharm Bull 21: 245–249.
Chinese Pharmacopoeia Commission (2005) Pharmacopoeia of the People’s Republic
of China (English Edition, Volume I). Beijing: People’s Medical Publishing
House. pp. 10–11.
Cho J, Park W, Lee S, Ahn W, Lee Y (2004) Ginsenosides-Rb1 from Panax ginseng
C.A. Meyer activates estrogen receptor-α and -β, independent of ligand binding.
J Clin Endocrinol Metab 89: 3510–3515.
Dai J-Y, Yang J-L, Li C (2008) Transport and metabolism of flavonoids from Chinese
herbal remedy Xiaochaihu-tang across human intestinal Caco-2 cell monolayers.
Acta Pharmacol Sin 29: 1086–1093.
Davies B, Morris T (1993) Physiological parameters in laboratory animals and
humans. Pharm Res 10: 1093–1095.
Guan Y-Y, Zhou J-G, Zhang Z, Wang G-L, Cai B-X, Hong L, Qiu Q-Y, He H (2006)
Ginsenoside-Rd from panax notoginseng blocks Ca2+ influx through receptor-
and store-operated Ca2+ channels in vascular smooth muscle cells. Eur J
Pharmacol 548: 129–136.
Hasegawa H, Sung JH, Matsumiya S, Uchiyama M (1996) Main ginseng saponin
metabolites formed by intestinal bacteria. Planta Med 62: 453–457.
Kwan CY (1995) Vascular effects of selected antihypertensive drugs derived from
traditional medicinal herbs. Clin Exp Pharmacol Physiol 22: s297–s299.
Lee Y, Jin Y, Lim W, Park W, Cho J, Jang S, Lee SK (2003) Ginsenoside-Rb1 acts as a
This article has not been copyedited and formatted. The final version may differ from this version.DMD Fast Forward. Published on September 28, 2009 as DOI: 10.1124/dmd.109.029819
at ASPE
T Journals on February 20, 2020
dmd.aspetjournals.org
Dow
nloaded from

DMD 29819
27
weak phytoestrogen in MCF-7 human breast cancer cells. Arch Pharm Res 26:
58–63.
Li L, Sheng Y-X, Zhang J-L, Wang C-S, Guo D-A (2004a) HPLC determination of
four active saponins from Panax notoginseng in rat serum and its application to
pharmacokinetic studies. Biomed Chromatogr 18: 849–856.
Li L, Zhang J-L, Sheng Y-X, Ye G, Guo H-Z, Guo D-A (2004b) Liquid
chromatographic method for determination of four active saponins from Panax
notoginseng in rat urine using solid-phase extraction. J Chromatogr B 808:
177–183.
Li L, Sheng Y-X, Zhang J-L, Wang S-S, Guo D-A (2006) High-performance liquid
chromatographic assay for the active saponins from Panax notoginseng in rat
tissues. Biomed Chromatogr 20: 327–335.
Li X-Y, Sun J-G, Wang G-J, Hao H-P, Liang Y, Zheng Y-T, Yan B, Sheng L-S (2007a)
Simultaneous determination of Panax notoginsenoside R1, ginsenoside Rg1, Rd,
Re and Rb1 in rat plasma by HPLC/ESI/MS: platform for the pharmacokinetic
evaluation of total panax notoginsenoside, a typical kind of multiple constituent
traditional Chinese medicine. Biomed Chromatogr 21: 735–746.
Li X-Y, Wang G-J, Sun J-G, Hao H-P, Xiong Y-Q, Yan B, Zheng Y-T, Sheng L-S
(2007b) Pharmacokinetic and absolute bioavailability study of total Panax
notoginseng, a typical multiple constituent traditional Chinese medicine (TCM)
in rats. Biol Pharm Bull 30: 847–851.
Lipinski CA, Lombardo F, Dominy BW, Feeney PJ (1997) Experimental and
computational approaches to estimate solubility and permeability in drug
discovery and development settings. Adv Drug Deliv Rev 23: 3–25.
Liu Z-Q, Luo X-Y, Liu G-Z, Chen Y-P, Wang Z-C, Sun Y-X (2003) In vitro study of
This article has not been copyedited and formatted. The final version may differ from this version.DMD Fast Forward. Published on September 28, 2009 as DOI: 10.1124/dmd.109.029819
at ASPE
T Journals on February 20, 2020
dmd.aspetjournals.org
Dow
nloaded from

DMD 29819
28
the relationship between the structure of ginsenoside and its antioxidative or
prooxidative activity in free radical induced hemolysis of human erythrocytes. J
Agric Food Chem 51: 2555–2558.
Lu T, Yang J-L, Gao X-M, Chen P, Du F-F, Sun Y, Wang F-Q, Xu F, Shang H-C,
Huang Y-H, Wang Y, Wan R-Z, Liu C-X, Zhang B-L, Li C (2008) Plasma and
urinary tanshinol from Salvia miltiorrhiza (Danshen), can be used as
pharmacokinetic markers for cardiotonic pills, a cardiovascular herbal medicine.
Drug Metab Dispos 36: 1578–1586.
Mashour NH, Lin GI, Frishman WH (1998) Herbal medicine for the treatment of
cardiovascular disease. Arch Intern Med 158: 2225–2234.
Ng TB (2006) Pharmacological activity of Sanqi ginseng (Panax notoginseng). J
Pharm Pharmacol 58: 1007–1019.
Odani T, Tanizawa H, Takino Y (1983a) Studies on the absorption, distribution,
excretion and metabolism of ginseng saponins. II. The absorption, distribution,
and excretion of ginsenoside Rg1 in the rat. Chem Pharm Bull 31: 292–298.
Odani T, Tanizawa H, Takino Y (1983b) Studies on the absorption, distribution,
excretion and metabolism of ginseng saponins. III. The absorption, distribution,
and excretion of ginsenoside Rb1 in the rat. Chem Pharm Bull 31: 1059–1066.
Qian T-X, Jiang Z-H and Cai Z-W (2006) High-performance liquid chromatography
coupled with tandem mass spectrometry applied for metabolic study of
ginsenoside Rb1 on rat. Anal Biochem 352: 87–96.
Sengupta S, Toh S-A, Sellers LA, Skepper JN, Koolwijk P, Leung HW, Yeung H-W,
Wong RNS, Sasisekharan R, Fan T-PD (2004) Modulating angiogenesis: the Yin
and the Yang in ginseng. Circulation 110: 1219–1225.
Smith BP, Vandenhende FR, DeSante KA, Farid NA, Welch PA, Callaghan JT, Forgue
This article has not been copyedited and formatted. The final version may differ from this version.DMD Fast Forward. Published on September 28, 2009 as DOI: 10.1124/dmd.109.029819
at ASPE
T Journals on February 20, 2020
dmd.aspetjournals.org
Dow
nloaded from
DMD 29819
29
ST (2000) Confidence interval criteria for assessment of dose proportionality.
Pharm Res 17: 1278–1283.
Tawab, MA, Bahr U, Karas M, Wurglics M, Schubert-Zsilavecz M (2003)
Degradation of ginsenosides in humans after oral administration. Drug Metab
Dispos 31: 1065–1071.
Veber DF, Johnson SR, Cheng H-Y, Smith BR, Ward KW, Kopple KD (2002)
Molecular properties that influence the oral bioavailability of drug candidates. J
Med Chem 45: 2615–2623.
Wang L, Sun Y, Du F-F, Niu W, Lu T, Kan J-M, Xu F, Yuan K-H, Qin T, Liu C-X, Li
C (2007) ‘LC-electrolyte effects’ improve the bioanalytical performance of
liquid chromatography/tandem mass spectrometric assays in supporting
pharmacokinetic study for drug discovery. Rapid Commun Mass Spectrom 21:
2573–2584.
Xu Q-F, Fang X-L, Chen D-F (2003) Pharmacokinetics and bioavailability of
ginsenoside Rb1 and Rg1 from Panax notoginseng in rats. J Ethnopharmcol 84:
187–192.
This article has not been copyedited and formatted. The final version may differ from this version.DMD Fast Forward. Published on September 28, 2009 as DOI: 10.1124/dmd.109.029819
at ASPE
T Journals on February 20, 2020
dmd.aspetjournals.org
Dow
nloaded from

DMD 29819
30
Footnotes
This work was supported by Grant 2005CB523403 from the Chinese
Ministry of Science and Technology, Grant 2009ZX09304-002 from the
Chinese Ministry of Health, Grant 90209044 from the National Natural Science
Foundation of China, and Grant 08DZ1980200 from the Science & Technology
Commission of Shanghai Municipality.
This article has not been copyedited and formatted. The final version may differ from this version.DMD Fast Forward. Published on September 28, 2009 as DOI: 10.1124/dmd.109.029819
at ASPE
T Journals on February 20, 2020
dmd.aspetjournals.org
Dow
nloaded from

DMD 29819
31
FIG. 1. Plasma concentration-time profiles of ginsenosides in rats following p.o.
administration of Sanqi extract. In the single-dose study, rats received Sanqi extract at
4, 8, or 16 ml/kg. In the multiple-dose study, rats received Sanqi extract at 4
ml/rat/day for 22 days. The right upper panel shows good logarithmic compound
dose-exposure relationship among the bulky ppd-type ginsenosides GRa3, GRb1, and
GRd, but the doses of other ginsenosides did not correlate with their exposures.
FIG. 2. Relationship between the sugar-substitution in ginsenosides and their PK
properties that limit intestinal absorption. GF2 and GF1 exhibited efflux ratios greater
than 8 in Caco-2 monolayers.
FIG 3. Relationship between the sugar-substitution in ginsenosides and their
disposition profiles in rats following i.v. administrations. The i.v. dose of each
individual compound was 5 μmol/kg. The PK parameters were calculated from the
plasma concentration-time curves.
FIG. 4. Rat excretion profiles of ginsenosides and their deglycosylated products
following p.o. administration of Sanqi extract. The p.o. dose of Sanqi extract was 8
ml/kg. The red numbers 3, 6, and 20 in parentheses indicate the deglycosylation sites
in the ginsenosides. Note that the measured urinary Cum.Ae values of C-K, GF1 and
GRh1 could be greater than the actual values due to fecal contamination (which
contained substantially high amounts of the compounds) during sample collection.
FIG. 5. Rat excretion profiles of i.v. administered GRb1, GRg1, and their metabolites.
The i.v. dose of each individual compound was 5 μmol/kg. Both the oxidized (Ox-)
and deglycosylated metabolites were measured. GRd was the only measurable
deglycosylated metabolite of i.v. administered GRb1, whereas no deglycosylated
metabolite of GRg1 was detected in urine or bile following i.v. administration of the
This article has not been copyedited and formatted. The final version may differ from this version.DMD Fast Forward. Published on September 28, 2009 as DOI: 10.1124/dmd.109.029819
at ASPE
T Journals on February 20, 2020
dmd.aspetjournals.org
Dow
nloaded from

DMD 29819
32
compound.
FIG. 6. Tissue distribution profiles of i.v. administered GRb1, GRg1, and C-K in rats.
The i.v. dose of each individual compound was 5 μmol/kg. The plasma Vss values for
i.v. administered GRb1, GRg1, and C-K in rats were 220, 533, and 441 ml/kg,
respectively.
This article has not been copyedited and formatted. The final version may differ from this version.DMD Fast Forward. Published on September 28, 2009 as DOI: 10.1124/dmd.109.029819
at ASPE
T Journals on February 20, 2020
dmd.aspetjournals.org
Dow
nloaded from

Pla
sma
conc
entr
atio
n (n
M)
Time (h)
0
1.5
3.0
1 8 15 22
AU
C(µ
M·h
)
0
0.8
1.6
Cm
ax(µ
M)
1 8 15 220
15
30
AU
C(µ
M·h
)
1 8 15 22
Duration of administration (day)
0.001
0.01
0.1
1
10
100
1 10 100 1000
AU
C (
µM
·h)
Dose (µmol/kg)
0
70
140
210
280
350 GRa3
0
300
600
900
1200
1500 GRb1
0
200
400
600
8001000
300 6 12 2418 4236 48
GRd
0
40
80
120
160
200
0 6 12 2418
GRe
0
40
80
120
160
200
0 6 12 2418
NGR1
0
150
300
450
600
750
0 6 12 2418
GRg1
GRa3GRb1GRd
C-K
GRc
GF2
GRg3
16 ml/kg 8 ml/kg 4 ml/kg
GRe
NGR1
GRg1
20gRf
0
40
80
120
160200
0 6 12 2418
C-K
R2 = 0.90
30
20
10
00 4 8 16
R2 = 0.94
0 4 8 16
R2 = 0.92
0 4 8 16
AU
C(µ
M·h
)
Dose of Sanqi extract (ml/kg)
0.6
0.4
0.2
00 4 8 16
3.6
2.4
1.2
00 4 8 16 0 4 8 16 0 4 8 16
R2 = 0.23
R2 = 0.00 R2 = 0.05R2 = 0.22
GRe NGR1 GRg1GRa3 GRb1 GRd C-K
Pla
sma
conc
entr
atio
n (n
M)
Time (h)
0
1.5
3.0
1 8 15 22
AU
C(µ
M·h
)
0
0.8
1.6
Cm
ax(µ
M)
1 8 15 220
15
30
AU
C(µ
M·h
)
1 8 15 22
Duration of administration (day)
0
1.5
3.0
1 8 15 22
AU
C(µ
M·h
)
0
0.8
1.6
Cm
ax(µ
M)
1 8 15 220
0.8
1.6
Cm
ax(µ
M)
1 8 15 221 8 15 220
15
30
AU
C(µ
M·h
)
1 8 15 221 8 15 22
Duration of administration (day)
0.001
0.01
0.1
1
10
100
1 10 100 1000
AU
C (
µM
·h)
Dose (µmol/kg)
0.001
0.01
0.1
1
10
100
1 10 100 1000
AU
C (
µM
·h)
Dose (µmol/kg)
0
70
140
210
280
350 GRa3
0
70
140
210
280
350 GRa3
0
300
600
900
1200
1500 GRb1
0
300
600
900
1200
1500 GRb1
0
200
400
600
8001000
300 6 12 2418 4236 48
GRd
0
200
400
600
8001000
300 6 12 2418 4236 48300 6 12 2418 4236 48
GRd
0
40
80
120
160
200
0 6 12 2418
GRe
0
40
80
120
160
200
0
40
80
120
160
200
0 6 12 24180 6 12 2418
GRe
0
40
80
120
160
200
0 6 12 2418
NGR1
0
40
80
120
160
200
0
40
80
120
160
200
0 6 12 24180 6 12 2418
NGR1
0
150
300
450
600
750
0 6 12 2418
GRg1
0
150
300
450
600
750
0 6 12 24180 6 12 2418
GRg1
GRa3GRb1GRd
C-K
GRc
GF2
GRg3
16 ml/kg 8 ml/kg 4 ml/kg
GRe
NGR1
GRg1
20gRf
GRa3GRb1GRd
C-K
GRc
GF2
GRg3
16 ml/kg 8 ml/kg 4 ml/kg
GRe
NGR1
GRg1
20gRf
0
40
80
120
160200
0 6 12 2418
C-K
0
40
80
120
160200
0 6 12 24180 6 12 2418
C-K
R2 = 0.90
30
20
10
00 4 8 16
R2 = 0.94
0 4 8 16
R2 = 0.92
0 4 8 16
AU
C(µ
M·h
)
Dose of Sanqi extract (ml/kg)
0.6
0.4
0.2
00 4 8 16
3.6
2.4
1.2
00 4 8 16 0 4 8 16 0 4 8 16
R2 = 0.23
R2 = 0.00 R2 = 0.05R2 = 0.22
GRe NGR1 GRg1GRa3 GRb1 GRd C-K
R2 = 0.90
30
20
10
00 4 8 16
R2 = 0.94
0 4 8 16
R2 = 0.92
0 4 8 16
R2 = 0.90
30
20
10
00 4 8 16
R2 = 0.94
0 4 8 16
R2 = 0.92
0 4 8 16
AU
C(µ
M·h
)
Dose of Sanqi extract (ml/kg)
0.6
0.4
0.2
00 4 8 16
3.6
2.4
1.2
00 4 8 16 0 4 8 16 0 4 8 16
R2 = 0.23
R2 = 0.00 R2 = 0.05R2 = 0.22
0.6
0.4
0.2
00 4 8 16
0.6
0.4
0.2
00 4 8 16
3.6
2.4
1.2
00 4 8 16
3.6
2.4
1.2
00 4 8 160 4 8 16 0 4 8 160 4 8 16 0 4 8 160 4 8 16
R2 = 0.23
R2 = 0.00 R2 = 0.05R2 = 0.22
GRe NGR1 GRg1GRa3 GRb1 GRd C-K
Figure 1
This article has not been copyedited and formatted. The final version may differ from this version.DMD Fast Forward. Published on September 28, 2009 as DOI: 10.1124/dmd.109.029819
at ASPE
T Journals on February 20, 2020
dmd.aspetjournals.org
Dow
nloaded from

Figure 2
GRa3
GRc
GRb1
GRd
GF2
GRg3
GRg2GRg1 NGR1
20gRf
GRe
C-K
GRh1
GRh2
PptPpd
GRf
GF1
GF1 GF2
0.5x10⁻⁶
10-5
GRa3
GRc
GRb1
GRd
GF2
GRg3
GRg2GRg1 NGR1
20gRf
GRe
C-K
GRh1
GRh2
PptPpd
GRf
GF1
GF1 GF2
0.5x10⁻⁶
10-5
1
S(M
)P
app
(cm
/s)
Sugar count
0 4 5Sugar count
1 2 3
7
4
1
-2
LogP
200
300
400
100
0
TP
SA
(Å
)
0 4 51 2 3
500
GRa3
GRcGRb
1
GRdNGR
1
20gRf
GRe
Ppd
10
Ppt
GRh1GF
1
GRg1
GRg2
GRfC-KGRh2
GF2GRg3
GRa3
GRcGRb
1
GRdNGR
1
20gRf
GRe
Ppd
10
Ppt
GRh1GF
1
GRg1
GRg2
GRfC-KGRh2
GF2GRg3
GRa3
GRcGRb1GRd
NGR1
20gRf
GReGF2GRg
3
GRg2
GRg1GRf
GRh1GF1C-KGRh
2
Ppt
Ppd
5
0GRa
3GRcGRb1GRd
NGR1
20gRf
GReGF2GRg
3
GRg2
GRg1GRf
GRh1GF1C-KGRh
2
Ppt
Ppd
5
0
PptPpd
GRh1GF
1
C-KGRh2
GF2
GRg3
GRg2
GRg1
GRfGRdNGR
1
20gRfGRe
GRcGRb1
GRa3
140 ÅPptPpd
GRh1GF
1
C-KGRh2
GF2
GRg3
GRg2
GRg1
GRfGRdNGR
1
20gRfGRe
GRcGRb1
GRa3
140 Å
GRa3
GRcGRb1
GRd
NGR1
20gRf
GRe
GF2GRg3GRg2
GRg1GRf
GRh1GF
1C-KGRh2
PptPpd
12
GRa3
GRcGRb1
GRd
NGR1
20gRf
GRe
GF2GRg3GRg2
GRg1GRf
GRh1GF
1C-KGRh2
PptPpd
12
0
10
40
Tot
al H
-bon
d co
unt 50
20
30
4
8
16
NR
OT
B
20
12
0
0 4 51 2 310-8
10-7
10-6
10-5
10-2
10-4
10-6
10-8
GRa3
GRc
GRb1
GRdNGR1
20gRf
GReGF2
GRg3GRg2
GRg1
GRfGRh1GF1C-KGRh2
Ppt
Ppd
50x10-6
GRa3
GRc
GRb1
GRdNGR1
20gRf
GReGF2
GRg3GRg2
GRg1
GRfGRh1GF1C-KGRh2
Ppt
Ppd
50x10-6
: apical basolateral
: basolateral apical GRa3
GRc
GRb1
GRd
GF2
GRg3
GRg2GRg1 NGR1
20gRf
GRe
C-K
GRh1
GRh2
PptPpd
GRf
GF1
GF1 GF2
0.5x10⁻⁶
10-5
GRa3
GRc
GRb1
GRd
GF2
GRg3
GRg2GRg1 NGR1
20gRf
GRe
C-K
GRh1
GRh2
PptPpd
GRf
GF1
GF1 GF2
0.5x10⁻⁶
10-5
1
S(M
)P
app
(cm
/s)
Sugar count
0 4 5Sugar count
1 2 3
7
4
1
-2
LogP
200
300
400
100
0
TP
SA
(Å
)
0 4 51 2 3
500
GRa3
GRcGRb
1
GRdNGR
1
20gRf
GRe
Ppd
10
Ppt
GRh1GF
1
GRg1
GRg2
GRfC-KGRh2
GF2GRg3
GRa3
GRcGRb
1
GRdNGR
1
20gRf
GRe
Ppd
10
Ppt
GRh1GF
1
GRg1
GRg2
GRfC-KGRh2
GF2GRg3
GRa3
GRcGRb1GRd
NGR1
20gRf
GReGF2GRg
3
GRg2
GRg1GRf
GRh1GF1C-KGRh
2
Ppt
Ppd
5
0GRa
3GRcGRb1GRd
NGR1
20gRf
GReGF2GRg
3
GRg2
GRg1GRf
GRh1GF1C-KGRh
2
Ppt
Ppd
5
0
PptPpd
GRh1GF
1
C-KGRh2
GF2
GRg3
GRg2
GRg1
GRfGRdNGR
1
20gRfGRe
GRcGRb1
GRa3
140 ÅPptPpd
GRh1GF
1
C-KGRh2
GF2
GRg3
GRg2
GRg1
GRfGRdNGR
1
20gRfGRe
GRcGRb1
GRa3
140 Å
GRa3
GRcGRb1
GRd
NGR1
20gRf
GRe
GF2GRg3GRg2
GRg1GRf
GRh1GF
1C-KGRh2
PptPpd
12
GRa3
GRcGRb1
GRd
NGR1
20gRf
GRe
GF2GRg3GRg2
GRg1GRf
GRh1GF
1C-KGRh2
PptPpd
12
0
10
40
Tot
al H
-bon
d co
unt 50
20
30
4
8
16
NR
OT
B
20
12
0
0 4 51 2 310-8
10-7
10-6
10-5
10-2
10-4
10-6
10-8
GRa3
GRc
GRb1
GRdNGR1
20gRf
GReGF2
GRg3GRg2
GRg1
GRfGRh1GF1C-KGRh2
Ppt
Ppd
50x10-6
GRa3
GRc
GRb1
GRdNGR1
20gRf
GReGF2
GRg3GRg2
GRg1
GRfGRh1GF1C-KGRh2
Ppt
Ppd
50x10-6
: apical basolateral
: basolateral apical
: apical basolateral
: basolateral apical
This article has not been copyedited and formatted. The final version may differ from this version.DMD Fast Forward. Published on September 28, 2009 as DOI: 10.1124/dmd.109.029819
at ASPE
T Journals on February 20, 2020
dmd.aspetjournals.org
Dow
nloaded from

Figure 3
10000
1000
100
10
1
CL t
ot,p
(ml/h
/kg)
0 41 2 3 5
2000
1000
0
2500
1500
500Vss
(ml/k
g)
Sugar count
0
5
10
15
20t 1
/2(h
)
GF2
GReNGR1
20gRf
GRg1
GRg3
GRg2
GRf
GF1
Ppd
Ppt
GRa3
GRc
GRd
C-K
GRh2GRh1
GRb1
GF2
GReNGR1
20gRf
GRg1
GRg3
GRg2
GRf
GF1
Ppd
Ppt
GRa3
GRc
GRd
C-K
GRh2GRh1
GRb1
GF1
C-KGRh1GRh2
GRg1
GRg2
GRg3
GRd
NGR1
GRe20gRf GRa3GRc
GRb1GF2
GRf
Rat total body water(670 ml/kg)Rat plasma
volume(31 ml/kg)
Ppd
Ppt
GF1
C-KGRh1GRh2
GRg1
GRg2
GRg3
GRd
NGR1
GRe20gRf GRa3GRc
GRb1GF2
GRf
Rat total body water(670 ml/kg)Rat plasma
volume(31 ml/kg)
Ppd
Ppt
R1O
R2O
HO(20)
(3)
(20)
(3)OH notexistingat C-6
Ppd-type
(20)
HO
R2O
HO
OR3(6)
(3)
Ppt-type
(20)No Sugarattachedto C-3
(6)
Glucose Xylose Rhamnose Arabinose
R1O
R2O
HO(20)
(3)
(20)
(3)OH notexistingat C-6
Ppd-type
(20)
HO
R2O
HO
OR3(6)
(3)
Ppt-type
(20)No Sugarattachedto C-3
(6)
(20)No Sugarattachedto C-3
(6)
Glucose Xylose Rhamnose Arabinose
R1O
R2O
HO(20)
(3)
(20)
(3)OH notexistingat C-6
Ppd-type
(20)
HO
R2O
HO
OR3(6)
(3)
Ppt-type
(20)No Sugarattachedto C-3
(6)
Glucose Xylose Rhamnose Arabinose
R1O
R2O
HO(20)
(3)
(20)
(3)OH notexistingat C-6
Ppd-type
(20)
HO
R2O
HO
OR3(6)
(3)
Ppt-type
(20)No Sugarattachedto C-3
(6)
(20)No Sugarattachedto C-3
(6)
Glucose Xylose Rhamnose Arabinose
R1O
R2O
HO(20)
(3)
(20)
(3)OH notexistingat C-6
Ppd-type
(20)
HO
R2O
HO
OR3(6)
(3)
Ppt-type
(20)No Sugarattachedto C-3
(6)
Glucose Xylose Rhamnose Arabinose
R1O
R2O
HO(20)
(3)
(20)
(3)OH notexistingat C-6
Ppd-type
(20)
HO
R2O
HO
OR3(6)
(3)
Ppt-type
(20)No Sugarattachedto C-3
(6)
(20)No Sugarattachedto C-3
(6)
Glucose Xylose Rhamnose Arabinose
R1O
R2O
HO(20)
(3)
(20)
(3)OH notexistingat C-6
Ppd-type
(20)
HO
R2O
HO
OR3(6)
(3)
Ppt-type
(20)No Sugarattachedto C-3
(6)
Glucose Xylose Rhamnose Arabinose
R1O
R2O
HO(20)
(3)
(20)
(3)OH notexistingat C-6
Ppd-type
(20)
HO
R2O
HO
OR3(6)
(3)
Ppt-type
(20)No Sugarattachedto C-3
(6)
(20)No Sugarattachedto C-3
(6)
Glucose Xylose Rhamnose Arabinose
GRa3
GRcGRb1
GRd
GF2GRg3
GRg2GRg1
NGR120gRfGRe
GRh1GF1GRh2
PptPpd
GRf
C-K
0
500
1000
1500
0 5 10 15 20
t1/2 (h)
AU
C (
µM
·h)
GRd
GRa3 GRb1
GRc
The otherginsenosides
0
500
1000
1500
0 5 10 15 20
t1/2 (h)
AU
C (
µM
·h)
GRd
GRa3 GRb1
GRc
The otherginsenosides
GRa3
GRcGRb1
GRd
GF2GRg3
GRg2GRg1
NGR120gRfGRe
GRh1GF1GRh2
PptPpd
GRf
C-K
0
500
1000
1500
0 5 10 15 20
t1/2 (h)
AU
C (
µM
·h)
GRd
GRa3 GRb1
GRc
The otherginsenosides
0
500
1000
1500
0 5 10 15 20
t1/2 (h)
AU
C (
µM
·h)
GRd
GRa3 GRb1
GRc
The otherginsenosides
This article has not been copyedited and formatted. The final version may differ from this version.DMD Fast Forward. Published on September 28, 2009 as DOI: 10.1124/dmd.109.029819
at ASPE
T Journals on February 20, 2020
dmd.aspetjournals.org
Dow
nloaded from

Figure 4
Compd.GRa3 Glc2-Glc
R1
GRb1 Glc2-GlcGlc2-GlcGRc
GRd Glc2-Glc
GRg3 Glc2-GlcGF2 GlcCompd. R1
Ppd HC-K H
R2Glc6-Glc3-XylGlc6-GlcGlc6-AraGlcGlc
HGlc
GlcHR2
HGRh2
R1O
OHR2O
(3) (20)
Compd. R1
Compd. R1
HO
OHR2O
OR1
(20)
(6)
NGR1
20gRfGRe
Glc2-GlcGlc2-RhaGlc2-Xyl
GRg1 GlcGlc2-GlcGRf
GRg2 Glc2-Rha GRh1 GlcGF1 H
R2HGlc H
R2GlcGlcGlcGlcHHHPpt
Ppd-type Ppt-type
HO
Glc-O
HO
O-Glc2-Xyl
HO
Glc-O
HO
O-Glc
GRg1[D] NGR1
NGR1
HO
Glc-O
HO
O-Glc2-Rha
GRe
[D]
− Xyl
(6)− Rha
(6)
[P][U][B][F]
GRe [D]
[P][U][B][F]
GRh1GF1
− Glc
(6)
− Glc
(20)− Glc
(6)
− Glc
(20)
[U][B][F]
GRg1
[P][U][B][F]
20gRf [D] GRf [D] GRh1[D]
20gRf[P][U][B][F]
GRf
− Glc
(6)
− Glc
(6)
[B][F]
− Glc
(20)
[U][B][F]
GRcGlc-2Glc-O
Xyl-3Glc-6Glc-O
HO
GRa3
Glc-2Glc-O
Glc-6Glc-O
HO
GRb1
GF2
HO
Glc-O
HO
C-K GRh2
[P]
− Glc
(3)− Glc
(20)
− Glc
(20)− Glc
(3)
− Glc
(3)
− Glc
(3)
GRc [D]
[P][U][B]
[P][U][B][F]
GRg3[P][F]
[F]
GRb1[D] GRd [D]GRa3[D]
[P][U][B][F]
[P][U][B][F]
-Sanqi extract-
− Xyl
(20)
GF2 [D]
Glc-2Glc-O
Glc-O
HO
GRd
[P][U][B][F]
− Glc
(20)− Ara
(20)
GF1[D] GRg2 [D]
GRg2[U][B][F]
GRg3 [D]
− Rha
(6)
− Glc
(20)
[F]Ppt[F]Ppd
Plasma: AUC
Urine: Cum.Ae
Bile: Cum.Ae
Feces: Cum.Ae
Individual dose from Sanqi extract:
50 µmol/kg
5 µM·h
50 nmol/kg
50 nmol/kg
5 µmol/kg
[P][U][B][F]
[D]
Intestinal absorption
Deglycosylation
− Glc
(20)
HO
Glc-O
HO
O-Glc2-Xyl
HO
Glc-O
HO
O-Glc
GRg1[D] NGR1
NGR1
HO
Glc-O
HO
O-Glc2-Rha
GRe
HO
Glc-O
HO
O-Glc2-Rha
GRe
[D]
− Xyl
(6)− Rha
(6)
[P][U][B][F]
[P][U][B][F]
GRe [D]
[P][U][B][F]
[P][U][B][F]
GRh1GF1
− Glc
(6)
− Glc
(20)− Glc
(6)
− Glc
(20)
[U][B][F]
[U][B][F]
GRg1
[P][U][B][F]
20gRf [D] GRf [D] GRh1[D]
20gRf[P][U][B][F]
GRf
− Glc
(6)
− Glc
(6)
[B][F]
− Glc
(20)
[U][B][F]
[U][B][F]
GRcGlc-2Glc-O
Xyl-3Glc-6Glc-O
HO
GRa3
Glc-2Glc-O
Xyl-3Glc-6Glc-O
HO
GRa3
Glc-2Glc-O
Glc-6Glc-O
HO
GRb1
Glc-2Glc-O
Glc-6Glc-O
HO
GRb1
GF2
HO
Glc-O
HO
C-K GRh2
[P]
− Glc
(3)− Glc
(20)
− Glc
(20)− Glc
(3)
− Glc
(3)
− Glc
(3)
GRc [D]
[P][U][B]
[P][U][B]
[P][U][B][F]
[P][U][B][F]
GRg3[P][F]
GRg3[P][F][P][F]
[F][F]
GRb1[D] GRd [D]GRa3[D]
[P][U][B][F]
[P][U][B][F]
[P][U][B][F]
[P][U][B][F]
-Sanqi extract-
− Xyl
(20)
GF2 [D]
Glc-2Glc-O
Glc-O
HO
GRd
Glc-2Glc-O
Glc-O
HO
GRd
[P][U][B][F]
[P][U][B][F]
− Glc
(20)− Ara
(20)
GF1[D] GRg2 [D]
GRg2[U][B][F]
GRg2[U][B][F]
GRg3 [D]
− Rha
(6)
− Glc
(20)
[F][F]Ppt[F][F]Ppd
Plasma: AUC
Urine: Cum.Ae
Bile: Cum.Ae
Feces: Cum.Ae
Individual dose from Sanqi extract:
50 µmol/kg
5 µM·h
50 nmol/kg
50 nmol/kg
5 µmol/kg
[P][U][B][F]
[D]
Intestinal absorption
Deglycosylation
− Glc
(20)
This article has not been copyedited and form
atted. The final version m
ay differ from this version.
DM
D Fast Forw
ard. Published on September 28, 2009 as D
OI: 10.1124/dm
d.109.029819 at ASPET Journals on February 20, 2020 dmd.aspetjournals.org Downloaded from

Figure 5
% o
f i.v
. dos
e ex
cret
ed
Time (h)
10
20
30
40
50
0
0.5
1.0
1.5
2.0
0
20
40
60
80
100
0
0 24 48 72 96
GRb1
Metabolites of GRb1
0 24
GRg1
0.1
0.2
0.3
0.4
0.5
00 24
Metabolites of GRg1
GRb1
GRg1
Biliary excretion
Urinary excretion
Ox-GRg1
Ox-GRb1
GRd Ox-GRd
% o
f i.v
. dos
e ex
cret
ed
Time (h)
10
20
30
40
50
0
0.5
1.0
1.5
2.0
0
20
40
60
80
100
0
10
20
30
40
50
0
0.5
1.0
1.5
2.0
0
20
40
60
80
100
0
0 24 48 72 96
GRb1
Metabolites of GRb1
0 24
GRg1
0 24
GRg1
0.1
0.2
0.3
0.4
0.5
0
0.1
0.2
0.3
0.4
0.5
00 24
Metabolites of GRg1
GRb1
GRg1
Biliary excretion
Urinary excretion
Ox-GRg1
Ox-GRb1
GRd Ox-GRd
This article has not been copyedited and formatted. The final version may differ from this version.DMD Fast Forward. Published on September 28, 2009 as DOI: 10.1124/dmd.109.029819
at ASPE
T Journals on February 20, 2020
dmd.aspetjournals.org
Dow
nloaded from
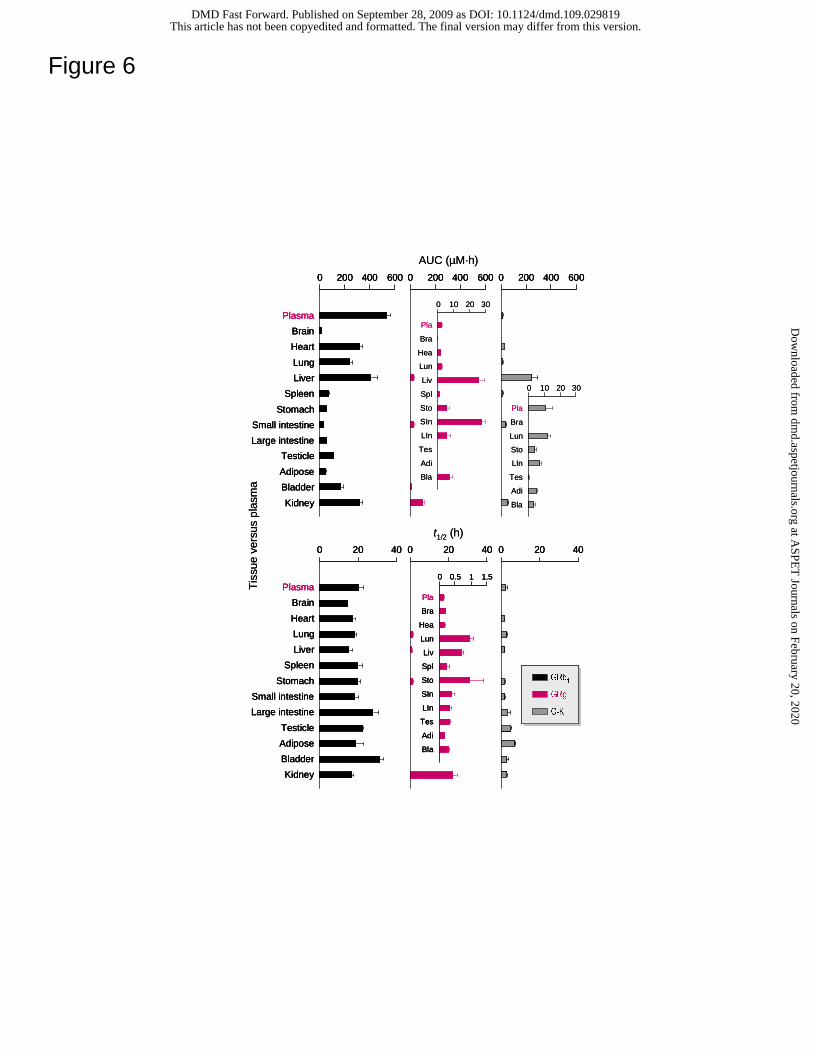
Adipose
Testicle
Bladder
Kidney
Large intestine
Small intestine
Stomach
Spleen
Liver
Lung
Heart
Brain
PlasmaTis
sue
vers
us p
lasm
aAUC (µM·h)
0 200 400 600
Large intestine
Small intestine
Bladder
Kidney
Stomach
Spleen
Liver
Lung
Heart
Brain
Plasma
Adipose
Testicle
0 10 20 30
Bla
Adi
Tes
LIn
SIn
Sto
Spl
Liv
Lun
Hea
Bra
Pla
Bla
Adi
Tes
LIn
SIn
Sto
Spl
Liv
Lun
Hea
Bra
Pla
0 0.5 1 1.5
0 200 400 600 0 200 400 600
Bla
Adi
Tes
LIn
Sto
Lun
Bra
Pla
0 10 20 30
400 20
t1/2 (h)
400 20400 20
GRb1
GRg1
C-K
Adipose
Testicle
Bladder
Kidney
Large intestine
Small intestine
Stomach
Spleen
Liver
Lung
Heart
Brain
Plasma
Adipose
Testicle
Bladder
Kidney
Large intestine
Small intestine
Stomach
Spleen
Liver
Lung
Heart
Brain
PlasmaTis
sue
vers
us p
lasm
aAUC (µM·h)
0 200 400 6000 200 400 600
Large intestine
Small intestine
Bladder
Kidney
Stomach
Spleen
Liver
Lung
Heart
Brain
Plasma
Adipose
Testicle
Large intestine
Small intestine
Bladder
Kidney
Stomach
Spleen
Liver
Lung
Heart
Brain
Plasma
Adipose
Testicle
0 10 20 30
Bla
Adi
Tes
LIn
SIn
Sto
Spl
Liv
Lun
Hea
Bra
Pla
Bla
Adi
Tes
LIn
SIn
Sto
Spl
Liv
Lun
Hea
Bra
Pla
0 0.5 1 1.5
Bla
Adi
Tes
LIn
SIn
Sto
Spl
Liv
Lun
Hea
Bra
Pla
0 0.5 1 1.5
0 200 400 6000 200 400 600 0 200 400 6000 200 400 600
Bla
Adi
Tes
LIn
Sto
Lun
Bra
Pla
0 10 20 30
400 20 400 20
t1/2 (h)
400 20 400 20400 20 400 20
GRb1
GRg1
C-K
Figure 6
This article has not been copyedited and formatted. The final version may differ from this version.DMD Fast Forward. Published on September 28, 2009 as DOI: 10.1124/dmd.109.029819
at ASPE
T Journals on February 20, 2020
dmd.aspetjournals.org
Dow
nloaded from

![Absorption, Metabolism and Excretion of …dmd.aspetjournals.org/content/dmd/40/4/815.full.pdfAbsorption, Metabolism and Excretion of [14C]Mirabegron (YM178),a Potent and Selective](https://img.dokumen.tips/doc/110x75/5b3dd4207f8b9a986e8de445/absorption-metabolism-and-excretion-of-dmd-metabolism-and-excretion-of-14cmirabegron.jpg)