Embed Size (px)
Citation preview

From Gerwert
Mid-Infrared (MIR) (Vibrational) Spectroscopy
Includes infrared absorption spectroscopy (classic IR and FTIR, transmission and reflection) and infrared scattering spectroscopy (Raman)
Absolute
Difference
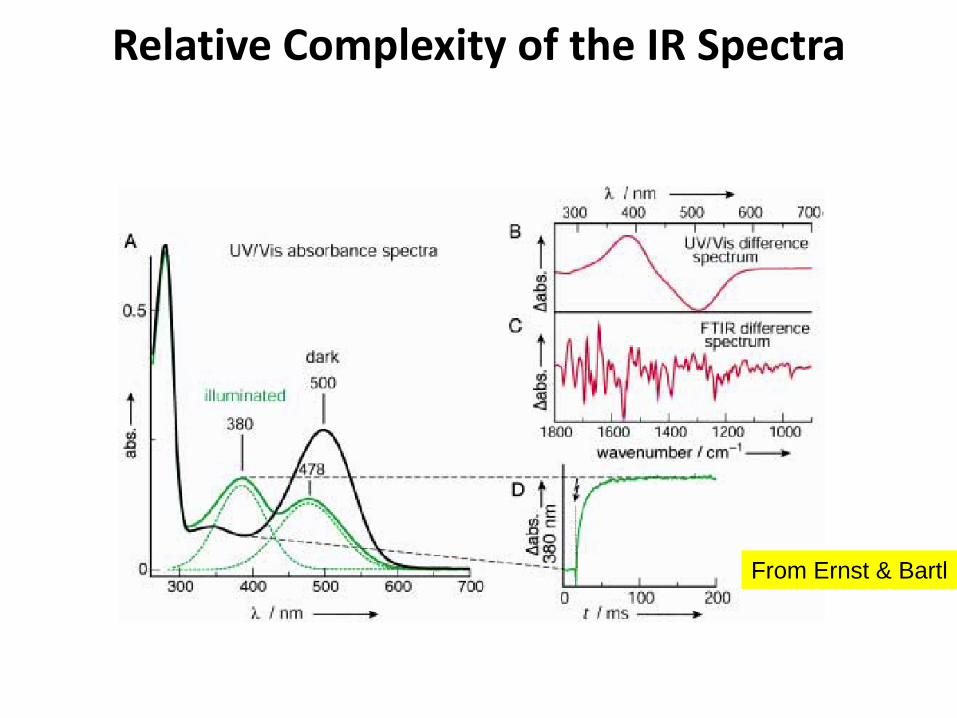
Relative Complexity of the IR Spectra
From Ernst & Bartl
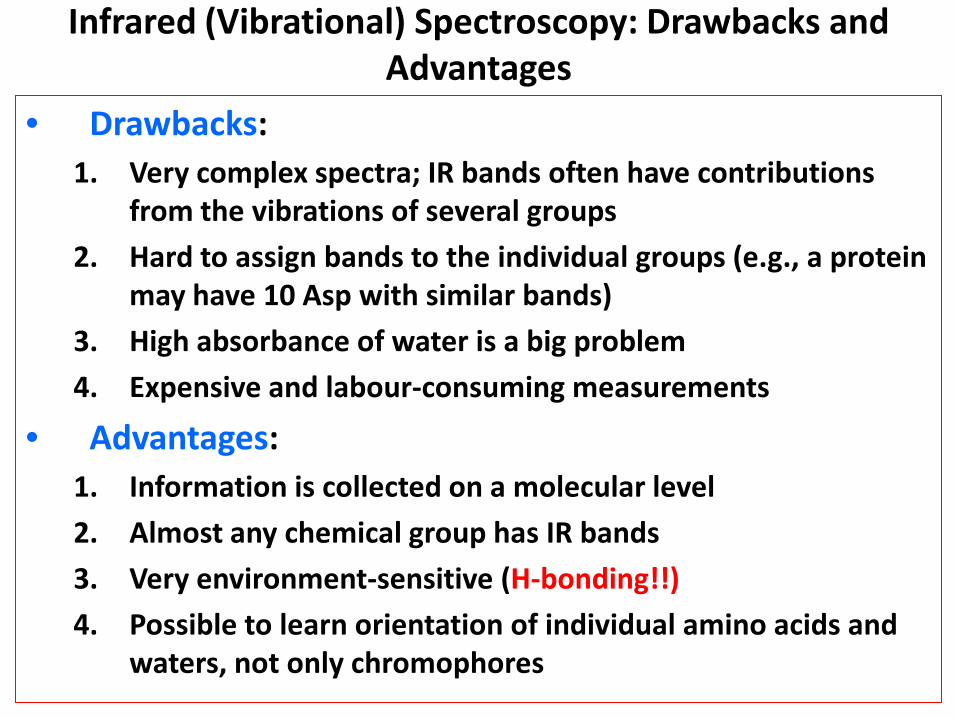
Infrared (Vibrational) Spectroscopy: Drawbacks and Advantages
• Drawbacks:1. Very complex spectra; IR bands often have contributions
from the vibrations of several groups
2. Hard to assign bands to the individual groups (e.g., a protein may have 10 Asp with similar bands)
3. High absorbance of water is a big problem
4. Expensive and labour-consuming measurements
• Advantages:1. Information is collected on a molecular level
2. Almost any chemical group has IR bands
3. Very environment-sensitive (H-bonding!!)
4. Possible to learn orientation of individual amino acids and waters, not only chromophores

Water Absorbance
Strongly Masks IR
Protein Bands
From Haris et al

Extracting the Information from
IR Spectra: Deconvolution and Derivative
From Arrondo et alSarcoplasmicreticulum
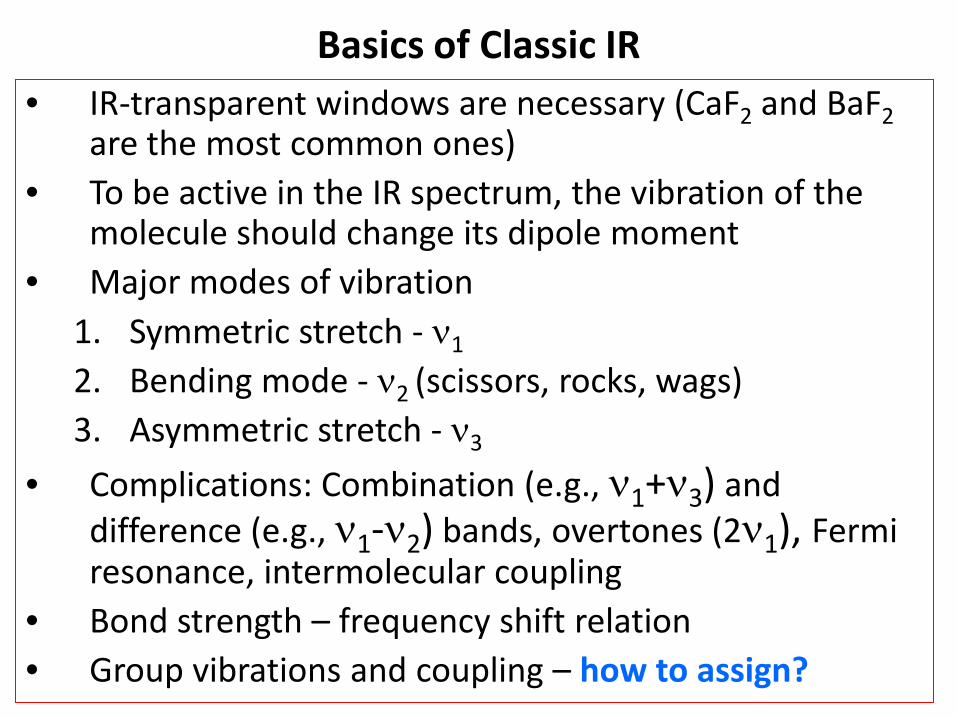
Basics of Classic IR• IR-transparent windows are necessary (CaF2 and BaF2
are the most common ones)• To be active in the IR spectrum, the vibration of the
molecule should change its dipole moment• Major modes of vibration
1. Symmetric stretch - ν1
2. Bending mode - ν2 (scissors, rocks, wags)3. Asymmetric stretch - ν3
• Complications: Combination (e.g., ν1+ν3) and difference (e.g., ν1-ν2) bands, overtones (2ν1), Fermi resonance, intermolecular coupling
• Bond strength – frequency shift relation• Group vibrations and coupling – how to assign?

Assignment of IR Bands
• Normal mode calculations (only for simple molecules)
• Isotope exchange (H/D)
• Isotope labeling (including SDIL)
• Model compounds
• Mutations
• Chemical modifications
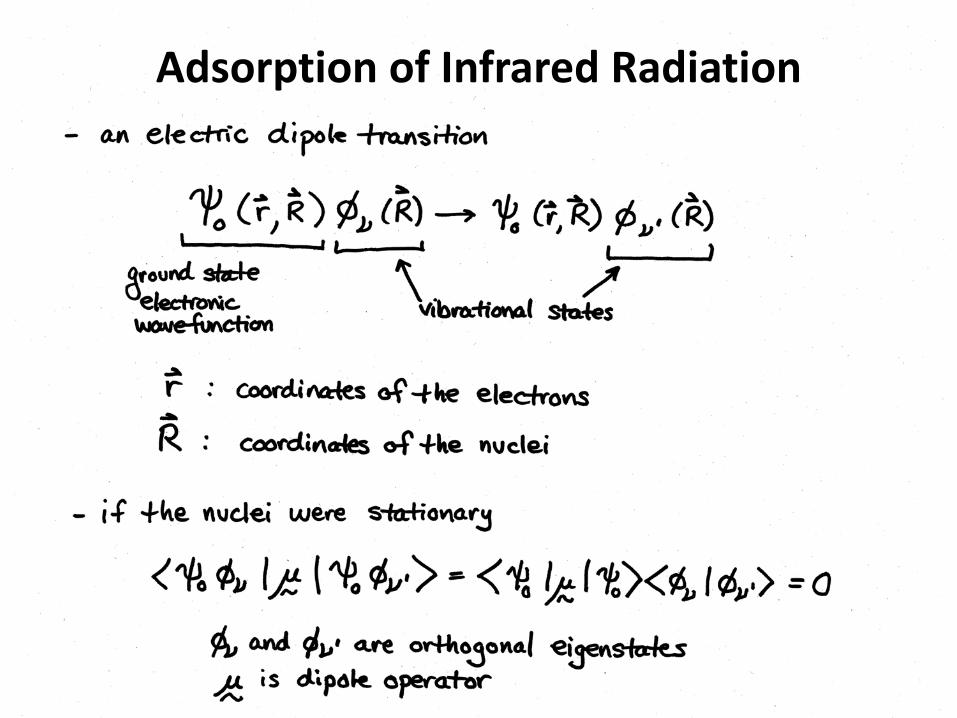
Adsorption of Infrared Radiation

Adsorption of Infrared Radiation

Carbon Dioxide Molecule

Carbon Dioxide Molecule

Protein Structure From Infrared Studies
• Bonds demonstrate characteristic oscillation frequency => normal modes of oscillation
• For proteins, normal vibrational modes present within individual residues have been modelled by studying N-methylacetamide (NMA) (see Arrondo et al. reference)– 9 useful bands => Amide A, B, I-VII bands
Schematic diagram of N-methylacetamide

Protein Normal Modes
(a) Amide A and B (NH stretching, arises as a doublet)
(b) Amide I (80% CO stretching, 20% other)
(c) Amide II (60% NH bending, 40% CN stretching)
(d) Amide III
(e) Amide IV
(f) Amide V
(g) Amide VI
(h) Amide VII
(i) 1070 cm-1
(j) 908 cm-1
(k) 498 cm-1
(l) 274 cm-1

Proteins: Secondary Structure
• Theoretically, Amide-A, -I, -II and -III bands are most useful for determining protein structure
• Due to experimental limitations, only Amide-I and -II bands are typically used– Amide-I is most commonly used for determining protein structure
• “Standard” samples are studied to determine characteristic features of spectra produced by secondary structures (e.g. α-helices, β-sheets)– polylysine is often used, as it will adopt random coil, α-helical or β-sheet
conformations depending on physiological conditions
• Secondary structure determined by observing shifts in Amide-Ibands– considering bonds as 2 point masses connected by a spring, hydrogen
bonding will lower the “spring constant” of the bond, resulting in lower vibrational frequency

Proteins: Secondary Structure
STRUCTURE AMIDE-I ν
(cm-1)___
antiparallel β-sheet 1675 - 1695
310-helix 1660 - 1670
α-helix 1648 - 1660
random coil 1640 - 1648
β-sheet 1625 - 1640
aggregated strands 1610 - 1628
Jackson & Mantsch, Crit. Rev. Biochem. Mol. Biol. 30, pp.95-120. (1995)
Arrondo et al., Prog. Biophys. Mol. Biol. 59, pp.23-56. (1992)
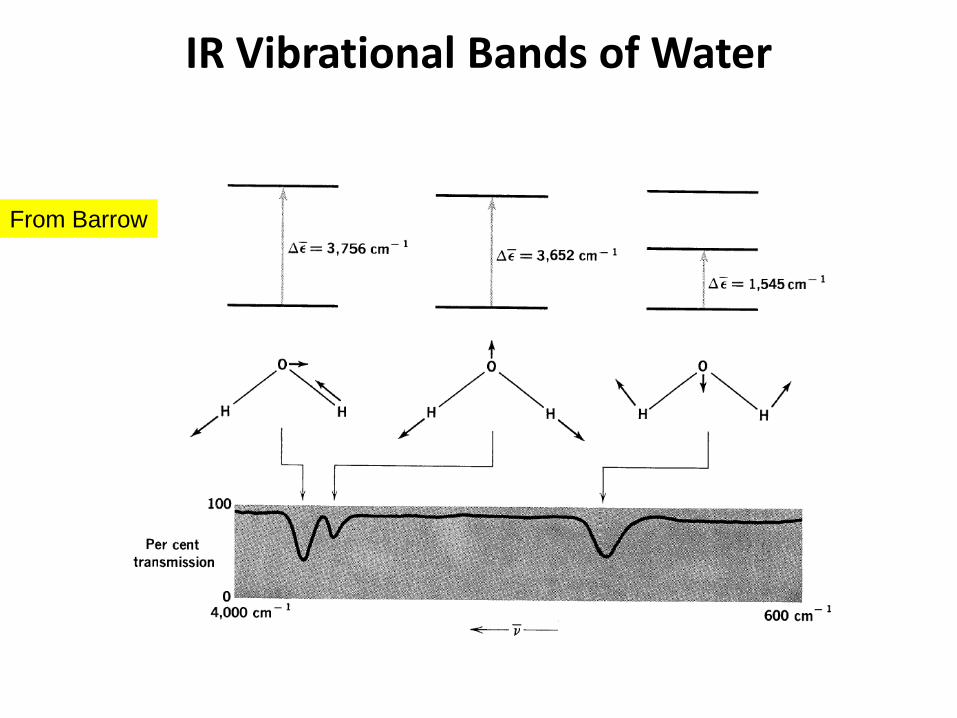
IR Vibrational Bands of Water
From Barrow
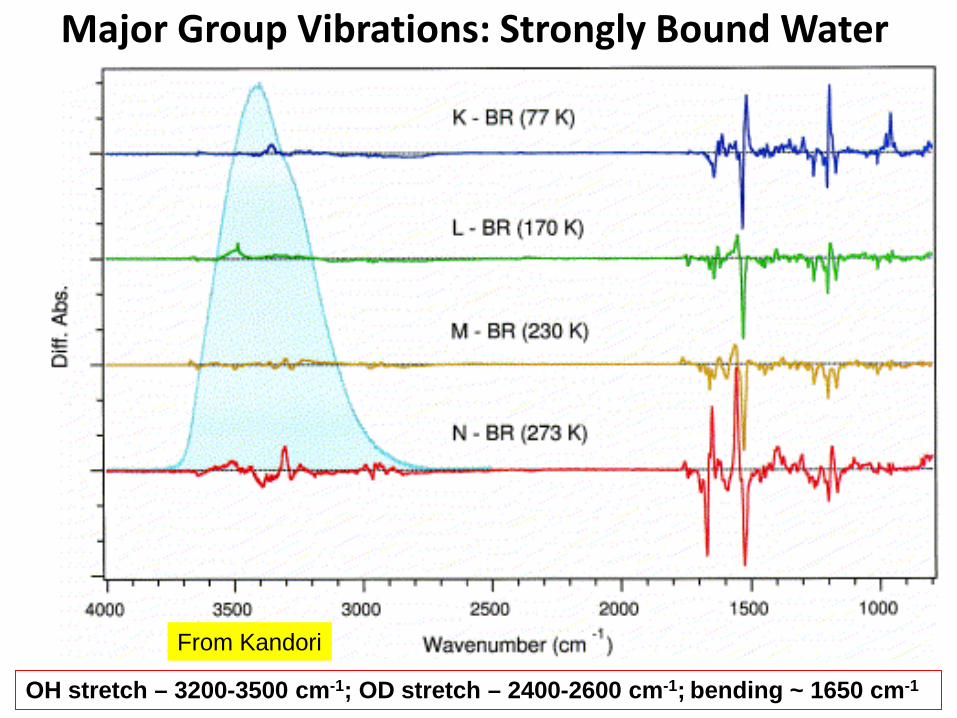
Major Group Vibrations: Strongly Bound Water
From Kandori
OH stretch – 3200-3500 cm-1; OD stretch – 2400-2600 cm-1; bending ~ 1650 cm-1

Major Group Vibrations: Protein Backbone
• Amide bands reflect global conformational changes• Amides A and B (N-H stretch), 3100 and 3300 cm-1
• Amide I (mostly C=O stretch), 1600-1700 cm-1
Often used to determine protein secondary structure, even though the correlation is not absolute: α-helix is at 1648-1660 cm-1, β-sheet is at 1625-1640 cm-1, turns are at 1660-1685 cm-1, and unordered peptides are at 1652-1660 cm-1
• Amide II (mostly N-H bend and C-N stretch), 1510-1580 cm-1; very sensitive to H/D exchange, so it is often used (along with Amide I) to check solvent accessibility of the protein core and to distinguish between unordered and helical conformations

H/D Exchange of Amide ProtonsFrom Haris et al
chymotrypsin
Amide I – β-sheetAmide II
NH ND

Following Protein Unfolding In the Amide Region
From Haris et al
Citrate synthase in D2O
Amide I –aggregated β-sheet
Amide I –α-helix
Amide I –α-helix
Amide I –aggregated β-sheet

Major Group Vibrations: Protein Side-Chains• Protonation/deprotonation, pKa and environmental changes
(H-bonding) of Asp/Glu (1700-1770 cm-1 for protonated C=O stretch)
• Environmental changes of Asn/Gln (1670-1700 cm-1 for C=O stretch)
• Environmental changes of Tyr (C-O- stretch) at ~ 1500 cm-1
• Environmental changes of Thr (O-H stretch) at 3400-3500 cm-1
• Environmental changes of Trp (N-H stretch) at ~ 3500 cm-1
• Environmental changes of Cys (S-H stretch) at 2400-2600 cm-1

Major Group Vibrations: Lipids
• PO2- stretches (1085 and 1228 cm-1) -
phospholipids
• COO- stretches (1623 cm-1)
• various C-H and CH3 stretches and bends
• N+(CH3)3 bends and stretches – choline-based lipids

Difference spectrum of the N intermediate of the photocycle
N
Data: A. Dioumaev
Typical Characterization of Bacteriorhodopsin by Infrared Spectroscopy
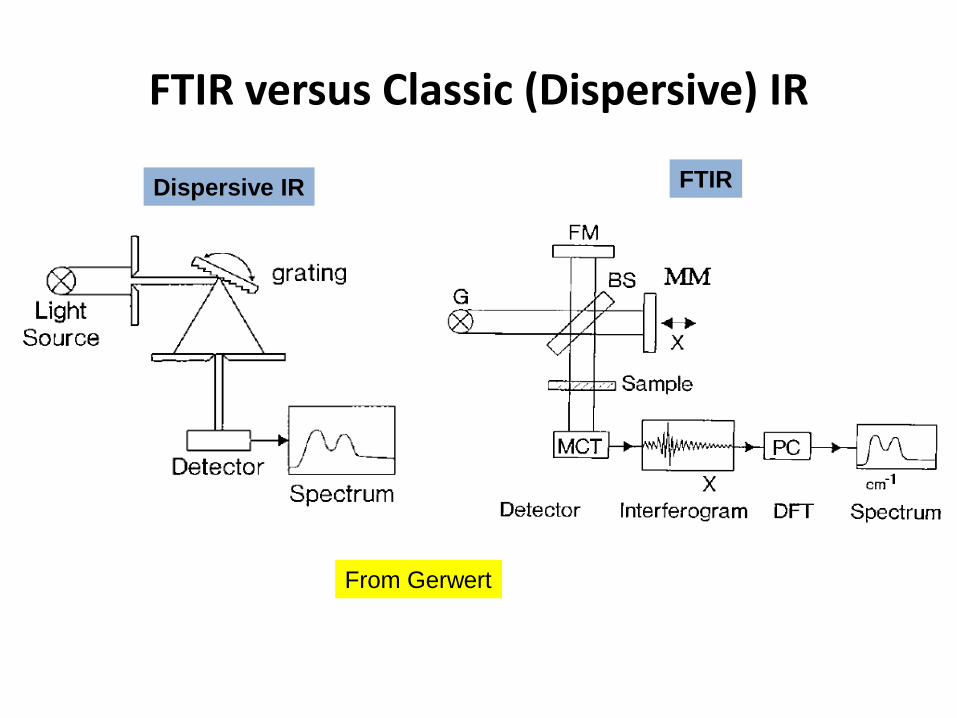
FTIR versus Classic (Dispersive) IR
From Gerwert
Dispersive IR FTIR

FTIR versus Classic (Grating) IR
• Interferometer-based vs. monochromator- based
• Interferogram contains information about all spectral elements (multiplex or Felgett advantage)
• Interferometers have much higher light throughput (Jacquinot advantage)
From Siebert
∫+∞
∞−
= dxxxsS ]2cos[)()( πνν

Fourier Transform Infrared (FTIR) Spectrometry
• Michelson interferometer is the heart of most commercially available FTIR spectrometers– as movable mirror is swept from left to right, optical path difference
between light in the two arms of the interferometer increases– for a single wavelength IR source, constructive and destructive
interference conditions are periodically observed
Fourier Transform IR spectroscopy allows for multiple IR wavelengths to be measured simultaneously!
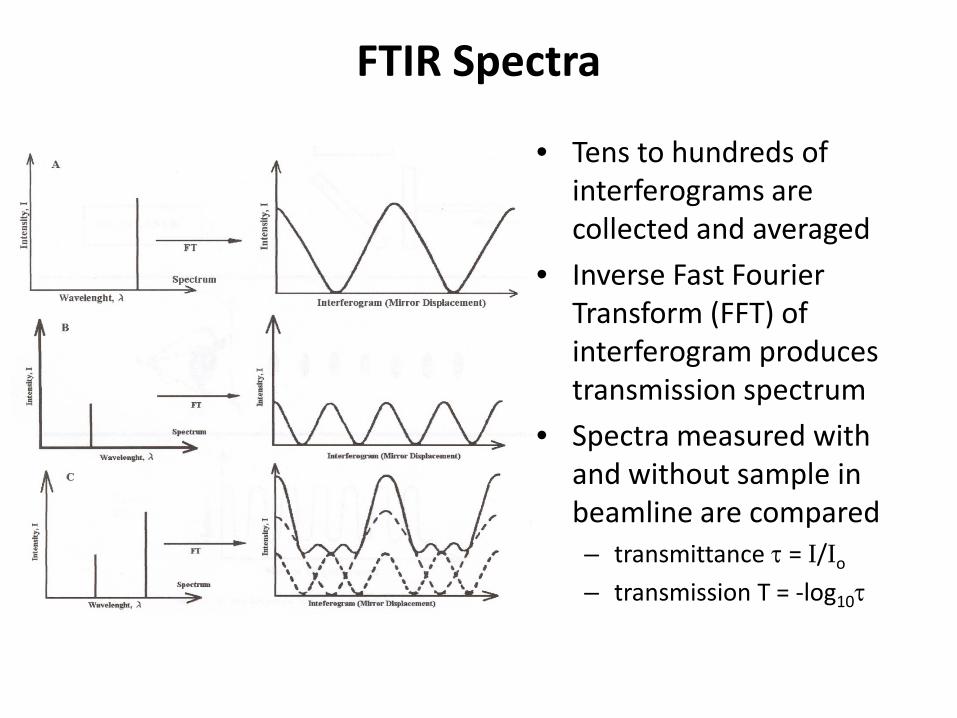
FTIR Spectra
• Tens to hundreds of interferograms are collected and averaged
• Inverse Fast Fourier Transform (FFT) of interferogram produces transmission spectrum
• Spectra measured with and without sample in beamline are compared– transmittance τ = I/Io
– transmission T = -log10τ

FTIR: Benefits & Pitfalls
Water absorbs strongly in the IR region of the spectrum Absorption bands often overlap, necessitating complicated
deconvolution routines Fourier self deconvolution, derivative techniques, least squares fitting
No information regarding positional structure! for known structures, can use FTIR to monitor changes in
conformation
Non-destructive technique
Can be performed on samples with any morphology (crystals, membrane-bound, gels, etc.)
Small sample volumes (10 mL of protein solution, even less for some variations of FTIR)
Extremely good time resolution (as low as 30 ns)

Simple Scheme of FTIR Spectrometer
From Siebert

Simple Scheme of FTIR Spectrometer
From Kotting et al
Bruker

Simple Scheme of FTIR Spectrometer
Bruker FTIR spectrometer layout

IR Sample Holders
From Kotting et al
Transmission
Reflection
Flow

Difference FTIR Spectroscopy
Can be either static (photostationary or low-temperature) or time-resolved
From Siebert

Absolute vs. Difference FTIR of Ras
Protein
From Kotting et al

Difference Spectra of Carboxylic Acids
From Nyquist et al

Time-Resolved (Reaction-Induced) Difference FTIR
Methods of Triggering:1. Light
2. Caged compounds
3. Mixing
From Gerwert
Caged Phosphate

Time-Resolved (Reaction-Induced) FTIR
Artwork: Lichi Shi

Time-Resolved Difference FTIR
Artwork: Lichi Shi

Time-Resolved Difference FTIR
From Siebert

Two Major Kinds of Time-Resolved FTIR
• Rapid-scan1. One set of interferograms is scanned per each flash2. Can not go faster than 10 ms per spectrum3. Relatively low noise, fast results
• Step-scan1. One time-slice is measured for each position of the
moving mirror, then the spectra are reconstructed2. High time-resolution (up to ns)3. Relatively high-noise, very time-consuming, requires
fast detectors and A/D converters
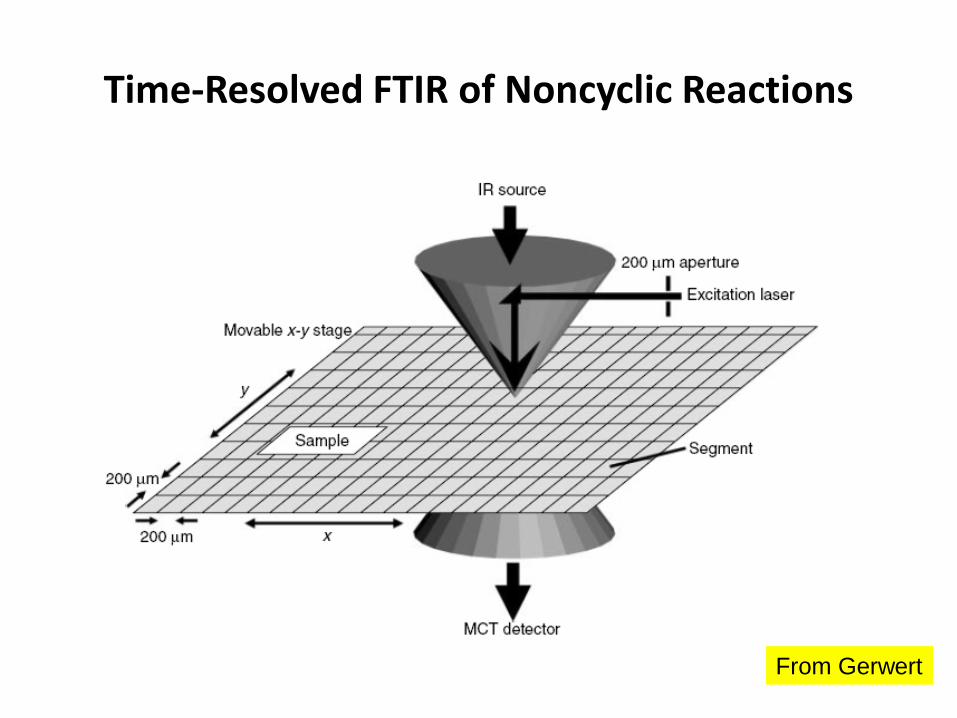
Time-Resolved FTIR of Noncyclic Reactions
From Gerwert

Some Important Transition Dipole Moments of Lipids and Membrane Proteins
From Tamm et al
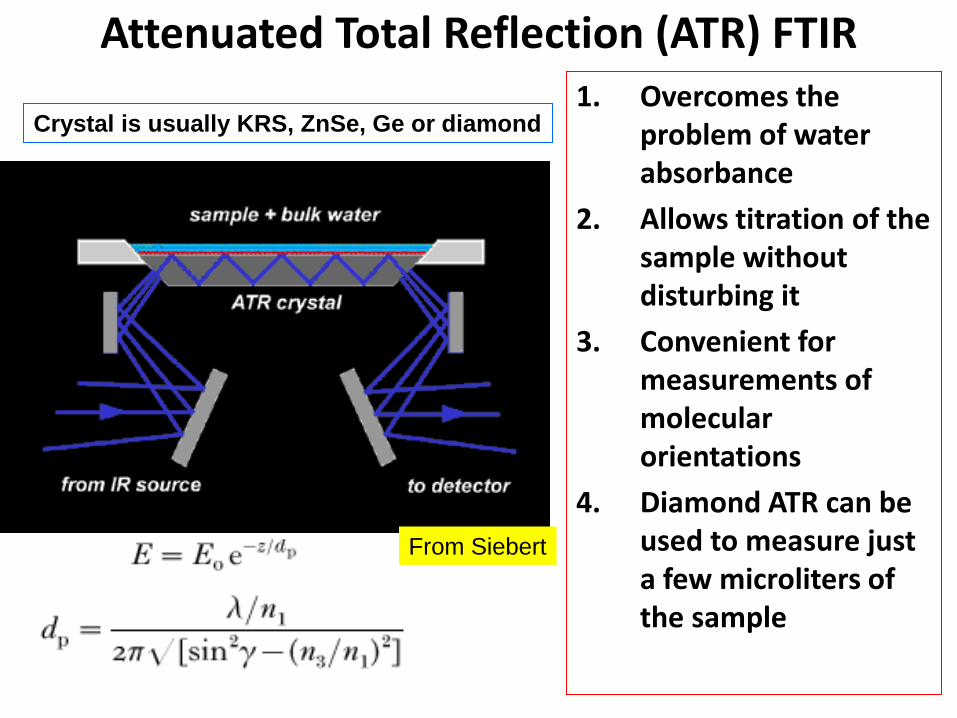
Attenuated Total Reflection (ATR) FTIR1. Overcomes the
problem of water absorbance
2. Allows titration of the sample without disturbing it
3. Convenient for measurements of molecular orientations
4. Diamond ATR can be used to measure just a few microliters of the sample
Crystal is usually KRS, ZnSe, Ge or diamond
From Siebert
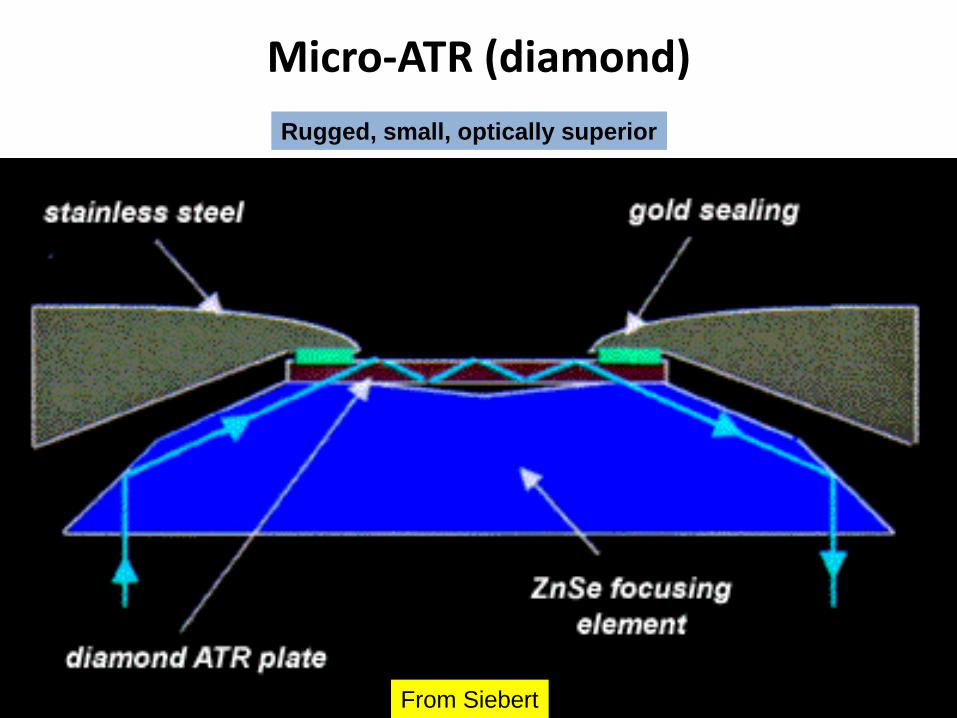
Micro-ATR (diamond)
From Siebert
Rugged, small, optically superior

ATR-IR Titration of Carboxylic
Acids(Asp, Glu)
Citrate
COOH
COO-
From Goormaghtigh et al
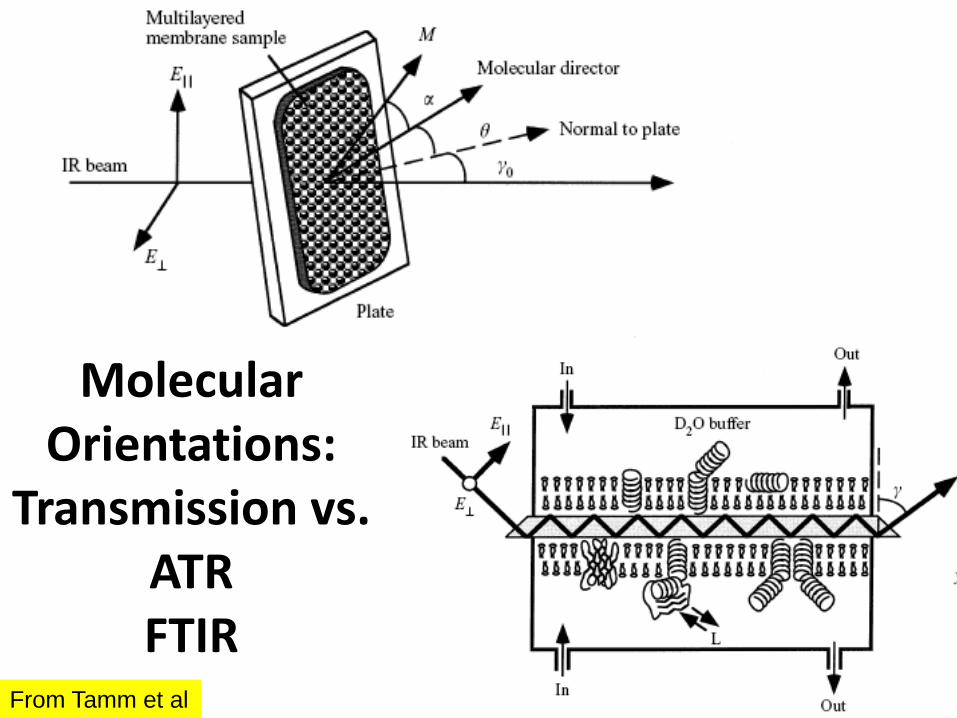
Molecular Orientations:
Transmission vs. ATRFTIR
From Tamm et al

Polarized ATR-FTIR To Determine
Lipid Orientation and Order
From Tamm et al
DMPC C-H
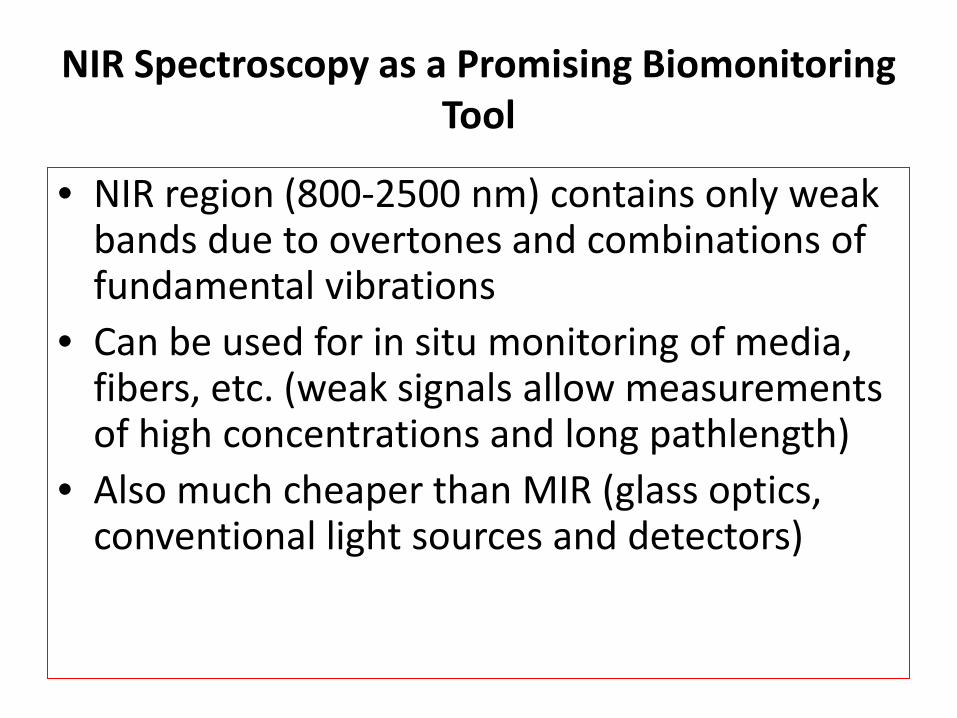
NIR Spectroscopy as a Promising Biomonitoring Tool
• NIR region (800-2500 nm) contains only weak bands due to overtones and combinations of fundamental vibrations
• Can be used for in situ monitoring of media, fibers, etc. (weak signals allow measurements of high concentrations and long pathlength)
• Also much cheaper than MIR (glass optics, conventional light sources and detectors)

Raman Spectroscopy: Basics• Inelastically scattered radiation collected at 90° (or 180°) to the
monochromatic light source (UV, visible, or near IR)
From Browne et al
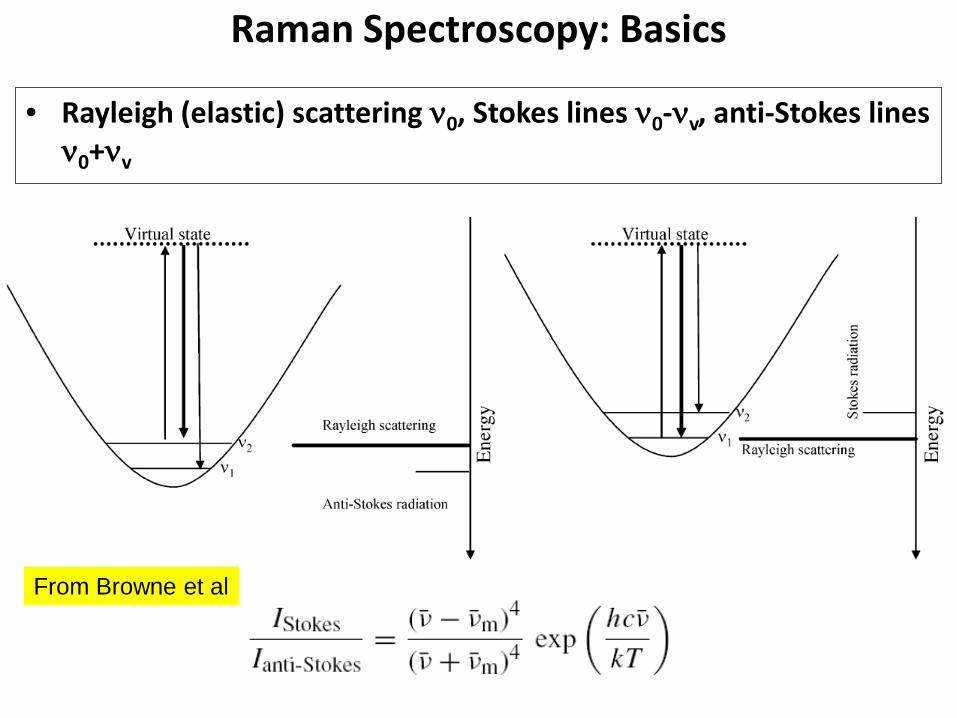
Raman Spectroscopy: Basics
• Rayleigh (elastic) scattering ν0, Stokes lines ν0-νv, anti-Stokes lines ν0+νv
From Browne et al

Raman Spectroscopy: Basics• The scattering is very inefficient, so powerful lasers are needed.
This sometimes creates a problem of the photostationary mixtures and sample damage. Does not have a problem with water absorbance
From Browne et al

Raman Spectroscopy: Basics• Different from IR selection rules – there must be a polarizability
change during the vibration. Thus, Raman can give additional information through the lines which are not active in classic IR (D=αE)
From Miura et al
Example of Complementarity of IR and Raman

Resonance Raman
From Browne et al

From Koechendorfer
Raman Bands of the Chromophore of Rhodopsins
11-cis-retinal

Raman Titration of SH groups (Cys)
From Miura et al
thioredoxin

Specialized Raman Techniques in Biophysics
• FT-Raman (no problem of electronic excitation, photobleaching, and fluorescence)
• UV-Raman• Time-resolved (kinetic) Raman1. Pump+Probe2. Spinning Cells3. Flow cells• Surface-enhanced Raman (silver electrodes and
hydrosols) - SERS• Raman Microscopes (Spectra+Imaging)• CARS – coherent anti-Stokes Raman Spectroscopy

FT-Raman Spectra of Microbial Rhodopsins

UV-Raman –Following
Aromatic Amino Acids and
Nucleotides
From Thomas
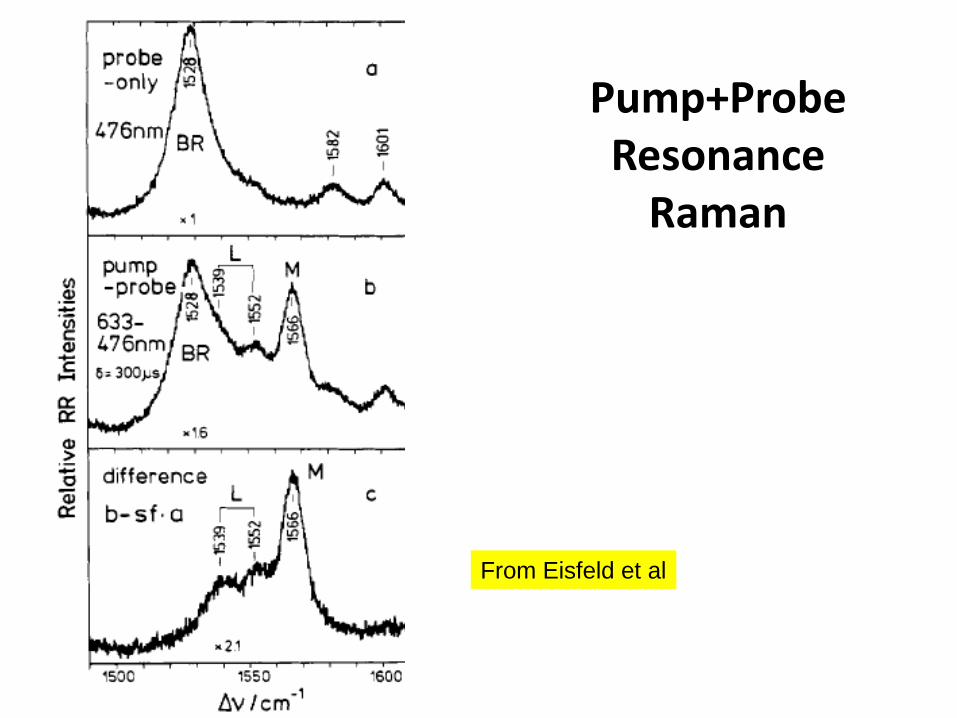
Pump+Probe Resonance
Raman
From Eisfeld et al

A New Word in Raman – Stimulated Raman
From Kukura et al

Femtosecond Stimulated Raman –
Probing Fast Photobiological
Reactions
From Kukura et al

Application of Femtosecond
Stimulated Raman to Vision
From Kukura et al
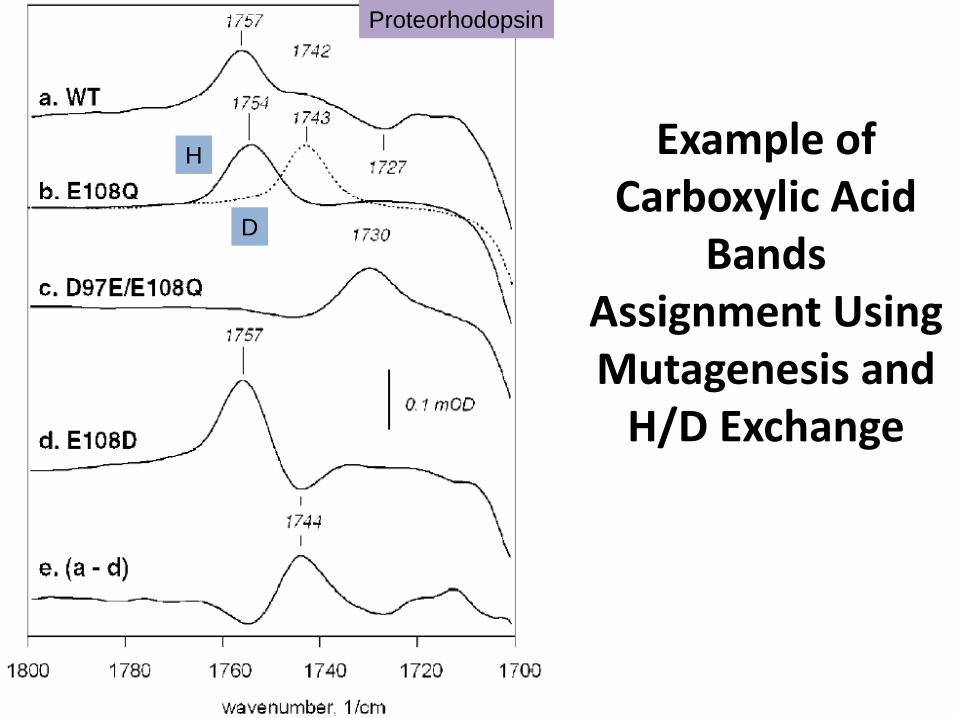
Example of Carboxylic Acid
Bands Assignment Using Mutagenesis and
H/D Exchange
Proteorhodopsin
H
D
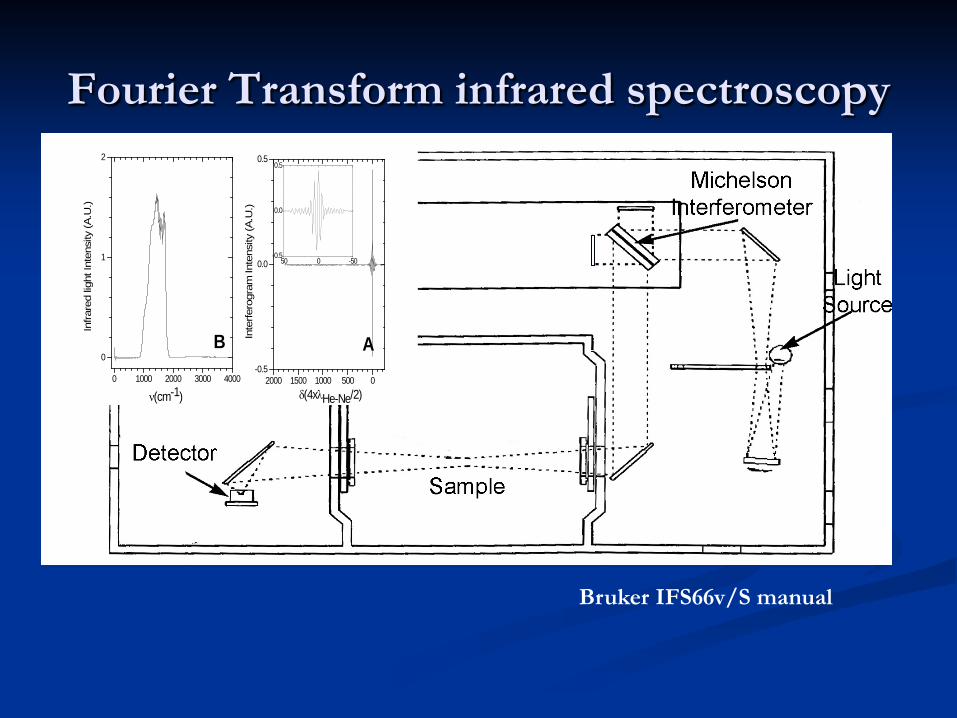
Fourier Transform infrared spectroscopy
0 1000 2000 3000 4000
0
1
2
50 0 -50-0.5
0.0
0.5
2000 1500 1000 500 0-0.5
0.0
0.5
Infra
red
light
Inte
nsity
(A.U
.)
Inte
rfero
gram
Inte
nsity
(A.U
.)
δ(4xλHe-Ne/2)ν(cm-1)
A
B
Bruker IFS66v/S manual

Transmission Polarized FTIR to Determine Orientation of Various Molecular Groups
Inside the Protein
From Hatanaka et al
C=O Asp85
C=O Asp85