Embed Size (px)
DESCRIPTION
Rock behaviour
Citation preview

doi:10.1144/GSL.QJEG.1993.026.01.02 1993; v. 26; p. 5-17 Quarterly Journal of Engineering Geology and Hydrogeology
Peter N. W. Verhoef
dredgingAbrasivity of Hawkesbury Sandstone (Sydney, Australia) in relation to rock
Quarterly Journal of Engineering Geology and Hydrogeology
serviceEmail alerting to receive free email alerts when new articles cite this article click here
requestPermission to seek permission to re-use all or part of this article click here
SubscribeHydrogeology or the Lyell Collection
to subscribe to Quarterly Journal of Engineering Geology andclick here
Notes
Downloaded by Victoria Roads Library on 6 November 2007
© 1993 Geological Society of London
Quarterly Journal of Engineering Geology, 26, 5-17. 0481-2085/93 $03.50 © 1993 The Geological Society
Abrasivity of Hawkesbury Sandstone (Sydney, Australia) in relation to rock dredging
Peter N. W. Verhoef
Delft Technological University, Faculty of Mining and Petroleum Engineering, Section of Engineering Geology, P. O. Box 5028, 2600 GA Delft, The Netherlands
Abstract
During rock cutter dredging for the trench for the Sydney Harbour Tunnel, partially cut in rock of the Hawkesbury Sandstone, tool consumption data were obtained and com- pared with the wear value F developed by Schimazek, and with the cutting and abrasive wear rates as determined by the Newcastle-upon-Tyne cuttability tests. It appears that while the F-values correlate well with actual tool consumption, correlations with laboratory cutting and abrasion tests are not always significant.
The F-value is obtained from a number of easily measured rock parameters (Brazilian tensile strength, mineralogical composition and grain size.) Use of the F-value is considered advantageous compared to laboratory tests which measure the abrasivity of rock directly because it is difficult to perform sufficient abrasivity tests to cover the variability inherent in a rock mass and it is impossible to perform laboratory tests that are truly representative of the actual cutting and abrasion mechanisms operating. Site investigations for rock dredging projects would be improved if systematic determinations of the F-values were carried out. This would help to improve the 'educated guesses' of tool consumption currently practised during the tendering stages of a dredging project. Accurate prediction, however, will always necessitate a trial dredge excavation to calibrate and to check the appropriateness of the abrasivity parameters chosen.
Introduction
One of the major problems in rock dredging projects is the correct prediction of tool consumption. During the tendering stage, potential tool consumption is a significant factor in the estimation of contractors' costs. As rock dredging is a relatively recent develop- ment it can profit from the experience gained in mechanical tunnel excavation.
Large parts of the Sydney area, including the Harbour, are underlain by the Hawkesbury Sandstone, a weak to moderately strong quartz-rich rock. The Hawkesbury Sandstone is of Triassic age and up to 290m thick. Major tunnelling projects have been carried out in this rock and increasingly use has been made of mechanical excavation methods. For the two recent projects carried out in the Sydney region, the Sydney Harbour Tunnel and the Sydney Ocean
Outfalls, considerable attention has been paid to the abrasivity of the Hawkesbury Sandstone (Fig. 1). This situation provided an opportunity to compare the available information on tool consumption and abrasi- vity of both projects.
On two of the Outfall tunnels, data have been published on the cuttability and abrasivity 1 of the rocks excavated (Lowe & McQueen 1988, 1990). The Malabar Ocean Outfall Decline passes through Hawkesbury Sandstone and was partially excavated by mechanical means. Lowe & McQueen (1988) give data on the rock properties and the tool consumption rate and provide an analysis of roadheader performance.
For the Sydney Harbour Tunnel, consisting partly of land tunnels and partly of immersed reinforced concrete tube elements in the harbour, the trench dredged for the tube elements was excavated partially in rock, using a rock cutter suction dredger. Unusually the contractor made excavation data available for analysis. Experience with tool wear prediction in rock dredging (Verhoef 1988) is limited, as contractors usually consider their tool consumption and produc- tion data to be highly confidential. This paper compares the available site investigation and labora- tory data with the excavation performance of the dredger.
Tool wear in rock cutting dredging appears to be related mainly to the abrasivity of the excavated rock in one way or another. In Australia, the rock cuttability and wear tests developed by Roxborough (1987) and the Cerchar test and Goodrich test (Bamford 1984; cited in Braybrooke 1988) are used in site investigations to assess abrasivity of rock for tunnelling or mining purposes. In this paper special attention is given to the F-value developed by Schimazek & Knatz (1970). The F-value has shown a tendency to be linearly related to abrasive wear (Schimazek & Knatz 1970, 1976; Paschen 1980; Verhoef, Van den Bold & Vermeer 1990). Certainly in Europe the F-value is used to assess abrasivity of rock,
1 Cuttability refers to the facility of rock to be excavated by cutting tools. Cuttability is influenced by the abrasivity of the rock as it may blunt the tools resulting in an increase of cutting energy required.

6 P. N. W. V E R H O E F
SUBURBAN SYDNEY
(J 0
TH HEAD OUTFALL
SYDNEY HARBOUR
SYDNEY HARBOUR
TUNNEL
BONDI OUTFALL
LUCAS HEIGHTS
BAY
MALABAR OUTFALL
(J
, . . . . . . ,
5 KM Q.. t ~
N
FIG. 1. Locat ion map.
especially in coal mining and tunnelling. Voest-Alpine Bergtechnik uses graphs containing the F-value and unconfined compressive strength to predict the con- sumption of several types of tungsten carbide chisels (K. Gehring 1991, pers. comm.). Braybrooke (1988) shows graphs published by Voest-Alpine on pick-usage of Voest-Alpine's AM 100 roadheader using Schima- zek's F-value. However, tool consumption data of projects for which the F-value was determined are unknown to the author. Values of F can be obtained from rock samples using the Brazilian tensile strength test (on saturated specimens for dredging projects) and by studying thin sections of the same sample under the microscope to obtain information on mineralogy and grain size. Hardness of minerals other than quartz may be accounted for by expressing their hardness relative to that of quartz. Thus,
F = E q Qtz x 0 x BTS 100 (N/mm) (1)
where F is Schimazek's wear factor, Eq Qtz is the equivalent quartz volume percentage and ¢ is the grain size (mm). As the Schimazek method was not used
during the site investigation programme of both projects, the necessary parameters were not readily obtainable and had to be partially inferred. The rock abrasivity data were compared with tool replacement data. The data on the Malabar project came from Lowe & McQueen (1988) and data on the dredging project were compiled by Watson (1990). Only tool replacement data considered representative of normal rock cutting dredging operation were used.
Engineering properties of the Hawkesbury Sandstone
Pells (1985) has given a comprehensive review of the properties of the Hawkesbury Sandstone in the Sydney area. The rock mass consists dominantly of massive sandstone beds, typically 2-5 m thick, but locally up to 15m. The mass structure is typically mega cross- bedded which has been described by Herbert (1976) to be the result of braided river deposition in a Triassic environment comparable to the present River Brama- putra in Bangladesh. Locally mudstone or shale is
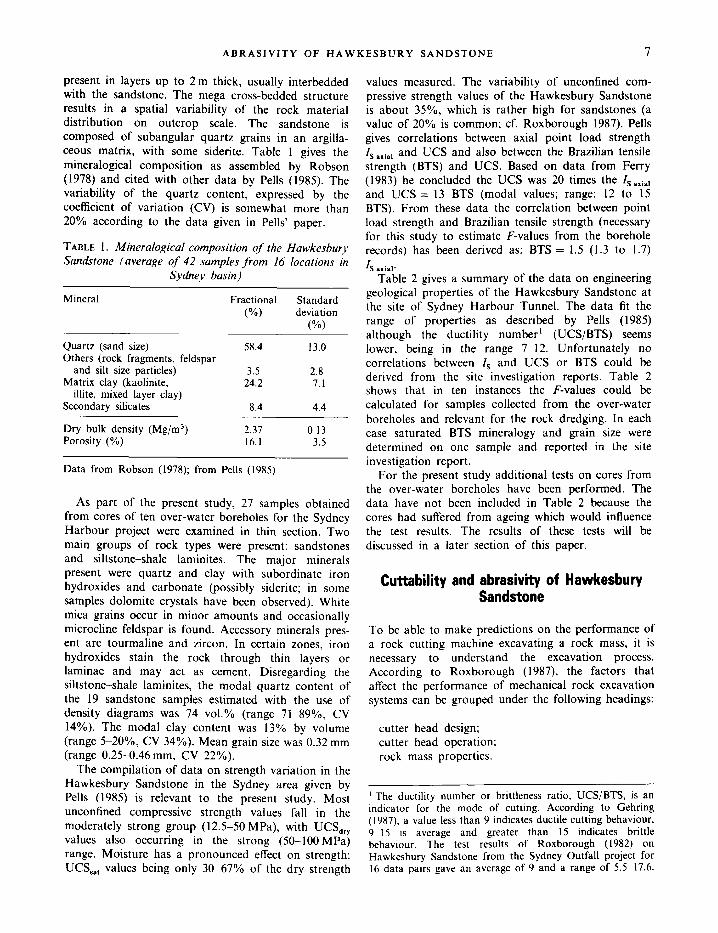
ABRASIVITY OF HAWKESBURY SANDSTONE 7
present in layers up to 2 m thick, usually interbedded with the sandstone. The mega cross-bedded structure results in a spatial variability of the rock material distribution on outcrop scale. The sandstone is composed of subangular quartz grains in an argilla- ceous matrix, with some siderite. Table 1 gives the mineralogical composition as assembled by Robson (1978) and cited with other data by Pells (1985). The variability of the quartz content, expressed by the coefficient of variation (CV) is somewhat more than 20% according to the data given in Pells' paper.
TABLE 1. Mineralogical composition of the Hawkesbury Sandstone (average of 42 samples from 16 locations in
Sydney basin)
Mineral Fractional Standard (%) deviation
(%)
Quartz (sand size) 58.4 13.0 Others (rock fragments, feldspar
and silt size particles) 3.5 2.8 Matrix clay (kaolinite, 24.2 7.1
illite, mixed layer clay) Secondary silicates 8.4 4.4
Dry bulk density (Mg/m 3) 2.37 0.13 Porosity (%) 16.1 3.5
Data from Robson (1978); from Pells (1985)
As part of the present study, 27 samples obtained from cores of ten over-water boreholes for the Sydney Harbour project were examined in thin section. Two main groups of rock types were present: sandstones and siltstone-shale laminites. The major minerals present were quartz and clay with subordinate iron hydroxides and carbonate (possibly siderite; in some samples dolomite crystals have been observed). White mica grains occur in minor amounts and occasionally microcline feldspar is found. Accessory minerals pres- ent are tourmaline and zircon. In certain zones, iron hydroxides stain the rock through thin layers or laminae and may act as cement. Disregarding the siltstone-shale laminites, the modal quartz content of the 19 sandstone samples estimated with the use of density diagrams was 74 vol.% (range 71-89%, CV 14%). The modal clay content was 13% by volume (range 5-20%, CV 34%). Mean grain size was 0.32 mm (range 0.25--0.46mm, CV 22%).
The compilation of data on strength variation in the Hawkesbury Sandstone in the Sydney area given by Pells (1985) is relevant to the present study. Most unconfined compressive strength values fall in the moderately strong group (12.5-50MPa), with UCSdry values also occurring in the strong (50-100MPa) range. Moisture has a pronounced effect on strength; UCSsa t values being only 30-67% of the dry strength
values measured. The variability of unconfined com- pressive strength values of the Hawkesbury Sandstone is about 35%, which is rather high for sandstones (a value of 20% is common; cf. Roxborough 1987). Pells gives correlations between axial point load strength Is axia~ and UCS and also between the Brazilian tensile strength (BTS) and UCS. Based on data from Ferry (1983) he concluded the UCS was 20 times the Is axi~ and UCS = 13 BTS (modal values; range: 12 to 15 BTS). From these data the correlation between point load strength and Brazilian tensile strength (necessary for this study to estimate F-values from the borehole records) has been derived as: BTS = 1.5 (1.3 to 1.7)
S ax ia l "
Table 2 gives a summary of the data on engineering geological properties of the Hawkesbury Sandstone at the site of Sydney Harbour Tunnel. The data fit the range of properties as described by Pells (1985) although the ductility number ~ (UCS/BTS) seems lower, being in the range 7-12. Unfortunately no correlations between I s and UCS or BTS could be derived from the site investigation reports. Table 2 shows that in ten instances the F-values could be calculated for samples collected from the over-water boreholes and relevant for the rock dredging. In each case saturated BTS mineralogy and grain size were determined on one sample and reported in the site investigation report.
For the present study additional tests on cores from the over-water boreholes have been performed. The data have not been included in Table 2 because the cores had suffered from ageing which would influence the test results. The results of these tests will be discussed in a later section of this paper.
Cuttability and abrasivity of Hawkesbury Sandstone
To be able to make predictions on the performance of a rock cutting machine excavating a rock mass, it is necessary to understand the excavation process. According to Roxborough (1987), the factors that affect the performance of mechanical rock excavation systems can be grouped under the following headings:
cutter head design; cutter head operation; rock mass properties.
1The ductility number or brittleness ratio, UCS/BTS, is an indicator for the mode of cutting. According to Gehring (1987), a value less than 9 indicates ductile cutting behaviour, 9 15 is average and greater than 15 indicates brittle behaviour. The test results of Roxborough (1982) on Hawkesbury Sandstone from the Sydney Outfall project for 16 data pairs gave an average of 9 and a range of 5.5-17.6.

8 P. N. W. VERHOEF
TABLE 2. Summary of geotechnical properties of the Hawkesbury Sandstone at the Sydney Harbour Tunnel site
Northern Tunnels Southern Tunnels Over-water boreholes Test No (n) Mean (Range) No (n) Mean (Range) No (n) Mean (Range)
UCS dry (MPa) 70 42.9 (16.2-93) 18 42.6 (29-67) - - UCS sat. (MPa) 55 22.8 (4-46) 14 21.0 (8-40) 26 22.6 (9.0-34.6) BTS dry (MPa) 45 4.6 (1.5-9.8) 16 3.6 (1.4-6.0) - - BTS sat. (MPa) - - - - 26 3.3 (1.4-5.4) Ductility number UCS/BTS - - - - 6 9.2 (7.8-10.2) Qtz (%) 10 70 (40-82) 10 76 (66-80) 13 60 (19-82) Qtz eq (%) - - - - 13 62 (24-83) SE dry (MJ/m 3) 10 10.6 (8.3-13.9) 10 11.6 (10.4-13.9) - - SE sat. (MJ/m 3) 3 8.5 (6.8-10.7) - - 4 11.3 (10.0-12.3) Cutting wear dry (mg/m) 4 1.70 (1.44-2.11) - - Cutting wear sat. (mg/m) - - - - 4 4.25 (3.83-4.98) Abr. wear dry (mg/m) 9 1.14 (0.57-1.80) 9 1.13 (1.0-1.2) - - Abr. wear sat. (mg/m) - - - - 6 0.87 (0.11-1.15) Cerchar Abr. dry (0.1 mm) 19 4.8 (2.8-8.7) 6 4.0 (2.0-5.7) - - Cerchar Abr. sat. (0.1 mm) - - 6 4.0 (2.0-6.3) - - F-value sat. (N/mm) - - - - 10 0.61 (0.03-1.07)
Sources: Pells (1990); Coffey & Partners SI reports (1987). F-values calculated from data SI report.
Cutter head design refers to the geometry and the material properties of the cutting tools. The cutter head operation refers to the applied energy input; the forces and velocities involved and the environment in which the cutting operation takes place. The environ- ment refers to dry or wet excavation conditions and encompasses the external physical variables such as ambient temperature and pressure.
Roxborough (1987) points out that the question of cuttability of rock is largely determined by the rock mass properties at the site. The choice requires the selection of a type of machine and then adapting it to the site conditions. The machine characteristics needed for a certain type of rock are governed mainly by its cuttability, information on which can be obtained from the following rock properties (Roxborough 1987; see also Fig. 2):
(1) Specific cutting force: F¢/d; the mean force acting on a pick or chisel in its cutting direction (F¢) per unit depth of cut (d).
(2) Specific normal force: F,/d; the mean force acting on a cutting tool normal to its cutting direction per unit depth of cut (d).
Both specific forces are known to increase linearly with depth of cut. From the specific cutting force the torque and power required to cut a rock at a specified rate can be determined while the force that must be provided by a machine's thrusting system to achieve and maintain the required depth of cut can be calculated from the specific normal force.
(3) Specific energy: SE = F,L/V; the energy or work required (cutting force F¢ times distance travelled L) to cut a unit volume of rock (V). This parameter may be
used to measure the efficiency of a rock cutting system within a given rock, with lower values indicating higher efficiencies. It can also be used to compare the cuttability of different rock types (using a standard cutting test) and from the result it is possible to approximate the potential excavation rate for a particular machine type in a given rock.
(4) Cutting tool wear rate: the rate at which a cutting tool wears in a given rock, measured as the weight loss of tool material (usually tungsten carbide; steel for cutting dredgers) per unit cutting distance (mg/m).
According to Roxborough (1987), specific energy and tool wear rate provide the most useful basis on which to relate machine potential to rock properties.
The core cut t ing test
In the late 1960s a cutting test was developed by Roxborough and co-workers at the Mining Engineer- ing Department of the University of Newcastle-upon- Tyne (UK). This test aimed to assemble information on the relevant parameters which might describe the performance of an excavation machine in a rock mass. The cutting test was developed to determine the four machine performance parameters on core samples. The test is standardized to exclude machine design influences and consists of cutting a groove 12.7mm wide and 5 mm deep along the surface length of a rock core sample parallel to its long axis (Fig. 2). The core is then rotated by 180 ° to make a similar parallel cut. If the core has not been broken it may be rotated

A B R A S I V I T Y OF H A W K E S B U R Y S A N D S T O N E 9
DYNAMOMETER[~
PICK HOLDER ~ I DIRECTION CARBIDE INSERTa-~--~ OF CUTTING
. . . . ~ . . . . . . . . . .
CORE SAMPLE
12 .7 rnm
...~" e"
FIG. 2. Test arrangement of the Newcastle-upon-Tyne cutting test.
again to make a third and fourth cut. If the core is 250 mm long a maximum length of 1 m can be tested. The test arrangement is placed on a shaper. For each rock core tested a new tungsten carbide chisel-shaped cutter insert is used. The insert is 12.7 mm wide with a front rake angle of 0 ° and a back clearance angle of 5 °. The principal forces acting on the chisel are measured by means of a triaxial dynamometer to which the cutting tool is attached. The forces are measured continuously during the cut and logged on computer. The amount of rock cut from each groove is measured and used to calculate the specific energy. The tungsten carbide insert is weighed before and after the set of up to four cuts and its weight loss is used to determine cutting wear. The specifications of this cutting test are given in Table 3.
rock mass. From the beginning of the development of the cutting test, Roxborough and co-workers have performed a suite of index tests on the rock materials used, including petrographic examination (minera- logy, grain size and shape, cementation), physical properties (density, porosity), UCS, BTS, Shore hard- ness, NCB cone indenter and Schmidt hammer rebound. Results of these index tests have been correlated with the parameters obtained from the cutting test by means of multiple linear regression techniques (McFeat-Smith & Fowell 1977). Attempts were made to relate relevant index tests and the rock cutting parameters to the actual performance of tunnelling machines. McFeat-Smith & Fowell (1977) found linear correlations between laboratory specific energy and in situ specific energy and between laboratory cutting wear and pick replacement rate for a Dosco road header in relatively massive rock (no significant discontinuities). In addition a relation between SE and field cutting rate was found (see also Speight & Fowell 1987). However, Roxborough (1987) points out that, although these relationships look promising, the major drawback of the method is the difficulty of performing sufficient tests for the results to become representative. Hence relationships of cutting parameters with index tests are important. For the laboratory cutting test, Roxborough found:
SE = 0.25 UCS + C(N/m 2) (2)
TABLE 3. Specifications for rock cutting test (UNSW, Sydney)
cutting speed 105 mm/s cutting depth 5 mm cutting width 12.7 mm
insert: tungsten carbide 12.7mm wide, front rake angle 0 °, back clearance angle 5 ° Material properties: grade B23. Composition: Co 9.5%, WC 90.5%. Grain size 6 ~tm, density I4.59 _+ 0.6 Mg/m 3, hardness HV2o = 1225 kgf/mm 2.
rock core: diameter larger than 50 mm, length preferably 200- 250 mm.
A limiting minimum diameter of 50 mm for the rock core is required because the breakout angle of rock chips is dependent on the radius of the core; with small diameter cores the rock yield is reIatively lower and the specific energy higher than for a larger core of the same rock.
The execution of the test is straightforward, but the equipment necessary is quite exclusive and, probably more importantly, considerable amounts of rock core are required to obtain a good impression of the variation in rock cutting characteristics for a certain
where SE = specific energy; UCS = unconfined com- pressive strength and C is a constant found by linear regression and dependent on rock type. This relation- ship allows cutting tests to be used and advantage taken of the more numerous data on UCS to make an analysis of the variability of strength in the rock mass to be excavated, which can be applied to the excavation performance prediction. According to Rox- borough (1987), equation (2) is basically sound, but would apply only to machines which have a constant depth of cut.
Roxborough considers the wear of the carbide inserts in the cutting test to be attributable to two sources, namely abrasion and brittle chipping of the metal. The latter mainly occurs when rock of high strength is tested. The impact chipping usually takes place at the cutting edge and corners of the inserts in the cutting test. Significant chipping relates to the magnitude of the peak component forces measured during the test.
The core abras ion t e s t
The abrasion test was developed to investigate the contribution of abrasive wear. This is performed on a core of the same rock, placed in a lathe rotating at
10 P. N. W. VERHOEF
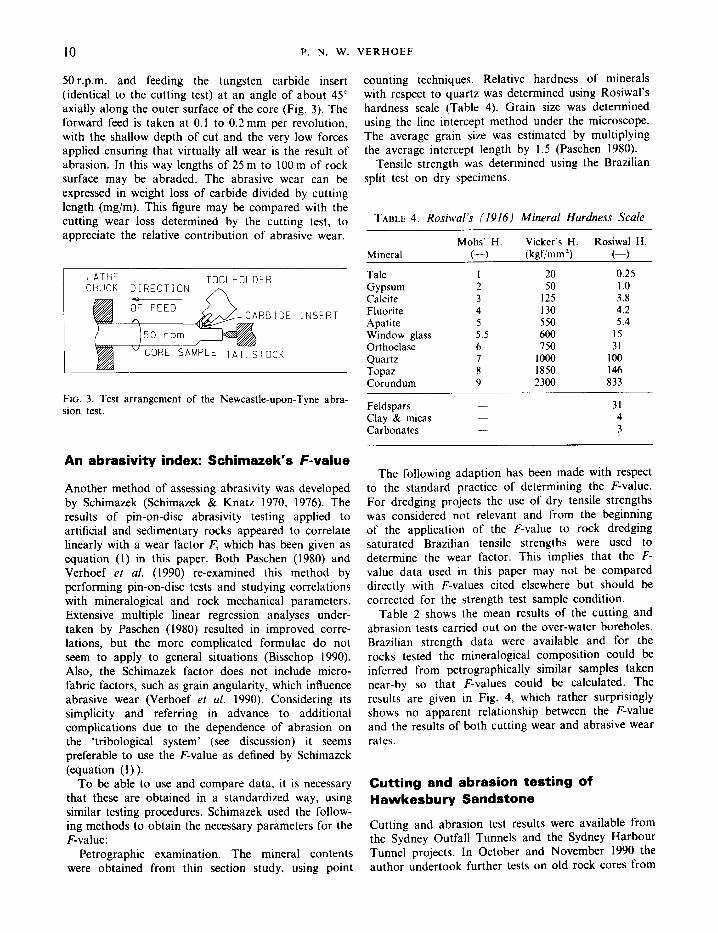
50r.p.m. and feeding the tungsten carbide insert (identical to the cutting test) at an angle of about 45 ° axially along the outer surface of the core (Fig. 3). The forward feed is taken at 0.1 to 0.2 mm per revolution, with the shallow depth of cut and the very low forces applied ensuring that virtually all wear is the result of abrasion. In this way lengths of 25 m to 100 m of rock surface may be abraded. The abrasive wear can be expressed in weight loss of carbide divided by cutting length (mg/m). This figure may be compared with the cutting wear loss determined by the cutting test, to appreciate the relative contribution of abrasive wear.
LATHE TOOLHOLDER CHUCK DIRECTION
OF FEED CARBIDE INSERT
CORE SAMPLE TAILSTOCK
FIG. 3. Test arrangement of the Newcastle-upon-Tyne abra- sion test.
An abrasivity index: Schimazek's F-value
Another method of assessing abrasivity was developed by Schimazek (Schimazek & Knatz 1970, 1976). The results of pin-on-disc abrasivity testing applied to artificial and sedimentary rocks appeared to correlate linearly with a wear factor F, which has been given as equation (1) in this paper. Both Paschen (1980) and Verhoef et al. (1990) re-examined this method by performing pin-on-disc tests and studying correlations with mineralogical and rock mechanical parameters. Extensive multiple linear regression analyses under- taken by Paschen (1980) resulted in improved corre- lations, but the more complicated formulae do not seem to apply to general situations (Bisschop 1990). Also, the Schimazek factor does not include micro- fabric factors, such as grain angularity, which influence abrasive wear (Verhoef et al. 1990). Considering its simplicity and referring in advance to additional complications due to the dependence of abrasion on the 'tribological system' (see discussion) it seems preferable to use the F-value as defined by Schimazek (equation ( l)) .
To be able to use and compare data, it is necessary that these are obtained in a standardized way, using similar testing procedures. Schimazek used the follow- ing methods to obtain the necessary parameters for the F-value:
Petrographic examination. The mineral contents were obtained from thin section study, using point
counting techniques. Relative hardness of minerals with respect to quartz was determined using Rosiwal's hardness scale (Table 4). Grain size was determined using the line intercept method under the microscope. The average grain size was estimated by multiplying the average intercept length by 1.5 (Paschen 1980).
Tensile strength was determined using the Brazilian split test on dry specimens.
TABLE 4. Rosiwal's (1916) Mineral Hardness Scale
Mohs' H. Vicker's H. Rosiwal H. Mineral (--) (kgf/mm 2) (--)
Talc 1 20 0.25 Gypsum 2 50 1.0 Calcite 3 125 3.8 Fluorite 4 130 4.2 Apatite 5 550 5.4 Window glass 5.5 600 15 Orthoclase 6 750 31 Quartz 7 1000 100 Topaz 8 1850 146 Corundum 9 2300 833
Feldspars - - - - 3 l Clay & micas - - - - 4 Carbonates - - - - 3
The following adaption has been made with respect to the standard practice of determining the F-value. For dredging projects the use of dry tensile strengths was considered not relevant and from the beginning of the application of the F-value to rock dredging saturated Brazilian tensile strengths were used to determine the wear factor. This implies that the F- value data used in this paper may not be compared directly with F-values cited elsewhere but should be corrected for the strength test sample condition.
Table 2 shows the mean results of the cutting and abrasion tests carried out on the over-water boreholes. Brazilian strength data were available and for the rocks tested the mineralogical composition could be inferred from petrographically similar samples taken near-by so that F-values could be calculated. The results are given in Fig. 4, which rather surprisingly shows no apparent relationship between the F-value and the results of both cutting wear and abrasive wear rates.
Cutting and abrasion testing of Hawkesbury Sandstone
Cutting and abrasion test results were available from the Sydney Outfall Tunnels and the Sydney Harbour Tunnel projects. In October and November 1990 the author undertook further tests on old rock cores from

A B R A S I V I T Y OF H A W K E S B U R Y S A N D S T O N E 11
TABLE 5. Results of cutting and abrasion tests and F-value determination on aged samples from the over-water boreholes of Sydney Harbour and from a block sample taken at Lucas Heights disposal site
Specific Cutting Abrasive Core BTS Cutting force Normal force energy wear wear F-value Number Description (MPa) Mean (kN) Peak (kN) Mean (kN) Peak (kN) (MJ/m 3) (mg/m) (mg/m) (N/mm)
3001 sl.w. SST 0.4 0.27 0.40 0.12 0.18 2.28 1.61 0.59 0.12 3002 fine gr. SST 2.7 0.36 0.79 0.31 0.55 4.39 2.52 0.32 0.09 3201 med.gr. SST 2.3 0.29 0.65 0.40 0.57 - - 2.53 0.88 0.67 3211 med.gr. SST 0.5 0.27 0.43 0.07 0.10 2.55 1.35 0.40 0.12 3212 sl.w. med.gr. SST 0.4 0.29 0.38 0.11 0.12 3.13 0.32 - - 0.08 3213 med.gr. SST 2.0 0.50 0.79 0.27 0.43 8.53 1.46 0.36 0.61 3233 med.gr. SST 3.0 0.68 1.39 0.57 0.89 10.09 1.80 - - 1.03 3241 SST 0.9 0.25 0.37 0.13 0.16 3.52 1.00 0.49 0.17 3252 SST 2.3 0.58 1.05 0.54 0.75 9.23 - - 1.00 0.52 3261 sl.w. SST 0.3 0.20 0.27 0.07 0.10 2.79 0.41 0.51 0.07 3262 SST 1.3 0.37 0.56 0.13 0.20 4.65 0.69 0.63 0.28 3281 Siltstone 1.9 0.55 0.77 0.06 0.16 - - 0.83 - - 0.08
Lucas Heights block average (x) 1.0 0.26 0.36 0.13 0.15 3.00 2.84 0.43 0.19 standard deviation (s) 0.3 0.06 0.08 0.04 0.05 0.72 1.23 - - 0.09 coeff, of variation (CV) (%) 29 21 22 34 30 24 43 - - 48 number of tests (n) 14 14 14 14 14 12 14 2 13
sl.w. = slightly weathered; med.gr. = medium grained; SST = sandstone
the Sydney Harbour Tunnel project. These latter tests were performed in Professor Roxborough's Laboratory in the Department of Mining Engineering at the University of New South Wales.
6
4.: t Ec~ 3.51
v
3 ¸
2.5-
1.5
1
0.5 ~
0 0 0
Cutting wear
o Q
Abrasive wear
0 0.2 0.4 0.6 0.8 1 Estimated F-value (N/mm)
FIG. 4. Results of the cutting and abrasion tests carried out on samples obtained from the over-water boreholes for the Sydney Harbour Tunnel project, compared with estimates of the F-value for the tested samples.
The samples were provided by the geotechnical consultants to the Sydney Harbour Tunnel project, Coffey Partners Pty Ltd. The samples tested were taken
from the over-water boreholes in the Harbour in order to gather additional data relevant to the rock cutting dredging. It should be noted that these cores had been stored in metal boxes in the open air for more than two years which may have had a detrimental influence on their quality. Additional cores were taken from a block of Hawkesbury Sandstone obtained from the domestic waste disposal site at Lucas Heights, South Sydney, where rock excavation by ripping was taking
place. Both the cutting and abrasion tests have been
performed on these rock cores. As the cuttability and abrasivity of the rock were studied in relation to the rock cutting dredging done for the Sydney Harbour Tunnel, all cores were tested in a water saturated condition, achieved by immersion in water for 24 hours. From each core tested, discs were cut for the Brazilian tensile strength test (saturated) and thin sections made for microscopic study, with the aim of determining the wear factor F of Schimazek.
The results of the laboratory tests are given in Table 5 and Fig. 5. A comparison of Figs 4 and 5 shows that the values of cutting forces, strength and cutting wear are generally lower than those measured during the site investigation on fresh cores. This may reflect the deterioration of the quality of the cores during storage. Again, the conclusion can be drawn that there is no clear relationship between F-value and laboratory wear rates as measured with the cutting and abrasion test.

12 P . N . W . V E R H O E F
TABLE 6. Estimate of average strength, quartz content and grain size for the length of borehole actually excavated for the trench, to determine a characteristic F-mass
Length I s BTS(est) Quartz Size F-mass BH no. (m) (MPa) (MPa) vot. % (ram) N/mm)
302 (N) 7.2 0.6 0.9 65 0. I0 0.06 330 (N) 5.2 0.3 0.4 60 0.10 0.02 300 (N) 1.6 0.3 0.4 60 0.10 0.02 12 (N) 13.0 0.2 0.3 70 0.35 0.07 320 (S) 1.8 0.3 0.5 68 0.35 0.12 321 (S) 4.0 0.3 0.5 80 0.50 0.18 322 (S) 0.5 extremely weathered rock 323A (S) 5.0 1.0 1.5 77 0.60 0.69 324 (S) 2.7 0.8 1.2 67 0.60 0.48 325A (S) 2.9 1.4 2.1 60 0.40 0.50 326A (S) 4.0 0.7 1.1 71 0.50 0.37
2.5- gg
2 E E
1.5- "~
1 t •
0 o o'.1 0'.2 013 014 015
I.. Cutting wear Ii i: Abrasive wearli
o'.6 0'.7 o'.8 0'.9 i F-value (N/mm)
FIG. 5. Results of the additional cutting and abrasion tests carried out on (aged) samples from the over-water boreholes of the Sydney Harbour Tunnel project, compared with F- values determined on the samples.
Sydney Harbour Tunnel rock dredging
Sydney Harbour is an old river valley partially filled with Quaternary sediments. The central part of the trench excavation for the Sydney Harbour Tunnel was therefore in soft sediments. Only at the sides of the ancient valley had partially weathered Hawkesbury Sandstone to be excavated. Estimates of F-value have been made from the site investigation reports and the over-water borehole records. In some instances where no Brazilian strength data were available, other tests which also give an indication of tensile strength were used such as the uniaxial (or true) tensile strength and the point load test. Alternatively an estimate of Brazilian strength can be made from the uniaxial compressive strength test. The derivation of BTS
estimates from other tensile strength tests or index tests is not a straightforward matter. In the ISRM Suggested Method for Point Load Strength determi- nation (1985) it is mentioned that I s values equal about 0.8 tensile or Brazilian strength, but it is well known that BTS commonly over-estimates true uniaxial tensile strength. Shulin Xu, De Freitas & Clark (1988) found for Penrith sandstone that BTS was about four times direct tensile strength (TS), while for Devonian sandstone they found that BTS equals about three times TS. Fortunately Pells (1985) gives correlation data of UCS, the Brazilian and the point load strength for Hawkesbury sandstone. From these it may be derived that on average the BTS is about 1.5 times the
I s value.
i
t not included in regression analysis
Q. l
o o.1 0.2 0.3 0.4 ols o16 o2~ o18 Fmass estimate (N/mm)
FIG. 6. Comparison of the tool consumption of the rock cutter dredger with an estimate of the average F-value for the rock mass excavated. To protect the interests of the dredging contractor the real tool consumption data are not published. Only data that were considered representative of normal dredging operation at the site were used. F-mass estimates were only made where boreholes were sufficiently close to the excavation zone.

ABRASIVITY OF HAWKESBURY SANDSTONE 13
An attempt was made to estimate an average F-value (F-mass) for the section of the borehole actually excavated by the dredger. This was done by consider- ing the variation in the I s value and petrography recorded in the relevant section of the borehole. The results are given in Table 6.
Figure 6 shows plots of estimated F-values considered representative of the excavation zone as encountered in the boreholes and the tool consumption recorded near to the boreholes. The problem with tool consumption data is that these are not always related to 'normal practice' rock cutting dredging. Only reliable tool consumption data were used and only F-mass estimates of boreholes sufficiently close to the excavated rock zone. The tool consumption data were compiled by Watson (1990). Care was taken that the data on tool consumption were representative of normal practice and not biased by dredging operator factors or exceptional dredgiiag conditions. Extremely weathered rock was discarded, as were data from the head-on dredging performed at the harbour sides.
The F-mass estimates were made as follows. First an average strength (Is) was estimated for the section of the borehole which was in the excavation zone (Table 6), together with an estimate of average quartz content and grain size. Then the daily excavation reports were examined and it was determined which boreholes were close to the excavated zone (Fig. 7). If no boreholes were close, the data were discarded. In Fig. 7 the height contours show the approximate distribution of rock head. The trench has been excavated to a depth of - 20 .5m. With respect to excavation volume, the density of borehole data is very small.
( • 329
I / /~ ~ TRENCH " ' " .... . • a0 ,
5
r \ ~ "" " " " ~ - 5 1~ r" ~ X %X "
,,
or~ d a y ~ E Z ~ ] ~'~ ='~¢e ' " 5 ' " eoce,'=~ zo~
N . , • 3 2 9 o ' , , q u ' w a i ~ N ' ~ 3 0 r n
. . . .
FXG. 7. Simplified map showing part of the trench near the northern shore. The typical daily dredging excavation zones from which tool consumption numbers were available are numbered in working order. Note the distribution of boreholes.
block (Table 5, Lucas Heights block, CV = 48%), the result of the estimated means of F-mass with the tool consumption (Fig. 6) shows a good linear trend. The conclusions of this survey are:
(1) The laboratory cutting and abrasion wear rates do not correlate with the F-value for the Hawkesbury Sandstone.
(2) The F-value correlates with tool consumption (and thus abrasive wear of the pick-points).
(3) The cutting and abrasive wear rates as determined by the cutting and abrasion tests do not correlate with actual tool consumption in this case.
Malabar Outfall Decline Tunnel (Lowe & M cOueen 1988)
This decline tunnel traverses two sedimentary rock formations: the Hawkesbury Sandstone and the under- lying Newport Formation, which consists mainly of siltstone and sandstone units. Lowe & McQueen (1988) give an extensive description of the engineering geological properties of these rocks. They have divided the Hawkesbury Sandstone into five types, based on petrographic characteristics:
Type 1: fine to medium grained sandstone, average quartz content 63 vol.%.
Type 2: fine to medium grained, quartz content 78 vol.%.
Type 3: medium to coarse grained, quartz content 78 vol.%.
Type 4: medium coarse grained to conglomerate, quartz content 76 vol.%.
Type 5: fine to coarse, carbonate cemented, 57 vol.% quartz.
Average data necessary to estimate the F-value are given in Table 7.
All the reported tests were carried out in the saturated condition, as close to natural moisture content as possible. As regards the strength of Type 4, the unconfined compressive strength considered character- istic by Lowe & McQueen is 55 MPa (Table 7), while the strength measured by Roxborough on the sample used for the cutting test was 26 MPa. If this value is used for the calculation of F, an F-value of 0.91 is obtained, which would give the SST 4 a more logical position in the graph of Fig. 8. Table 7 gives the average wear values derived from the cutting and abrasion test of Roxborough (1987) ~ and the pick
Considering the variability of the quartz content (CV = 20%) and compression strength (CV = 35%) and the high variability of F-value within one rock
]Note that the cuttability test has also been carried out on these samples in Newcastle-upon-Tyne (England). Only cutting wear rate was determined.

14 P. N. W. V E R H O E F
TABLE 7. Summary of geotechnical data for the Malabar Decline Tunnel (from Lowe & McQueen 1988)
Vol.% Grain UCS BTS est. F est Abrasive Cutting AM75 AM100 SSST type mass size (mm) Qtz % (MPa) (MPa) (N/mm) wear (mg/m) wear (mg/m) (pps/m 3) (pps/m 3)
1 39 0.30 63 32.0 2.5 0.47 1.09 2.16 0.302 0.866 2 * 0.30 78 45.0 3.5 0.81 2.19 3.13 1.189 0.950 3 * 0.50 78 45.0 3.5 1.35 2.45 4.10 1.189 0.950 4 7 0.60 76 55.0 4.2 1.93 1.30 3.93 - - - - 5 1.5 0.40 57 - - - - - - 2.35 3.07 - - - - Nwp.sst 23 0.13 60 38.0 2.9 0.23 0.42 1.30 - - 0.535 Nwp.siltst 74 0.09 45 60.0 4.6 0.19 0.26 0.92 - - 0.206
* Type 2 & 3 make up 50% of the rock mass excavated; they could not be distinguished in the tunnel
consumption data of the two roadheader types used (Alpine Voest AM75 and AM100) are given. As no tensile strength test results were reported, BTS is estimated to be 1/13 of UCS, following Pells (1985) as the Newport (Nwp) rocks, siltstones and sandstones were described as being very similar to type SST 1 Hawkesbury Sandstone. Pick consumption data were given and these have been included.
~5- E
4"
~3-
1-
0 0
nwp sst s s t l ss t2 ss t3
nwp siltst
A
m
o12 0'.4
• Cutting wear (Nc) i
• Cutting wear i
~ Abrasive wear I
A
SSt4
0'.6 0'.8 i 1'.2 1'.4 1'.6 1'.8 2 Estimated F-value (N/mm)
FIG. 8. Estimated F-values of the typical Hawkesbury Sand- stone types (SST 1-4) and Newport Sandstone and Siltstone compared with the wear rates determined with the laboratory cutting and abrasion test. Malabar Outfall Decline (Lowe & McQueen 1988). See text for discussion.
Figure 8 shows how the estimated average F-value relates to the relevant wear data available. There appears to be a relationship with the cutting wear and abrasive wear rates determined in the laboratory tests.
Tool consumptions of the Voest Alpine roadheaders are plotted against the F-value in Fig. 9. For both, an increase of tool consumpton with F-value is shown. As no distinction could be made between Type 2 and Type 3 sandstone in the tunnel and in view of the fact that the relative abundance of these two types in the
boreholes apparently could not be estimated, the pick consumptions for both have been combined. This should be borne in mind when examining Figs 8 and 9. Type 2 differed from Type 3 mainly in grain size, but this is an important property with regard to abrasivity as can be deduced from their F-values.
Considering the manner in which the data have been obtained, any conclusions can only be tentative. In this case it is suggested simply that the F-value and the laboratory cutting and abrasive wear rates relate to actual tool consumption.
1.4-
1.2~ I
E 1 .
o8~
E 0.6~
8 -~ 0.4-
o2~
nwp sst
nwp siltst
• •
m
~ 1 ~ 2 ~ 3
AM 75
0 0.2 014 016 018 1 1.2 1.4 1.6 1.8 Estimated F-value (N/mm)
FIG. 9. Comparison of tool consumption data of Voest Alpine Roadheaders AM 75 and AM 100 with the F-values considered representative for the rock types excavated in the Malabar Outfall Decline. In the tunnel type SST 3 could not be distinguished from type SST 2 (data from Lowe & McQueen 1988).
Discussion
This study has attempted to relate laboratory or in situ derived rock parameters to actual excavation performance. Despite the fact that state-of-the art site

ABRASIVITY OF HAWKESBURY SANDSTONE 15
investigation reports were available for the Sydney Harbour project (containing much more geotechnical data than usual for dredging projects), the amount of data related to abrasivity was poor. One reason was the difficulty of performing many cutting and abrasion tests on rock cores. In most cases the F-value had to be estimated because one of the necessary parameters was lacking at a particular sampling point. When a reliable guess of mineralogy could be made (Fig. 4) or the BTS could be assessed from other strength tests (Figs 6 and 8), the F-value was estimated. For each case the method of estimating F has been consistent and efforts were made to obtain representative values. It is considered that the results as presented are the best that could be derived. For the estimate of F-mass (Fig. 6) many more assumptions had to be made; an F-value considered to be representative of a section of a bore core was used for a huge volume of rock.
In the case of Malabar, the data show that the F- value and the cutting and abrasive wear rates derived from the cutting and abrasion tests are related. Both methods also relate to pick consumption. In the case of the rock cutter dredging operation, it is notable that the estimated F-mass value shows an apparently linear correlation with actual pick consumption; however, the laboratory cutting and abrasion wear rates are not related to both F-value and pick consumption (Figs 4--6).
From what is known about wear problems using the science of tribology (e.g. Uetz 1986; Zum Gahr 1987), the results obtained by this survey are not surprising. In tribology it is stressed that wear (and thus pick consumption) is a system dependent process. The interaction between cutter head and rock is dependent on many variables, both internal and external, which are too numerous to be scaled down and simulated by simple laboratory tests. The system of a dredger cutting rock may be approached experimentally by the scheme shown in Fig. 10 (Verhoef 1990). Simple laboratory tests like the pin-on-disc test (Category VI in Fig. 10) or the cutting test (Category V) are very remote from the actual process taking place when dredging rock. In tribology it is attempted to simulate as well as possible the particular aspects of the process under study, using the same environmental conditions and simulating the proper temperatures and forces etc. Tests in Category VI or V are carried out to obtain an indication of the relative performance of different types of cutting steel for example. The tools undergo tests with increasingly complicated equipment and finally the prototypes are tested on the real machines. This type of development has not always been the practice. Very often new designs of tools were immediately tested on a purposely built machine. This has proved to be too expensive a method.
The above also explains why results of different types of wear tests could diverge. Cutting tool
geometry and the tool material both influence the result. Dredgers commonly use high quality steel (sometimes with tungsten carbide coating or inserts). This is why the specially designed cutting and abrasion tests which are developed for the Dutch dredging industry use steel chisels instead of tungsten carbide ones (Bisschop 1991; Davids & Adrichem 1990; Van der Sman 1988). In as far as the geometry of the cutting tool determines the cutting and wear mechan- isms operating, this is a factor which can be used in tool design.
I Field testing during normal working practise
II Full scale test of complete test machine
l r n u
III Test with full size part of machine
IV Test with odginal part of machine
V Test on testbody under similar loading conditions
Vl Model test with simple testbodies
4. mml
FIG. 10. Tribological testing categories for a rock cutter suction dredger.
The major problem in the case of rock cutting no longer lies in the tool development, on which most attention has been placed up to now, but in the assessment of the properties of the rock mass with its inherent variability of properties. The limited number of cutting or abrasion tests which can be performed for a project is one problem. The F-value as such is a wear

16 P. N. W. VERHOEF
factor which is potentially very useful, because it is based on parameters which can be obtained easily and in much larger quantities. The approach to wear prediction and cuttability performance in site investi- gations should therefore be to obtain as many rock parameters as possible, using index tests like UCS, E- modulus, BTS, I s and thin section examination. In site investigation practice for dredging projects thin section examination is frequently neglected. The mineralogical and microscopic properties of the soils and rocks should be determined in a geostatistically justified way and it is possible to undertake laboratory index tests on a number of samples. These data should then be used to calibrate the results of more complicated wear or cutting tests in the laboratory and by a trail dredging operation on the real scale (Verhoef 1990). Contractors will then be able to estimate to a much higher level of accuracy the tool replacement rate to be expected for a project.
Conclusion
For the first time relatively accurate tool consumption data of a rock cutter suction dredger could be studied. In this case the wear factor F derived by Schimazek, related reasonably well with tool consumption. Another method commonly applied in rock tunnelling, the cutting wear and abrasive wear rates derived from the Newcastle-upon-Tyne cutting and abrasion tests, did not correlate with the tool consumption of the rock cutting dredger. Both F-value and the cutting and abrasion wear rates were related to the tool consump- tion of the roadheaders used to excavate the Malabar Outfall Decline in Sydney.
The amount of cutting or abrasion tests which can be performed on rock cores will always be limited. In site investigation practice, therefore, use should be made of rock index tests which relate to cutting performance and abrasive wear. Such tests include UCS, BTS, I s, thin section examination (mineralogy, microscopic structure, grain shape, grain size), E- modulus and so on. The results of this paper indicate that further study into the use of wear factors combining index tests, such as the F-value, is war- ranted. For wear prediction, it is necessary to calibrate the results of abrasion tests or wear factors against a trial excavation with a real cutting machine at the site.
ACKNOWLEDGEMENTS. This research is supported by the Technology Foundation (STW, The Netherlands). Andr6 Veldstra, Kevin Green and John Watson of the Westham Dredging Company Pry Ltd, Sydney are thanked for the confidence and enthusiasm with which the experience and reports on the Sydney Harbour dredging with the Kunara rock cutter suction dredger were entrusted to me. Likewise, Coffey Partners International Pty Ltd (Philip Pells, Patrick
Wong) supported the work and provided rock samples. Professor Frank Roxborough was a very generous host during my three months stay at the University of New South Wales. I benefited very much from the happy support received from the staff and personnel of the Mining Engineering (Paul Hagan, Joe Shonhardt, Drago Panich, Sue Howard, Carol Vallance), Civil Engineering (Fiona Mac- Gregor, Paul Gwynne) and Applied Geology Departments (Larissa Smith, Michael de Mol, Red Flossman, Greg McNally). John Braybrooke is thanked for the critical interest shown during the course of the study. Professor David Price (Delft University), Aldert van Hemmen (Stapel Shipyard) and Harry Steeghs (Delft Hydraulics Laboratory) and two anonymous reviewers are thanked for their comments on the first draft of this paper.
List of notations
CV = coefficient of variation = s/x x 100 (%) s = standard deviation x = average (weighted mean) UCS = Unconfined compressive strength (MPa) BTS = Brazilian tensile strength (MPa) Is a~ial = axial Point load strength (MPa)
TS = Tensile strength (MPa) F = Schimazek's wear factor (N/mm; equation (1)) Eq Qtz = Equivalent quartz volume percentage (%); this is determined by adding the Rosiwal hardness with respect to quartz (= 100) of the minerals comprising the rock, considering the volume percentage taken by those minerals ¢, = grain size (mm) SE = specific energy (N/m2; MJ/m 3) F c = specific cutting force (N/m) /7, = specific normal force (N/m) Rsq = regression coefficient squared
References
BisscnoP, F. 1991. The Analysis of a Laboratory Cutting and Abrasion Test to be applied in Rock Cutting Dredging. Classified internal report, Faculty of Mining and Petroleum Engineering, Delft University of Technology.
BRAYBROOKE, J. C. 1988. The state of the art of rock cuttability and rippability prediction. Proceedings of the Fifth Australian-New Zealand Conference on Geomecha- nics, August 1988, Sydney, 13~42.
DAVIDS, S. W. & ADRICHEM, P. 1990. The Testing of a Classification Apparatus for the Wear of Cutter Heads during Cutting of Rock (in Dutch). Classified internal report, Faculty of Mechanical and Marine Engineering, Delft University of Technology.
ISRM 1985. Suggested method for determining point load strength. International Journal of Rock Mechanics, Mining Science & Geomechanical Abstracts, 22, 61-70.
GEHRING, K. 1987. Rock Testing Procedures at VA's Geotechnical Laboratory in Zeltweg. Internal report TZU 41. Voest Alpine Zeltweg, Austria,

A B R A S I V I T Y OF H A W K E S B U R Y S A N D S T O N E 17
HERBERT, C. 1976. The depositional development of the basin. In: BRANAGAN, D. F. et al. An Outline of the Geology and Geomorphology of the Sydney' Basin. Science Press, Sydney, 5-38.
LOWE, P. T. & MCQUEEN, L. B. 1988. Ground conditions and construction methods in the Malabar Ocean Outfall Decline and observations on rock cuttability. Proceed- ings of the Australian Underground Construction and Tunnelling Association Seminar on Cost Effective Tunnel- ling in the Sydney Basin. IE Australia, Canberra, 165- 203.
- - & - - 1990. Construction of the North Head Ocean Outfall Tunnel. Proceedings of VII Australian Tunnelling Conference, The Underground Domain. IE Australia, Canberra, 90/8, 159-172.
MCFEAT-SM1TH, I. & FOWELL, R. J. 1977. Correlation of rock properties and the cutting performance of tunnelling machines. Proceedings of Conference on Rock Engineer- ing, University of Newcastle upon Tyne, 587-602.
PASCHEN, D. 1980. Petrographische und geomechanische Charakterisierung yon Ruhrkarbongesteinen zur Bestim- mung ihres Verschleissverhaltens. Dissertation, Tech- nische Universit/it Claustahl.
PELLS, P. J. N. 1985. Engineering properties of the Hawkes- bury Sandstone. In: PELLS, P. J. N. (ed.) Engineering Geology of the Sydney Region. Balkema, Rotterdam, 179-197.
ROXBOROUGH, F. F. 1982. An Assessment of the Cuttability of Rock Formations Associated with the Sydney' M W S & DB Submarine Outfall Tunnels. Unisearch Limited Report for The Metropolian Water Sewerage and Drainage Board.
- - 1987. The role of some basic rock properties in assessing cuttability. Proceedings Seminar "Tunnels--Wholly Engi- neered Structures". IE Australia, April.
SCHIMAZEK J. & KNATZ H. 1970. Der Einfluss des Gestein-
saufbaus auf die Schnittgeschwindigkeit und den Meis- selverschleiss yon Streckenvortriebsmachinen. Gliickauf, 106, 274-278.
- - & - - 1976. Die Beurteiling der Bearbeitkarkeit von Gesteinen durch Schneid- und Rollenbohrwerkzeuge. Ertzmetall. 29, 113-119.
SHULIN XU, DE FREITAS, M. H. & CLARK, B. A. 1988. The measurement of tensile strength of rock. In: ROMANA (ed.) Rock Mechanics and Power Plants. Proceedings of International Society of Rock Mechanics Symposium, Madrid, 125-132.
SPEIGHT, H. E. & FOWELL, R. J. 1987. Roadheader performance studies using a full scale laboratory re- search facility. Proceedings of the 28th US Symposium on Rock Mechanics, Tuscon. Balkema, Rotterdam, 973-980.
VAN DER SMAN, R. M. 1988. Results of a First Series of Wear Tests on Chisels with the Shaper (in Dutch). Classified internal report, Faculty of Mechanical and Marine Engineering, Delft University of Technology.
VERHOEE, P. N. W. 1988. Towards a prediction of the abrasive wear of cutting tools in rock dredging. Delft Progress Report, 13, 307-320.
- - 1990. Wear testing categories for rock dredging projects. 6th International IAEG Congress, Amsterdam, Discussion Volume. Balkema, Rotterdam.
- - , VAN DEN BOLD, H. J. & VERMEER, Th. W. M. 1990. Influence of microscopic structure on the abrasivity of rock as determined by the pin-on-disc test". Proceedings of the 6th International full Congress of the IAEG, Amsterdam, Balkema, Rotterdam, 495-504.
UETZ, H. 1986. Abrasion und Erosion Carl Hauser Verlag, Mfinchen.
WATSON, J. 1990. Internal report Westham Dredging Com- pany Pty., Ltd.
ZUM GAHR, K. H. 1987. Microstructure and wear of materials. Elsevier, Amsterdam.
Received 28 October 1991; revised typescript accepted 5 November 1992