Embed Size (px)
DESCRIPTION
1
Citation preview

ABRASION RESISTANCE OF HIGH-STRENGTH CONCRETE MADE WITH CLASS C FLY ASH
Tarun R. Naik, Ph.D., P.E. Director Center for By-Products Utilization Shiw S. Singh, Ph.D., P.E. Post-Doctoral Fellow Center for By-Products Utilization and Mohammad M. Hossain Research Associate Center for By-Products Utilization
Center for By-Products Utilization University of Wisconsin-Milwaukee Department of Civil Engineering & Mechanics 3200 North Cramer Street Milwaukee, WI 53211

-1-
ABRASION RESISTANCE OF HIGH-STRENGTH CONCRETE MADE WITH CLASS C FLY ASH By Tarun R. Naik, Shiw S. Singh, and Mohammad M. Hossain Synopsis: This work was undertaken to evaluate the abrasion resistance of concrete proportioned
to have five levels of cement replacements (15, 30, 40, 50, and 70%) with one source of Class C
fly ash. A reference concrete without fly ash was proportioned to have the 28-day compressive
strength of 41 MPa. Concrete specimens were subjected to abrasion according to the ASTM C-
944 test method. In this work, all the concretes made with and without fly ash passed the abrasion
resistance requirements per ASTM C-779, Procedure C. Depth of wear values produced by the
ASTM C-944 test, were quite low (less than 1 mm) for the strength levels tested in this work.
An accelerated test method was developed and used to evaluate abrasion resistance of high-
strength concrete. This method used the grinding wheels with smaller size washers, and a
standard Ottawa sand was applied to the surface being abraded at an interval of one minute. The
accelerated test results showed that abrasion resistance of concrete having cement replacement up
to 30% was comparable to the reference concrete without fly ash. Beyond 30% cement
replacement, the fly ash concrete exhibited slightly lower resistance to abrasion relative to the no-
fly ash concrete.
Keywords: abrasion resistance; compressive strength; concretes; depth of wear; fly ash .

-2-
BIOGRAPHICAL SKETCH
ACI Fellow Tarun R. Naik is the director of the Center for By-Products Utilization and an
associate professor of civil engineering at the University of Wisconsin, Milwaukee. He received
his BE degree from the Gujarat University, India, and MS and PhD degrees from the University
of Wisconsin, Madison. ACI member of ACI committees 201, Durability of Concrete; 437,
Strength Evaluation of Existing Concrete Structures, 123 Research; E801, Student Concrete
Projects; and 214, Evaluation of Results of Tests used to Determine the Strength of Concrete. He
also serves on several technical committees of ASCE and ASTM.
ACI member Shiw S. Singh is working as a Post-Doctoral Fellow at the Center for By-Products
Utilization, Department of Civil Engineering at the University of Wisconsin, Milwaukee. He
received his Ph.D. degree in Solid Biomechanics at the University of Wisconsin, Madison. His
research interest are in the areas of fatigue and fracture, mechanical and durability properties of
concrete made with and without By-Products, and environmental impact assessments.
Mohammad M. Hossain is working as a Research Associate at the Center for By-Products
Utilization, Department of Civil Engineering and Mechanics, University of Wisconsin-Milwaukee.
He received his MS degree from The University of Wisconsin-Milwaukee. His research interests
are by-products utilization in concrete.
-3-
INTRODUCTION
Deterioration of concrete surfaces occurs due to various forms of wear such as erosion,
cavitation, and abrasion due to various exposures. Abrasion wear occurs due to rubbing,
scraping, skidding, or sliding of objects on the concrete surface. This form of wear is observed in
pavements, floors, or other surfaces on which friction forces are applied due to relative motion
between the surfaces and moving objects.
Concrete abrasion resistance is markedly influenced by a number of factors including
concrete strength, aggregate properties, surface finishing, and type of hardeners or toppings. A
large number of previous studies (1-6) have indicated that concrete abrasion resistance is primarily
dependent upon compressive strength of the concrete. The factors such as air entrainment, water-
to-cement ratio, type of aggregates and their properties, etc. that affect the concrete strength,
therefore, should also influence abrasion resistance. According to ACI Committee 201, concrete
subjected to abrasion should have at least 28 MPa compressive strength (1).
In general, hardened paste possesses low resistance to abrasion. In order to develop concrete
for high abrasion resistance, it is desirable to use hard surface material, aggregate, and paste
having low porosity and high strength (2).
Data on the abrasion resistance of concrete is needed to determine appropriate mixture
proportions in order to make abrasion resistant concrete. A limited amount of published work is
available on abrasion resistance of fly ash concrete, especially high-volume Class C fly ash
concrete. Therefore, this project was undertaken to investigate abrasion resistance of concrete
incorporating Class C fly ash.
-4-
RESEARCH SIGNIFICANCE
This research was carried out to evaluate the performance of Class C fly ash in concrete with
respect to strength and abrasion resistance. Concrete strength and abrasion resistance were
determined at various levels of cement replacements with the fly ash. The results obtained in this
investigation would be useful in establishing mixture proportions for Class C fly ash concretes.
LITERATURE REVIEW
It is well established that cement content, water-to-cement ratio, slump, air content, type of
finish, and curing, affect the characteristics of the concrete surface layer including abrasion
resistance (3). Numerous studies (4,5,6) have shown that compressive strength is the most
important factor governing the abrasion resistance of concrete. Witte and Backstrom (5) reported
that for equal strengths, abrasion resistance of air entrained concrete is similar to that of non-air
entrained concrete. Concrete resistance to abrasion is strongly influenced by the relative abrasion
resistance of its constituent materials such as coarse aggregates and mortar (6). Generally,
concretes made with trap rock or granite as aggregates exhibit higher abrasion resistance compared
to the "softer" limestone aggregate concretes.
A number of investigations have shown that both surface finishing techniques and types of
curing practice have a strong influence on abrasion resistance of concrete (7-12). Nanni (13)
indicated that compressive strength is a poor parameter to evaluate abrasion because of influence
of surface finishing and curing conditions. In general, proper finishing and curing practices are
known to enhance the abrasion resistance of concrete considerably.
Nanni (13) evaluated abrasion resistance of roller compacted concrete (RCC) using both
laboratory and field specimens. Fifty percent of the cement was replaced by a Class C fly ash in
-5-
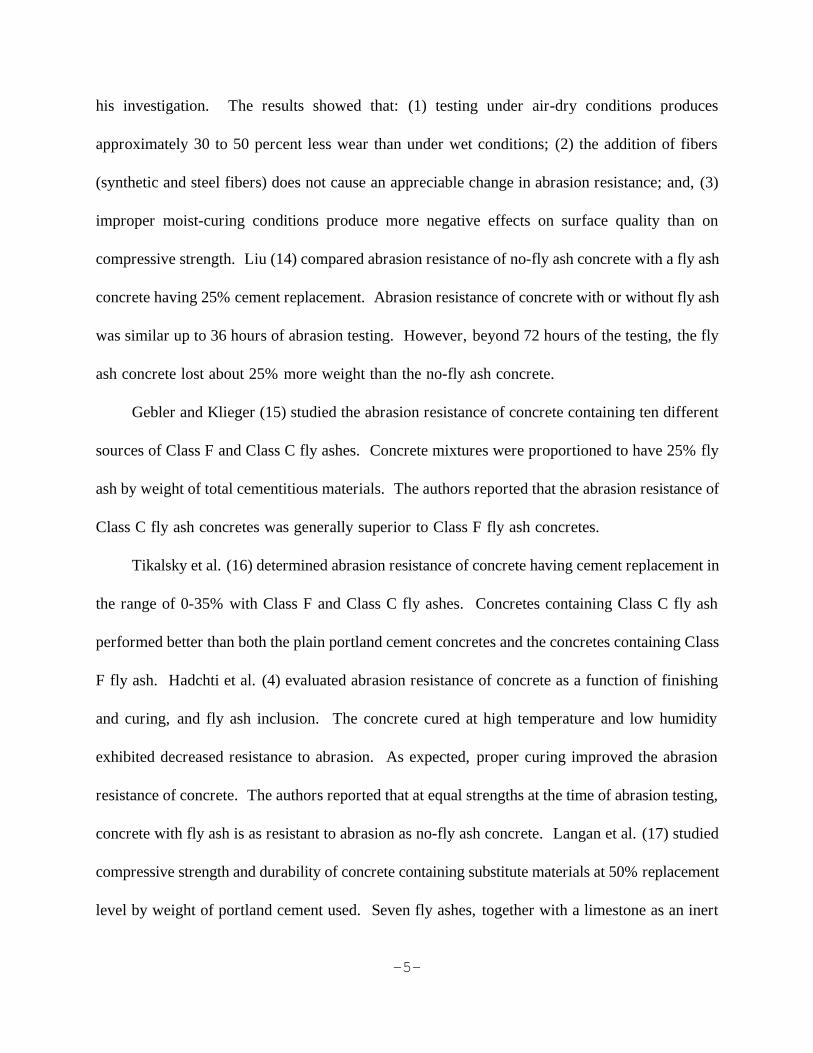
his investigation. The results showed that: (1) testing under air-dry conditions produces
approximately 30 to 50 percent less wear than under wet conditions; (2) the addition of fibers
(synthetic and steel fibers) does not cause an appreciable change in abrasion resistance; and, (3)
improper moist-curing conditions produce more negative effects on surface quality than on
compressive strength. Liu (14) compared abrasion resistance of no-fly ash concrete with a fly ash
concrete having 25% cement replacement. Abrasion resistance of concrete with or without fly ash
was similar up to 36 hours of abrasion testing. However, beyond 72 hours of the testing, the fly
ash concrete lost about 25% more weight than the no-fly ash concrete.
Gebler and Klieger (15) studied the abrasion resistance of concrete containing ten different
sources of Class F and Class C fly ashes. Concrete mixtures were proportioned to have 25% fly
ash by weight of total cementitious materials. The authors reported that the abrasion resistance of
Class C fly ash concretes was generally superior to Class F fly ash concretes.
Tikalsky et al. (16) determined abrasion resistance of concrete having cement replacement in
the range of 0-35% with Class F and Class C fly ashes. Concretes containing Class C fly ash
performed better than both the plain portland cement concretes and the concretes containing Class
F fly ash. Hadchti et al. (4) evaluated abrasion resistance of concrete as a function of finishing
and curing, and fly ash inclusion. The concrete cured at high temperature and low humidity
exhibited decreased resistance to abrasion. As expected, proper curing improved the abrasion
resistance of concrete. The authors reported that at equal strengths at the time of abrasion testing,
concrete with fly ash is as resistant to abrasion as no-fly ash concrete. Langan et al. (17) studied
compressive strength and durability of concrete containing substitute materials at 50% replacement
level by weight of portland cement used. Seven fly ashes, together with a limestone as an inert
-6-
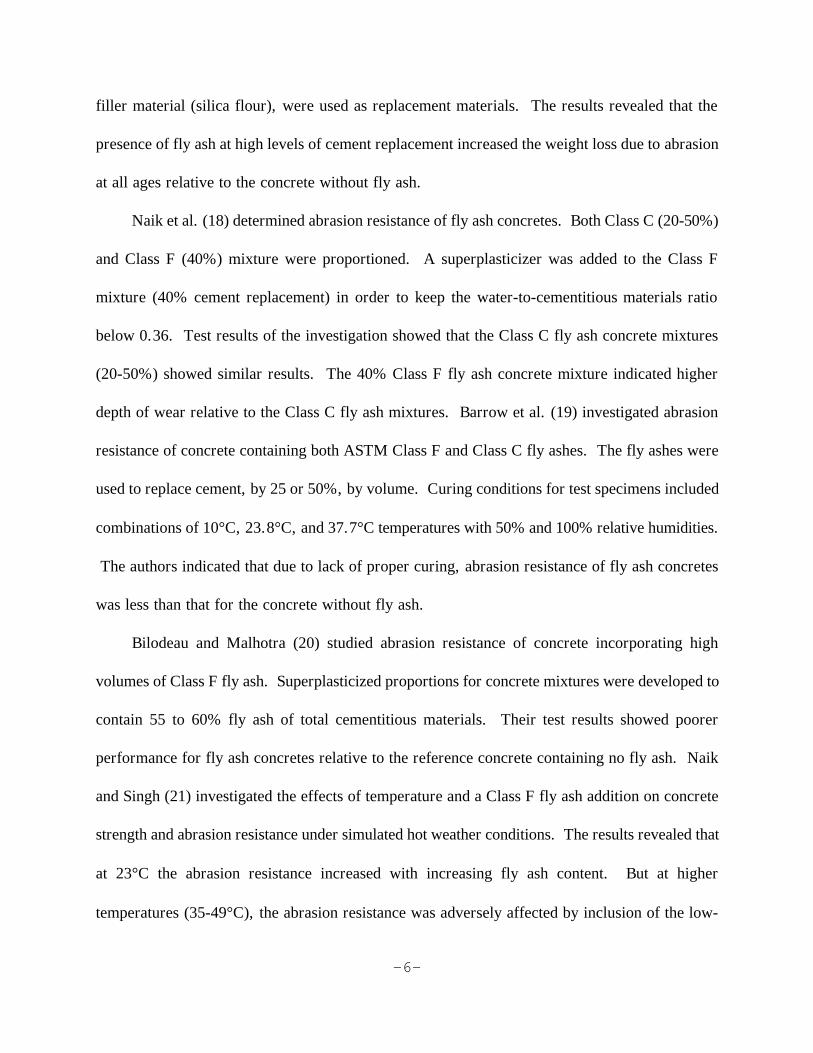
filler material (silica flour), were used as replacement materials. The results revealed that the
presence of fly ash at high levels of cement replacement increased the weight loss due to abrasion
at all ages relative to the concrete without fly ash.
Naik et al. (18) determined abrasion resistance of fly ash concretes. Both Class C (20-50%)
and Class F (40%) mixture were proportioned. A superplasticizer was added to the Class F
mixture (40% cement replacement) in order to keep the water-to-cementitious materials ratio
below 0.36. Test results of the investigation showed that the Class C fly ash concrete mixtures
(20-50%) showed similar results. The 40% Class F fly ash concrete mixture indicated higher
depth of wear relative to the Class C fly ash mixtures. Barrow et al. (19) investigated abrasion
resistance of concrete containing both ASTM Class F and Class C fly ashes. The fly ashes were
used to replace cement, by 25 or 50%, by volume. Curing conditions for test specimens included
combinations of 10°C, 23.8°C, and 37.7°C temperatures with 50% and 100% relative humidities.
The authors indicated that due to lack of proper curing, abrasion resistance of fly ash concretes
was less than that for the concrete without fly ash.
Bilodeau and Malhotra (20) studied abrasion resistance of concrete incorporating high
volumes of Class F fly ash. Superplasticized proportions for concrete mixtures were developed to
contain 55 to 60% fly ash of total cementitious materials. Their test results showed poorer
performance for fly ash concretes relative to the reference concrete containing no fly ash. Naik
and Singh (21) investigated the effects of temperature and a Class F fly ash addition on concrete
strength and abrasion resistance under simulated hot weather conditions. The results revealed that
at 23°C the abrasion resistance increased with increasing fly ash content. But at higher
temperatures (35-49°C), the abrasion resistance was adversely affected by inclusion of the low-
-7-
calcium fly ash. Ukita et al. (22) evaluated abrasion resistance of concrete incorporating a low-
calcium fly ash in the range of 0-35% of cement by volume. Test results indicated that at a 15%
cement replacement with fly ash, the abrasion resistance increased with the fineness of fly ash.
However, at the fly ash content of 30%, the abrasion resistance of concrete was lower than that
for the no-fly ash concrete.
Carette et al. (23) studied abrasion resistance of air entrained superplasticized high-volume
Class F fly ash concrete. The amount of fly ash ranged from 55 to 60% of the total cementitious
materials. The authors indicated that some concretes exhibited significantly lower abrasion
resistance than other concretes of similar or even lower compressive strength.
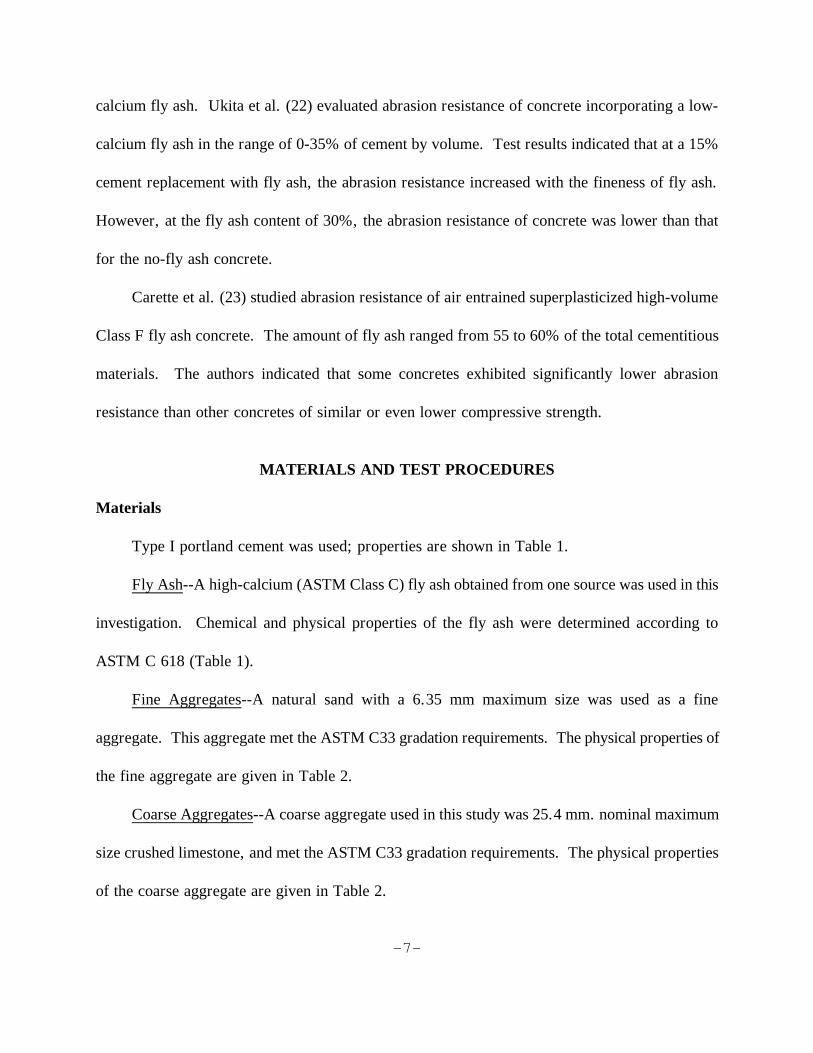
MATERIALS AND TEST PROCEDURES
Materials
Type I portland cement was used; properties are shown in Table 1.
Fly Ash--A high-calcium (ASTM Class C) fly ash obtained from one source was used in this
investigation. Chemical and physical properties of the fly ash were determined according to
ASTM C 618 (Table 1).
Fine Aggregates--A natural sand with a 6.35 mm maximum size was used as a fine
aggregate. This aggregate met the ASTM C33 gradation requirements. The physical properties of
the fine aggregate are given in Table 2.
Coarse Aggregates--A coarse aggregate used in this study was 25.4 mm. nominal maximum
size crushed limestone, and met the ASTM C33 gradation requirements. The physical properties
of the coarse aggregate are given in Table 2.

-8-
Chemical Admixtures--A commercially available melamine-based superplasticizer was
used. A resin-type air entraining admixture was used in all the mixtures.
MIXTURE PROPORTIONS
A total of eleven different mixtures were produced. Three of them were control mixtures,
and the other eight mixtures contained ASTM Class C fly ash. Mixtures with fly ash were
proportioned on the basis of using 1.25 parts of fly ash by weight for each part of portland cement
by weight replaced. The proportions of Portland cement replaced ranged from 15 to 70%. The
mixture proportions are given in Table 4. The control mixture without fly ash was proportioned
to have the 28-day compressive strength of 41 MPa. The water-to-cementitious materials ratio
[w/(c+f)] was maintained at 0.35 ± 0.02 and air content was kept at 6 ± 1% for the primary
mixtures. The mixtures which did not meet the target water-to-cementitious materials ratio and/or
air content requirements were classified as secondary mixtures. The primary mixtures only were
used for data analysis and to derive the main conclusions from this study. The secondary mixtures
were only used to evaluate the effect of air content on concrete strength and abrasion resistance.
Production scale concrete batches of 0.76 m3 each were mixed in a power-driven revolving-paddle
mixer in accordance with ASTM C 192 at a precast concrete plant.
CASTING AND CURING OF TEST SPECIMENS
Slab specimens (305 x 305 x 102 mm) were cast for abrasion resistance determinations, and
compressive strength test cylinders (152 x 305 mm) were cast according to ASTM C 192. The
abrasion test specimens were cast using an internal and external vibrator. After casting, all test

-9-
specimens were finished with a steel trowel. Immediately after finishing, the specimens were
covered with plastic to minimize their moisture loss. All the test specimens were stored at
temperatures of about 21°C in the casting room area of the precast concrete plant. They were
demolded after 24 hours. They were then put into a moist curing room at 23°C temperature with
100 percent relative humidity until the time of test. The 70% fly ash mixture specimens were
demolded after 11 days of curing under the casting room conditions (21°C) due to slow setting.
FRESH CONCRETE PROPERTIES
Fresh concrete properties such as slump, unit weight, temperature, and air content were
determined according to applicable ASTM test methods. The results are presented in Table 3.
HARDENED CONCRETE PROPERTIES
Compressive strength of test cylinder, after capping with sulfur compound were tested for
compressive strength according to ASTM C 39 test method. Test results are reported in Table 4.
The abrasion resistance tests were performed at 28, 91, and 365 days. The tests were
conducted on the molded surface of the slab to get uniform finish surface for the test specimens.
All specimens were tested at dry condition by the ASTM C 944 test method. Three separate test
areas were tested on the same face of the specimen. The rotating cutter consisted of 24 grinding
dressing wheels. The rotating cutter having washers with a diameter equal to that of the dressing
wheels, produced depth of abrasion about 1 mm after about 60 minutes of exposure to the abrasive
force. This was considered too slow. Therefore, it was decided to develop an accelerated
technique, especially for concrete having high resistance to abrasion similar to one used in this
study. This revised method was equipped with washers having smaller diameter relative to the

-10-
dressing wheels. Furthermore, an amount (approximately one teaspoon) of silica sand ("Ottawa
Sand" max. size 0.8 mm) was added to the concrete surface during exposure to abrasion at one
minute intervals. At each wear location (circle of wear), for each wear time, three readings were
taken at two points in the circle; and, the average of these six readings were recorded as one data
point for each wear circle at the measured time of wear, Tables 5, 6, and 7.
TEST RESULTS AND DISCUSSIONS
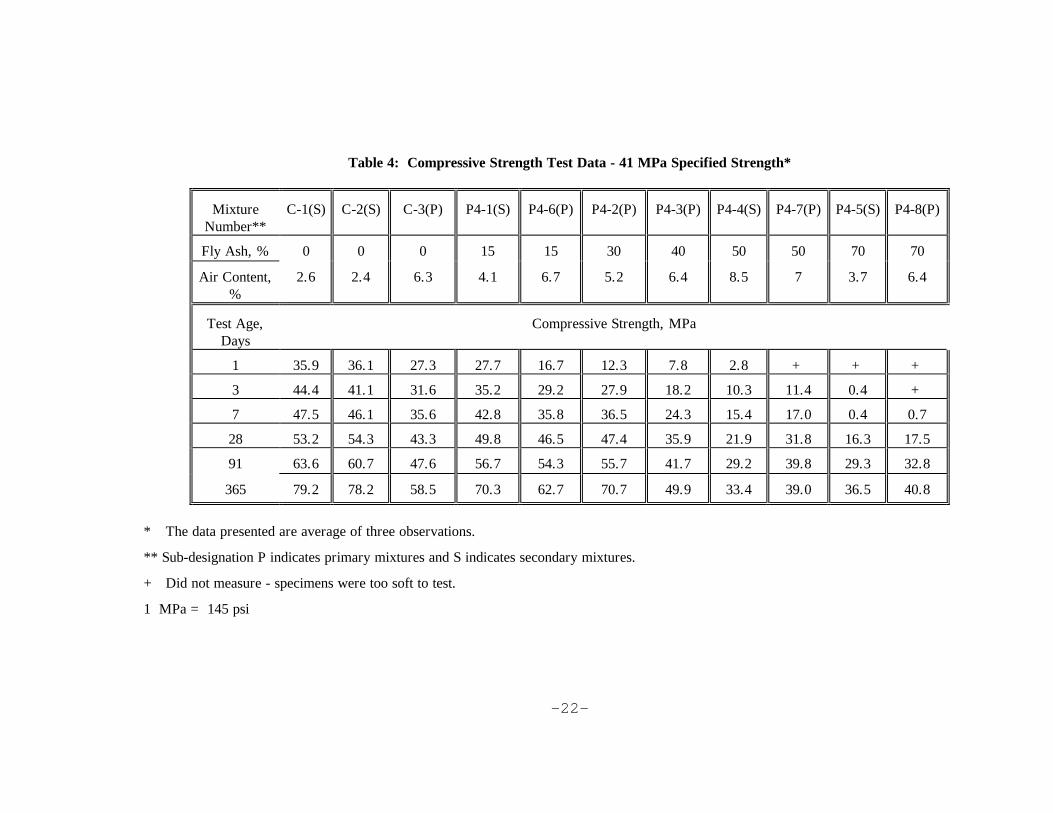
The compressive strengths were measured at the ages of 1, 3, 7, 28, 91, and 365 days.
Compressive strengths of primary mixtures are shown in Fig. 1 and 2. As anticipated,
compressive strength test results show that the 1-day compressive strength of fly ash mixtures
were substantially lower compared to the reference mixture (Mix No. C-3); it decreased with
increasing fly ash content, probably primarily because sufficient cementitious action of the Class C
fly ash was not yet activated.
The 3-day test results for up to 30 percent cement replacement (Mix No. P4-6 and P4-2)
were comparable to the no-fly ash concrete (Mix No. C-3). However, a substantial decrease in
the 3-day strength was observed when fly ash content was increased to replace 40% cement or
higher. The 3-day compressive strength for the 70% fly ash mixture (Mix P4-8) was not
determined because the concrete specimens were "soft". Similar trends were also observed at the
7-day age.
The 28-day peak strength was obtained for the 30 percent fly ash replacement concrete (Mix
No.P4-2). Beyond the 30% cement replacement, the compressive strength of concrete decreased
with increasing amounts of fly ash up to 70% cement replacement at the 28-day age. The 40 and

-11-
50% fly ash mixtures, however, attained the 28-day strengths in excess of 31 MPa, well suited for
many structural uses.
The 91-day peak strength was also obtained for the 30 percent fly ash replacement concrete.
The 40 percent fly ash mixture attained slightly lower strength compared to the no-fly ash
concrete at this age. The 91-day strengths for both 50 and 70 percent fly ash concrete mixtures
were 40 and 33 MPa, respectively, which are quite suitable for most structural uses. The strength
results of the mixtures at 365 days followed the similar trend as that observed at 91 days.
As expected, compressive strength of concrete decreased as air content increased, especially
above the 7-day age (Table 4). However, for the lower strength 70% fly ash mixture the effect of
increased air content was negligible within experimental range (Fig. 3).
All concrete mixtures tested in this investigation showed excellent abrasion resistance, when
tested in accordance with ASTM C 944. Their depth of abrasion remained less than 1 mm.
In order to determine relative abrasion resistance for all the concrete mixtures, the modified
method established for this work was utilized (21). The test was stopped at 60 minutes or 3 mm
wear, whichever occurred first. The abrasion tests were performed at the ages of 28, 91, and 365
days. The average depth of wear for test specimens for all the mixtures are presented in Tables 5
through 7.
Fig. 4 to 7 present the abrasion resistance for the six primary mixtures. In general abrasion
wear decreased (i.e., abrasion resistance increased) with increasing age. Test results show that
concrete mixtures up to 30 percent cement replacement by fly ash had abrasion resistance similar
to that for the no-fly ash concrete. Beyond 30% cement replacement, it decreased slightly up to

-12-
50 percent cement replacement. The 70% Class C fly ash mixture exhibited the lowest abrasion
resistance of all the mixtures tested in this work, primarily because of its lower compressive
strength.
All the abrasion test results showed that the compressive strength was an important factor
affecting abrasion resistance of concrete mixtures. Fig. 8 shows that depth of wear decreased
linearly as compressive strength increased, without regard to the fly ash content.
The effect of air content on abrasion resistance of concretes is depicted in Fig. 9. The
results show that variation in air content did not have any appreciable effect on the abrasion
resistance of the concretes within the tested range.
CONCLUSIONS
1. Compressive strength of fly ash concrete containing up to 50% cement replacement was very
acceptable for most structural applications.
2. Compressive strength of concrete decreased with increasing air content, except for the 70%
fly ash concrete.
3. Abrasion resistance of concrete was strongly affected by its compressive strength,
irrespective of fly ash content.
4. Fly ash concrete up to 30% cement replacement exhibited abrasion resistance similar to the
concrete without fly ash, at the 28-day, 91-day, and 365-day ages.
5. Abrasion resistance of fly ash concrete with 40, 50 and 70 percent cement replacement was
lower than the no-fly ash concrete.

-13-
6. Effect of air content on abrasion resistance of concrete was insignificant within the tested
range.

-14-
ACKNOWLEDGEMENT
The authors express their gratitude to EPRI for providing financial support for this project. They
would also like to thank Dean M. Golden and Michael J. Miller of EPRI for their interest and help
during this investigation. Thanks are due to Advanced Caststone Company for providing materials
and facilities for manufacture of test specimens used in this investigation.
The authors would also like to thank the College of Engineering and Applied Science and the
Graduate School of the University of Wisconsin-Milwaukee for providing partial funding and
facilities for conducting this research work.
Additional funding for this project was also provided by the primary sponsors of the Center for
By-Products Utilization : Dairyland Power Cooperative, LaCrosse, Wisconsin; Madison Gas and
Electric Company, Madison, Wisconsin; National Minerals Corporation, St. Paul, Minnesota;
Northern States Power Company, Eau Claire, Wisconsin; Wisconsin Electric Power Company,
Milwaukee, Wisconsin; Wisconsin Power and Light Company, Madison, Wisconsin; and,
Wisconsin Public Service Corporation, Green Bay, Wisconsin. Their continuing help and interest
in the activities of CBU is gratefully acknowledged.
CONVERSION FACTORS
1 mm = 0.0394 in.
1 MPa = 145 Psi
1 kg/m3 = 1.6855 lb/yd3

-15-
REFERENCES
1. ACI Committee 201 Report, "Guide to Durable Concrete", Title No. 74-53, American
Concrete Institute, December 1977.
2. Mehta, P.K., Concrete Structure, Properties and Materials, Prentice-Hall International
Series in Civil Engineering and Engineering Mechanics, 3rd Edition, 1986, 450 pages.
3. Prior, M.E., "Abrasion Resistance: Significance of Tests and Properties of Concrete and
Concrete-Making Materials", ASTM STP-169A, ASTM, Philadelphia, 1966, pp. 246-260.
4. Hadchti, K.M. and Carrasquillo, R.L., "Abrasion Resistance and Scaling Resistance of
Concrete Containing Fly Ash", Center for Transportation Research, Bureau of Engineering
Research, University of Texas at Austin, Research Report: 481-3, August 1988, 185 pages.
5. Witte, L.P. and Backstrom, J.E., "Some Properties Affecting the Abrasion Resistance of
Air-Entrained Concrete", ASTM Proceedings, Vol. 51, 1951, pp. 1141-1155.
6. Laplante, P., Aifcin, P.C., and Vezina, "Abrasion Resistance of Concrete", Journal of
Materials in Civil Engineering, Vol. 3, No. 1, February 1991, pp. 19-30.
7. Ytterburg, R.F., "Wear-Resistant Industrial Floors of Portland Cement Concrete", Civil
Engineering - ASCE, V. 41, No. 1, Jan. 1971, pp. 68-71.
8. Nanni, A., "Curing of Roller Compacted Concrete and Strength Development", Journal of
Transportation Engineering, ASCE, V. 114, No. 6, Nov. 1988, pp. 684-694.
9. Fentress, B., "Slab Construction Practice Compared by Wear Tests", ACI Journal,
Proceedings V.70, No. 7, July 1973, pp. 486-491.

-16-
10. Kettle, R., and Sadegzadah, M., "The Influence of Construction Procedures on Abrasion
Resistance", ACI Special Publication No. SP-100, American Concrete Institute, Detroit,
1987, pp. 1385-1410.
11. Senbetta, E., and Malchow, G., "Studies on Control of Durability of Concrete Through
Proper Curing", Proceedings of the Katharine and Bryant Mather Intl. Conference on
Concrete Durability, ACI Special Publication No. SP-100, American Concrete Institute,
Detroit, Vol. 1, 1987, pp. 73-87.
12. Sadeyzadeh, M., Page, C.L., and Kettle, R.J., "Surface Microstructure and Abrasion
Resistance of Concrete", Cement and Concrete Research, Vol. 17, No. 4, July 1987, pp.
581-590.
13. Nanni, A., "Abrasion Resistance of Roller Compacted Concrete", ACI Materials Journal,
Vol. 86, No. 53, Nov.-Dec. 1989, pp. 559-565.
14. Liu, T.C., "Abrasion Resistance of Concrete", ACI Journal, Proc. Vol. 78, No. 5, 1981,
pp. 341-350.
15. Gebler, S.H., and Klieger, Paul, "Effect of Fly Ash on Physical Properties of Concrete",
Proceedings of the CANMET/ACI Second International Conference on the Use of Fly Ash,
Silica Fume, Slag, and Natural Pozzolans in Concrete, Madrid, Spain, V.M. Malhotra, Ed.,
Vol. 1, ACI Special Publication No. SP-91, 1986, pp. 1-50.
16. Tikalsky, P.J., Carrasquillo, P.M., and Carrasquillo, R.L., "Strength and Durability
Considerations Affecting Mix Proportioning of Concrete Containing Fly Ash", ACI
Materials Journal, Vol. 85, No. 6, November-December 1988, pp. 505-511.

-17-
17. Langan, B.W., Joshi, R.C., and Ward, M.A., "Strength and Durability of Concrete
Containing 50% Portland Cement Replacement by Fly Ash and other Materials", Canadian
Journal of Civil Engineering, Vol. 17, 1990, pp. 19-27.
18. Naik, T.R., Ramme, B.W., and Tews, J.H., "Pavement Construction with High Volume
Class C and Class F Fly Ash Concrete", Presented at the CANMET/ACI Fourth International
Conference on the Use of Fly Ash, Silica Fume, Slag and Natural Pozzolans in Concrete,
Istanbul, Turkey, May, 1992.
19. Barrow, R.S., Hadchiti, K.M., Carrasquillo, P.M., and Carrasquillo, R.L., "Temperature
Rise and Durability of Concrete Containing Fly Ash", Proceedings of the CANMET/ACI
Third International Conference on the Use of Fly Ash, Silica Fume, Slag and Natural
Pozzolans in Concrete, Trondheim, Norway, Vol. 1, 1989, pp. 331-348.
20. Bilodeau, A. and Malhotra, V.M., "Concrete Incorporating High Volumes of ASTM Class
F Fly Ashes: Mechanical Properties and Resistance to Deicing Salt Scaling and to Chloride-
ion Penetration", Proceedings of the CANMET/ACI Fourth International Conference on the
Use of Fly Ash, Silica Fume, Slag and Natural Pozzolans in Concrete, Istanbul, Turkey,
V.M. Malhotra, Ed. Vol. 1, ACI Special Publication SP-132, 1992, pp. 319-349.
21. Naik, T.R., and Singh, S.S., "Effects of Inclusion of Fly Ash on Abrasion Resistance of
Concrete", Proceedings of the Second CANMET/ACI Conference on Durability of Concrete,
Montreal, Canada, Supplementary Paper, August 1991, pp. 683-707.

-18-
22. Ukita, K., Shigematsu, S., and Ishic, M., "Improvements in the Properties of Concrete
Utilizing Classified Fly Ash", Proceedings of the CANMET/ACI Third International
Conference on the Use of Fly Ash, Silica Fume, Slag and Natural Pozzolans in Concrete,
Trondheim, Norway, Vol. 1, 1989, pp. 219-240.
23. Carette, G.G., Bilodeau, A., Cheurier, R., and Malhotra, V.M., "Mechanical Properties of
Concrete Incorporating High Volumes of Fly Ash From Sources in the U.S.A.",
Supplemental Proceedings, CANMET/ACI Fourth International Conference on the Use of Fly
Ash, Silica Fume, Slag, and Natural Pozzolans in Concrete, EPRI-Report No. TR-100577,
March 1992, pp. 1-33.
24. "Annual Book of ASTM Standards", Construction, Concrete and Aggregates, Section 4,
Vol. 04.02, 1988.

-19-
Table 1: Properties of Cement and Fly Ash Used
Chemical Composition
Cement, Percent
ASTM C
150, Type I
Fly Ash, Percent
ASTM C
618 Silicon Dioxide, SiO2
20.2
-
30.5
-
Aluminum Oxide, Al2O3
4.7
-
17.2
- Ferric Oxide, Fe2O3
0.3
-
5.5
-
Total, SiO2 + Al2O3 + Fe2O3
25.2
-
53.2 50.0 Min.
Sulfur Trioxide, SO3
+
3.0 Max.
+ 5.0 Max.
Calcium Oxide, CaO
64.1
-
28.6
- Magnesium Oxide, MgO
0.9
6.0 Max.
4.7
5.0 Max.
Titanium Dioxide, TiO2
0.3
-
1.6
- Potassium Oxide, K2O
0.1
-
0.4
-
Sodium Oxide, Na2O
0.1
-
2.0 1.5 Max.
Moisture Content
-
-
0.1 3.0 Max.
Loss on Ignition
-
3.0 Max.
0.3 6.0 Max.
Physical Properties of Cement Air Content (%)
7.1
12 Max.
-
-
Fineness (m2/kg)
396
280 Min.
-
- Autoclave Expansion (%)
0.03
0.8 Max.
-
-
Specific Gravity
3.16
-
-
- Compressive Strength, MPa 1-day 3-day 7-day 28-day
16.2 25.7 31.5 37.9
-
12.4 Min. 19.3 Min.
-
- - - -
- - - -
Vicat Time of Initial Set (min)
145 45 Min., 375
Max.
-
-
Physical Properties of Fly Ash Fineness Retained on No. 325 Sieve (%)
-
-
18.6
34 Max.
Pozzolanic Activity Index with Cement 28-day (% of control)
-
-
105
75 Min.
Water Requirement (% of Control)
-
-
90.4
105 Max.
Autoclave Expansion (%)
-
-
0.02
0.8 Max.
Specific Gravity
-
-
2.78
-
Note: + Data is not available

-20-
1 MPa = 145 Psi

-21-
Table 2: Physical Properties of Aggregates
Aggregates
Bulk
Specific Gravity
Bulk
Specific Gravity (SSD)
Apparent Specific Gravity
SSD
Absorption (%)
Dry Rodded Unit Weight
(Kg/m3)
Percent voids (%)
Fineness Modulus
Fine Aggregates
2.54
2.57
2.62
1.25
1765
30.5
2.66
Coarse Aggregates
2.76
2.78
2.84
1.07
1755
36.4
3.40
1 kg/m3 = 0.0624 lb/ft.3
Table 3: Mixture Proportions Using Pleasant Prairie Power Plant ASTM Class C (P-4) Fly Ash - 41
MPa Specified Strength*
Mixture Number
C-1(S)
C-2(S)
C-3(P)
P4-1(S)
P4-2(P)
P4-3(P)
P4-4(S)
P4-5(S)
P4-6(P)
P4-7(P)
P4-8(P)
Cement (kg/m3)
398
397
375
328
259
220
174
107
320
179
110
Fly Ash (kg/m3)
0
0
0
72
139
182
216
310
71
226
316
Water (kg/m3)
123
125
135
139
133
150
141
153
129
136
155
[w/(c+f)]
0.31
0.32
0.36
0.35
0.34
0.37
0.36
0.37
0.33
0.33
0.36
Sand, SSD (kg/m3)
715
712
682
695
677
659
624
637
693
655
607
25 mm aggregates, SSD (kg/m3)
1259
1264
1182
1207
1172
1153
1099
1128
1180
1139
1145
Slump (mm)
25
45
120
65
160
120
55
75
145
115
120
Air Content (%)
2.6
2.4
6.3
4.1
5.2
6.4
8.5
3.7
6.7
7
6.4
Superplasticizer (L/m3)
2.7
2.7
2.9
2.9
2.8
2.7
2.6
2.6
2.8
2.7
2.6
Air Entraining Agent
(ml/m3)
280
330
270
300
350
515
810
905
420
885
1380
Air Temperature (°C)
20
20
21
21
21
21
26
26
-
-
-
Concrete Temperature (°C)
20
20
23
23
23
26
26
26
21
26
25
Fresh Concrete Density
(kg/m3)
2500
2500
2380
2445
2395
2360
2250
2335
2400
2335
2365
Hardened Concrete Density, SSD (kg/m3)
2515
2510
2470
2510
2430
2415
2280
2300
2440
2340
2325
* Sub-designation P indicates primary mixtures and S indicates secondary mixtures.
1 kg/m3 = 1.6855 lb/yd3; 1 mm = 0.0394 in.; ml/m3 = 0.026 U.S. fl oz./yd3
L/m 3 = 25.9 U.S. fl oz/yd3; tc = (tf - 32)/1.8.
-22-
Table 4: Compressive Strength Test Data - 41 MPa Specified Strength*
Mixture
Number**
C-1(S)
C-2(S)
C-3(P)
P4-1(S)
P4-6(P)
P4-2(P)
P4-3(P)
P4-4(S)
P4-7(P)
P4-5(S)
P4-8(P)
Fly Ash, %
0
0
0
15
15
30
40
50
50
70
70
Air Content,
%
2.6
2.4
6.3
4.1
6.7
5.2
6.4
8.5
7
3.7
6.4
Test Age,
Days
Compressive Strength, MPa
1
35.9
36.1
27.3
27.7
16.7
12.3
7.8
2.8
+
+
+
3
44.4
41.1
31.6
35.2
29.2
27.9
18.2
10.3
11.4
0.4
+
7
47.5
46.1
35.6
42.8
35.8
36.5
24.3
15.4
17.0
0.4
0.7
28
53.2
54.3
43.3
49.8
46.5
47.4
35.9
21.9
31.8
16.3
17.5
91
63.6
60.7
47.6
56.7
54.3
55.7
41.7
29.2
39.8
29.3
32.8
365
79.2
78.2
58.5
70.3
62.7
70.7
49.9
33.4
39.0
36.5
40.8
* The data presented are average of three observations.
** Sub-designation P indicates primary mixtures and S indicates secondary mixtures.
+ Did not measure - specimens were too soft to test.
1 MPa = 145 psi

-23-
Table 5: Abrasion Resistance Test Results Obtained by Using the Accelerated Test Method
at 28-Day Age
Mixture Number* C-1(S)
C-2(S)
C-3(P)
P4-1(S)
P4-2(P)
P4-3(P)
P4-4(S)
P4-5(S)
P4-6(P)
P4-7(P)
P4-8(P)
Ash, %
0
0
0
15
30
40
50
70
15
50
70
, Minutes
Depth of Wear,mm
5
0.11
0.10
0.23
0.14
0.14
0.18
0.34
0.44
0.18
0.23
0.30
10
0.26
0.26
0.46
0.36
0.34
0.49
0.57
1.00
0.32
0.63
0.68
15
0.64
0.41
0.69
0.52
0.50
0.78
0.90
1.38
0.54
0.92
1.29
20
1.04
0.63
0.82
0.70
0.66
1.00
1.09
1.71
0.64
1.11
1.40
25
1.17
0.75
1.01
0.92
0.85
1.27
1.38
1.90
0.90
1.27
1.89
30
1.45
0.88
1.11
1.08
1.02
1.58
1.63
2.34
1.03
1.49
2.00
35
1.65
1.04
1.28
1.24
1.18
1.77
1.86
2.63
1.18
1.58
2.35
40
1.88
1.21
1.39
1.39
1.33
2.01
2.04
2.94
1.33
2.16
2.81
45
1.99
1.33
1.57
1.62
1.50
2.18
2.22
-
1.49
2.34
3.04
50
2.17
1.50
1.75
1.78
1.74
2.28
2.44
-
1.65
2.56
-
55
2.28
1.67
1.89
1.96
1.88
2.45
2.62
-
1.80
2.72
-
60
2.42
1.85
2.06
2.16
2.05
2.56
2.76
3.68
1.95
2.85
3.55
* Sub-designation P indicates primary mixtures and S indicates secondary mixtures.
1 mm = 0.0394 in.
Table 6: Abrasion Resistance Test Results Obtained by Using the Accelerated Test Method at 91-Day
Age
Mixture Number* C-1(S)
C-2(S)
C-3(P)
P4-1(S)
P4-2(P)
P4-3(P)
P4-4(S)
P4-5(S)
P4-6(P)
P4-7(P)
P4-8(P)
Ash, %
0
0
0
15
30
40
50
70
15
50
70
, Minutes
Depth of Wear,mm
0.08
0.08
0.14
0.06
0.05
0.08
0.20
0.22
0.1
0.22
0.34
10
0.23
0.23
0.29
0.26
0.17
0.29
0.46
0.48
0.27
0.57
0.61
15
0.43
0.45
0.49
0.41
0.35
0.54
0.74
0.74
0.53
0.88
0.96
20
0.55
0.62
0.75
0.62
0.53
0.78
0.96
0.90
0.64
1.10
1.25
25
0.72
0.75
0.96
0.79
0.76
1.01
1.18
1.15
0.82
1.50
1.51
30
0.94
0.90
1.10
0.94
0.90
1.18
1.37
1.39
0.99
1.65
1.68
35
1.13
1.03
1.24
1.11
1.04
1.29
1.55
1.64
1.10
1.77
1.89
40
1.27
1.12
1.39
1.27
1.18
1.50
1.74
1.85
1.26
2.01
2.03
45
1.37
1.27
1.46
1.44
1.31
1.71
1.92
2.04
1.39
2.16
2.16
50
1.50
1.41
1.58
1.53
1.48
1.85
2.04
2.24
1.50
2.27
2.32
55
1.64
1.50
1.68
1.65
1.64
1.97
2.21
2.38
1.59
2.33
2.47
60
1.80
1.63
1.77
1.75
1.70
2.08
2.34
2.54
1.71
2.41
2.59
* Sub-designation P indicates primary mixtures and S indicates secondary mixtures.
1 mm = 0.0394 in.

-24-
Table 7: Abrasion Resistance Test Results Obtained by Using the Accelerated
Test Method at 365-Day Age
Mixture Number* C-1(S)
C-2(S)
C-3(P)
P4-1(S)
P4-2(P)
P4-3(P)
P4-4(S)
P4-5(S)
P4-6(P)
P4-7(P)
P4-8(P)
Ash, %
0
0
0
15
30
40
50
70
15
50
70
, Minutes
Depth of Wear,mm 0.07
0.08
0.14
0.11
0.18
0.23
0.41
0.28
0.11
0.24
0.47
0.19
0.24
0.22
0.35
0.47
0.66
0.77
0.62
0.28
0.57
1.00
0.28
0.35
0.18
0.48
0.46
0.90
0.98
0.90
0.41
0.85
1.33
0.37
0.49
0.40
0.60
0.62
1.19
1.30
1.27
0.65
1.05
1.67
0.42
0.63
0.57
0.81
0.73
1.42
1.51
1.52
0.85
1.27
1.87
0.56
0.76
0.64
0.93
0.90
1.54
1.63
1.79
1.02
1.43
2.07
0.71
0.85
0.73
1.11
1.03
1.78
1.77
2.09
1.18
1.61
2.40
0.84
0.96
0.78
1.30
1.19
1.94
1.99
2.27
1.24
1.74
2.60
1.08
1.04
1.04
1.57
1.22
2.05
2.15
2.46
1.35
1.94
2.74
1.19
1.17
1.11
1.71
1.37
2.22
2.35
2.59
1.49
2.00
2.96
1.17
1.28
1.26
1.84
1.49
2.50
2.56
2.76
1.67
2.30
3.07
1.44
1.36
1.43
1.94
1.50
2.68
2.66
3.02
1.81
2.47
3.34
* Sub-designation P indicates primary mixtures and S indicates secondary mixtures.
1 mm = 0.0394 in.

-25-
LIST OF FIGURES Fig. 1 Compressive strength versus age (1 MPa = 145 psi) Fig. 2 Compressive strength versus percentage of cement replacement with fly ash (1 MPa =
145 psi) Fig. 3 Compressive strength versus cement replacement with fly ash for concrete containing
different percentages of air content (1 MPa = 145 psi) Fig. 4 Abrasion resistance versus cement replacement with fly ash (1 mm = 0.0394 in) Fig. 5 Depth of wear versus time for fly ash concretes at 28 days (1 mm = 0.0394 in.) Fig. 6 Depth of wear versus time for fly ash concrete at 91 days ( 1 mm = 0.0394 in.) Fig. 7 Depth of wear versus time for fly ash concretes at 365 days (1 mm = 0.0394 in.) Fig. 8 Abrasion resistance versus compressive strength of concretes containing different
percentages of fly ash (1 MPa = 145 psi; 1 mm = 0.0394 in.) Fig. 9 Abrasion resistance versus cement replacement with fly ash containing different
percentage of air content (1 mm = 0.0394 in.)