Embed Size (px)
Citation preview
1
The Linked World: Working Paper Series
About The Linked World Project
Information and communication technology (ICT) has decisively established itself as a general purpose tech-nology—one that affects an entire economy. Over the past four decades, ICT has spurred dramatic changes that will continue for the foreseeable future. Harder to predict, though, is the exact nature of those changes, and how they will play out across societies—in our economies, our cultural relationships and the way human beings interact.
This notion formed the basic motivation for embarking on the study, which the Telefónica Foundation agreed to underwrite in 2008. The purpose of The Linked World: How ICT Is Transforming Societies, Cultures, and Economies is to take stock of our knowledge on what the economic, social, and cultural impacts of ICT will be. How has it evolved, how much have we been able to quantify or to evaluate in a qualitative sense, and what does it mean for the challenges and opportunities ahead?
The Linked World: How ICT Is Transforming Societies, Cultures, and Economies is the result of a two-year global research project led by The Conference Board and underwritten by the Telefónica Foundation.
This working paper is one of a global series that forms the basis of the book The Linked World: How ICT Is Transforming Societies, Cultures, and Economies published by the Telefónica Foundation and Artel Press.
For more information about this project, including video summaries and online forums please go to: www.ictlinkedworld.com
Impact of ICT on Production of Goods and Services:
The Global Broadband Bonus: Broadband
Internet’s Impact on Seven Countries
By Shane Greenstein (Northwestern University) and Ryan McDevitt (University of
Rochester)

2
The Global Broadband Bonus: Broadband Internet’s Impact on Seven Countries
Shane Greenstein (Northwestern University) and Ryan McDevitt (University of Rochester)
Throughout the world during the first decade of this century, many household switched their mode of
accessing the Internet from dial‐up to broadband. The upgrade to broadband motivates a
straightforward question: What was the contribution of broadband to the creation of new economic
value? To answer this question, estimates must be derived of two separate quantities – new gross
domestic product (GDP) and new consumer surplus.
Greenstein and McDevitt (2009) provide estimates of the economic value in the U.S. created by the
diffusion of broadband from 1999 to 2006.1 The findings suggested that broadband had created
considerable value. We observe $39 billion of total revenue in Internet access in 2006, with broadband
accounting for $28 billion of this total. Depending on the estimate, households generated $20 to $22
billion of the broadband revenue. Approximately $8.3 to $10.6 billion was additional revenue created
between 1999 and 2006. That replacement is associated with $4.8 to $6.7 billion in consumer surplus,
which is not measured via Gross Domestic Product (GDP). An Internet‐access Consumer Price Index (CPI)
would have to decline by 1.6% to 2.2% per year for it to reflect the creation of value.
This prior research motivates questions about whether similar patterns arise in countries other than the
U.S. In this project we propose to ask a similar question about six additional countries, Canada, the U.K.,
Spain, Mexico, Brazil and China. We chose these six because they vary in their circumstances and their
economies represent typical experiences in the high‐income and middle‐income countries of the world.
We bring the analysis as forward into the present as data permits. That leads us to modify the methods
used in Greenstein and McDevitt (2009). Here we employ a method that accommodates the range of
experience in these countries.
As with the prior work, we focus on estimating the revenue growth and consumer surplus affiliated with
broadband’s diffusion to households. We are drawn to that because these economic gains from new
technology are not otherwise readily visible. In this report we explain how the method and data were
modified to accommodate all seven counties. We also consider the strengths and drawbacks of this
approach, as well as why some extensions require modification. The report then presents results based
on these estimates.
In general, we find that the broadband bonus in other countries is comparable to the size of the
broadband economies in those countries. Countries with large Internet economies, such as the United
States and China, are receiving large economic bonuses from investment in broadband. Countries with
smaller Internet economies, such as Canada, the U.K., and Spain receive smaller levels of bonuses, but
bonuses in proportion to the scale of use of the Internet.
1 All data and figures in this chapter refer to fixed broadband internet, as opposed to mobile broadband,
unless explicitly noted otherwise.

3
The report closes with a discussion about extending these methods to the measurement of the gains
from the diffusion of mobile broadband in many countries. We identify the primary issues preventing
such an exercise as of this writing, and we speculate about the types of issues that will arise when
measurement becomes feasible.
The diffusion of the Internet
To familiarize readers with this technology and market, we provide a picture of deployment, adoption,
and revenue generation for broadband.2 This experience provides a benchmark for further analysis.
The data tell a story of technology diffusion and upgrade. The diffusion of dial‐up coincided with the
initial use of the Internet in most households. The diffusion of broadband came a few years later and,
for households in several dozen developed economies, involved an upgrade of the bandwidth.
During the 2003 to 2009 period, broadband service was delivered to households primarily in two forms
of wire‐line service — over cable or telephone lines. Countries differed significantly in the extent to
which these different delivery channels played a role. At the end of the period there was growing use of
a third and fourth delivery channel, fiber to the home, and access with mobile modes.3 Some cable firms
built out their facilities to deliver these services in the late 1990s, and many—especially telephone
companies—waited until the early to mid 2000s.
Cable modem service involved a gradual upgrade to cable plants in many locales, depending on the
generation of the cable system.4 Broadband over telephone lines involved upgrades to telephone
switches and lines to make it feasible to deliver a service called Digital Subscriber Line (DSL). Both of
these choices typically supported higher bandwidth to the household than from it—called Asymmetric
Digital Subscriber Line (ADSL).
Broadband has several appealing features that users experience in heterogeneous ways. In comparison
to dial‐up service, broadband provides households with faster Internet service and, thus, access to
better online applications. Broadband also may allow users to avoid an additional phone line for
supporting dial‐up. In addition, broadband services are also “always on,” and users perceive that as a
more convenient service. It is also generally faster in use. A maximum rate of 14.4K (kilobytes per
2 The U.S. experience is documented in Greenstein and McDevitt (2009), while much of the
experience for the developed and developing world economies is tracked in OECD Broadband Portal, http://www.oecd.org/sti/ict/broadband.
3 In many areas, households also had access to direct supply of high-speed lines, such as T-1 lines. This was prohibitively expensive for almost all users except businesses, and even then, it was mostly used by businesses in dense urban areas, where the fiber was cheaper to lay. Fiber to the home has recently become cheaper, and may become a viable option sometime in the future. See Crandall (2005).
4 During the 1990s most cable companies sold access to the line directly to users, but made arrangements with other firms, such as Roadrunner or @home, to handle traffic, routing, management and other facets of the user experience. Some of these arrangements changed after 2001, either due to managerial preferences, as when @home lost its contract, or due to regulatory mandates to give users choice over another Internet Service Provider (ISP), as occurred after the AOL/Time Warner merger. See Rosston (2006).
4
second) and 28.8K were predominant in the mid 1990s for dial‐up modems. The typical bandwidth in
the late 1990s was 43K to 51K, with a maximum of 56K. DSL and cable achieved much higher maximum
bandwidths, typically somewhere in the neighborhood of a maximum rate of 750K to 3M (megabytes
per second), depending on the user choices and vendor configuration. Even higher bandwidth became
available to some households late in this period.
Many factors shape the quality of a user’s experience, such as the capacity/bandwidth of lines, the
number of users in the neighborhood in a cable system, the geographic location of a system in the
national grid, the frequency of use of sites with geographically dispersed caching, and the time of day at
which the household performs most activities. In brief, generalizations are hard to make beyond the
obvious: Broadband gives the user a better experience than dial‐up access.5
Non‐wire line services were also available over the period, primarily via satellite. These services tended
to be expensive and limited, so they were not very popular with most households, but were very
popular with households who lacked wire‐line broadband. Another channel for delivering data in mobile
format involved limited use of cell phone infrastructure combined with a card for laptop computers or a
specialized device, such as Blackberry. These were used primarily to support email and texting and other
low‐bandwidth applications.
Near the very end of our sampling period a new set of mobile broadband services began to gain market
traction with households, primarily in the form of smart phones. Though smart phones had been
available in a variety of models for many years, it is commonly acknowledged that the category began to
take‐off in adoption after the introduction of the Apple iPhone in 2007. Recent reports suggest the
Apple iPhone and new Blackberry designs dominate this product category for the time being.
In the United States broadband was available in only a few locations in the 1990s and the early 2000s,
but it became more available over time. User demands for high‐bandwidth internet applications (such as
music downloading) increased as households became familiar with them. Firms also rolled out new
services as more users acquired broadband (e.g., Web2.0 applications), which then generated even
more adoption.
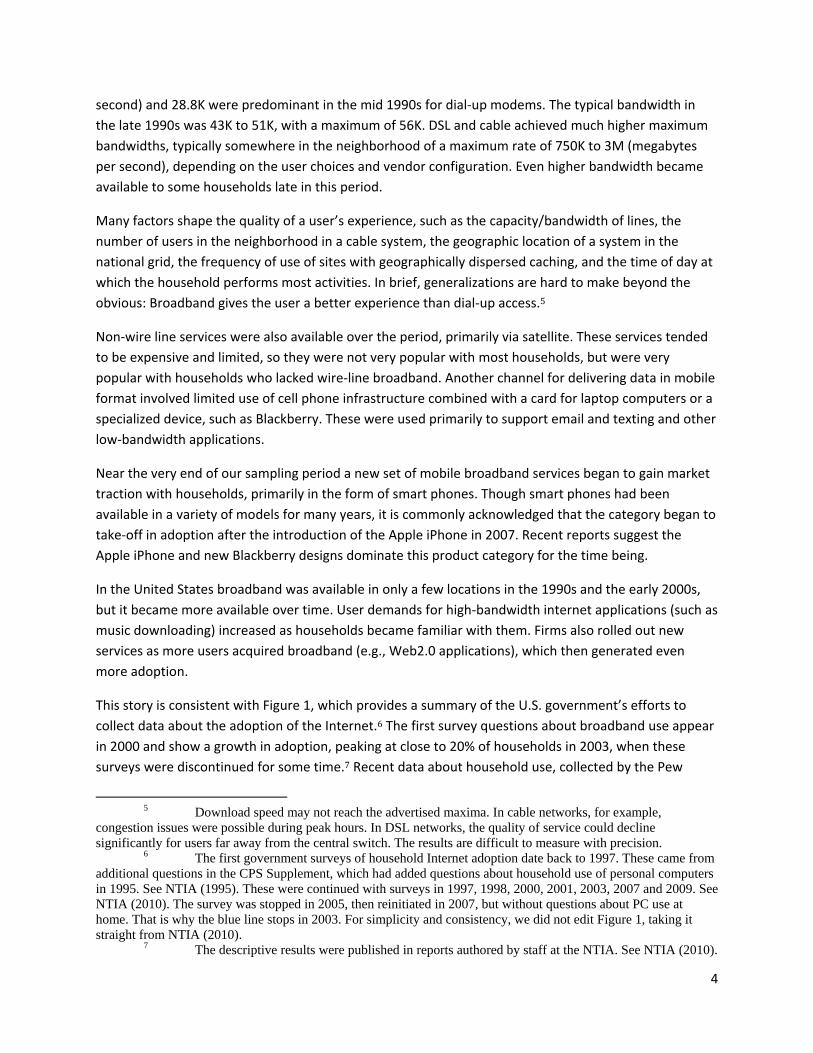
This story is consistent with Figure 1, which provides a summary of the U.S. government’s efforts to
collect data about the adoption of the Internet.6 The first survey questions about broadband use appear
in 2000 and show a growth in adoption, peaking at close to 20% of households in 2003, when these
surveys were discontinued for some time.7 Recent data about household use, collected by the Pew
5 Download speed may not reach the advertised maxima. In cable networks, for example,
congestion issues were possible during peak hours. In DSL networks, the quality of service could decline significantly for users far away from the central switch. The results are difficult to measure with precision.
6 The first government surveys of household Internet adoption date back to 1997. These came from additional questions in the CPS Supplement, which had added questions about household use of personal computers in 1995. See NTIA (1995). These were continued with surveys in 1997, 1998, 2000, 2001, 2003, 2007 and 2009. See NTIA (2010). The survey was stopped in 2005, then reinitiated in 2007, but without questions about PC use at home. That is why the blue line stops in 2003. For simplicity and consistency, we did not edit Figure 1, taking it straight from NTIA (2010).
7 The descriptive results were published in reports authored by staff at the NTIA. See NTIA (2010).
5
Internet and American Life Project, show that the diffusion continued in the anticipated direction.
Adoption reached over 47% of households by 2006.8 The survey resumed in 2007 and the anticipated
trajectory continued, with 50.8% of households having broadband in October 2007 and 63.5% in
October of 2009.
In the earliest years of diffusion to householdsthat is, prior to 2002the diffusion of broadband Internet access was very much supply‐driven in the sense that supply‐side issues were the main determinants of Internet availability and, hence, adoption. Most households simply switched from dial‐up to broadband if they could and they found the higher bandwidth worth the extra expense. Cable and telecom operators needed to retrofit existing plants, which constrained availability in many places. In those years, the spread of broadband service was much slower and less evenly distributed than that of dial‐up service. Highly populated areas were more profitable due to economies of scale and lower last‐
mile expenses. As building has removed these constraints, demand‐related factorssuch as price,
bandwidth, and reliabilityhave played a more significant role in determining the margins between who adopts and who does not.9 By 2006 supply‐side issues began to fade, with only the most low density parts of the country lacking suppliers.
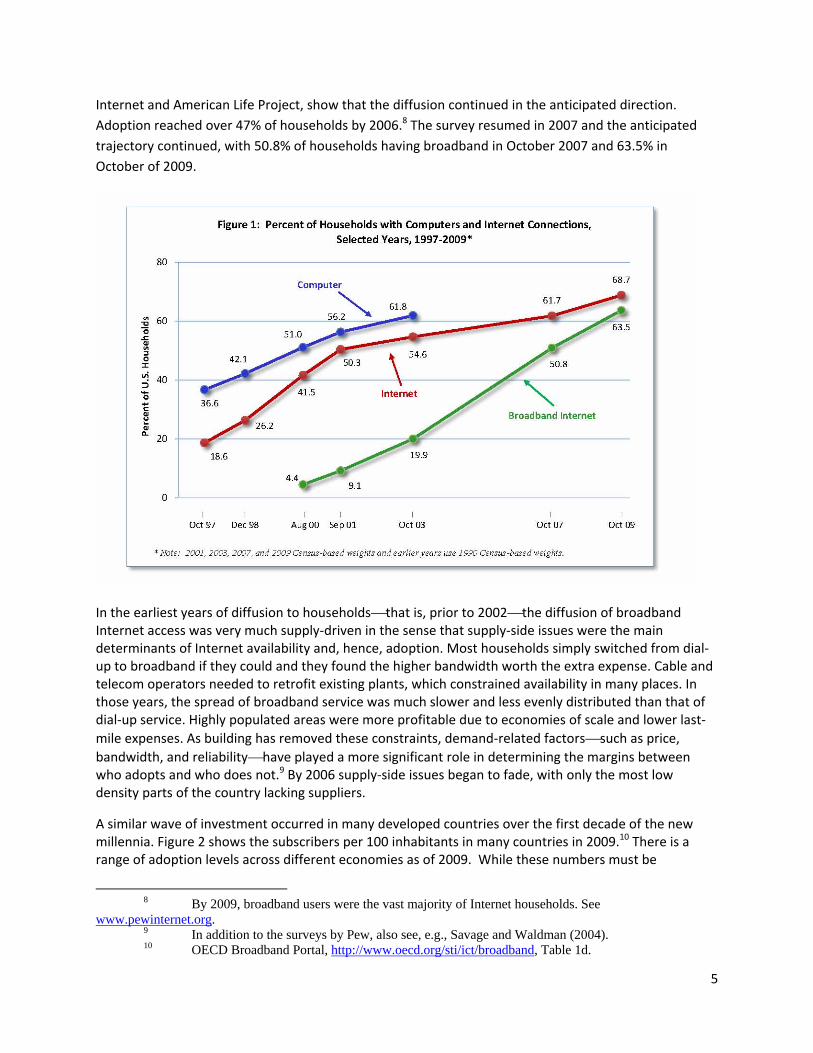
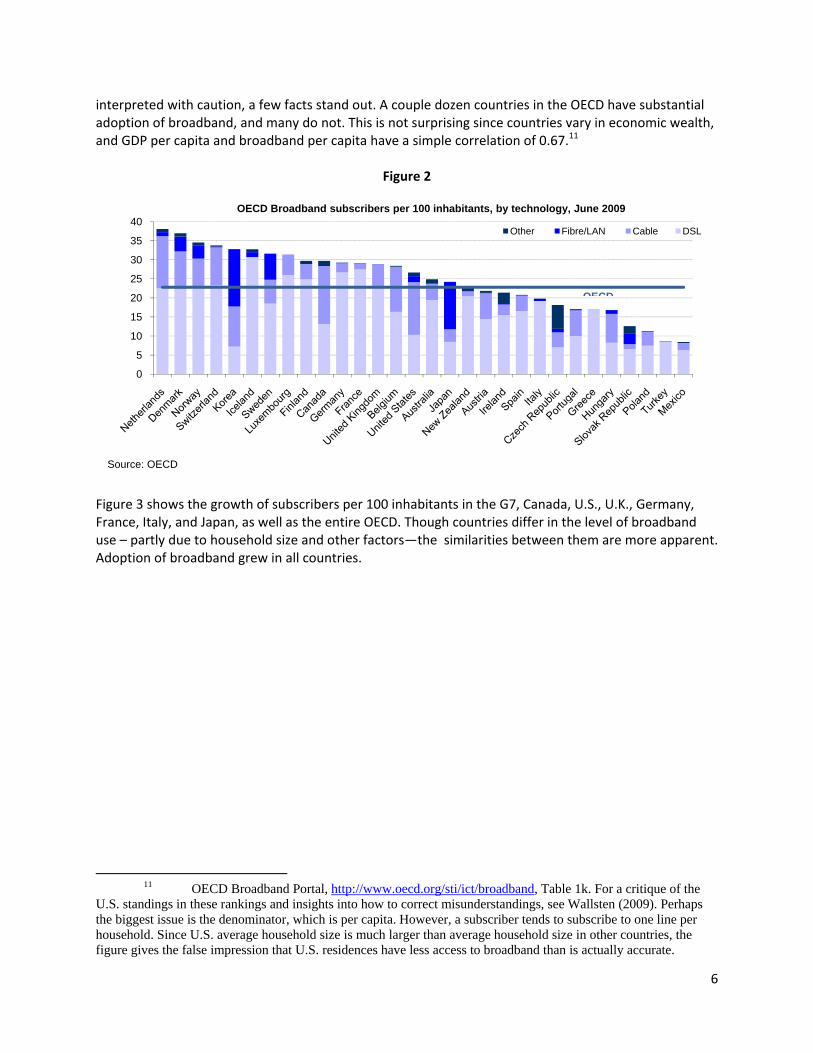
A similar wave of investment occurred in many developed countries over the first decade of the new millennia. Figure 2 shows the subscribers per 100 inhabitants in many countries in 2009.10 There is a range of adoption levels across different economies as of 2009. While these numbers must be
8 By 2009, broadband users were the vast majority of Internet households. See
www.pewinternet.org. 9 In addition to the surveys by Pew, also see, e.g., Savage and Waldman (2004). 10 OECD Broadband Portal, http://www.oecd.org/sti/ict/broadband, Table 1d.
6
interpreted with caution, a few facts stand out. A couple dozen countries in the OECD have substantial adoption of broadband, and many do not. This is not surprising since countries vary in economic wealth, and GDP per capita and broadband per capita have a simple correlation of 0.67.11
Figure 2
Figure 3 shows the growth of subscribers per 100 inhabitants in the G7, Canada, U.S., U.K., Germany, France, Italy, and Japan, as well as the entire OECD. Though countries differ in the level of broadband use – partly due to household size and other factors—the similarities between them are more apparent. Adoption of broadband grew in all countries.
11 OECD Broadband Portal, http://www.oecd.org/sti/ict/broadband, Table 1k. For a critique of the
U.S. standings in these rankings and insights into how to correct misunderstandings, see Wallsten (2009). Perhaps the biggest issue is the denominator, which is per capita. However, a subscriber tends to subscribe to one line per household. Since U.S. average household size is much larger than average household size in other countries, the figure gives the false impression that U.S. residences have less access to broadband than is actually accurate.
0
5
10
15
20
25
30
35
40
Source: OECD
Other Fibre/LAN Cable DSL
OECD Broadband subscribers per 100 inhabitants, by technology, June 2009
OECD

7
Figure 3
Source: OECD 12
To gain further insight into these general trends in this study we examine several countries in detail.
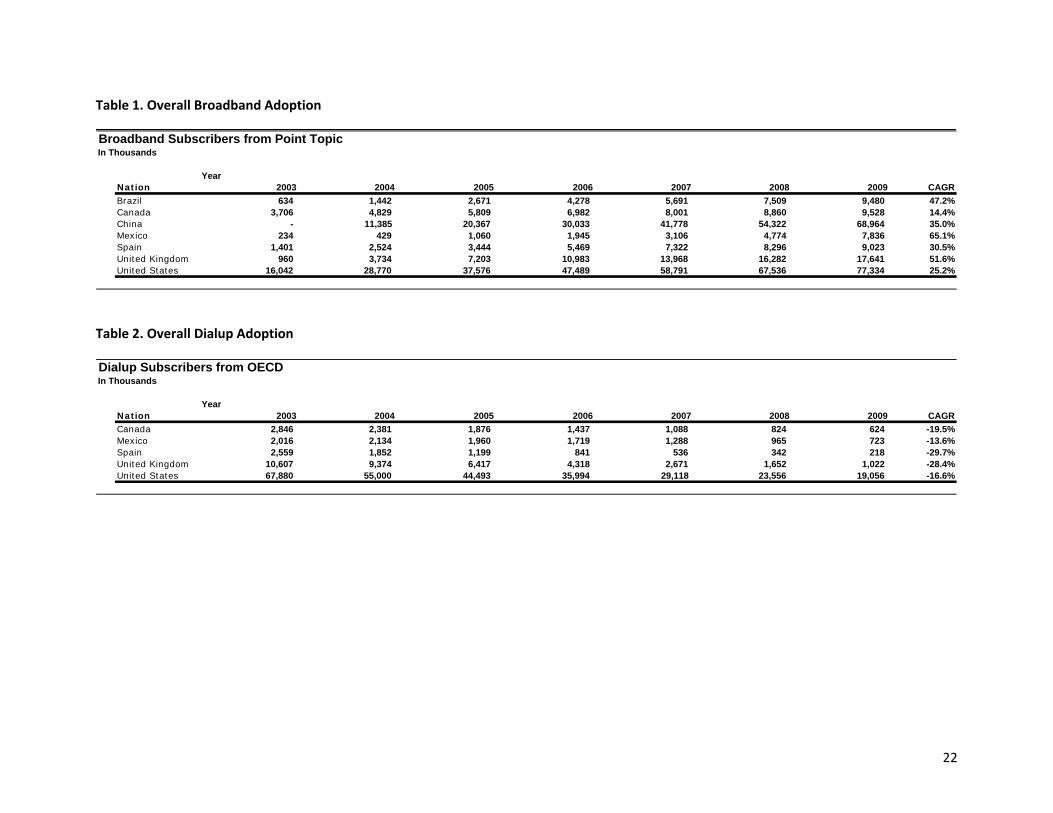
Table 1 and 2 presents broadband and dial‐up adoption for the seven countries covered in this study –
the U.S., Canada, U.K., Spain, China, Mexico and Brazil. The broadband data in Table 1 come from Point‐
Topic, a private consultancy. (We will explain more below). Table 2 provides OECD’s estimates of
household dial‐up adoption by year.13
One fact also immediately emerges from the descriptive statistics in the tables, and it shapes all the
results below. The scale of adoption in the U.S. and China far outweighs the scale of adoption in any
other country. That occurs for two rather obvious reasons. The U.S. and China have much larger
populations than the U.K., Spain, and Canada. While Mexico and Brazil also have large populations,
those countries had much lower rates of adoption. The general level of economic development is a
major determinant of adoption.
12 OECD Broadband Portal, http://www.oecd.org/sti/ict/broadband, Table 1i. 13 The OECD collects this data from government agencies, and sometimes the explanations for the
sources are not transparent. OECD says that the data are for each year, but does not make clear which quarter. In addition, their estimate for dial-up use in the U.S. provides information that does not reconcile well against Figure 1. The OECD number appears too high. For the sake of consistency, we continue to work with it, and look for the sensitivity of our results to their estimates.
0
5
10
15
20
25
30
35
2001-Q4
2002-Q2
2002-Q4
2003-Q2
2003-Q4
2004-Q2
2004-Q4
2005-Q2
2005-Q4
2006-Q2
2006-Q4
2007-Q2
2007-Q4
2008-Q2
2008-Q4
2009-Q2
2009-04
France
Germany
Canada
United Kingdom
United States
Japan
OECD
Italy
Broadband penetration, G7 countries

8
Motivation and Challenges
The economic determinants behind the growth of broadband are straightforward to state: Dial‐up
became available first and diffused to households as a means to deliver the Internet. Broadband
emerged later as a higher quality and more expensive alternative, albeit one available in only a few
places and from a limited set of providers, if any. Then over time, broadband became more reliable and
more widely available, and as that happened, many households paid to upgrade their Internet service.
There are two common approaches to measuring gains from the new good. First, what is the increase in
revenue (GDP) above and beyond what would have been generated had dial‐up continued? Second,
what is the increase in consumer surplus beyond what would have occurred had dial‐up continued?14
When addressing these questions traditional approaches do not worry about which vendor or user gains
or losses. We will do the same, and will only compute an aggregate measure.
We focus on revenue instead of producer surplus because we are hampered by the lack of precise
information about the unit cost of provision, which is necessary for an estimate of producer surplus at
each point in time. Instead, we examine the difference in vendor revenue between actual history and a
hypothetical scenario without broadband, absent multiplier and general equilibrium effects. That is, we
estimate how much the GDP increased in the Internet access market as a result of the deployment of
broadband. If we desired to provide a ballpark of the producer surplus generated, we would need to
compare that estimate against estimates for upgrade costs for an initial broadband build‐out and typical
variable costs per year.
To measure consumer surplus ideally, we should measure the difference in “areas under the demand
curves” between the actual demand for broadband and what consumer surplus would have demanded
had dial‐up continued and not been replaced by broadband. This is challenging to do for many reasons,
but one is primary here: We cannot observe what the dial‐up market would have looked like had
broadband not diffused. Instead of measuring two demand curves, we get close to our ideal measure by
looking at estimates of user willingness to pay for the upgrade to broadband.
For estimates of consumer surplus in the U.S. market, Greenstein and McDevitt (2009) employed one
set of estimates from Savage and Waldman (2004). It is representative of the type of findings seen in
other studies. These authors conducted an extensive survey of dial‐up and broadband users in 2002.
This study had advantages because it is a survey of both users and nonusers. The authors also used this
survey to directly estimate “willingness to pay” measures for attributes of dial‐up and broadband
service, which facilitates some simple accounting of the value of broadband in comparison to dial‐up for
existing dial‐up users.
While this is sufficient for U.S. data, it comes with three drawbacks for a cross‐country comparison. First,
it is very data‐intensive. It requires yearly data on both broadband and dial‐up use. Second, it does not
14 For further discussion of the motivation, see e.g., Brussels Round Table, 2006.

9
fully account for heterogeneity in household willingness‐to‐pay. It averages out such differences.15
Third, to our knowledge there are only a limited number of similar estimates for demand in the U.S., or,
for that matter, other countries. While the limited evidence suggests many similarities across countries
in demand, the evidence is not large, and does not come from the countries of interest.16
Hence, we had two options for modeling demand. Our first option would build on the extensive survey
analysis of U.S. buyers and assumes that non‐U.S. buyers indicate something about the willingness to
pay for broadband from non‐ U.S. buyers.17 The second modeling option would not rely on such a
survey. It would take a different approach.
We will implement the second option for several reasons. Applying the first option to a non‐U.S. country
would require data on the total number of households, number of Internet users, number of broadband
users, and information relevant to the cost of adoption, such as the price of access or cost of second
lines. In general, however, older data is much more difficult to find, particularly about cost of dial‐up and
the cost of a second line to support it. It is particularly difficult to get consistent data across countries.
Hence, our strategy will favor recent data over older data, and broadband data over all other data,
consistent with the focus of this study.
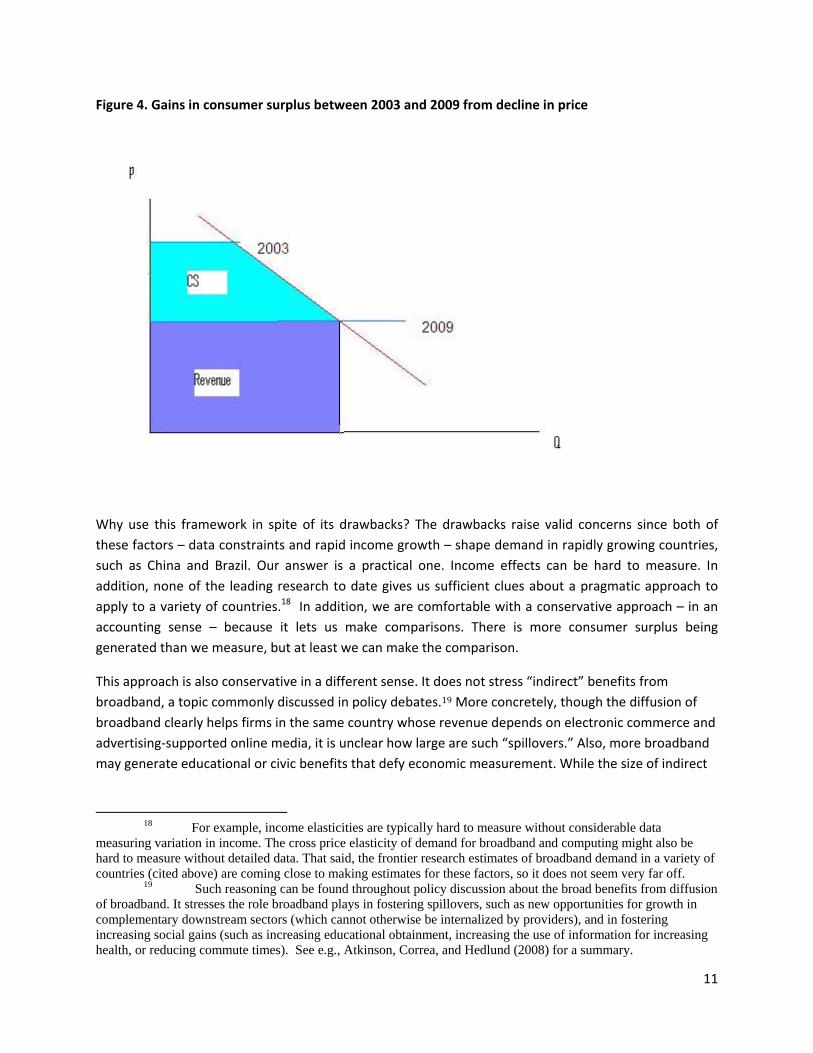
Our strategy is illustrated in figure 4. As we explain below, our data provide information about the
deployment and use of broadband in the same country over multiple years. That facilitates a
comparison over time. In most countries nominal broadband prices remain virtually unchanged one year
to the next, in spite of inflation. Hence, as household incomes keep pace with inflation, the real price of
broadband falls. Equivalently, the fraction of a household budget devoted to broadband falls.
This forms the basis of a feasible measurement strategy within a country. In the figure we illustrate the
difference between 2003 and 2009. As the real price falls the demand for broadband rises. Over time
the fall in price “traces” out the demand curve. With this approach it also is possible to trace the change
in consumer surplus in a country.
15 To be clear, we do not believe such accounting would alter our benchmark calculations much, but
we acknowledge it is an open question. The study of Rappoport, Taylor and Kridel (2003) takes steps in that direction, but did not provide sufficient information to make a full estimate.
16 For example, Rappoport et al. (2003) report an own-price elasticity of -1.46 for DSL for a nested logit model applied to a sample of U.S. households in 2000, while Crandall, Sidak, and Singer (2002) find an own-price elasticity of -1.184 for a slightly different sample in a similar time period. Using the same sample, Rappoport, Taylor, and Kridel (2003), page 82, estimate elasticities for different price levels, finding evidence of more elastic demand at higher prices. The estimates range from close to 1 for DSL and cable modem prices close to $20 a month, and they change in the expected direction. For $30 DSL prices they estimate a price elasticity of -2.1, and for cable modem prices of $40 they estimate -2.35. Estimates on samples of households in other countries tend to find more elastic demand. For example, Pereira and Ribeiro (2006) find an own-price elasticity for broadband (cable and DSL) of -2.84 for a sample of households in Portugal. In a sample of Austrian households Cardona et al. (2007) find similar elasticities for broadband (approximately -2.5) in areas where there are many options, and more inelastic demand (approx -0.97) when DSL is the only broadband option and dial-up provides the only competition to DSL.
17 That is, we would have to adjust for the differences between the demographic characteristics in Savage-Waldman’s (2004) sample and those in other countries.

10
This approach has two advantages. First, it is quite simple, and that has advantages for cross‐country
comparisons. Second, it can apply to any country in which the underlying premises of the model remain
valid.
More concretely, this model assumes a stable set of factors determine demand, and these same factors
are not shifting the demand over time, which is reasonable over short periods of time. We also do not
expect large year‐to‐year increases and decreases in broadband demand. Fortunately, our preliminary
examination of data for the U.S., Canada, U.K., China, Brazil, Spain and Mexico did not find large year‐to‐
year increases or decreases in adoption, which suggests that the data are consistent with these
assumptions. Nonetheless, we are wary that the countries with fast growth in incomes, such as Brazil
and China, might depart from these assumptions if we tried to extend the study a few more years, so we
remain alert for other issues.
This method has another characteristic, and we consider that to be another advantage. It will result in a
conservative estimate. It ignores the gains to adoption for all early adopters, for example, because it
does not measure the “upper part of the triangle.” Said another way, it does not measure the surplus
generated prior to 2003 in Figure 4.
This approach has two drawbacks: it requires the same data each year. As we will demonstrate below,
not all countries have data about broadband that satisfies such a requirement, particularly earlier in the
decade. Most of the available data also does not adjust for the quality of broadband, which most
observers presume has improved over time.
Second, and somewhat technically, this method measures surplus arising only from a movement along a
demand curve, not any shift in demand. It acts as if all increases in volume come from price declines and
nothing else. That means the exercise underestimates surplus that arises from demand shift linked to,
for example, increase in GDP per capita or a fall in the price of complementary goods such as personal
computers. This feature of the framework is related to our previous remark about this framework
working best in countries where incomes are not growing rapidly.
11
Figure 4. Gains in consumer surplus between 2003 and 2009 from decline in price
Why use this framework in spite of its drawbacks? The drawbacks raise valid concerns since both of
these factors – data constraints and rapid income growth – shape demand in rapidly growing countries,
such as China and Brazil. Our answer is a practical one. Income effects can be hard to measure. In
addition, none of the leading research to date gives us sufficient clues about a pragmatic approach to
apply to a variety of countries.18 In addition, we are comfortable with a conservative approach – in an
accounting sense – because it lets us make comparisons. There is more consumer surplus being
generated than we measure, but at least we can make the comparison.
This approach is also conservative in a different sense. It does not stress “indirect” benefits from
broadband, a topic commonly discussed in policy debates.19 More concretely, though the diffusion of
broadband clearly helps firms in the same country whose revenue depends on electronic commerce and
advertising‐supported online media, it is unclear how large are such “spillovers.” Also, more broadband
may generate educational or civic benefits that defy economic measurement. While the size of indirect
18 For example, income elasticities are typically hard to measure without considerable data
measuring variation in income. The cross price elasticity of demand for broadband and computing might also be hard to measure without detailed data. That said, the frontier research estimates of broadband demand in a variety of countries (cited above) are coming close to making estimates for these factors, so it does not seem very far off.
19 Such reasoning can be found throughout policy discussion about the broad benefits from diffusion of broadband. It stresses the role broadband plays in fostering spillovers, such as new opportunities for growth in complementary downstream sectors (which cannot otherwise be internalized by providers), and in fostering increasing social gains (such as increasing educational obtainment, increasing the use of information for increasing health, or reducing commute times). See e.g., Atkinson, Correa, and Hedlund (2008) for a summary.
12
benefits could differ substantially across countries, there is no practical way to measure their size in a
way that allows for meaningful comparison across countries.
That circumscribes our interpretation. We measure the economic factors considered by parties involved
in a transaction—anything that shapes the perceived or anticipated costs of using dial‐up, the
willingness to pay for an upgrade to broadband, and/or the decision not to return to dial‐up.
For suppliers these factors include: Sale of second lines, revenue for dial‐up access, and revenue for
broadband access. For households, the following factors shape the anticipated value of broadband
service and, hence, the willingness to pay for an upgrade: Savings on a second line, savings on commute
time, anticipated health and entertainment benefits, and anticipated savings on phone bill (e.g., if user
moves to VoIP, or Voice‐Over Internet Protocol).
Our understanding of these factors shapes our interpretation of the estimates, which do not include
externalities, namely, benefits or costs not considered by the parties involved in the transaction. For
example, our interpretation does not include externalities to suppliers, such as the benefits to Cisco
from selling more Wi‐Fi equipment to users, to Amazon from additional sales because broadband users
experience more satisfying service, or to Google from more advertisement sales because users stay on‐
line longer.
Similarly, our interpretation does not include externalities to users. Those would be unanticipated or
unperceived costs or gains—such as the unanticipated slowness that one neighbor’s use imposes on
another’s in a cable architecture, or the benefits that one person’s participation in a p2p (peer‐to‐peer)
network confers on another (as long as there is no membership fee). That also does not include such
externalities as changes to privacy (for good or ill) or crime (online identity theft, etc).
Data and Challenges
Our investigation of the available data led us to favor the data at Point Topic, a consultancy based out of
London. Point Topic covers broadband and dial‐up access back to at least 2002 for many countries. The
company also claims to distinguish between household and business users in its adoption/price data,
which is another key detail. They have information about the seven countries of Interest and many
more. In general, the U.S. data about adoption and revenue from Point Topic do not substantially differ
from our prior estimates for the U.S..
Table 3 shows the estimates from Point Topic for household broadband adoption for the seven
countries of interest – U.S., Canada, U.K., Spain, Mexico, China, and Brazil. We use Point Topic’s data for
the first quarter of each year to provide a conservative analysis of the annual rate of adoption. This is
conservative because adoption is growing in many countries, so a number from later quarters will be
higher. Our definition of broadband Internet is also technologically conservative, as it includes DSL and
cable, but excludes other formats, such as mobile (primarily due to lack of consistent data for all
countries).

13
Note the key strength and limitation of Point Topic’s data. These data are a consistent source for most
countries in most years. Definitions remain consistent, and so do reporting standards, which permits
meaningful comparisons over time. 20 However, Point Topic does not have complete observations for
every country for every year. It has data for only the U.S. and Canada back to 1999, and every country
except China has data by 2002. China’s begins in 2004. To achieve consistency across countries, we
begin our analysis in 2003 with the exception of China, which we begin in 2004.
Finally, we present estimates for revenue for each country for each year. Table 3 shows total revenue
for each country in terms of its local currency. It uses Point Topic’s estimate of broadband users and a
price index from the major provider(s) in each country, expressed in 2009 real terms, in the local
currency of the country of origin (e.g., Canadian dollars for Canada, Mexican pesos for Mexico, etc).21
Figure 5
Figure 5 shows year over year growth rates in revenue for each country. The rates of growth follow a
standard pattern for a diffusing technology. During the earliest moments of diffusion the growth rates
for revenue are very high, reflecting the low base from which they start. Of time, however, growth rates
approach zero, a symptom of market maturity and potential saturation. Four countries – the U.S.,
Canada, Spain, and perhaps the U.K. by the end of the sample – show signs of reaching maturity in this
sense. Three countries – Brazil, China and Mexico – show the fewest symptoms of maturity in this sense.
20 Those statements only hold for wireline data. As of this writing Point Topic has little data about
the most recent trends in mobile broadband access. We found they have some data on the number of subscribers for mobile data contracts for laptops – those little cards that plug into notebooks. Most of this is business-oriented demand – which is outside of what we are doing. The most recent estimates from Rosston, Savage and Waldman (2010) include estimates for the value of mobility in laptops at home and recreation (e.g., big screen mobility), and found only minor effects. It is rounding error in the greater scheme of things in any event, too small to matter much.
21 Price indices for each country come from the CIA World Factbook.

14
These revenue levels are important to stress, because access fees generated most of the revenue during
the first decade of the commercial Internet. The typical household spent more than three‐quarters of its
time on‐line at free or advertising‐supported sites, devoting most of its Internet budget to access fees,
not separate subscription fees for each service online.22 Although subscription‐based services and
advertising services started growing rapidly after 2003, the amount spent on access fees each year far
exceeds advertising revenue. Advertising revenue is now growing at a more rapid pace than access fees,
and it may exceed access revenue soon, but not as of this writing.23
The Broadband Bonus in seven countries
Our primary goal is to compute something equivalent to the estimate of the broadband bonus found in
Greenstein and McDevitt (2009). That is, we estimate consumer surplus and net gain in producer
revenue (broadband revenue minus lost dial‐up revenue), expressed in a single currency for
comparability. These estimates are in Tables 5C.I, 5C.II, and 5C.III, and we will discuss them at the end of
this section. However, to give readers an appreciation for the construction and robustness of these
results, we present the several intermediate steps towards those final tables.
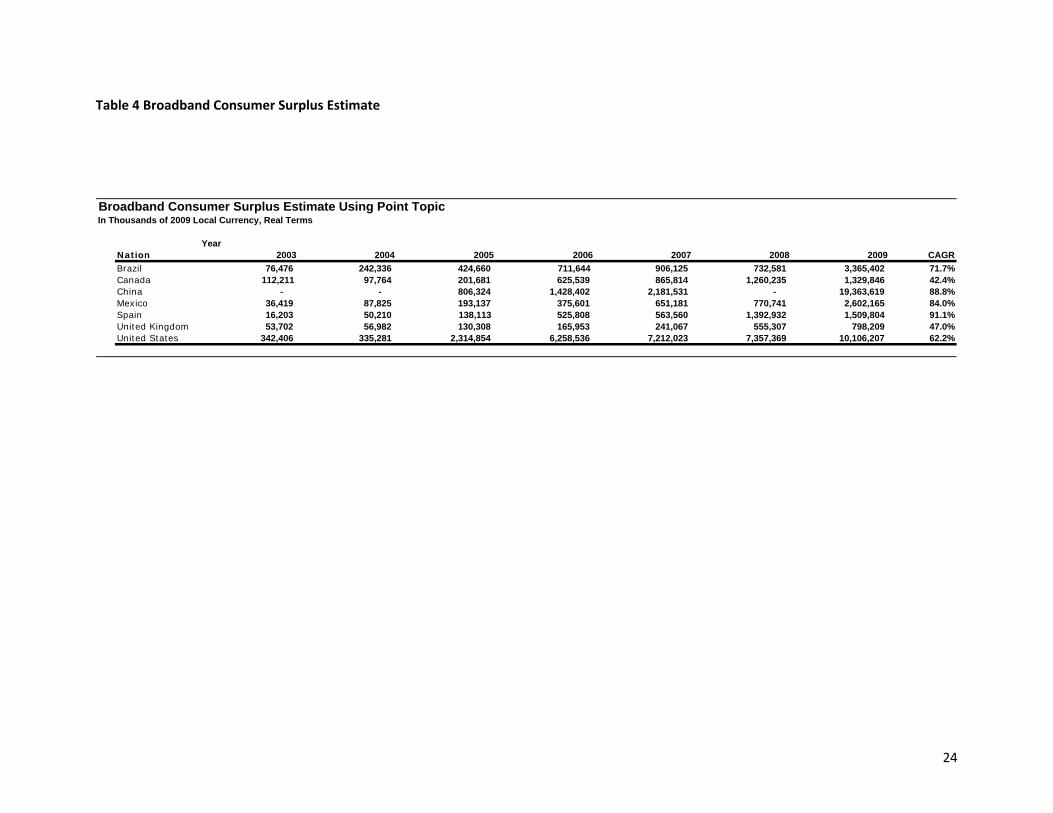
Table 4 present the first step to the main results. Table 4 computes an estimate for consumer surplus in
the local currency indexed to 2009 prices. It is constructed with Point Topic’s price estimates and
accounts for users’ willingness to pay by assumption. As stated earlier, a decline in real prices generates
consumer surplus. Such declines are common in all these economies from the combination of general
price inflation with flat or no growth in nominal prices for broadband. As with Table 3, it denominates
the numbers in local currency (e.g., Canadian dollars for Canada, pesos for Mexico, etc).
Surplus grows over time in all the estimates, but the data source shapes the level reached at any point in
time. For example, Table 4, using Point Topic data put the estimates for surplus without correcting for
dial‐up revenue at $6.2B and $10.1B for the United States in 2006 and 2009, respectively.
It is informative to compare across countries using the same methodology and data source, recognizing
that each estimate is denominated in local currency, which prevents comparing between countries. All
countries are growing. This is not a surprise. When revenue and adoption grow, so does consumer
surplus. The scale of the growth is also not surprising, since it largely depends on the change in prices
levels and change in revenue.
22 See, e.g.,Goldfarb (2004). 23 The following will provide a sense of the magnitudes of different activities in the U.S. In the 2006
Annual Service Survey, Web Search Portals (NAICS 518112) generated $6.3 billion in advertising in 2006, out of $9.1 billion of revenue for the category. According to the 2002 NAICS definitions, firms in this sector “operate web sites that use a search engine to generate and maintain extensive databases of Internet addresses and content in an easily searchable format. Web search portals often provide additional Internet services, such as e-mail, connections to other web sites, auctions, news, and other limited content, and serve as a home base for Internet users.” See http://www.census.gov/epcd/naics02/def/ND518112.HTM#N518112, (accessed January, 2010). This is up from $4.5 billion and $3.3 billion in advertising revenue in 2005 and 2004, respectively. In addition, Internet Publishers (NAICS 516) generated $2.6 billion in revenue in 2006, up from $2.3 billion and $1.8 billion in 2004 and 2005, respectively. That is still far less than the $39 billion in access revenue in 2006.

15
One additional comparison provides confidence in this step. Despite differences in approach and
method to accommodate differences in the sources of data, the estimates for the United States in Table
4 are qualitatively similar to the estimates in Greenstein and McDevitt (2009) for the overlapping years,
with some (unsurprising) differences in the timing of growth. Table 4 puts the total consumer surplus in
2006 at $6.2B while Greenstein and McDevitt (2009) estimate it between $8.3B and $10.5B. The
estimates for Table 4 are lower than prior estimates, which is largely due to the different methods for
estimating changes in prices.
Figure 6
Figure 6 converts these estimates into growth rates for each country. The figure illustrates one feature
of this approach. It results in comparatively “unsmooth” changes in the size of consumer surplus one
year to the next, which the figure portrays as a substantial growth rates followed by non growth. Such
“lack of smoothness” is plausible in adjacent years in a country, but this periodicity appears to be more
than we would expect. This feature suggests not placing too much emphasis on any particular estimate
in any specific year. Accordingly, we focus on general trends.
The next step adjusts the estimates for the replacement of dial‐up by broadband, presuming that dial‐up
would have been available had broadband never diffused. Table 5A provides estimates of cannibalized
dialup revenue using OECD’s figures for dial‐up use and an estimate of the price of dial‐up service, also
from OECD.24 When available, the price survey from 2000 is used and remaining years are estimated to
be the proportional rate for DSL price changes. This method is used because price estimates for dial‐up
in more recent years are not available from OECD. Since OECD does not provide dial‐up use in China and
24 We have inquired with staff at OECD statistics, and, as best we can tell, OECD ceased publishing
comprehensive cross-country information about the price of dial-up use after 2000, so we use the last available data.
16
Brazil, further tables present adjusted estimates for the five countries for which dial‐up information is
available, as well as unadjusted estimates that include China and Brazil. In this way, the reader can see
what matters and what does not.
The estimates for cannibalized revenue in Table 5A vary in size across countries. Not surprisingly, the
U.S. has the largest amount of cannibalization, because its dial‐up industry was quite large before
broadband began to deploy. Once again, these are denominated in local revenue, so it is not possible to
directly compare the size of the estimates across countries.
Table 5B.I derives a broadband bonus. It adds gross broadband revenue to consumer surplus and
subtracts cannibalized dial‐up revenue. It uses Point Topic data and estimates using local currencies
indexed to 2009, and supplements them with the OECD data for five countries. The size of the net gains
follows directly from the prior tables, reflecting the scale of the components that went into them.
As a step towards comparing the importance of cannibalization across countries, Table 5B.II goes as far
as possible without using the OECD data on dial‐up. That permits us to compare all seven countries. The
table adds net revenue to consumer surplus and does not subtract dial‐up revenue. These are
overestimates of the true broadband bonus because they do not account for what dial‐up would have
provided. Why make such an overestimate? It puts all countries on a similar footing, though not a similar
currency (which is the next step). That is an intermediate step toward comparing the size of the Brazilian
and Chinese experience to the other five, once we put all seven in the same real currency.
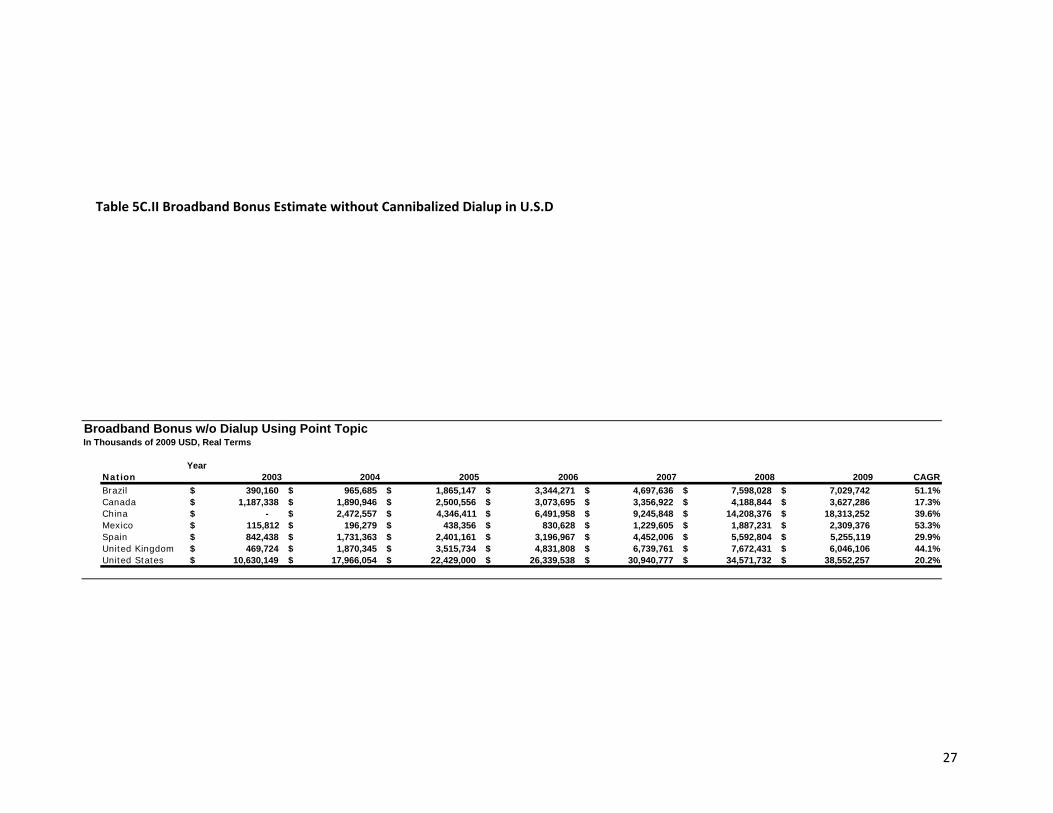
Tables 5C.I‐II correspond to Tables 5B.I‐II but express figures in U.S. dollars indexed to 2009.25 This
allows for comparability across countries. Table 5C.I shows that the U.S. bonus exceeds that in Canada,
Mexico, Spain, and the U.K. The differences are in keeping with differences in the scale of the
broadband economies in each country.
Table 5C.II includes China and Brazil, as well as the other countries, but does not subtract
cannibalization of dial‐up, which follows directly from Table 5B.II. All these comparisons must be
interpreted cautiously because they do not reflect the subtraction of lost dial‐up revenue, but these are
suggestive, nonetheless.
In both estimates the size of the China broadband bonus is large, just under half the size for the U.S.
(before correcting for cannibalized dial‐up). The size for Brazil is also quite large, though the tables do
not provide a robust sense of this scale. According to the Point Topic data, the size exceeds the
magnitudes for the UK and Spain.
The size and scale of adoption is the biggest determinant of the size of the estimates for the broadband
bonus. For example, consider all seven countries, even those for which there is not data on dial‐up
cannibalization. The correlation is 2009 between the number of adopters and the size of the bonus
without cannibalization is 0.91. This suggests that many countries have gone through similar changes,
25 Exchange rates come from the Federal Reserve Board of Governor’s estimates and convert local
currencies to U.S. dollar denominations indexed to 2009.

17
similar to the changes found in the United States in this time period, and these changes are
proportionate to the size and extent of diffusion within their countries.
Table 5D presents another approach to understanding the scale of the estimates, once again continuing
with estimates that do not subtract dial‐up revenue. It computes the fraction of the broadband bonus
stemming from consumer surplus. The calculations for 2009 are the most informative, because these
show the results after the diffusion has progressed furthest – and, correspondingly, the distortion from
lack of dial‐up data is at its lowest. In most of the countries a large part of the bonus from diffusion goes
to consumers, appearing nowhere in standard GDP statistics. In Brazil, Canada, Spain and the U.S. these
percentages exceed 20%, and in both China and the UK these exceed 15%. Only Mexico shows a small
percentage, which may be due to the early point of the diffusion of broadband in that country.
Table 5D reinforces a key point: countries with greater adoption of broadband provide their consumers
with a greater benefit. Ignoring consumer surplus leads to missing a large part of the benefit of
broadband to consumers.
Conclusions and Future Developments
This research was motivated by two seemingly simple questions addressed in Greenstein and McDevitt
(2009). What consumer surplus and revenue growth was affiliated with broadband’s diffusion in seven
countries, the U.S., Canada, the U.K., Spain, Mexico, Brazil and China? We chose these seven because
they vary in their circumstances, and their economies represent typical experiences in the high‐income
and middle‐income countries of the world. These questions drew our interest because these economic
gains from new technology are not otherwise readily visible.
In general, the findings support the view that motivated our investigation at the outset. The scale of the
broadband bonus in other countries is comparable to the size of the broadband economies in those
countries. Countries with large Internet economies, such as the United States and China, are receiving
large economic bonuses from investment in broadband. Countries with smaller Internet economies,
such as Canada, the U.K. and Spain, receive smaller levels of bonuses, but bonuses in proportion to the
scale of use of the Internet.
The results for Brazil and Mexico are intriguing. In comparison with other countries, both had a later
start and more recent acceleration in investment in broadband. Potential exists for more in Mexico,
but, as yet, that potential has not been realized. Brazil’s Internet economy appears to be growing rapidly
now, and that suggests the generation of considerable broadband bonus in the near future.
More broadly, we have focused the spotlight on the gains from the diffusion of one technology across
several countries. This is clearly part of a broader world‐wide trend, and but one of many countries. We
conjecture that detailed analysis of many developing countries would yield similar findings.
There is also nothing about our approach that is unique to broadband. A similar approach could be used
for a widely diffusing access technology. In that light, we look forward to another similar process, reborn
with another technology and product.
18
In a few years time we may be able to trace the gains from deployment of mobile broadband access. We
say “a few years time” because this topic comprises two markets, mobile broadband in a small screen
and in a large screen. Until the latter part of the decade demand for smart phones was primarily about
demand for phone on a Palm, Blackberry and Windows CE, namely, a small screen. It was also about, to
some extent, enabling mobility in laptops, especially in business applications, which is namely a big
screen. It is widely recognized that supply and household demand changed after the introduction of the
iPhone in mid 1997. We need another few years or so to see how this technology creates value in a wide
set of countries, and collect data about the experience.
It will be tempting to perform measurement similar to those found in this paper. It might even be
possible. It is very clear that 3G26 use has begun to grow around the world. Counting devices with 3G
capability as of the 4th quarter of 2009, Canada has 2.7 million , China has 9.4 million, Brazil 8.9 million,
Mexico 3.9 million, Spain 21.9 million, the U.K. 30.7 million, and the U.S. 122.6 million.27 Most of this
growth occurred in the last two years. Big screen use is considerably smaller, and, as noted, much of it
is for business use, which takes it outside the consumer surplus framework of this paper.28
At this time, however, several issues make it difficult to infer much from a few years experience. First,
the product category has taken considerable time to reach a stable market structure, and no observer
today would call it stable enough to define a clear price for a standardized service (which can be
compared over time). While the iPhone and Blackberry clearly lead as of this writing, competitive
responses organized by Palm, Microsoft, Nokia, and Google have been attempted, and those firms and
others will continue to attempt more. Such experimentation will continue as long as most executives in
those firms believe demand growth will continue. That makes it difficult to define the key features
needed for measurement – both price and quantity.
Second, it is quite difficult to characterize the earliest experiences in this market as the movement down
a demand curve, as our present framework interprets all such movements. Such a framework applies
most readily to a setting that has clearly moved beyond its early adopters, the set of intrepid users with
enthusiasm for technology. Though the market for smart phones has reached that point in the U.S. and
U.K., and probably has in Spain and Canada, it is not clear the market has reached that point yet in every
country. Once again, it appears as if it will do so soon, at which point measurement will be more clearly
defined.
Third, as of this writing it is unclear whether the majority of users treat their smart phones as substitutes
to their home broadband use. Smart phones provide additional mobility, and that might be a valuable
trait in and of itself, quite independently of the value of broadband. If smart phones are simply
additional services due to mobility, then the exercise in this paper could be applied, and the results
could be interpreted as the “value of mobile broadband.” If the additional services are partial
26 In these data 3G includes CDMA-2000 1xEV-DO Connections, CDMA-2000 1xEV-DO Rev A
Connections, TD-CDMA connections, and WCDMA Fam connections. 27 The data come from Wireless Intelligence, as of February, 2010. 28 According to IDC big screen and small screen use is roughly of similar magnitude in Brazil. In the
UK small screen use is five times larger than big screen, in Spain ten times, and in Mexico eighteen times larger.

19
substitutes, then estimation would need to understand how much wireline broadband the smart phone
replaced, looking for the net gain in using smart phones above and beyond using broadband lines.
Without such an adjustment any estimate would overestimate the gains to smart phones.
One last issue is particularly vexing for measurement of smart phone use, namely, the vague boundaries
between home and business use. Notions of consumer surplus will not apply well if a substantial set of
buyers are business users. With wireline broadband this is less of an issue because the destination of the
location for Internet access largely identifies its buyer (home or business). Smart phones, however, sell
both to home and business, and any estimate of consumer surplus would need to have clear
information about the bright line between these customers.
These issues should not deter further measurement. Rather, it suggests the discussion remains far from
closed. Because of leapfrogging of mobile over fixed broadband in emerging economies, mobile
broadband may be the first broadband experience for many people. So not only is it unclear whether
mobile broadband substitutes or complements fixed broadband, but the extent of substitutability could
vary substantially by country according each country's stage of infrastructure development.
We thus foresee numerous challenges extending these results to the next generation of mobile
broadband. That should motivate further interest in the topics covered in this article, and in approaches
related to them. We look forward to such efforts.

20
Sources
Atkinson, R. D., D. K. Correa, J. A. Hedlund. 2008. Explaining International Broadband Leadership, May 1,
http://www.itif.org/index.php?id=142.
Brussels Round Table. 2006. Restoring European economic and social progress: unleashing the potential
of ICT, Annexes to Main Report, Indepen, Diespeker Wharf, 38 Graham Street, London, UK, N1 8JX.
Cardona, M., A. Schwarz, B. B. Yurtoglu, and C. Zulehner. 2008. “Demand Estimation and Market
Definition for Broadband Internet Services.” Mimeo. University of Vienna.
Crandall, R., 2005. “Broadband Communications,” in Handbook of Telecommunications Economics, Eds.,
M. Cave, S. Majumdar, and I. Vogelsang, pp. 156‐187, Amerstam, The Netherlands; Elsevier.
Crandall, R., W., J. G. Sidak, and H. J. Singer. 2002. “The Empirical Case Against Asymmetric Regulation of
Broadband Internet Access.” Berkeley Law and Technology Journal 17 (1): 953–87.
Goldfarb, A. 2004. “Concentration in Advertising‐Supported Online Markets: An Empirical Approach.”
Economics of Innovation and New Technology 13(6):581–94.
Greenstein, Shane, and Ryan McDevitt, 2009, “The Broadband Bonus: Accounting for Broadband’s
Impact on U.S. GDP,” NBER Working paper 14758. http://www.nber.org
NTIA (National Telecommunications and Information Administration). 2010. “Digital Nation: 21rst
Century America’s Progress Toward Universal Broadband Internet Access,”
http://www.ntia.doc.gov/reports.html.
———. 1995. “Falling Through the Net: A Survey of the ‘Have Nots’ in Rural and Urban
America.” Accessed March 17, 2006. http://www.ntia.doc.gov/reports.html
Pereira, P., T. Ribeiro. 2006. “The Impact on Broadband Access to the Internet of the Dual Ownership of
Telephone and Cable Networks.” Mimeo.
Rappaport, P. L. Taylor, and D. Kridel, 2003, “Willingness to Pay and Demand for Broadband Services, in
(Ed), Allan L. Shampine, Down to the Wire, Nova Science Publishers Inc.; Hauppauge, NJ.
Rosston, G., 2009. “The Rise and Fall of Third‐Party High Speed Access.” Information and Economic
Policy, 21 (1), pp. 21 – 33.
Rosston, G., S.J. Savage, and D. Waldman. 2010. "Household Demand for Broadband Internet Service,"
SIEPR Discussion Paper 09‐008, Stanford University. http://siepr.stanford.edu/publicationsprofile/2109
Savage, S. J. and D. Waldman. 2004. “United States Demand for Internet Access.” Review of Network
Economics 3(3): Pp. 228‐247
Wallsten, Scott. 2009. “Understanding International Broadband Comparisons 2009 Update ,” Technology Policy Institute Working Paper. Available at SSRN: http://ssrn.com/abstract=1434570

21
22
Table 1. Overall Broadband Adoption
Table 2. Overall Dialup Adoption
Broadband Subscribers from Point TopicIn Thousands
YearNation 2003 2004 2005 2006 2007 2008 2009 CAGR
Brazil 634 1,442 2,671 4,278 5,691 7,509 9,480 47.2%Canada 3,706 4,829 5,809 6,982 8,001 8,860 9,528 14.4%China - 11,385 20,367 30,033 41,778 54,322 68,964 35.0%Mexico 234 429 1,060 1,945 3,106 4,774 7,836 65.1%Spain 1,401 2,524 3,444 5,469 7,322 8,296 9,023 30.5%United Kingdom 960 3,734 7,203 10,983 13,968 16,282 17,641 51.6%United States 16,042 28,770 37,576 47,489 58,791 67,536 77,334 25.2%
Dialup Subscribers from OECDIn Thousands
YearNation 2003 2004 2005 2006 2007 2008 2009 CAGR
Canada 2,846 2,381 1,876 1,437 1,088 824 624 -19.5%Mexico 2,016 2,134 1,960 1,719 1,288 965 723 -13.6%Spain 2,559 1,852 1,199 841 536 342 218 -29.7%United Kingdom 10,607 9,374 6,417 4,318 2,671 1,652 1,022 -28.4%United States 67,880 55,000 44,493 35,994 29,118 23,556 19,056 -16.6%

23
Table 3 Broadband Revenue Estimate
Broadband Revenue Estimate Using Point TopicIn Thousands of 2009 Local Currency, Real Terms
Nation 2003 2004 2005 2006 2007 2008 2009 CAGR
Brazil 1,294,154 2,581,327 4,446,171 6,677,188 8,660,612 11,959,924 11,969,980 37.4%Canada 1,717,952 2,352,523 2,860,999 2,931,341 3,082,933 2,970,079 3,112,854 8.9%China - 20,472,775 35,181,958 50,961,697 69,843,624 102,868,641 105,899,025 31.5%Mexico 1,193,741 2,055,538 4,744,069 8,380,884 12,820,374 19,811,401 29,461,214 58.1%Spain 775,689 1,317,567 1,686,770 2,095,704 2,864,485 2,410,174 2,484,086 18.1%United Kingdom 237,527 971,708 1,733,031 2,588,178 3,196,210 3,357,633 3,373,604 46.1%United States 10,287,743 17,630,773 20,114,146 20,081,002 23,728,754 27,214,363 28,446,051 15.6%
24
Table 4 Broadband Consumer Surplus Estimate
Broadband Consumer Surplus Estimate Using Point TopicIn Thousands of 2009 Local Currency, Real Terms
YearNation 2003 2004 2005 2006 2007 2008 2009 CAGR
Brazil 76,476 242,336 424,660 711,644 906,125 732,581 3,365,402 71.7%Canada 112,211 97,764 201,681 625,539 865,814 1,260,235 1,329,846 42.4%China - - 806,324 1,428,402 2,181,531 - 19,363,619 88.8%Mexico 36,419 87,825 193,137 375,601 651,181 770,741 2,602,165 84.0%Spain 16,203 50,210 138,113 525,808 563,560 1,392,932 1,509,804 91.1%United Kingdom 53,702 56,982 130,308 165,953 241,067 555,307 798,209 47.0%United States 342,406 335,281 2,314,854 6,258,536 7,212,023 7,357,369 10,106,207 62.2%

25
Table 5A Cannibalized Dialup Revenue Estimate
Table 5B.I Broadband Bonus Estimate with Cannibalized Dialup
Cannibalized Dialup Revenue Using OECDIn Thousands of 2009 Local Currency, Real Terms
YearNation 2003 2004 2005 2006 2007 2008 2009 CAGR
Canada 153,245 431,899 790,475 780,721 928,274 903,895 958,658 29.9%Mexico - - 612,341 1,401,123 2,761,753 3,668,897 4,209,230 47.0%Spain 264,253 644,978 972,280 926,805 947,695 636,503 631,292 13.2%United Kingdom 64,901 226,617 586,675 842,786 1,022,474 1,024,043 1,007,115 48.0%United States 2,328,896 5,936,192 8,240,040 6,138,964 6,814,296 8,137,521 9,485,053 22.2%
Broadband Bonus w/ Dialup Using Point TopicIn Thousands of 2009 Local Currency, Real Terms
YearNation 2003 2004 2005 2006 2007 2008 2009 CAGR
Canada 1,676,918 2,018,388 2,272,205 2,776,159 3,020,473 3,326,419 3,484,041 11.0%Mexico 1,230,160 2,143,362 4,324,865 7,355,362 10,709,802 16,913,244 27,854,148 56.2%Spain 527,639 722,799 852,602 1,694,708 2,480,349 3,166,603 3,362,599 30.3%United Kingdom 226,328 802,072 1,276,664 1,911,345 2,414,804 2,888,897 3,164,698 45.8%United States 8,301,253 12,029,862 14,188,959 20,200,574 24,126,482 26,434,212 29,067,205 19.6%

26
Table 5B.II Broadband Bonus Estimate without Cannibalized Dialup
Table 5C.I Broadband Bonus Estimate with Cannibalized Dialup in U.S.D
Broadband Bonus w/o Dialup Using Point TopicIn Thousands of 2009 Local Currency, Real Terms
YearNation 2003 2004 2005 2006 2007 2008 2009 CAGR
Brazil 1,370,630 2,823,663 4,870,831 7,388,832 9,566,737 12,692,505 15,335,382 41.2%Canada 1,830,163 2,450,287 3,062,680 3,556,880 3,948,747 4,230,314 4,442,700 13.5%China - 20,472,775 35,988,282 52,390,099 72,025,155 102,868,641 125,262,644 35.2%Mexico 1,230,160 2,143,362 4,937,206 8,756,485 13,471,555 20,582,142 32,063,378 59.3%Spain 791,892 1,367,777 1,824,882 2,621,513 3,428,045 3,803,106 3,993,890 26.0%United Kingdom 291,229 1,028,690 1,863,339 2,754,131 3,437,278 3,912,940 4,171,813 46.3%United States 10,630,149 17,966,054 22,429,000 26,339,538 30,940,777 34,571,732 38,552,257 20.2%
Broadband Bonus w/ Dialup Using Point TopicIn Thousands of 2009 USD, Real Terms
YearNation 2003 2004 2005 2006 2007 2008 2009 CAGR
Canada 1,087,919$ 1,557,639$ 1,855,164$ 2,399,031$ 2,567,774$ 3,293,810$ 2,844,580$ 14.7%Mexico 115,812$ 196,279$ 383,989$ 697,720$ 977,528$ 1,550,820$ 2,006,205$ 50.3%Spain 561,318$ 914,936$ 1,121,845$ 2,066,717$ 3,221,233$ 4,656,769$ 4,424,472$ 34.3%United Kingdom 365,045$ 1,458,313$ 2,408,800$ 3,353,237$ 4,734,910$ 5,664,504$ 4,586,519$ 43.6%United States 8,301,253$ 12,029,862$ 14,188,959$ 20,200,574$ 24,126,482$ 26,434,212$ 29,067,205$ 19.6%
27
Table 5C.II Broadband Bonus Estimate without Cannibalized Dialup in U.S.D
Broadband Bonus w/o Dialup Using Point TopicIn Thousands of 2009 USD, Real Terms
YearNation 2003 2004 2005 2006 2007 2008 2009 CAGR
Brazil 390,160$ 965,685$ 1,865,147$ 3,344,271$ 4,697,636$ 7,598,028$ 7,029,742$ 51.1%Canada 1,187,338$ 1,890,946$ 2,500,556$ 3,073,695$ 3,356,922$ 4,188,844$ 3,627,286$ 17.3%China -$ 2,472,557$ 4,346,411$ 6,491,958$ 9,245,848$ 14,208,376$ 18,313,252$ 39.6%Mexico 115,812$ 196,279$ 438,356$ 830,628$ 1,229,605$ 1,887,231$ 2,309,376$ 53.3%Spain 842,438$ 1,731,363$ 2,401,161$ 3,196,967$ 4,452,006$ 5,592,804$ 5,255,119$ 29.9%United Kingdom 469,724$ 1,870,345$ 3,515,734$ 4,831,808$ 6,739,761$ 7,672,431$ 6,046,106$ 44.1%United States 10,630,149$ 17,966,054$ 22,429,000$ 26,339,538$ 30,940,777$ 34,571,732$ 38,552,257$ 20.2%

28
Table 5D The Proportion of Broadband Bonus Stemming from Consumer Surplus
Consumer Surplus as a Proportion of Broadband Bonus w/o Dialup Using Point TopicIn 2009 USD Real Terms
YearNation 2003 2004 2005 2006 2007 2008 2009
Brazil 5.58% 8.58% 8.72% 9.63% 9.47% 5.77% 21.95%Canada 6.13% 3.99% 6.59% 17.59% 21.93% 29.79% 29.93%China 0.00% 2.24% 2.73% 3.03% 0.00% 15.46%Mexico 2.96% 4.10% 3.91% 4.29% 4.83% 3.74% 8.12%Spain 2.05% 3.67% 7.57% 20.06% 16.44% 36.63% 37.80%United Kingdom 18.44% 5.54% 6.99% 6.03% 7.01% 14.19% 19.13%United States 3.22% 1.87% 10.32% 23.76% 23.31% 21.28% 26.21%