Embed Size (px)
Citation preview

About OMICS GroupAbout OMICS GroupAbout OMICS GroupAbout OMICS GroupAbout OMICS GroupAbout OMICS GroupAbout OMICS GroupAbout OMICS Group
OMICS Group International is an amalgamation of Open Accesspublications and worldwide international science conferences andevents. Established in the year 2007 with the sole aim of making theinformation on Sciences and technology ‘Open Access’, OMICSGroup publishes 400 online open access scholarly journals in allaspects of Science, Engineering, Management and Technologyaspects of Science, Engineering, Management and Technologyjournals. OMICS Group has been instrumental in taking theknowledge on Science & technology to the doorsteps of ordinarymen and women. Research Scholars, Students, Libraries,Educational Institutions, Research centers and the industry are mainstakeholders that benefitted greatly from this knowledgedissemination. OMICS Group also organizes 300 Internationalconferences annually across the globe, where knowledge transfertakes place through debates, round table discussions, posterpresentations, workshops, symposia and exhibitions.

About OMICS Group ConferencesAbout OMICS Group ConferencesAbout OMICS Group ConferencesAbout OMICS Group ConferencesAbout OMICS Group ConferencesAbout OMICS Group ConferencesAbout OMICS Group ConferencesAbout OMICS Group Conferences
OMICS Group International is a pioneer and leading science event organizer, which publishes around 400 open access journals and conducts over 300 Medical, Clinical, Engineering, Life Sciences, Pharma scientific conferences all over the globe annually with the support of more than 1000 scientific associations and 30,000 editorial board members and 3.5 million associations and 30,000 editorial board members and 3.5 million followers to its credit.
OMICS Group has organized 500 conferences, workshops andnational symposiums across the major cities including SanFrancisco, Las Vegas, San Antonio, Omaha, Orlando, Raleigh,Santa Clara, Chicago, Philadelphia, Baltimore, United Kingdom,Valencia, Dubai, Beijing, Hyderabad, Bengaluru and Mumbai.

Recent Advances in the Applications of
Chromatography-Mass Spectrometry to
Environmental Matrix Analysis
Peter J Baugh
Peter J Baugh Track 7 Environmental Analytical Aspects
3
Peter J Baugh
Coordinator of the EMSSIG
(The BMSS)
www.analyticalmethodologycentre.co.uk
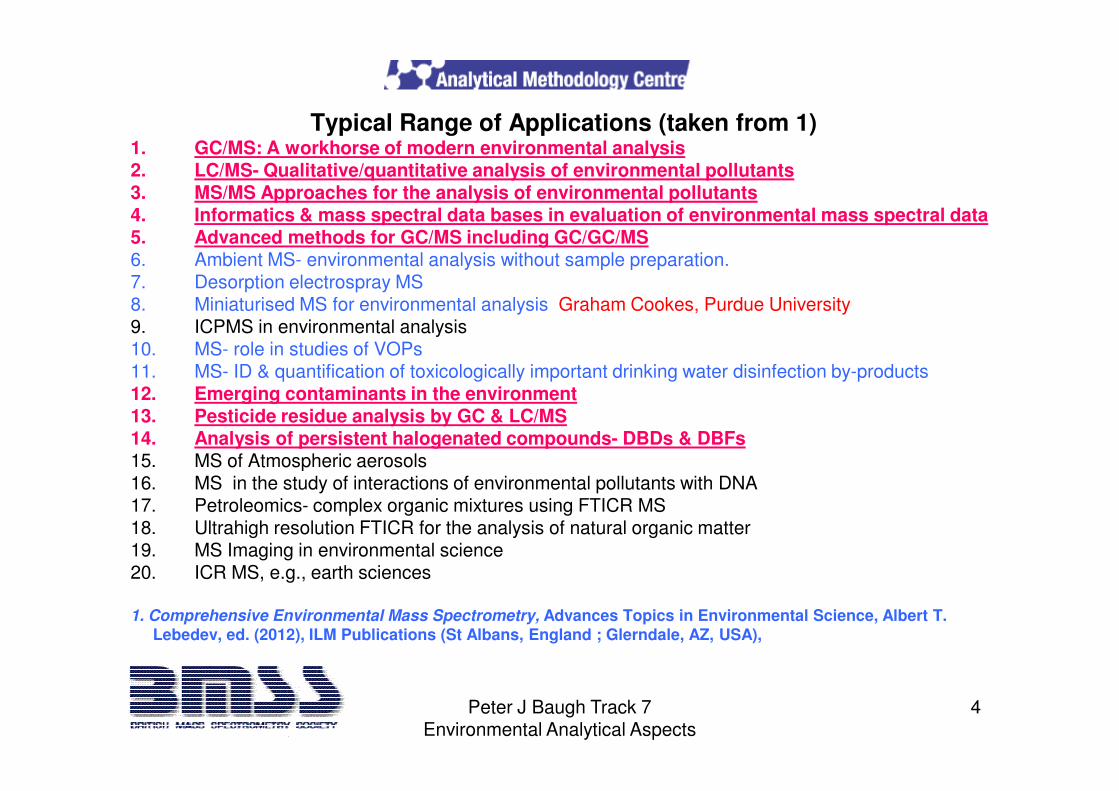
Typical Range of Applications (taken from 1)1. GC/MS: A workhorse of modern environmental analysis2. LC/MS- Qualitative/quantitative analysis of environmental pollutants3. MS/MS Approaches for the analysis of environmental pollutants4. Informatics & mass spectral data bases in evaluation of environmental mass spectral data5. Advanced methods for GC/MS including GC/GC/MS6. Ambient MS- environmental analysis without sample preparation.7. Desorption electrospray MS8. Miniaturised MS for environmental analysis Graham Cookes, Purdue University9. ICPMS in environmental analysis10. MS- role in studies of VOPs11. MS- ID & quantification of toxicologically important drinking water disinfection by-products12. Emerging contaminants in the environment
Peter J Baugh Track 7 Environmental Analytical Aspects
4
12. Emerging contaminants in the environment13. Pesticide residue analysis by GC & LC/MS14. Analysis of persistent halogenated compounds- DBDs & DBFs15. MS of Atmospheric aerosols16. MS in the study of interactions of environmental pollutants with DNA17. Petroleomics- complex organic mixtures using FTICR MS18. Ultrahigh resolution FTICR for the analysis of natural organic matter19. MS Imaging in environmental science20. ICR MS, e.g., earth sciences
1. Comprehensive Environmental Mass Spectrometry, Advances Topics in Environmental Science, Albert T.Lebedev, ed. (2012), ILM Publications (St Albans, England ; Glerndale, AZ, USA),

Schedule of Presentation
1. Introduction
2. 3. 4. & 5 Sample Preparation ; yes or no matrix dependent
6. Chromatography – GC, LC
7. & 8. Mass Spectrometry – ionisation and analyser functions
9. & 10. LRMS & HRMS exemplified ; other instrumentation used
11. Applications Illustrated
Peter J Baugh Track 7 Environmental Analytical Aspects
5
12. Data System Software Capability exemplified
The focus is on selected examples of GLC & HPLC with LRMS and HRMS. There is insufficient time available to review extensively this extremely large field of analysis. Several areas are highlighted to illustrate the power and capability of the instrumentation and options available to the environmental analyst.
Sound bites and snapshots of the recent advances.

1. Introduction- general comments
The ever increasing sophistication in instrumentation means yesterday’s data canbe somewhat obsolete and there is continuing need to refine acquiredinformation. Particularly, important are the sensitivity, specificity anddetection limits obtainable, which enable ever decreasing levels of pollutantsto be detected, and quantified. Also the regulations on permissible levels areever-changing in parallel.
It is important to emphasise where the problems lie in relation to ensuring that thedata obtained reflect accurately the integrity of the sample and what itoriginally contained. It is not a case hopefully, of GI & GO as it has frequently
Peter J Baugh Track 7 Environmental Analytical Aspects
6
data obtained reflect accurately the integrity of the sample and what itoriginally contained. It is not a case hopefully, of GI & GO as it has frequentlybeen when characterising a complex polluted sample. Remember whatoccurred in 1976 when the first packed column GC/MS analysis attempted bythe EPA (USA) where the introduction of one dirty sample totally clogged upthe instrument, even though GC/MS was selected as the facility of choice forenvironmental analysis.
To this end the introduction of the sample-front end, through separation & analysis to the back end- dataacquisition, handling and processing must be considered insequence and integrally.
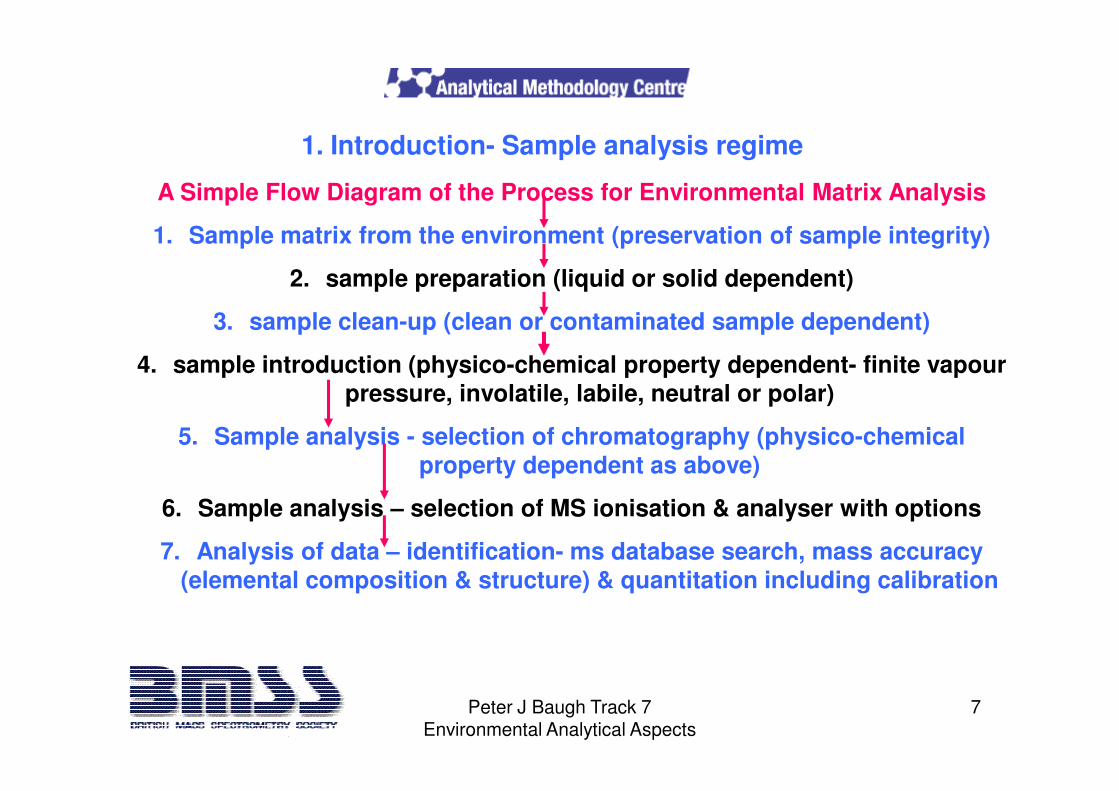
A Simple Flow Diagram of the Process for Environmental Matrix Analysis
1. Sample matrix from the environment (preservation of sample integrity)
2. sample preparation (liquid or solid dependent)
3. sample clean-up (clean or contaminated sample dependent)
4. sample introduction (physico-chemical property dependent- finite vapour pressure, involatile, labile, neutral or polar)
1. Introduction- Sample analysis regime
Peter J Baugh Track 7 Environmental Analytical Aspects
7
pressure, involatile, labile, neutral or polar)
5. Sample analysis - selection of chromatography (physico-chemical property dependent as above)
6. Sample analysis – selection of MS ionisation & analyser with options
7. Analysis of data – identification- ms database search, mass accuracy (elemental composition & structure) & quantitation including calibration
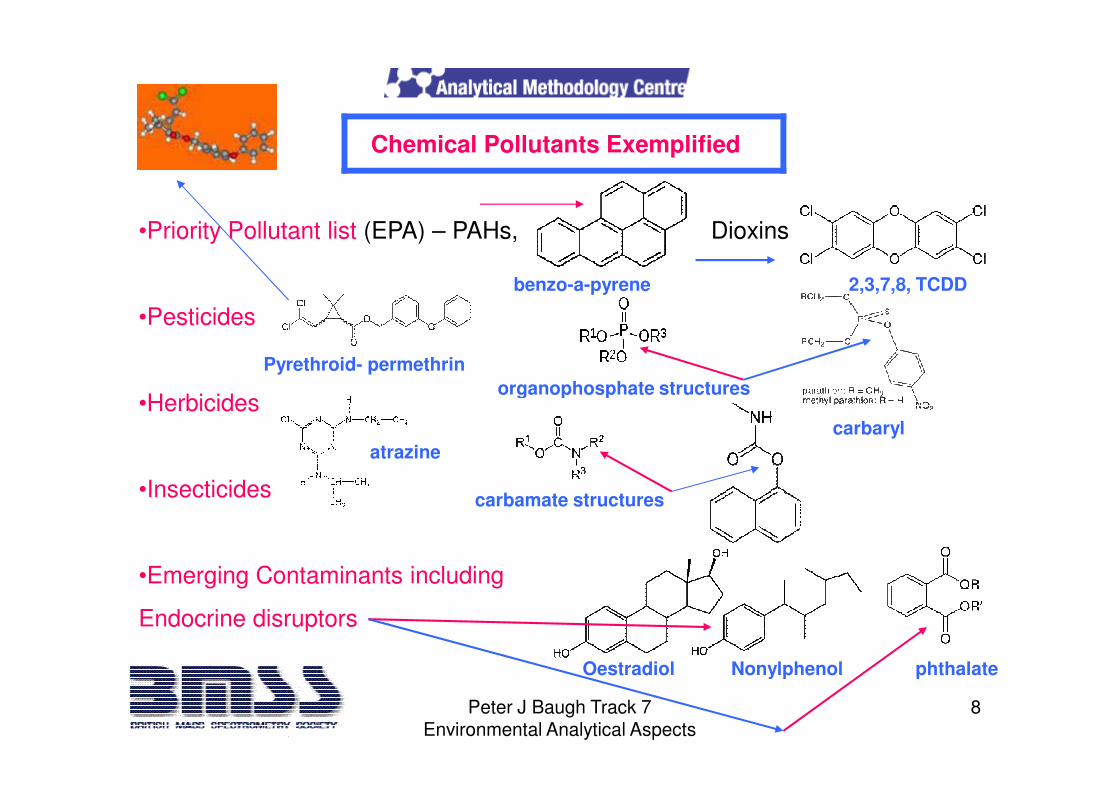
Chemical Pollutants Exemplified
•Priority Pollutant list (EPA) – PAHs, Dioxins
•Pesticides
•Herbicides
Pyrethroid- permethrin
2,3,7,8, TCDD
organophosphate structures
benzo-a-pyrene
Peter J Baugh Track 7 Environmental Analytical Aspects
8
•Herbicides
•Insecticides
•Emerging Contaminants including
Endocrine disruptors
carbaryl
Oestradiol Nonylphenol phthalate
atrazine
organophosphate structures
carbamate structures

2. Sample Preparation
It may be that sample preparation still commands as important a placeas ever in the analysis when taking a finite amount of the raw matrixthrough a number of stages to obtain the final residue in a specificvolume, in which extraction, separation via RP and NP columnchromatography modes with the addition of standards (isotopicallylabelled) having the same chemistry as the target compounds areinvolved.
A good example of the rigour required is in the sample preparation andwork up for dioxin analysis
Peter J Baugh Track 7 Environmental Analytical Aspects
9
There has been a strenuous effort to render sample preparation largelyunnecessary but a considerable element of clean up still remains. Theavailability of high resolution MS/MS which allows an increase in specificitycan largely remove the need for matrix treatment thus avoiding the everpresent problem of false positives. Limitations here can revolve around thenumber of MS/MS ion programs (precursor to product ion transitions) thatcan be accommodated when confronted with a multi-component mixture.Obviously MS/MS LRMS is of less value for unknown components.
work up for dioxin analysis
On-Line SPME
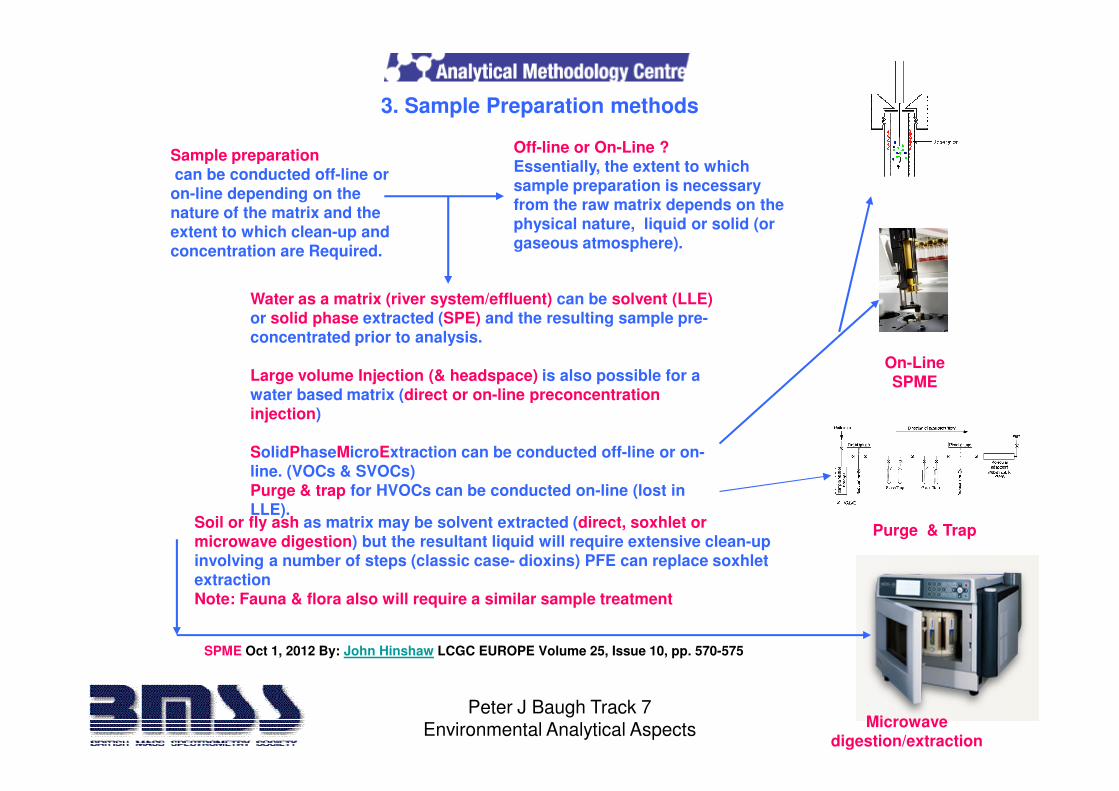
Sample preparationcan be conducted off-line or on-line depending on the nature of the matrix and the extent to which clean-up and concentration are Required.
3. Sample Preparation methods
Off-line or On-Line ?Essentially, the extent to which sample preparation is necessary from the raw matrix depends on the physical nature, liquid or solid (or gaseous atmosphere).
Water as a matrix (river system/effluent) can be solvent (LLE) or solid phase extracted (SPE) and the resulting sample pre-concentrated prior to analysis.
Large volume Injection (& headspace) is also possible for a water based matrix (direct or on-line preconcentration
Peter J Baugh Track 7 Environmental Analytical Aspects
10
Purge & Trap
Microwave digestion/extraction
water based matrix (direct or on-line preconcentration injection)
SolidPhaseMicroExtraction can be conducted off-line or on-line. (VOCs & SVOCs) Purge & trap for HVOCs can be conducted on-line (lost in LLE).
Soil or fly ash as matrix may be solvent extracted (direct, soxhlet or microwave digestion) but the resultant liquid will require extensive clean-up involving a number of steps (classic case- dioxins) PFE can replace soxhlet extractionNote: Fauna & flora also will require a similar sample treatment
SPME Oct 1, 2012 By: John Hinshaw LCGC EUROPE Volume 25, Issue 10, pp. 570-575

4. Sample Clean up exemplified
Clean waters relatively free of particulates can be filtered through solid-phase extraction (SPE)discs that, for example, quantitatively retain dioxins & furans. The EPA Methods 8260 and 8270 arethe basis of the sample preparation for polychlorinated dibenzo-p-dioxins, polychlorinateddibenzofurans and PCBs in surface and ground water.
Typical sample clean-up for Dioxins & Furans Analysis post soxhlet extraction
•Removal of lipids by sulphuric acid treatment Basic Soxhlet extraction
Peter J Baugh Track 7 Environmental Analytical Aspects
11
•Removal of lipids by sulphuric acid treatment
•Removal of interfering components by acidic/basic silica gel
•Separation of PCBs and similar interferences by activated alumina
•Separation of non-planar molecules by activated charcoal
Pressurised fluid extraction (PFE) recently introduced requires less solvent use
and reduced extraction time (EPA method 3545).
Basic Soxhlet extraction unit ; automated multi-extraction systems are available.
See later for details of GC/HRMS for ultra-trace analysis

4. Sample Treatment/Clean up exemplified
100 mL water
SPE
C18 cartridge
Flow rate 1 mL/min
Conditioning:
MeOH
AcOEt:DCM
Flow Diagrams for the determination of pesticides in water
Washing:
Deionised water
Elution:
FiltrationSurrogate
mix, ppb
100 mL water
SPEOasis HLB cartridge
Centrifugation if required
HCOOH
Surrogate mix
Conditioning:
MeOH
Acetone
Peter J Baugh Track 7 Environmental Analytical Aspects
12
AcOEt:DCM
MeOH
Deionised
water
Elution:
AcOEt:DCM (1:1)
Evaporation, @ 40o
N2
Reconstitution, 0.5 mL
solvent
Extract
GC/QqQMS/MS
HCOOH 1%
Vacuum dried
Elution,
5 mL acetone
Evaporation @ 40o
N2
Reconstitution
1 mL, 10% ACN (aq)
Extract
UHPLC/QqQMS/MS
For examples see 11. Applications illustrated, later

5. Sample Preparation, Injection Modes & Instrument Alternatives
Matrix Extraction Clean-up Injection
Modes
Instrument
Alternatives/preferences
water LLE/SPE No
(Preconcent-
ration)
Automated
On-line SPME
Purge & Trap or
Headspace
LC/MS-
Q, QqQ, TOF,
QTOF
SIM,MS/MS,MRM
GC/MS
IT, Q, QqQ, TOF,
QTOF
SIM,MS/MS,MRM
waste water LLE/SPE Yes
(Preconcent-
ration)
Automated
On-line SPME
Purge & Trap or
Headspace
Q, QqQ, TOF,
QTOF
SIM,MS/MS,MRM
IT, QMS, QqQMS,
TOF, QTOF
SIM/ MRM
Soil Soxhlet yes Automated QqQ GC/HRMS)
Peter J Baugh Track 7 Environmental Analytical Aspects
13
Soil
sediment
Soxhlet
PFE
yes Automated
Injection,
(headspace for
HVOCs)
QqQ
QTOF
GC/HRMS)
SIM (dioxins)
Flyash
(Incinerator)
soxhlet
PFE
yes Automated
injection
QqQ
MS/MS
GC/HRMS
SIM (dioxins)
Pressurised fluid extraction (PFE) recently introduced requires less solvent use and reduced extraction time (EPA method 3545).
Comments MS/MS more
selective for
CDDs/CDFs than
PCBs
10,000 resoluion
in SIM

6. Chromatography
• Capillary GLC: c.30-40% of pollutants with finite vapour pressures (including GC x GC,heart cut variations). Fast GC (MS) is capable of reducing analysis times by a factor of 3 -10 using small diameter thin film capillary columns typically- 20 m x 0.15 mm i.d. x 0.12µm film but with reduced sample capacity.
• HPLC/UHPLC: non-volatile, semi & polar pollutants
Ultra high-performance liquidchromatography, UHPLC, usescolumns packed with porous sub-2-µm particles (usually 1.8 µm) tovastly increase throughput andresolving power compared to
Peter J Baugh Track 7 Environmental Analytical Aspects
14
• IMS- Ion mobility coupled to MS
• SFC: volatile & non-volatile (with polar additive to SF stream) not discussed
conventional 5-µm columns (P ≤
19000 psi). Important to avoidcolumn overload.
Ion mobility equation.
Resolving power of drift tube

6. Chromatography- GLC or HPLC & UPLC?
HPLC in gradient elution mode is increasingly used for Environmental Analysis with increase inelution strength of the solvent during separations to allow analysis of the more retainedmolecules.
LC/MS can be used for Environmental Analysis in many instances but GC/MS is still preferred for dioxin analysis.
Whereas coupling of capilllary GC to MS is relatively simple LC is more challenging for several reasons:
• Gas phase ions are required to be generated from either solvated molecules or ionised in
Peter J Baugh Track 7 Environmental Analytical Aspects
15
API covers a number of ionisation processes, which are soft ionisation modes unlike EI for GC/MS (Note though enhanced M+ applying lower ionisation energy for EI for GC x GC TOF without reduction in sensitivity)
Atmospheric Pressure Ionisation, API, APCI, APPI
Electrospray ESI, DESI
• Gas phase ions are required to be generated from either solvated molecules or ionised in liquid mobile phase. Nebulisation, desolvation, ionisation processes occur in the MS source at atmospheric pressure – API
• Ions formed in the source should be transferred efficiently into the optics of the MS while eliminating the huge volume of gas produced by evaporation of the MP
• Neutral compounds as contaminants should be eliminated as far as possible.

7. Ionisation/Scan Mode of choice
•EI full scan for ms data base search ; SIM for selected ion monitoring & higher levels of detection (GC-MS)
•EI/CI with MS/MS for M+ and
Peter J Baugh Track 7 Environmental Analytical Aspects
16
for M+ and precursor to product ion transition monitoring MRM
•API/APCI with LC-MS/MS for M+ or M.-
DESI

API Ionization processesAPI Ionization processesCharge Transfer
N2+●
N2e-
2e-
2N2
N4+● M+●
MCorona dischargeneedle
M� “Dry” source conditions
7. Ionisation/Scan Mode of choice
Peter J Baugh Track 7 Environmental Analytical Aspects
17
M+●
M� “Dry” source conditions
� Favoured by relatively
non-polar compounds
Proton Transfer
Corona dischargeneedle N2
+●
N4+●
H2O
H2O+●
H2O
H3O+●
+OH●
MH+
M
� Modified source
conditions eg. With
methanol presence
� Favoured by relatively
polar compounds

ESI
7. Ionisation/Scan Mode of choice
Peter J Baugh Track 7 Environmental Analytical Aspects
18

8. Mass Analysers
Single Quadrupole Mass Filter
Schematic of tandem mass spectrometry, QqQ
Ion trap
Peter J Baugh Track 7 Environmental Analytical Aspects
19
QTOF with ion mobility separator (or collision cell not shown here)
Ion trap

What is Orbitrap analyzer?
Orbitrap analyzer =
+ Image current detection+ Image current detection
(Quadro-logarithmic potential)
(axial oscillations)
8. Mass Analysers- Orbitrap
Peter J Baugh Track 7 Environmental Analytical Aspects
20
+ Image current detection+ Image current detection
I(t)
oscillations)
+ + ElectrodynamicElectrodynamic squeezingsqueezing
+ External pulsed ion + External pulsed ion
sourcesource
(time-dependent field during injection)
(C-trap)

8. Mass Analysers- Orbitrap
Peter J Baugh Track 7 Environmental Analytical Aspects
21
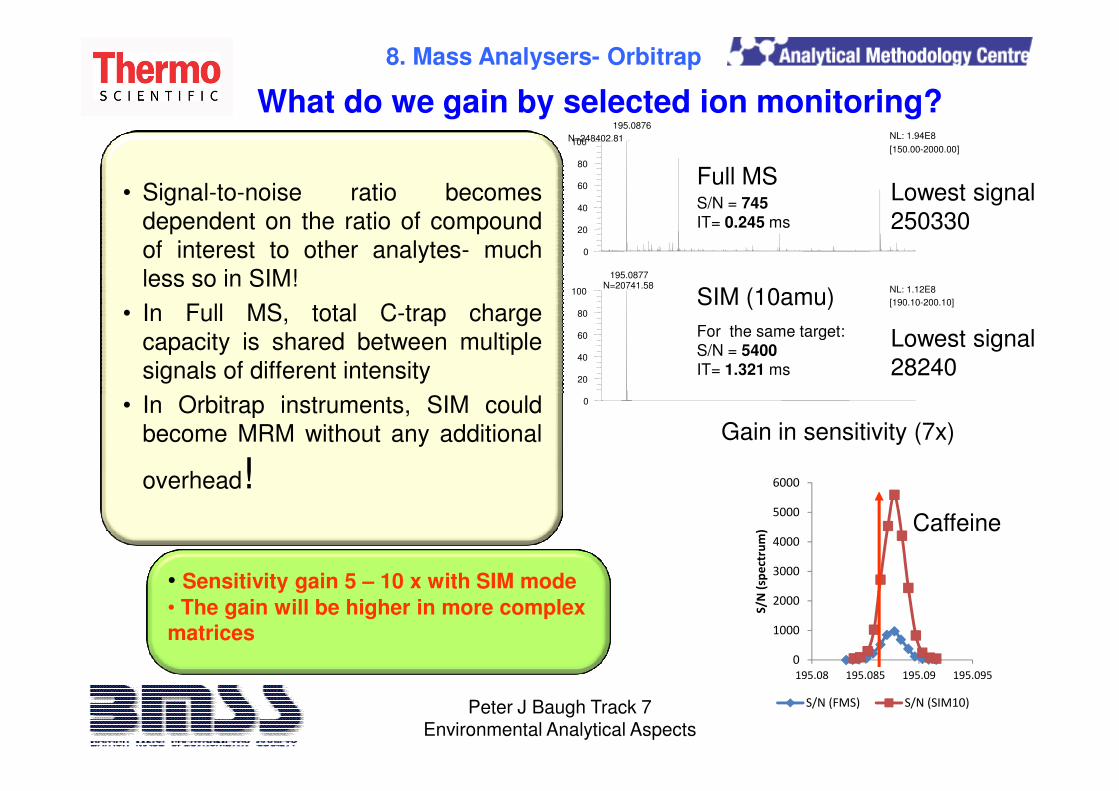
What do we gain by selected ion monitoring?
• Signal-to-noise ratio becomes
dependent on the ratio of compound
of interest to other analytes- much
less so in SIM!
• In Full MS, total C-trap charge
capacity is shared between multiple
signals of different intensity
• In Orbitrap instruments, SIM could
20
40
60
80
100
0
20
40
60
80
100
195.0876
N=248402.81
195.0877N=20741.58
NL: 1.94E8
[150.00-2000.00]
NL: 1.12E8
[190.10-200.10]
Full MS
SIM (10amu)
S/N = 745IT= 0.245 ms
For the same target:
S/N = 5400IT= 1.321 ms
Lowest signal
250330
Lowest signal
28240
8. Mass Analysers- Orbitrap
Peter J Baugh Track 7 Environmental Analytical Aspects
22
• Sensitivity gain 5 – 10 x with SIM mode
• The gain will be higher in more complexmatrices
• In Orbitrap instruments, SIM could
become MRM without any additional
overhead!
0
0
1000
2000
3000
4000
5000
6000
195.08 195.085 195.09 195.095
S/N
(sp
ect
rum
)
S/N (FMS) S/N (SIM10)
Gain in sensitivity (7x)
Caffeine
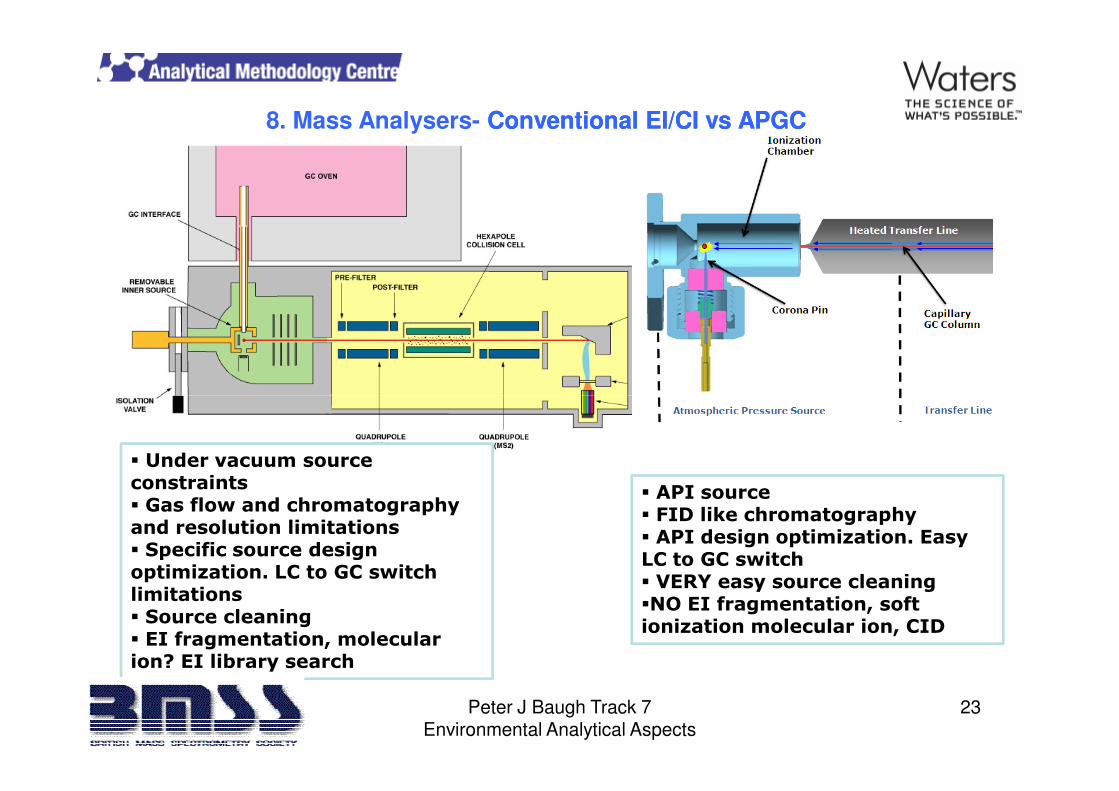
8. Mass Analysers- Conventional EI/CI vs APGCConventional EI/CI vs APGC
Peter J Baugh Track 7 Environmental Analytical Aspects
23
� API source� FID like chromatography� API design optimization. Easy LC to GC switch� VERY easy source cleaning�NO EI fragmentation, soft ionization molecular ion, CID
� Under vacuum source constraints� Gas flow and chromatography and resolution limitations� Specific source design optimization. LC to GC switch limitations� Source cleaning� EI fragmentation, molecular ion? EI library search

8. Mass Analysers- Sensitivity & Parameters
Analyser Mass Range
[*10-3]}
Resolution, [∆m/z]
Resolving
PowerFWHM [*10-3]
Mass
Accuracy [ppm]
MS/MS Scan Rate
[Scans/s]
Q 3 0.1 - 0.7 - Low - 0.5 - 4
QqQ 3 0.1 - 0.7 - Low MS/MS 0.5 - 4
IT 4 - 20 0.1 - 0.7 - Low MSN 5 - 10
Peter J Baugh Track 7 Environmental Analytical Aspects
24
LIT 4 -20 0.1 - 0.7 - Low MSN 1 - 10
Orbitrap 6 - 50 - 100 ≤5 MSN 0.5 - 2
oaTOF 20 - 40 - 15 - 20 ≤5 20 - 30
QqTOF 10 - 40 - 15 - 25 ≤5 MS/MS 20 - 30
Sector, EB
hybrid
5 - 15 - 30 - 80 ≤5 MS/MS 0.1 – 0.5

Single quadrupole or ion trap instruments are employed for environmental analysis where low cost isrequired. However, tandem quadrupole systems are preferred and for general quantitative analysis MS/MS.MRM is used providing selectivity, sensitivity and linearity over a wide range. Screening methods allow alarge number of target compounds to be analysed and target pollutants to be confirmed and quantified.MRM is limited to detecting specified compounds selected.
9. Low resolution instruments (IT, Q & QqQ/TSQ)
Features/capabilities of TSQs are:
•Acquisition speed: capability 10 ms per acquisition ;
•Multi residue methods require fast analysis with UPLC and 2MRMs (transitions) per compound and n x 2MRM, where n = 50 – 200, the number of target compounds.
Peter J Baugh Track 7 Environmental Analytical Aspects
25
2MRM, where n = 50 – 200, the number of target compounds.
•Time programmed methods are used with time windows to select a number of MRMs for compounds expected (retention time related) as for single quadrupoles in SRM mode
•Linearity: TSQ 5 – 6 orders of magnitude
NOTE Ion traps can be used aslow cost alternative to TSQsand Qtrap (quadrupole + lineartrap) can be employed in EA asa conventional TSQ, enablinggood sensitivity.
Only the most recent/sensitiveLC/TSQ can achieve requiredDetection Limits (DLs) in drinkingwater by direct sample injection.

9. TandemQ continued
Applications of interest include, pesticides, drug residues and oestrogenics, drugsof abuse, residues from personal care products, halogenated compounds havingdomestic and industrial applications and ECDs are required (EC directive). AnLC/MS/MS method with 2 MRM transitions is confirmatory if the quantification andconfirmation are in the expected ratio and the retention time is within the expectedtime window.
Peter J Baugh Track 7 Environmental Analytical Aspects
26
Targeted methods are also employed to detect and quantifiy a known list of compounds in an environmental matrix, such as, surface water. Targeted screening is the descriptive term for a more extensive list of compounds. The ID can be confirmed using a second transition and the amount can be calculated.
Pre-concentration 500x to 1 ml (GC/MS) or tosample volumes of 50 ml with an increase ininstrument sensitivity (LC/TQ) can be applied.Alternatively on-line pre-concentration can beused as for SPME where the total sample isinjected ; usually used for a class ofcompounds, such as acidic herbicides becauseof the problems associated with generalmethod development. Surface contaminatedwaters can reduce column lifetime because ofthe possibility intractable materials(particulates) present.
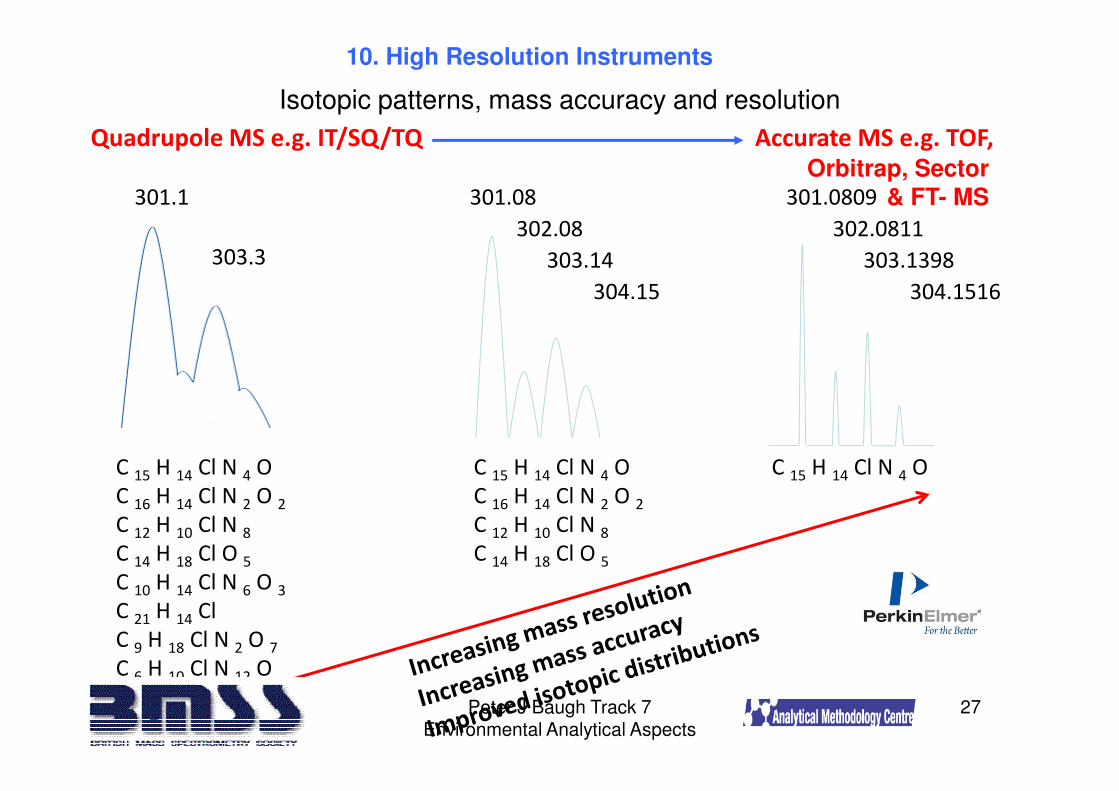
Isotopic patterns, mass accuracy and resolution
301.1
303.3
301.08
303.14
302.08
304.15
301.0809
303.1398
302.0811
304.1516
Quadrupole MS e.g. IT/SQ/TQ Accurate MS e.g. TOF,
Orbitrap, Sector & FT- MS
10. High Resolution Instruments
Peter J Baugh Track 7 Environmental Analytical Aspects
27
C 15 H 14 Cl N 4 O
C 16 H 14 Cl N 2 O 2C 12 H 10 Cl N 8C 14 H 18 Cl O 5C 10 H 14 Cl N 6 O 3C 21 H 14 Cl
C 9 H 18 Cl N 2 O 7C 6 H 10 Cl N 12 O
C 15 H 14 Cl N 4 O
C 16 H 14 Cl N 2 O 2C 12 H 10 Cl N 8C 14 H 18 Cl O 5
C 15 H 14 Cl N 4 O

10. High Resolution Instruments
Double Focusing HR Mass Spectrometer for ultra-trace analysis
GC/HRMS operated in SIM mode is almost universally employed for ultra-trace analysis toselectively distinguish pollutant masses from the background. The advent of high sensitivityelectron multipliers allows low femtogram detection of ions separated by HRMS and todistinguish between isotope-labelled analogues and the native compounds. There are a numberof criteria for positive ID
1. Elution correct time window
2. Peak must be Gaussian
3. Intensity > 3:1 (S/N)Isotope dilution MS allows ability to monitor recovery,recovery of LIS can be used to monitor sample
Peter J Baugh Track 7 Environmental Analytical Aspects
28
4. For CDDs, the 2,3,7,8 congeners must elute within ± 2 s of labelled analogues (LIS)
5. Isotope ratios must be within 15% of theoretical values
recovery of LIS can be used to monitor sampleextraction efficiency, LIS can be used as GC RTmarkers, IS can be used to enhance sensitivity at lowconcentrations by acting as carriers through the cleanup stages and analysis
QC requirements are rigorous to avoid falsepositives and negatives and involve- extensiveuse of blanks, dedicated facilities, use of isotopedilution, replicate analyses, interlab comparison,certified reference material, validation ofchromatography, multi-point HRMS calibration,validation of peaks- GC & MS, trained staff.
EB Dual Focus Sector (& reverse geometry BE
10. High Resolution Instruments, continued
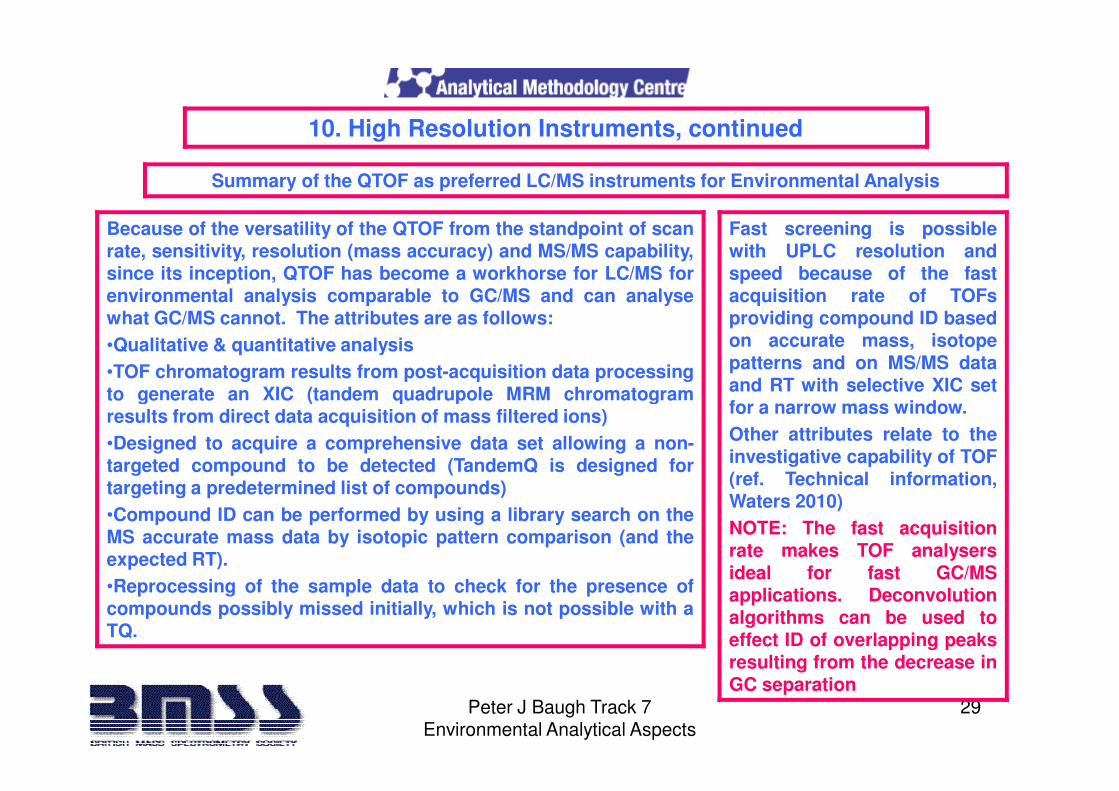
Because of the versatility of the QTOF from the standpoint of scanrate, sensitivity, resolution (mass accuracy) and MS/MS capability,since its inception, QTOF has become a workhorse for LC/MS forenvironmental analysis comparable to GC/MS and can analysewhat GC/MS cannot. The attributes are as follows:
•Qualitative & quantitative analysis
•TOF chromatogram results from post-acquisition data processingto generate an XIC (tandem quadrupole MRM chromatogram
Summary of the QTOF as preferred LC/MS instruments for Environmental Analysis
Fast screening is possiblewith UPLC resolution andspeed because of the fastacquisition rate of TOFsproviding compound ID basedon accurate mass, isotopepatterns and on MS/MS dataand RT with selective XIC set
Peter J Baugh Track 7 Environmental Analytical Aspects
29
to generate an XIC (tandem quadrupole MRM chromatogramresults from direct data acquisition of mass filtered ions)
•Designed to acquire a comprehensive data set allowing a non-targeted compound to be detected (TandemQ is designed fortargeting a predetermined list of compounds)
•Compound ID can be performed by using a library search on theMS accurate mass data by isotopic pattern comparison (and theexpected RT).
•Reprocessing of the sample data to check for the presence ofcompounds possibly missed initially, which is not possible with aTQ.
for a narrow mass window.
Other attributes relate to theinvestigative capability of TOF(ref. Technical information,Waters 2010)
NOTE: The fast acquisitionrate makes TOF analysersideal for fast GC/MSapplications. Deconvolutionalgorithms can be used toeffect ID of overlapping peaksresulting from the decrease inGC separation

5000
6000
7000
8000
9000
10000
6490
S/N
1 p
g r
eserp
ine
6490 Advances Sensitivity 50 Fold in 4 Years
11. Applications illustrated 1. TandemQuad Sensitivity progression
Peter J Baugh Track 7 Environmental Analytical Aspects
30
30
0
1000
2000
3000
4000
2006 2007 2008 2009 2010
64106460S
/N 1
pg
reserp
ine

Trace metals
•Identification/quantification of
elements such as arsenic,
lead, and mercury at ppt levels
Persistent organic
pollutants (POPs)
•Monitoring trace-level residues in
Hormones in water
•Identification/quantitation of compounds and metabolites, which can affect marine organism physiology
Disinfection by-products
•Balancing the benefits of disinfection
11. Applications illustrated 1. Inter-comparison of MS Instrumentation
GC/MS, LC/MS, GC/QQQ, LC/QQQ, LC/Q-TOF, LC/TOF, ICP/MS
Peter J Baugh Track 7 Environmental Analytical Aspects
31
October 10, 2014Confidentiality Label
31
•Monitoring trace-level residues in
the environment
•PCBs, Dioxins, and
prefluorinated compounds
Indoor air testing
•Fast screening for solvents, paints,
and other volatile organics
(sick building syndrome)
•Thermal desorption techniques for
monitoring air inside vehicles
•Balancing the benefits of disinfection (microbial control) with the creation of possible carcinogenic compounds
Nutrients in water
•UV/VIS and fluorescence solutions for nitrites, phosphates

Sample Inlet
NebulizationGas Inlet
Auxiliary Gas Inlet
Heater
Nebulizer
Patented New Field Free APCI Design – ASMS 2009
Corona needle ‘hidden’ within the
grounded body of the APCI
nebulizer. The intense field gradient
associated with the Corona needle
is invisible to the Ion transportation
field
11. Applications illustrated 2. Direct Sampling Injection
Peter J Baugh Track 7 Environmental Analytical Aspects
32
Corona Discharge Needle
Thermocouple
To MS Analyzer
Capillary Orifice into Vacuum
Endplate Electrode
Heated CounterCurrent Gas Flow
Sample Ions
APCI Probe Exit
Sample stream forced
into the region of the
corona discharge
…
•Wetting a SPE cartridge with MeOH
148.07 155.14
163.05
164.06
168.01 175.08
180.08
182.04 189.05
191.08
197.92
198.09
199.09
202.08
208.11
209.10
210.11
212.11
219.11
221.91
222.11
223.10
226.08 226.12
227.12
228.21
239.13
240.09
243.11
249.13
255.15
160 170 180 190 200 210 220 230 240 250 260m/z
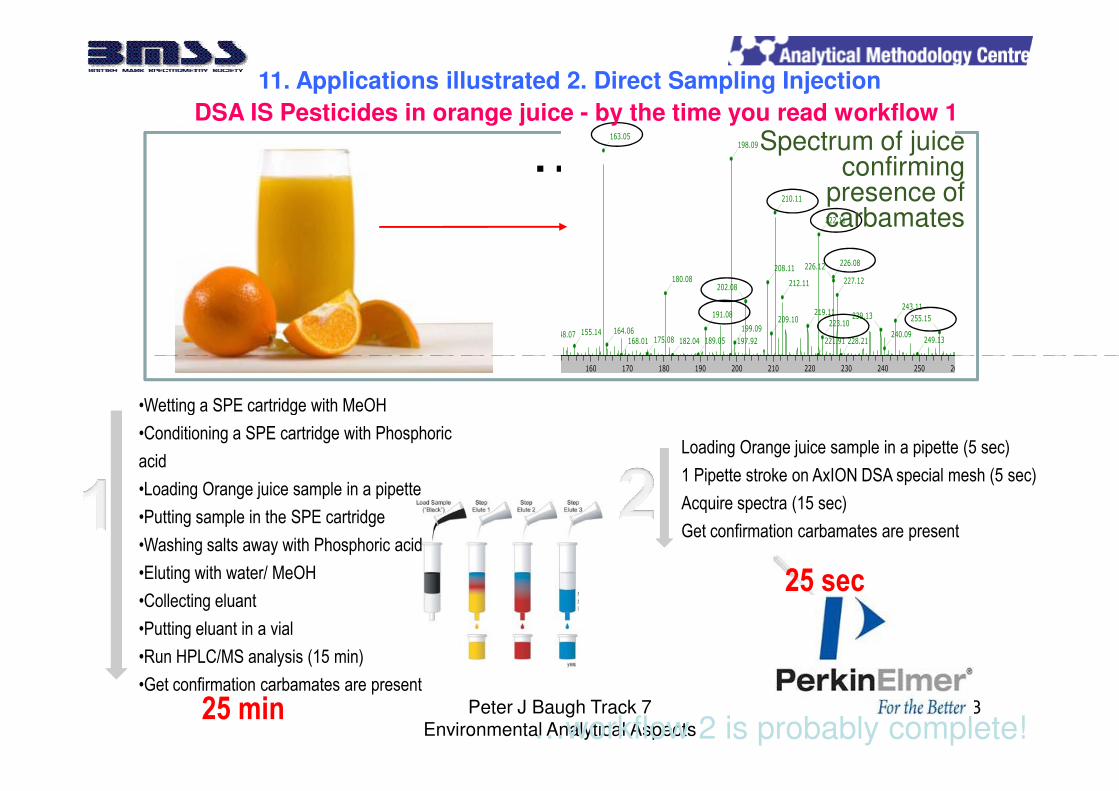
Spectrum of juice confirming
presence of carbamates
DSA IS Pesticides in orange juice - by the time you read workflow 1
11. Applications illustrated 2. Direct Sampling Injection
Peter J Baugh Track 7 Environmental Analytical Aspects
33
•Wetting a SPE cartridge with MeOH
•Conditioning a SPE cartridge with Phosphoric
acid
•Loading Orange juice sample in a pipette
•Putting sample in the SPE cartridge
•Washing salts away with Phosphoric acid
•Eluting with water/ MeOH
•Collecting eluant
•Putting eluant in a vial
•Run HPLC/MS analysis (15 min)
•Get confirmation carbamates are present
…workflow 2 is probably complete!
Loading Orange juice sample in a pipette (5 sec)
1 Pipette stroke on AxION DSA special mesh (5 sec)
Acquire spectra (15 sec)
Get confirmation carbamates are present
25 sec
25 min

When do you need a TOF for the correct results?
11. Applications illustrated 2 . LC/TOF-MS
Peter J Baugh Track 7 Environmental Analytical Aspects
34

11. Applications illustrated 3. Ion Mobility MS, QTOF
Peter J Baugh Track 7 Environmental Analytical Aspects
35

F
O
OH
O
N N
N
H
H+
Ciprofloxacin (M+H=m/z 332.1410)
3D view of mobility separated co3D view of mobility separated co--eluting isobaric masses at 1.92 minseluting isobaric masses at 1.92 mins
The two components of ciprofloxacin are
11. Applications illustrated 3. Ion Mobility MS
Peter J Baugh Track 7 Environmental Analytical Aspects
36
The two components of ciprofloxacin are shown here.How is it certain that these components are ciprofloxacin.Well, by generating accurate mass measurement and fragmentation information for these two components after separation by ion mobility.The components identified are empirically isobaric.
70eV
16eV
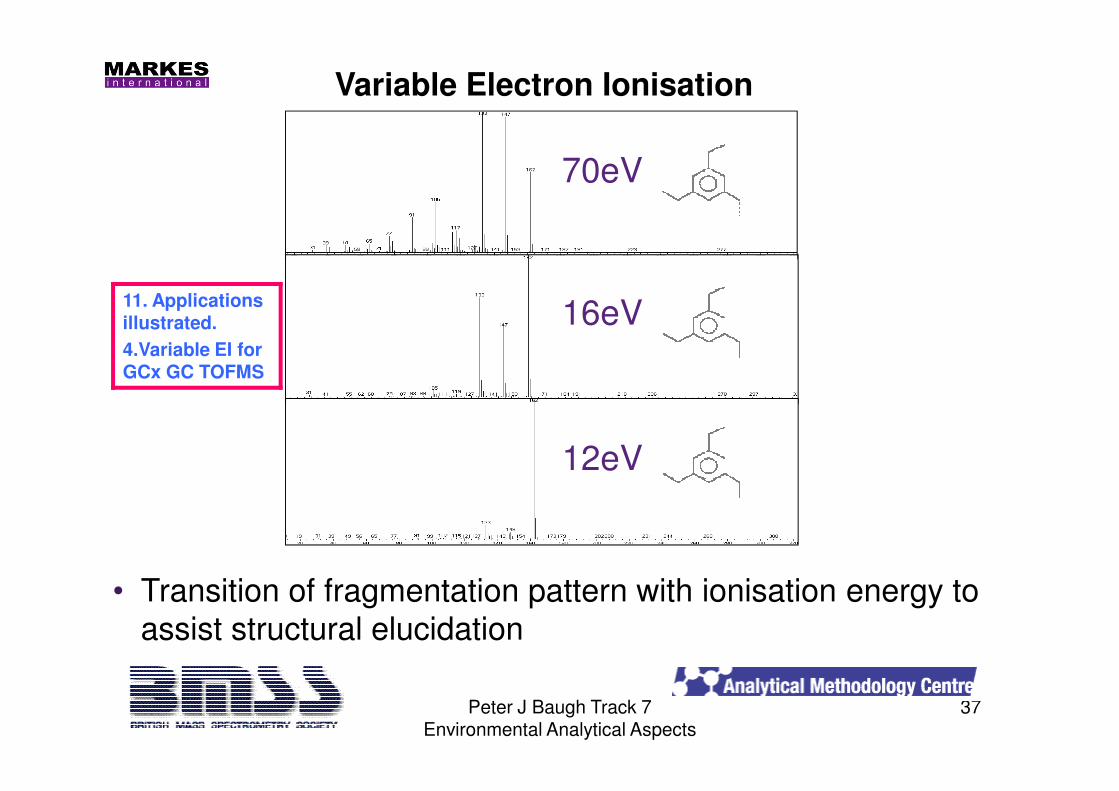
Variable Electron Ionisation
11. Applications illustrated.
4.Variable EI for GCx GC TOFMS
Peter J Baugh Track 7 Environmental Analytical Aspects
37
12eV
• Transition of fragmentation pattern with ionisation energy to
assist structural elucidation

• Comprehensive two-dimensional gas chromatography
• Two columns of different selectivity connected in series.
• A modulator pulses 1st column eluents onto the 2nd column in
11. Applications illustrated. 4. GCx GC TOFMS
Peter J Baugh Track 7 Environmental Analytical Aspects
38
eluents onto the 2 column in narrow bands.
Enhanced separation for analysis of complex
mixtures!

11. Applications illustrated.
4. GCx GC TOFMS
Analysis of emerging contaminants
Peter J Baugh Track 7 Environmental Analytical Aspects
39
A. Gravell, P. Kutty, G.Mills, D. Barden and S. Smith, LCGC: Current Trends in Mass Spectroscopy, March 2013, 8-15.
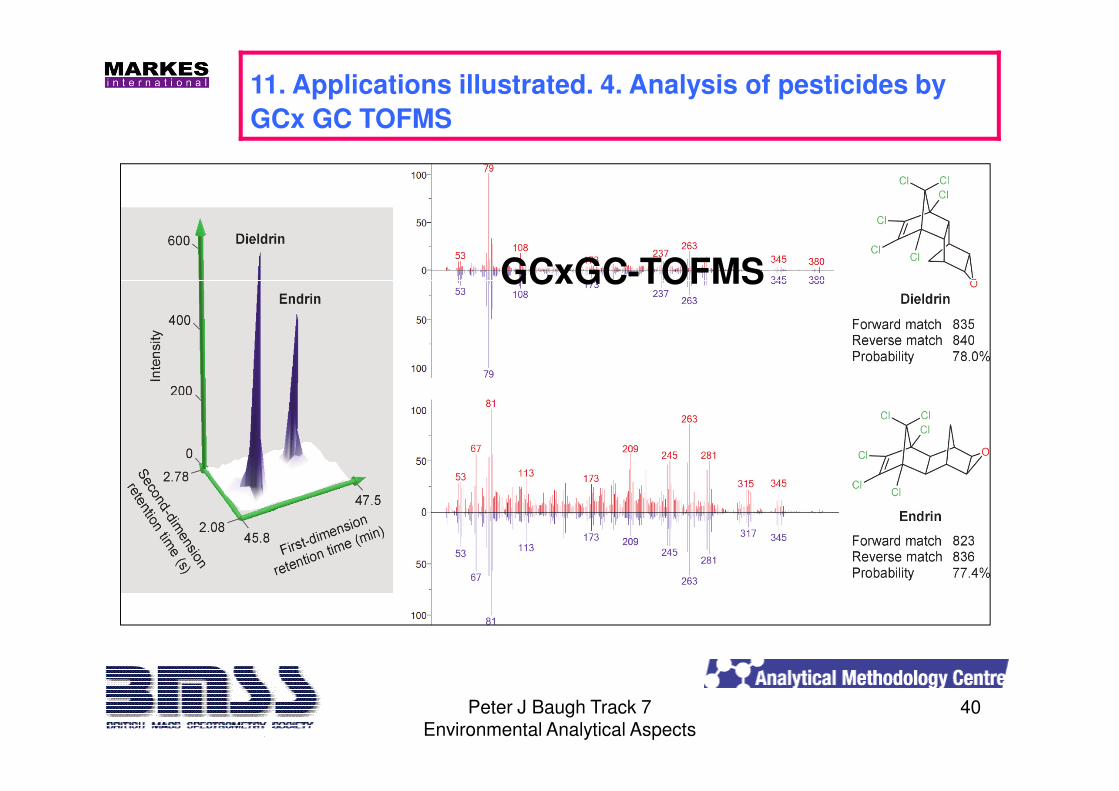
GCxGC-TOFMS
11. Applications illustrated. 4. Analysis of pesticides by
GCx GC TOFMS
Peter J Baugh Track 7 Environmental Analytical Aspects
40

11. Applications illustrated. 5. PesticideScreener
•Complete LC-QTOF solution based on high resolution, accurate mass data for multi-target screening in food and feed samples.
Peter J Baugh Track 7 Environmental Analytical Aspects
41
Atrazine
Report
Processing
TargetAnalysis High Quality
Pesticide Database
IdentificationConfirmation
Sample
Pesticidesfood, feed, water
LC-QTOF-MS
RSLC +maXis impactHigh sensitivityhigh resolution
accurate mass datatrue isotope pattern
October 10, 2014 41

146.0594
183.0995253.0308
277.1800
23.+MS, 5.48-5.73min #323-338, found: Thiacloprid (C 10 H 9 Cl 1 N 4 S 1 , 252.0236, [ [M+H]+: 253.0309])
0.2
0.4
0.6
0.8
1.0
5x10
Intens.
Aldicarb Fragm 116
Carbaryl Fragm 145
0.6
0.8
1.0
5x10
Intens.
Data
www.bruker.comwww.bruker.comwww.bruker.com
11. Applications illustrated. 5. PesticideScreener
Complete Data
Peter J Baugh Track 7 Environmental Analytical Aspects
42
183.0995
225.1094
277.1800
298.2741371.3165
253.0309
23. Thiacloprid (C 10 H 9 Cl 1 N 4 S 1 , 252.0236, err[mDa]: 0.17, mSigma: 16.9)0.0
0.0
0.5
1.0
1.5
2.0
4x10
150 200 250 300 350 400 m/z
October 10, 2014 42
Butocarboxim Fragm 75
Aldicarb Fragm 89
Carbendazim Fragm 160
Carbofuran Fragm 165
Carbendazim
Dimethoate Fragm 199
Thiabendazole
Carbaryl
Aldicarb (NH4) Carbaryl (NH4)
Carbofuran
Acetamiprid
Dimethoate
Pirimicarb
Thiacloprid
Imidacloprid
Metalaxyl
4.5 5.0 5.5 6.0 6.5 7.0 7.5 8.0 Time [min]
0.0
0.2
0.4
0.6
1. Exact mass2. Isotopes3. Retention
time
��������
Data
Thiacloprid,Theoretical
One-click link back to the original data – full ability to examine chromatograms and spectra.
12. Data System Capabilities in brief
The acquisition of data (and rate) has reached enormous proportions and one file can have acapacity as great as 1Gb, for example, for a QTOF in which all ions are detected over the timeperiod of the analysis. The data acquisition has several purposes.
1. To generate EI mass spectra which can be search via a mass spectral data base. GC/MSprimarily
• NIST/EPA/NIH spectral database ; 244k compounds
• Wiley Registry of Mass Spectral Data, 9th edition (McLafferty, 2010) ; 666k compounds
All relevant information relating to each compound is included in the data base – mass spectra,primary name, synonyms, structure, elemental composition, nominal mass formula, CA Servcie
Peter J Baugh Track 7 Environmental Analytical Aspects
43
primary name, synonyms, structure, elemental composition, nominal mass formula, CA ServcieRegistry number (CASrn) and a number identifying the position in the database. There are anumber of other DBs – viz. pesticides, pollutants and metabolites and organisation generatedDBs.
2. NIST MS DB with LC/MS Data. With the advent of TOF MS accurate mass measurements areavailable to environmental analysts, which with isotope peak intensities can enable developmentof elemental compositions for unknowns. The large DBs can be searched to determine ifcompounds have identified elemental compositions.
3. NIST DB with the search program can also be used with data obtained by collision activation,CAD or MS/MS, for neutral loss searches determine the losses from a specified precursor.

•ACD/Labs provides the ability to link interpreted analytical data with its chemical and geographical context and store in a database
•Stores the chemical profile of a sample point or product•Spot changes via chemo-metrics•Compare good or normal conditions with bad or emergency conditions and identify differences•Do spectral searching to see what other samples or sample points have a specific compound of interest•Also useful for environmental fate studies but drawing degradation pathways and characterizing the degradants by spectroscopy
•Automated full scan GC-MS screening•De-convolute a chromatogram and identify compounds from a library•Blank subtraction and single point quantitation against internal standards•Automated boiling point predictions to help identify the correct library hit in full scan GC-MS
12. Data System Software Capability exemplified
Peter J Baugh Track 7 Environmental Analytical Aspects
44
•Compare two samples and spot differences•Automated LC-MS screening
•De-convolution and formula searching against a library•Toxicity predictions for identified chemical structures
•Acute Toxicity•Aquatic Toxicity•Genotox•Predicted health effects+ others
•Automated archiving of raw data files retrievable via a database search•Full audit trail
•Chromatography method development•Prediction of where a compound will elute within a method (also useful for identification)

An example of a fully automated GC-MS automated screening system
Sample data
Run Full Scan GC-MS
(and SIM if required)
Analyst runs instrument
Chemo-metricsAuto-deconvolute the
chromatogram and store
extracted components
Raw file sent to archive
Location stored in
database
Data sets automatically
picked up from the
instrument directory
12. Data System Software Capability exemplified
Peter J Baugh Track 7 Environmental Analytical Aspects
45
Toxicity predictions
Boiling point predictions

Acknowledgements
1. The British Mass Spectrometry Society for support.2. The Organising Committee, OMICS, for assistance with registration &
accommodation expenses.3. Mark Upton, PERKIN ELMER, for illustration of Direct Sampling Analysis using New
Field Free APCI Design & applications.4. Simon Stevens & Laura McGregor, MARKES INTERNATIONAL., for GCxGC-TOFMS
illustration and examples.5. Daniel McMillan, Waters, for illustration of Q-IM-TOFMS & GC-TOFMS
instrumentation and example applications.6. Tony Drury, BRUKER, for LC-Q-TOFMS and applications.7. Tim Steele, AGILENT Technologies for TandemQ applications.
Peter J Baugh Track 7 Environmental Analytical Aspects
46
7. Tim Steele, AGILENT Technologies for TandemQ applications.8. Claudia C. B. Martins, THERMO FISHER SCIENTIFIC, for LC/orbitrap-MS illustration
& applications.9. Peter Russell, ACDLabs for software capability & applications.10. Chromedia for illustration of instrumentation diagrams.11. ILM Publications for text & information from articles in reference 1.
Thank you for your
attention and for listening