Embed Size (px)
Citation preview

About Omics Group
OMICS Group International through its Open AccessInitiative is committed to make genuine and reliablecontributions to the scientific community. OMICSGroup hosts over 400 leading-edge peer reviewedOpen Access Journals and organize over 300Open Access Journals and organize over 300International Conferences annually all over the world.OMICS Publishing Group journals have over 3 millionreaders and the fame and success of the same can beattributed to the strong editorial board which containsover 30000 eminent personalities that ensure a rapid,quality and quick review process.

About Omics Group conferences
• OMICS Group signed an agreement with more than 1000International Societies to make healthcare informationOpen Access. OMICS Group Conferences make theperfect platform for global networking as it brings togetherrenowned speakers and scientists across the globe to amost exciting and memorable scientific event filled withmuch enlightening interactive sessions, world classmost exciting and memorable scientific event filled withmuch enlightening interactive sessions, world classexhibitions and poster presentations
• Omics group has organised 500 conferences, workshopsand national symposium across the major cities includingSanFrancisco,Omaha,Orlado,Rayleigh,SantaClara,Chicago,Philadelphia,Unitedkingdom,Baltimore,SanAntanio,Dubai,Hyderabad,Bangaluru and Mumbai.

Mid-infrared semiconductor laser based trace gas
analyzers: advances, applications & future outlook
OUTLINE
S. So 1a, R. Lewicki1,2,
W. Ren2,W. Jiang2, Y. Cao2, D. Jiang2, F.K. Tittel2b
V. Spagnolo3, Pietro Patimisco3
1Sentinel Photonics, Princeton, NJ 085402 Rice University, 6100 Main St., Houston, TX 77005
3Univerity of Bari, Italy
a) [email protected]; b) [email protected]
Laser Optics2014
Philadelpia, PA
September,8-10, 2014
Research support by NSF ERC MIRTHE, NSF-ANR NexCILAS, the Robert Welch Foundation, and Sentinel
Photonics Inc. via an EPA and NSF SBIR sub-award is acknowledged
• New Laser Based Trace Gas Sensor Technology
� Novel Multipass Absorption Cell & Electronics
� Quartz Enhanced Photoacoustic Spectroscopy
• Examples of Mid-Infrared Sensor Architectures
� C2H6, NO, CO and CH4
� Future Directions of Laser Based Gas Sensor
Technology and Conclusions

Motivation for Mid-infrared C2H6 Detection
• Atmospheric chemistry and climate
� Fossil fuel and biofuel consumption,
� biomass burning,
� vegetation/soil,
� natural gas loss
• Oil and gas prospecting
• Application in medical breath analysis (a non-invasive method to identify Targeted C H(a non-invasive method to identify and monitor different diseases):
� asthma,
� schizophrenia,
� Lung cancer,
� vitamin E deficiency.
HITRAN absorption spectra of C2H6, CH4, and H2O
4
Targeted C2H6
absorption line

NOAA Monitoring & Sampling Location: Alert, Nunavut, Canada
ALT, Ethane Concentration Measurements
General View on the FacilityLatitude: 82.4508º North
Longitude: 62.5056º WestElevation: 200.00 m
5

C2H6 Detection with a 3.36 µm CW DFB LD using a Novel
Compact Multipass Absorption Cell and Control Electronics
Schematic of a C2H6 gas sensor using a Nanoplus 3.36 µm DFB laser diode
as an excitation source. M – mirror, CL – collimating lens, DM – dichroic
2f WMS signal
for a C2H6 line
at 2976.8 cm-1
at a pressure of
200 Torr
as an excitation source. M – mirror, CL – collimating lens, DM – dichroic
mirror, MC – multipass cell, L – lens, SCB – sensor control board.Innovative long path, small volume
multipass gas cell: 57.6m with 459 passes
MPC dimensions: 17 x 6.5 x 5.5 (cm)
Distance between the MPC mirrors: 12.5 cm
Minimum detectable C2H6 concentration is:
~ 740 pptv (1σ; 1 s time resolution)

� High pathlength/volume ratio
� Simple spherical mirrors
� Utilize entire mirror surface - embrace optical aberration
MULTIPASS CELL TECHNOLOGY
aberration
� Flexible design – two opposing mirrors
� Typ. 10% throughput for 459 passes
Herriott Cell Pattern Sentinel 3.7 m cell Sentinel 57 m cell

From Conventional PAS to QEPAS
Laser beam,
power P
Absorption α
Modulated
(P or λ) at f
or f/2
SWAP RESONATING ELEMENT!!!
Q>>1000
Cell is OPTIONAL!
V-effective volume
Piezoelectric crystal
Resonant at f
quality factor Q
Vf
PQS
α~
or f/2
×
∆
α=
Hz
Wcm-1
min
f
PNNEA
8

Quartz Tuning Fork as a Resonant Microphone for QEPAS
Unique properties
• Extremely low internal losses:
� Q~10 000 at 1 atm
� Q~100 000 in vacuum
• Acoustic quadrupole geometry
� Low sensitivity to external sound
• Large dynamic range (~106) – linear from thermal noise to breakdown deformation
� 300K noise: x~10-11 cm� 300K noise: x~10 cm
� Breakdown: x~10-2 cm
• Wide temperature range: from 1.6K to ~700K
Acoustic Micro-resonator (mR) tubes
• Optimum inner diameter:0.6 mm; mR-QTF gap is 25-50 µm
• Optimum mR tubes must be ~ 4.4 mm long (~λ/4<l<λ/2 for sound at 32.8 kHz)
• SNR of QTF with mR tubes: ×30 (depending on gas composition and pressure)
9

Motivation for Nitric Oxide Detection
• Atmospheric Chemistry
• Environmental pollutant gas monitoring� NOX monitoring from automobile exhaust and
power plant emissions
� Precursor of smog and acid rain
• Industrial process control
� Formation of oxynitride gates in CMOS Devices
• NO in medicine and biology� Important signaling molecule in physiological
processes in humans and mammals (1998 Nobel Prize in Physiology/Medicine)
� Treatment of asthma, COPD, acute lung rejection
• Photofragmentation of nitro-based explosives 10

NO: 5.26 µm
CO: 4.66 µm CH2O: 3.6 µm
CO2: 4.2 µm
CH4: 3.3 µm
COS: 4.86 µm
Molecular Absorption Spectra within two Mid-IR
Atmospheric Windows and NO absorption @ 5.26µm
0.06
0.08
0.10
0.12
0.14
0.16
Abso
rption
[%
]
1ppm NO at 250 Torr, L=1 m
NH3: 10.6 µm O3: 10 µm
N20, CH4: 7.66 µm
12.5 µm 7.6 µm
3.1 µm5.5 µm
Source: HITRAN 2000 database
1800 1850 1900 1950
0.00
0.02
0.04
0.06
Abso
rption
[%
]
Wavenumber [cm-1]
11

Emission spectra of a 1900cm-1 TEC CW DFB QCL
and HITRAN Simulated spectra
Output power: 117 mW @ 25 C
Thorlabs/Maxion 12

CW TEC DFB QCL based QEPAS NO Gas Sensor
Schematic of a DFB-QCL based Gas Sensor.
PcL – plano-convex lens, Ph – pinhole,
QTF – quartz tuning fork, mR – microresonator,
RC- reference cell, P-elec D – pyro electric detector
13

Performance of CW DFB-QCL based WMS QEPAS
NO Sensor Platform
2
4
6
8
10
QE
PA
S 2
f sig
nal [a
.u.]
1ppm NO + 2.4% H2O, P= 240 Torr
100
200
0.1% NO at P=200 Torr, 5 cm ref. cell
QE
PA
S 3
f sig
nal [a
.u.]
40
60
80
100
NO
con
ce
ntr
ation [
ppb]
95 ppb NO reference cylinder
NO
14
2f QEPAS signal amplitude for 95 ppb NO
when DFB-QCL was locked to the 1900.08
cm-1 line.
900 890 880 870 860 850
-4
-2
0
QE
PA
S 2
f sig
nal [a
.u.]
Laser current [mA]
-100
0
QE
PA
S 3
f sig
nal [a
.u.]
2f QEPAS signal (navy) and reference 3f signal (red)
when DFB-QCL was tuned across 1900.08 cm-1 NO
line.
Minimum detectable NO concentration is:
~ 3 ppbv (1σ; 1 s time resolution)
13:37 13:40 13:43 13:46 13:49
0
20
NO
con
ce
ntr
ation [
ppb]
Time [HH:MM]
N2N2

Motivation for Carbon Monoxide Detection
• Atmospheric Chemistry� Incomplete combustion of natural gas, fossil fuel
and other carbon containing fuels.
� Impact on atmospheric chemistry through its reaction with hydroxyl (OH) for troposphere ozone formation and changing the level of greenhouse gases (e.g. CH4).gases (e.g. CH4).
• CO in medicine and biology� Hypertension, neurodegenerations, heart failure and
inflammation have been linked to abnormality in CO metabolism and function.
15

Performance of a NWU 4.61 µm high power CW TEC DFB QCL
4
5
6
7
8
9
10
11
12
T=18 oC
T=12.5 oC
T=15 oC
λ~4.6 µm DFB QCL
cw operation
Optica
l p
ow
er(
mW
)
Vo
lta
ge
(V
)
0
100
200
300
400
500
600
700
800
900
1000
T=10 oC
2164.8
2165.4
2166.0
2166.6
2167.2
2167.8
2168.4
2169.0
2169.6
2170.2
2170.8
2171.4
R6 CO line
Wa
ven
um
be
r(cm
-1)
T=10 oC
T=12.5 oC
T=15 oC
T=18 oC
R5 CO line
0 200 400 600 800 1000 1200
Current (mA)
500 600 700 800 900 1000 1100 1200 13002164.8
Current (mA)
2166 2168 2170 2172 2174 21760.0
0.3
0.6
0.9
1.2
1.5
x10-5
R8R7
Absorp
tion
Wavenumber (cm-1)
200 ppb CO 2% H2O
x10-5
R6R5
0.0
0.1
0.2
0.3
0.4 300 ppb N
2O
Absorp
tion
CW DFB-QCL optical power and current tuning at a four different QCL temperatures.
Estimated max wall-
plug efficiency (WPE)
is ~ 7% at 1.25A QCL
drive-current.

400
500
600
700
800
900 P=760 Torr
CO
concentr
ation (
ppb)
From cigarette
CW DFB-QCL based CO QEPAS Sensor Results
-30
-15
0
15
30
45
60
2169.1 2169.2 2169.3-450
0450900
Modulation depth=50 mA
P=760 Torr
x104
QE
PA
S S
ign
al (C
nts
)
Wavenumber (cm-1)
with 2.6% H2O
dry gas
(a)
Pure Nitrogen
(b)
2f QEPAS signal for dry (red) and moisturized (blue)
10:00 11:00 12:00 13:00 14:00 15:000
100
200
300C
O c
oncentr
ation (
ppb)
Time (HH:MM)
17:00 17:20 17:40 18:00 18:200
10
20
30
40
17:00 17:05 17:10 17:15
0.0
0.5
1.0
1.5
2.0
N2
50 ppb
x104
QE
PA
S S
ign
al
(Cn
ts)
Time (HH:MM)
N2
x104
P=760 Torr
Modulation depth=40 mA
N250 ppb 100 ppb
250 ppb
500 ppb
1000 ppb
2500 ppb
QE
PA
S S
ignal (C
nts
)
Time (HH:MM)
5000 ppb
Gas with 2.6% H2O
17Dilution of a 5 ppm CO reference gas mixture when
the CW DFB-QCL is locked to the 2169.2 cm-1 R6 CO line.
2f QEPAS signal for dry (red) and moisturized (blue)
5 ppm CO:N2 mixture near 2169.2 cm-1.
Minimum detectable CO concentration is:
~ 2 ppbv (1σ; 1 s time resolution)
Atmospheric CO concentration levels on Rice University campus,
Houston, TX

QEPAS based CH4 and N2O Gas Sensor
ZnSe Pc L mR mRQTF
Ge Pc L7.83 µm
CW DFB-QCL
CH4 & N2O
Ph
Acoustic Detection Module
(ADM)
Needle valve
Gas inlet
Pressure
controller &
Flow meter
Pump
Gas outlet
-
+
QCL Driver
Pre-Amp
Temperature
controller
M
M
RCPD
Motivation for CH4 andN2O Detection
• Prominent greenhouse gases
• Sources : Wetlands, leakagefrom natural gas systems,fossil fuel production andagriculture
•Applications: Environmental, medical and aerospace (N2O)
QCL Driver
Control Electronics Unit (CEU)
Lock-in
2f
Data collection and processing
Lock-in
3f
controller
Detection Limit (1σ) with a 1-sec averaging time
Methane (CH4) (1275.04 cm-1) 13 ppbv
Nitrous Oxide (N2O) (1275.5 cm-1) 6 ppbv
440 450 460 470 480 490 500
-1.0
-0.5
0.0
0.5
1.0
1.5
2.0
2f
Sig
na
l x 1
05 (a
. u.)
Injected Current (mA)
Baseline
2f signal (1.8 ppmv N2O)
2f Signal Ambient Air
2f Signal (1 ppmv CH4)
Pressure
130 Torr
T
21.5 °C
AM
4 mA
f
32760 Hz
fmod
16380 Hz
123 mW
132 mW
158 mW
161 mW
Deduced N2O concentration in the ambient
laboratory air: 331 ppbv
Submitted to The Analyst Aug. 2013
18
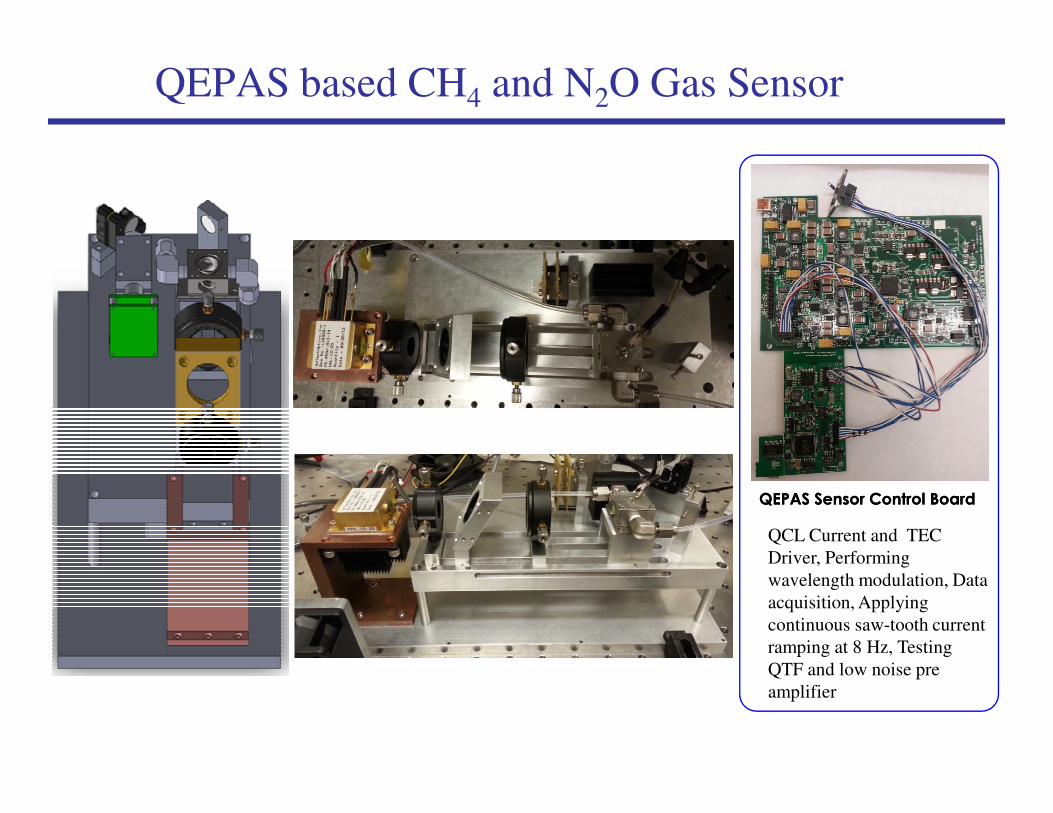
QEPAS based CH4 and N2O Gas Sensor
QEPAS Sensor Control BoardQEPAS Sensor Control Board
QCL Current and TEC
Driver, Performing
wavelength modulation, Data
acquisition, Applying
continuous saw-tooth current
ramping at 8 Hz, Testing
QTF and low noise pre
amplifier

NIR
VIS
Molecule (Host) Frequency, cm-1
Pressure,
Torr
NNEA,
cm-1W/Hz½
Power,
mW
NEC (τ=1s),
ppmv
O3 (air) 35087.70 700 3.0×10⁻⁸ 0.8 1.27
O2 (N2) 13099.30 158 4.74×10⁻⁷ 1228 13
C2H2 (N2)* 6523.88 720 4.1×10⁻⁹ 57 0.03
NH3 (N2)* 6528.76 575 3.1×10⁻⁹ 60 0.06
C2H4 (N2)* 6177.07 715 5.4×10⁻⁹ 15 1.7
CH4 (N2+1.2% H2O)* 6057.09 760 3.7×10⁻⁹ 16 0.24
N2H4 6470.00 700 4.1×10⁻⁹ 16 1
H2S (N2)* 6357.63 780 5.6×10⁻⁹ 45 5
HCl (N2 dry) 5739.26 760 5.2×10⁻⁸ 15 0.7
CO2 (N2+1.5% H2O) * 4991.26 50 1.4×10⁻⁸ 4.4 18
CH2O (N2:75% RH)* 2804.90 75 8.7×10⁻⁹ 7.2 0.12
QEPAS Performance for Trace Gas Species (September 2014)
* - Improved microresonator
** - Improved microresonator and double optical pass through ADM
*** - With amplitude modulation and metal microresonator
NNEA – normalized noise equivalent absorption coefficient.
NEC – noise equivalent concentration for available laser power and τ=1s time constant, 18 dB/oct filter slope.
Mid-IR
CH2O (N2:75% RH)* 2804.90 75 8.7×10 7.2 0.12
CO (N2 +2.2% H2O) 2176.28 100 1.4×10⁻⁷ 71 0.002
CO (propylene) 2196.66 50 7.4×10⁻⁸ 6.5 0.14
N2O (air+5%SF6) 2195.63 50 1.5×10⁻⁸ 19 0.007
C2H5OH (N2)** 1934.2 770 2.2×10⁻⁷ 10 90
NO (N2+H2O) 1900.07 250 7.5×10⁻⁹ 100 0.003
C2HF5 (N2)*** 1208.62 770 7.8×10⁻⁹ 6.6 0.009
NH3 (N2)* 1046.39 110 1.6×10⁻⁸ 20 0.006
SF6 948.62 75 2.7x10⁻¹⁰ 18 5x10⁻⁵ (50 ppt)
For comparison: conventional PAS 2.2 ×10⁻⁹ cm-1W/√Hz for NH3

Mini Methane Sensor for UAVs
Miniaturization
21
Remote controlled quad-copter UAV
for pipeline sniffing -payload maximum only 600g!

5.0x10⁶
1.0x10⁷
1.5x10⁷
2.0x10⁷
2.5x10⁷
2f
Lock-I
n A
mp
litud
e [a
.u.]
10ppm CH4
3.3 micron DFB Laser
3.75m optical path
Mini Methane Sensor for UAVs
Sensor Performance
22
0 20 40 60 80 100
-1.5x10⁷
-1.0x10⁷
-5.0x10⁶
0.0
5.0x10
2f
Lock-I
n A
mp
litud
e [a
.u.]
Spectral Channel Number
Onboard pressure controller and pump systemContinuous measurement [10Hz] with onboard processingDirect concentration output – no post-processing necessary

Future Directions and Outlook
• New target analytes such as carbonyl sulfide (OCS), formaldehyde (CH2O), nitrous acid (HNO2), hydrogen peroxide (H2O2), ethylene (C2H4), ozone (O3), nitrate (NO3), propane (C3H8), and benzene (C6H6)
• Ultra-compact, low cost, robust sensors (e.g. C2H6, NO, CO…)
2 6
NO, CO…)
• Monitoring of broadband absorbers: acetone (C3H6O), acetone peroxide (TATP), UF6…
• Optical power build-up cavity designs
• Development of trace gas sensor networks
• QEPAS based detection at THz frequencies
23

Future Directions and Outlook
• Development of robust, compact sensitive, mid-infrared trace gas sensor technology based on room temperature, continuous wave, DFB QCL and ICLs for environmental, industrial, biomedical monitoring and security applications
• Seven target trace gas species were detected with a 1 sec sampling time:
� C2H6 at ~ 3.36 µm with a detection sensitivity of 740 pptv using TDLAS
� NH3 at ~ 10.4 µm with a detection sensitivity of ~1 ppbv (200 sec averaging time);
� NH3 at ~ 10.4 µm with a detection sensitivity of ~1 ppbv (200 sec averaging time);
� NO at ~5.26µm with a detection limit of 3 ppbv
� CO at ~ 4.61 µm with minimum detection limit of 2 ppbv
� SO2 at ~7.24 µm with a detection limit of 100 ppbv
� CH4 and N2O at ~7.28 µm currently in progress with detection limits of 20 and 7 ppbv, respectively.
• New target analytes such as CH2O, H2O2, and C2H4,
• Monitoring of broadband absorbers such as acetone, C3H8, C6H6 and UF6

Let Us Meet Again
We welcome all to our future group conferences of Omics group international
Please visit:Please visit:
www.omicsgroup.com
www.Conferenceseries.com
http://optics.conferenceseries.com/

