Embed Size (px)
Citation preview

Secondary
ABOITIZ POWER CORPORATION
Fourth Quarter / Full Year 2015
Financial & Operating Results
9 March 2016

Secondary
NET INCOME (in million pesos)
9 March 2016
Aboitiz Power Corporation Fourth Quarter/Full Year 2015 Financial & Operating Results2
812 916 906 1,171721
3,5732,844 3,064
4,433
2,700
1Q2015 2Q2015 3Q2015 4Q2015 4Q2014
QUARTERLY BREAKDOWN
3,203 3,806
13,47613,915
FY2014 FY2015
17,604EPS = P2.39
5%
+3%
+19%
16,705EPS = P2.27
DistributionGeneration AP Parent & Others
3,5033,683
4,347
54%30%
4,164
5,410
Net income up on higher generation and distribution earnings

Secondary
CORE NET INCOME (in million pesos)
9 March 2016
Aboitiz Power Corporation Fourth Quarter/Full Year 2015 Financial & Operating Results3
812 916 906 1,171721
3,5613,021
3,828
4,402
2,619
1Q2015 2Q2015 3Q2015 4Q2015 4Q2014
QUARTERLY BREAKDOWN
DistributionGeneration AP Parent & Others
3,4293,837
4,335
56%11%
Non-Recurring ItemsFY2014 FY2015 1Q2015 2Q2015 3Q2015 4Q2015 4Q2014
AP Parent 24 135 (1) 22 101 12 (8)
AP -Gen (160) (897) 13 (176) (764) 31 81
Total Gains/(Losses) (136) (762) 11 (154) (663) 43 73
4,827
3,203 3,806
13,63614,812
FY2014 FY2015
18,366EPS = P2.509%
+9%
+19%
16,841EPS = P2.29 5,367
Core net income up on higher sales from the Coal and Large Hydro Units
Secondary
BENEFICIAL EBITDA (in million pesos)
9 March 2016
Aboitiz Power Corporation Fourth Quarter/Full Year 2015 Financial & Operating Results4
1,265 1,411 1,438 1,343 1,308
7,2396,129
7,3918,688
5,766
1Q2015 2Q2015 3Q2015 4Q2015 4Q2014
QUARTERLY BREAKDOWN
5,480 5,457
27,04129,447
FY2014 FY2015
35,1768%
+9%
-0.4%
32,615
DistributionGeneration AP Parent & Others
7,2477,571
8,531
38%10%
9,094
9,980
Cash generation continued to be strong
Secondary
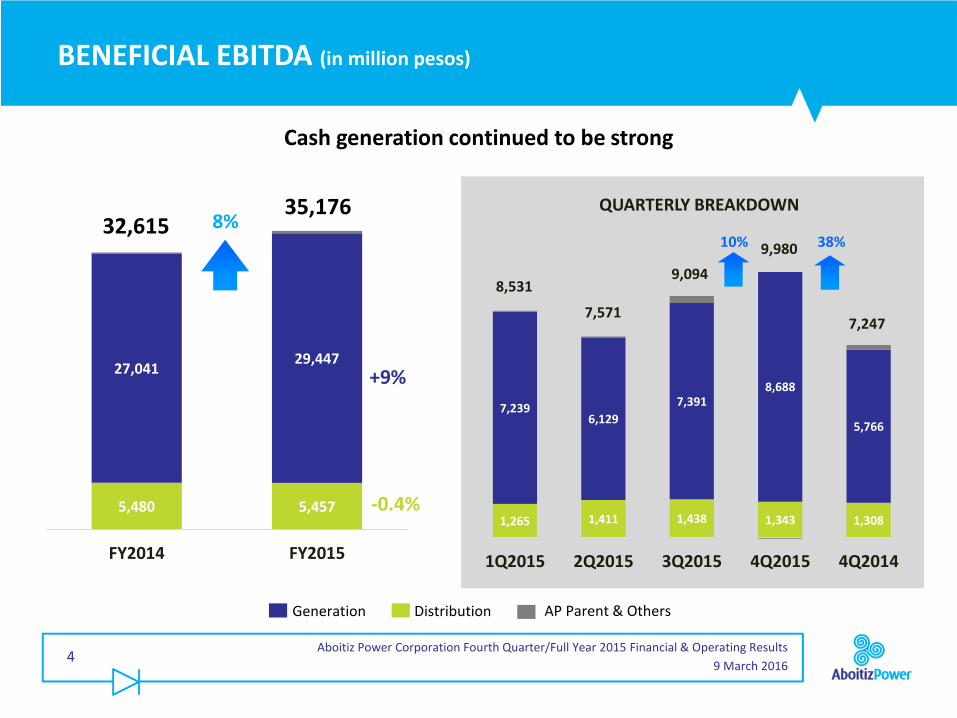
FINANCIAL CONDITION
9 March 2016
Aboitiz Power Corporation Fourth Quarter/Full Year 2015 Financial & Operating Results5
BALANCE SHEET
(In million Pesos)
Cash and Equivalents
YE2014
Total Assets
Total Interest Bearing Debt
Total Liabilities
Net Debt
Total Equity
Current Ratio
Net Debt to Equity
20,161
91,367
9,902
22,385
-
68,982
1.7x
-0.1x
Investments and Advances 70,012
YE2015
13,841
85,574
9,911
22,613
-
62,962
1.2x
-0.1x
70,373
PARENT
YE2014
40,232
216,761
97,347
120,681
57,115
96,080
3.4x
0.6x
24,816
YE2015
51,098
242,562
114,152
140,948
63,054
101,613
3.1x
0.6x
22,552
CONSOLIDATED
Year-end balance sheet continued to be strong with low gearing

Secondary
OPERATING HIGHLIGHTS: GENERATION
9 March 2016
Aboitiz Power Corporation Fourth Quarter/Full Year 2015 Financial & Operating Results6
184 133
557 613
935 980
123 173
FY2014 FY2015
Capacity Sales Breakdown by Profile (MW)
Spot Market Energy Contracts
Capacity Contracts Ancillary
1,9001,800 6%
Capacity Sold Factor
Fuel Group FY14 FY15Change in % points
MINI HYDRO 49% 44% -5
LARGE HYDRO 64% 78% 14
SNAP Magat 54% 60% 6
SNAP Benguet 79% 100% 21
GEOTHERMAL 79% 75% -4
COAL 93% 97% 4
Therma Luzon 93% 93% -
Therma South 100% -
OIL 95% 97% 2
83% 85%CapacitySold Factor
Capacity sales growth driven by increase in available capacities

Secondary
OPERATING HIGHLIGHTS: GENERATION
9 March 2016
Aboitiz Power Corporation Fourth Quarter/Full Year 2015 Financial & Operating Results7
Fuel GroupBeneficial
Total Energy Sales(GWh)
BeneficialAncillary Sales
(GWh)
FY14 FY15 YoY Chg FY14 FY15 YoY Chg
MINI HYDRO 690 686 -1%
LARGE HYDRO 799 790 -1% 853 1,221 43%
SNAP Magat 377 381 1% 473 572 21%
SNAP Benguet 422 409 -3% 380 650 71%
GEOTHERMAL 2,772 2,643 -5%
COAL 5,510 6,580 19%
Therma Luzon 4,706 5,124 9% 224 298 33%
Therma South - 436 -
OIL 1,504 1,854 23%
AP – GENERATION 11,272 12,550 11% 1,077 1,519 41%
Volume Sales growth driven by the Coal, Large Hydro and Oil Groups

Secondary
OPERATING HIGHLIGHTS: GENERATION
9 March 2016
Aboitiz Power Corporation Fourth Quarter/Full Year 2015 Financial & Operating Results8
MAGAT’S WATER LEVEL VS. RULE CURVE (in MASL)
Dry Spell to persist until mid-2016

Secondary
OPERATING HIGHLIGHTS: GENERATION
9 March 2016
Aboitiz Power Corporation Fourth Quarter/Full Year 2015 Financial & Operating Results9
In Peso/kWhBilateral
ContractsSpot Market
Weighted Average
Ancillary
FY14 FY15 FY14 FY15 FY14 FY15 FY14 FY15
AP GENERATION GROUP 4.93 3.64 5.05 4.41 4.94 3.70 2.22 2.04
SNAP Magat 4.68 5.07 5.50 3.56 5.01 4.83 2.10 2.22
SNAP Benguet 4.65 4.71 6.99 5.13 5.47 4.75 2.73 2.05
Therma Luzon* 4.04 3.80 5.14 5.03 4.19 3.90 1.64 1.66
Therma South - 4.00 - - - 4.00
APRI** 4.65 4.16 4.04 3.69 4.52 4.05
Note: Fuel cost and purchased power:*TLI: P1.39/kWh (FY2015) versus P1.91/kWh (FY2014)**APRI: P1.53/kWh (FY2015) versus P1.88/kWh (FY2014)
Average selling price continued to drop

Secondary
OPERATING HIGHLIGHTS: DISTRIBUTION
9 March 2016
Aboitiz Power Corporation Fourth Quarter/Full Year 2015 Financial & Operating Results10
344
459
24
106 96
22 28 22
1,102
354
475
26 102 102
22 30 26
1,138
DavaoLight
VECO CotabatoLight
SFELAPCO SEZ MEZ BEZ LEZ Total
FY2014 FY2015
1,117
3,363
4,480
1,186
3,573
4,759
Residential Commercial &Industrial
Total Power Sales
FY2014 FY2015
BENEFICIAL POWER SALES (Gwhr)
BENEFICIAL GWH SALES GROWTH(BY CUSTOMER TYPE)
PEAK DEMAND (MW)
3%
2,790 3,142 3,322 3,606 3,727 3,934 4,076 4,480 4,759
2007 2008 2009 2010 2011 2012 2013 2014 2015
6%
6%
6%
6%
Power sales grew across all customer segments

Secondary
OPERATING HIGHLIGHTS: DISTRIBUTION
9 March 2016
Aboitiz Power Corporation Fourth Quarter/Full Year 2015 Financial & Operating Results11
Gov’t Cap – 8.50%
2%
1% 1%
4%
6% 6%
8%8%
1%1% 1%
3%
5%
7%8%
5%
SYSTEMS LOSSGROSS MARGIN / KWH SALE
SFELAPCOSEZ Davao Light VECO CotabatoLight
MEZ BEZ
1.25
1.44
1.60
1.77 1.71
1.61
2010 2011 2012 2013 2014 2015
FY2014
FY2015
LEZ
Gross margin dropped due to Davao Light’s higher cost

Secondary
PROJECT UPDATES
12Aboitiz Power Corporation Fourth Quarter/Full Year 2015 Financial & Operating Results
9 March 2016
Therma South – Davao Coal Unit 1 (130MW): COD – Sept. 18, 2015 Unit 2 (130MW): COD – Feb. 2, 2016
Source: Official Gazette of the Republic of the Philippines
Therma South coal-fired power plant fully operational

Secondary
PROJECT UPDATES
13Aboitiz Power Corporation Fourth Quarter/Full Year 2015 Financial & Operating Results
9 March 2016
Source: Official Gazette of the Republic of the Philippines
Ph
ilip
pin
es
Projects under-construction Capacity Start of Construction Estimated Completion
San Carlos - Negros (Solar) 59 MWp 2H2015 1Q2016
Pagbilao 3 (Coal) 400 MW 2H2014 2H2017
Manolo Fortich (Hydro) 68 MW 1H2015 2H2017
MARIS Canal (Hydro) 8.5 MW 2H2015 2H2017
Cebu (Coal) 300 MW 1H2015 2H2018
Exploratory Projects Estimated Capacity Partner/s Location
Mini Hydro ~200 MW - Across the Philippines
Large Hydro 390 MW - Luzon
Geothermal - - Luzon & Mindanao
Inte
rnat
ion
al
Hydro 127 MWSN Power & Energi
InfranusantaraCentral Sulawesi, Indonesia
Geothermal 110 MW Medco Power East Java Province, Indonesia
Healthy pipeline in place to reach our target of ~4,000 MW by 2020

Secondary
Annex A: EARNINGS BREAKDOWN
9 March 2016
Aboitiz Power Corporation Fourth Quarter/Full Year 2015 Financial & Operating Results14
(in million pesos) YEAR - TO - DATE FOR THE QUARTERINVESTEE ACTUAL ACTUAL ACTUAL ACTUAL
2015 2014 2015 2014
Parent & Others (117) 26 (194) 82
Power Generation Group:
ARI (Parent & others) 84 (2) 49 1
HEDCOR INC 57 82 40 11
HEDCOR SIBULAN 759 917 180 263
HEDCOR TUDAYA 104 89 31 30
HEDCOR TAMUGAN 0 0 0 0
HEDCOR SABANGAN 123 (17) 82 (8)
HEDCOR BUKIDNON (35) (13) (7) (13)
LUZON HYDRO 113 197 (60) 13
MORE 9 26 20 24
SNAP MAGAT 1,030 957 513 537
SNAP BENGUET 1,088 1,570 252 263
SPPC 73 50 17 11
WMPC 155 124 29 31
CPPC 178 191 15 26
EAUC 125 124 23 11
THERMA MOBILE 354 231 107 (27)
THERMA MARINE 469 448 136 (77)
STEAG 324 10 150 59
ABOVANT HOLDINGS (CEDC) 625 614 175 174
RP ENERGY (7) (7) (3) (2)
THERMA (Parent & Others) 61 (12) 58 (10)
THERMA SOUTH 254 (6) 250 (14)
THERMA LUZON 3,772 3,687 1,245 858
THERMA VISAYAS 176 (3) 188 (1)
PAGBILAO ENERGY (49) (18) (19) (3)
AP RENEWABLES 4,074 4,239 964 544
Sub-Total Power Generation 13,915 13,476 4,433 2,700
Power Distribution Group:
COTABATO LIGHT & POWER 116 57 38 (1)
DAVAO LIGHT & POWER 1,992 1,629 781 362
VISAYAN ELECTRIC CO. 963 957 163 229
SFELAPCO 147 133 61 27
LIMA ENERZONE 167 62 36 14
SUBIC ENERZONE 296 251 62 61
MACTAN ENERZONE 60 54 13 14
BALAMBAN ENERZONE 65 60 16 14
Sub-Total Power Distribution 3,806 3,203 1,171 721
TOTAL NET INCOME 17,604 16,705 5,410 3,503EARNINGS PER SHARE (average outstanding) 2.39 2.27 0.74 0.48
RECURRING NET INCOME 18,366 16,841 5,367 3,429
% increase (decrease) 9% 56%

Secondary
Thank you