Embed Size (px)
Citation preview

APPENDIX 4D
SOUTH32 LIMITED
(ABN 84 093 732 597)
RESULTS FOR ANNOUNCEMENT TO THE MARKET
This page and the accompanying 52 pages comprise the half year end financial information given to the Australian
Securities Exchange (ASX) under Listing Rule 4.2A. This statement includes consolidated results of the South32 Group
for the half year ended 31 December 2016 compared with the half year ended 31 December 2015 on a statutory basis.
The half year report should be read in conjunction with the Annual Financial Report 2016.
US$M H1 FY17 H1 FY16 %
Revenue from continuing operations 3,221 2,981 up 8%
Profit/(loss) after tax from continuing operations 620 (1,749) N/A
Underlying earnings from continuing operations 479 26 up 1,742%
Net tangible assets per share
Net tangible assets per ordinary share were US$1.83 as at 31 December 2016 (US$1.72 as at 30 June 2016).
Dividends
The Board has resolved to pay an interim dividend of US 3.6 cents per share (unfranked) for the half year ended 31
December 2016 (record date 10 March 2017; payment date 6 April 2017).
For
per
sona
l use
onl
y

This page is intentionally blank
For
per
sona
l use
onl
y
SOUTH32 3
FINANCIAL RESULTS AND OUTLOOK HALF YEAR ENDED 31 DECEMBER 2016
16 February 2017 ASX / LSE / JSE: S32
South32 delivers strong financial results and announces first interim dividend
“The disciplined application of our strategy and stronger commodity prices underpinned a significant improvement in
financial performance. We generated free cash flow of US$626M for a net cash position of US$859M as we further
optimised our operations and benefitted from our operating leverage.
“We continue to unlock value through the accelerated development of La Esmeralda, the progression of the Klipspruit Life
Extension project towards a final investment decision, the completion of the West Marradong mining access agreement
and the commencement of exploration in the Southern Areas at GEMCO.
“The proposed US$200M acquisition of the Metropolitan Colliery is expected to create additional value and realise unique
synergies with Illawarra Metallurgical Coal.
“Our strong balance sheet and simple capital management framework is designed to reward shareholders as financial
performance improves. We have declared our first interim dividend of US$192M and will continue to manage our financial
position to ensure we retain the right balance of flexibility and efficiency.”
Graham Kerr, South32 CEO
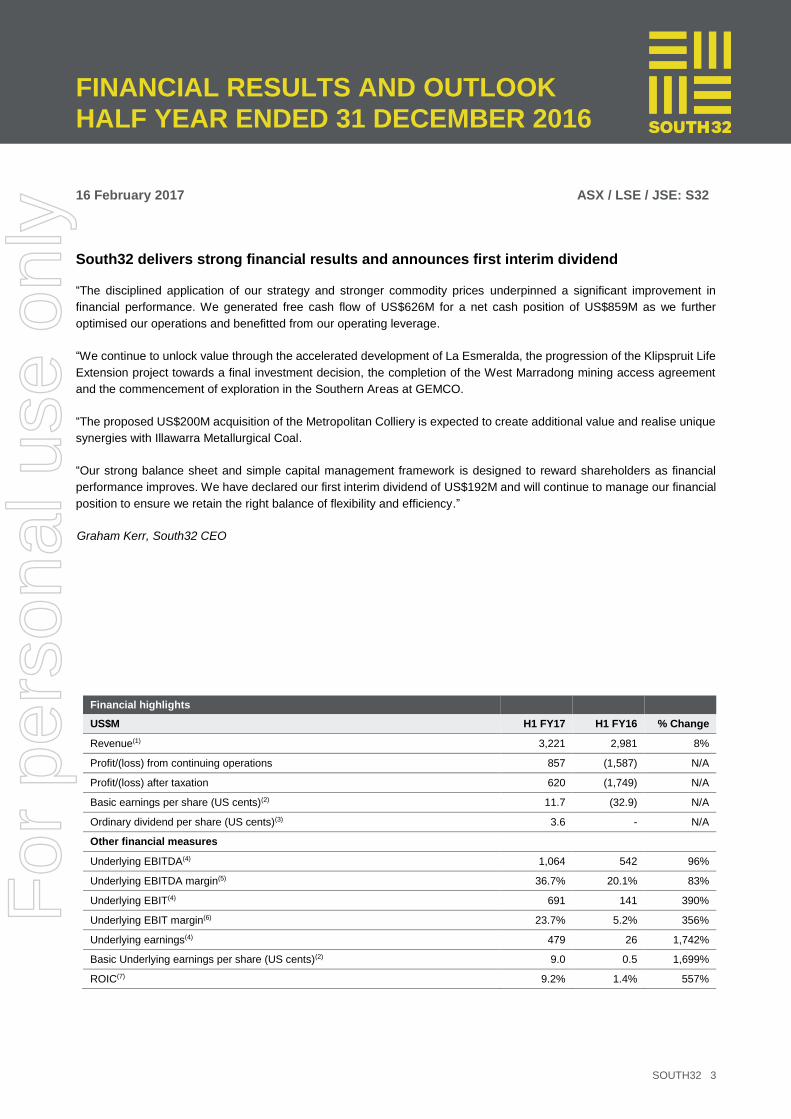
Financial highlights
US$M H1 FY17 H1 FY16 % Change
Revenue(1) 3,221 2,981 8%
Profit/(loss) from continuing operations 857 (1,587) N/A
Profit/(loss) after taxation 620 (1,749) N/A
Basic earnings per share (US cents)(2) 11.7 (32.9) N/A
Ordinary dividend per share (US cents)(3) 3.6 - N/A
Other financial measures
Underlying EBITDA(4) 1,064 542 96%
Underlying EBITDA margin(5) 36.7% 20.1% 83%
Underlying EBIT(4) 691 141 390%
Underlying EBIT margin(6) 23.7% 5.2% 356%
Underlying earnings(4) 479 26 1,742%
Basic Underlying earnings per share (US cents)(2) 9.0 0.5 1,699%
ROIC(7) 9.2% 1.4% 557%
For
per
sona
l use
onl
y

SOUTH32 4
DECEMBER 2016 HALF YEAR SUMMARY
SAFETY
Our vision is to create a safe working environment where we can guarantee that everyone goes home safe and well every
day. Tragically, we lost a colleague at work in the Africa Region in the half year. We are committed to investing time,
energy and leadership to make a sustainable and lasting change to our safety performance. Through the implementation
of our Care Strategy, we are building an inclusive workplace with a strong culture of care and accountability, where work
is well-designed and we continuously improve and learn. Our Total Recordable Injury Frequency (TRIF) declined from 7.9
to 5.3 per million hours worked in the period.
PERFORMANCE HIGHLIGHTS
The disciplined application of our strategy and stronger commodity prices underpinned a significant improvement in
financial performance. Specific highlights included:
Our response to favourable market conditions as we restarted 22 pots at South Africa Aluminium and opportunistically
increased manganese ore production;
A substantial 197% improvement in free cash flow to US$626M, including distributions from equity accounted
investments, as we continued to optimise our operations and benefit from our operating leverage;
The further strengthening of our Balance Sheet with an increase in our net cash position to US$859M, despite a
temporary build in working capital;
The unlocking of additional value with the accelerated development of La Esmeralda (Cerro Matoso), the progression
of the Klipspruit Life Extension project towards a final investment decision, the completion of the access agreement
for the West Marradong mining area (Worsley Alumina), and the commencement of exploration for high grade
manganese ore in the Southern Areas at GEMCO and Cu-Ni-PGE mineralisation at Huckleberry in Canada;
The creation of value beyond our existing portfolio with the proposed acquisition of the Metropolitan Colliery(8) and
potential realisation of unique synergies with Illawarra Metallurgical Coal; and
Our first interim dividend of US 3.6 cents per share to shareholders (US$192M).
Production guidance for FY17 is unchanged for all operations and is predicated on a strong finish to the financial year. We
continue to pursue our cost saving targets, which have been revised to reflect changes in foreign exchange rates and
price-linked royalties.
EARNINGS
The Group’s statutory profit was US$620M in H1 FY17. The corresponding period’s loss was impacted by the recognition
of impairment charges totalling US$1.7B (post-tax US$1.7B).
Consistent with our accounting policy, various items are excluded from the Group’s statutory profit result to derive
Underlying earnings including: exchange rate losses associated with the restatement of monetary items (US$20M pre-
tax); fair value gains on derivative instruments (US$189M pre-tax); exchange rate gains associated with the Group’s non
US dollar denominated net debt (US$11M pre-tax); exchange rate gains on tax balances (US$13M) and the tax expense
for all pre-tax earnings adjustments (US$49M). Further information on these earnings adjustments is included on page 13.
Underlying EBITDA increased by US$522M to US$1.1B in H1 FY17 as higher prices for the majority of our commodities
offset lower volumes, giving rise to an increase in sales revenue of US$240M. This, combined with our continued focus on
costs, resulted in an increase in our operating margin from 20% to 37%.
Underlying EBIT increased by US$550M to US$691M, benefitting from a reduction in depreciation and amortisation
following the recognition of non-cash impairment charges in H1 FY16. The half year run-rate for depreciation and
amortisation did, however, exceed annual guidance which is revised on page 11. Detailed earnings analysis is included
on pages 14 through 15.
For
per
sona
l use
onl
y
SOUTH32 5
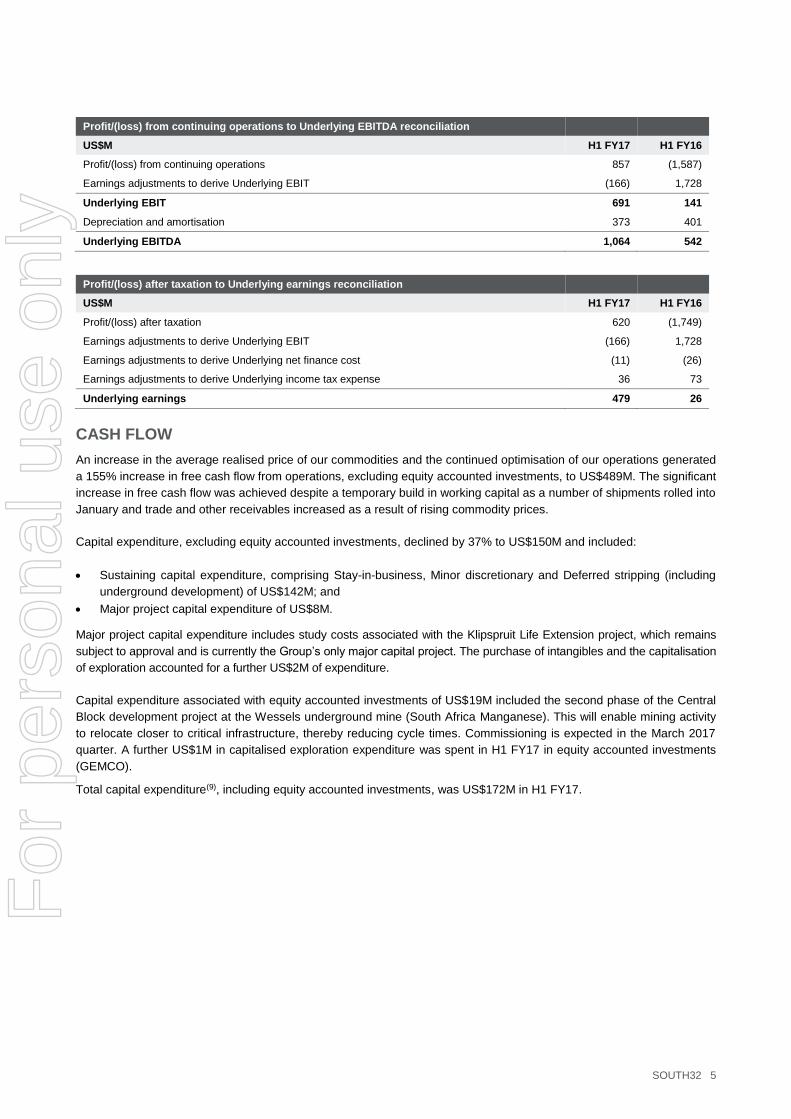
Profit/(loss) from continuing operations to Underlying EBITDA reconciliation
US$M H1 FY17 H1 FY16
Profit/(loss) from continuing operations 857 (1,587)
Earnings adjustments to derive Underlying EBIT (166) 1,728
Underlying EBIT 691 141
Depreciation and amortisation 373 401
Underlying EBITDA 1,064 542
Profit/(loss) after taxation to Underlying earnings reconciliation
US$M H1 FY17 H1 FY16
Profit/(loss) after taxation 620 (1,749)
Earnings adjustments to derive Underlying EBIT (166) 1,728
Earnings adjustments to derive Underlying net finance cost (11) (26)
Earnings adjustments to derive Underlying income tax expense 36 73
Underlying earnings 479 26
CASH FLOW
An increase in the average realised price of our commodities and the continued optimisation of our operations generated
a 155% increase in free cash flow from operations, excluding equity accounted investments, to US$489M. The significant
increase in free cash flow was achieved despite a temporary build in working capital as a number of shipments rolled into
January and trade and other receivables increased as a result of rising commodity prices.
Capital expenditure, excluding equity accounted investments, declined by 37% to US$150M and included:
Sustaining capital expenditure, comprising Stay-in-business, Minor discretionary and Deferred stripping (including
underground development) of US$142M; and
Major project capital expenditure of US$8M.
Major project capital expenditure includes study costs associated with the Klipspruit Life Extension project, which remains
subject to approval and is currently the Group’s only major capital project. The purchase of intangibles and the capitalisation
of exploration accounted for a further US$2M of expenditure.
Capital expenditure associated with equity accounted investments of US$19M included the second phase of the Central
Block development project at the Wessels underground mine (South Africa Manganese). This will enable mining activity
to relocate closer to critical infrastructure, thereby reducing cycle times. Commissioning is expected in the March 2017
quarter. A further US$1M in capitalised exploration expenditure was spent in H1 FY17 in equity accounted investments
(GEMCO).
Total capital expenditure(9), including equity accounted investments, was US$172M in H1 FY17.
For
per
sona
l use
onl
y

SOUTH32 6
Free cash flow of operations, excluding equity accounted investments
US$M H1 FY17 H1 FY16
Profit/(loss) from continuing operations 857 (1,587)
Non-cash items 207 1,868
(Profit)/loss from equity accounted investments (164) 356
Change in working capital (203) (211)
Cash generated from continuing operations 697 426
Total capital expenditure, excluding equity accounted investments, including intangibles and capitalised exploration
(152) (253)
Operating cash flows from continuing operations before financing activities and tax, and after capital expenditure
545 173
Interest (paid)/received (17) (18)
Income tax (paid)/received (39) 37
Free cash flow of operations, excluding equity accounted investments 489 192
In addition to free cash flow of US$489M, distributions totalling US$137M were received from equity accounted investments
during H1 FY17, comprising US$41M in dividends and US$96M from the repayment of a shareholder loan.
BALANCE SHEET
As at 31 December 2016, the Group’s net cash position was US$859M, an increase of US$547M from 30 June 2016. The
further strengthening of our financial position ensures we are well placed to fund the proposed acquisition of the
Metropolitan Colliery for US$200M and the payment of our interim dividend (US$192M). While these commitments will
consume a significant proportion of the free cash flow generated in H1 FY17, a release of working capital and additional
distributions from our equity accounted investments are expected in the March 2017 quarter. We will continue to manage
our financial position to ensure we retain the right balance of flexibility and efficiency.
Net cash/(debt)
US$M H1 FY17 FY16
Cash and cash equivalents 1,901 1,225
Finance leases (581) (602)
Other interest bearing liabilities (461) (311)
Net cash/ (debt) 859 312
The increase in interest bearing liabilities recorded in H1 FY17 is a result of the cash management activities that the Group
undertakes on behalf of the manganese joint venture and is offset by a commensurate increase in cash and cash
equivalents. The US$21M reduction in finance leases is primarily associated with the weaker Australian dollar at the end
of H1 FY17.
Standard and Poor’s and Moody’s reaffirmed the Group’s BBB+ and Baa1 credit ratings respectively, following their annual
reviews in H1 FY17.
For
per
sona
l use
onl
y
SOUTH32 7
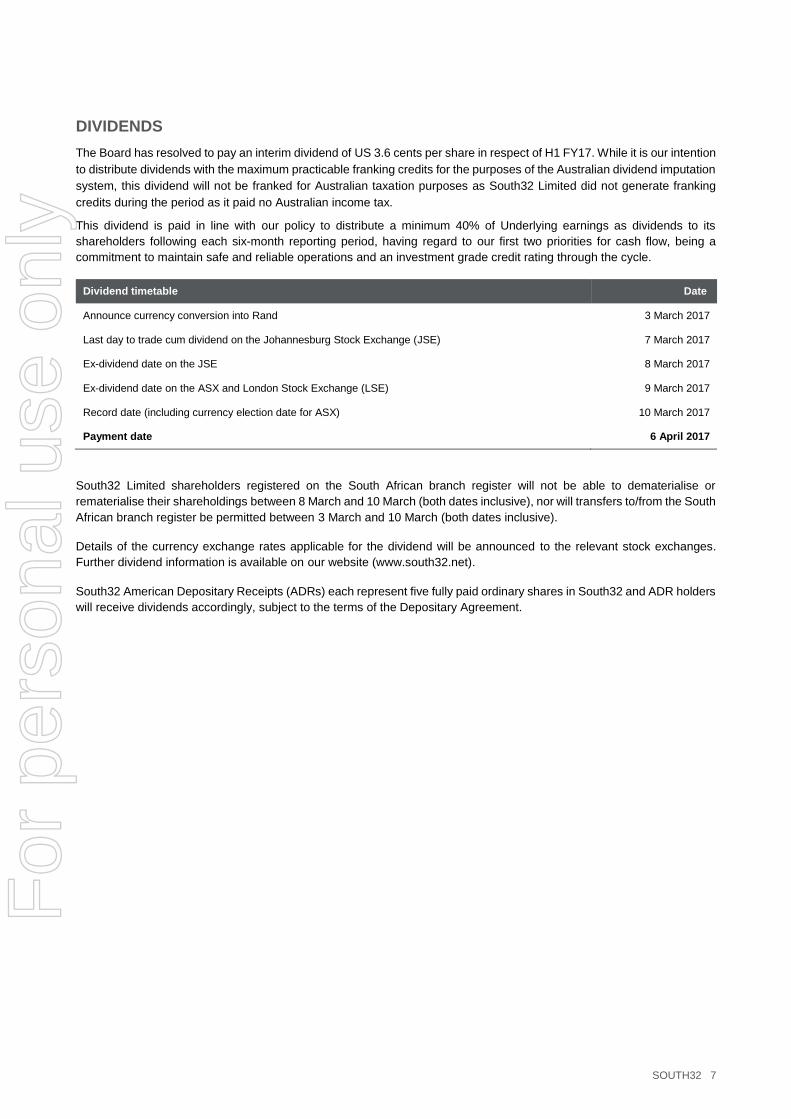
DIVIDENDS
The Board has resolved to pay an interim dividend of US 3.6 cents per share in respect of H1 FY17. While it is our intention
to distribute dividends with the maximum practicable franking credits for the purposes of the Australian dividend imputation
system, this dividend will not be franked for Australian taxation purposes as South32 Limited did not generate franking
credits during the period as it paid no Australian income tax.
This dividend is paid in line with our policy to distribute a minimum 40% of Underlying earnings as dividends to its
shareholders following each six-month reporting period, having regard to our first two priorities for cash flow, being a
commitment to maintain safe and reliable operations and an investment grade credit rating through the cycle.
Dividend timetable Date
Announce currency conversion into Rand 3 March 2017
Last day to trade cum dividend on the Johannesburg Stock Exchange (JSE) 7 March 2017
Ex-dividend date on the JSE 8 March 2017
Ex-dividend date on the ASX and London Stock Exchange (LSE) 9 March 2017
Record date (including currency election date for ASX) 10 March 2017
Payment date 6 April 2017
South32 Limited shareholders registered on the South African branch register will not be able to dematerialise or
rematerialise their shareholdings between 8 March and 10 March (both dates inclusive), nor will transfers to/from the South
African branch register be permitted between 3 March and 10 March (both dates inclusive).
Details of the currency exchange rates applicable for the dividend will be announced to the relevant stock exchanges.
Further dividend information is available on our website (www.south32.net).
South32 American Depositary Receipts (ADRs) each represent five fully paid ordinary shares in South32 and ADR holders
will receive dividends accordingly, subject to the terms of the Depositary Agreement.
For
per
sona
l use
onl
y

SOUTH32 8
OUTLOOK
Information in this section does not reflect the proposed acquisition of the Metropolitan Colliery.
PRODUCTION
Production guidance for FY17 is unchanged for our upstream operations.
Illawarra Metallurgical Coal saleable production guidance was revised in December 2016 to 7.9Mt as a result of challenging
ground conditions at Appin Area 9 and a moderation of mining rates at Appin Area 7 to ensure gas concentrations were
maintained at safe levels. With the completion of the 901 panel and associated release of ground stresses, longwall
availability and cutting rates are anticipated to improve in FY18. The lower production rate in FY17 has, however, impacted
the timing of longwall panel extraction and production guidance for FY18 has been revised accordingly.
Worsley Alumina saleable alumina production guidance is unchanged with the refinery expected to produce at its
nameplate capacity of 4.6Mtpa (100% basis) across FY17 and FY18. Similarly, Brazil Alumina saleable production
guidance for FY17 is unchanged at 1.32Mt with a small increase in production anticipated in FY18.
At South Africa Energy Coal, total coal production guidance for FY17 and FY18 is unchanged and will benefit from
additional capital investment at the Wolvekrans Middelburg Complex to open up new mining areas.
Payable nickel production guidance for Cerro Matoso remains unchanged at approximately 36kt for FY17 before the accelerated
development of the higher grade La Esmeralda Mineral Resource increases production by 16% in FY18 to approximately 42kt.
Production from La Esmeralda is now expected to commence in the June 2017 quarter.
Production guidance for Australia Manganese of 3.1Mwmt in FY17 and FY18 remains unchanged, albeit with a greater proportion
of Premium Concentrate ore (PC02) product. Guidance is not provided for South Africa Manganese as our plans will continue to
be adjusted to reflect market demand given our focus on value over volume.
The optimised longer term mine plan at Cannington seeks to maximise total silver, lead and zinc extraction across the
remaining years of the underground operation and reduce geotechnical risk by sequencing stope design. FY17 production
guidance (silver 19.05Moz, lead 163kt, zinc 80kt) remains predicated on the extraction of the higher grade (silver/lead)
60L stope that is in close proximity to the existing underground crusher, while the development of the replacement
underground crusher is expected to be commissioned in the March 2018 quarter. Guidance will be revised should
geotechnical conditions dictate a change to the current stope sequence and the extraction of the 60L stope be deferred,
albeit with no net loss of metal production in the forward plan.
For
per
sona
l use
onl
y

SOUTH32 9
Upstream production guidance (South32 share)(10)
FY16 FY17e(a) FY18e(a)
Worsley Alumina
Alumina production (kt) 3,961 3,965 3,965
Brazil Alumina
Alumina production (kt) 1,335 1,320 1,350
South Africa Energy Coal(11)
Domestic coal production (kt) 16,825 17,000 17,000
Export coal production (kt) 14,856 13,850 12,800
Illawarra Metallurgical Coal
Metallurgical coal production (kt) 7,059 6,360 Revised ↓ 7,550
Energy coal production (kt) 1,307 1,540 Revised ↑ 1,450
Australia Manganese
Manganese ore production (kwmt) 3,071 3,120 3,125
South Africa Manganese
Manganese ore production (kwmt) 1,711 Subject to demand Subject to demand
Cerro Matoso
Payable nickel production (kt) 36.8 36.0 Revised ↑ 41.6
Cannington
Payable silver production (koz) 21,393 19,050 16,550
Payable lead production (kt) 173 163 147
Payable zinc production (kt) 79 80 72
(a) The denotation (e) refers to an estimate or forecast year.
Our African aluminium smelters continue to operate at benchmark levels of current efficiency and are experiencing fewer
load-shedding events. During H1 FY17, we restarted production in the 22 pots (equivalent to 3% of total production) that
were taken offline at South Africa Aluminium in September 2015.
At Metalloys (South Africa Manganese), we continue to operate one of four furnaces, whereas all four furnaces at TEMCO
(Australia Manganese) are expected to return to full capacity once scheduled maintenance is completed in the March 2017
quarter.
For
per
sona
l use
onl
y
SOUTH32 10
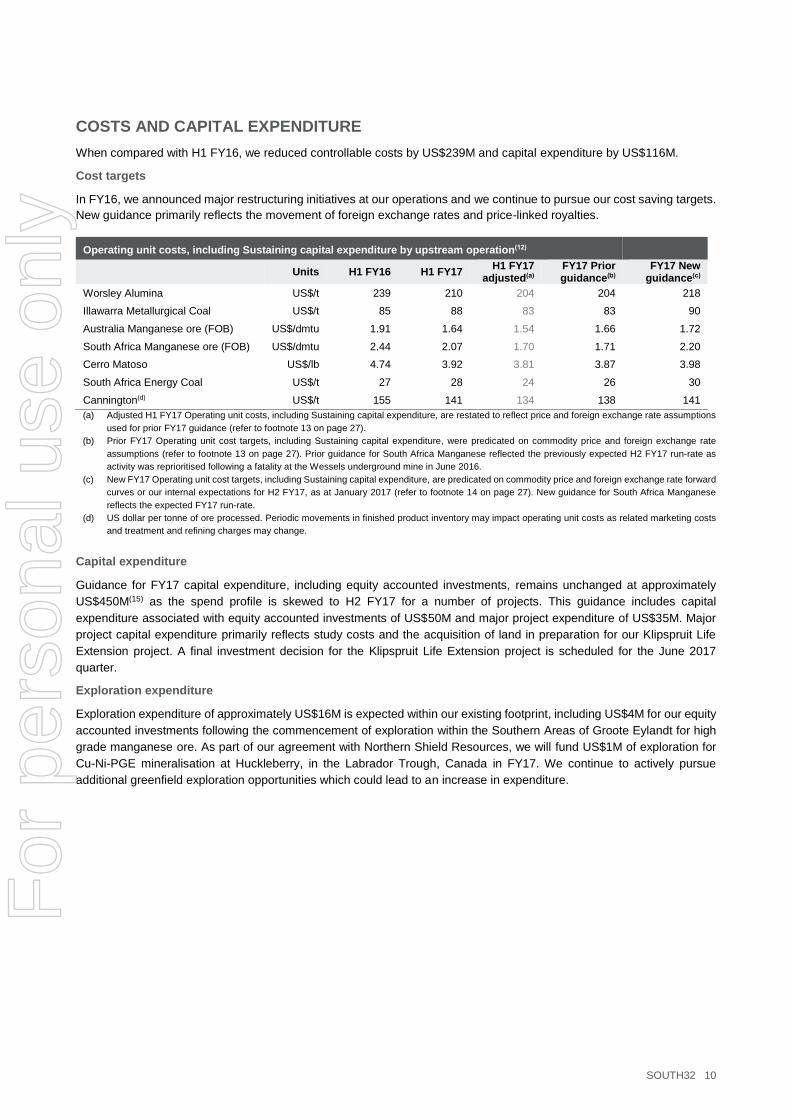
COSTS AND CAPITAL EXPENDITURE
When compared with H1 FY16, we reduced controllable costs by US$239M and capital expenditure by US$116M.
Cost targets
In FY16, we announced major restructuring initiatives at our operations and we continue to pursue our cost saving targets.
New guidance primarily reflects the movement of foreign exchange rates and price-linked royalties.
Operating unit costs, including Sustaining capital expenditure by upstream operation(12)
Units H1 FY16 H1 FY17 H1 FY17
adjusted(a) FY17 Prior guidance(b)
FY17 New guidance(c)
Worsley Alumina US$/t 239 210 204 204 218
Illawarra Metallurgical Coal US$/t 85 88 83 83 90
Australia Manganese ore (FOB) US$/dmtu 1.91 1.64 1.54 1.66 1.72
South Africa Manganese ore (FOB) US$/dmtu 2.44 2.07 1.70 1.71 2.20
Cerro Matoso US$/lb 4.74 3.92 3.81 3.87 3.98
South Africa Energy Coal US$/t 27 28 24 26 30
Cannington(d) US$/t 155 141 134 138 141
(a) Adjusted H1 FY17 Operating unit costs, including Sustaining capital expenditure, are restated to reflect price and foreign exchange rate assumptions
used for prior FY17 guidance (refer to footnote 13 on page 27).
(b) Prior FY17 Operating unit cost targets, including Sustaining capital expenditure, were predicated on commodity price and foreign exchange rate
assumptions (refer to footnote 13 on page 27). Prior guidance for South Africa Manganese reflected the previously expected H2 FY17 run-rate as
activity was reprioritised following a fatality at the Wessels underground mine in June 2016.
(c) New FY17 Operating unit cost targets, including Sustaining capital expenditure, are predicated on commodity price and foreign exchange rate forward
curves or our internal expectations for H2 FY17, as at January 2017 (refer to footnote 14 on page 27). New guidance for South Africa Manganese
reflects the expected FY17 run-rate.
(d) US dollar per tonne of ore processed. Periodic movements in finished product inventory may impact operating unit costs as related marketing costs
and treatment and refining charges may change.
Capital expenditure
Guidance for FY17 capital expenditure, including equity accounted investments, remains unchanged at approximately
US$450M(15) as the spend profile is skewed to H2 FY17 for a number of projects. This guidance includes capital
expenditure associated with equity accounted investments of US$50M and major project expenditure of US$35M. Major
project capital expenditure primarily reflects study costs and the acquisition of land in preparation for our Klipspruit Life
Extension project. A final investment decision for the Klipspruit Life Extension project is scheduled for the June 2017
quarter.
Exploration expenditure
Exploration expenditure of approximately US$16M is expected within our existing footprint, including US$4M for our equity
accounted investments following the commencement of exploration within the Southern Areas of Groote Eylandt for high
grade manganese ore. As part of our agreement with Northern Shield Resources, we will fund US$1M of exploration for
Cu-Ni-PGE mineralisation at Huckleberry, in the Labrador Trough, Canada in FY17. We continue to actively pursue
additional greenfield exploration opportunities which could lead to an increase in expenditure.
For
per
sona
l use
onl
y

SOUTH32 11
DEPRECIATION AND AMORTISATION
Depreciation and amortisation, excluding equity accounted investments, of US$760M is now expected in FY17. The
US$40M increase in guidance primarily results from an adjustment to the useful life of specific assets, the accelerated
depreciation of the Group’s information technology systems and the appreciation of the South African rand given its impact
on the depreciation profile of projects scheduled for completion in FY17. Depreciation and amortisation for equity
accounted investments is also expected to increase by US$10M to US$80M in FY17.
TAX EXPENSE
The Group’s Underlying effective tax rate (Underlying ETR), which excludes taxation associated with equity accounted
investments, largely reflects the geographic distribution of the Group’s profit. The corporate tax rates applicable to the
Group include: Australia 30%; South Africa 28%; Colombia 40%; and Brazil 34%. It should also be recognised that
permanent differences have a disproportionate effect on the Group’s Underlying ETR(16) when commodity prices and profit
margins are compressed.
While South32 Limited currently maintains a zero franking credit balance, the Group is expected to generate a positive
franking credit balance in FY17, based on current projections. South32 Limited did not generate franking credits during the
period as it paid no Australian income tax.
For
per
sona
l use
onl
y

SOUTH32 12
DECEMBER 2016 HALF YEAR FINANCIAL RESULTS
To provide insight into the underlying performance of the South32 Group, we present internal earnings measures utilised
by management. These internal measures include Underlying EBITDA, Underlying EBIT and Underlying earnings.
Income statement
US$M H1 FY17 H1 FY16
Revenue 3,221 2,981
Other income 142 167
Expenses excluding net finance cost (2,670) (4,379)
Share of profit/(loss) of equity accounted investments 164 (356)
Profit/(loss) from continuing operations 857 (1,587)
Net finance cost (60) (45)
Taxation expense (177) (117)
Profit/(loss) after taxation 620 (1,749)
Basic earnings per share (US cents) 11.7 (32.9)
Other financial information
Profit/(loss) from continuing operations 857 (1,587)
Earnings adjustments to derive Underlying EBIT (166) 1,728
Underlying EBIT 691 141
Depreciation and amortisation 373 401
Underlying EBITDA 1,064 542
Profit/(loss) after taxation 620 (1,749)
Earnings adjustments after taxation (141) 1,775
Underlying earnings 479 26
Basic Underlying earnings per share (US cents) 9.0 0.5
For
per
sona
l use
onl
y

SOUTH32 13
EARNINGS ADJUSTMENTS
The following table notes the various Earnings adjustments that are excluded from the Group’s Underlying measures.
Earnings adjustments
US$M H1 FY17 H1 FY16
Adjustments to Underlying EBIT
Significant items - 92
Exchange rate (gains)/losses on restatement of monetary items(a) 20 (87)
Impairment losses(a)(b) 4 1,384
Fair value (gains)/losses on derivative instruments(a) (189) 36
Major corporate restructures(a) 2 5
Impairment losses included in operating profit/(loss) of equity accounted investments(c) - 287
Earnings adjustments included in operating profit/(loss) of equity accounted investments(c) (3) 11
Total adjustments to Underlying EBIT (166) 1,728
Adjustments to net finance cost
Exchange rate variations on net debt (11) (26)
Total adjustments to net finance cost (11) (26)
Adjustments to income tax expense
Significant items - 39
Tax effect of earnings adjustments to Underlying EBIT 45 (152)
Tax effect of earnings adjustments to net finance cost 4 8
Exchange rate variations on tax balances (13) 178
Total adjustments to income tax expense 36 73
Total earnings adjustments (141) 1,775
(a) Recognised in expenses excluding net finance cost in the consolidated income statement.
(b) In the half year ended 31 December 2015, the South32 Group recognised impairments as a result of significant and continuing weakening
of commodity markets. For detailed disclosure of the impairments refer to the financial statements released for the period ending 31
December 2015.
(c) Recognised in share of profit/(loss) of equity accounted investments in the consolidated income statement.
For
per
sona
l use
onl
y

SOUTH32 14
EARNINGS ANALYSIS
The following key factors influenced Underlying earnings in H1 FY17, relative to H1 FY16.
Prices, foreign exchange and inflation
An increase in average realised prices for our commodities increased revenue by US$661M. Metallurgical and energy
coal, and manganese ore and alloy were the main contributors, increasing revenue by US$313M and US$230M
respectively. Higher averaged realised silver, lead and zinc prices increased sales revenue by a further US$93M.
Conversely, lower average realised prices for alumina reduced revenue by US$39M.
Despite the increase in commodity prices, price-linked costs decreased by US$47M, attributable to lower raw material
prices at our alumina and aluminium operations and a reduction in treatment and refining charges for Cannington
concentrates. This was offset by general inflation which increased costs by US$51M. The inflationary impact was most
pronounced at our African operations which accounted for 65% of the total variance.
The cumulative impact of changes in foreign exchange rate markets reduced Underlying EBIT by a net US$12M as a
stronger Australian dollar was partially offset by a weaker South African rand.
Volume
The US$243M volume related impact in revenue reflects a decline in processed ore grades and metal production at
Cannington (US$104M) and lower production at South Africa Energy Coal (US$103M) following the suspension of the
North Plant at the Wolvekrans Middelburg Complex, scheduled maintenance and the repositioning of draglines. The
revenue impact of lower production volumes at Illawarra Metallurgical Coal (US$20M) was mitigated by a net reduction in
inventory.
Controllable cost reduction
Controllable costs were US$239M lower than the corresponding period as we continued to benefit from the major
restructuring initiatives undertaken in H2 FY16. An increase in controllable costs is anticipated in H2 FY17 as working
capital unwinds.
Group and Unallocated costs of US$70M are expected in FY17, as planned.
Other items
Other items reduced Underlying EBIT by US$19M in H1 FY17. Depreciation and amortisation, including equity accounted
investments, declined by US$72M as a result of impairments recorded in H1 FY16. Conversely, the net effect of a reduction
in power sales in Brazil (US$57M) and the prior US$29M reversal of a rehabilitation provision that benefitted South Africa
Energy Coal in H1 FY16 reduced Underlying EBIT by a combined US$86M.
141
691
479
47 12 51 243 23919
7271
141
661
0
200
400
600
800
1,000
H1
FY
16
Un
de
rlyin
g E
BIT
Sale
s p
rice
Price
-lin
ked
co
sts
Fore
ign
excha
ng
e
Inflatio
n
Sale
s v
olu
me
Co
ntr
olla
ble
costs
Oth
er
Inte
rest
& ta
x (
equ
ity
accou
nte
d in
ve
stm
ents
)
H1
FY
17
Un
de
rlyin
g E
BIT
Un
de
rlyin
g n
et
fin
an
ce c
ost
Un
de
rlyin
g ta
xa
tion
exp
en
se
H1
FY
17
Un
de
rlyin
g e
arn
ing
s
Net finance cost and taxation
Uncontrollable
Reconciliation of movements in Underlying earnings (US$M)(17)(18)
For
per
sona
l use
onl
y
SOUTH32 15
Interest and tax associated with equity accounted investments
The Group’s manganese operations are jointly controlled by South32 (60% share) and Anglo American (40% share). The
Underlying interest and taxation expense associated with these equity accounted investments increased by US$72M to
US$91M in H1 FY17 as higher prices led to a significant increase in profitability.
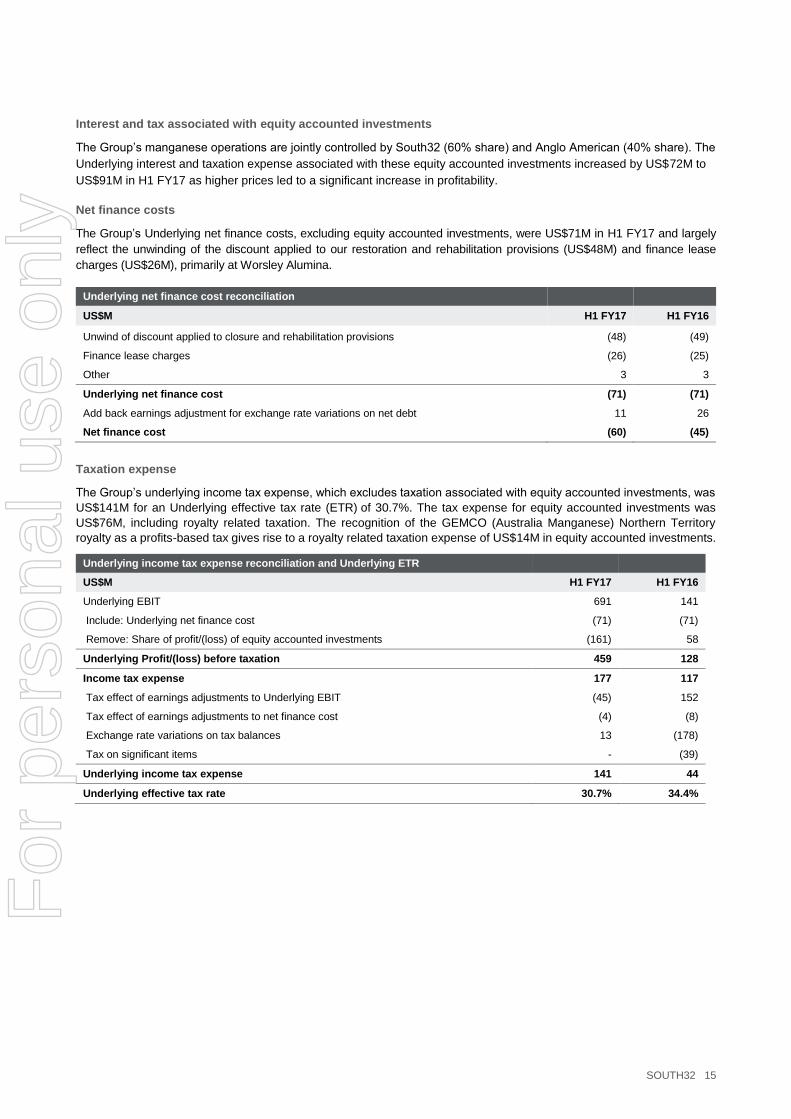
Net finance costs
The Group’s Underlying net finance costs, excluding equity accounted investments, were US$71M in H1 FY17 and largely
reflect the unwinding of the discount applied to our restoration and rehabilitation provisions (US$48M) and finance lease
charges (US$26M), primarily at Worsley Alumina.
Underlying net finance cost reconciliation
US$M H1 FY17 H1 FY16
Unwind of discount applied to closure and rehabilitation provisions (48) (49)
Finance lease charges (26) (25)
Other 3 3
Underlying net finance cost (71) (71)
Add back earnings adjustment for exchange rate variations on net debt 11 26
Net finance cost (60) (45)
Taxation expense
The Group’s underlying income tax expense, which excludes taxation associated with equity accounted investments, was
US$141M for an Underlying effective tax rate (ETR) of 30.7%. The tax expense for equity accounted investments was
US$76M, including royalty related taxation. The recognition of the GEMCO (Australia Manganese) Northern Territory
royalty as a profits-based tax gives rise to a royalty related taxation expense of US$14M in equity accounted investments.
Underlying income tax expense reconciliation and Underlying ETR
US$M H1 FY17 H1 FY16
Underlying EBIT 691 141
Include: Underlying net finance cost (71) (71)
Remove: Share of profit/(loss) of equity accounted investments (161) 58
Underlying Profit/(loss) before taxation 459 128
Income tax expense 177 117
Tax effect of earnings adjustments to Underlying EBIT (45) 152
Tax effect of earnings adjustments to net finance cost (4) (8)
Exchange rate variations on tax balances 13 (178)
Tax on significant items - (39)
Underlying income tax expense 141 44
Underlying effective tax rate 30.7% 34.4%
For
per
sona
l use
onl
y
SOUTH32 16
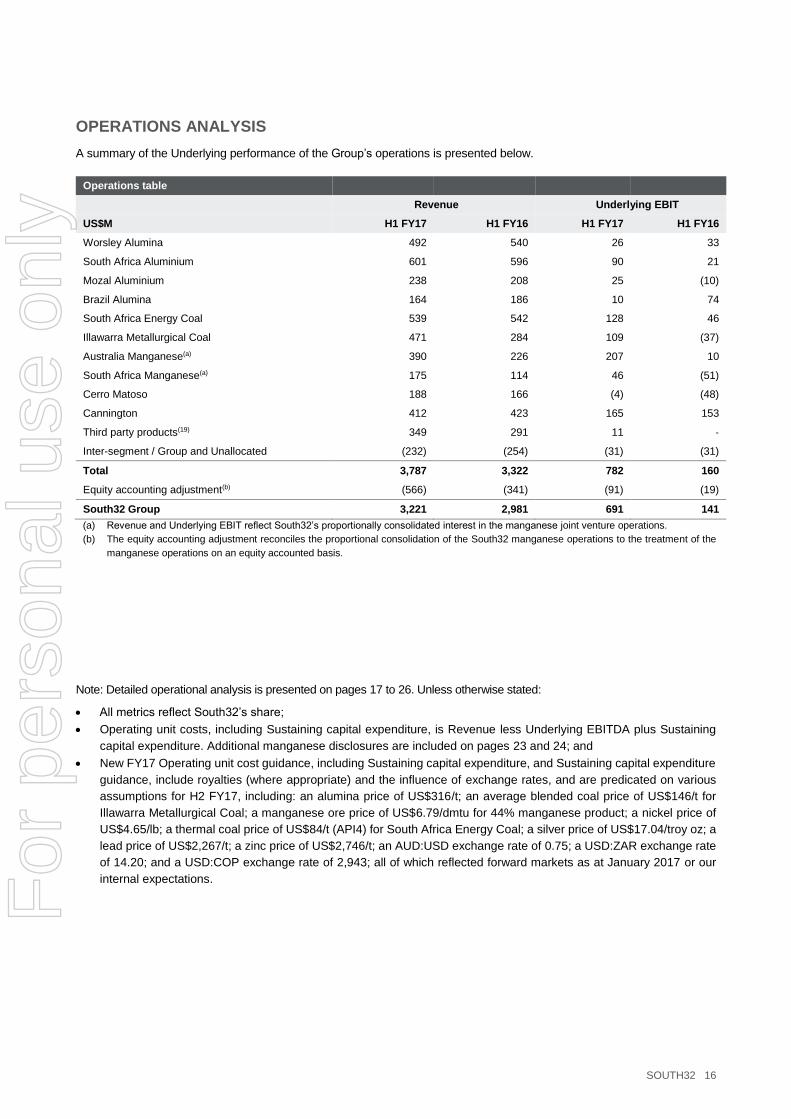
OPERATIONS ANALYSIS
A summary of the Underlying performance of the Group’s operations is presented below.
Operations table Revenue Underlying EBIT
US$M H1 FY17 H1 FY16 H1 FY17 H1 FY16
Worsley Alumina 492 540 26 33
South Africa Aluminium 601 596 90 21
Mozal Aluminium 238 208 25 (10)
Brazil Alumina 164 186 10 74
South Africa Energy Coal 539 542 128 46
Illawarra Metallurgical Coal 471 284 109 (37)
Australia Manganese(a) 390 226 207 10
South Africa Manganese(a) 175 114 46 (51)
Cerro Matoso 188 166 (4) (48)
Cannington 412 423 165 153
Third party products(19) 349 291 11 -
Inter-segment / Group and Unallocated (232) (254) (31) (31)
Total 3,787 3,322 782 160
Equity accounting adjustment(b) (566) (341) (91) (19)
South32 Group 3,221 2,981 691 141
(a) Revenue and Underlying EBIT reflect South32’s proportionally consolidated interest in the manganese joint venture operations.
(b) The equity accounting adjustment reconciles the proportional consolidation of the South32 manganese operations to the treatment of the
manganese operations on an equity accounted basis.
Note: Detailed operational analysis is presented on pages 17 to 26. Unless otherwise stated:
All metrics reflect South32’s share;
Operating unit costs, including Sustaining capital expenditure, is Revenue less Underlying EBITDA plus Sustaining
capital expenditure. Additional manganese disclosures are included on pages 23 and 24; and
New FY17 Operating unit cost guidance, including Sustaining capital expenditure, and Sustaining capital expenditure
guidance, include royalties (where appropriate) and the influence of exchange rates, and are predicated on various
assumptions for H2 FY17, including: an alumina price of US$316/t; an average blended coal price of US$146/t for
Illawarra Metallurgical Coal; a manganese ore price of US$6.79/dmtu for 44% manganese product; a nickel price of
US$4.65/lb; a thermal coal price of US$84/t (API4) for South Africa Energy Coal; a silver price of US$17.04/troy oz; a
lead price of US$2,267/t; a zinc price of US$2,746/t; an AUD:USD exchange rate of 0.75; a USD:ZAR exchange rate
of 14.20; and a USD:COP exchange rate of 2,943; all of which reflected forward markets as at January 2017 or our
internal expectations. For
per
sona
l use
onl
y

SOUTH32 17
WORSLEY ALUMINA
(86% SHARE)
Volumes
Worsley Alumina saleable production decreased by 3% (or
53kt) to 1.9Mt in H1 FY17. Hydrate production remained at
an annualised rate of 4.5Mt (100% basis) and FY17
saleable alumina production guidance remains unchanged
at 4.0Mt.
FY18 saleable alumina production guidance is unchanged
with the refinery expected to produce at its nameplate capacity
of 4.6Mt (100% basis).
Costs
Operating unit costs decreased by 12% to US$200/t in
H1 FY17 despite a stronger Australian dollar. Reduced
employee and contractor numbers and procurement savings,
including lower energy costs and contractor rates, contributed
to the improvement in unit costs.
We have restated FY17 Operating unit costs, including
Sustaining capital expenditure guidance to US$218/t in FY17
(FY16: US$221/t) to reflect updated exchange rate and price-
linked royalty assumptions and a minor increase in costs. This
includes Sustaining capital expenditure of US$59M as
additional investment is directed towards water infrastructure
in H2 FY17. Revised exchange rate and price assumptions for
our FY17 unit cost targets are detailed on page 27, footnote
14.
Financial performance
Underlying EBIT declined by US$7M in H1 FY17 to US$26M.
Lower average realised alumina prices (-US$32M, net of price-
linked costs), a stronger Australian dollar (-US$10M) and a
US$44M reduction in controllable costs had the most
significant influence on financial performance.
Capital expenditure decreased by 14% to US$19M in
H1 FY17.
South32 share H1 FY17 H1 FY16
Alumina production (kt) 1,940 1,993
Alumina sales (kt) 1,909 1,898
Realised alumina sales price (US$/t)(a)
258 285
Operating unit cost (US$/t)(b) 200 228
(a) Realised sales price is calculated as sales revenue divided by sales volume.
(b) Operating unit cost is Revenue less Underlying EBITDA divided by sales volume.
South32 share (US$M) H1 FY17 H1 FY16
Revenue 492 540
Underlying EBITDA 110 108
Underlying EBIT 26 33
Net operating assets/(liabilities)(a) 3,186 3,208
Capital expenditure 19 22
Major projects (>US$100M) - -
All other capital expenditure 19 22
Exploration expenditure - -
Exploration expensed - -
(a) H1 FY16 reflects balance as at 30 June 2016.
For
per
sona
l use
onl
y

SOUTH32 18
SOUTH AFRICA ALUMINIUM (100%)
Volumes
South Africa Aluminium saleable production increased by
1% (or 4kt) to 356kt in H1 FY17 as the smelter continued to
operate at benchmark levels of current efficiency, with
fewer load-shedding events. Strong performance also
reflected the recommencement of production in the 22 pots
that were suspended in the September 2015 quarter.
Costs
Operating unit costs decreased by 8% to US$1,380/t in
H1 FY17. The combination of lower raw material prices and a
weaker South African rand offset higher aluminium price-
linked power costs and the impact of lower sales. A total of 50
pots were relined across H1 FY17 at a cost of approximately
US$211k per pot (H1 FY16: 66 pots at US$204k per pot).
72 pots are scheduled to be relined in FY17.
While additional productivity gains are being pursued, the cost
profile of the smelter will be more heavily influenced by power
and raw material inputs, given the operation’s high variable
cost base. Hillside sources power from Eskom under long-term
contracts. The price of electricity supplied to potlines 1 and 2
is linked to the LME aluminium price and the South African
rand/US dollar exchange rate. The price of electricity supplied
to potline 3 is South African rand based and linked to South
African and United States producer price indices.
Financial performance
Underlying EBIT increased by US$69M in H1 FY17 to
US$90M. The combination of higher average realised
aluminium prices and premia and lower raw material costs
increased Underlying EBIT by US$80M, net of other price-
linked costs. The impact of lower sales volumes (-US$28M)
was offset by inventory movements that contributed to a total
controllable cost reduction of US$19M.
Capital expenditure decreased by 25% to US$6M in
H1 FY17.
South32 share H1 FY17 H1 FY16
Aluminium production (kt) 356 352
Aluminium sales (kt)(a) 347 363
Realised sales price (US$/t)(a) 1,732 1,642
Operating unit cost (US$/t)(b) 1,380 1,496
(a) Volumes and prices do not include any third party trading that may be undertaken independently of equity production. Realised sales price is calculated as sales revenue divided by sales volume.
(b) Operating unit cost is Revenue less Underlying EBITDA divided by sales volume.
South32 share (US$M) H1 FY17 H1 FY16
Revenue 601 596
Underlying EBITDA 122 53
Underlying EBIT 90 21
Net operating assets/(liabilities)(a) 1,243 1,059
Capital expenditure 6 8
Major projects (>US$100M) - -
All other capital expenditure 6 8
Exploration expenditure - -
Exploration expensed - -
(a) H1 FY16 reflects balance as at 30 June 2016.
For
per
sona
l use
onl
y

SOUTH32 19
MOZAL ALUMINIUM
(47.1% SHARE)
Volumes
Mozal Aluminium saleable production increased by 2% (or
3kt) to 136kt in H1 FY17 as current efficiency continued to
improve and the operation experienced fewer load-
shedding events. The 11% increase in sales reflects the
timing of shipments between periods.
Costs
Operating unit costs decreased by 12% to US$1,448/t in
H1 FY17 reflecting stronger sales and lower raw materials
prices. A total of 39 pots were relined across H1 FY17 at a
cost of approximately US$193k per pot (H1 FY16: 69 pots at
US$212k per pot). 106 pots are now scheduled to be relined
in FY17.
While additional productivity gains are being pursued, the cost
profile of the smelter will be more heavily influenced by power
and raw material inputs, given the operation’s high variable
cost base. Mozal Aluminium utilises hydroelectric power under
a long-term contract that is generated by Hidroeléctrica de
Cahora Bassa (HCB). HCB delivers power into the South
African grid to Eskom and Mozal Aluminium sources the power
via the Mozambique Transmission Company (Motraco).
Financial performance
Underlying EBIT increased by US$35M in H1 FY17 to
US$25M. The combination of higher average realised
aluminium prices and premia and lower raw material costs
increased Underlying EBIT by US$23M, net of other price-
linked costs. The benefit of higher sales volumes (+US$21M)
was partially offset by an unfavourable year-on-year
movement in inventory that contributed to a net controllable
cost increase of US$12M. A favourable exchange rate impact
(+US$8M) was offset by inflation (-US$6M).
Capital expenditure decreased by 40% to US$3M in
H1 FY17.
South32 share H1 FY17 H1 FY16
Aluminium production (kt) 136 133
Aluminium sales (kt)(a) 134 121
Realised sales price (US$/t)(a) 1,776 1,719
Operating unit cost (US$/t)(b) 1,448 1,653
(a) Volumes and prices do not include any third party trading that may be undertaken independently of equity production. Realised sales price is calculated as sales revenue divided by sales volume.
(b) Operating unit cost is Revenue less Underlying EBITDA divided by sales volume.
South32 share (US$M) H1 FY17 H1 FY16
Revenue 238 208
Underlying EBITDA 44 8
Underlying EBIT 25 (10)
Net operating assets/(liabilities)(a) 561 565
Capital expenditure 3 5
Major projects (>US$100M) - -
All other capital expenditure 3 5
Exploration expenditure - -
Exploration expensed - -
(a) H1 FY16 reflects balance as at 30 June 2016.
For
per
sona
l use
onl
y

SOUTH32 20
BRAZIL ALUMINA
(ALUMINA 36% SHARE, ALUMINIUM
40% SHARE)
Volumes
Brazil Alumina saleable production remained unchanged in
H1 FY17 at 673kt as planned maintenance at the refinery and
port in the September 2016 quarter was offset by record
production in the December 2016 quarter. FY17 saleable
alumina production guidance remains unchanged at 1.32Mt,
with a small increase in production anticipated in FY18.
Costs
Alumina operating unit costs at the non-operated refinery
increased by 5% to US$194/t in H1 FY17 as the Brazilian real
strengthened and sales volumes declined.
Financial performance
Underlying EBIT decreased by US$64M in H1 FY17 to
US$10M as the contribution of power sales declined by
US$57M in the period.
In H1 FY16 we terminated the power supply contract with
Eletronorte and in H2 FY16 recorded an onerous contract
provision to reflect anticipated future losses associated with
the remaining power supply commitments across FY17 and
FY18.
Within the alumina supply chain, Underlying EBIT decreased
by US$24M to US$12M. Lower average realised alumina
prices (-US$7M, net of price-linked costs), weaker sales
volumes (-US$6M) and the stronger Brazilian real (-US$6M)
led to the decline in profitability.
Capital expenditure at the refinery increased by 44% to
US$13M in H1 FY17.
South32 share H1 FY17 H1 FY16
Alumina production (kt) 673 673
Alumina sales (kt) 638 661
Realised alumina sales price (US$/t)(a)
257 281
Alumina operating unit cost (US$/t)(b)(c)
194 185
(a) Realised sales price is calculated as sales revenue divided by sales volume.
(b) Operating unit cost is Revenue less Underlying EBITDA divided by sales volume.
(c) Includes cost of acquiring bauxite from Mineração Rio do Norte S.A.
South32 share (US$M) H1 FY17 H1 FY16
Revenue 164 186
Alumina 164 186
Aluminium - -
Intra-segment elimination - -
Other income(a) 86 105
Underlying EBITDA 38 110
Alumina 40 64
Aluminium (2) 46
Underlying EBIT 10 74
Alumina 12 36
Aluminium (2) 38
Net operating assets/(liabilities)(b) 662 707
Alumina 722 737
Aluminium (60) (30)
Capital expenditure 13 9
Major projects (>US$100M) - -
All other capital expenditure 13 9
Exploration expenditure - -
Exploration expensed - -
(a) Other income in H1 FY17 includes revenue of US$84M from the sale of surplus electricity (H1 FY16: US$99M). This revenue was offset by electricity purchases from Eletronorte and the unwind of the onerous contract provision recorded in FY16.
(b) H1 FY16 reflects balance as at 30 June 2016.
For
per
sona
l use
onl
y

SOUTH32 21
SOUTH AFRICA ENERGY COAL
(92% SHARE)
Volumes
South Africa Energy Coal saleable production decreased
by 9% (or 1.6Mt) to 14.8Mt in H1 FY17. The decline in
production reflects the prior suspension of the North Plant
at the Wolvekrans Middelburg Complex (WMC), scheduled
maintenance and the repositioning of draglines. Export
sales were also impacted by Transnet’s annual rail
maintenance cycle.
Total coal production guidance for FY17 and FY18 is
unchanged and will benefit from additional capital
investment at the Wolvekrans Middelburg Complex that will
open up new mining areas. FY17 saleable coal production
guidance is 30.9Mt (domestic coal 17.0Mt, export coal
13.9Mt).
Costs
Operating unit costs increased by 4% to US$26/t in H1 FY17
largely as a result of lower sales volumes for both domestic
and export coal. This impact was partially offset by a
favourable movement in inventory and a weaker South African
rand.
We have restated FY17 Operating unit costs, including
Sustaining capital expenditure guidance to US$30/t in FY17
(FY16: US$27/t) to reflect updated exchange rate and price-
linked royalty assumptions. This includes Sustaining capital
expenditure of US$75M as additional investment is directed
towards the Wolvekrans Middelburg Complex in H2 FY17.
Revised exchange rate and price assumptions for our FY17
unit cost targets are detailed on page 27, footnote 14.
Financial performance
Underlying EBIT increased by US$82M in H1 FY17 to
US$128M. Higher average realised coal prices increased
Underlying EBIT by US$100M, net of price-linked costs, but
were partially offset by lower sales volumes (net -US$73M).
Non-cash charges declined by US$46M as depreciation and
amortisation was rebased following the prior recognition of
impairments.
Sustaining capital expenditure decreased by 40% to US$25M
in H1 FY17 following the purchase of mobile equipment in the
prior period. We expect Major project capital expenditure of
approximately US$30M in FY17 to fund study costs and the
acquisition of land in preparation for our Klipspruit Life
Extension project. A final investment decision is scheduled for
the June 2017 quarter. Major project capital expenditure is
excluded from our unit cost guidance.
100 per cent terms(a) H1 FY17 H1 FY16
Energy coal production (kt) 14,825 16,379
Domestic sales (kt)(b) 8,918 9,080
Export sales (kt)(b) 5,856 8,021
Realised domestic sales price (US$/t)(b)
19 19
Realised export sales price (US$/t)(b) 63 46
Operating unit cost (US$/t)(c) 26 25
(c) South32’s interest in South Africa Energy Coal is accounted at 100% until B-BBEE vendor loans are repaid.
(d) Volumes and prices do not include any third party trading that may be undertaken independently of equity production. Realised sales price is calculated as sales revenue divided by sales volume.
(e) Operating unit cost is Revenue less Underlying EBITDA divided by sales volume.
100 per cent terms(a) (US$M) H1 FY17 H1 FY16
Revenue(b) 539 542
Underlying EBITDA 152 116
Underlying EBIT 128 46
Net operating assets/(liabilities)(c) (81) (99)
Capital expenditure 27 42
Major projects (>US$100M) 2 -
All other capital expenditure 25 42
Exploration expenditure - -
Exploration expensed - -
(a) South32’s interest in South Africa Energy Coal is accounted at 100% until B-BBEE vendor loans are repaid.
(b) Includes domestic and export sales revenue.
(c) H1 FY16 reflects balance as at 30 June 2016.
For
per
sona
l use
onl
y

SOUTH32 22
ILLAWARRA METALLURGICAL COAL
(100%)
Volumes
Illawarra Metallurgical Coal saleable production decreased by 6% (or 243kt) to 3.7Mt in H1 FY17. The decline in production primarily reflected challenging ground conditions at Appin Area 9 and a moderation of mining rates at Appin Area 7 that ensured gas concentrations were maintained at safe levels. These impacts were partially offset by strong operating performance at Dendrobium. Consistent with our recent update, Illawarra Metallurgical Coal sales of 8.1Mt are expected in FY17 as Appin Area 7 has returned to full capacity and Appin Area 9 has recommenced production, as planned.
With the completion of the 901 panel and associated
release of ground stresses, longwall availability and cutting
rates are anticipated to improve in subsequent longwall
panels. The lower production rate in FY17 has, however,
impacted the timing of longwall panel extraction and
production guidance for FY18 has been revised
accordingly.
Restated FY17 production guidance incorporates a longwall
move for each of the March and June 2017 quarters.
Costs
Operating unit costs increased by 19% to US$75/t in H1 FY17
as a result of lower sales and the operation’s high proportion
of fixed costs. Additional cost pressure stemmed from a
stronger Australian dollar, inflation and higher price-linked
royalties.
We have restated Operating unit costs, including Sustaining
capital expenditure guidance to US$90/t (FY16: US$80/t) to
reflect updated exchange rate and price-linked royalty
assumptions. This includes Sustaining capital expenditure of
US$129M, encompassing underground mine development of
US$69M. Revised exchange rate and price assumptions for
our FY17 unit cost targets are detailed on page 27, footnote
14.
Financial performance
Underlying EBIT increased by US$146M in H1 FY17 to
US$109M. The benefit of higher average realised coal prices
(+US$193M, net of price-linked costs) was partially offset by a
decline in sales volumes (-US$20M) and a stronger Australian
dollar (-US$10M). Our average realised price for H1 FY17 was
impacted by a carry over shipment in December 2016 that was
associated with our prior declaration of force majeure. Another
carry over shipment is scheduled for H2 FY17.
Capital expenditure decreased by 51% to US$54M in
H1 FY17 following the completion of the Appin Area 9 project
in the March 2016 quarter. Capital expenditure included
underground development of approximately US$29M.
South32 share H1 FY17 H1 FY16
Metallurgical coal production (kt) 2,829 3,298
Energy coal production (kt) 884 658
Metallurgical coal sales (kt) 2,788 3,132
Energy coal sales (kt) 817 609
Realised metallurgical coal sales price (US$/t)(a)
151 82
Realised energy coal sales price (US$/t)(a)
62 43
Operating unit cost (US$/t)(b) 75 63
(a) Realised sales price is calculated as sales revenue divided by sales volume.
(b) Operating unit cost is Revenue less Underlying EBITDA divided by sales volume.
South32 share (US$M) H1 FY17 H1 FY16
Revenue(a) 471 284
Underlying EBITDA 202 50
Underlying EBIT 109 (37)
Net operating assets/(liabilities)(b) 1,514 1,516
Capital expenditure 54 111
Major projects (>US$100M) 6 26
All other capital expenditure 48 85
Exploration expenditure 2 1
Exploration expensed 2 1
(a) Includes metallurgical coal and energy coal sales revenue.
(b) H1 FY16 reflects balance as at 30 June 2016.
For
per
sona
l use
onl
y
SOUTH32 23
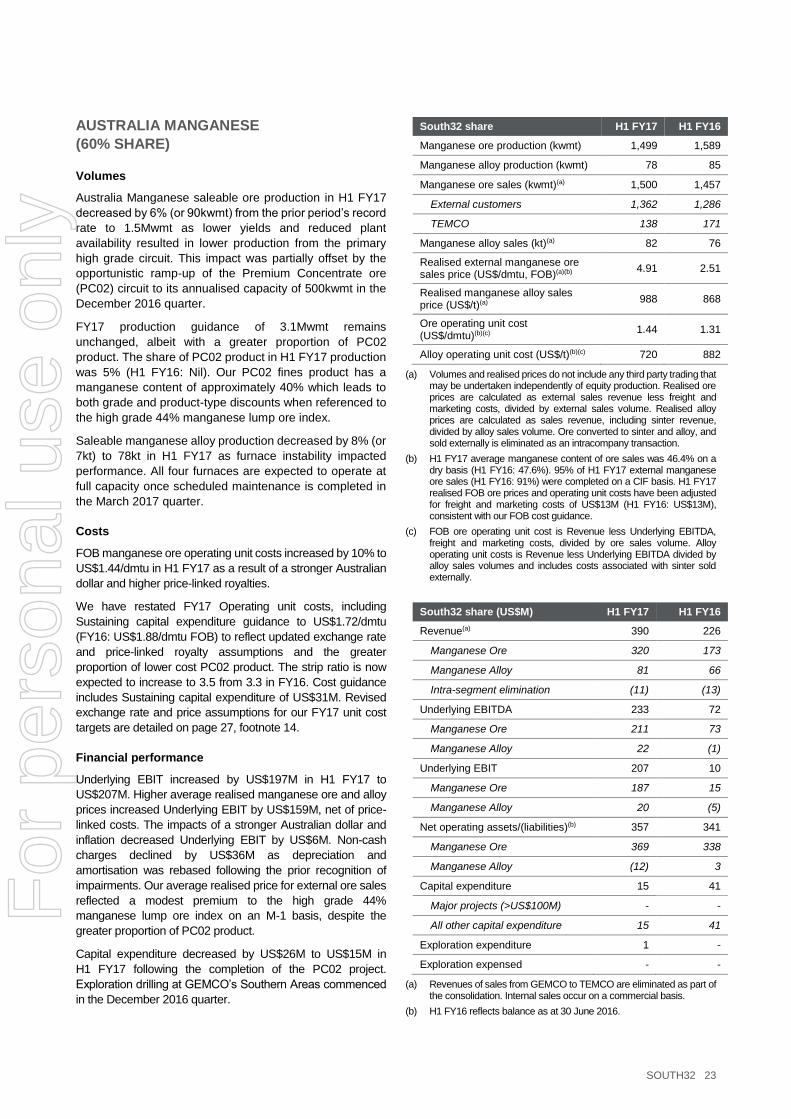
AUSTRALIA MANGANESE
(60% SHARE)
Volumes
Australia Manganese saleable ore production in H1 FY17
decreased by 6% (or 90kwmt) from the prior period’s record
rate to 1.5Mwmt as lower yields and reduced plant
availability resulted in lower production from the primary
high grade circuit. This impact was partially offset by the
opportunistic ramp-up of the Premium Concentrate ore
(PC02) circuit to its annualised capacity of 500kwmt in the
December 2016 quarter.
FY17 production guidance of 3.1Mwmt remains
unchanged, albeit with a greater proportion of PC02
product. The share of PC02 product in H1 FY17 production
was 5% (H1 FY16: Nil). Our PC02 fines product has a
manganese content of approximately 40% which leads to
both grade and product-type discounts when referenced to
the high grade 44% manganese lump ore index.
Saleable manganese alloy production decreased by 8% (or
7kt) to 78kt in H1 FY17 as furnace instability impacted
performance. All four furnaces are expected to operate at
full capacity once scheduled maintenance is completed in
the March 2017 quarter.
Costs
FOB manganese ore operating unit costs increased by 10% to
US$1.44/dmtu in H1 FY17 as a result of a stronger Australian
dollar and higher price-linked royalties.
We have restated FY17 Operating unit costs, including
Sustaining capital expenditure guidance to US$1.72/dmtu
(FY16: US$1.88/dmtu FOB) to reflect updated exchange rate
and price-linked royalty assumptions and the greater
proportion of lower cost PC02 product. The strip ratio is now
expected to increase to 3.5 from 3.3 in FY16. Cost guidance
includes Sustaining capital expenditure of US$31M. Revised
exchange rate and price assumptions for our FY17 unit cost
targets are detailed on page 27, footnote 14.
Financial performance
Underlying EBIT increased by US$197M in H1 FY17 to
US$207M. Higher average realised manganese ore and alloy
prices increased Underlying EBIT by US$159M, net of price-
linked costs. The impacts of a stronger Australian dollar and
inflation decreased Underlying EBIT by US$6M. Non-cash
charges declined by US$36M as depreciation and
amortisation was rebased following the prior recognition of
impairments. Our average realised price for external ore sales
reflected a modest premium to the high grade 44%
manganese lump ore index on an M-1 basis, despite the
greater proportion of PC02 product.
Capital expenditure decreased by US$26M to US$15M in
H1 FY17 following the completion of the PC02 project.
Exploration drilling at GEMCO’s Southern Areas commenced
in the December 2016 quarter.
South32 share H1 FY17 H1 FY16
Manganese ore production (kwmt) 1,499 1,589
Manganese alloy production (kwmt) 78 85
Manganese ore sales (kwmt)(a) 1,500 1,457
External customers 1,362 1,286
TEMCO 138 171
Manganese alloy sales (kt)(a) 82 76
Realised external manganese ore sales price (US$/dmtu, FOB)(a)(b)
4.91 2.51
Realised manganese alloy sales price (US$/t)(a)
988 868
Ore operating unit cost (US$/dmtu)(b)(c)
1.44 1.31
Alloy operating unit cost (US$/t)(b)(c) 720 882
(a) Volumes and realised prices do not include any third party trading that may be undertaken independently of equity production. Realised ore prices are calculated as external sales revenue less freight and marketing costs, divided by external sales volume. Realised alloy prices are calculated as sales revenue, including sinter revenue, divided by alloy sales volume. Ore converted to sinter and alloy, and sold externally is eliminated as an intracompany transaction.
(b) H1 FY17 average manganese content of ore sales was 46.4% on a dry basis (H1 FY16: 47.6%). 95% of H1 FY17 external manganese ore sales (H1 FY16: 91%) were completed on a CIF basis. H1 FY17 realised FOB ore prices and operating unit costs have been adjusted for freight and marketing costs of US$13M (H1 FY16: US$13M), consistent with our FOB cost guidance.
(c) FOB ore operating unit cost is Revenue less Underlying EBITDA, freight and marketing costs, divided by ore sales volume. Alloy operating unit costs is Revenue less Underlying EBITDA divided by alloy sales volumes and includes costs associated with sinter sold externally.
South32 share (US$M) H1 FY17 H1 FY16
Revenue(a) 390 226
Manganese Ore 320 173
Manganese Alloy 81 66
Intra-segment elimination (11) (13)
Underlying EBITDA 233 72
Manganese Ore 211 73
Manganese Alloy 22 (1)
Underlying EBIT 207 10
Manganese Ore 187 15
Manganese Alloy 20 (5)
Net operating assets/(liabilities)(b) 357 341
Manganese Ore 369 338
Manganese Alloy (12) 3
Capital expenditure 15 41
Major projects (>US$100M) - -
All other capital expenditure 15 41
Exploration expenditure 1 -
Exploration expensed - -
(a) Revenues of sales from GEMCO to TEMCO are eliminated as part of the consolidation. Internal sales occur on a commercial basis.
(b) H1 FY16 reflects balance as at 30 June 2016.
For
per
sona
l use
onl
y

SOUTH32 24
SOUTH AFRICA MANGANESE
(ORE 44.4% SHARE, ALLOY 60% SHARE)
Volumes
South Africa Manganese saleable ore production increased
by 23% (or 177kwmt) to 934kwmt in H1 FY17 as market
conditions supported a drawdown of Wessels concentrate
stockpiles and the use of higher cost trucking to access
export opportunities. Wessels concentrate accounted for
15% of H1 FY17 external sales (H1 FY16: 4%). South
Africa Manganese ore production will remain configured for
an optimised rate of 2.9Mwmt pa (100% basis), although
we will continue to act opportunistically when market
fundamentals are supportive.
Manganese alloy saleable production decreased by 20%
(or 9kt) to 37kt in H1 FY17 as a result of furnace instability.
Metalloys continues to operate one of its four furnaces.
Costs
FOB manganese ore operating unit costs decreased by 13%
to US$1.96/dmtu in H1 FY17. The benefit of a weaker South
African rand was partially offset by higher price-linked royalties
and the impact of inflation. The drawdown of low cost Wessels
concentrate stockpiles offset the costs absorbed to
opportunistically increase trucking of ore to port.
We have restated FOB Operating unit costs, including
Sustaining capital expenditure guidance to US$2.20/dmtu in
FY17 (FY16: US$2.01/dmtu FOB) to reflect updated exchange
rate and price-linked royalty assumptions. This includes
Sustaining capital expenditure of US$9M. Revised exchange
rate and price assumptions for our FY17 unit cost targets are
detailed on page 27, footnote 14.
Financial performance
Underlying EBIT increased by US$97M in H1 FY17 to
US$46M as higher average realised manganese ore and alloy
prices increased Underlying EBIT by US$66M, net of price-
linked costs. Our average realised price for external sales
reflects a 12% discount to the medium grade 37% manganese
lump ore index on an M-1 basis as our Wessels concentrate is
a fine grained product. Non-cash charges declined by US$8M
as depreciation and amortisation was rebased following the
prior recognition of impairments.
Capital expenditure decreased to US$4M in H1 FY17. The
Wessels Central Block project remains on track to be
completed in the March 2017 quarter.
South32 share H1 FY17 H1 FY16
Manganese ore production (kwmt) 934 757
Manganese alloy production (kwmt) 37 46
Manganese ore sales (kwmt)(a) 928 879
External customers 859 862
Metalloys 69 17
Manganese alloy sales (kt)(a) 40 50
Realised external manganese ore sales price (US$/dmtu, FOB)(a)(b)
3.87 2.00
Realised manganese alloy sales price (US$/t)(a)
875 740
Ore operating unit cost (US$/dmtu)(b)(c)
1.96 2.24
Alloy operating unit cost (US$/t)(b)(c) 925 1,120
(a) Volumes and prices do not include any third party trading that may be undertaken independently of equity production. Realised ore prices are calculated as external sales revenue less freight and marketing costs, divided by external sales volume. Realised alloy prices are calculated as sales revenue, divided by alloy sales volume. Ore converted to sinter and alloy, and sold externally is eliminated as an intracompany transaction. Manganese ore sales are grossed-up to reflect a 60% accounting effective interest.
(b) H1 FY17 average manganese content of ore sales was 40.3% on a dry basis (H1 FY16: 40.1%). 61% of H1 FY17 external manganese ore sales (H1 FY16: 54%) were completed on a CIF basis. H1 FY17 realised FOB ore prices and operating costs have been adjusted for freight and marketing costs of US$10M (H1 FY16: US$9M), consistent with our FOB cost guidance.
(c) FOB ore operating unit cost is Revenue less Underlying EBITDA, freight and marketing costs, divided by ore sales volume. Alloy operating unit costs is Revenue less Underlying EBITDA divided by alloy sales volumes.
South32 share (US$M) H1 FY17 H1 FY16
Revenue(a) 175 114
Manganese Ore(b) 145 78
Manganese Alloy 35 37
Intra-segment elimination (5) (1)
Underlying EBITDA 61 (28)
Manganese Ore(b) 63 (9)
Manganese Alloy (2) (19)
Underlying EBIT 46 (51)
Manganese Ore(b) 54 (25)
Manganese Alloy (8) (26)
Net operating assets/(liabilities)(c) 337 342
Manganese Ore(b) 263 258
Manganese Alloy 74 84
Capital expenditure 4 7
Major projects (>US$100M) - -
All other capital expenditure 4 7
Exploration expenditure - -
Exploration expensed - -
(a) Revenues of sales from Hotazel mines to Metalloys are eliminated as part of the consolidation. Internal sales occur on a commercial basis.
(b) Consistent with the presentation of South32’s segment information, South Africa Manganese ore production and sales have been reported at 60%. The group’s financial statement will continue to reflect a 54.6% interest in South Africa Manganese ore.
(c) H1 FY16 reflects balance as at 30 June 2016.
For
per
sona
l use
onl
y

SOUTH32 25
CERRO MATOSO
(99.9% SHARE)
Volumes
Cerro Matoso payable nickel production remained largely
unchanged at 17.7kt in H1 FY17 as plant performance was
further optimised and higher recoveries were achieved.
Payable nickel production guidance for Cerro Matoso
remains unchanged at approximately 36kt for FY17.
Accelerated development of the higher grade La Esmeralda
Mineral Resource will increase production by 16% in FY18
to approximately 42kt. Production from La Esmeralda is
now expected to commence in the June 2017 quarter.
Costs
Operating unit costs decreased by 14% to US$3.81/lb in
H1 FY17. Modest inflationary pressure was more than offset
by lower electricity costs, a reduction in contract services and
lower raw material consumption rates.
We have restated FY17 Operating unit costs, including
Sustaining capital expenditure guidance to US$3.98/lb
(FY16: US$4.30/lb) to reflect updated exchange rate and
price-linked royalty assumptions. This includes Sustaining
capital expenditure of US$16M. Revised exchange rate and
price assumptions for our FY17 unit cost targets are detailed
on page 27, footnote 14.
Financial performance
Underlying EBIT increased by US$44M in H1 FY17 to a loss
of US$4M as higher average realised prices (+US$21M, net of
price-linked costs) and embedded cost saving initiatives
(+US$22M) underpinned an improvement in financial
performance.
Capital expenditure of US$4M was 67% lower than the prior
period.
South32 share H1 FY17 H1 FY16
Ore mined (kwmt) 2,347 3,017
Ore processed (kdmt) 1,289 1,312
Ore grade processed (%, Ni) 1.5 1.5
Payable nickel production (kt) 17.7 17.5
Payable nickel sales (kt) 17.6 17.5
Realised nickel sales price (US$/lb)(a)
4.85 4.30
Operating unit cost (US$/lb)(b) 3.81 4.43
(a) Inclusive of by-products. Realised sales price is calculated as sales revenue divided by sales volume.
(b) Operating unit cost is Revenue less Underlying EBITDA divided by Payable nickel sales volume.
South32 share (US$M) H1 FY17 H1 FY16
Revenue 188 166
Underlying EBITDA 40 (5)
Underlying EBIT (4) (48)
Net operating assets/(liabilities)(a) 647 683
Capital expenditure 4 12
Major projects (>US$100M) - -
All other capital expenditure 4 12
Exploration expenditure 2 3
Exploration expensed 2 1
(a) H1 FY16 reflects balance as at 30 June 2016.
For
per
sona
l use
onl
y
SOUTH32 26
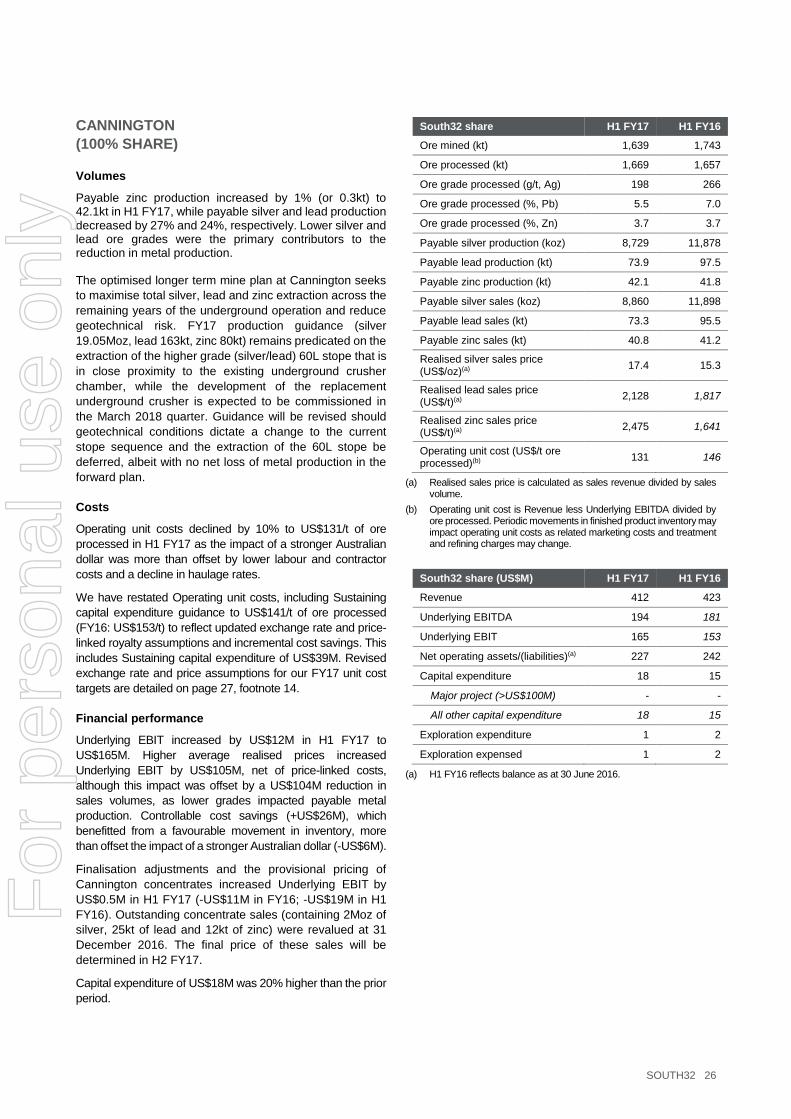
CANNINGTON
(100% SHARE)
Volumes
Payable zinc production increased by 1% (or 0.3kt) to 42.1kt in H1 FY17, while payable silver and lead production decreased by 27% and 24%, respectively. Lower silver and lead ore grades were the primary contributors to the reduction in metal production. The optimised longer term mine plan at Cannington seeks
to maximise total silver, lead and zinc extraction across the
remaining years of the underground operation and reduce
geotechnical risk. FY17 production guidance (silver
19.05Moz, lead 163kt, zinc 80kt) remains predicated on the
extraction of the higher grade (silver/lead) 60L stope that is
in close proximity to the existing underground crusher
chamber, while the development of the replacement
underground crusher is expected to be commissioned in
the March 2018 quarter. Guidance will be revised should
geotechnical conditions dictate a change to the current
stope sequence and the extraction of the 60L stope be
deferred, albeit with no net loss of metal production in the
forward plan.
Costs
Operating unit costs declined by 10% to US$131/t of ore
processed in H1 FY17 as the impact of a stronger Australian
dollar was more than offset by lower labour and contractor
costs and a decline in haulage rates.
We have restated Operating unit costs, including Sustaining
capital expenditure guidance to US$141/t of ore processed
(FY16: US$153/t) to reflect updated exchange rate and price-
linked royalty assumptions and incremental cost savings. This
includes Sustaining capital expenditure of US$39M. Revised
exchange rate and price assumptions for our FY17 unit cost
targets are detailed on page 27, footnote 14.
Financial performance
Underlying EBIT increased by US$12M in H1 FY17 to
US$165M. Higher average realised prices increased
Underlying EBIT by US$105M, net of price-linked costs,
although this impact was offset by a US$104M reduction in
sales volumes, as lower grades impacted payable metal
production. Controllable cost savings (+US$26M), which
benefitted from a favourable movement in inventory, more
than offset the impact of a stronger Australian dollar (-US$6M).
Finalisation adjustments and the provisional pricing of
Cannington concentrates increased Underlying EBIT by
US$0.5M in H1 FY17 (-US$11M in FY16; -US$19M in H1
FY16). Outstanding concentrate sales (containing 2Moz of
silver, 25kt of lead and 12kt of zinc) were revalued at 31
December 2016. The final price of these sales will be
determined in H2 FY17.
Capital expenditure of US$18M was 20% higher than the prior
period.
South32 share H1 FY17 H1 FY16
Ore mined (kt) 1,639 1,743
Ore processed (kt) 1,669 1,657
Ore grade processed (g/t, Ag) 198 266
Ore grade processed (%, Pb) 5.5 7.0
Ore grade processed (%, Zn) 3.7 3.7
Payable silver production (koz) 8,729 11,878
Payable lead production (kt) 73.9 97.5
Payable zinc production (kt) 42.1 41.8
Payable silver sales (koz) 8,860 11,898
Payable lead sales (kt) 73.3 95.5
Payable zinc sales (kt) 40.8 41.2
Realised silver sales price (US$/oz)(a)
17.4 15.3
Realised lead sales price (US$/t)(a)
2,128 1,817
Realised zinc sales price (US$/t)(a)
2,475 1,641
Operating unit cost (US$/t ore processed)(b)
131 146
(a) Realised sales price is calculated as sales revenue divided by sales volume.
(b) Operating unit cost is Revenue less Underlying EBITDA divided by ore processed. Periodic movements in finished product inventory may impact operating unit costs as related marketing costs and treatment and refining charges may change.
South32 share (US$M) H1 FY17 H1 FY16
Revenue 412 423
Underlying EBITDA 194 181
Underlying EBIT 165 153
Net operating assets/(liabilities)(a) 227 242
Capital expenditure 18 15
Major project (>US$100M) - -
All other capital expenditure 18 15
Exploration expenditure 1 2
Exploration expensed 1 2
(a) H1 FY16 reflects balance as at 30 June 2016.
For
per
sona
l use
onl
y

SOUTH32 27
NOTES (1) Revenue includes revenue from third party products.
(2) H1 FY17 basic earnings per share is calculated as Profit/(loss) after taxation from continuing operations divided by the weighted average number of
shares for H1 FY17 (5,319 million). H1 FY17 basic Underlying earnings per share is calculated as Underlying earnings divided by the weighted average
number of shares for H1 FY17. H1 FY16 basic earnings per share is calculated as Profit/(loss) after taxation from continuing operations divided by the
weighted average number of shares for H1 FY16 (5,324 million). H1 FY16 basic Underlying earnings per share is calculated as Underlying earnings
divided by the weighted average number of shares for H1 FY16.
(3) H1 FY17 dividend per share is calculated as total dividend (US$192M) divided by the number of shares on issue at 31 December 2016 (5,324 million).
(4) Underlying EBIT is profit from continuing operations before net finance costs, taxation and any earnings adjustment items, including impairments.
Underlying EBIT is reported inclusive of South32's share of net finance costs and taxation of equity accounted investments. Underlying EBITDA is
Underlying EBIT, before depreciation and amortisation. Underlying earnings is Profit/(loss) after taxation and earnings adjustment items. Underlying
earnings is the key measure that South32 uses to assess the performance of the South32 Group, make decisions on the allocation of resources and
assess senior management's performance. In addition, the performance of each of the South32 operations and operational management are assessed
based on Underlying EBIT. In order to calculate Underlying earnings, Underlying EBIT and Underlying EBITDA, the following items are adjusted as
applicable each period, irrespective of materiality:
Exchange rate gains/losses on restatement of monetary items;
Impairment losses/reversals;
Net gain/loss on disposal and consolidation of interests in businesses;
Fair value gain/loss on derivative instruments;
Major corporate restructures; and
The income tax impact of the above items.
In addition, items that do not reflect the underlying operations of South32, and are individually significant to the financial statements, are excluded to
determine Underlying earnings. Significant items are detailed in the Financial Information.
(5) Comprises Underlying EBITDA excluding third party product EBITDA, divided by revenue excluding third party product revenue.
(6) Comprises Underlying EBIT excluding third party product EBIT, divided by revenue excluding third party product revenue.
(7) Return on invested capital (ROIC) is a key measure that South32 uses to assess performance. ROIC is calculated as annualised Underlying EBIT less
the discount on rehabilitation provisions included in net finance cost, tax effected by the Group’s Underlying effective tax rate (ETR), divided by the sum
of fixed assets (excluding any rehabilitation asset and impairments) and inventories. Manganese is included in the calculation on a proportional
consolidation basis.
(8) Refer to exchange release dated 3 November 2016.
(9) Total capital expenditure comprises Capital expenditure, the purchase of intangibles and capitalised exploration expenditure. Capital expenditure
comprises Sustaining capital expenditure and Major projects capital expenditure. Sustaining capital expenditure comprises Stay-in-business (SIB),
Minor discretionary and Deferred stripping (including underground development) capital expenditure.
(10) South32’s ownership share of operations are as follows: Worsley Alumina (86%), South Africa Aluminium (100%), Mozal Aluminium (47.1% share),
Brazil Alumina (Alumina 36% share, Aluminium 40% share), South Africa Energy Coal (92% share), Illawarra Metallurgical Coal (100%), Australia
Manganese (60% share), South Africa Manganese (60% share), Cerro Matoso (99.9% share), and Cannington (100%).
(11) South32’s interest in South Africa Energy Coal is accounted at 100% until broad-based black economic empowerment (B-BBEE) vendor loans are
repaid.
(12) Operating unit cost, including Sustaining capital expenditure is operating cost plus Sustaining capital expenditure (excludes Major Project capital
expenditure) divided by sales. Operating cost is Revenue less Underlying EBITDA. Additional manganese disclosures are included on pages 23 and
24.
(13) Prior FY17 Operating unit cost guidance, including Sustaining capital expenditure, and Sustaining capital expenditure guidance, include royalties (where
appropriate) and the influence of exchange rate assumptions, and were predicated on: an alumina price of US$259/t; an average blended coal price of
US$83/t for Illawarra Metallurgical Coal; a manganese ore price of US$3.23/dmtu for 44% manganese product; a nickel price of US$3.95/lb; a thermal
coal price of US$54/t (API4) for South Africa Energy Coal; a silver price of US$17.50/troy oz; a lead price of US$1,723/t; a zinc price of US$1,907/t; an
AUD:USD exchange rate of 0.72; a USD:ZAR exchange rate of 16.57; and a USD:COP exchange rate of 3,025; all of which reflected forward markets
as at May 2016 or our internal expectations.
(14) New FY17 Operating unit cost guidance, including Sustaining capital expenditure, and Sustaining capital expenditure guidance, include royalties (where
appropriate) and the influence of exchange rates, and are predicated on various assumptions for H2 FY17, including: an alumina price of US$316/t; an
average blended coal price of US$146/t for Illawarra Metallurgical Coal; a manganese ore price of US$6.79/dmtu for 44% manganese product; a nickel
price of US$4.65/lb; a thermal coal price of US$84/t (API4) for South Africa Energy Coal; a silver price of US$17.04/troy oz; a lead price of US$2,267/t;
a zinc price of US$2,746/t; an AUD:USD exchange rate of 0.75; a USD:ZAR exchange rate of 14.20; and a USD:COP exchange rate of 2,943; all of
which reflected forward markets as at January 2017 or our internal expectations.
(15) FY17 Capital expenditure guidance is predicated on forward markets as at January 2017, or our internal expectations, for H2 FY17, including: an
AUD:USD exchange rate of 0.75; a USD:ZAR exchange rate of 14.20; and a USD:COP exchange rate of 2,943.
(16) Underlying effective tax rate (ETR) is Underlying income tax expense excluding royalty related taxation divided by Underlying profit before tax; both the
numerator and denominator exclude equity accounted investments.
(17) Sales price variance reflects the revenue impact of changes in commodity prices, based on the current period’s sales volume. Price-linked costs
variance reflects the change in royalties together with the change in input costs driven by changes in commodity prices or market traded consumables.
Foreign exchange reflects the impact of exchange rate movements on local currency denominated costs and sales. Volume variance reflects the
revenue impact of sales volume changes, based on the comparative period’s sales prices. Controllable costs variance represents the impact from
changes in the Group’s controllable local currency cost base, including the variable cost impact of production volume changes on expenditure, and
period on period movements in inventories. The controllable cost variance excludes earnings adjustments including significant items.
(18) Underlying net finance cost and Underlying taxation expense are actual H1 FY17 results, not year-on-year variances.
For
per
sona
l use
onl
y

SOUTH32 28
(19) Third party products sold comprise US$135 million for aluminium, US$56 million for alumina, US$73 million for coal, US$47 million for freight services
and US$37 million for aluminium raw materials. Underlying EBIT on third party products comprise US$6 million for aluminium, (US$4) million for alumina,
US$9 million for coal, nil for freight services and nil for aluminium raw materials.
The following abbreviations may be used throughout this report: US$ million (US$M); US$ billion (US$B); December half year is abbreviated to H1 FY17, grams per tonne (g/t); tonnes (t); thousand tonnes (kt); thousand tonnes per annum (ktpa); million tonnes (Mt); million tonnes per annum (Mtpa); thousand troy ounces (koz); million troy ounces (Moz); thousand wet metric tonnes (kwmt); thousand dry metric tonnes (kdmt) dry metric tonne unit (dmtu); pound (lb); megawatt (MW); Australian Securities Exchange (ASX); London Stock Exchange (LSE); and Johannesburg Stock Exchange (JSE).
For
per
sona
l use
onl
y

SOUTH32 29
SOUTH32 FINANCIAL INFORMATION For the half year ended 31 December 2016
SOUTH32 FINANCIAL INFORMATION For the year ended 30 June 2015
For
per
sona
l use
onl
y

SOUTH32 30
CONSOLIDATED INCOME STATEMENT
for the half year ended 31 December 2016
US$M
Note
H1 FY17
H1 FY16
Continuing operations
Revenue
Group production 2,873 2,691
Third party products 348 290
3,221 2,981
Other income 142 167
Expenses excluding net finance cost (2,670) (4,379)
Share of profit/(loss) of equity accounted investments 164 (356)
Profit/(loss) from continuing operations 857 (1,587)
Comprising:
Group production 846 (1,587)
Third party products 11 –
Profit/(loss) from continuing operations 857 (1,587)
Finance expenses (77) (57)
Finance income 17 12
Net finance cost 6 (60) (45)
Profit/(loss) before tax 797 (1,632)
Income tax (expense)/benefit (177) (117)
Profit/(loss) after tax from continuing operations 620 (1,749)
Attributable to:
Equity holders of South32 Limited 620 (1,749)
Profit/(loss) from continuing operations attributable to the equity holders of South32 Limited
Basic earnings per share (US cents) 5 11.7 (32.9)
Diluted earnings per share (US cents) 5 11.5 (32.9)
The accompanying notes form part of the half year financial statements.
For
per
sona
l use
onl
y

SOUTH32 31
CONSOLIDATED STATEMENT OF COMPREHENSIVE INCOME
for the half year ended 31 December 2016
US$M
H1 FY17
H1 FY16
Profit/(loss) for the period 620 (1,749)
Other comprehensive income
Items that may be reclassified to the income statement:
Available for sale investments:
Net gain/(loss) taken to equity (1) (28)
Net (gain)/loss transferred to the income statement – 23
Tax benefit/(expense) recognised within other comprehensive income 2 5
Total items that may be reclassified to the income statement 1 –
Items not to be reclassified to the income statement:
Equity accounted investments – share of other comprehensive income/(loss) – 1
Actuarial gain/(loss) on pension and medical schemes 2 6
Tax benefit/(expense) recognised within other comprehensive income (1) (2)
Total items not to be reclassified to the income statement 1 5
Total other comprehensive income/(loss) 2 5
Total comprehensive income/(loss) 622 (1,744)
Attributable to:
Equity holders of South32 Limited 622 (1,744)
The accompanying notes form part of the half year financial statements.
For
per
sona
l use
onl
y
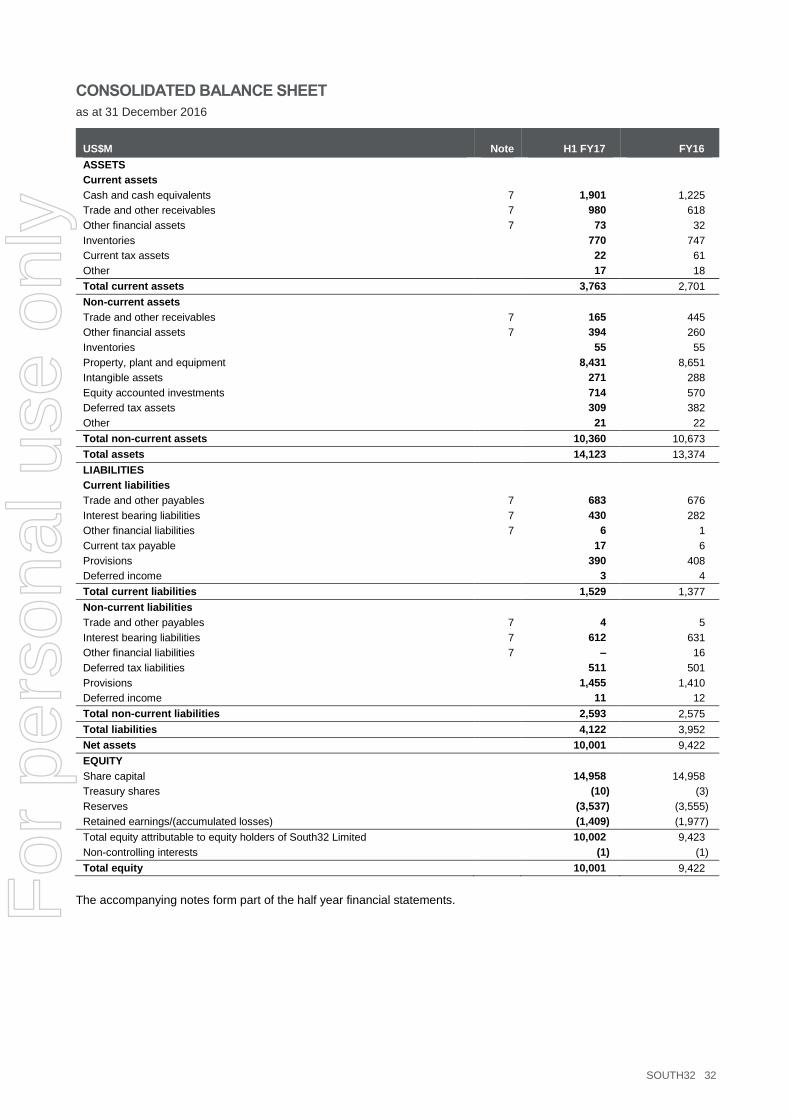
SOUTH32 32
CONSOLIDATED BALANCE SHEET
as at 31 December 2016
US$M
Note
H1 FY17
FY16
ASSETS
Current assets
Cash and cash equivalents 7 1,901 1,225
Trade and other receivables 7 980 618
Other financial assets 7 73 32
Inventories 770 747
Current tax assets 22 61
Other 17 18
Total current assets 3,763 2,701
Non-current assets
Trade and other receivables 7 165 445
Other financial assets 7 394 260
Inventories 55 55
Property, plant and equipment 8,431 8,651
Intangible assets 271 288
Equity accounted investments 714 570
Deferred tax assets 309 382
Other 21 22
Total non-current assets 10,360 10,673
Total assets 14,123 13,374
LIABILITIES
Current liabilities
Trade and other payables 7 683 676
Interest bearing liabilities 7 430 282
Other financial liabilities 7 6 1
Current tax payable 17 6
Provisions 390 408
Deferred income 3 4
Total current liabilities 1,529 1,377
Non-current liabilities
Trade and other payables 7 4 5
Interest bearing liabilities 7 612 631
Other financial liabilities 7 – 16
Deferred tax liabilities 511 501 Provisions 1,455 1,410
Deferred income 11 12
Total non-current liabilities 2,593 2,575
Total liabilities 4,122 3,952
Net assets 10,001 9,422
EQUITY
Share capital 14,958 14,958
Treasury shares (10) (3)
Reserves (3,537) (3,555)
Retained earnings/(accumulated losses) (1,409) (1,977)
Total equity attributable to equity holders of South32 Limited 10,002 9,423
Non-controlling interests (1) (1)
Total equity 10,001 9,422
The accompanying notes form part of the half year financial statements.
For
per
sona
l use
onl
y

SOUTH32 33
CONSOLIDATED CASH FLOW STATEMENT
for the half year ended 31 December 2016
US$M
H1 FY17
H1 FY16
Operating activities
Profit/(loss) before tax from continuing operations 797 (1,632)
Adjustments for:
Non-cash significant items – 37
Depreciation and amortisation expense 373 401
Impairments of property, plant and equipment, financial assets, intangibles and equity accounted investments
4 1,384
Employee share awards expense 22 12
Net finance cost 60 45
Share of (profit)/loss of equity accounted investments (164) 356
Fair value (gains)/losses on derivative instruments (189) 36
Other non-cash or non-operating items (3) (2)
Changes in assets and liabilities:
Trade and other receivables (164) 162
Inventories (23) 119
Trade and other payables 24 (296)
Provisions and other liabilities (40) (196)
Cash generated from continuing operations 697 426
Interest received 17 12
Interest paid (34) (30)
Income tax (paid)/received (39) 37
Dividends received – 1
Dividends received from equity accounted investments 41 19
Net cash flows from continuing operating activities 682 465
Investing activities
Purchases of property, plant and equipment (150) (237)
Exploration expenditure (7) (7)
Exploration expenditure expensed and included in operating cash flows 6 5
Purchase of intangibles (1) (14)
Investment in financial assets (28) (80)
Investment in equity accounted investments (21) –
Cash outflows from investing activities (201) (333)
Proceeds from sale of property, plant and equipment and intangibles 15 1
Proceeds from financial assets 105 112
Net cash flows from continuing investing activities (81) (220)
Financing activities
Proceeds from interest bearing liabilities 147 2
Repayment of interest bearing liabilities (9) (190)
Purchase of shares by Employee Share Ownership Plan (ESOP) Trusts (12) –
Dividends paid (53) –
Net cash flows from continuing financing activities 73 (188)
Net increase/(decrease) in cash and cash equivalents 674 57
Cash and cash equivalents, net of overdrafts, at the beginning of the period 1,225 644
Foreign currency exchange rate changes on cash and cash equivalents 2 (8)
Cash and cash equivalents, net of overdrafts, at the end of the period 1,901 693
The accompanying notes form part of the half year financial statements.
For
per
sona
l use
onl
y

SOUTH32 34
CONSOLIDATED STATEMENT OF CHANGES IN EQUITY
for the half year ended 31 December 2016
Attributable to equity holders of South32 Limited
US$M Share capital
Treasury
shares Reserves
Retained
earnings/
(accumulated
losses) Total
Non-
controlling
interests Total equity
Balance as at 1 July 2016 14,958 (3) (3,555) (1,977) 9,423 (1) 9,422
Profit/(loss) for the period – – – 620 620 – 620
Other comprehensive income/(loss)
– – 1 1 2 – 2
Total comprehensive income/(loss)
– – 1 621 622 – 622
Transactions with owners:
Accrued employee entitlements for unexercised awards
– – 22 – 22 – 22
Dividends – – – (53) (53) – (53)
Purchase of shares by ESOP Trusts
– (12) – – (12) – (12)
Employee share awards exercised – 5 (5) – – – –
Balance as at 31 December 2016 14,958 (10) (3,537) (1,409) 10,002 (1) 10,001
Balance as at 1 July 2015 14,958 – (3,557) (365) 11,036 (1) 11,035
Profit/(loss) for the period – – – (1,749) (1,749) – (1,749)
Other comprehensive income/(loss)
– – – 5 5 – 5
Total comprehensive income/(loss)
– – – (1,744) (1,744) – (1,744)
Transactions with owners:
Accrued employee entitlements for unexercised awards
– – 12 – 12 – 12
Balance as at 31 December 2015 14,958 – (3,545) (2,109) 9,304 (1) 9,303
The accompanying notes form part of the half year financial statements.
For
per
sona
l use
onl
y

SOUTH32 35
NOTES TO FINANCIAL STATEMENTS
NOTES TO FINANCIAL STATEMENTS – BASIS OF PREPARATION
1. Reporting entity 36
2. Basis of preparation 36
NOTES TO FINANCIAL STATEMENTS – RESULTS FOR THE PERIOD
3. Segment information 37
4. Dividends 41
5. Earnings per share 41
NOTES TO FINANCIAL STATEMENTS – CAPITAL STRUCTURE AND FINANCING
6. Net finance cost 42
7. Financial assets and financial liabilities 42
NOTES TO FINANCIAL STATEMENTS – OTHER NOTES
8. Subsequent events 45
DIRECTORS’ DECLARATION 46
DIRECTORS’ REPORT 47
Lead Auditor’s Independence Declaration under Section 307C of the Corporations Act 2001 49
Independent Auditor’s Review Report 50
For
per
sona
l use
onl
y

SOUTH32 36
NOTES TO FINANCIAL STATEMENTS – BASIS OF PREPARATION
The consolidated financial statements of South32 Limited referred to as the “Company” and its subsidiaries and joint
arrangements (collectively, the “South32 Group”) for the half year ended 31 December 2016 were authorised for issue in
accordance with a resolution of the Directors on 16 February 2017.
1. Reporting entity
South32 Limited is a for-profit company limited by shares incorporated in Australia with a primary listing on the Australian
Securities Exchange, a standard listing on the London Stock Exchange and a secondary listing on the Johannesburg Stock
Exchange. The nature of the operations and principal activities of the South32 Group are described in note 3 Segment
information.
2. Basis of preparation
The half year financial statements are a general purpose condensed financial report which:
Have been prepared in accordance with AASB 134 Interim Financial Reporting, IAS 34 Interim Financial Reporting
and the Corporations Act 2001;
Have been prepared on a historical cost basis, except for derivative financial instruments and certain other financial
assets and liabilities which are required to be measured at fair value;
Are presented in US dollars, which is the functional currency of the majority of the Group’s operations, and all values
are rounded to the nearest million dollars (US$M or US$ million) unless otherwise stated, in accordance with Australian
Securities and Investments Commission (ASIC) Corporations (Rounding in Financial / Directors’ Reports) Instrument
2016/191;
Present reclassified comparative information where required for consistency with the current period’s presentation;
and
Have been prepared on the basis of accounting policies and methods of computation consistent with those applied in
the 30 June 2016 annual financial statements.
In preparing these half year financial statements, management has made judgements, estimates and assumptions that
affect the application of accounting policies and the reported amounts of assets and liabilities, income and expense. Actual
results may differ from these estimates. The significant judgements made by management in applying the Group’s
accounting policies and the key sources of estimation uncertainty were the same as those that applied to the consolidated
financial statements as at and for the year ended 30 June 2016.
For a full understanding of the financial performance and financial position of the South32 Group it is recommended that
the half year financial statements be read in conjunction with the annual financial statements for the year ended 30 June
2016. Consideration should also be given to any public announcements made by the Company during the half year ended
31 December 2016 in accordance with the continuous disclosure obligations of the ASX Listing Rules.
The following exchange rates relative to the US dollar have been applied in the financial statements.
Average for the
half year ended
31 December
2016
Average for the
half year ended
31 December
2015
As at
31 December
2016
As at
30 June
2016
As at
31 December
2015
Australian dollar(1) 0.75 0.72 0.72 0.74 0.73
Brazilian real 3.27 3.69 3.26 3.24 3.90
Colombian peso 2,983 2,999 3,001 2,916 3,149
South African rand 14.00 13.60 13.60 14.85 15.56
(1) Displayed as US$ to A$ based on common convention.
For
per
sona
l use
onl
y
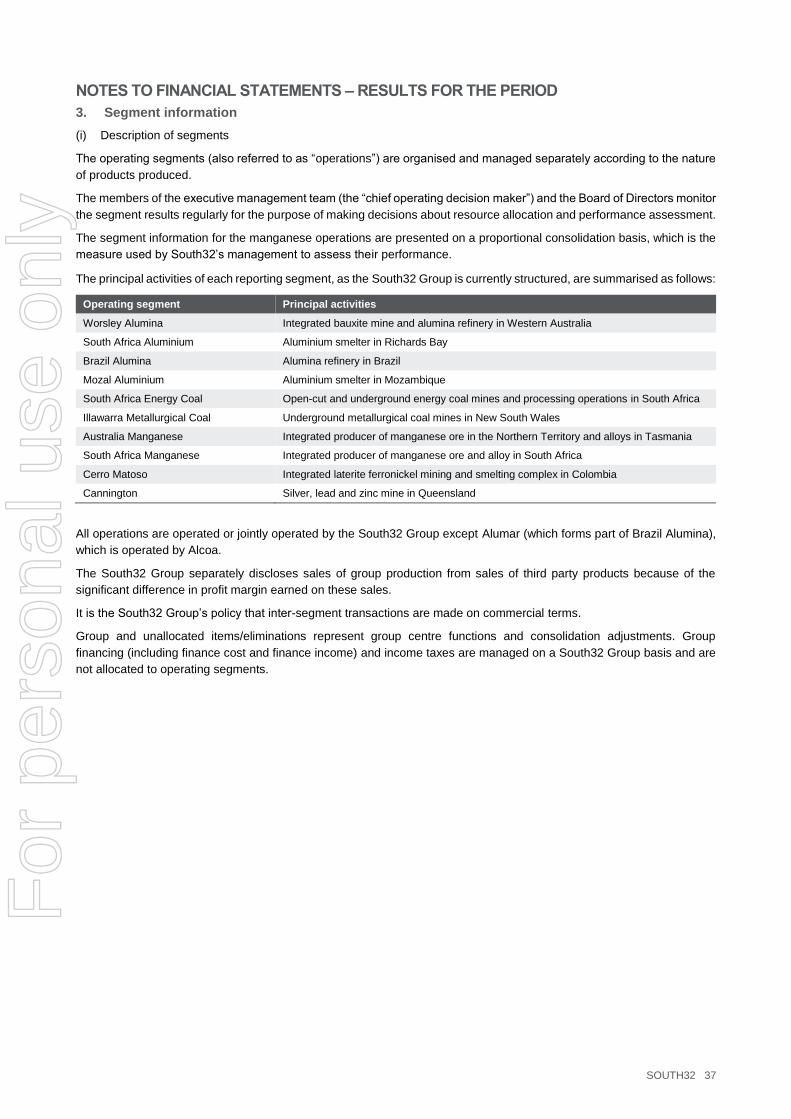
SOUTH32 37
NOTES TO FINANCIAL STATEMENTS – RESULTS FOR THE PERIOD
3. Segment information
(i) Description of segments
The operating segments (also referred to as “operations”) are organised and managed separately according to the nature
of products produced.
The members of the executive management team (the “chief operating decision maker”) and the Board of Directors monitor
the segment results regularly for the purpose of making decisions about resource allocation and performance assessment.
The segment information for the manganese operations are presented on a proportional consolidation basis, which is the
measure used by South32’s management to assess their performance.
The principal activities of each reporting segment, as the South32 Group is currently structured, are summarised as follows:
Operating segment Principal activities
Worsley Alumina Integrated bauxite mine and alumina refinery in Western Australia
South Africa Aluminium Aluminium smelter in Richards Bay
Brazil Alumina Alumina refinery in Brazil
Mozal Aluminium Aluminium smelter in Mozambique
South Africa Energy Coal Open-cut and underground energy coal mines and processing operations in South Africa
Illawarra Metallurgical Coal Underground metallurgical coal mines in New South Wales
Australia Manganese Integrated producer of manganese ore in the Northern Territory and alloys in Tasmania
South Africa Manganese Integrated producer of manganese ore and alloy in South Africa
Cerro Matoso Integrated laterite ferronickel mining and smelting complex in Colombia
Cannington Silver, lead and zinc mine in Queensland
All operations are operated or jointly operated by the South32 Group except Alumar (which forms part of Brazil Alumina),
which is operated by Alcoa.
The South32 Group separately discloses sales of group production from sales of third party products because of the
significant difference in profit margin earned on these sales.
It is the South32 Group’s policy that inter-segment transactions are made on commercial terms.
Group and unallocated items/eliminations represent group centre functions and consolidation adjustments. Group
financing (including finance cost and finance income) and income taxes are managed on a South32 Group basis and are
not allocated to operating segments.
For
per
sona
l use
onl
y

SOUTH32 38
NOTES TO FINANCIAL STATEMENTS – RESULTS FOR THE PERIOD
3. Segment information (continued)
Half year ended
31 December 2016
US$M
Worsley
Alumina
South
Africa
Aluminium
Mozal
Aluminium
Brazil
Alumina
South
Africa
Energy Coal
Illawarra
Metallurgical
Coal
Australia
Manganese(1)
South Africa
Manganese(1)
Cerro
Matoso Cannington
Group and
unallocated
items/
elimination
Statutory
adjustment(1) Group
Revenue
Group production 291 601 238 133 539 471 390 175 188 412 – (565) 2,873
Third party products(2) – – – – – – – – – – 349 (1) 348
Inter-segment revenue 201 – – 31 – – – – – – (232) – –
Total revenue 492 601 238 164 539 471 390 175 188 412 117 (566) 3,221
Underlying EBITDA 110 122 44 38 152 202 233 61 40 194 – (132) 1,064
Depreciation and amortisation (84) (32) (19) (28) (24) (93) (26) (15) (44) (29) (20) 41 (373)
Underlying EBIT 26 90 25 10 128 109 207 46 (4) 165 (20) (91) 691
Comprising:
Group Production 26 90 25 10 129 109 207 46 (4) 165 (31) (253) 519
Third party products(2) – – – – – – – – – – 11 – 11
Share of profit/(loss) of equity accounted investments(3)
– – – – (1) – – – – – – 162 161
Underlying EBIT 26 90 25 10 128 109 207 46 (4) 165 (20) (91) 691
Net finance cost (71)
Income tax (expense)/benefit (141)
Underlying earnings from continuing operations
479
Earnings adjustments(4) 141
Profit/(loss) after tax 620
Capital expenditure(5) 19 6 3 13 27 54 15 4 4 18 6 (19) 150
Equity accounted investments(6)
– – – – 12 – – – – – – 702 714
Total assets(6) 3,613 1,495 651 855 810 1,728 601 551 831 381 3,257 (650) 14,123
Total liabilities(6) 427 252 90 193 891 214 244 214 184 154 1,907 (648) 4,122
(1) The segment information reflects South32’s interest in the manganese operations and is presented on a proportional consolidation basis, which is the measure used by South32’s management to assess their performance. The manganese operations are equity accounted in the consolidated financial statements. The statutory adjustment column reconciles the proportional consolidation to the equity accounting position.
(2) Third party products sold comprise US$135 million for aluminium, US$56 million for alumina, US$73 million for coal, US$47 million for freight services and US$37 million for aluminium raw materials. Underlying EBIT on third party products comprise US$6 million for aluminium, (US$4) million for alumina, US$9 million for coal, nil for freight services and nil for aluminium raw materials.
(3) Share of profit/(loss) of equity accounted investments includes the impacts of earnings adjustments to Underlying EBIT.
(4) Refer to note 3(ii) Earnings adjustments.
(5) Capital expenditure excludes the purchase of intangibles and capitalised exploration expenditure.
(6) Total segment assets and liabilities for each operating segment represent operating assets and liabilities which predominately exclude the carrying amount of equity accounted investments, cash, interest bearing liabilities and tax balances.
For
per
sona
l use
onl
y

SOUTH32 39
NOTES TO FINANCIAL STATEMENTS – RESULTS FOR THE PERIOD
3. Segment information (continued)
Half year ended
31 December 2015
US$M
Worsley
Alumina
South
Africa
Aluminium
Mozal
Aluminium
Brazil
Alumina
South
Africa
Energy Coal
Illawarra
Metallurgical
Coal
Australia
Manganese(1)
South Africa
Manganese(1)
Cerro
Matoso Cannington
Group and
unallocated
items/
elimination
Statutory
adjustment(1) Group
Revenue
Group production 286 596 208 186 542 284 226 110 166 423 – (336) 2,691
Third party products(2) – – – – – – – – – – 291 (1) 290
Inter-segment revenue 254 – – – – – – 4 – – (254) (4) –
Total revenue 540 596 208 186 542 284 226 114 166 423 37 (341) 2,981
Underlying EBITDA 108 53 8 110 116 50 72 (28) (5) 181 (19) (104) 542
Depreciation and amortisation (75) (32) (18) (36) (70) (87) (62) (23) (43) (28) (12) 85 (401)
Underlying EBIT 33 21 (10) 74 46 (37) 10 (51) (48) 153 (31) (19) 141
Comprising:
Group Production 33 21 (10) 74 44 (37) 10 (51) (48) 153 (31) 41 199
Third party products(2) – – – – – – – – – – – – –
Share of profit/(loss) of equity accounted investments(3)
– – – – 2 – – – – – – (60) (58)
Underlying EBIT 33 21 (10) 74 46 (37) 10 (51) (48) 153 (31) (19) 141
Net finance cost (71)
Income tax (expense)/benefit (44)
Underlying earnings from continuing operations
26
Earnings adjustments(4) (1,775)
Profit/(loss) after tax (1,749)
Capital expenditure(5) 22 8 5 9 42 111 41 7 12 15 13 (48) 237
Equity accounted investments(6)
– – – – 13 – – – – – – 557 570
Total assets(6) 3,647 1,334 656 874 728 1,745 577 517 889 401 2,654 (648) 13,374
Total liabilities(6) 439 275 91 167 827 229 236 175 206 159 1,796 (648) 3,952
(1) The segment information reflects South32’s interest in the manganese operations and is presented on a proportional consolidation basis, which is the measure used by South32’s management to assess their performance. The manganese operations are equity accounted in the consolidated financial statements. The statutory adjustment column reconciles the proportional consolidation to the equity accounting position.
(2) Third party products sold comprise US$138 million for aluminium, US$11 million for alumina, US$28 million for coal, US$50 million for freight services and US$63 million for aluminium raw materials. Underlying EBIT on third party products comprise (US$1) million for aluminium, (US$1) million for alumina, US$1 million for coal, US$1 million for freight services and nil for aluminium raw materials.
(3) Share of profit/(loss) of equity accounted investments includes the impacts of earnings adjustments to Underlying EBIT.
(4) Refer to note 3(ii) Earnings adjustments.
(5) Capital expenditure excludes the purchase of intangibles and capitalised exploration expenditure.
(6) Total segment assets and liabilities for each reporting segment are as at 30 June 2016 and represent operating assets and liabilities which predominately exclude the carrying amount of equity accounted investments, cash, interest bearing liabilities and tax balances.
For
per
sona
l use
onl
y

SOUTH32 40
NOTES TO FINANCIAL STATEMENTS – RESULTS FOR THE PERIOD
3. Segment information (continued)
(ii) Earnings adjustments
The following table shows earnings adjustments in determining Underlying earnings:
US$M H1 FY17 H1 FY16
Adjustments to Underlying EBIT
Significant items – 92
Exchange rate (gains)/losses on restatement of monetary items(1) 20 (87)
Impairment losses(1)(2) 4 1,384
Fair value (gains)/losses on derivative instruments(1) (189) 36
Major corporate restructures(1) 2 5
Impairment losses included in profit/(loss) of equity accounted investments(3) – 287
Earnings adjustments included in profit/(loss) of equity accounted investments(3) (3) 11
Total adjustments to Underlying EBIT (166) 1,728
Adjustments to net finance cost
Exchange rate variations on net debt (11) (26)
Total adjustments to net finance cost (11) (26)
Adjustments to income tax expense
Significant items – 39
Tax effect of earnings adjustments to Underlying EBIT 45 (152)
Tax effect of earnings adjustments to net finance cost 4 8
Exchange rate variations on tax balances (13) 178
Total adjustments to income tax expense 36 73
Total earnings adjustments (141) 1,775
(1) Recognised in expenses excluding net finance cost in the consolidated income statement.
(2) In the half year ended 31 December 2015, the South32 Group recognised impairments as a result of significant and continuing weakening of commodity markets. For detailed disclosure of the impairments refer to the financial statements released for the period ending 31 December 2015.
(3) Recognised in share of profit/(loss) of equity accounted investments in the consolidated income statement.
For
per
sona
l use
onl
y

SOUTH32 41
NOTES TO FINANCIAL STATEMENTS – RESULTS FOR THE PERIOD
4. Dividends
US$M H1 FY17 H1 FY16
Final unfranked dividend(1) 53 –
Total dividends declared and paid during the period 53 –
(1) On 25 August 2016, the Directors resolved to pay an unfranked final dividend of US 1 cent per share in respect of the 2016 financial year. The dividend was paid on 6 October 2016.
5. Earnings per share
Basic earnings per share (EPS) amounts are calculated based on profit attributable to equity holders of South32 Limited
and the weighted average number of shares outstanding during the period.
Dilutive EPS amounts are calculated based on profit attributable to equity holders of South32 Limited and the weighted
average number of shares outstanding after adjustment for the effects of all dilutive potential shares.
The following reflects the profit/(loss) and share data used in the basic and diluted EPS computations:
Profit/(loss) attributable to equity holders
US$M H1 FY17 H1 FY16
Profit/(loss) attributable to equity holders of South32 Limited (basic) 620 (1,749)
Profit/(loss) attributable to equity holders of South32 Limited (diluted) 620 (1,749)
Weighted average number of shares
Million H1 FY17 H1 FY16
Basic earnings per share denominator(1) 5,319 5,324
Shares and options contingently issuable under employee share ownership plans(2)(3) 55 –
Diluted earnings per share denominator 5,374 5,324
(1) The basic EPS denominator is the aggregate of the weighted average number of shares after deduction of the weighted average number of Treasury shares outstanding during the period.
(2) Included in the calculation of diluted EPS are shares contingently issuable under employee share ownership plans.
(3) Diluted EPS calculation excludes 15,371,165 (31 December 2015: 78,949,327) rights which are considered anti-dilutive and are subject to service and performance conditions.
Earnings per share
US cents H1 FY17 H1 FY16
Earnings per share – continuing operations
Basic earnings per share 11.7 (32.9)
Diluted earnings per share 11.5 (32.9)
For
per
sona
l use
onl
y

SOUTH32 42
NOTES TO FINANCIAL STATEMENTS – CAPITAL STRUCTURE AND FINANCING
6. Net finance cost
US$M H1 FY17 H1 FY16
Finance expenses
Interest on borrowings 8 5
Finance lease interest 26 25
Discounting on provisions and other liabilities 48 49
Net interest expense on post-retirement employee benefits 5 4
Fair value change on financial asset 1 –
Exchange rate variations on net debt (11) (26)
77 57
Finance income
Interest income 17 12
Net finance cost 60 45
7. Financial assets and financial liabilities
The following table presents the South32 Group's financial assets and liabilities by class at their carrying amounts which
approximates their fair value:
31 December 2016 US$M
Loans and receivables
Available for
sale securities
Held at fair value through profit or loss
Other financial assets and
liabilities at amortised cost
Total
Financial assets
Cash and cash equivalents 1,901 – – – 1,901
Trade and other receivables(1) 663 – 47 – 710
Derivative contracts – – 206 – 206
Loans to equity accounted investments 266 – – – 266
Interest bearing loans receivable 43 – – – 43
Other investments – 261 – – 261
Total 2,873 261 253 – 3,387
Financial liabilities
Trade and other payables(2) – – 8 639 647
Derivative contracts – – 6 – 6
Finance leases – – – 581 581
Unsecured other – – – 461 461
Total – – 14 1,681 1,695
(1) Excludes input taxes of US$126 million included in trade and other receivables.
(2) Excludes input taxes of US$40 million included in trade and other payables.
For
per
sona
l use
onl
y

SOUTH32 43
NOTES TO FINANCIAL STATEMENTS – CAPITAL STRUCTURE AND FINANCING
7. Financial assets and financial liabilities (continued)
30 June 2016 US$M
Loans and receivables
Available for
sale securities
Held at fair
value through profit or loss
Other financial assets and
liabilities at amortised cost
Total
Financial assets
Cash and cash equivalents 1,225 – – – 1,225
Trade and other receivables(1) 493 – 58 – 551
Derivative contracts – – 33 – 33
Loans to equity accounted investments 352 – – – 352
Interest bearing loans receivable 41 – – – 41
Other investments – 259 – – 259
Total 2,111 259 91 – 2,461
Financial liabilities
Trade and other payables(2) – – 6 642 648
Derivative contracts – – 17 – 17
Finance leases – – – 602 602
Unsecured other – – – 311 311
Total – – 23 1,555 1,578
(1) Excludes input taxes of US$119 million included in trade and other receivables.
(2) Excludes input taxes of US$33 million included in trade and other payables.
Measurement of fair value
The following table shows the South32 Group’s financial assets and liabilities carried at fair value with reference to the
nature of valuation inputs used:
Level 1 – Valuation is based on unadjusted quoted prices in active markets for identical financial assets and liabilities.
Level 2 – Valuation is based on inputs (other than quoted prices included in Level 1) that are observable for the financial
asset or liability, either directly (i.e. as unquoted prices) or indirectly (i.e. derived from prices).
Level 3 – Valuation is based on inputs that are not based on observable market data.
31 December 2016 US$M
Level 1
Level 2
Level 3
Total
Financial assets and liabilities
Trade and other receivables – 47 – 47
Trade and other payables – (8) – (8)
Derivative contracts – (6) 206 200
Investments – available for sale – 126 135 261
Total – 159 341 500
For
per
sona
l use
onl
y

SOUTH32 44
NOTES TO FINANCIAL STATEMENTS – CAPITAL STRUCTURE AND FINANCING
7. Financial assets and financial liabilities (continued)
Level 3 financial assets and liabilities
The following table shows the movements in the South32 Group’s Level 3 financial assets and liabilities:
US$M H1 FY17 H1 FY16
As at the beginning of the period 161 296
Unrealised gains/(losses) recognised in the consolidated income statement(1) 189 (65)
Unrealised gains/(losses) recognised in consolidated other comprehensive income(2) (9) (16)
At the end of the period 341 215
(1) Unrealised gains and losses recognised in the consolidated income statement are recorded in expenses excluding net finance cost.
(2) Unrealised gains and losses recognised in consolidated other comprehensive income are recorded in the financial assets reserve.
Sensitivity analysis
The carrying amount of financial assets and liabilities that are valued using inputs other than observable market data are
calculated using valuation models, including discounted cash flow modelling, with significant inputs as listed below. The
potential effect of using reasonably possible alternative assumptions in these models, based on a change in the most
significant inputs by 10 per cent while holding all other variables constant, is shown in the following table.
31 December 2016 Profit before tax Equity
US$M
Carrying amount Significant inputs
10% increase in
input
10% decrease
in input
10% increase in
input
10% decrease
in input
Financial assets and liabilities
Derivative contracts(1) 206 Aluminium price(2)
Foreign exchange rate(2) Electricity price(3)
(187) 176 (135) 127
Investments – available for sale(1)(4)
135 Aluminium price(2)
Foreign exchange rate(2) – – 48 (52)
Total 341 (187) 176 (87) 75
(1) Sensitivity analysis is performed assuming all inputs are directionally moving unfavourably and favourably.
(2) Aluminium prices are comparable to market consensus forecast and foreign exchange rates are aligned with forward market rates.
(3) Electricity prices are determined as a market equivalent price based on inputs from published data.
(4) When a decrease in fair value recognised in equity reflects an impairment, such amounts are recognised in profit before tax.
For
per
sona
l use
onl
y

SOUTH32 45
NOTES TO FINANCIAL STATEMENTS – OTHER NOTES
8. Subsequent events
On 3 November 2016 the South32 Group announced that it had entered into a binding agreement to acquire the
Metropolitan Colliery and its associated 16.67% interest in the Port Kembla Coal Terminal from an Australian subsidiary
of Peabody Energy Corporation. The offer includes a cash consideration of US$200 million plus a contingent consideration
whereby both companies share commodity price upside in the first year of production or on a minimum of 1.3Mt, should
metallurgical coal prices exceed an agreed forward curve. The agreement is subject to approval by the Australian
Competition and Consumer Commission.
On 16 February 2017, the Directors resolved to pay an unfranked interim dividend of US 3.6 cents per share (US$192
million) in respect of the 2017 half year. The dividend will be paid on 6 April 2017. The dividend has not been provided for
in the half year financial statements and will be recognised in the financial statements for the 2017 financial year.
No other matters or circumstances have arisen since the end of the half year that have significantly affected, or may
significantly affect, the operations, results of operations or state of affairs of the South32 Group in subsequent accounting
periods.
For
per
sona
l use
onl
y

SOUTH32 46
DIRECTORS’ DECLARATION
In accordance with a resolution of the directors of South32 Limited, we state that:
In the opinion of the directors:
(a) The consolidated financial statements and notes that are set out on pages 29 to 45 for the half year ended
31 December 2016 are in accordance with the Corporations Act 2001, including:
(i) Giving a true and fair view of South32 Limited’s financial position as at 31 December 2016 and of its
performance for the half year ended on that date; and
(ii) Complying with Australian Accounting Standard AASB 134 Interim Financial Reporting and
Corporations Regulations 2001.
(b) There are reasonable grounds to believe that South32 Limited will be able to pay its debts as and when
they become due and payable.
Signed in accordance with a resolution of the Board of Directors.
David Crawford AO
Chairman
Graham Kerr
Chief Executive Officer and Managing Director
Dated 16 February 2017
For
per
sona
l use
onl
y
SOUTH32 47
DIRECTORS’ REPORT
The directors of South32 Limited present the consolidated financial report for the half year ended 31 December 2016 and
the auditor’s review report thereon.
Directors
The directors of the Company during or since the end of the half year are:
David Crawford AO
Graham Kerr
Frank Cooper AO
Peter Kukielski
Xolani Mkhwanazi
Ntombifuthi (Futhi) Mtoba
Wayne Osborn
Keith Rumble
The company secretaries of the Company during or since the end of the half year are:
Nicole Duncan
Melanie Williams (appointed 9 August 2016)
Review and results of operations
A review of the operations of the consolidated entity during the period and of the results of those operations is contained
on pages 3 to 28.
Principal risks and uncertainties
Due to the international scope of South32’s operations and the industries in which it is engaged there are a number of
risk factors and uncertainties which could have an effect on South32’s results and operations for the remaining six
months of the financial year.
Significant external, operational, sustainability and financial risks that could impact South32’s performance include:
Fluctuations in commodity prices, exchange rates, interest rates and global economy;
Actions by governments, political events or tax authorities;
Cost inflation and labour disputes could impact operating margins and expansion plans;
Access to water and power;
We may be subject to regulations in relation to dividend payments or capital returns;
Regulatory risks of climate change;
Risk to commodity portfolio from climate change;
Access to infrastructure;
Failure to maintain, realise or enhance existing reserves;
Support of the local communities in which businesses are located;
Health and safety impacts in respect of our activities;
Environmental risks in respect of activities including water and waste water management;
Deterioration in liquidity and cash flow;
Unexpected operational or natural catastrophes;
Commercial counterparties that we transact with may not meet their obligations;
Risks of fraud and corruption;
Breaches of information technology security processes; and
Failure to retain and attract employees.
Further information on these risks and how they are managed can be found on pages 37 to 42 of the Annual Report for
the year ended 30 June 2016, a copy of which is available on South32’s website at www.south32.net.
For
per
sona
l use
onl
y

SOUTH32 48
DIRECTORS’ REPORT
Events subsequent to the balance date
On 3 November 2016 the South32 Group announced that it had entered into a binding agreement to acquire the
Metropolitan Colliery and its associated 16.67% interest in the Port Kembla Coal Terminal from an Australian subsidiary
of Peabody Energy Corporation. The offer includes a cash consideration of US$200 million plus a contingent consideration
whereby both companies share commodity price upside in the first year of production or on a minimum of 1.3Mt, should
metallurgical coal prices exceed an agreed forward curve. The agreement is subject to approval by the Australian
Competition and Consumer Commission.
On 16 February 2017, the Directors resolved to pay an unfranked interim dividend of US 3.6 cents per share (US$192
million) in respect of the 2017 half year. The dividend will be paid on 6 April 2017. The dividend has not been provided for
in the half year financial statements and will be recognised in the financial statements for the 2017 financial year.
The Directors are not aware of any other matters or circumstance that have arisen since the end of the half year that have
significantly affected, or may significantly affect, the operations, the results of operations or state of affairs of the South32
Group in subsequent accounting periods.
UK responsibility statements
The Directors state that to the best of their knowledge:
The Financial Results and Outlook on pages 3 to 28, includes a fair review of important events during the first six
months of the current financial year and their impact on the half year financial statements, and a description of
the principal risks and uncertainties for the remaining six months of the year; and
That disclosure has been made for related party transactions that have taken place in the first six months of the
current financial year and that have materially affected the financial position or performance of the South32 Group
during that period, and any changes in the related party transactions described in the last annual report that could
have such a material effect.
Lead auditor’s independence declaration
A copy of the lead auditor’s independence declaration as required under Section 307C of the Corporations Act 2001 is set
out on page 49.
Rounding
The amounts shown in this report and in the financial statements have been rounded to the nearest million dollars (US$M
or US$ million) unless otherwise stated, in accordance with Australian Securities and Investments Commission (ASIC)
Corporations (Rounding in Financial / Directors’ Reports) Instrument 2016/191.
Signed in accordance with a resolution of the Board of Directors.
David Crawford AO
Chairman
Graham Kerr
Chief Executive Officer and Managing Director
Dated 16 February 2017
For
per
sona
l use
onl
y

SOUTH32 49
Lead Auditor’s Independence Declaration under Section 307C of the Corporations Act 2001
To: the directors of South32 Limited
I declare that, to the best of my knowledge and belief, in relation to the review for the half-year ended 31 December
2016 there have been:
(i) no contraventions of the auditor independence requirements as set out in the Corporations Act 2001
in relation to the review; and
(ii) no contraventions of any applicable code of professional conduct in relation to the review.
KPM_INI_01
PAR_S IG_01
PAR_NAM_01 PAR_POS_01 PAR_DAT_01 PAR_CIT_01
KPMG
Denise McComish
Partner
Perth
16 February 2017
KPMG, an Australian partnership and a member firm of the KPMG
network of independent member firms affiliated with KPMG International Cooperative (“KPMG International”), a Swiss entity.
Liability limited by a scheme approved under Profession Standards Legislation.
For
per
sona
l use
onl
y

SOUTH32 50
Independent Auditor’s Review Report
Independent Auditor’s Review Report
To the shareholders of South32 Limited
Conclusion
Based on our review, which is not an audit, we have
not become aware of any matter that makes us
believe that the Half-year Financial Statements of
South32 Limited is not in accordance with the
Corporations Act 2001, including:
i) giving a true and fair view of the Group’s
financial position as at 31 December 2016
and of its performance for the half-year ended
on that date; and
ii) complying with Australian Accounting
Standard AASB 134 Interim Financial
Reporting and the Corporations Regulations
2001.
We have reviewed the accompanying Half-year
Financial Statements of South32 Limited.
The Half-year Financial Statements comprises:
the consolidated balance sheet as at 31
December 2016
consolidated income statement and consolidated
statement of comprehensive income, consolidated
statement of changes in equity and consolidated
cash flow statement for the half-year ended on
that date
notes 1 to 8 comprising a summary of significant
accounting policies and other explanatory
information
the Directors’ Declaration.
The Group comprises South32 Limited (the
Company) and the entities it controlled at the half-
year’s end or from time to time during the half-year.
Responsibilities of the Directors for the Half-year Financial Statements
The Directors of the Company are responsible for:
the preparation of the Half-year Financial Statements that gives a true and fair view in accordance with
Australian Accounting Standards and the Corporations Act 2001; and
for such internal control as the Directors determine is necessary to enable the preparation of the Half-year
Financial Statements that is free from material misstatement, whether due to fraud or error.
KPMG, an Australian partnership and a member firm of the KPMG
network of independent member firms affiliated with KPMG
International Cooperative (“KPMG International”), a Swiss entity.
Liability limited by a scheme approved under
Profession Standards Legislation.
For
per
sona
l use
onl
y
SOUTH32 51
Auditor’s responsibility for the review of the Half-year Financial Statements
Our responsibility is to express a conclusion on the Half-year Financial Statements based on our review. We
conducted our review in accordance with Auditing Standard on Review Engagements ASRE 2410 Review of a
Financial Report Performed by the Independent Auditor of the Entity, in order to state whether, on the basis of
the procedures described, we have become aware of any matter that makes us believe that the Half-year
Financial Statements are not in accordance with the Corporations Act 2001 including: giving a true and fair view
of the Group’s financial position as at 31 December 2016 and its performance for the half-year ended on that
date; and complying with Australian Accounting Standard AASB 134 Interim Financial Reporting and the
Corporations Regulations 2001. As auditor of South32 Limited, ASRE 2410 requires that we comply with the
ethical requirements relevant to the audit of the annual financial report.
A review of half-year financial statements consists of making enquiries, primarily of persons responsible for
financial and accounting matters, and applying analytical and other review procedures. A review is substantially
less in scope than an audit conducted in accordance with Australian Auditing Standards and consequently does
not enable us to obtain assurance that we would become aware of all significant matters that might be identified
in an audit. Accordingly, we do not express an audit opinion.
Independence
In conducting our review, we have complied with the independence requirements of the Corporations Act 2001.
KPMG
Denise McComish
Partner
Perth
16 February 2017
For
per
sona
l use
onl
y

SOUTH32 52
DISCLAIMER
FORWARD LOOKING STATEMENTS
This release contains forward-looking statements, including statements about trends in commodity prices and currency
exchange rates; demand for commodities; production forecasts; plans, strategies and objectives of management; capital
costs and scheduling; operating costs; anticipated productive lives of projects, mines and facilities; and provisions and
contingent liabilities. These forward-looking statements reflect expectations at the date of this release, however they are
not guarantees or predictions of future performance. They involve known and unknown risks, uncertainties and other
factors, many of which are beyond our control, and which may cause actual results to differ materially from those expressed
in the statements contained in this release. Readers are cautioned not to put undue reliance on forward-looking statements.
Except as required by applicable laws or regulations, the South32 Group does not undertake to publicly update or review
any forward looking statements, whether as a result of new information or future events. Past performance cannot be relied
on as a guide to future performance.
NON-IFRS FINANCIAL INFORMATION
This release includes certain non-IFRS financial measures, including Underlying earnings, Underlying EBIT and Underlying
EBITDA, Underlying basic earnings per share, Underlying effective tax rate, Underlying EBIT margin, Underlying EBITDA
margin, Underlying return on capital, Free cash flow, net debt, net operating assets and ROIC. These measures are used
internally by management to assess the performance of our business, make decisions on the allocation of our resources
and assess operational management. Non-IFRS measures have not been subject to audit or review and should not be
considered as an indication of or alternative to an IFRS measure of profitability, financial performance or liquidity.
NO OFFER OF SECURITIES
Nothing in this release should be read or understood as an offer or recommendation to buy or sell South32 securities, or
be treated or relied upon as a recommendation or advice by South32.
NO FINANCIAL OR INVESTMENT ADVICE – SOUTH AFRICA
South32 does not provide any financial or investment 'advice' as that term is defined in the South African Financial
Advisory and Intermediary Services Act, 37 of 2002, and we strongly recommend that you seek professional advice.
For
per
sona
l use
onl
y

SOUTH32 53
FURTHER INFORMATION
INVESTOR RELATIONS
Alex Volante T +61 8 9324 9029 M +61 403 328 408 E [email protected]
Rob Ward T +61 8 9324 9340 M +61 431 596 831 E [email protected]
MEDIA RELATIONS
Diana Wearing Smith T +61 8 9324 9198 M +61 436 482 290 E [email protected]
James Clothier T +61 8 9324 9697 M +61 413 319 031 E [email protected]
Further information on South32 can be found at www.south32.net.
South32 Limited (ABN 84 093 732 597) Registered in Australia (Incorporated in Australia under the Corporations Act 2001) Registered Office: Level 35, 108 St Georges Terrace Perth Western Australia 6000 Australia ISIN: AU000000S320
JSE Sponsor: UBS South Africa (Pty) Ltd
16 February 2017
For
per
sona
l use
onl
y