Embed Size (px)
Citation preview

(ABN 64 142 809 970)
White Rock Minerals Ltd
and its controlled entities
31 December 2018
Consolidated interim financial report
For
per
sona
l use
onl
y

WHITE ROCK MINERALS LTD CONSOLIDATED INTERIM FINANCIAL REPORT
2 | P a g e
Corporate Directory
DIRECTORS
Peter Lester (Chairman) Matthew Gill (Managing Director and Chief Executive Officer) Jeremy Gray (Non‐Executive Director) Stephen Gorenstein (Non‐Executive Director)
COMPANY SECRETARY AND CHIEF FINANCIAL OFFICER
Shane Turner
PRINCIPAL & REGISTERED OFFICE
24 Skipton Street Ballarat Victoria 3350
CONTACT DETAILS
PO Box 195 Ballarat Victoria 3353 Tel: 03 5331 4644 Email: [email protected]
SHARE REGISTRARS
Security Transfer Registrars Pty Ltd 770 Canning Highway Applecross Western Australia 6153 Tel: 08 9315 2333
AUDITORS
KPMG Tower Two, Collins Square 727 Collins Street Melbourne Victoria 3000
BANKERS
ANZ Banking Group Limited 927 Sturt Street Ballarat Victoria 3350
LEGAL ADVISORS
Baker McKenzie 181 William Street Melbourne Victoria 3000 F
or p
erso
nal u
se o
nly
WHITE ROCK MINERALS LTD CONSOLIDATED INTERIM FINANCIAL REPORT
3 | P a g e
Contents
Page
Directors’ report 4
Consolidated interim statement of financial position 14
Consolidated interim statement of comprehensive income 15
Consolidated interim statement of changes in equity 16
Consolidated interim statement of cash flows 17
Condensed notes to the consolidated interim financial statements 18
Directors’ declaration 25
Independent auditor’s review report 26
Lead auditor’s independence declaration 28
For
per
sona
l use
onl
y

WHITE ROCK MINERALS LTD CONSOLIDATED INTERIM FINANCIAL REPORT
4 | P a g e
Directors’ report
The Directors present their report together with the consolidated interim financial statements of White Rock Minerals Ltd (“the Company” or “White Rock”) and its controlled entities (“the Group”) for the half‐year ended 31 December 2018 and the auditors review report thereon.
Directors
The Directors of the Company at any time during or since the end of the half‐year are:
Name Executive Director/Managing Director
Appointed/Resignation date
Matthew Gill
Appointed 1 August 2016
Non‐Executive Director/Chairman
Brian Phillips
Non‐Executive Director/Chairman
Appointed 26 March 2010
Resigned 31 December 2018
Peter Lester Appointed 12 April 2013
Non‐Executive Director
Chairman from 1 January 2019
Ian Smith
Non‐Executive Director
Jeremy Gray
Non‐Executive Director
Stephen Gorenstein
Appointed 3 February 2017
Resigned 28 February 2019
Appointed 5 May 2017
Appointed 17 December 2018
Principal activities
The consolidated interim statement of comprehensive income shows a loss after tax of $1,230,476 for the half‐year
ended 31 December 2018 (December 2017: loss $1,565,810). This result was after an impairment charge recognised on
exploration and evaluation assets of $421,701 (December 2017: $837,760). Refer to note 7 of the Consolidated Interim
Financial Report for further detail of the impairment assessment performed.
The Group has no bank debt. As at 31 December 2018 the Group had a cash position of $1,546,428 (June 2018:
$1,980,321).
Review of operations
White Rock Minerals Ltd is an Australian exploration and development company whose activities are focussed on gold,
silver and copper exploration and development in eastern Australia and zinc ‐ silver ‐lead – gold ‐ copper exploration in
Alaska, USA. The Company’s two projects are 100% owned – the globally significant Red Mountain zinc and precious
metals VMS project in Alaska and the Mt Carrington gold‐silver project located near Drake in northern New South Wales.
For
per
sona
l use
onl
y
WHITE ROCK MINERALS LTD CONSOLIDATED INTERIM FINANCIAL REPORT
5 | P a g e
Subsequent Events
Non‐Executive Director, Mr Ian Smith, resigned effective 28 February 2019.
Other than the events described, there has not arisen in the interval between the end of the reporting period and the date of this report any item, transaction or event of a material or unusual nature likely, in the opinion of the Directors of the Company, to affect significantly the operations of the Group, the results of those operations, or the state of affairs of the Group, in future periods.
Red Mountain Zinc‐Silver‐Lead‐Gold Project, Alaska, USA
Background
The Red Mountain Project is located in central Alaska (Figure 2), 100km south of Fairbanks, in the Bonnifield Mining District. The tenement package comprises 760 mining claims over a total area of 475km², covering the known Dry Creek and West Tundra Flats volcanogenic massive sulphide (“VMS”) deposits.
VMS deposits typically occur as a cluster of deposits (“camps”). Typically, deposits are evenly spaced within a camp. Within almost all camps, deposit sizes are normally distributed. In mature camps this means one “giant” (> 40Mt of ore, 1.8Mt of total base metal: upper 10% of all VMS deposits), two large (>10Mt ore, 550,000 tonnes of base metals: upper 25% of all deposits) and 3‐8 small (<3.3Mt ore, 150,000 tonnes of base metal, 50% of all deposits) deposits /occurrences. Typical VMS camps consist of 4‐8 deposits, each spaced about 4 to 6 km apart.
The Red Mountain Project includes the Fosters, Discovery (together referred to as Dry Creek) and West Tundra Flats (WTF) deposits (Figure 3). These are the most prominent occurrences in the Bonnifield District and can be considered a single VMS camp.
At the Dry Creek deposit, two horizons containing massive sulphide mineralisation have been found. The Dry Creek North Horizon occurs near the upper part of the Mystic Creek and hosts the majority of mineralisation defined to date. The Dry Creek South Horizon occurs lower in the section. Both zones dip steeply north. The Dry Creek North Horizon can be traced for 4,500 metres. The central 1,400 metres (on the flanks of Red Mountain) host the Fosters and Discovery deposits.
At Discovery, mineralisation occurs as massive to semi‐massive zinc‐lead‐silver rich sulphides within, and at the base of, an aphanitic, intensely quartz‐sericite‐pyrite altered, siliceous rock termed the “mottled meta‐rhyolite”. This mineralisation is commonly associated with overlying stringer and disseminated chalcopyrite‐pyrite mineralisation. At Fosters, mineralisation is hosted by a distinctive brown pyritic mudstone unit in the hangingwall of, and along strike from, the “mottled meta‐rhyolite”.
The mineralisation comprises disseminations and wispy laminations of sulphides and zones of semi‐massive to massive sulphides. Sulphides include pyrite, sphalerite, galena and chalcopyrite. Precious metals are typically enriched, especially in the footwall portion of the mineralization.
Mineralisation at Dry Creek pinches and swells along strike and down dip, as is typical of VMS deposits. True width intersections are up to 40 metres where there is evidence of growth faults, which typically act as feeders to the VMS system and can be important controls in localising thick mineralised accumulations. Identifying and targeting such growth faults along the VMS horizon will be an important part of exploration to expand and discover new deposits.
At the West Tundra Flats prospect the mineralized zone occurs at the base of a black chloritic schist unit that is at the base of the sedimentary Sheep Creek Member and at the very top of the metavolcanic Mystic Creek Member. Massive sulphide mineralisation is localised in a number of generally narrow exhalative units distinguished by semi‐massive and massive sulphides including pyrite, sphalerite and galena. The massive sulphides are commonly rich in silver with erratic gold. The zone extends at least 1,000 metres northwest‐southeast along strike and 1,600m down dip to the southwest. The horizon dips about 10° to the southwest, is 0.3 to 4.4 m thick and remains open down dip.
Previously, exploration on the Red Mountain project has comprised some 101 drill holes for 13,831m at Dry Creek and 26 drill holes for 5,349m at West Tundra Flats (ASX Announcement 15 February 2016).
Historical preliminary metallurgical test work on a composite sample of drill core intersections showed that the ore responded well to a traditional flotation scheme producing a bulk lead concentrate and a separate zinc concentrate with excellent metal recoveries. Zinc recoveries were in excess of 98% of the available zinc. Lead recoveries were
For
per
sona
l use
onl
y
WHITE ROCK MINERALS LTD CONSOLIDATED INTERIM FINANCIAL REPORT
6 | P a g e
approximately 75‐80% of the available lead. Silver, copper and gold reported to the lead concentrate. Recoveries of these metals were in the range of 70% to 80%.
The zinc concentrate produced was of very high quality with grades ranging from 58% to 62%. Lead‐copper concentrate produced by the test work contained approximately 33% lead, with dilution being primarily due to zinc. An evaluation of this concentrate indicated that the mineralogical makeup of the concentrate was simple, and reagent optimization should be capable of upgrading this concentrate to approximately 50% lead. Results from analysis of the zinc concentrate showed low selenium content at <0.01% and typical cadmium values at 0.15%.
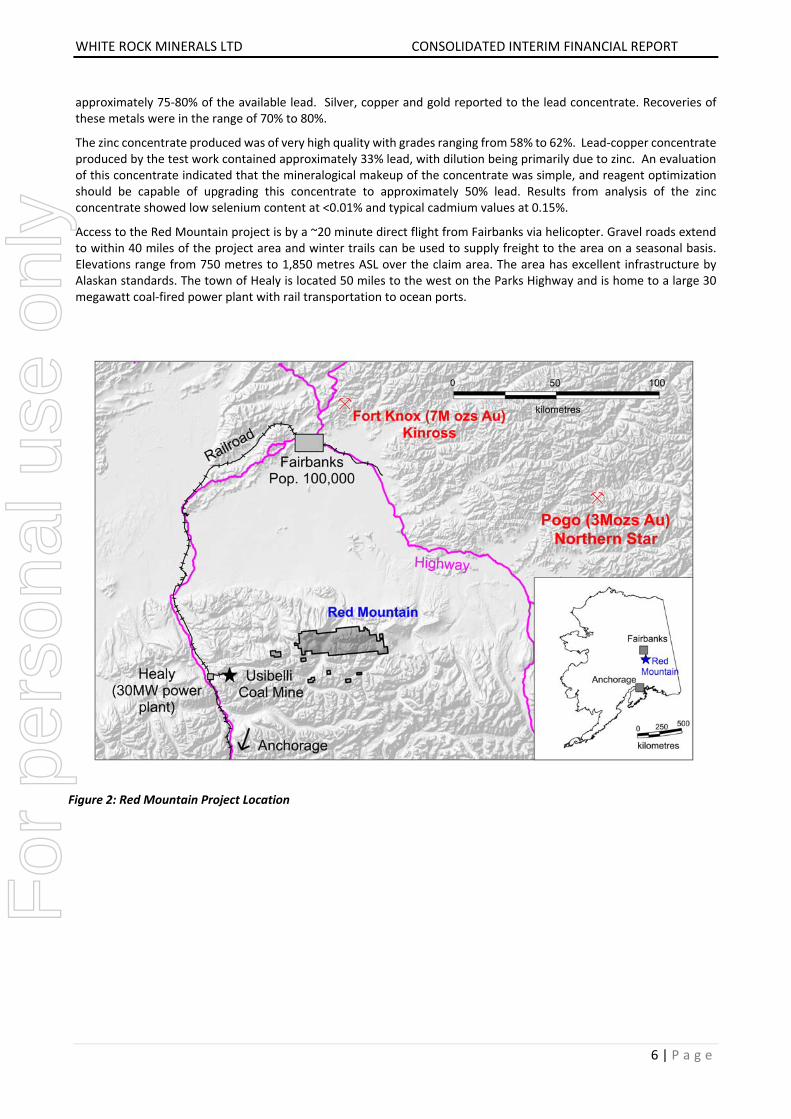
Access to the Red Mountain project is by a ~20 minute direct flight from Fairbanks via helicopter. Gravel roads extend to within 40 miles of the project area and winter trails can be used to supply freight to the area on a seasonal basis. Elevations range from 750 metres to 1,850 metres ASL over the claim area. The area has excellent infrastructure by Alaskan standards. The town of Healy is located 50 miles to the west on the Parks Highway and is home to a large 30 megawatt coal‐fired power plant with rail transportation to ocean ports.
Figure 2: Red Mountain Project Location
For
per
sona
l use
onl
y

WHITE ROCK MINERALS LTD CONSOLIDATED INTERIM FINANCIAL REPORT
7 | P a g e
Figure 3: Red Mountain project tenement outline with locations for the Dry Creek and West Tundra Flats VMS deposits,
the new Hunter VMS discovery and outlier VMS prospects explored historically.
Mineral Resources
In April 2017 the Company completed a maiden Mineral Resource estimate for the Red Mountain project (ASX Announcement 26 April 2017). Highlights of the Mineral Resource are:
High grade Inferred Mineral Resource of 9.1 million tonnes @ 12.9% ZnEq1 for 1.2Mt of contained zinc equivalent at a 3% Zn cut‐off.
Total Inferred Mineral Resource of 16.7 million tonnes @ 8.9% ZnEq for 1.5Mt of contained zinc equivalent at a 1% Zn cut‐off for Dry Creek, 3% Zn cut‐off for West Tundra Flats & 0.5% Cu cut‐off for Dry Creek Cu Zone.
Impressive base metal and precious metal content with 678,000t zinc, 286,000t lead, 53.5 million ounces silver and 352,000 ounces gold.
This Mineral Resource places the Red Mountain Project in the top quartile of undeveloped high‐grade VMS (zinc, silver, gold) deposits globally2.
Mineralisation commences at surface and is open down dip.
For
per
sona
l use
onl
y

WHITE ROCK MINERALS LTD CONSOLIDATED INTERIM FINANCIAL REPORT
8 | P a g e
Table 2 ‐ Red Mountain June 2018 Inferred Mineral Resource Estimate
Prospect Cut‐off Tonnage ZnEq1 Zn Pb Ag Cu Au ZnEq1 Zn Pb Ag Cu Au
Mt % % % g/t % g/t kt kt kt Moz kt koz
Dry Creek Main 1% Zn 9.7 5.3 2.7 1.0 41 0.2 0.4 514 262 98 12.7 15 123
West Tundra Flats 3% Zn 6.7 14.4 6.2 2.8 189 0.1 1.1 964 416 188 40.8 7 229
Dry Creek Cu Zone 0.5% Cu 0.3 3.5 0.2 0.04 4.4 1.4 0.1 10 0.5 0.1 0.04 4 1
Total 16.7 8.9 4.1 1.7 99 0.2 0.7 1,488 678 286 53.5 26 352
Table 3 ‐ Red Mountain June 2018 Inferred Mineral Resource Estimate at a 3% Zn Cut‐off (contained within Table 1, not additional)
Prospect Cut‐off Tonnage ZnEq1 Zn Pb Ag Cu Au ZnEq1 Zn Pb Ag Cu Au
Mt % % % g/t % g/t kt kt kt Moz kt koz
Dry Creek Main 3% Zn 2.4 8.7 4.7 1.9 69 0.2 0.4 211 115 46 5.3 5 32
West Tundra Flats 3% Zn 6.7 14.4 6.2 2.8 189 0.1 1.1 964 416 188 40.8 7 229
Total 9.1 12.9 5.8 2.6 157 0.1 0.9 1,176 531 234 46.1 12 260 1 ZnEq = Zinc equivalent grades are estimated using long‐term broker consensus estimates compiled by RFC Ambrian as at 20 March 2017 adjusted for recoveries from historical metallurgical testing work and calculated with the formula ZnEq =100 x [(Zn% x 2,206.7 x 0.9) + (Pb% x 1,922 x 0.75) + (Cu% x 6,274 x 0.70) + (Ag g/t x (19.68/31.1035) x 0.70) + (Au g/t x (1,227/31.1035) x 0.80)] / (2,206.7 x 0.9). White Rock is of the opinion that all elements included in the metal equivalent calculation have reasonable potential to be recovered and sold.
2 Source:‐ SNL, RFC Ambrian and company data.
Exploration
Red Mountain is a globally significant advanced exploration project centred on an established volcanogenic massive sulphide (“VMS”) district in Alaska where there are already two significant zinc‐silver‐lead‐gold‐copper deposits identified (Dry Creek and West Tundra Flats) providing White Rock with a Resource base of 16.7Mt at 8.9% ZnEq1 including a high‐grade component of 9.1Mt @ 12.9% ZnEq1.
During 2018 White Rock completed its first field season of on‐ground exploration with a number of successful milestones in advancing the project towards proving up that the Bonnifield Mining District can indeed be an emerging new VMS camp of significance, containing zinc, silver, lead and gold. Highlights of the 2018 field season included:
A total of 24 drill holes for 4,111 metres of diamond core drilling was completed during 2018.
Best drill intersection in the history of this project into the Discovery Lens at the Dry Creek deposit with 4.7m @ 19.5% Zn, 7.8% Pb, 466g/t Ag, 6.9g/t Au and 1.5% Cu for 49.7% ZnEq1 (DC18‐79)3.
Down dip extension of the Fosters Lens at the Dry Creek deposit with 4.3m @ 4.8% Zn, 2.3% Pb, 1,435g/t Ag, 2.2g/t Au and 0.5% Cu for 43.2% ZnEq1 (DC18‐77)3 and remaining open down dip.
Best drill intersection in the history of this project at the West Tundra deposit with 3.5m @ 15.1% Zn, 6.7% Pb, 518g/t Ag, 2.1g/t Au and 0.2% Cu for 35.2% ZnEq1 (WT18‐28)4.
Discovery and successful drill testing of the new Hunter prospect massive sulphide mineralisation with 1.4m @ 17.4% Zn, 3.9% Pb, 90g/t Ag & 1.6% Cu for 25.8% ZnEq1 from 48.2m (HR18‐01)5. This discovery remains open east and west and down dip with massive sulphide mapped for over 500 metres along strike on the surface.
Identification of 9 high priority geochemical anomalies6 from a detailed regional stream sediment program across the core area of regional prospectivity centred on the Bonnifield East syncline with particular emphasis on two distinct anomaly clusters; west of the known mineralisation at Dry Creek (the southern limb of the Bonnifield syncline) and in the Glacier Creek area with strong sulphide footwall alteration on the northern limb of the Bonnifield syncline. Strong base metal anomalism up to 1.1% zinc in streams indicates high prospectivity for outcropping massive sulphides.
Successful orientation ground geophysics across known mineralisation with CSAMT accurately identifying massive sulphide mineralisation at Dry Creek and West Tundra enabling the technique to be a rapid reconnaissance tool for identifying drill targets within zones of anomalous geochemistry and favourable stratigraphy7. The CSAMT crew acquired 40 line km of new data along strike of Dry Creek and West Tundra.
Successful application of portable XRF analysis of soil samples to deliver rapid target generation.
For
per
sona
l use
onl
y
WHITE ROCK MINERALS LTD CONSOLIDATED INTERIM FINANCIAL REPORT
9 | P a g e
The successful progress of the 2018 exploration program resulted in the signing of a cornerstone investment and strategic relationship agreement with Sandfire Resources NL (ASX:SFR) (Sandfire) that included an option to enter a Joint Venture Agreement regarding the Red Mountain Project. Sandfire contributed $2.5 million equity and a further $1 million convertible loan unsecured to White Rock during 2018.
Subsequently, at the end of 2018, Sandfire exercised its option to enter into a Joint Venture Agreement8 over the Red Mountain Project, which once signed, would see funds committed with Stage One of this JV being a minimum of A$20M spent on the project over the first four years. For Year One (the 2019 field season), the funding requirement would be a minimum of A$6M, with White Rock managing the project for at least the first year of the earn‐in. This is a great endorsement of White Rock’s view of the project’s quality and potential.
The results achieved from the successful 2018 exploration program also resulted in the expansion of the tenement package9 with an area of 475km² now secured over the Bonnifield Mining District and additional prospective footwall stratigraphy, plus a number of additional historic VMS mineral occurrences not yet explored with modern techniques.
3 Refer ASX Announcement 4th July 2018 “High Grade Zinc‐Silver Drill Intersections Extend Mineralisation at Red Mountain”.
4 Refer ASX Announcement 18th June 2018 “Initial Drilling Delivers High Grade Zinc Results at Red Mountain”.
5 Refer ASX Announcement 20th August 2018 “High Grade Zinc Discovery at the Hunter Prospect, Red Mountain”.
6 Refer ASX Announcement 4th December 2018 “New Geochemical Anomalies Associated with VMS Alteration, Red Mountain”.
7 Refer ASX Announcement 20th June 2018 “New Massive Sulphide Mineralisation Drill Intercepts Coincident with Geophysics Anomalies at Red Mountain”.1 Refer ASX Announcement 27th December 2018 “Sandfire Exercises Option to Enter Joint Venture on Red Mountain”.
8 Refer ASX Announcement 27th December 2018 “Sandfire Exercises Option to Enter Joint Venture on Red Mountain”.
9 Refer ASX Announcement 21st November 2018 “Expanded Land Holding with Additional High‐Grade VMS Prospects, Red Mountain”.
Mt Carrington Gold‐Silver Project, NSW, Australia
Background
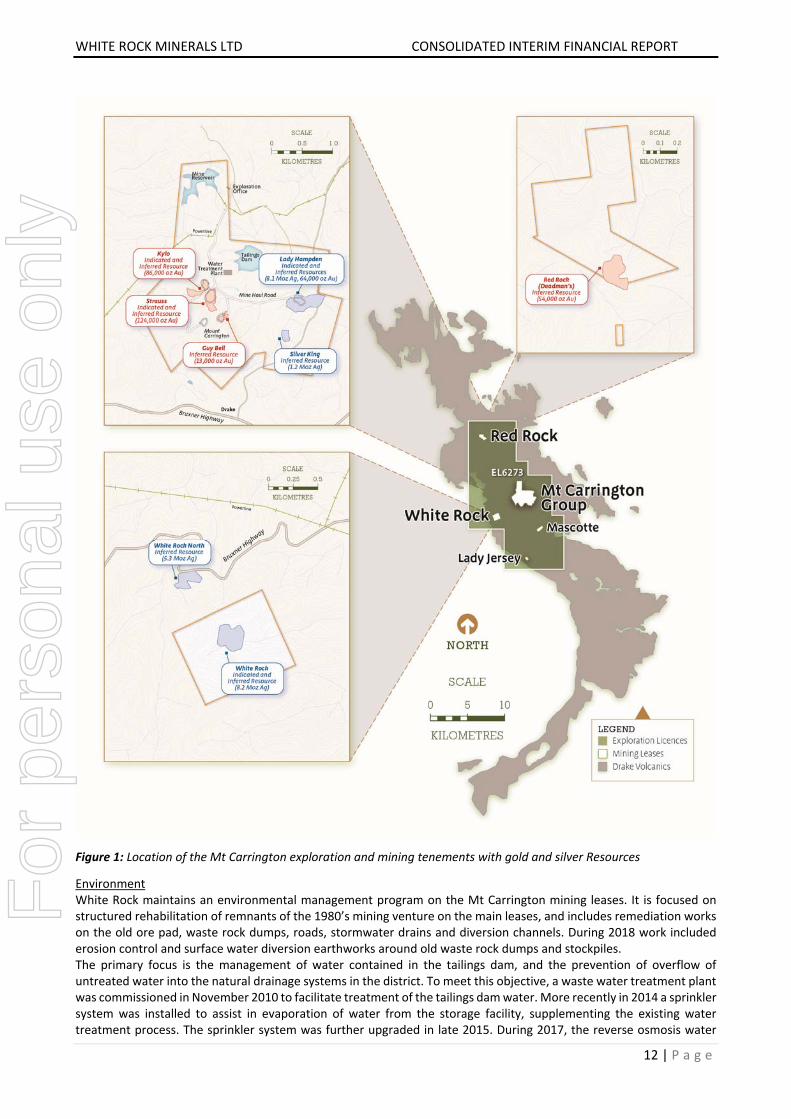
The Mt Carrington project is located near the township of Drake in northern NSW and comprises one Exploration Licence (“EL6273”) and 22 mining leases wholly contained within EL6273, covering a total area of 183km2 as at 31 December 2018 (Figure 1).
The project covers a significant portion of the Drake Volcanic belt with a strike length in excess of 60km. The belt has been subject to sporadic exploration since the 1960s for gold, silver, copper, zinc, lead, molybdenum, tin and tungsten. However, no systematic exploration using modern techniques was undertaken on EL6273 from 1994 until 2008. It is considered that potential within the EL6273 at Mt Carrington is very high for a variety of precious and base metal deposits.
The mining leases held by White Rock cover an area of 940 hectares and contain the historic Drake Au‐Ag‐Cu‐Zn mineral field. The field has seen intermittent exploration and small scale mining from the late 1800’s to the late 1980’s. However, the previous mining endeavours are considered to have only scratched the surface. Until White Rock’s involvement, no systematic evaluation of the current Mineral Resources on the mining leases had been undertaken for more than 16 years.
The mining leases were renewed in December 2010 for a period of ten years, providing security of tenure to underpin any future development.
The leases also contain significant infrastructure and assets which are owned by White Rock. These include a tailings dam, freshwater dam, waste water treatment plant, road network, high voltage power supply, and office and accommodation facilities.
Development Studies
The Company previously reported the key outcomes from the Company’s Pre‐Feasibility Study (PFS) into the development of the gold first stage of its 100% owned Mt Carrington gold and silver project, located in New South Wales
For
per
sona
l use
onl
y

WHITE ROCK MINERALS LTD CONSOLIDATED INTERIM FINANCIAL REPORT
10 | P a g e
(refer ASX Announcement “White Rock's Mt Carrington gold ‐ silver Project Pre‐Feasibility Study Stage One” dated 27 December 2017).
The outcomes confirmed the technical and financial viability of the initial project development and provide a very strong rationale to advance the project through a Definitive Feasibility Study (DFS) towards development.
Highlights:‐ Gold first, Silver later
Maiden Ore Reserve declared:‐ 3.47 million tonnes at 1.4g/t gold for 159,000 ounces gold,
When compared to the 2016 Scoping Study (refer ASX dated 20 October 2016):‐
Gold First Stage mine life has been extended from an initial 3 years to 4 ½ years,
The production rate increases 25% to 1,000,000 tpa,
Gold production increases 30% to 35,000 ounces per annum, and
Total gold produced increases 59% to 148,000 oz gold over this initial 4 ½ year Gold First Stage.
The Stage One Pre‐feasibility study (PFS) confirms Mt. Carrington as a viable gold first project (Gold First) with significant potential upside in subsequent silver production and future gold and silver exploration.
The PFS findings indicate a technically sound and financially viable project generating in excess of A$36 million undiscounted cashflow over the initial 4 ½ year Gold First mine plan, with a strong Internal Rate of Return (IRR) of 34%.
Initial development is to be based on the first three gold‐only production open pits and a conventional whole‐of‐ore leach process plant with an annual throughput of 1 million tonnes.
Maiden Ore Reserve of 3.47 million tonnes of material containing 159,000 oz gold, supporting a project producing at least 35,000 oz per year recovered gold for the proposed initial 4 ½ year operation.
Total forecast capital expenditure of A$35.7 million including a A$4 million contingency.
Estimated average all‐in sustaining cost (AISC) of A$1,236 per ounce over the initial 4 ½ year life of mine (LOM) with a payback of 22 months.
Highly prospective near‐mine exploration potential for both gold and silver, and additional “silver‐only” Indicated Mineral Resources are available for the second stage of the Project’s development (Stage Two).
Stage Two presents an attractive opportunity to potentially increase the scale and overall life of the mine with minimal capital outlay. Stage Two is currently the subject of continuing studies.
Directors have approved the Stage One PFS, with commencement of the Mt. Carrington Definitive Feasibility Study (DFS) to follow, subject to funding.
The compilation of the PFS included detailed economic analysis and further technical work building on previous studies which determined that the best “go‐forward” case was a gold first initial stage capitalising on the existing pre‐stripped gold pits, tailings dam and process water facilities with minimal capital expenditure to commence full rate production, based on a 1 mtpa process plant and 35,000 ounces of gold p.a. for the initial 4 ½ year mine plan.
The silver dominant Mineral Resource, containing some 8.3M ounces in the Indicated category (refer ASX announcements 13 February 2012 & 20 November 2013) is the subject of further mineralogy studies, metallurgical test work and concentrate sales discussions. Mining of these silver resources constitutes Stage Two of the Mt Carrington project.
The PFS confirms Mt Carrington as a viable and relatively fast start, modest capex and opex project that is technically sound and economically viable, generating over A$36 million in undiscounted cash‐flow over its initial stage 4 ½ year life. The forecast capital cost of A$35.7 million including a A$4 million contingency makes a modest capex start‐up gold project. With this in place, the Stage Two silver phase will benefit from the already installed processing plant and associated infrastructure paid for by the Gold First stage of the project. This will further extend the life of the mine and further enhance the Project’s financial metrics.
All technical analysis was done using a US$1,275/ounce gold price and a foreign exchange rate of AUD:USD 0.75.
As a key outcome from the PFS, WRM declared a maiden Ore Reserve in accordance with the JORC Code (2012) for the Mt Carrington Gold First project of 3.47 million tonnes of ore at a grade of 1.4 g/t gold containing 159,000 ounces of gold. Whilst this Stage One mine plan is small as a stand‐alone project, its economic returns and payback period are viable, with free cashflow in excess of A$36 million generated and a payback period of 22 months. Stage Two of the project will potentially increase the overall scale of the mine and project economics, with minimal capital requirements.
Based on the results of the PFS, the WRM Board has approved the commencement of the Definitive Feasibility Study (DFS), subject to funding.
For
per
sona
l use
onl
y

WHITE ROCK MINERALS LTD CONSOLIDATED INTERIM FINANCIAL REPORT
11 | P a g e
The PFS was compiled using a number of well‐credentialed, independent and reputable consultants and engineering companies across Australia along with White Rock Minerals’ personnel.
Mineral Resources
White Rock published an updated Mineral Resource estimate for the Mt Carrington project in October 2017 (refer ASX Announcement 9th October 2017). The Resource contains 341,000 oz gold and 23.2M oz silver in the Indicated and Inferred categories. The Mineral Resource is contained within 8 mineral deposits located on granted Mining Leases and Exploration Licences at Mt Carrington, as presented on Figure 1, and summarised in Table 1.
The Strauss and Kylo Mineral Resource was prepared and reported in accordance with the JORC Code (2012) at a 0.5g/t Au cut‐off
(refer ASX Announcement 9 October 2017). All material assumptions and technical parameters underpinning the estimates in the
relevant market announcement continue to apply and have not materially changed.
Gold dominant Mineral Resources have been estimated using a cut‐off of 0.5g/t Au except Red Rock, which uses a cut‐off of 0.7g/t
Au. All silver dominant Mineral Resources have been estimated using a cut‐off of 25g/t Ag. The Red Rock, Guy Bell, Lady Hampden,
White Rock, White Rock North and Silver King Mineral Resource was prepared and reported in accordance with the JORC Code (2004)
as per ASX Announcements by White Rock Minerals Ltd on 13 February 2012, 11 July 2013 and 20 November 2013, and the ASX
Announcement by Rex Minerals Ltd on 10 December 2008. The Resources figures have not been updated since to comply with the
JORC Code 2012 on the basis that the information has not materially changed since it was last reported.
Table 1: Mt Carrington Mineral Resource Summary
Resource Category Deposit Tonnes Gold grade (g/t) Gold ounces Silver grade (g/t) Silver ounces
Strauss 2,070,000 1.5 103,000 1.7 115,000
Kylo 2,010,000 1.3 85,000 1.4 92,000
Sub‐Total 4,080,000 1.4 188,000 1.6 207,000
Strauss 380,000 1.7 21,000 2.4 30,000
Kylo 30,000 1.1 1,000 1.5 2,000
Sub‐Total 410,000 1.7 22,000 2.3 31,000
MT CARRINGTON MINERAL RESOURCES
Gold Dominant
Indicated
Inferred
Resource Category Deposit Tonnes Gold grade (g/t) Gold ounces Silver grade (g/t) Silver ounces
Red Rock 1,630,000 1.0 54,000 3.5 182,000
Guy Bell 160,000 2.5 13,000 4.9 24,000
Sub‐Total 1,790,000 1.2 67,000 3.6 206,000
Resource Category Deposit Tonnes Gold grade (g/t) Gold ounces Silver grade (g/t) Silver ounces
Lady Hampden 1,840,000 0.6 37,000 69 4,056,000
White Rock 1,710,000 77 4,214,000
Sub‐Total 3,540,000 0.3 37,000 73 8,270,000
Lady Hampden 2,470,000 0.3 27,000 51 4,023,000
White Rock 2,660,000 47 3,978,000
White Rock North 3,180,000 52 5,314,000
Silver King 640,000 59 1,218,000
Sub‐Total 8,950,000 0.1 27,000 51 14,533,000
Silver Dominant
MT CARRINGTON MINERAL RESOURCES
Gold Dominant
Inferred
Indicated
Inferred
Category
Indicated
Inferred
Total
MT CARRINGTON COMBINED MINERAL RESOURCES
18,770,000 341,000 23,247,000
7,620,000 225,000 8,477,000
11,150,000 116,000 14,770,000
Tonnes Gold ounces Silver ouncesFor
per
sona
l use
onl
y
WHITE ROCK MINERALS LTD CONSOLIDATED INTERIM FINANCIAL REPORT
12 | P a g e
Figure 1: Location of the Mt Carrington exploration and mining tenements with gold and silver Resources
Environment White Rock maintains an environmental management program on the Mt Carrington mining leases. It is focused on structured rehabilitation of remnants of the 1980’s mining venture on the main leases, and includes remediation works on the old ore pad, waste rock dumps, roads, stormwater drains and diversion channels. During 2018 work included erosion control and surface water diversion earthworks around old waste rock dumps and stockpiles. The primary focus is the management of water contained in the tailings dam, and the prevention of overflow of untreated water into the natural drainage systems in the district. To meet this objective, a waste water treatment plant was commissioned in November 2010 to facilitate treatment of the tailings dam water. More recently in 2014 a sprinkler system was installed to assist in evaporation of water from the storage facility, supplementing the existing water treatment process. The sprinkler system was further upgraded in late 2015. During 2017, the reverse osmosis water
For
per
sona
l use
onl
y

WHITE ROCK MINERALS LTD CONSOLIDATED INTERIM FINANCIAL REPORT
13 | P a g e
treatment plant was re‐commissioned to complement the expanded water sprinkler system and thus provide a more reliable water management and discharge system.
When required, the treatment plant allows for release of the treated water into the local drainage system at a rate of 500,000 litres per day. The water quality is monitored and independently analysed off site. Treated water is of significantly better quality than the benchmark determined by the Australian and New Zealand Environment Conservation Council. Compliance water sampling is undertaken on a monthly basis for 21 catchment sites in the Drake district.
White Rock Minerals Ltd Tenement schedule as at 31 December 2018
Country/State Project Tenement ID Area
Australia/NSW Mt Carrington EL6273, MPL24, MPL256, MPL259, SL409, SL471, SL492, ML1147,
ML1148, ML1149, ML1150, ML1200, MPL1345, ML5444, GL5477,
GL5478, ML5883, ML6004, ML6006, ML6242, ML6291, ML6295,
ML6335
183km²
USA/Alaska Red Mountain ADL611355, ADL611356, ADL611362, ADL611364, ADL611366,
ADL611371, ADL621625‐621738 (114), ADL623325‐623330 (6),
ADL623337‐623342 (6), ADL624104‐624627 (524), ADL721002‐
721010 (9), ADL721029‐721038 (10), ADL721533‐721615 (83),
ADL721624, ADL721625
475km²
Table 4: Mt Carrington Tenement and Red Mountain Schedule
The Mt Carrington Project comprises 22 Mining Leases and one Exploration Licence. All tenements are held 100% by White Rock (MTC) Pty Ltd, a wholly owned subsidiary of White Rock Minerals Ltd. No farm‐in or farm‐out agreements are applicable.
The Red Mountain Project comprises 760 Mining Claims. All tenements are held 100% by White Rock (RM) Inc., a wholly owned subsidiary of White Rock Minerals Ltd. No farm‐in or farm‐out agreements are applicable. The Red Mountain Project is subject to an Option for Earn‐in and Joint Venture Agreement with Sandfire Resources NL (refer ASX Announcement 10th July 2018).
Corporate
As at 31 December 2018 the Company had 1,636,457,861 shares on issue and 570,602,353 options. No New Information or Data This announcement contains references to exploration results, Mineral Resource estimates, Ore Reserve estimates, production targets and forecast financial information derived from the production targets, all of which have been cross‐referenced to previous market announcements by the Company. The Company confirms that it is not aware of any new information or data that materially affects the information included in the relevant market announcements. In the case of Mineral Resource estimates, Ore Reserve estimates, production targets and forecast financial information derived from the production targets, all material assumptions and technical parameters underpinning the estimates, production targets and forecast financial information derived from the production targets contained in the relevant market announcement continue to apply and have not materially changed.
Lead Auditor’s Independence Declaration
The lead auditor’s independence declaration is set out on page 28 and forms part of the Directors’ Report for the half‐year ended 31 December 2018.
Signed in accordance with a resolution of the Directors:
Peter Lester
Chairman
Dated at Melbourne this 14th day of March 2019
For
per
sona
l use
onl
y

WHITE ROCK MINERALS LTD CONSOLIDATED INTERIM FINANCIAL REPORT
14 | P a g e
Consolidated interim statement of financial position
As at 31 December 2018
31 Dec 2018 30 June 2018
Note $ $
Current assets Cash and cash equivalents 1,546,428 1,980,321 Trade and other receivables 993,861 1,008,409 Prepayments 137,148 171,915
Total current assets 2,677,437 3,160,645
Non‐current assets Exploration and evaluation assets 7 17,864,843 15,501,192 Property, plant and equipment 389,227 383,902
Total non‐current assets 18,254,070 15,885,094
Total assets 20,931,507 19,045,739
Current liabilities Trade and other payables 7(ii) 553,735 1,472,234 Employee benefits 34,943 32,568
Total current liabilities 588,678 1,504,802
Non‐current liabilities Trade and other payables 7(ii) 741,419 956,129 Employee benefits 16,431 15,219 Provision for rehabilitation 1,181,000 978,000
Total non‐current liabilities 1,938,850 1,949,348
Total liabilities 2,527,528 3,454,150
Net assets 18,403,979 15,591,589
Equity Issued capital 8(i) 48,426,035 44,799,836 Reserves 8(iii) 824,783 408,116 Accumulated losses (30,846,839) (29,616,363)
Total equity 18,403,979 15,591,589
The condensed notes on pages 18 to 24 are an integral part of these consolidated interim financial statements.
For
per
sona
l use
onl
y

WHITE ROCK MINERALS LTD CONSOLIDATED INTERIM FINANCIAL REPORT
15 | P a g e
Consolidated interim statement of comprehensive income
For the six months ended 31 December 2018
6 months to
31 Dec 2018
6 months to
31 Dec 2017
Note $ $
Net financing income 6 8,060 42,194
Other income 6 267,616 ‐
Administrative expenses (388,823) (297,463)
Depreciation expense (1,126) (526)
Contract labour expenses (416,646) (338,736)
Employee benefits expense (74,219) (75,635)
Impairment of assets 7(i) (421,701) (837,760)
Marketing expenses (153,996) (116,201)
Foreign exchange (loss)/gain (49,641) 58,317
(Loss) before income tax (1,230,476) (1,565,810)
Income tax benefit ‐ ‐
Net (loss) for the period after tax (1,230,476) (1,565,810)
Total comprehensive (loss) attributable to members of
White Rock Minerals Ltd
(1,230,476)
(1,565,810)
(Loss) per share attributable to ordinary equity holders
Basic loss per share (cents) (0.08) (0.18)
Diluted loss per share (cents) (0.08) (0.18)
The condensed notes on pages 18 to 24 are an integral part of these consolidated interim financial statements.
For
per
sona
l use
onl
y

WHITE ROCK MINERALS LTD CONSOLIDATED INTERIM FINANCIAL REPORT
16 | P a g e
Consolidated interim statement of changes in equity
For the six months ended 31 December 2018
Share Capital
$
Reserves
$
Accumulated
Losses
$
Total Equity
$
Balance at 1 July 2018 44,799,836 408,116 (29,616,363) 15,591,589
Issue of ordinary shares 3,797,194 416,667 ‐ 4,213,861
Transaction costs on share issue, net of tax (170,995) ‐ ‐ (170,995)
Total comprehensive loss for the period ‐ ‐ (1,230,476) (1,230,476)
Balance at 31 December 2018 48,426,035 824,783 (30,846,839) 18,403,979
Balance at 1 July 2017 41,552,890 306,443 (26,936,266) 14,923,067
Issue of ordinary shares 101,200 ‐ ‐ 101,200
Transaction costs on share issue, net of tax (5,790) ‐ ‐ (5,790)
Share based payments transactions ‐ 134,500 ‐ 134,500
Total comprehensive loss for the period ‐ ‐ (1,565,810) (1,565,810)
Balance at 31 December 2017 41,648,300 440,943 (28,502,076) 13,587,167
The condensed notes on pages 18 to 24 are an integral part of these consolidated interim financial statements.
For
per
sona
l use
onl
y
WHITE ROCK MINERALS LTD CONSOLIDATED INTERIM FINANCIAL REPORT
17 | P a g e
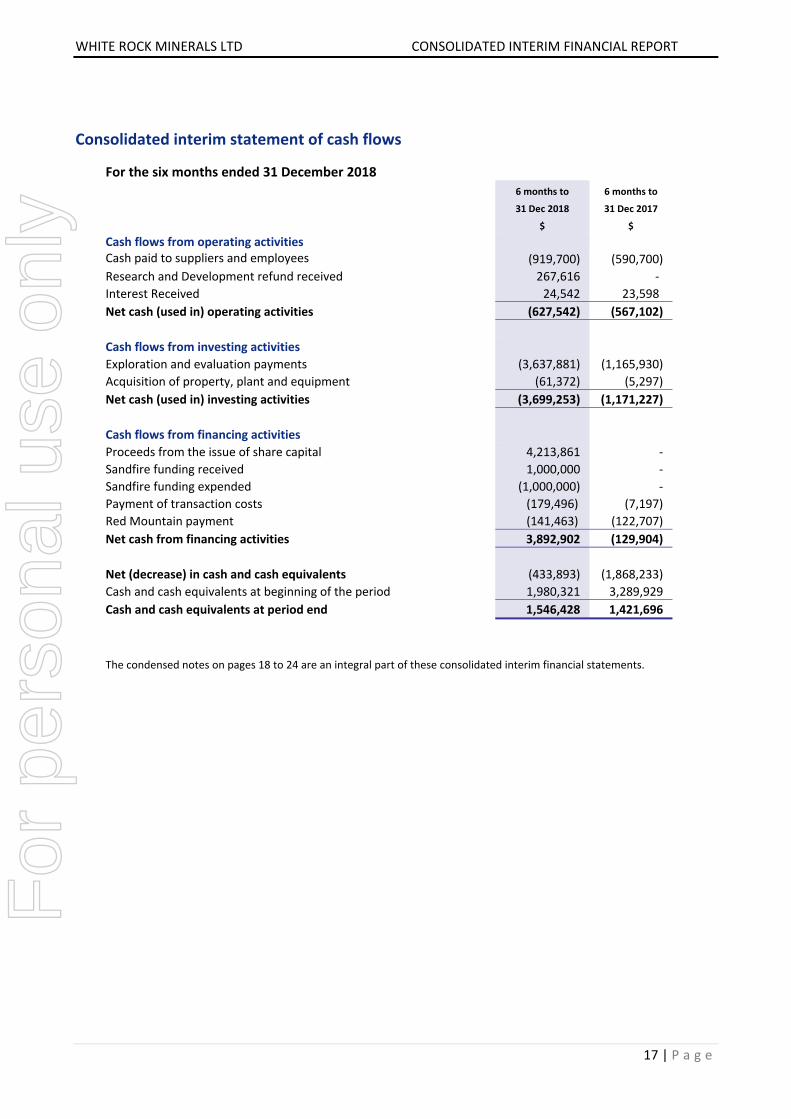
Consolidated interim statement of cash flows
For the six months ended 31 December 2018
6 months to
31 Dec 2018
6 months to
31 Dec 2017
$ $
Cash flows from operating activities
Cash paid to suppliers and employees (919,700) (590,700)
Research and Development refund received 267,616 ‐
Interest Received 24,542 23,598
Net cash (used in) operating activities (627,542) (567,102)
Cash flows from investing activities
Exploration and evaluation payments (3,637,881) (1,165,930)
Acquisition of property, plant and equipment (61,372) (5,297)
Net cash (used in) investing activities (3,699,253) (1,171,227)
Cash flows from financing activities
Proceeds from the issue of share capital 4,213,861 ‐
Sandfire funding received 1,000,000 ‐
Sandfire funding expended (1,000,000) ‐
Payment of transaction costs (179,496) (7,197)
Red Mountain payment (141,463) (122,707)
Net cash from financing activities 3,892,902 (129,904)
Net (decrease) in cash and cash equivalents (433,893) (1,868,233)
Cash and cash equivalents at beginning of the period 1,980,321 3,289,929
Cash and cash equivalents at period end 1,546,428 1,421,696
The condensed notes on pages 18 to 24 are an integral part of these consolidated interim financial statements.
For
per
sona
l use
onl
y

WHITE ROCK MINERALS LTD CONSOLIDATED INTERIM FINANCIAL REPORT
18 | P a g e
Condensed notes to the consolidated interim financial statements
For the period ended 31 December 2018 1 Reporting entity
White Rock Minerals Ltd (the “Company”) is a Company domiciled in Australia. The address of the Company’s registered office is 24 Skipton Street, Ballarat, Victoria, 3350. The consolidated interim financial statements of the Company as at and for the six months period ended 31 December 2018 comprise the Company and its controlled entities (together referred to as the “Group”). The Group is a profit orientated entity and is primarily involved in minerals exploration, evaluation and development in NSW, Australia and Alaska, USA. The consolidated annual financial statements of the Group as at and for the year ended 30 June 2018 are available upon request from the Company’s registered office or at www.whiterockminerals.com.au.
2 Statement of compliance
The consolidated interim financial statements have been prepared in accordance with AASB 134 Interim Financial Reporting and the Corporations Act 2001. Selected explanatory notes are included to explain events and transactions that are significant to an understanding of the changes in financial position and performance of the Group since the last annual consolidated financial statements as at and for the year ended 30 June 2018. The consolidated interim financial statements do not include all of the information required for full annual financial statements and should be read in conjunction with the consolidated annual financial statements of the Group as at and for the year ended 30 June 2018. These consolidated interim financial statements were approved by the Board of Directors on 14th March 2019. 3 Significant accounting policies
(i) Going Concern
The Group recorded a loss after tax of $1,230,476, and cash outflows of $433,893 net of cash raised via equity funding for the interim period ended 31 December 2018. The Group’s financial position as at 31 December 2018 was as follows:
The Group had available cash reserves of $1,546,428;
The Group’s current assets (excluding restricted cash of $856,000 and rehabilitation security bonds of $122,000) exceed current liabilities of $588,678 by $1,110,759;
The Group is required to make future payments as described in note 7(ii). The liabilities are payable in United States Dollars and expose the Group to movements in the United States Dollar against the Australian Dollar;
The Group’s main activity is exploration and as such it does not presently have a source of operating income, rather it is reliant on equity raisings or funds from other external sources to fund its activities;
Under the Cartesian Financing Package the Group may access, subject to conditions precedent, additional funding as set out in note 9;
The Group also has the Equity Placement Facility which may provide up to $7,200,000 of funding via placements of fully paid ordinary shares. Refer to Note 9 for further details; and
As described in Note 7(iii) the Group is entitled to earn a management fee of 10% of expenditure undertaken on behalf of Sandfire during 2019 under the Red Mountain earn in agreement.
Current forecasts indicate that cash on hand as at 31 December 2018 will not be sufficient to fully fund the planned exploration, studies and operational activities at Red Mountain and Mount Carrington, settle the applicable obligations referred to in Note 7(ii), maintain the Group’s tenements in good standing and meet minimum operational and expenditure commitments during the next twelve months. Accordingly, the Group will be required to secure additional funding to support planned activities.
For
per
sona
l use
onl
y

WHITE ROCK MINERALS LTD CONSOLIDATED INTERIM FINANCIAL REPORT
19 | P a g e
The Group’s position as at 28 February 2019 was as follows:
The Group had available cash and cash equivalents of $1,203,843;
The Group has trade and other payables of $528,771; and
There have been no material changes to the Group’s assets or liabilities or non‐cancellable commitments since 31 December 2018.
The Group has not secured any additional funding since 31 December 2018.
The Directors are confident that the Group will secure sufficient funds, or by way of other means, ensure that the Group can meet essential operational and expenditure commitments for at least the next twelve months including maintaining the Group’s tenements in good standing and paying its debts, as and when they are fall due. Accordingly, the interim financial statements for the six months ended 31 December 2018 have been prepared on a going concern basis, as in the opinion of the Directors, the Group will be in a position to continue to meet its essential operating costs and pay its debts as and when they fall due for at least twelve months from the date of this report. However, the Directors recognise that if further funding is not subsequently secured, the outcome of which is uncertain until funding is secured, there is a material uncertainty as to whether the going concern basis of accounting is appropriate. As a result, the Group may be required to relinquish title to certain tenements, significantly curtail further expenditures and may have to realise assets and extinguish its liabilities other than in the ordinary course of business and at amounts different from those stated in the interim financial statements. (ii) Changes in accounting policies
The accounting policies applied in these interim financial statements are the same as those applied in the Group’s consolidated financial statements as at and for the year ended 30 June 2018. The Group has adopted all mandatory new standards and amendments to other standards, with a date of initial application of 1 July 2018. The revised, amended and new standards or interpretations (AASB 15 Revenue from contracts with customers and AASB 9 Financial instruments) did not have a material impact on the amounts or disclosures in the consolidated interim financial statements. 4 Use of estimates and judgement
The preparation of the consolidated interim financial statements requires management to make judgements, estimates and assumptions that affect the application of accounting policies and the reported amounts of assets and liabilities, income and expenses. Actual results may differ from these estimates. In preparing these consolidated interim financial statements, the significant judgements made by management in applying the Group’s accounting policies and the key sources of estimation uncertainty were the same as those applied to the consolidated financial statements as at and for the year ended 30 June 2018. 5 Segment reporting
The Group consists of two operating segments and operates in two geographic locations, Mt Carrington, New South Wales, Australia and Red Mountain, Bonnifield, Alaska, United States of America. Note 7 contains details of exploration expenditure capitalised on each operating segment. With the exception of the impairment written down of capitalised exploration during the period of $421,701 which was attributable to the Mt Carrington segment (refer to note 7), foreign exchange loss of $49,641, and reassessment of discount rate loss of $16,529 for the Red Mountain project, no income or expense were incurred by the operating segments. All other income and expenses incurred by the Group relate to corporate activities and are therefore unallocated to the operating segments. 6 Other income
Other income includes a research and development refund of $267,616 (31 December 2017: nil) in relation to the Definitive Feasibility Study at Mount Carrington.
For
per
sona
l use
onl
y

WHITE ROCK MINERALS LTD CONSOLIDATED INTERIM FINANCIAL REPORT
20 | P a g e
7 Exploration and evaluation assets
Exploration and evaluation assets carried forward in respect of minerals exploration areas of interest:
6 months to
31 Dec 2018
6 months to
30 Jun 2018
Mount Carrington: $ $
Opening balance 9,631,098 9,568,584 Additions 444,350 151,551 Impairment charged to the income statement (i) (421,701) (89,037)
Closing balance 9,653,747 9,631,098
6 months to
31 Dec 2018
6 months to
30 Jun 2018
Red Mountain: $ $
Opening balance 5,870,094 4,307,547 Expenditure 2,341,002 2,569,956 Application of expenditure against future payment obligations ‐ (1,007,409)
Closing balance (ii) (iii) 8,211,096 5,870,094
31 Dec 2018 30 Jun 2018
Combined: $ $
Mount Carrington 9,653,747 9,631,098 Red Mountain 8,211,096 5,870,094
Closing balance 17,864,843 15,501,192
Recoverability of the carrying amount of exploration and evaluation assets is dependent on the successful development and commercial exploitation or sale of the respective area of interest.
(i) The Group capitalises exploration and evaluation expenditure in accordance with its accounting policy. During the year ended 30 June 2018, the Group became aware of facts and circumstances that indicated the carrying value of Property Plant and Equipment and capitalised exploration and evaluation could exceed the recoverable amount of the Mount Carrington Cash Generating Unit (CGU) and accordingly performed an impairment assessment resulting in a write down.
At 31 December 2018 the Group re‐assessed the value of the Mount Carrington CGU. Pursuant to the assessment there had been no change in the recoverable amount of Mount Carrington. Accordingly, exploration and evaluation expenditure capitalised for the period was recognised as an impairment expense in the income statement to the extent that the amounts capitalised caused the carrying value to exceed the CGU’s recoverable amount.
The impairment assessment was performed on the basis of similar methodology and assumptions used by the Group at 30 June 2018.
The valuation includes a number of significant assumptions including commodity prices, foreign exchange rates, the confidence level of known mineralisation measured in accordance with the JORC code, and expectations regarding exploration potential which can change significantly over short periods of time, and which may have a significant impact on the valuation if there was a change in assumption or new information became available. As a result, any variation in the key assumptions used to determine the recoverable amount would result in a change of the assessed recoverable amount. If the variation in assumption had a negative impact on the recoverable amount, it could in the absence of other factors indicate a requirement for additional impairment of non‐current assets.
For a full discussion of the methodology and assumptions used for the purposes of the impairment assessment, refer to the Group’s Annual Report for the year ended 30 June 2018.
For
per
sona
l use
onl
y

WHITE ROCK MINERALS LTD CONSOLIDATED INTERIM FINANCIAL REPORT
21 | P a g e
(ii) In May 2016, the Group acquired the Red Mountain tenements paying $US40,000 and agreeing to make the following payments.
US $50,000 in each of the years ended 31 December 2016 and 2017
US $100,000 in the year ended 31 December 2018
US $200,000 in the year ending 31 December 2019
US $550,000 in the year ending 31 December 2020
In addition, the Group was required to undertake exploration activities totalling US $1,200,000 as follows:
US $100,000 in the year ended 31 December 2016
US $200,000 in the year ended 31 December 2017
US $300,000 in the year ended 31 December 2018
US $600,000 in the year ending 31 December 2019
Amounts spent in excess of the annual amount are allowed to be carried forward and applied against future years. During the year ended 30 June 2018 the Group’s cumulative exploration expenditure exceeded the aggregate required amount. Accordingly, the liability was extinguished and amounts in excess are recognised as an exploration asset.
As at 31 December 2018 the following amounts remain outstanding which are recognised as liabilities in the balance sheet:
US $200,000 in the year ending 31 December 2019
US $550,000 in the year ending 31 December 2020
(iii) On 10 July 2018 the Group granted Sandfire Resources NL an option which may be exercised prior to 31 December 2018 to earn an interest in the Red Mountain project of:
51% by spending $6,000,000 within twelve months of exercising its option to earn in and a further $14,000,000 over the following three years;
70% by undertaking the activities required to achieve a 51% interest and spending a further $10,000,000 and completing a pre‐feasibility study over a further two years;
80% by undertaking the activities required to achieve a 70% interest and sole funding completion of a definitive feasibility study if White Rock elects not to contribute;
90% by undertaking the activities required to achieve a 80% interest and sole funding development of the Project if White Rock elects not to contribute.
In the first year White Rock will manage the expenditure to be funded by Sandfire and will be entitled to a management fee of 10% of the funds spent by Sandfire.
Further Sandfire provided $1,000,000 which was required to be spent on the Red Mountain project, which, if, Sandfire elected to earn into the Red Mountain project would be set off against the expenditure requirement of year one. In the event Sandfire did not elect to earn in to the Red Mountain project, the funds advanced were required to be repaid in cash or settled with shares to the value of $1,000,000.
The receipt of funds was accounted for on the basis that White Rock was acting as an agent for Sandfire in their undertaking expenditure on the Red Mountain project on the basis of management’s assessment that it was highly likely that Sandfire would exercise their option to elect to earn in to the Red Mountain project. On 27 December 2018 Sandfire exercised their option reducing the year one expenditure from $6,000,000 to $5,000,000 and at 31 December all of the $1,000,000 funds received had been spent on the project. Accordingly, the expenditure was not recognised as an exploration asset, no additional equity was recognised, and no liability is recorded at 31 December 2018 in respect of the arrangement.
For
per
sona
l use
onl
y
WHITE ROCK MINERALS LTD CONSOLIDATED INTERIM FINANCIAL REPORT
22 | P a g e
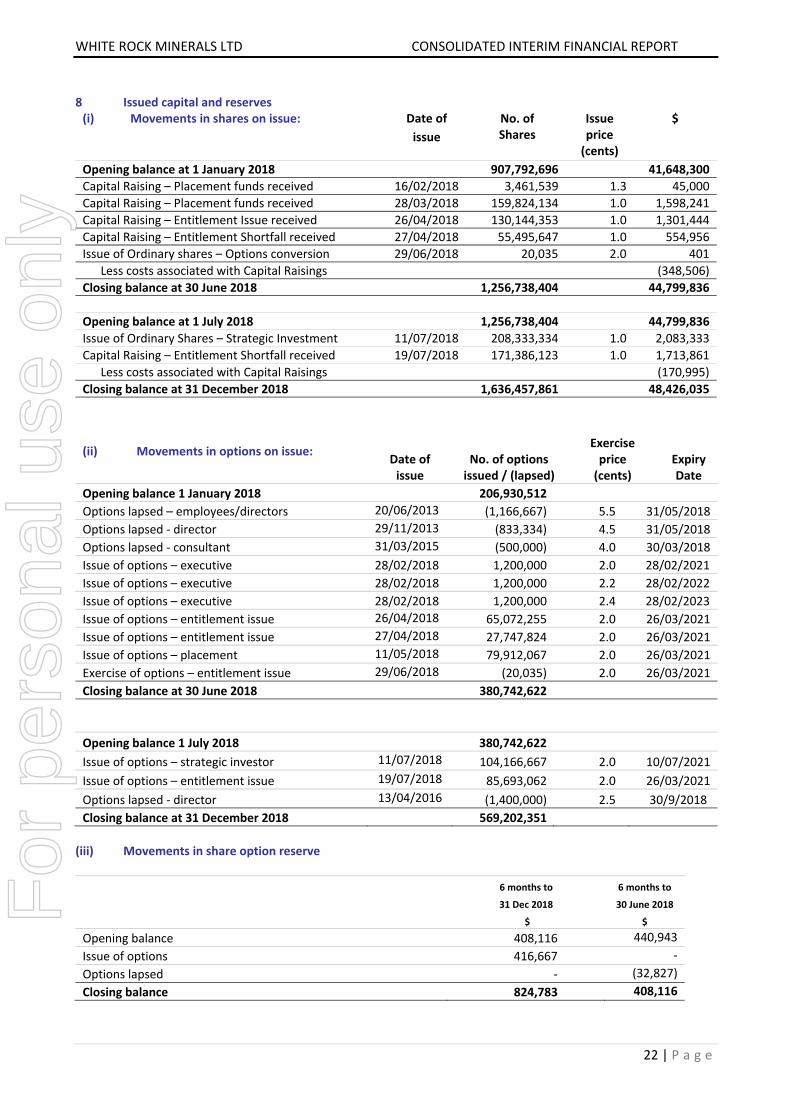
8 Issued capital and reserves (i) Movements in shares on issue:
Date of
issue
No. of Shares
Issue price (cents)
$
Opening balance at 1 January 2018 907,792,696 41,648,300
Capital Raising – Placement funds received 16/02/2018 3,461,539 1.3 45,000
Capital Raising – Placement funds received 28/03/2018 159,824,134 1.0 1,598,241
Capital Raising – Entitlement Issue received 26/04/2018 130,144,353 1.0 1,301,444
Capital Raising – Entitlement Shortfall received 27/04/2018 55,495,647 1.0 554,956
Issue of Ordinary shares – Options conversion 29/06/2018 20,035 2.0 401
Less costs associated with Capital Raisings (348,506)
Closing balance at 30 June 2018 1,256,738,404 44,799,836
Opening balance at 1 July 2018 1,256,738,404 44,799,836
Issue of Ordinary Shares – Strategic Investment 11/07/2018 208,333,334 1.0 2,083,333
Capital Raising – Entitlement Shortfall received 19/07/2018 171,386,123 1.0 1,713,861
Less costs associated with Capital Raisings (170,995)
Closing balance at 31 December 2018 1,636,457,861 48,426,035
(iii) Movements in share option reserve
(ii) Movements in options on issue:
Date of issue
No. of options issued / (lapsed)
Exercise price (cents)
Expiry Date
Opening balance 1 January 2018 206,930,512
Options lapsed – employees/directors 20/06/2013 (1,166,667) 5.5 31/05/2018
Options lapsed ‐ director 29/11/2013 (833,334) 4.5 31/05/2018
Options lapsed ‐ consultant 31/03/2015 (500,000) 4.0 30/03/2018
Issue of options – executive 28/02/2018 1,200,000 2.0 28/02/2021
Issue of options – executive 28/02/2018 1,200,000 2.2 28/02/2022
Issue of options – executive 28/02/2018 1,200,000 2.4 28/02/2023
Issue of options – entitlement issue 26/04/2018 65,072,255 2.0 26/03/2021
Issue of options – entitlement issue 27/04/2018 27,747,824 2.0 26/03/2021
Issue of options – placement 11/05/2018 79,912,067 2.0 26/03/2021
Exercise of options – entitlement issue 29/06/2018 (20,035) 2.0 26/03/2021
Closing balance at 30 June 2018 380,742,622
Opening balance 1 July 2018 380,742,622
Issue of options – strategic investor 11/07/2018 104,166,667 2.0 10/07/2021
Issue of options – entitlement issue 19/07/2018 85,693,062 2.0 26/03/2021
Options lapsed ‐ director 13/04/2016 (1,400,000) 2.5 30/9/2018
Closing balance at 31 December 2018 569,202,351
6 months to
31 Dec 2018
$
6 months to
30 June 2018
$
Opening balance 408,116 440,943
Issue of options 416,667 ‐
Options lapsed ‐ (32,827)
Closing balance 824,783 408,116
For
per
sona
l use
onl
y

WHITE ROCK MINERALS LTD CONSOLIDATED INTERIM FINANCIAL REPORT
23 | P a g e
9 Financial Instruments
Carrying amounts versus fair values The fair values of financial assets and financial liabilities approximate the carrying amounts in the consolidated interim statement of financial position. Financial risk management credit risk, liquidity risk, and interest rate risk There have been no changes in the Group’s financial risk management objectives and policies are consistent with those disclosed in the consolidated financial statements as at and for the year ended 30 June 2018.
Contingent funding arrangements Cartesian Financing Package
Under Phase II of the Cartesian Financing Package, in exchange for US $19,000,000 it is intended that White Rock will deliver to Cartesian Royalty Holdings (“CRH”) a gold stream of 20% of gold equivalent (cash, gold or gold credits, to be chosen at CRH's election) produced at the Mt Carrington Project over a period of 84 months, subject to a minimum delivery requirement of 40,000 ounces of gold equivalent. It is anticipated that the minimum delivery requirement may be adjusted on a pro‐rata basis depending on whether a higher or lower stream investment is required pursuant to the definitive feasibility study.
It is intended that White Rock will also grant CRH a Net Smelter Return royalty of 1.75% of all gold and silver production from the Mt Carrington tenements once the Phase II gold delivery minimum of 40,000 ounces gold equivalent has been repaid.
Phase II is subject to a number of conditions including:
successful completion of the definitive feasibility study on Mount Carrington, environmental impact statement and full permitting;
White Rock’s decision to proceed with the construction of the Mt Carrington Project and draw on the Phase II streaming investment;
satisfactory completion of due diligence by CRH;
acceptance of the mine plan and capital expenditure included in the definitive feasibility study by CRH;
White Rock securing access to grid power for 100% of the project power needs; and
negotiation and execution of definitive documentation for the Phase II transactions.
If the Phase II investment proceeds, it is intended that:
White Rock will agree to pay CRH an establishment fee of 3% of the total Phase II investment amount (which at White Rock's election may be satisfied by the issue of White Rock shares); and
the Phase II investment will be secured against White Rock and its interests in the Mt Carrington Project for the duration of the streaming investment (subject to any ASX or other regulatory requirements or restrictions).
In the event that White Rock materially breaches its exclusivity obligations, or receives alternative funding for the construction of the Mt Carrington project, White Rock will be required to pay to CRH a break fee of US $1,500,000.
Equity Placement Facility
In December 2017 the Group entered into an Equity Placement Agreement with the Kentgrove Capital growth fund. Under the facility Kentgrove are issued and hold shares to be sold at the discretion of White Rock. There shares were initially issued to Kentgrove for no consideration and any shares held at the end of the agreement must be returned to White Rock. If on instruction from White Rock the shares are sold by Kentgrove on the market, the proceeds net of commission percentage must be remitted by Kentgrove to White Rock. Any such amounts will be recognised as a increase in equity in future periods. The agreement expires on 11 December 2020.
For
per
sona
l use
onl
y
WHITE ROCK MINERALS LTD CONSOLIDATED INTERIM FINANCIAL REPORT
24 | P a g e
10 Contingent liabilities
The Group’s bankers have provided guarantees amounting to $856,000 (30 June 2018: $856,000) to certain government bodies as security over the Group’s performance of rehabilitation obligations on certain tenements. Under the agreement, the Group has indemnified the bank in relation to these guarantees. The guarantees are backed by collateral deposits amounting to $856,000 as at 31 December 2018 (30 June 2018: $856,000).
The Directors are of the opinion that there are no further matters for which further provision is required in relation to any contingencies as it is not probable that a future sacrifice of economic benefits will be required or the amount is not capable of reliable measurements.
11 Subsequent events
Non‐Executive Director, Mr Ian Smith, resigned effective 28 February 2019.
Other than the events described, there has not arisen in the interval between the end of the reporting period and the date of this report any item, transaction or event of a material or unusual nature likely, in the opinion of the Directors of the Company, to affect significantly the operations of the Group, the results of those operations, or the state of affairs of the Group, in future periods.
For
per
sona
l use
onl
y

WHITE ROCK MINERALS LTD CONSOLIDATED INTERIM FINANCIAL REPORT
25 | P a g e
Directors’ declaration
In the opinion of the Directors of White Rock Minerals Ltd (“the Company”): 1. The consolidated financial statements and notes set out on pages 14 to 24, are in accordance with
the Corporations Act 2001 including:
(a) giving a true and fair view of the Group’s financial position as at 31 December 2018 and of its performance for the half‐year ended on that date; and
(b) complying with Australian Accounting Standard AASB 134 Interim Financial
Reporting and the Corporations Regulations 2001; and 2. There are reasonable grounds to believe that the Company will be able to pay its debts as and
when they become due and payable. Signed in accordance with a resolution of the Directors:
Peter Lester Chairman
Dated at Melbourne this 14th day of March 2019
For
per
sona
l use
onl
y

26
KPMG, an Australian partnership and a member firm of the KPMG network of independent member firms affiliated with KPMG International Cooperative (“KPMG International”), a Swiss entity.
Liability limited by a scheme approved under Professional Standards Legislation.
Independent Auditor’s Review Report
To the shareholders of White Rock Minerals Ltd
Conclusion
We have reviewed the accompanying Interim Financial Report of White Rock Minerals Ltd (the Company).
Based on our review, which is not an audit, we have not become aware of any matter that makes us believe that the Interim Financial Report of White Rock Minerals Ltd is not in accordance with the Corporations Act 2001, including:
giving a true and fair view of the Group’s financial position as at 31 December 2018 and of its performance for the half-year ended on that date; and
complying with Australian Accounting Standard AASB 134 Interim Financial Reporting and the Corporations Regulations 2001.
The Interim Financial Report comprises:
Consolidated statement of financial position as at 31 December 2018;
Consolidated interim statement of comprehensive income, Consolidated interim statement of changes in equity and Consolidated interim statement of cash flows for the half-year ended on that date;
Notes 1 to 11 comprising a summary of significant accounting policies and other explanatory information; and
The Directors’ Declaration.
The Group consists of the Company and the entities it controlled at the half-year’s end or from time to time during the half-year.
The Interim Period is the six months ended on 31 December 2018.
Material uncertainty related to going concern – emphasis of matter
We draw attention to Note 3(i) to the Interim Financial Report, which states that current forecasts indicate that cash on hand as at 31 December 2018 is not sufficient to fund planned exploration and operational activities, settle the applicable obligations referred to in Note 7(ii), maintain the Group’s tenements in good standing and meet minimum expenditure requirements during the next twelve months. Accordingly, the Group will be required to raise additional funding which is materially uncertain until secured.
The conditions disclosed in Note 3(i), indicate a material uncertainty exists that may cast significant doubt on the Group’s ability to continue as a going concern and, therefore, whether it will realise its assets and discharge its liabilities in the normal course of business, and at the amounts stated in the Interim Financial Report. Our conclusion is not modified in respect of this matter. F
or p
erso
nal u
se o
nly

27
Responsibilities of the Directors for the Interim Financial Report
The Directors of the Company are responsible for:
the preparation of the Interim Financial Report that gives a true and fair view in accordance with Australian Accounting Standards and the Corporations Act 2001; and
for such internal control as the Directors determine is necessary to enable the preparation of the Interim Financial Report that is free from material misstatement, whether due to fraud or error.
Auditor’s responsibility for the review of the Interim Financial Report
Our responsibility is to express a conclusion on the Interim Financial Report based on our review. We conducted our review in accordance with Auditing Standard on Review Engagements ASRE 2410 Review of a Financial Report Performed by the Independent Auditor of the Entity, in order to state whether, on the basis of the procedures described, we have become aware of any matter that makes us believe that the Interim Financial Report is not in accordance with the Corporations Act 2001 including: giving a true and fair view of the Group’s financial position as at 31 December 2018 and its performance for the half-year ended on that date; and complying with Australian Accounting Standard AASB 134 Interim Financial Reporting and the Corporations Regulations 2001. As auditor of White Rock Minerals Ltd, ASRE 2410 requires that we comply with the ethical requirements relevant to the audit of the annual financial report.
A review of an Interim Financial Report consists of making enquiries, primarily of persons responsible for financial and accounting matters, and applying analytical and other review procedures. A review is substantially less in scope than an audit conducted in accordance with Australian Auditing Standards and consequently does not enable us to obtain assurance that we would become aware of all significant matters that might be identified in an audit. Accordingly, we do not express an audit opinion.
In conducting our review, we have complied with the independence requirements of the Corporations Act 2001.
KPMG Gordon Sangster
Partner
Melbourne
14 March 2019
For
per
sona
l use
onl
y

28
KPMG, an Australian partnership and a member firm of the KPMG network of independent member firms affiliated with KPMG International Cooperative (“KPMG International”), a Swiss entity.
Liability limited by a scheme approved under Professional Standards Legislation.
Lead Auditor’s Independence Declaration under
Section 307C of the Corporations Act 2001
To the Directors of White Rock Minerals Ltd
I declare that, to the best of my knowledge and belief, in relation to the review of White Rock Minerals Ltd for the half-year ended 31 December 2018 there have been:
i. no contraventions of the auditor independence requirements as set out in the Corporations Act 2001 in relation to the review; and
ii. no contraventions of any applicable code of professional conduct in relation to the review.
KPMG
Gordon Sangster Partner Melbourne 14 March 2019 PAR_SIG_01 PAR_NAM_01 PAR_POS_01 PAR_DAT_01 PAR_CIT_01
For
per
sona
l use
onl
y