Embed Size (px)
Citation preview

Af
Ba
b
c
a
A
R
R
A
K
B
S
A
S
1
Hrmamp(cnt
h0(
c o m p u t e r m e t h o d s a n d p r o g r a m s i n b i o m e d i c i n e 1 2 1 ( 2 0 1 5 ) 1–13
jo ur nal ho me p ag e: www.int l .e lsev ierhea l t h.com/ journa ls /cmpb
bdominal surgery process modeling frameworkor simulation using spreadsheets
iljana Mileva Boshkoskaa,∗, Talib Damijb, Franc Jelencc, Nadja Damija
Faculty of Information Studies, Ulica talcev 3, Novo mesto, SloveniaFaculty of Economics, University of Ljubljana, Kardeljeva ploscad 17, SloveniaUniversity Medical Centre, University of Ljubljana, Ljubljana, Slovenia
r t i c l e i n f o
rticle history:
eceived 6 January 2015
eceived in revised form 6 May 2015
ccepted 8 May 2015
eywords:
usiness process management
preadsheets
ctivity table modeling technique
imulations
a b s t r a c t
We provide a continuation of the existing Activity Table Modeling methodology with a modu-
lar spreadsheets simulation. The simulation model developed is comprised of 28 modeling
elements for the abdominal surgery cycle process. The simulation of a two-week patient
flow in an abdominal clinic with 75 beds demonstrates the applicability of the methodol-
ogy. The simulation does not include macros, thus programming experience is not essential
for replication or upgrading the model. Unlike the existing methods, the proposed solu-
tion employs a modular approach for modeling the activities that ensures better readability,
the possibility of easily upgrading the model with other activities, and its easy extension
and connectives with other similar models. We propose a first-in-first-served approach for
simulation of servicing multiple patients. The uncertain time duration of the activities is
modeled using the function “rand()”. The patients movements from one activity to the next
one is tracked with nested “if()” functions, thus allowing easy re-creation of the process
without the need of complex programming.
© 2015 The Authors. Published by Elsevier Ireland Ltd. This is an open access article under
Y-NC
The motivation for using the spreadsheet is threefold.Firstly, a spreadsheet provides a complete overview of the
the CC B
. Introduction
ealthcare process simulation is an interesting technique foresearch and practice. Many different approaches exist for
odeling a healthcare system [1], such as system dynamics,gent-based modeling, optimization techniques, electronicedical records information system [2], disease management-
rocess modeling approach [3] and discrete event simulationDES) [4]. The paper focuses on the usage of DES. The modelonsiders the limitations of the Slovenian hospital for abdomi-
al surgery in terms of the number of available beds, the meanime of activity durations and the number of available doctors.
∗ Corresponding author. Tel.: +386(0)59 087 902; fax: +386 (0)59 08 79 03.E-mail address: [email protected] (B.M. Boshkoska).
ttp://dx.doi.org/10.1016/j.cmpb.2015.05.001169-2607/© 2015 The Authors. Published by Elsevier Ireland Ltd. Thttp://creativecommons.org/licenses/by-nc-nd/4.0/).
-ND license (http://creativecommons.org/licenses/by-nc-nd/4.0/).
This paper proposes a two-step general modeling frame-work for healthcare process simulation. Firstly, the Activitytable modeling technique is applied. Secondly, spreadsheetsare used for simulation of the patient’s flow. The applicabil-ity of the proposed modeling framework is demonstrated ona real-life case study of the abdominal surgery process. Themodeling starts with defining the process workflow using theactivity table technique [24]. Next, the spreadsheet is used asa tool to simulate the healthcare process.
process at any point of time (the location of the patient, theavailability of beds, and the availability of resources). Secondly,
his is an open access article under the CC BY-NC-ND license

m s i
2 c o m p u t e r m e t h o d s a n d p r o g r athe simplicity of a spreadsheet allows upgrading the model byExcel users, without the need of performing complex program-ming tasks. The combination of the simplicity of spreadsheetsand their supportive presentation of data has proven to be ofa higher importance than complex and detailed model rep-resentation for decision support on operational-level models[5], and for policy-level models [6]. Furthermore, a spread-sheet allows easy upgrade of the model to connecting differenthospital departments, thus leading to a step forward towardmodeling the hospital as a whole system.
Thirdly, the issue has a particular practical merit. Many ofthe discrete event simulation models described in the litera-ture were built for a specific hospital, and are never reuseddue to economic reasons or the complexity of the models [1].In order to overcome this obstacle, this paper provides enoughdetails of the simulation approach so that it can be easily re-created by an Excel user, for different hospital departments.The aim of this paper is therefore to test the proposed two-step modeling framework on a specific healthcare process,not focusing on the comparison to other commercial prod-ucts. Suggested framework points to an optimal managementof resources and relative time, as well as supports a review ofthe presented structure of the activities.
The approach applied in this work starts by modeling theprocess discussed using the Activity table modeling tech-nique, and continues by transmitting the process modeldeveloped into a spreadsheet in order to simulate it.
The starting point for simulation of the healthcare processwas based on the simulations performed by [7] who use onespreadsheet to simulate an emergency department for patientflow. We changed and improved their approach in the follow-ing manners:
1. The simulation approach is performed without macros,thus no Visual Basic programming experience is requiredin order to replicate the model, or to upgrade it; however, aproficient knowledge of using formulas in Excel is required.
2. The solution employs a modular approach for modeling ofthe activities. It means that each activity is described in aseparate worksheet instead of using only one. This way weensure: better readability; the possibility of easily upgrad-ing the model with other activities; and its easy extensionand connectives with other Clinic’s models;
3. Three different modeling elements are introduced depend-ing on their functionality: activity, transaction, and gate; inaddition we provide two models for activities with multipleinputs;
4. The serving priority of the activities with multiple inputsis solved with the principal of first-in-first-served.
2. Activity table modeling technique
There are more than fifty tools [8] or methods that are men-tioned in the literature that are available for business processmodeling, which makes the selection of the proper tool dif-
ficult. An extensive comparison can be found in [9] wherean empirical review of existing methodologies, tools andtechniques for business process change are given, includ-ing a reference framework to assist the positioning of toolsn b i o m e d i c i n e 1 2 1 ( 2 0 1 5 ) 1–13
and techniques that improve re-engineering strategy, peo-ple, management, structure and the technology dimensionsof business processes.
The criteria that is of greatest interest when comparingthe techniques for business process modeling are: the rel-evance, the completeness, and the simplicity of the builtmodels [10,11]. Additionally, the process modeling tools mustbe capable of showing interconnections between the activitiesand conducting a decomposition of the processes. A commonway to represent a consecutive flow of activities in health-carewhich includes all encounter criteria is through workflows[12,22,23] or mapping [13]. Here we chose Activity table model-ing technique as a tool for representing the activities and theexisiting relations among them.
The Activity Table consists of two parts. The first part (firstfew columns) provides information about each activity listedby defining a number of parameters that describe the activity.The second part is a tabular-graphical representation of theprocess. To develop the activity table, information about pro-cess functioning should be gained during interviews that areorganized with knowledgeable employees.
2.1. Part 1
In the columns of Part 1 of the Activity Table a number of thefollowing parameters are defined for each activity(i), where iranges from 1 to the number of activities.
• Description. A short and precise description of what exactlyis the work carried out by the activity defined in row(i)
• Time. The expected duration needed for activity(i) to beprocessed and accomplished
• Rule. One or more constraints or rules that must be satisfiedin order for activity(i) to be performed
• Input/Ouput. Input(s) and ouput(s) of activity(i)
2.2. Part 2
Process: For each process, a new Activity Table is created. Thistable represents a model called the “as-is” process model,which describes the behavior of the process as it exists in real-ity. Thus, the name of the process selected is written in the firstcolumn of the Activity Table (see Fig. 1).
If the process is large and complex, then it should be par-titioned into a set of sub-processes, which are in this caselisted in the second column of the Activity Table. Each processconsists of a number of work processes.
Work Processes: A work process is a process that is per-formed within a department or organization unit. In this stepall work processes of the process discussed are listed in theWork Process column of the Activity Table. For each work pro-cess listed, the name of the department in which the workprocess is performed, is written in the first row of the table(see Fig. 1). A work process is a process that consists of a setof activities.
Activities: This step deals with identifying the activities
performed within each of the work processes defined in theprevious step. An activity is a simple micro-process that con-sists of one or more tasks that represent well-defined workperformed by one resource. An activity may consist of a
c o m p u t e r m e t h o d s a n d p r o g r a m s i n b i o m e d i c i n e 1 2 1 ( 2 0 1 5 ) 1–13 3
omin
nteetp
tai
Fig. 1 – Activity diagram for abd
umber of tasks [14]. A task could be understood as an elemen-ary work within an activity [14]. To identify the activities ofach work process, further interviews are organized with themployees involved in performing them. The Activity Tableechnique uses a small set of flowchart symbols to model arocess, such as: ©, �, �, ♦, →, ←, ↓, ↑.
To demonstrate the functionality of the proposed simula-
ion approach the paper introduces a real case study of thebdominal surgery process taken from the abdominal clinicn Slovenia. Firstly, the Activity table modeling technique isal surgery process simulation.
used to model the abdominal surgery process, resulting in themodel presented in Fig. 1. This table divides the surgery pro-cess into five work processes, each one consisting of severalactivities. Several entities are presented in the columns of theActivity table and linked to specific activities, where they carryout particular tasks. No other entities are participating in thisprocess, however, some of the entities are also included in
carrying out tasks outside the selected process. The proposedmodel represents the whole process by modeling each of its 28activities in a separate worksheet. These are interconnected
m s i
4 c o m p u t e r m e t h o d s a n d p r o g r aas in reality, so that a patient is directed from one activity tothe next one automatically.
In our example, the process simulation is carried out over aperiod of four weeks, a week consists of five working days andeight working hours per day. Consequently, we defined 9600rows in each spreadsheet (1 working day consists of 8 h; 8 h *60 min * 20 working days = 9600 min).
3. Model description and case studyimplementation
The process model that we describe is a discrete-event modelimplemented in an Excel workbook.
Performing simulations in Excel requires defining threemodeling elements: an activity, a transaction, and a gate. Anactivity is a description of a task with certain duration andwhich requires resources to be performed [15]. Transactionsare flow units that move through the process model from oneactivity to the next ones [16]. In the proposed model, patientshave the role of transactions. A Gate is a modeling elementthat is activated at a particular time of the day. It means thatthe transactions that arrive at the gate have to wait until thegate’s door opens at the time defined. A gate does not havetime duration nor resources, therefore it is not consideredas an activity. Consequently, it is not included in the activitydiagram presented in Fig. 1.
Each worksheet implements one modeling element. Aworksheet called Input data worksheet keeps the input data ofthe model.
3.1. Input data worksheet
The Input data worksheet specifies the configuration param-eters of the modeling elements and the constraints of themodel. It organizes the input data into three tables.
The first table defines the constraints of the model pre-sented with the maximum number of available beds. Thesecond table provides information about parameters of themodeled activities, described with different distributions. Thelast table shows for each activity its properties, such as ID,number of resources, and duration.
3.1.1. Example of input data worksheetTable 1 introduces an example of the input data worksheet forthe model of abdominal surgery process. It consists of threetables: Table 1a, 1b, and 1c. Table 1a shows that the number ofavailable beds in the Clinic is 75.
Table 1b gives the parameters of the triangular distribu-tions that are required in order to determine the durationof some of the activities, such as activities 18, 24, and oth-ers. For example, a triangular distribution determines theduration of the patient’s stay in intensive care (activity 18 inTable 1c). It has the following parameters: minimum stay ofthe patient in the intensive care is 1 day, maximum stay is 5
days, and the most probable stay is 4 days. The actual dura-tion is estimated with the function “rand()” that generates apseudo-random number uniformly distributed in the inter-val (0,1), which is scaled to the desired distribution accordingn b i o m e d i c i n e 1 2 1 ( 2 0 1 5 ) 1–13
to the given parameters in Table 1b. This transformation isknown as Probability Integral Transformation [12].
Table 1c provides names and time durations of the activ-ities. These parameters are read from the third and fourthcolumns in the Activity Table (Fig. 1) and inserted into Table 1c(the spreadsheet).
The activity durations (last column in Table 1c) are definedusing a number of time units, an interval denoted byBetween(a;b), see activities 10, 11, 17, 23, or a triangular distri-bution denoted by TriangDist(a;c;b), where a is the minimumtime duration, b is the maximum time duration and c is themost frequent time duration, see activities 18 and 24.
Our approach in this paper assumes a LogNormal prior dis-tribution for the activities 10, 11, 17 and 23 [17,18]. For example,the calculation of the time duration of activity 11 (“Carry outsurgery”) is obtained with the formula: LOGINV(RAND(), 5,0.45). Consequently, the bulk of the probability mass is locatedin the interval [60,240] minutes. The LogNormal prior wasselected purely for demonstration purposes. In many cases,more informative prior is needed. In Excel, drawing randomnumbers from an arbitrary prior can be achieved in two ways:
1. If the distribution is known, and the increase cumulativedistribution (icdf) exists in closed form, than the Inversetransform sampling theorem can be used to generate thesamples from the original distribution.
2. If the icdf does not exist in closed form, one can generatea VB script that performs Gibbs sampling, thus solving thisissue.
The lognormal priors of activities 10, 11, 17 and 23 arecalculated using the following parameters for the mean andstandard deviation:
• Activity 10 ∼ LN(mean=3.58, std=0.27)• Activity 11 ∼ LN(mean=5, std=0.45)• Activity 17 ∼ LN(mean=4.84 std=0.37)• Activity 23 ∼ LN(mean=5.02, std=0.41)
The sampling was performed using the inverse transformsampling theorem i.e., in Excel LOGINV(RAND(), mean, std).
More details regarding definition on distributions of thedurations of the activities can be found in [17,19–21].
3.2. Types of modeling elements
Each of the three modeling elements – gate, activity, and trans-action is modeled with a separate spreadsheet. Each row in thespreadsheet represents the state of the modeling element ata particular moment of time.
3.2.1. GateThe model of a gate in a worksheet comprises the followingfour columns:
(A) states the time when the gate is activated;(B) gives the number of transactions that are currently wait-
ing at the gate;(C) lists all transactions that wait at the gate; and

c o m p u t e r m e t h o d s a n d p r o g r a m s i n b i o m e d i c i n e 1 2 1 ( 2 0 1 5 ) 1–13 5
Table 1 – Excel simulation input data worksheet.
Table 1a
Number of beds 75
Table 1bParameters of triangular distribution Activity 18 Activity 24
a 1 3b 5 5c 4 4
Table 1cActivity ID Activity Name Resource Duration (Minutes)
01 Confirm surgery date 1 1002 Patient reception 1 1503 View and organize documents 1 1004 Fulfill care documents 1 1505 Explain surgery 1 1006 Sign surgery documents 1 507 Sign anesthesia documents 1 508 Prescribe medications 1 10Gate1 Every morning09 Prepare patient for surgery 1 3010 Carry out anesthesia 1 Between(30;45)11 Carry out surgery 1 Between(60;240)12 Wake up patient 1 3013 Place in intensive care 1 3014 Prescribe therapy 1 1015 Addition-al tests 1 1016 Order additional tests 3 1017 Carry out care 1 Between(90;180)18 Check recovery 2 TringDist(1;5;4)IntG Every morning19 Place in Clinic 1 2020 Prescribe therapy 2 1021 Addition-al tests 1 1022 Order additional tests 2 1023 Carry out care 1 Between(90;240)CliG Every morning24 Check recovery 2 TringDist(3;5;4)Gate2 Every morning25 Inform about release 1 1026 Prepare release report 1 30
(
s
3Fe
Gaawddd
27 Organize transport
28 Need transport
D) lists all transactions which are ready to be propagated tothe next activity.
Table 1c presents four gates for the example of abdominalurgery Clinic simulation: Gate1, IntG, CliG, and Gate2.
.2.2. Gate 1 as an example of a gate modeling elementig. 2 provides details of the Gate1 as an example of the mod-ling element gate.
The first column shows the activation time moment ofate1 measured in minutes. In the example at hand, Gate1 isctivated at 8:00 AM, hence the value of 480 min is obtaineds a multiplication of 8 h × 60 min. In this study, the clinic
orks 8 h per day. Therefore, in the simulation each workingay consists of 480 min and consequently the next workingay starts at 481 min and lasts until 960 min (this is 2 workingays × 8 h × 60 min), and so on.1 101 10
Column B gives the number of transactions that arrivedat Gate1 during the previous day and are waiting for thenext activity the following morning. The transactions in theexample are patients that completed the activity “08 Prescribemedications” (Fig. 3) and are waiting for the next activity “09Prepare patient for surgery” (see Table 1c). The value in the cellB2 is 25, and it is obtained using the information stored in theworksheet “08 Prescribe medications.”
In Excel, transferring such an information can beachieved by using the function “indirect” which returnsthe value of the specified reference. For example, the for-mula indirect(“‘8’!”&address(2;6)) returns the value from cellsin the worksheet “8′′ positioned on the address(row;column)=address(2;6), which is cell F2 in the worksheet “08 Prescribemedications.” Sometimes we don’t know the exact row into
which a certain value resides in the previous worksheets. Inthis case, we can use the function “match” which searchesthe given item in a specified range of cells returning the
6 c o m p u t e r m e t h o d s a n d p r o g r a m s i n b i o m e d i c i n e 1 2 1 ( 2 0 1 5 ) 1–13
te m
(A
(
(
(D
(
(
Fig. 2 – Example of a ga
relative position of the required given item. For example, theformula match(A3;’8’!$A$2:$A$18000;0) searches for a match ofthe value given in the cell A3 in the worksheet “8” in the cellrange A2 – A18000. Finally, the following formula is used in cellB3:
B3=sum(indirect(“‘8’!”&address(2;6):indirect(“‘8’!”&address(match(A3;‘8’!$A$2:$A$18000;0)+1;6)).
The formula sums the values starting from cell F2(address(2;6)) in the worksheet “08 Prescribe medications”until the row that matches the value of A3 from the work-sheet “Gate 1,” in the A column of the worksheet “08 Prescribemedications.”
Column C gives the list of all transactions that arrived atGate1, separated with colon “:”. The name of the transactionis given according to the minute in which it commenced. Forexample, 24 means that the transaction commenced at the24th minute. The following formula obtains the list in cell C3:
C3=indirect(“‘8’!”&address(match(A3;’8’!$A$2:$A$18000;0)+1;9)).
The formula returns the list of transactions from the work-sheet “08 Prescribe medications” which have finished by the961st minute specified in cell A3 in the worksheet Gate1.
The last column D gives only those transactions thatarrived in the last interval, such as between 1 and 480thminute, 481st and 960th minute, and so on. For example, thelist in column D3 comprises the activities obtained by applyingthe following formula:
D3=if(or(C3=0;C3=“”);“”;if(len(C2)=0;mid(C3;1;len(C3)-len(C2));mid(C3;len(C2)+2;len(C3)-len(C2)))).
(G
Fig. 3 – A sample of the activity
odeling element: Gate1.
The formula firstly examines if the list of activities isempty (with the conditional checkup if(or(C3=0;C3=“”))). Oth-erwise, the formula checks if the list in the previous intervalwas empty (if(len(C2)=0)), by introducing the formula len(text),which checks the length of characters of the variable text.If text is empty then the result is adding the whole list ofactivities, otherwise the formula subtracts the activities of theprevious interval from the current one. In Excel this is achievedusing the function mid(text, start, length), which from the textreturns a number of characters defined in length and startingfrom the position start in the text.
3.2.3. ActivityFig. 4 presents an example of an activity.
The worksheet that models an activity is comprised of thefollowing eight columns (A–H):
) States the simulation minute of the time which applies tothe whole row in the worksheet;
B) Stores whether a transaction has arrived in the indi-cated minute; “1” denotes arrival of a transaction, and “0”denotes that no transaction has arrived;
C) Shows until when a resource is busy; meaning until whichminute;
) States the availability of the resource; “1” denotes that theresource is busy, and “0” denotes that the resource is avail-able;
E) Gives a cumulative number of transactions that are waitingin a queue for processing;
F) Indicates whether the transaction defined in row I is fin-ished or not. If it is finished then 1 is inserted in cell(I, F),which means that the current transaction continues in the
next activity. Otherwise, “0” is written in cell(I,F);) Lists all transactions that are waiting in a queue forprocessing at the current activity. The transaction that willbe the first processed is first in the queue.
“08 Prescribe medications”.
c o m p u t e r m e t h o d s a n d p r o g r a m s i n b i o m e d i c i n e 1 2 1 ( 2 0 1 5 ) 1–13 7
onfir
(H
(
ido
3eTitiiiuaucnTit
mtIv
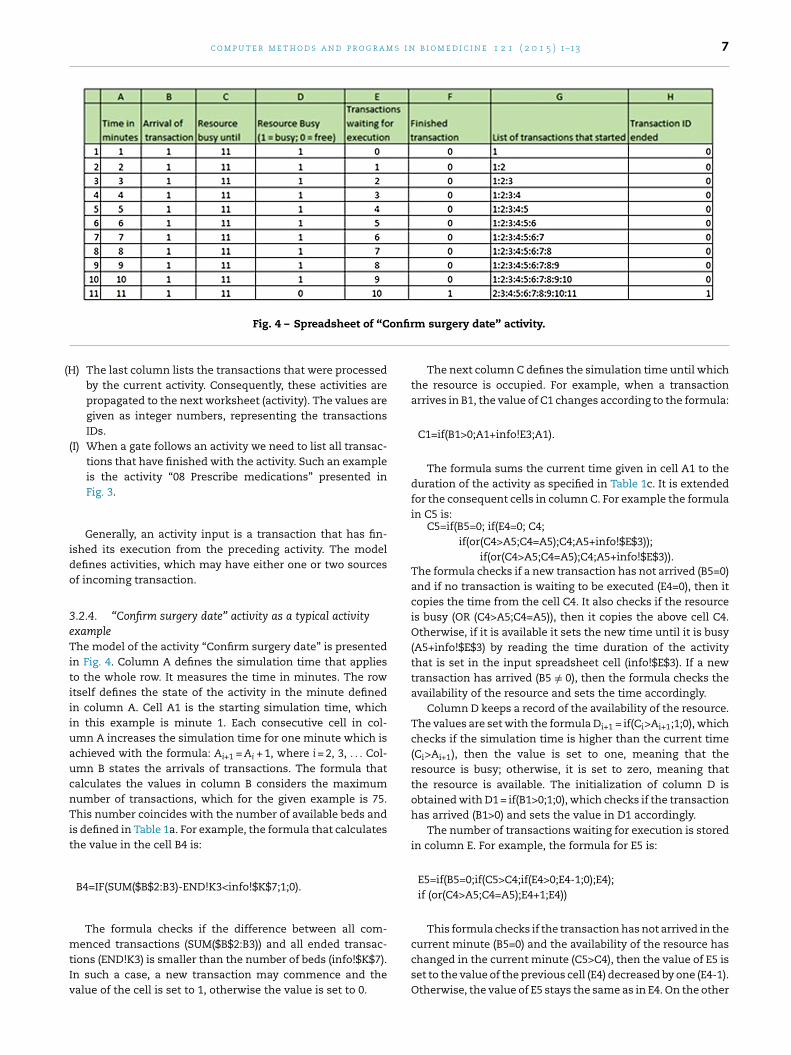
Fig. 4 – Spreadsheet of “C
) The last column lists the transactions that were processedby the current activity. Consequently, these activities arepropagated to the next worksheet (activity). The values aregiven as integer numbers, representing the transactionsIDs.
I) When a gate follows an activity we need to list all transac-tions that have finished with the activity. Such an exampleis the activity “08 Prescribe medications” presented inFig. 3.
Generally, an activity input is a transaction that has fin-shed its execution from the preceding activity. The modelefines activities, which may have either one or two sourcesf incoming transaction.
.2.4. “Confirm surgery date” activity as a typical activityxamplehe model of the activity “Confirm surgery date” is presented
n Fig. 4. Column A defines the simulation time that applieso the whole row. It measures the time in minutes. The rowtself defines the state of the activity in the minute definedn column A. Cell A1 is the starting simulation time, whichn this example is minute 1. Each consecutive cell in col-mn A increases the simulation time for one minute which ischieved with the formula: Ai+1 = Ai + 1, where i = 2, 3, . . . Col-mn B states the arrivals of transactions. The formula thatalculates the values in column B considers the maximumumber of transactions, which for the given example is 75.his number coincides with the number of available beds and
s defined in Table 1a. For example, the formula that calculateshe value in the cell B4 is:
B4=IF(SUM($B$2:B3)-END!K3<info!$K$7;1;0).
The formula checks if the difference between all com-
enced transactions (SUM($B$2:B3)) and all ended transac-ions (END!K3) is smaller than the number of beds (info!$K$7).n such a case, a new transaction may commence and thealue of the cell is set to 1, otherwise the value is set to 0.
m surgery date” activity.
The next column C defines the simulation time until whichthe resource is occupied. For example, when a transactionarrives in B1, the value of C1 changes according to the formula:
C1=if(B1>0;A1+info!E3;A1).
The formula sums the current time given in cell A1 to theduration of the activity as specified in Table 1c. It is extendedfor the consequent cells in column C. For example the formulain C5 is:
C5=if(B5=0; if(E4=0; C4;if(or(C4>A5;C4=A5);C4;A5+info!$E$3));
if(or(C4>A5;C4=A5);C4;A5+info!$E$3)).The formula checks if a new transaction has not arrived (B5=0)and if no transaction is waiting to be executed (E4=0), then itcopies the time from the cell C4. It also checks if the resourceis busy (OR (C4>A5;C4=A5)), then it copies the above cell C4.Otherwise, if it is available it sets the new time until it is busy(A5+info!$E$3) by reading the time duration of the activitythat is set in the input spreadsheet cell (info!$E$3). If a newtransaction has arrived (B5 /= 0), then the formula checks theavailability of the resource and sets the time accordingly.
Column D keeps a record of the availability of the resource.The values are set with the formula Di+1 = if(Ci>Ai+1;1;0), whichchecks if the simulation time is higher than the current time(Ci>Ai+1), then the value is set to one, meaning that theresource is busy; otherwise, it is set to zero, meaning thatthe resource is available. The initialization of column D isobtained with D1 = if(B1>0;1;0), which checks if the transactionhas arrived (B1>0) and sets the value in D1 accordingly.
The number of transactions waiting for execution is storedin column E. For example, the formula for E5 is:
E5=if(B5=0;if(C5>C4;if(E4>0;E4-1;0);E4);if (or(C4>A5;C4=A5);E4+1;E4))
This formula checks if the transaction has not arrived in the
current minute (B5=0) and the availability of the resource haschanged in the current minute (C5>C4), then the value of E5 isset to the value of the previous cell (E4) decreased by one (E4-1).Otherwise, the value of E5 stays the same as in E4. On the other
m s i
8 c o m p u t e r m e t h o d s a n d p r o g r ahand, if the transaction has arrived (B5 /= 0) and the resourceis busy, the simulation time is higher than equal to the currenttime (or(C4>A5;C4=A5)), then the value of E5 is incremented byone (E4+1), meaning that one more transaction is waiting forexecution, otherwise, the value of E5 stays the same as E4.
Column F provides information whether a transaction hasended in the current minute. For example, F5 is calculated asF5 = if(C5=A5;1;0). It means that if the current time is equal tothe simulation time until which the resource is busy, then theresource is released and the transaction has finished.
All transactions that commenced enter the queue incolumn G. The first value in column G is obtained withG1=IF(B1=1;A1;“”). A more complex formula calculates thevalues in the following rows. For example, the formula thatcalculates the value in G5 is:
G5=if(len(G4)=0; if(B5=1;A4;“”);if(and(B5=1;F5=1); concatenate(mid(G4;search(“:”;G4)+1;len(G4)-search(“:”;G4));“:”;A5);
if(and(B5=1;F5=0);concatenate(G4;“:”;A5);if(and(B5=0;F5=1); mid(G4;search(“:”;G4)+1;len(G4)-search(“:”;G4));G4))))
This is the most complex formula in the simulation. It com-prises of several scenarios. Supposing an empty queue(len(G4)=0), the newly arrived transaction (B5=1) is added tothe queue. This is denoted by if(B5=1;A4;“”). Two scenarios arepossible upon arrival of a transaction in a non-empty queue.
Scenario 1, simultaneously another transaction finishes(if(and(B5=1;F5=1)). In such a case, the newly arrived trans-action is added to the queue, and the finished transaction isremoved from it. This is achieved by using formula:
concatenate(mid(G4; term 1; term 2);“:”;A5).
In the last formula, term 1 - term 2 are introduced for betterreadability. The term 1–term 2 are:
term 1: search(“:”;G4)+1term 2: len(G4)-search(“:”;G4).
The function concatenate(text1; text2; . . .) is used to join text1with text2 and so on, while the function search(text1;text2) looksfor the text1 into text2 and returns its position.
Scenario 2, there is no transaction which finishes simulta-neously (if(and(B5=1;F5=0)), so only the newly arrived transac-tion is concatenated to the queue (concatenate(G4;“:”;A5);).
The last scenario occurs in a case when a transac-tion ends while no other transaction arrives simultaneously(if(and(B5=0;F5=1))). The ended transaction is removed fromthe queue using function mid(G4;search(“:”;G4)+1;len(G4)-search(“:”;G4)). If none of the described scenarios happens, theformula copies the queue from the previous cell G4.
Finally, column H keeps the IDs of the finished transac-tions in the current minute. For example, the value of H5 iscalculated as H5=IF(F5=1;left(G4; search(“:”;G4)-1);0). When atransaction finishes (F5=1) the formula reads the ID of the
ended transaction from the queue in G4. In Excel this isachieved with function left(text;length) which returns the left-most part of the text with number of characters defined withlength.(
n b i o m e d i c i n e 1 2 1 ( 2 0 1 5 ) 1–13
At first glance, the activity structure might seem too com-plex. However, each row in Fig. 4 can be interpreted as follows.Row 1 states that in the first minute (cell A1), a transaction hasarrived (B1=1), and it will be executed until minute 11 (C1=11).Consequently, the resource is busy (D1=1) starting from thecurrent minute until minute 11, when the activity finisheswith the execution of the commenced transaction (F11=1).There are no other transactions that are waiting in the queue(E1=0) for execution. Only one transaction has commenced,denoted with ID=1 (G1=“1”). Transactions that ended with exe-cution are removed from the queue in column G, such as thecase in G11. The ID of the ended transaction is given in columnH, as in the case of H11. Such a status report can be determinedfor each row of the activity.
3.2.5. Different types of activitiesThe model distinguishes two main modifications of an activ-ity: a decision activity and activity with multiple sources ofincoming transactions. In the latter case, the model definestwo modifications of the activity depending on the type of themodeling element that generates the incoming transaction tothe activity:
1. one transaction is generated from preceding activity, andanother is generated from a preceding decision activity, or
2. one transaction is generated from preceding activity, andanother is generated from a preceding gate.
The main difficulty in the first modification is determiningthe list of arrived transactions. In order to resolve this issue,the proposed solution includes two additional columns. Thefirst added column contains the information whether a trans-action has arrived from the second preceding activity. Thesecond added column summarizes the arrival of a transactionfrom any of the inputs. Its main functionality is to facilitate thewriting of the formulas in columns dependent on the inputsof the activity. The second modification of the activity modeladditionally introduces a single new column in which it holdsthe information of whether it is time to withdraw transac-tions from the gate. The principal first-in-first-served solvesthe priority of the transaction that should be served first incases when two transactions arrive simultaneously.
3.2.6. Decision activityA decision activity is used to check whether a certain conditionis fulfilled and on the basis of the outcome decides for furtheractions. The decision activity usually has two paths. One pathis indicated by “YES” and means that the condition is fulfilled.“NO” denotes the other path.
Fig. 5 is an example of a model of a decision activity.In addition to the columns defined for an activity, it com-
prises the following columns:
(I) generates random number using the “RAND()” function;(J) gives a decision YES or NO based on the obtained number
in (A);
K) auxiliary column that keeps record of the transactions thatended with a decision “YES”, and(L) auxiliary column that keeps record of the transactions that
ended with a decision “NO”.

s i n
3pApaitimiJoidcristktf
3pFtTc1h
tf
a(ta(
s(tvitrJut
tt
a
secondly, to add the newly arrived transaction (term 4). Interm 3 the function iserror(expression) is used which returns
c o m p u t e r m e t h o d s a n d p r o g r a m
.2.7. Decision activity for checking the recovery of theatientctivities 15, 18, 21, and 24 are the decision activities. Fig. 5resents a selection of states (listed in the first column) ofctivity 18, which decides positively in 20% and negativelyn 80% of cases. Columns H and I provide such a distribu-ion of the outcomes. In column I a random number in thenterval (0–1) is generated using the command rand(). State-
ent if(I720<(0,8);“NO”;“YES”) checks the number in column Is higher or lower than some threshold and saves the result in. In the given example, the threshold is 0.8 representing 80%f the cases. When a transaction ends, value “1” is denoted
n column H and the number in I is higher than 0.8, then theecision in J is “YES.” In such a case, the transaction is con-atenated to the list of transactions in column L. This list isequired because the next modeling element is gate Int, whichs activated once per day. Otherwise, if the number in I ismaller or equal to 0.8 at the time when a transaction ends,hen the transaction is only written to the column M, whicheeps record of the transactions that are directly propagatedhe next activity “19.” The rest of the columns have the sameunctionality as described above.
.2.8. Activity with incoming transactions from tworeceding activitiesig. 6 represents the activity 17, which is a successor ofwo activities; the decision activity 15; and the activity 16.he arrival of transactions is simulated with three columns:olumns B and C show arrival of the transaction from activities5 and 16, respectively, and column D shows if the transactionas arrived either from activity 15 or 16.
An example of the formula that examines arrival of theransaction from a previous decision activity is representedor the case of cell B2 with:
B2=IF (AND(indirect(“15!”&address(match(A2;’15’!$A$2:A1441;0)+1;7)));
NOT(indirect(“‘15’!”&address(match(A2;’15’!$A$2:A1441;0)+1;10)));))=TRUE; 1;0)).
The formula checks two conditions: if a trans-ction has completed the activity 15 (indirect“15!”&address(match(A2;’15’!$A$2:A1441;0)+1;7))) andhe decision was “YES,” then the completed trans-ction follows the current activity 17 (indirect“‘15’!”&address(match(A2;’15’!$A$2:A1441;0)+1;10))).
The time for execution of this activity is uncertain, in theense that it may take any value between 90 and 180 minsee activity 17 in Table 1c). Consequently, to simulate theime execution, a random number is generated in the inter-al (0–1) in each minute, which is scaled to the requirednterval. Because it is an activity with uniform distribu-ion of duration, column J calculates the time in minutesequired for execution of the transaction with the formula=MROUND(90+(180–90)*rand();1). The function MROUND issed to trunk the integer part of the number obtained with
he formula.As mentioned before, if there are several activities inhe queue that are waiting for execution, the priority ofhe transaction that should be served first is solved by the
b i o m e d i c i n e 1 2 1 ( 2 0 1 5 ) 1–13 9
principal first-in-first-served. The major difficulty in applyingthis principal lies in defining column M, which keeps a listof transactions that arrived to a certain point. The followingexample of nested “if”-statement that calculates M3, solvesthe problem:
M3=if(len(M2)=0;if(D3=1;if(B3=1;term 1;term 2);“”);if(and(D3=1;I3=1); concatenate(term 3;“:”;term 4);
if(and(D3=1;I3=0); concatenate (M2; “:”;term 4));
if(and(D3=0;I3=1);term 5; M2)))).
In the last nested if-statement some of the long expressionsare replaced with expressions term 1 - term 7, only for easierreadability in this paper. These have to be incorporatedinto the if-statement, when applied for modeling. Theterm 1–term 7 are:
term 1: indirect(“‘15’!”&address(match(A3;’15’!$A$2:$A$10000;0)+1;17)) – imports thetransaction ID from activity 15term 2: indirect (“‘16’!”& address (match(A3;’16’!$A$2:$A$10000;0)+1;10)) – imports thetransaction ID from activity 16term 3: mid(M2; if(iserror(search (“:”;M2));len(M2); search(“:”;M2)+1);
len (M2)-if(iserror(search(“:”;M2)); len(M2);search (“:”;M2)))
term 4: if(and(B3=1; C3=1);concatenate(term 4 1;”:”;term 4 2);if(B3=1;term 4 1;term 4 2))
term 4 1: indirect (“‘15’!”& address(match(A3;’15’!$A$2:$A$10000;0)+1;17));term 4 2: indirect (“‘16’!”& address(match(A3;’16’!$A$2:$A$10000;0)+1;10)))
term 5 mid(M2;search(“:”;M2)+1;len(M2)- search(“:”;M2)).
This formula handles the following cases:
1. If the list of transactions (M) is empty and a transaction hasarrived, then add the ID of the transaction from activity 15(term 1), or from activity 16 (term 2).
2. If the list of transactions is not empty, then the followingcases are possible:
. A new transaction arrives simultaneously when a currentone finishes (condition D3=1 and I3=1); in this case, the listof transactions has to be updated twice: firstly, to removethe transaction that finished its execution (term 3), and
value of True if it finds errors in expression. Term 4 is dividedin two cases: arrival of transactions simultaneously fromactivities 15 and 16 and arrival of a transaction either fromactivity 15 (term 4 1) or from 16 (term 4 2).

10 c o m p u t e r m e t h o d s a n d p r o g r a m s i n b i o m e d i c i n e 1 2 1 ( 2 0 1 5 ) 1–13
f a de
b
Fig. 5 – Example o
. A new transaction arrives, while no other transaction fin-ishes (the case of D3=1 and I3=0); the list of transactions isupdated by the newly arrived transaction(s), A transactionfinishes its execution and there is no newly arrived trans-actions (the case of D3=0 and I3=1); in this case the finishedtransaction is removed from the list of transactions (term 5).
c. Each row of such an activity can be easily read. For instance,in the 4809th minute (A7), a transaction arrived (D7) fromactivity 15 (B7). However, it must wait for processingbecause the resource is busy (F7) until minute 4888 (E7).There are two transactions (H7) in the queue with trans-action IDs 24 and 21 (M6), to which the newly arrivedtransaction 18 from activity 26 is the last one indicated inthe list (M7). The duration of this activity for the arrivedtransaction is 170 minutes (J7). The transaction that is cur-rently processed is 24 (the first one in M7). No transactioncompletes this activity at the current simulation minute(N7).
3.2.9. Activity with incoming transactions from preceding
activity and a gateThe second modification of an activity with multiple incomingtransactions discusses the case when the incoming transac-tions come from: a preceding gate and a preceding activity.Fig. 7 shows Activity 14 as an example of this case.Fig. 6 – Example of an activity 17 with t
cision activity 18.
Columns H and I are the newly introduced ones in themodel of such an activity. Column H checks whether it is timeto remove transactions from the Gate IntG. This is achievedwith the formula: countif(IntG!$A$2:$A$24;A2), which mayresult in two values: 0 or 1. Value “1” denotes that transactionshave to be removed from the gate IntG. These transactions arewritten into column (I) by using the formula:
I2=if(H2=1; if(indirect(“‘IntG’!”&address(match(A2;IntG!$A$2:$A$24;0)+1;5))=“”; 0;
indirect(“‘IntG’!”&address(match(A2;IntG!$A$2:$A$24;0)+1;5)));0).
The formula checks if it is time (H2=1) to remove transac-tions from the gate IntG. Furthermore, it checks if the queueof transactions waiting at IntG is empty. If the queue is notempty, then the formula removes the transactions from IntGand writes them into column I. The formula in column Mconcatenates the removed transactions to the existing list oftransactions in column M, which are waiting for processing bythe current activity.
For example, column A shows that in minute 2880 threetransactions (column E) are removed from IntG (columns H, I
and J) and are added to the existing list of transactions (col-umn M). No transactions completed the activity in the currentsimulation minute (column N).wo inputs: from activity 15 and 16.

c o m p u t e r m e t h o d s a n d p r o g r a m s i n b i o m e d i c i n e 1 2 1 ( 2 0 1 5 ) 1–13 11
Fig. 7 – Example of an activity 14 with two inputs: from activity ID 13 and the gate activity ID IntG.
Table 2 – Simulated time executions in days of activities in days with Excel model.
Maximal numberof beds
Number ofserved
patients in2 weeks
AverageCycle Time
(days)
AverageWork (days)
AverageWait (days)
MinimumCycle Time
(days)
MaximumCycle Time
(days)
4.2
3
Tap
12345
ho
75 44–47 20.80
.3. Outputs of the model
he output of the simulation model provides calculationsnd graphical representation of distributions of the followingarameters:
. Minimum Cycle Time
. Average Cycle Time
. Maximum Cycle Time
. Average Work Time
. Average Wait Time
Work Time is the amount of time during which transactionsave been actively processed. It is directly calculated as a sumf the activities duration times.
Fig. 8 – Five simulations of cycle times of 44–47 finishe
6 16.52 7.11 32.23
The amount of time work is actively being performed ontransactions. Calculated from activity task duration times.
Wait Time is the simulated amount of time that trans-actions are waiting. The waiting may occur due to differentreasons: waiting for a resource, or because of a gate.
Cycle Time is the simulated amount of time that a transac-tion spends within the process starting with the first activityand ending with the last one. A cycle time may differ fromone activity to another due to the different paths in the pro-cess and to the different activity durations calculated fromtheir distributions. The cycle time is a sum of work time andwait time.
The following equation connects the last three parameters:
Cycle Time = Work time + Wait Time.
d transactions ordered by time spent in the clinic.

12 c o m p u t e r m e t h o d s a n d p r o g r a m s i n b i o m e d i c i n e 1 2 1 ( 2 0 1 5 ) 1–13
Table 3 – Mean and standard deviation of the five simulation experiments.
Simulation 1 Simulation 2 Simulation 3 Simulation 4 Simulation 5
r
Mean 12,72 13,08
Standard Deviation 5,62 5,49
Maximum (minimum) Cycle Time refers to the highest(lowest) accumulated time for the transactions at hand, at anypoint in time.
The term average refers to the total time that all trans-actions spent in each activity divided by the number ofcompleted transactions for each activity.
4. Simulation results
In this section, we provide an example of a simulationobtained with the presented model.
Firstly, we set the number of available beds in the Clinicto 75. After that, we run the simulation five times, and weobtained the number of served patients, the average cycle timeper patient, the average work and wait times, and the mini-mum and maximum cycle times. Table 2 presents the obtainedresults. The model also provides a graphical representation ofthe distributions of measured parameters. The transactionscycle times for the five simulation experiments (Simulation1–5) are given in Fig. 8. The mean and the standard devia-tions for each of the simulations experiments 1–5 are givenin Table 3. The experts in the abdominal clinic confirmed theresults as logical.
5. Conclusion
This paper introduces a general two-step modeling frameworkfor healthcare process simulation by using the Activity tablemodeling technique and spreadsheets. The starting point wasa spreadsheet model used for simulation of emergency depart-ment for patient flow, for which we propose an upgrade andimprovement in several manners. Firstly, the newly developedmodeling framework does not require usage of macros. Hence,it can be reproduced in a fairly easy way as it does not requirea particular programming experience, and it can be used byusers with proficient knowledge of spreadsheets. Secondly,the solution employs a modular approach for modeling of theactivities thus ensuring better readability; easy integration ofthe model with other activities; and its easy extension andconnectives with other Clinic’s models. Finally, it shows thestate of the activity at any point of time. The proposed model-ing framework is applied on a real-life case study for modelingand simulation of the abdominal surgery process.
Acknowledgements
The work is supported by Creative Core FISNM-3330-13-500033‘Simulations’ project funded by the European Union, The Euro-pean Regional Development Fund.
12,57 12,36 12,545,63 5,43 5,16
e f e r e n c e s
[1] M. Gunal, M. Pidd, Discrete event simulation forperformance modelling in health care: a review of theliterature, J. Simul. 4 (2010) 42–51.
[2] A. Vishwanath, S. Rajan Singh, P. Winkelstein, The impact ofelectronic medical record systems on outpatient workflows:a longitudinal evaluation of its workflow effects, Int. J. Med.Inf. 79 (11) (2010) 778–791.
[3] M. Askari, R. Westerhof, S. Eslami, S. Medlock, S.E. Rooij, A.Abu-Hanna, A combined disease management and processmodeling approach for assessing and improving careprocesses: a fall management case-study, Int. J. Med. Inf. 82(10) (2013) 1022–1033.
[4] L. Holml, H. Lurås, F.A. Dahl, Improving hospital bedutilisation through simulation and optimisation, Int. J. Med.Inf. 82 (2) (2012) 80–89.
[5] A. Bagust, M. Place, J. Posnett, Dynamics of bed use inaccommodating emergency admissions: Stochasticsimulation model, BMJ Clin. Res. 319 (1999) 155–158.
[6] N. Proudlove, S. Black, A. Fletcher, OR and the challenge toimprove the NHS: modelling for insight and improvement inin-patient flows, J. Oper. Res. Soc. 58 (2007) 145–158.
[7] M.G. Klein, G. Reinhardt, Emergency department patientflow simulations using spreadsheets, Simul. Healthc. 7 (1)(2012) 40–47.
[8] R.S. Aguilar-Save, Business process modelling: review andframework, Int. J. Prod. Econ. 90 (2004) 129–149.
[9] W.J. Kettinger, T.C. Teng, S. Guha, Business process change: astudy of methodologies, techniques, and tools, MIS Q. 21(1997) 55–88.
[10] N. Damij, Business process modelling using diagrammaticand tabular techniques, Bus. Process Manag. J. 13 (1) (2007)70–90.
[11] T.H. Davenport, L. Prusak, Working Knowledge: HowOrganizations Manage What They Know, Harvard BusinessSchool Press, Cambridge, MA, 1998.
[12] L. Leemis, S. Park, Discrete-Event Simulation: A First Course,Prentice-Hall, Inc., Upper Saddle River, NJ, USA, 2005.
[13] L. Crystal Jiang, Z. Wang, T. Peng, J. Zhu, The dividedcommunities of shared concerns: mapping the intellectualstructure of e-Health research in social science journals, Int.J. Med. Inf. 84 (1) (2014) 24–35.
[14] N. Damij, T. Damij, Process Management. AMulti-Disciplinary Guide to Theory, Modelling, andMethodology, Springer, 2014.
[15] D. Hartvigsen, SimQuick Process Simulation with Excel,Mendoza College of Business Administration, University ofNotre Dame, Prentice Hall, Upper Saddle River, NJ, 2001, pp.07458.
[16] “iGrafx Help systm,” iGrafx LLC, 2013.[17] F. Dexter, R. Epstein, E. Bayman, J. Ledolter, Estimating
surgical case durations and making comparisons amongfacilities: identifying facilities with lower anesthesiaprofessional fees, Anesth. Analg. 116 (2013)1103–1115.
[18] F. Dexter, J. Ledolter, Bayesian prediction bounds and
comparisons of operating room times even for procedureswith few or no historic data, Anesthesiology 103 (2005)1259–2167.
s i n
c o m p u t e r m e t h o d s a n d p r o g r a m[19] F. Dexter, J. Ledolter, V. Tiwari, R. Epstein, Value of ascheduled duration quantified in terms of equivalentnumbers of historical cases, Anesth. Analg. 117 (2013)204–209.
[20] E. Marcon, F. Dexter, An observational study of surgeons’sequencing of cases and its impact on postanesthesia careunit and holding area staffing requirements at hospitals,
Anesth. Analg. 105 (2007) 119–126.[21] E. Marcon, F. Dexter, Impact of surgical sequencing on postanesthesia care unit staffing, Health Care Manag. Sci. 9(2006) 87–98.
b i o m e d i c i n e 1 2 1 ( 2 0 1 5 ) 1–13 13
[22] P. Gooch, A. Roudsari, Computerization of workflows,guidelines, and care pathways: a review of implementationchallenges for process-oriented health information systems,J. Am. Med. Inform. Assoc. 18 (2011) 738–748.
[23] K. Unertl, K.B. Johnson, N.M. Lorenz, Health informationexchange technology on the front lines of healthcare:workflow factors and patterns of use, J. Am. Med. Inform.
Assoc. 19 (2012) 392–400.[24] T. Damij, Development of a hospital information systemusing the TAD method, J. Am. Med. Inform. Assoc. 5 (1998)184–193.