Embed Size (px)
Citation preview
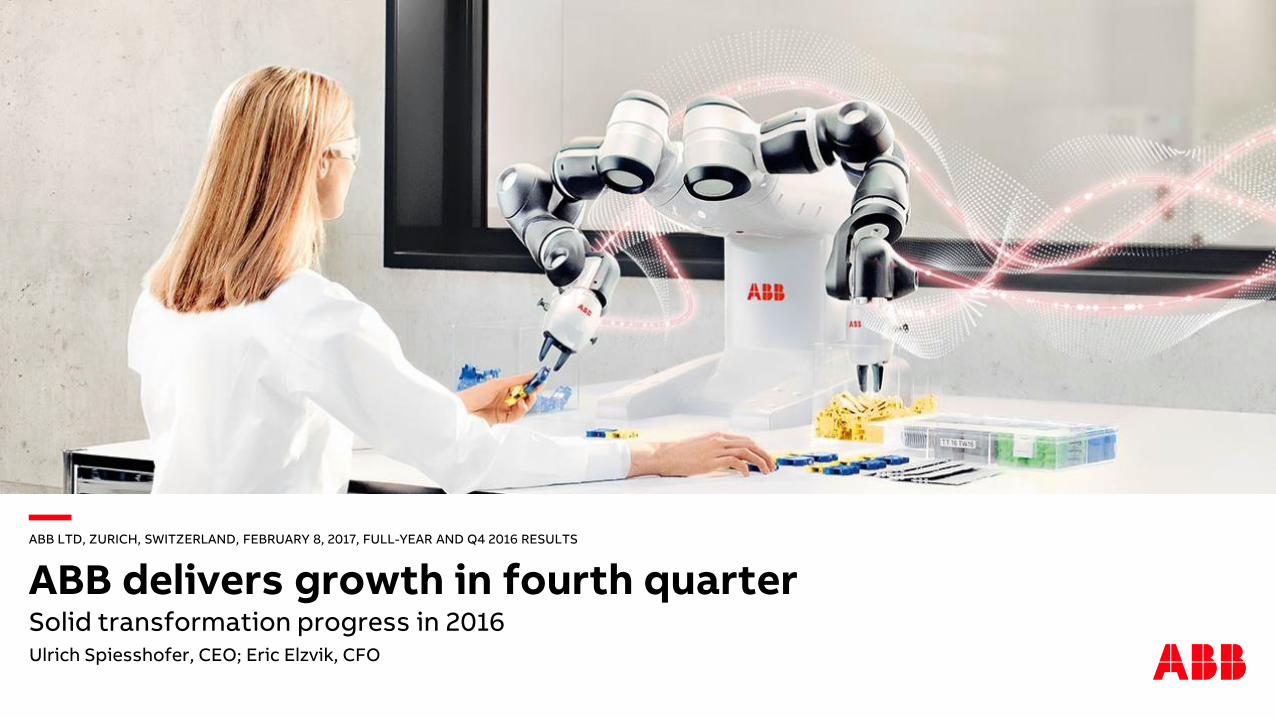
ABB LTD, ZURICH, SWITZERLAND, FEBRUARY 8, 2017, FULL-YEAR AND Q4 2016 RESULTS
ABB delivers growth in fourth quarterSolid transformation progress in 2016Ulrich Spiesshofer, CEO; Eric Elzvik, CFO
This presentation includes forward-looking information and statements including statements concerning the outlook for our businesses. These statements arebased on current expectations, estimates and projections about the factors that may affect our future performance, including global economic conditions, andthe economic conditions of the regions and industries that are major markets for ABB Ltd. These expectations, estimates and projections are generallyidentifiable by statements containing words such as “expects,” “believes,” “estimates,” “targets,” “plans,” “outlook” or similar expressions.
There are numerous risks and uncertainties, many of which are beyond our control, that could cause our actual results to differ materially from the forward-looking information and statements made in this presentation and which could affect our ability to achieve any or all of our stated targets. The importantfactors that could cause such differences include, among others:
– business risks associated with the volatile global economic environment and political conditions
– costs associated with compliance activities
– market acceptance of new products and services
– changes in governmental regulations and currency exchange rates, and
– such other factors as may be discussed from time to time in ABB Ltd’s filings with the U.S. Securities and Exchange Commission, including its Annual Reports on Form 20-F.
Although ABB Ltd believes that its expectations reflected in any such forward-looking statement are based upon reasonable assumptions, it can give noassurance that those expectations will be achieved.
This presentation contains non-GAAP measures of performance. Definitions of these measures and reconciliations between these measures and their US GAAPcounterparts can be found in the ‘Supplemental reconciliations and definitions’ section of “Financial Information” under “Quarterly results and annual reports”on our website at www.abb.com/investorrelations
February 8, 2017 Slide 2
Important notices
Q4 and full-year 2016 performance
Next Level transformation
Outlook and priorities 2017
February 8, 2017 Slide 3
Agenda
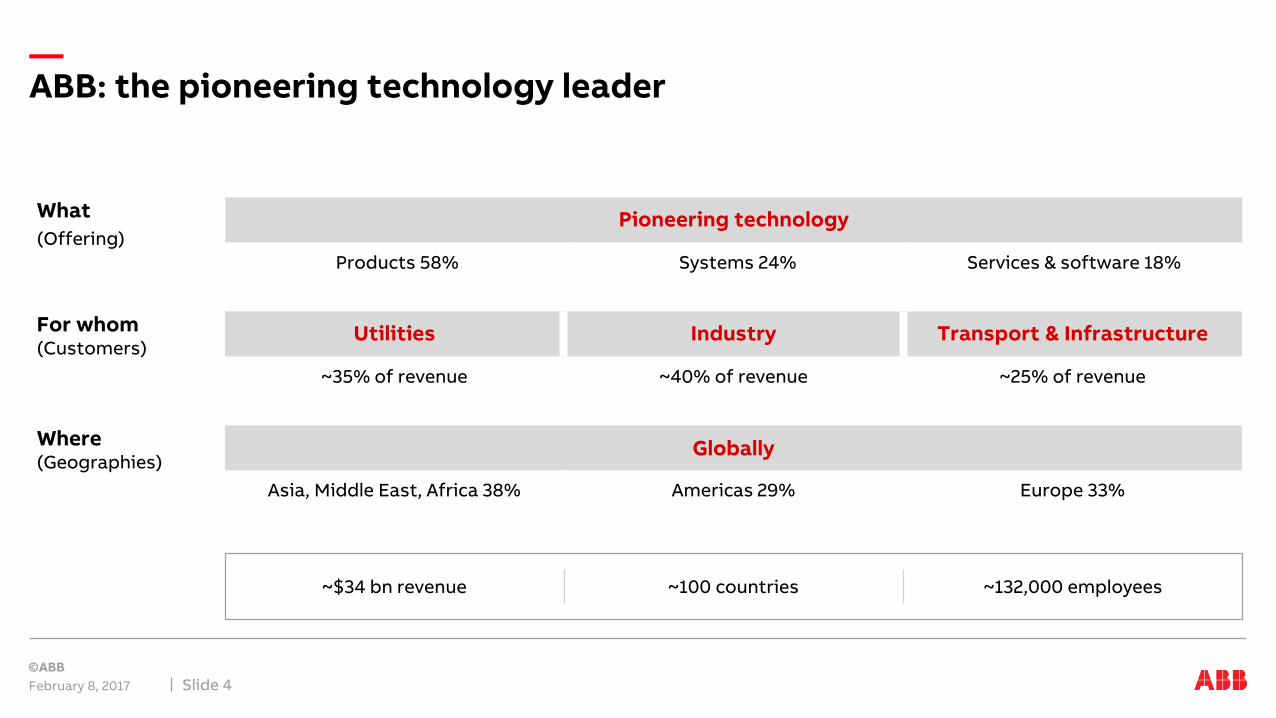
ABB: the pioneering technology leader
February 8, 2017 Slide 4
What
(Offering)
For whom (Customers)
Where (Geographies)
Utilities Industry Transport & Infrastructure
~35% of revenue ~40% of revenue ~25% of revenue
Globally
Asia, Middle East, Africa 38% Americas 29% Europe 33%
~$34 bn revenue ~100 countries ~132,000 employees
Pioneering technology
Products 58% Systems 24% Services & software 18%
February 8, 2017
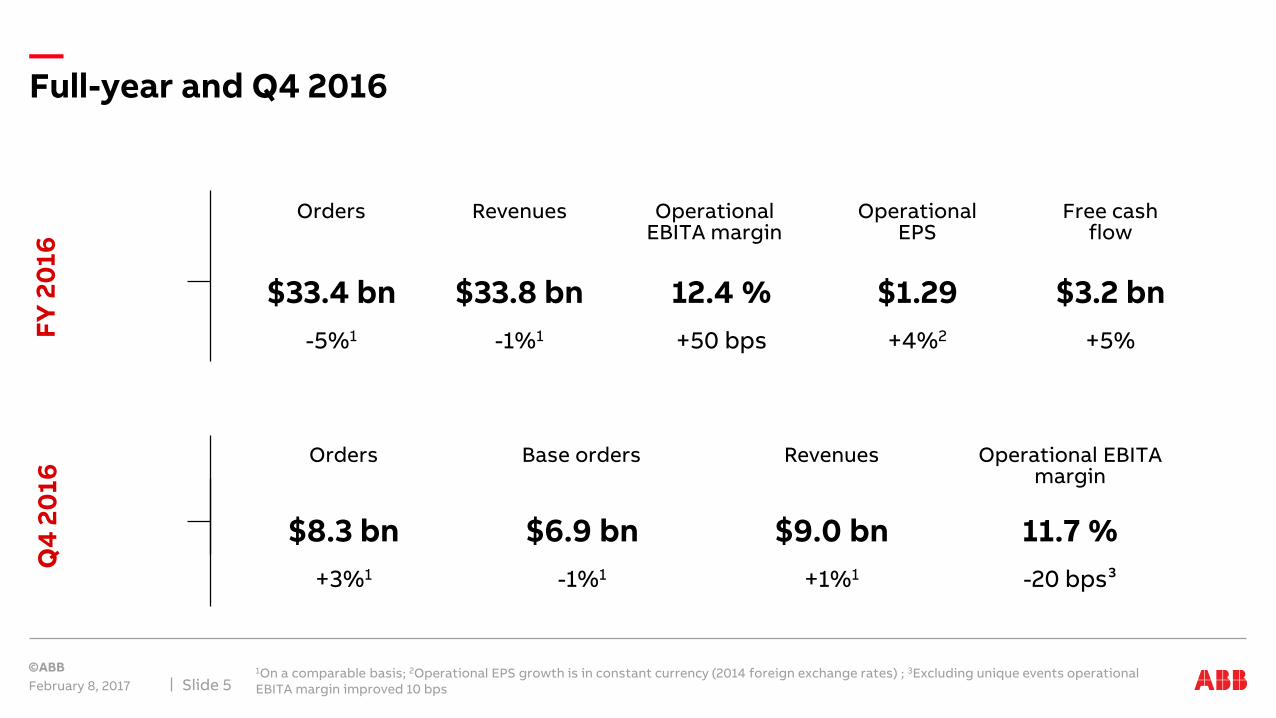
1On a comparable basis; 2Operational EPS growth is in constant currency (2014 foreign exchange rates) ; 3Excluding unique events operational EBITA margin improved 10 bpsSlide 5
Full-year and Q4 2016 F
Y 2
01
6Q
4 2
01
6
Operational EPS
$1.29
+4%2
$3.2 bn
+5%
Revenues Free cash flow
$33.4 bn
-5%1
$33.8 bn
-1%1
12.4 %
+50 bps
Operational EBITA margin
Orders
Operational EBITA margin
11.7 %
-20 bps³
Base orders Revenues
$8.3 bn
+3%1
$6.9 bn
-1%1
$9.0 bn
+1%1
Orders
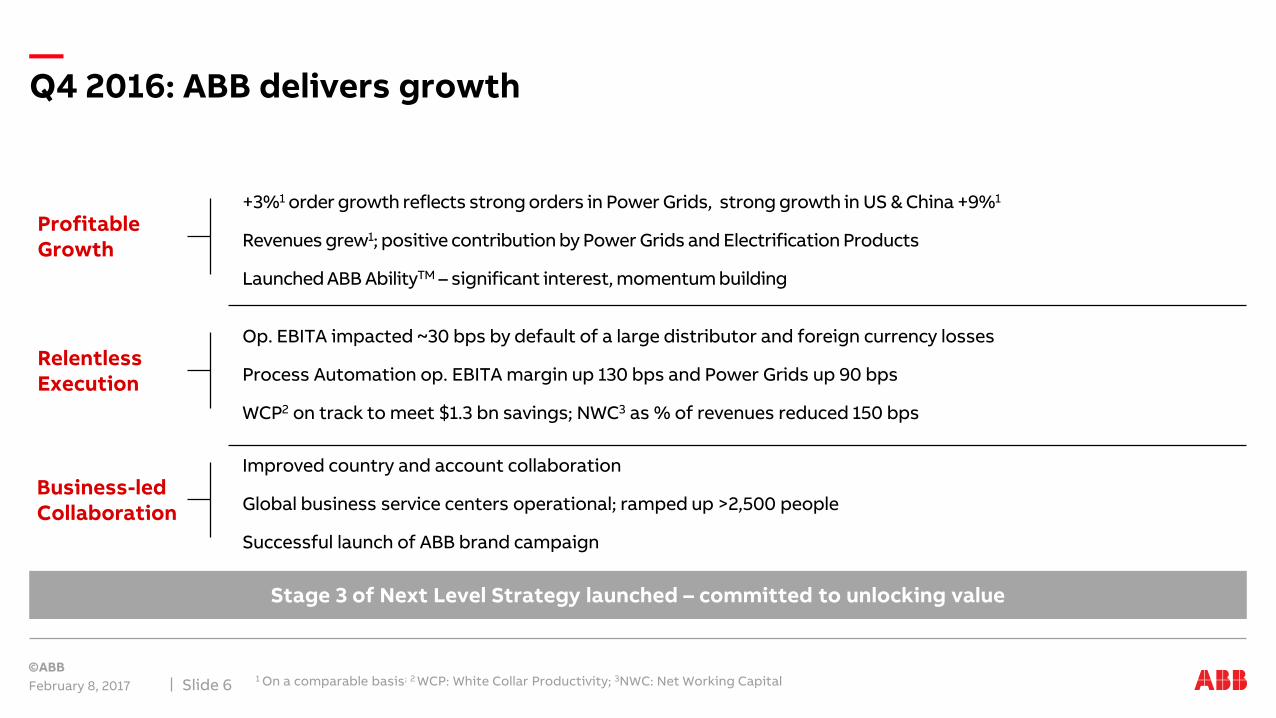
Q4 2016: ABB delivers growth
February 8, 20171 On a comparable basis; 2 WCP: White Collar Productivity; 3NWC: Net Working Capital Slide 6
Business-led Collaboration
Profitable Growth
Op. EBITA impacted ~30 bps by default of a large distributor and foreign currency losses
Process Automation op. EBITA margin up 130 bps and Power Grids up 90 bps
WCP2 on track to meet $1.3 bn savings; NWC3 as % of revenues reduced 150 bps
Stage 3 of Next Level Strategy launched – committed to unlocking value
Relentless Execution
Improved country and account collaboration
Global business service centers operational; ramped up >2,500 people
Successful launch of ABB brand campaign
+3%1 order growth reflects strong orders in Power Grids, strong growth in US & China +9%1
Revenues grew1; positive contribution by Power Grids and Electrification Products
Launched ABB AbilityTM – significant interest, momentum building
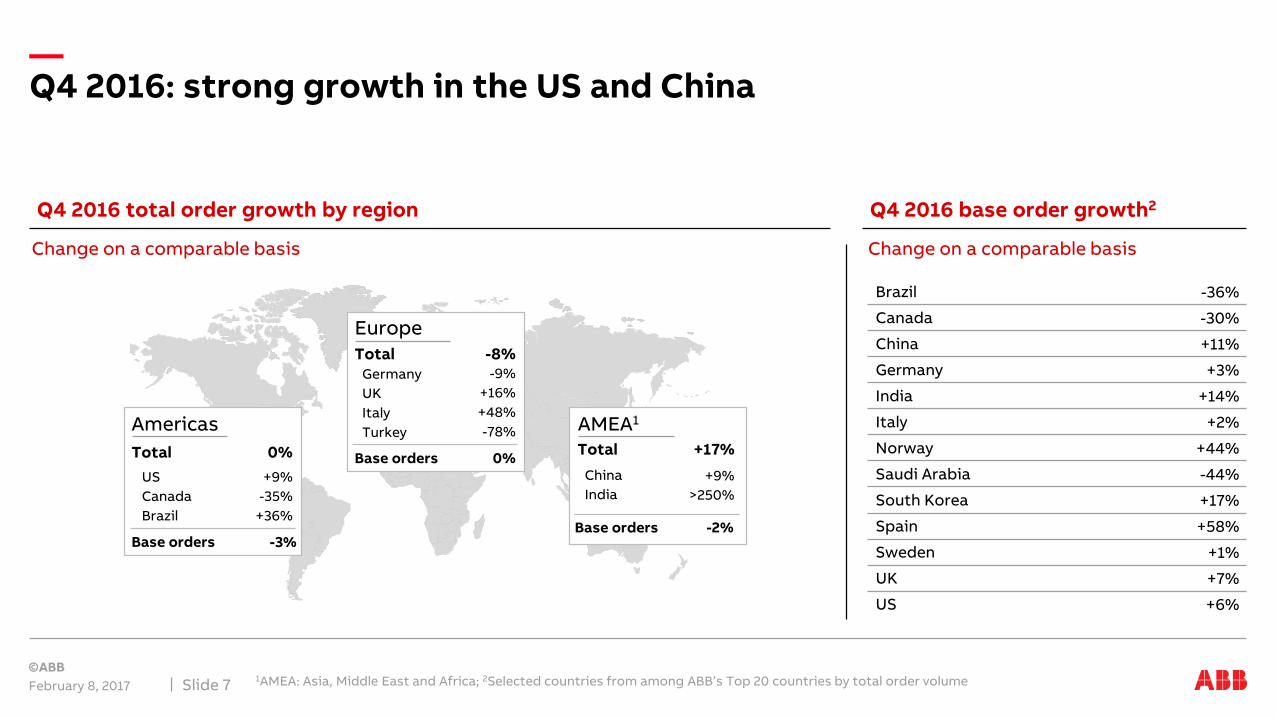
Q4 2016: strong growth in the US and China
February 8, 20171AMEA: Asia, Middle East and Africa; 2Selected countries from among ABB’s Top 20 countries by total order volume Slide 7
Q4 2016 total order growth by region Q4 2016 base order growth2
Americas
Base orders
US
Canada
Brazil
Total
+9%
-35%
+36%
-3%
0%
Europe
Base orders
Germany
UK
Italy
Turkey
Total-9%
+16%
+48%
-78%
0%
-8%
China
India
+9%
>250%
AMEA1
Base orders
Total
-2%
+17%
Change on a comparable basis Change on a comparable basis
Brazil -36%
Canada -30%
China +11%
Germany +3%
India +14%
Italy +2%
Norway +44%
Saudi Arabia -44%
South Korea +17%
Spain +58%
Sweden +1%
UK +7%
US +6%
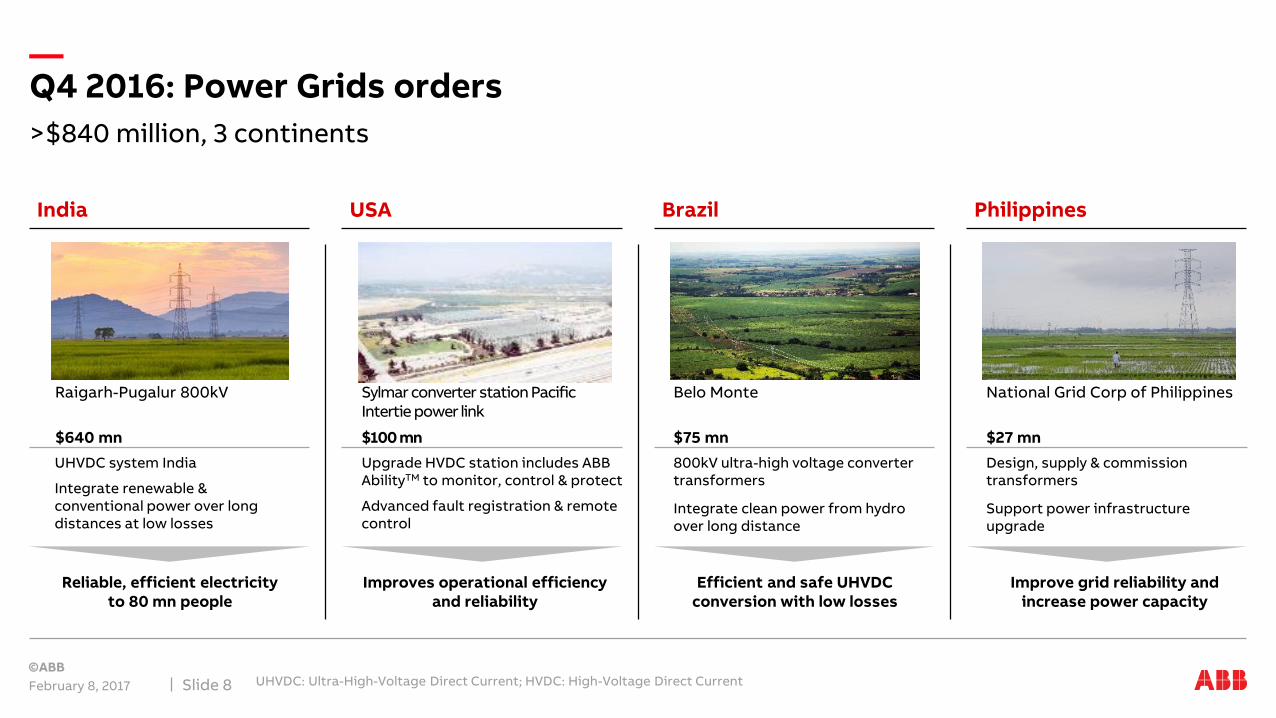
>$840 million, 3 continents
Q4 2016: Power Grids orders
February 8, 2017 UHVDC: Ultra-High-Voltage Direct Current; HVDC: High-Voltage Direct CurrentSlide 8
India USA Brazil Philippines
Raigarh-Pugalur 800kV Sylmar converter station Pacific Intertie power link
National Grid Corp of PhilippinesBelo Monte
UHVDC system India
Integrate renewable & conventional power over long distances at low losses
Upgrade HVDC station includes ABB AbilityTM to monitor, control & protect
Advanced fault registration & remote control
Design, supply & commission transformers
Support power infrastructure upgrade
800kV ultra-high voltage converter transformers
Integrate clean power from hydro over long distance
Reliable, efficient electricity to 80 mn people
Improves operational efficiency and reliability
Improve grid reliability and increase power capacity
Efficient and safe UHVDC conversion with low losses
$75 mn$640 mn $100 mn $27 mn
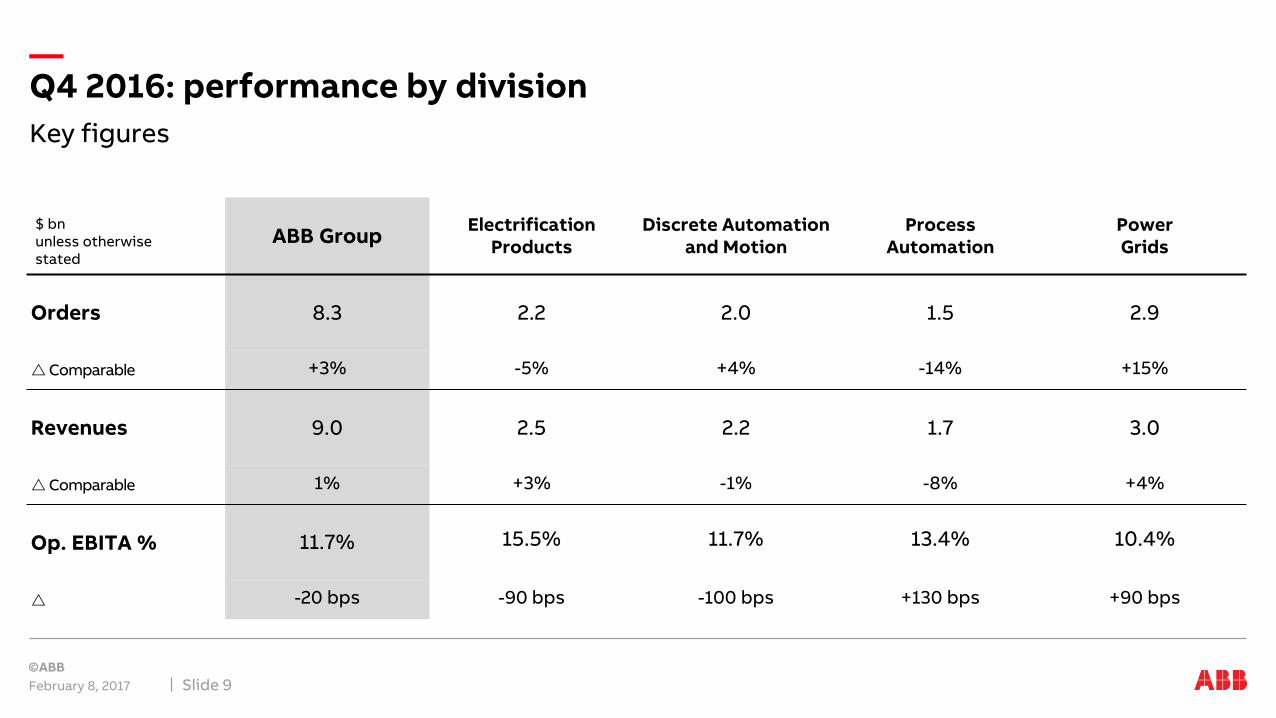
ABB GroupElectrification
ProductsDiscrete Automation
and MotionProcess
AutomationPower Grids
Orders 8.3 2.2 2.0 1.5 2.9
Comparable +3% -5% +4% -14% +15%
Revenues 9.0 2.5 2.2 1.7 3.0
Comparable 1% +3% -1% -8% +4%
Op. EBITA % 11.7% 15.5% 11.7% 13.4% 10.4%
-20 bps -90 bps -100 bps +130 bps +90 bps
Key figures
February 8, 2017 Slide 9
Q4 2016: performance by division
$ bnunless otherwise stated
February 8, 2017 Slide 10
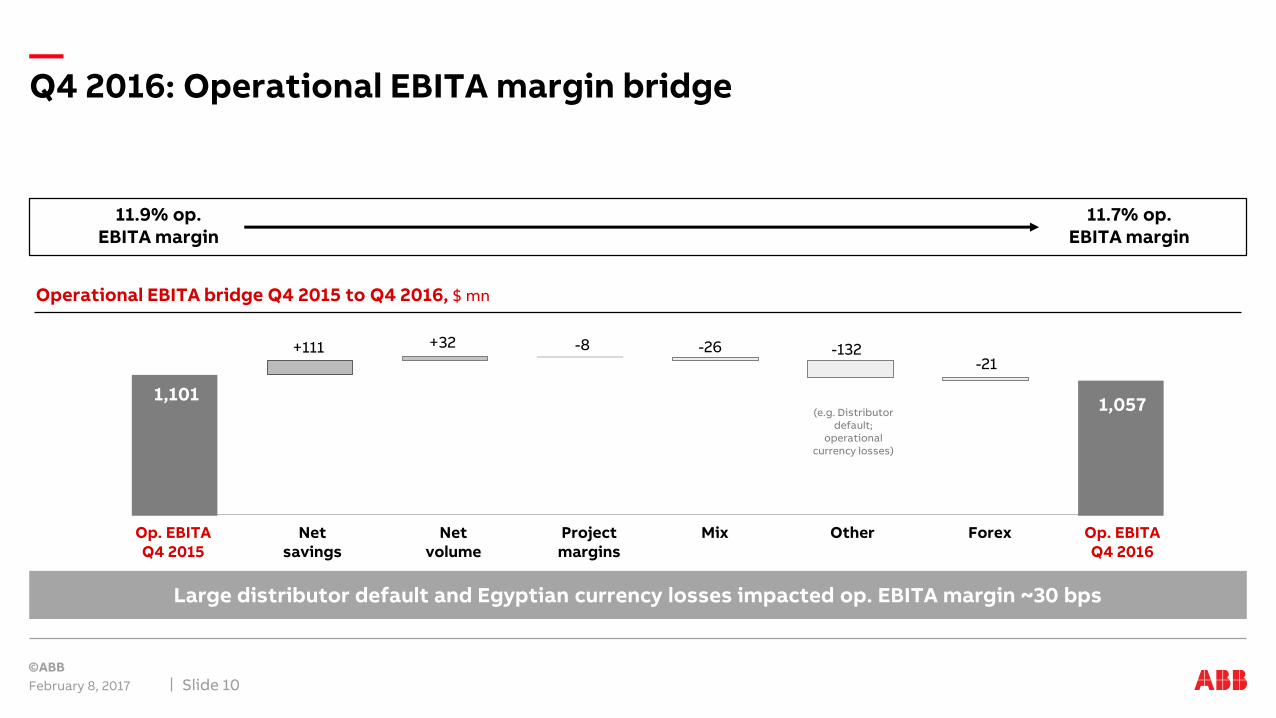
Q4 2016: Operational EBITA margin bridge
Operational EBITA bridge Q4 2015 to Q4 2016, $ mn
11.9% op. EBITA margin
11.7% op. EBITA margin
Net savings
Net volume
OtherProject margins
Mix ForexOp. EBITAQ4 2015
Op. EBITAQ4 2016
1,057
+32
-21-8 -132+111 -26
1,101(e.g. Distributor
default; operational
currency losses)
Large distributor default and Egyptian currency losses impacted op. EBITA margin ~30 bps
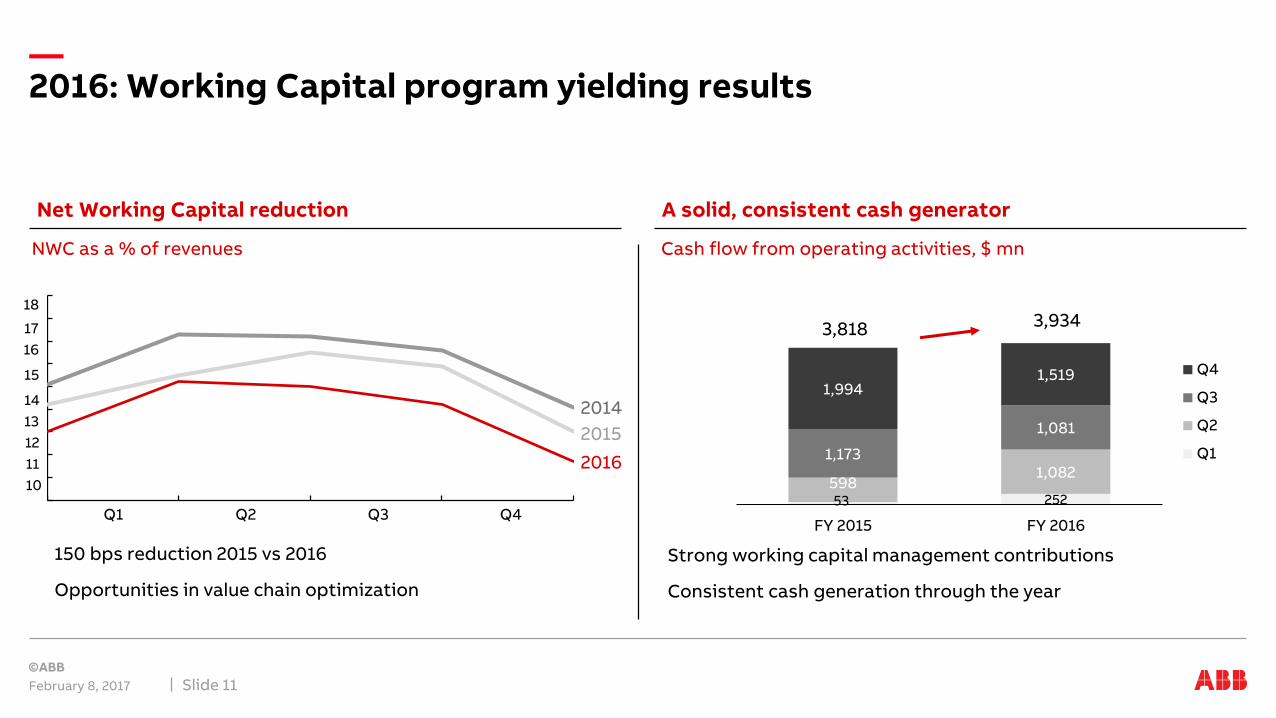
2016: Working Capital program yielding results
February 8, 2017 Slide 11
Net Working Capital reduction A solid, consistent cash generator
15
14
13
18
17
16
10
11
12
Q2 Q3 Q4Q1
150 bps reduction 2015 vs 2016
Opportunities in value chain optimization
NWC as a % of revenues
53 252598
1,0821,173
1,081
1,9941,519
0
500
1000
1500
2000
2500
3000
3500
4000
4500
FY 2015 FY 2016
Q4
Q3
Q2
Q1
Strong working capital management contributions
Consistent cash generation through the year
Cash flow from operating activities, $ mn
3,9343,818
2014
2015
2016
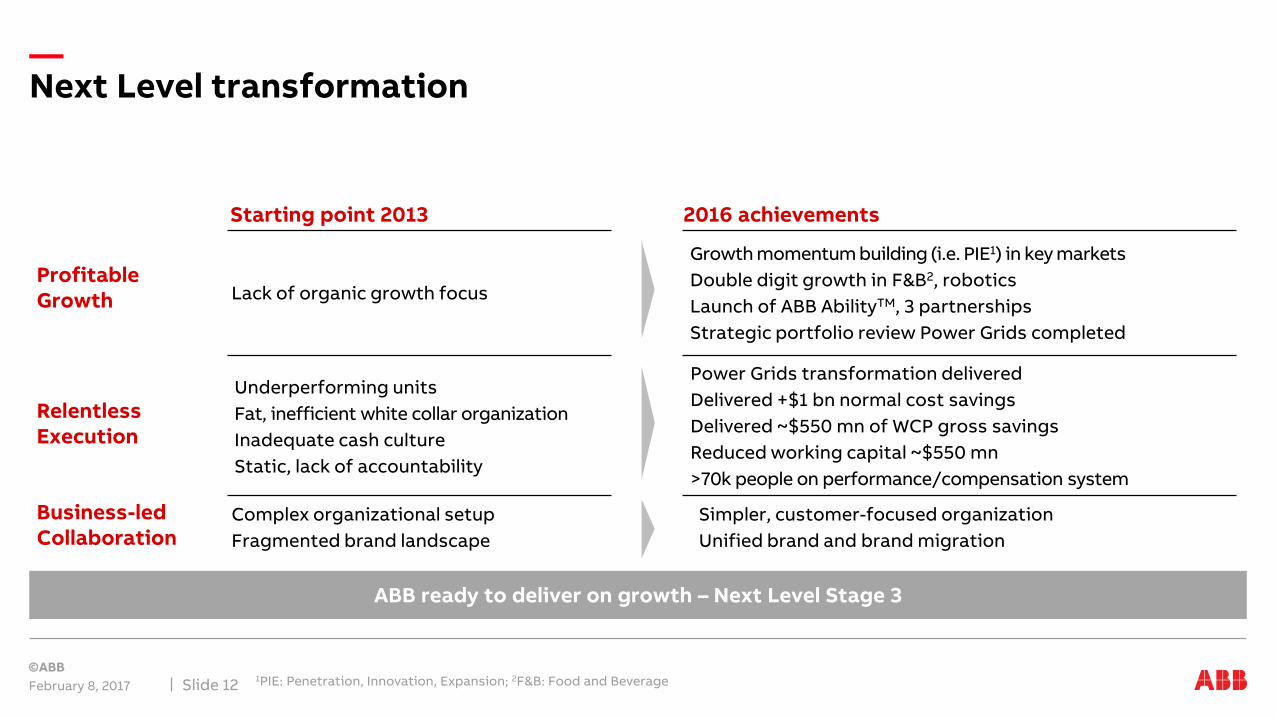
Next Level transformation
February 8, 20171PIE: Penetration, Innovation, Expansion; 2F&B: Food and BeverageSlide 12
ABB ready to deliver on growth – Next Level Stage 3
Growth momentum building (i.e. PIE1) in key markets
Double digit growth in F&B2, robotics
Launch of ABB AbilityTM, 3 partnerships
Strategic portfolio review Power Grids completed
Power Grids transformation delivered
Delivered +$1 bn normal cost savings
Delivered ~$550 mn of WCP gross savings
Reduced working capital ~$550 mn
>70k people on performance/compensation system
Simpler, customer-focused organization
Unified brand and brand migration
Lack of organic growth focus
Underperforming units
Fat, inefficient white collar organization
Inadequate cash culture
Static, lack of accountability
Complex organizational setup
Fragmented brand landscape
Starting point 2013 2016 achievements
Profitable Growth
Relentless Execution
Business-led Collaboration
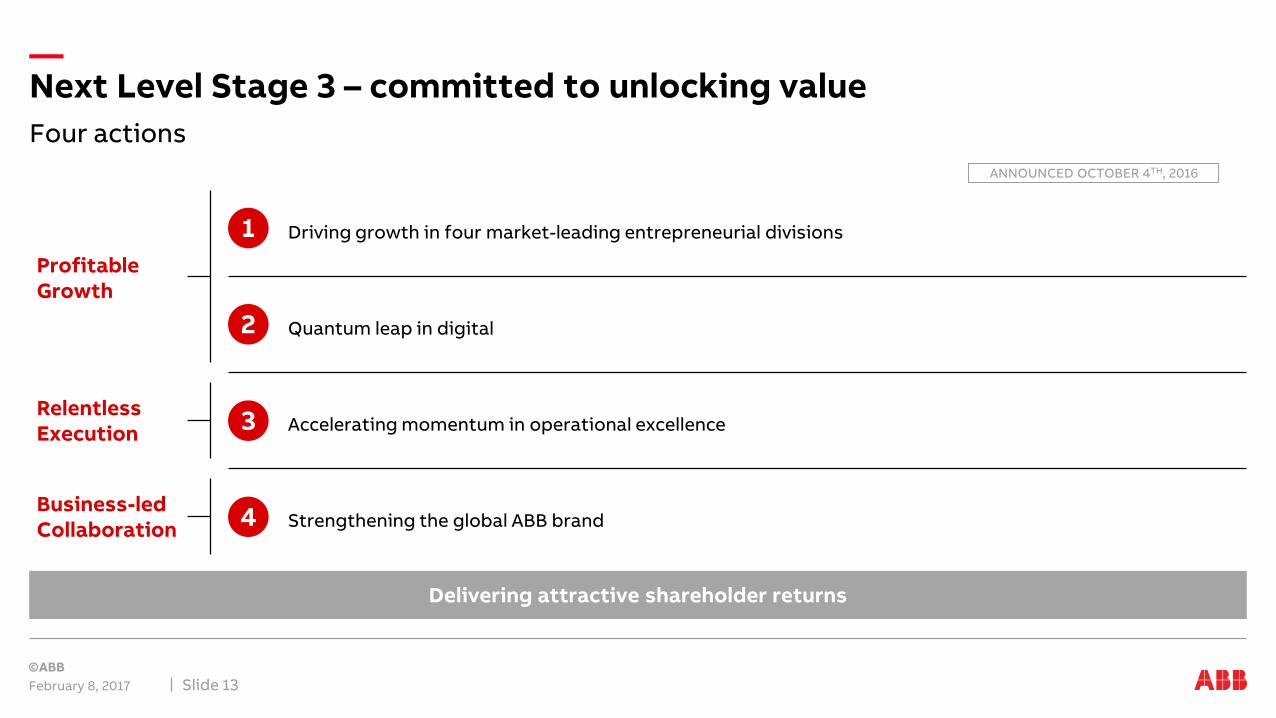
Four actions
Next Level Stage 3 – committed to unlocking value
February 8, 2017 Slide 13
Business-led Collaboration
2
4
Profitable Growth
Accelerating momentum in operational excellence
1
Delivering attractive shareholder returns
Relentless Execution
3
Strengthening the global ABB brand
Driving growth in four market-leading entrepreneurial divisions
Quantum leap in digital
ANNOUNCED OCTOBER 4TH, 2016
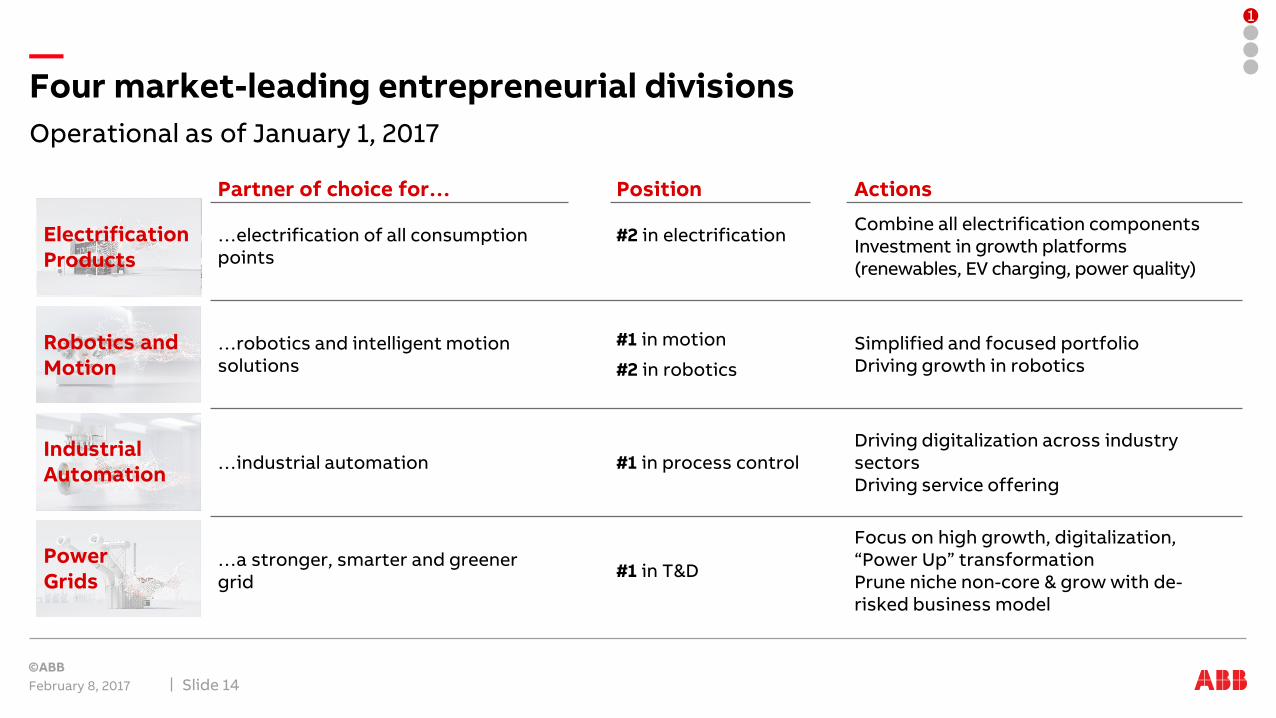
Operational as of January 1, 2017
February 8, 2017 Slide 14
Four market-leading entrepreneurial divisions
1
…robotics and intelligent motion solutions
…industrial automation
…a stronger, smarter and greener grid
#2 in electrification
#1 in motion
#2 in robotics
#1 in process control
#1 in T&D
Position Actions
Combine all electrification components Investment in growth platforms (renewables, EV charging, power quality)
Simplified and focused portfolio Driving growth in robotics
Driving digitalization across industry sectorsDriving service offering
Focus on high growth, digitalization, “Power Up” transformationPrune niche non-core & grow with de-risked business model
…electrification of all consumption points
Partner of choice for…
Electrification Products
Robotics and Motion
Industrial Automation
Power Grids

12%
February 8, 2017 New target margin range of 10-14% effective in 2018Slide 15
Power Grids shift from “Step Change” to “Power Up” transformation
Operational EBITA margin, %
Significant value creation potential, mainly driven by self-help
2020Growth2015 FY
2014 FY
2016 FY
Winning portfolio, digital & business models
World-classexecution
Q12016
Q22016
Q32016
Q42016
“Step Change” “Power Up”
14%
10%8%
1
4.8
7.67.99.3
9.0 9.39.5 10.4
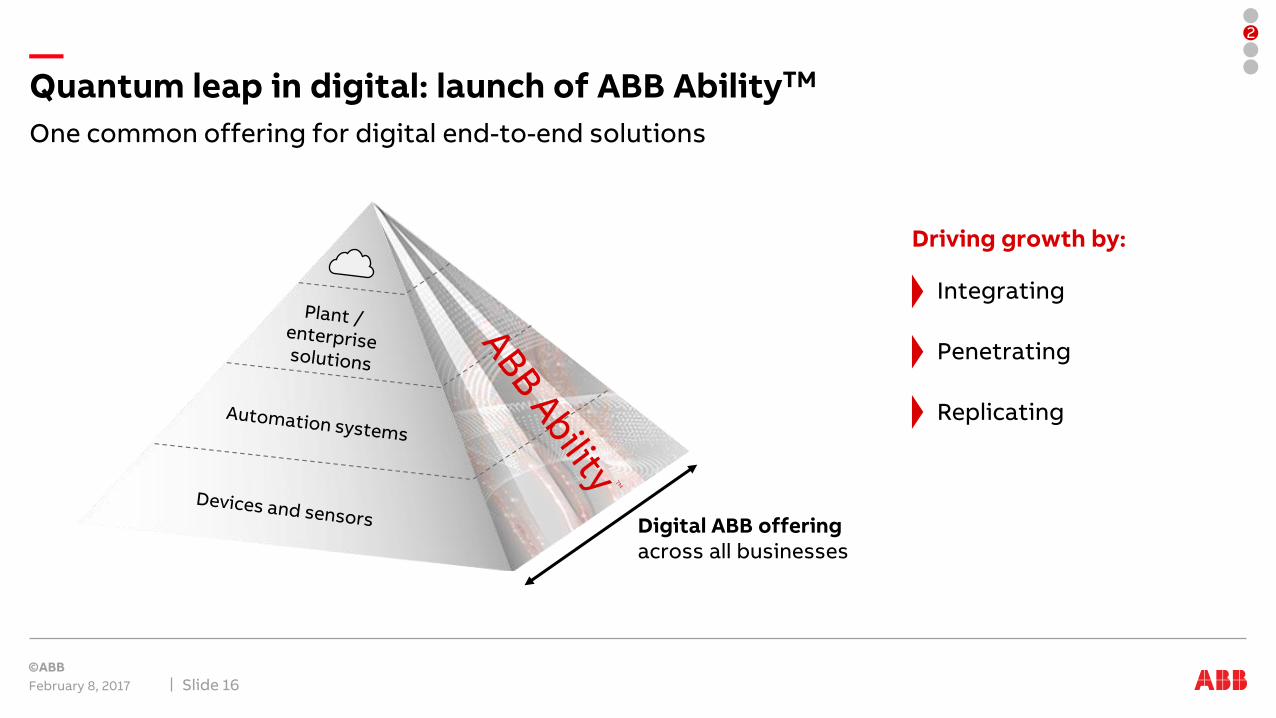
One common offering for digital end-to-end solutions
February 8, 2017 Slide 16
Quantum leap in digital: launch of ABB AbilityTM
Digital ABB offering across all businesses
2
Driving growth by:
Integrating
Penetrating
Replicating
February 8, 2017 Slide 17
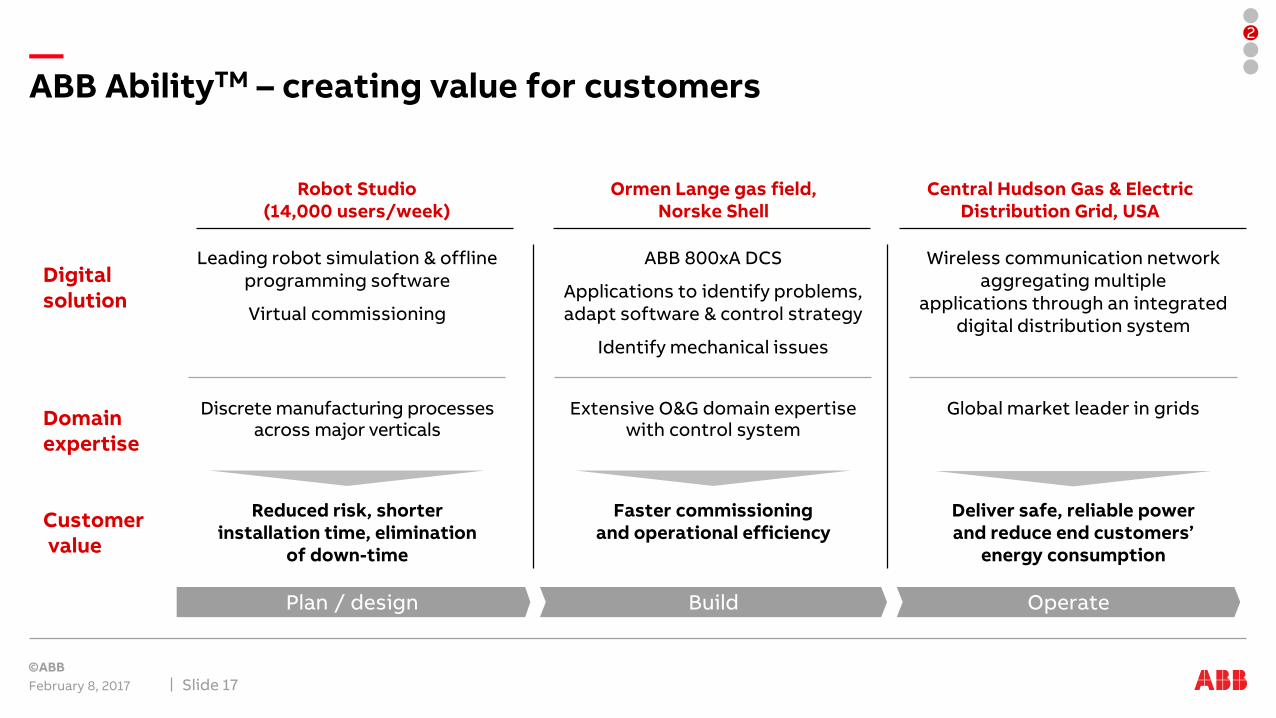
ABB AbilityTM – creating value for customers
2
Leading robot simulation & offline programming software
Virtual commissioning
Discrete manufacturing processes across major verticals
Reduced risk, shorter installation time, elimination
of down-time
ABB 800xA DCS
Applications to identify problems, adapt software & control strategy
Identify mechanical issues
Extensive O&G domain expertise with control system
Faster commissioning and operational efficiency
Wireless communication network aggregating multiple
applications through an integrated digital distribution system
Global market leader in grids
Deliver safe, reliable power and reduce end customers’
energy consumption
Robot Studio (14,000 users/week)
Ormen Lange gas field, Norske Shell
Central Hudson Gas & ElectricDistribution Grid, USA
Digital solution
Domain expertise
Customervalue
Plan / design Build Operate
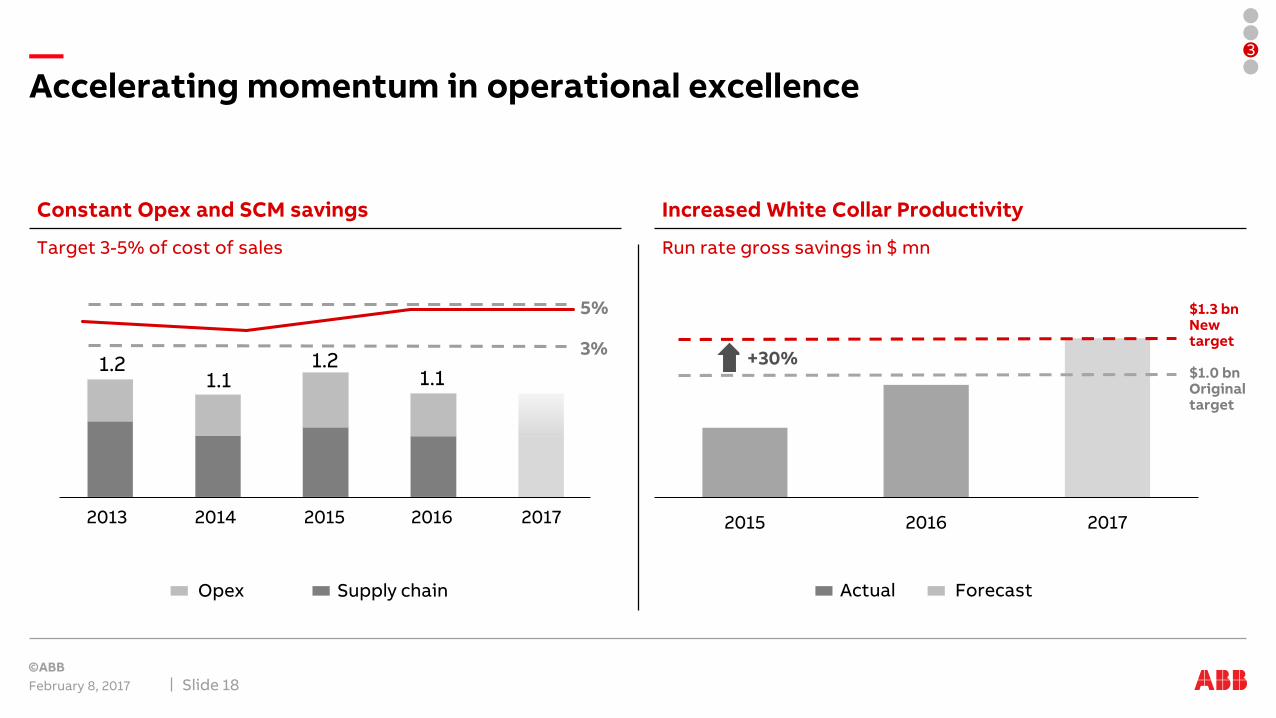
Accelerating momentum in operational excellence
February 8, 2017 Slide 18
Constant Opex and SCM savings Increased White Collar Productivity
Target 3-5% of cost of sales
1.2
Supply chainOpex
1.21.1
2013 2014 2015 2016
1.1
Run rate gross savings in $ mn
2015 2016 2017
Actual Forecast
3%
5%
3
$1.0 bnOriginal target
$1.3 bnNew target
+30%+30%
2017
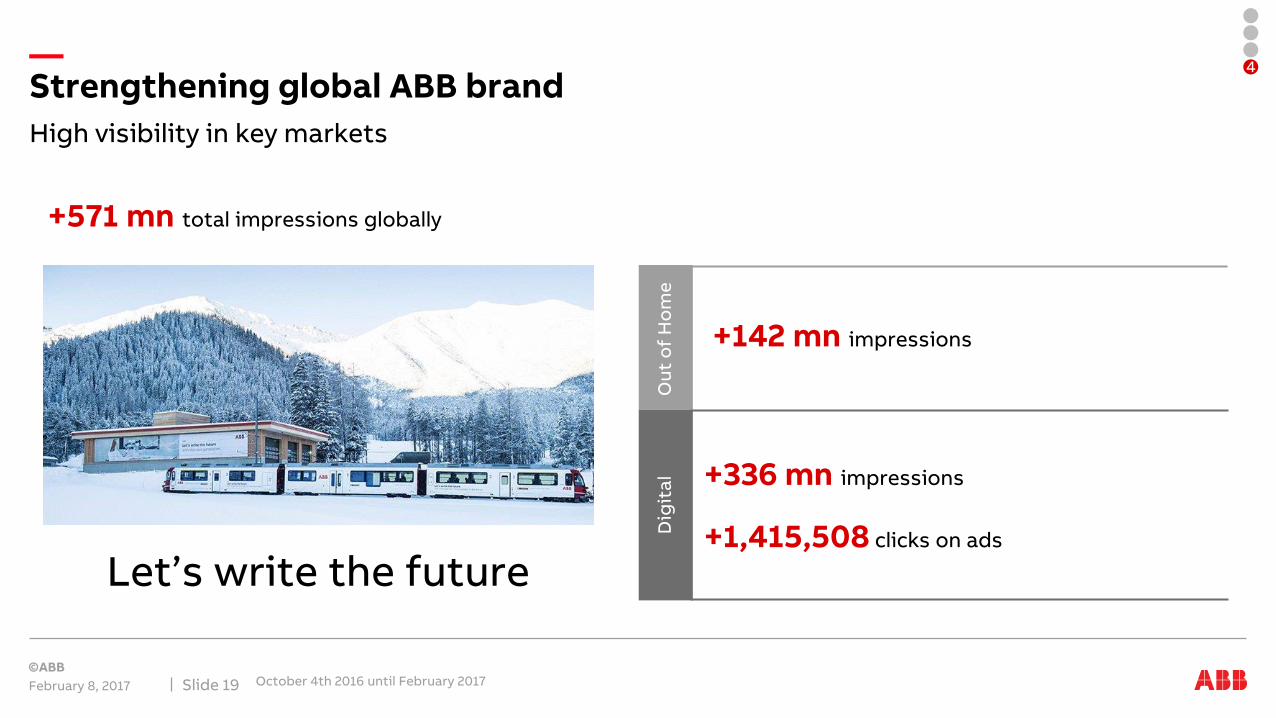
High visibility in key markets
February 8, 2017 October 4th 2016 until February 2017Slide 19
Strengthening global ABB brand 4
+571 mn total impressions globally
+142 mn impressions
+336 mn impressions
+1,415,508 clicks on ads
Dig
ita
lO
ut
of
Ho
me
Let’s write the future
15
25
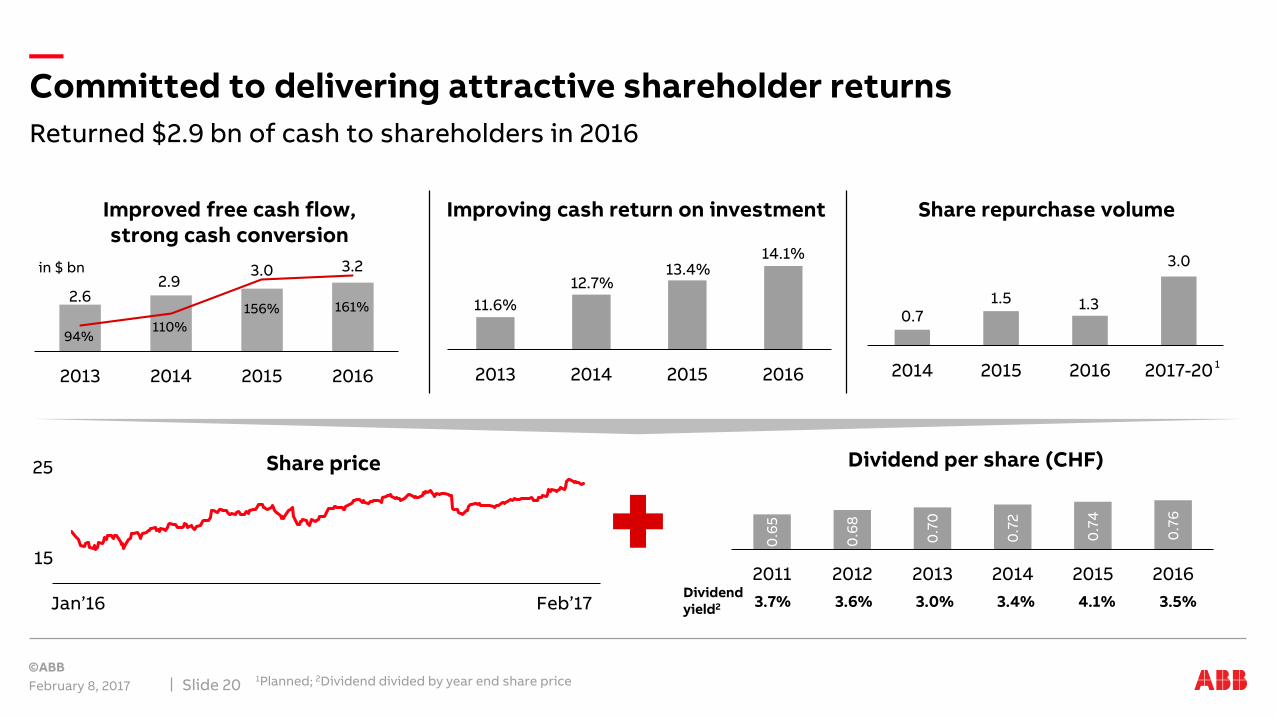
Returned $2.9 bn of cash to shareholders in 2016
February 8, 20171Planned; 2Dividend divided by year end share priceSlide 20
Committed to delivering attractive shareholder returns
in $ bn
Improved free cash flow, strong cash conversion
Improving cash return on investment Share repurchase volume
2.62.9
94%110%
156% 161%
2013 2014 2015 2016
3.0 3.2
11.6%
12.7%13.4%
14.1%
2013 2014 2015 2016
0.71.5 1.3
3.0
2014 2015 2016 2017-20
Dividend per share (CHF)
Dividend yield2 3.7% 3.6% 3.0% 3.4% 4.1%
2011 2012 2013 2014 2015 2016
0.7
4
0.7
2
0.7
0
0.6
8
0.6
5
0.7
6
3.5%Jan’16 Feb’17
Share price
1
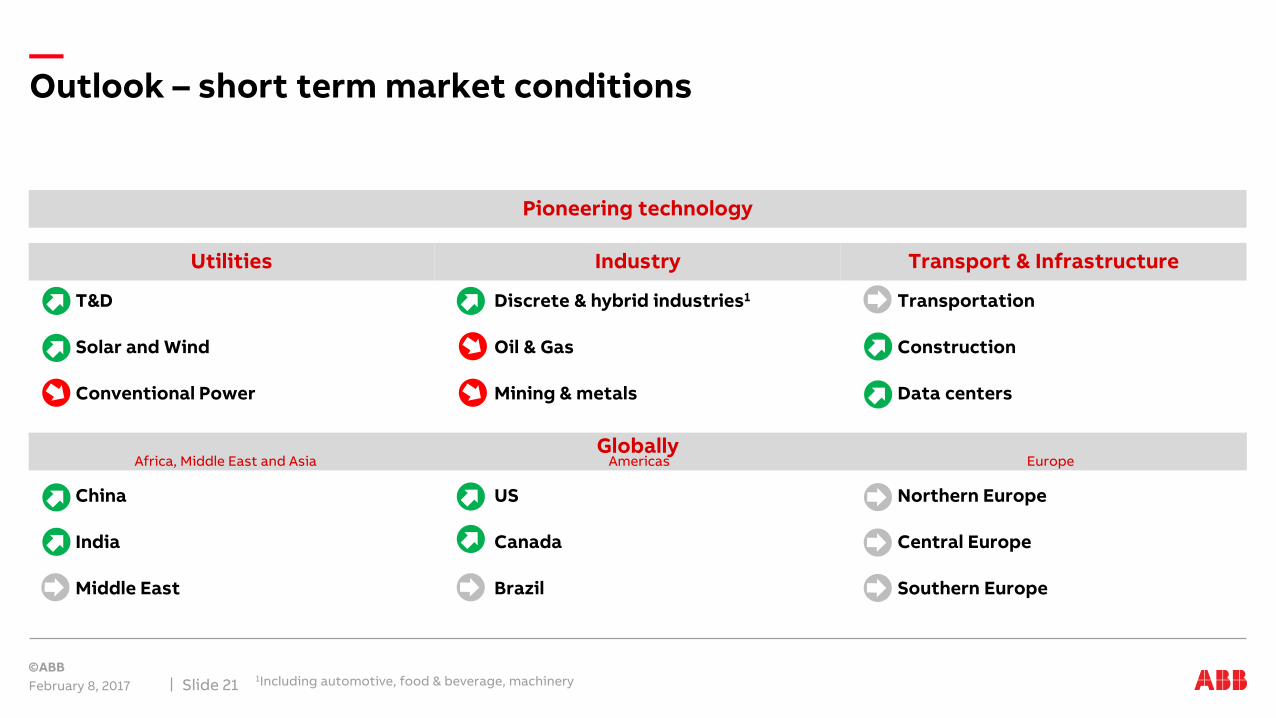
February 8, 20171Including automotive, food & beverage, machinerySlide 21
Outlook – short term market conditions
Utilities Industry Transport & Infrastructure
Globally
Pioneering technology
T&D
Solar and Wind
Conventional Power
Discrete & hybrid industries1
Oil & Gas
Mining & metals
Transportation
Construction
Data centers
China
India
Middle East
US
Canada
Brazil
Northern Europe
Central Europe
Southern Europe
Africa, Middle East and Asia Americas Europe
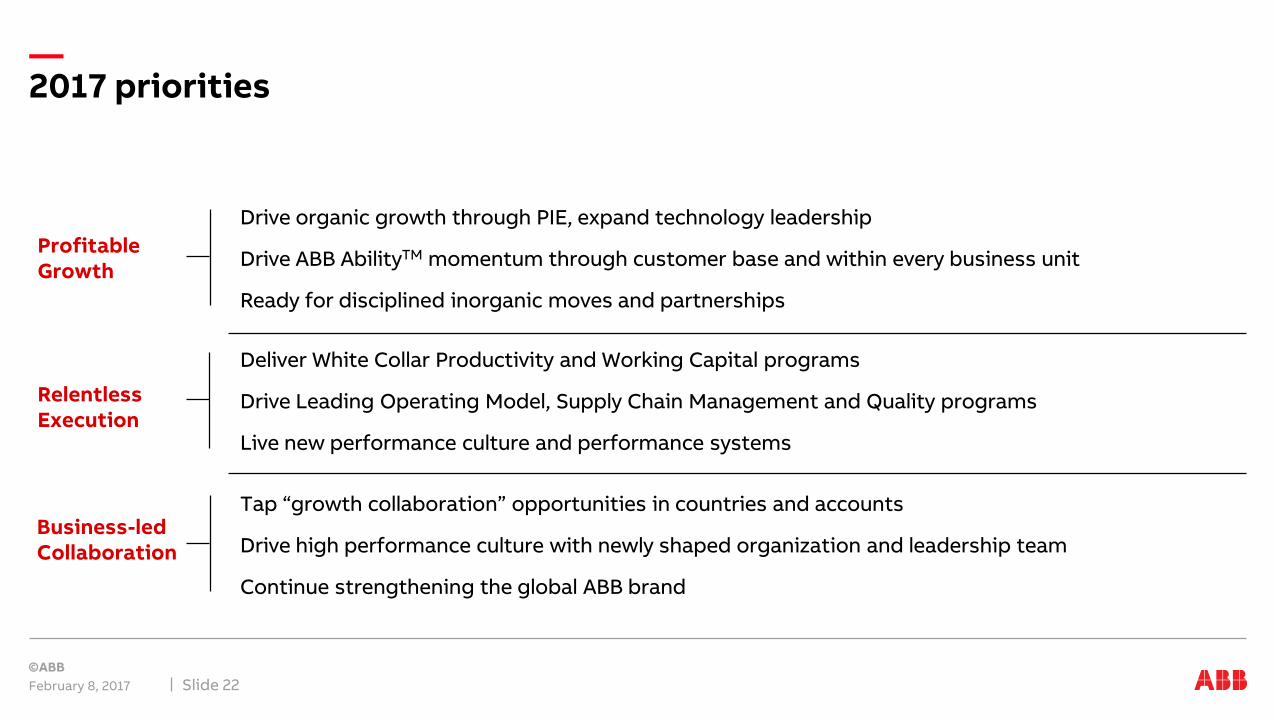
2017 priorities
February 8, 2017 Slide 22
Business-led Collaboration
Profitable Growth
Deliver White Collar Productivity and Working Capital programs
Drive Leading Operating Model, Supply Chain Management and Quality programs
Live new performance culture and performance systems
Relentless Execution
Tap “growth collaboration” opportunities in countries and accounts
Drive high performance culture with newly shaped organization and leadership team
Continue strengthening the global ABB brand
Drive organic growth through PIE, expand technology leadership
Drive ABB AbilityTM momentum through customer base and within every business unit
Ready for disciplined inorganic moves and partnerships
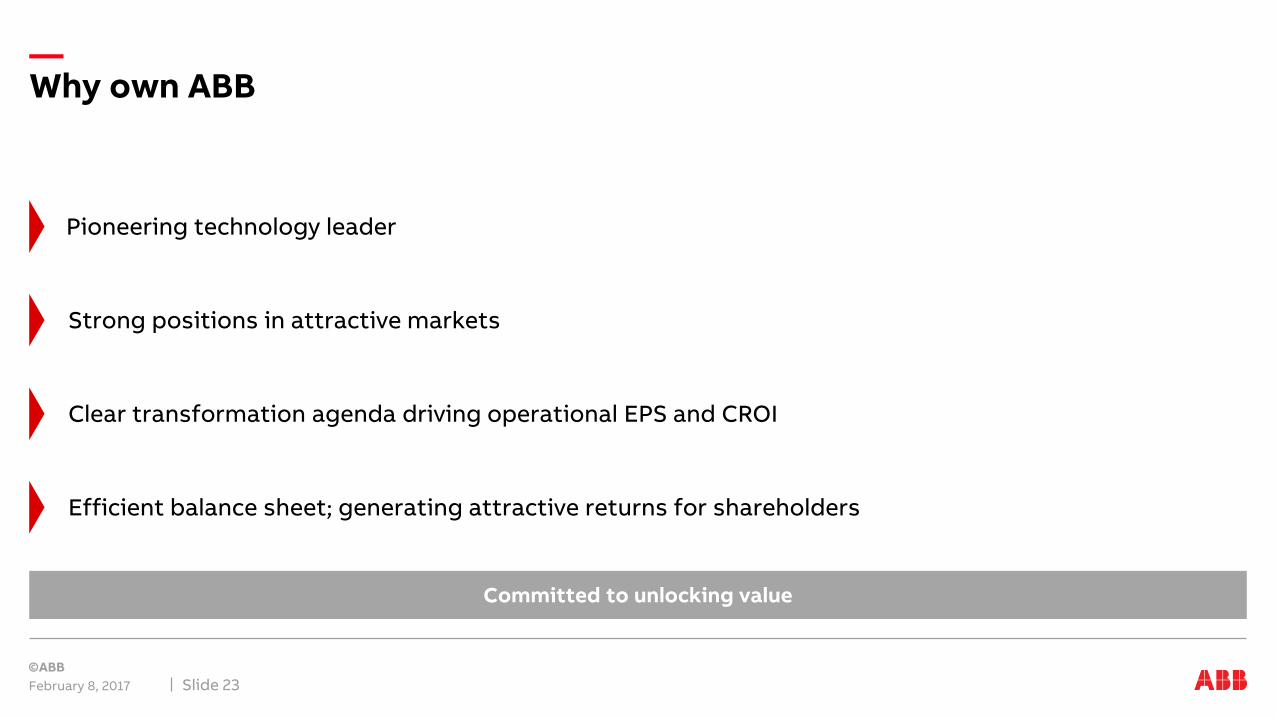
Why own ABB
February 8, 2017 Slide 23
Committed to unlocking value
Pioneering technology leader
Strong positions in attractive markets
Efficient balance sheet; generating attractive returns for shareholders
Clear transformation agenda driving operational EPS and CROI

Let’s write the future