Embed Size (px)
Citation preview
ABB LTD, ZURICH, SWITZERLAND, APRIL 20, 2017, Q1 2017 RESULTS
ABB continues its transformationUlrich Spiesshofer, CEO; Timo Ihamuotila, CFO
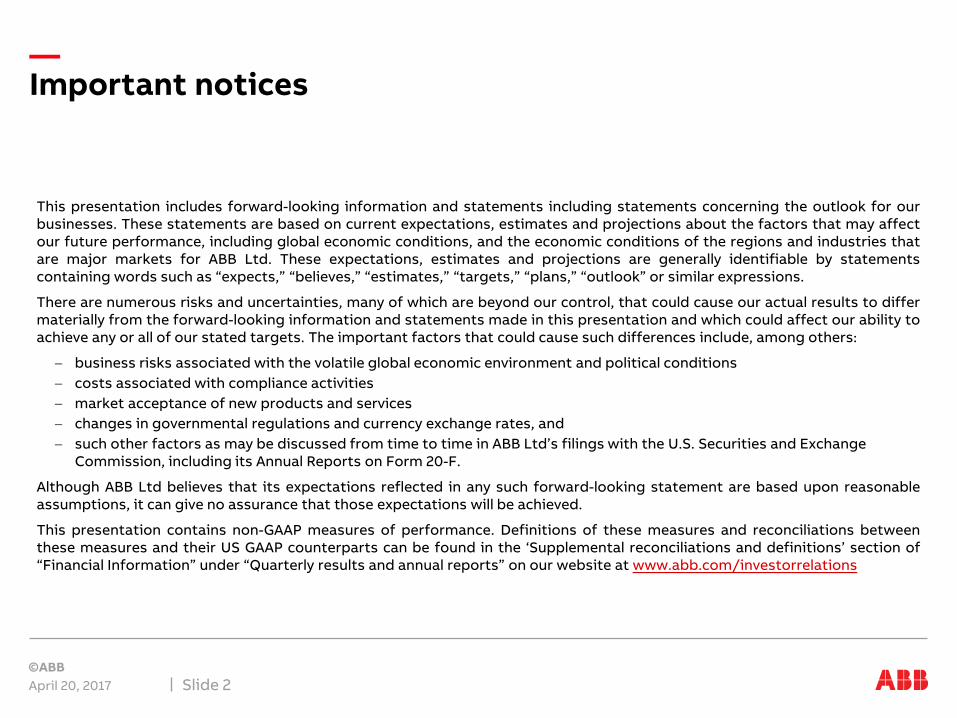
This presentation includes forward-looking information and statements including statements concerning the outlook for ourbusinesses. These statements are based on current expectations, estimates and projections about the factors that may affectour future performance, including global economic conditions, and the economic conditions of the regions and industries thatare major markets for ABB Ltd. These expectations, estimates and projections are generally identifiable by statementscontaining words such as “expects,” “believes,” “estimates,” “targets,” “plans,” “outlook” or similar expressions.
There are numerous risks and uncertainties, many of which are beyond our control, that could cause our actual results to differmaterially from the forward-looking information and statements made in this presentation and which could affect our ability toachieve any or all of our stated targets. The important factors that could cause such differences include, among others:
– business risks associated with the volatile global economic environment and political conditions– costs associated with compliance activities– market acceptance of new products and services– changes in governmental regulations and currency exchange rates, and– such other factors as may be discussed from time to time in ABB Ltd’s filings with the U.S. Securities and Exchange
Commission, including its Annual Reports on Form 20-F.
Although ABB Ltd believes that its expectations reflected in any such forward-looking statement are based upon reasonableassumptions, it can give no assurance that those expectations will be achieved.
This presentation contains non-GAAP measures of performance. Definitions of these measures and reconciliations betweenthese measures and their US GAAP counterparts can be found in the ‘Supplemental reconciliations and definitions’ section of“Financial Information” under “Quarterly results and annual reports” on our website at www.abb.com/investorrelations
Important notices
April 20, 2017 Slide 2
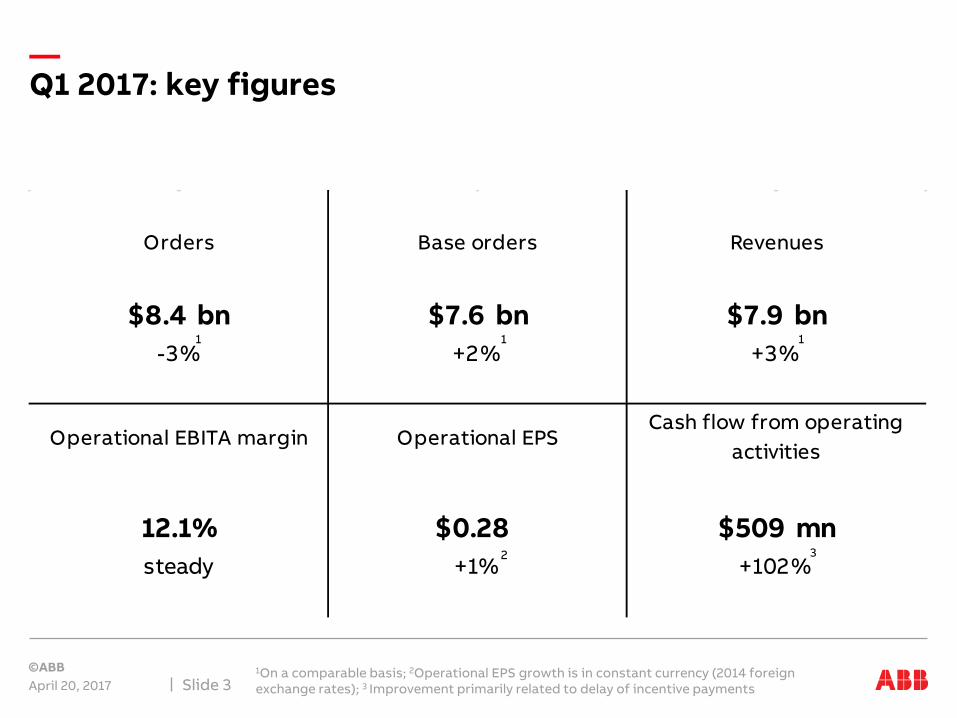
+1% +102%
$509 mn12.1% $0.28steady
Operational EBITA margin Operational EPSCash flow from operating
activities
$8.4 bn $7.6 bn $7.9 bn-3% +2% +3%
Orders Base orders Revenues
Q1 2017: key figures
April 20, 20171On a comparable basis; 2Operational EPS growth is in constant currency (2014 foreign exchange rates); 3 Improvement primarily related to delay of incentive payments Slide 3
1
2
11
3
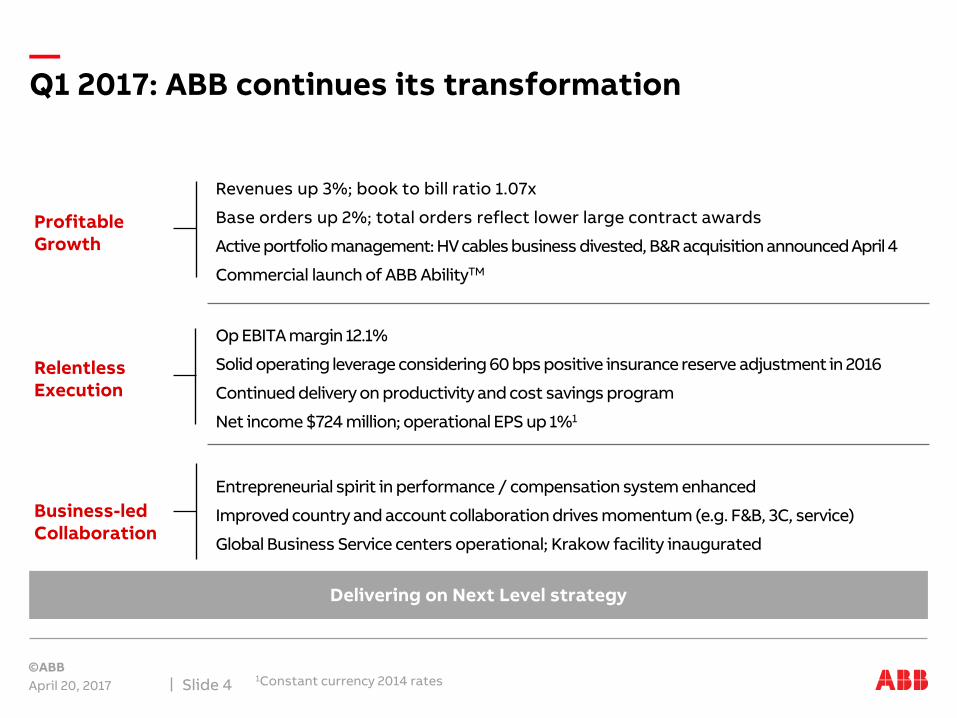
Q1 2017: ABB continues its transformation
April 20, 20171Constant currency 2014 ratesSlide 4
Profitable Growth
Relentless Execution
Business-led Collaboration
Revenues up 3%; book to bill ratio 1.07x
Base orders up 2%; total orders reflect lower large contract awards
Active portfolio management: HV cables business divested, B&R acquisition announced April 4
Commercial launch of ABB AbilityTM
Op EBITA margin 12.1%
Solid operating leverage considering 60 bps positive insurance reserve adjustment in 2016
Continued delivery on productivity and cost savings program
Net income $724 million; operational EPS up 1%1
Entrepreneurial spirit in performance / compensation system enhanced
Improved country and account collaboration drives momentum (e.g. F&B, 3C, service)
Global Business Service centers operational; Krakow facility inaugurated
Delivering on Next Level strategy
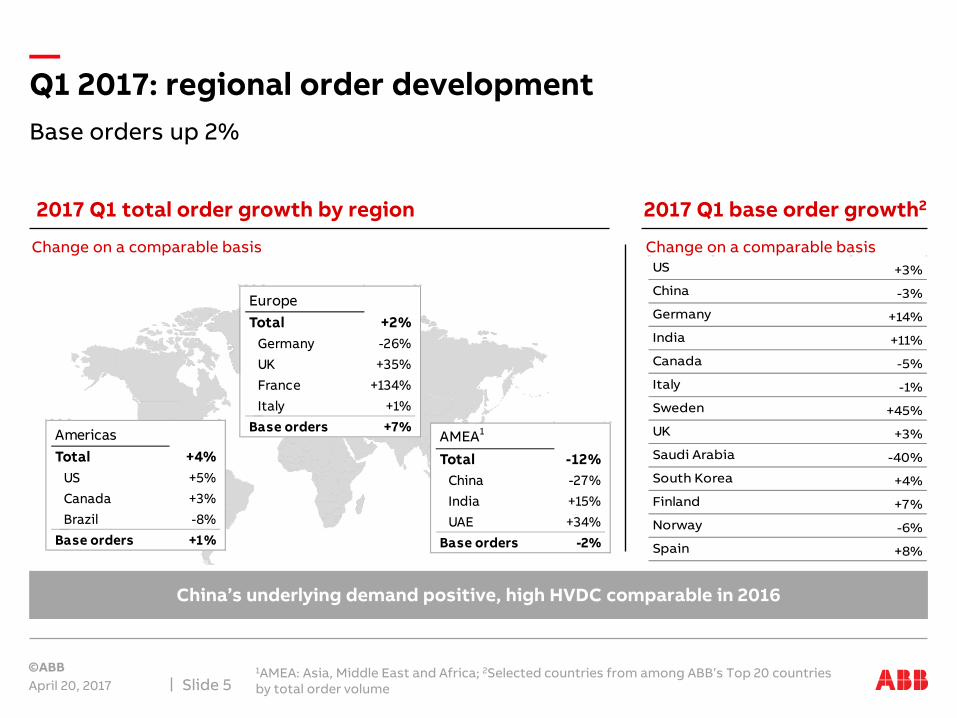
Base orders up 2%
Q1 2017: regional order development
April 20, 2017Middle Africa; 2Selected countries from among ABB’s Top 20 countries
by total order volume 1AMEA: Asia, East and
Slide 5
2017 Q1 total order growth by region 2017 Q1 base order growth2
Change on a comparable basis Change on a comparable basis
China’s underlying demand positive, high HVDC comparable in 2016
AmericasTotal +4%
US +5%Canada +3%Brazil -8%
Base orders +1%
EuropeTotal +2%
Germany -26%UK +35%France +134%Italy +1%
Base orders +7%AMEA1
Total -12%China -27%India +15%UAE +34%
Base orders -2%
US +3%
China -3%
Germany +14%
India +11%
Canada -5%
Italy -1%
Sweden +45%
UK +3%
Saudi Arabia -40%
South Korea +4%
Finland +7%
Norway -6%
Spain +8%
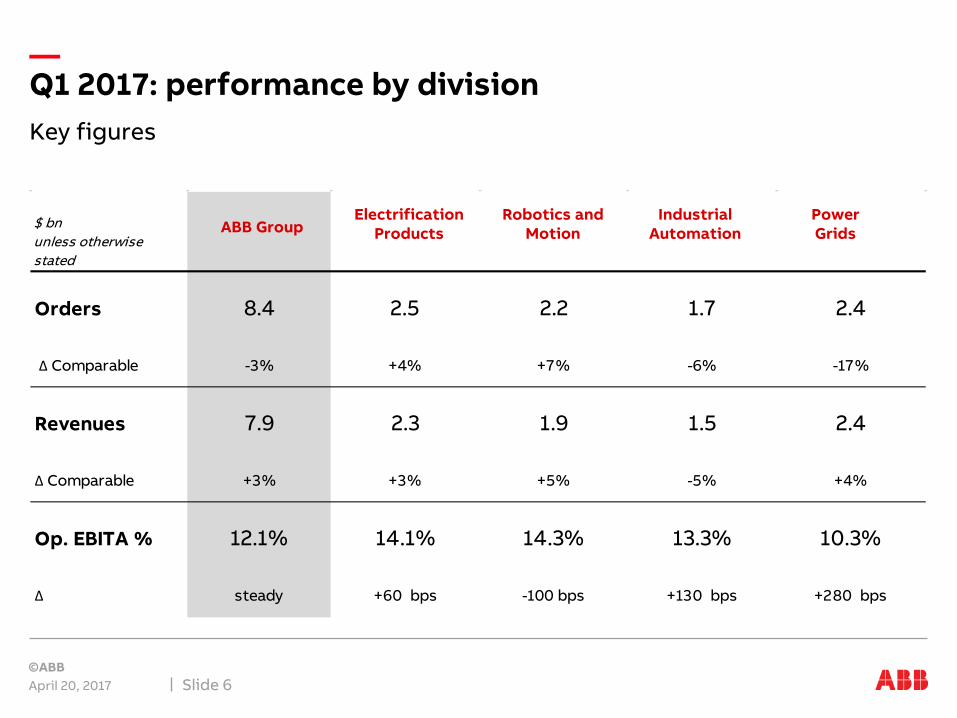
$ bn unless otherwise stated
ABB GroupElectrification
ProductsRobotics and
MotionIndustrial
AutomationPower Grids
Orders 8.4 2.5 2.2 1.7 2.4
Δ Comparable -3% +4% +7% -6% -17%
Revenues 7.9 2.3 1.9 1.5 2.4
Δ Comparable +3% +3% +5% -5% +4%
Op. EBITA % 12.1% 14.1% 14.3% 13.3% 10.3%
Δ steady +60 bps -100 bps +130 bps +280 bps
Key figures
Q1 2017: performance by division
April 20, 2017 Slide 6
Industrial Automation
Power GridsABB Group
Electrification Products
Robotics and Motion
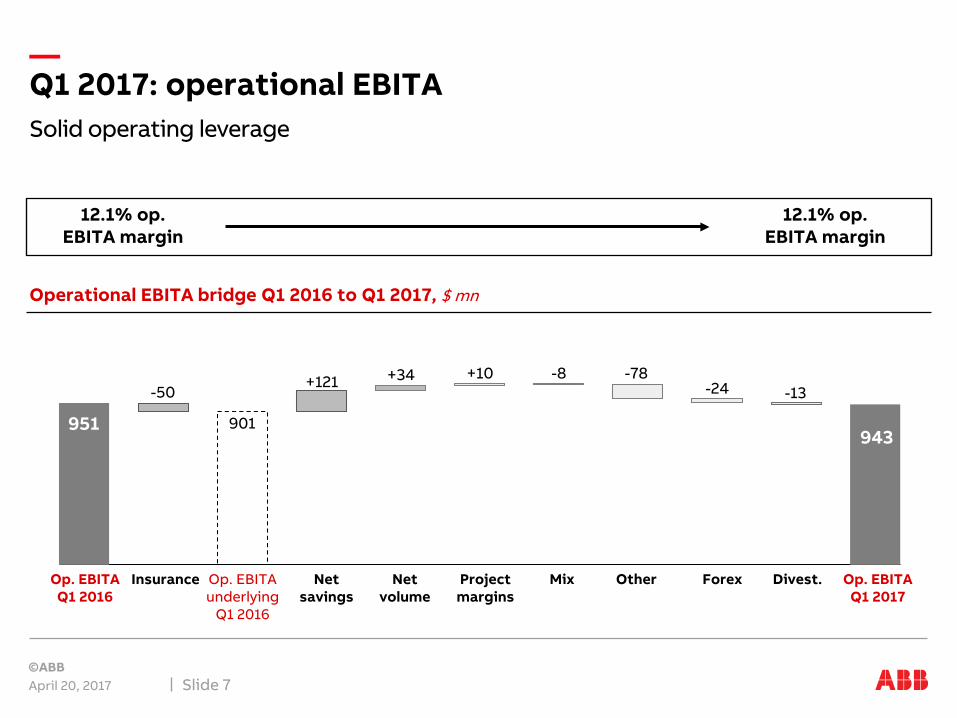
Q1 2017: operational EBITA
April 20, 2017 Slide 7
Operational EBITA bridge Q1 2016 to Q1 2017, $ mn
12.1% op. EBITA margin
12.1% op. EBITA margin
Insurance Op. EBITA underlying
Q1 2016
Project margins
Net savings
Net volume
MixOp. EBITAQ1 2016
Op. EBITAQ1 2017
943
-50
951
Forex Divest.
Solid operating leverage
Other
901
+121 +34 +10 -8 -78-24 -13
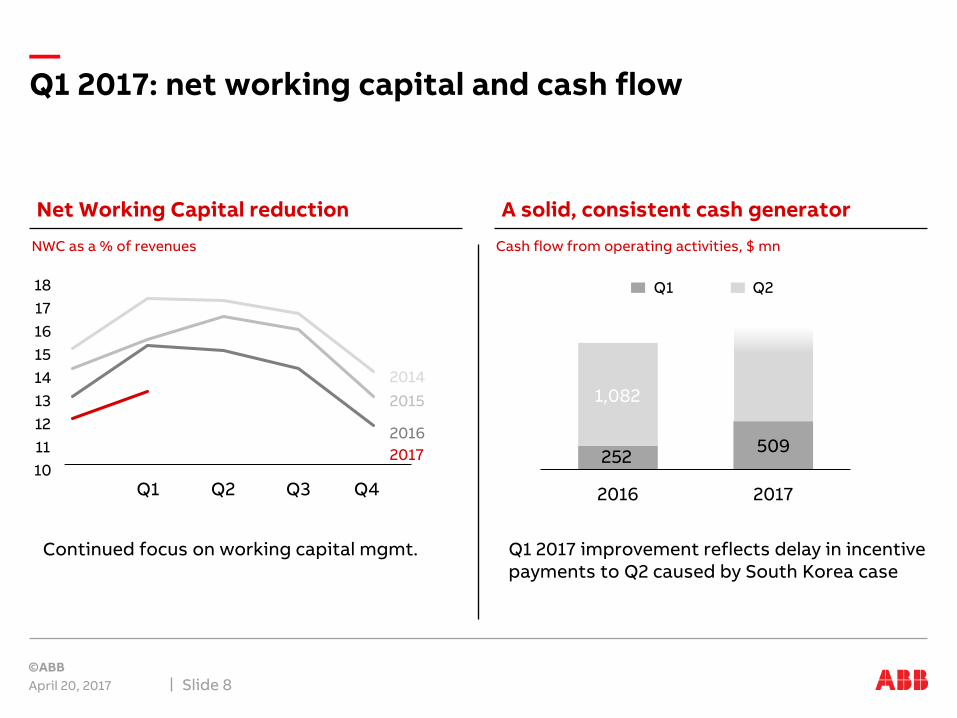
Q1 2017: net working capital and cash flow
April 20, 2017 Slide 8
Net Working Capital reduction A solid, consistent cash generator
NWC as a % of revenues
252 5090
200400600800
1000120014001600
2016 2017
1,082
Q1 2017 improvement reflects delay in incentive payments to Q2 caused by South Korea case
Cash flow from operating activities, $ mn
Continued focus on working capital mgmt.
Q4 Q1 Q2 Q3 Q4
181716151413121110
20142015
20162017
Q1 Q2
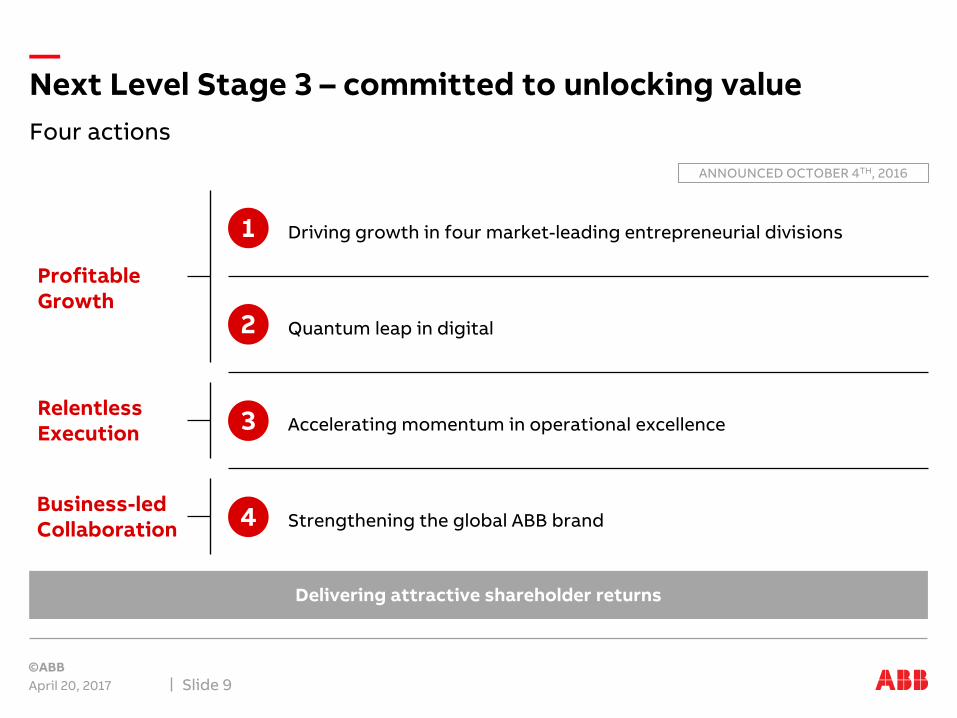
Four actions
Next Level Stage 3 – committed to unlocking value
April 20, 2017 Slide 9
Delivering attractive shareholder returns
Business-led Collaboration
2
4
Profitable Growth
Accelerating momentum in operational excellence
1
Relentless Execution 3
Strengthening the global ABB brand
Driving growth in four market-leading entrepreneurial divisions
Quantum leap in digital
ANNOUNCED OCTOBER 4TH, 2016
April 20, 2017 Slide 10
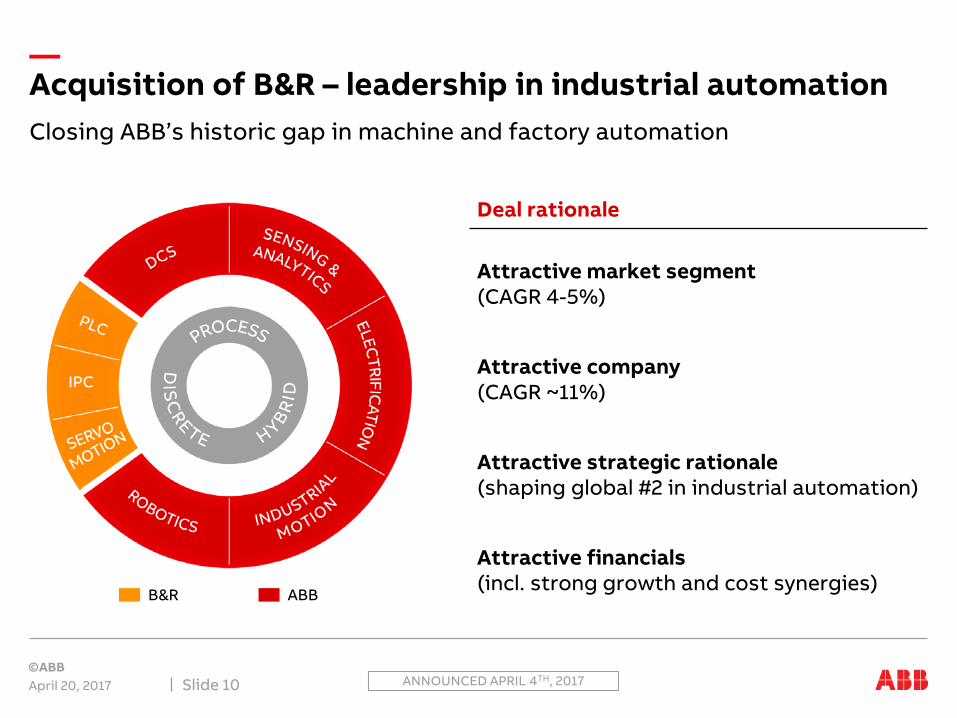
Closing ABB’s historic gap in machine and factory automation
Acquisition of B&R – leadership in industrial automation
Attractive market segment (CAGR 4-5%)
Attractive company (CAGR ~11%)
Attractive financials(incl. strong growth and cost synergies)
B&R ABB
Deal rationale
Attractive strategic rationale(shaping global #2 in industrial automation)
ANNOUNCED APRIL 4TH, 2017
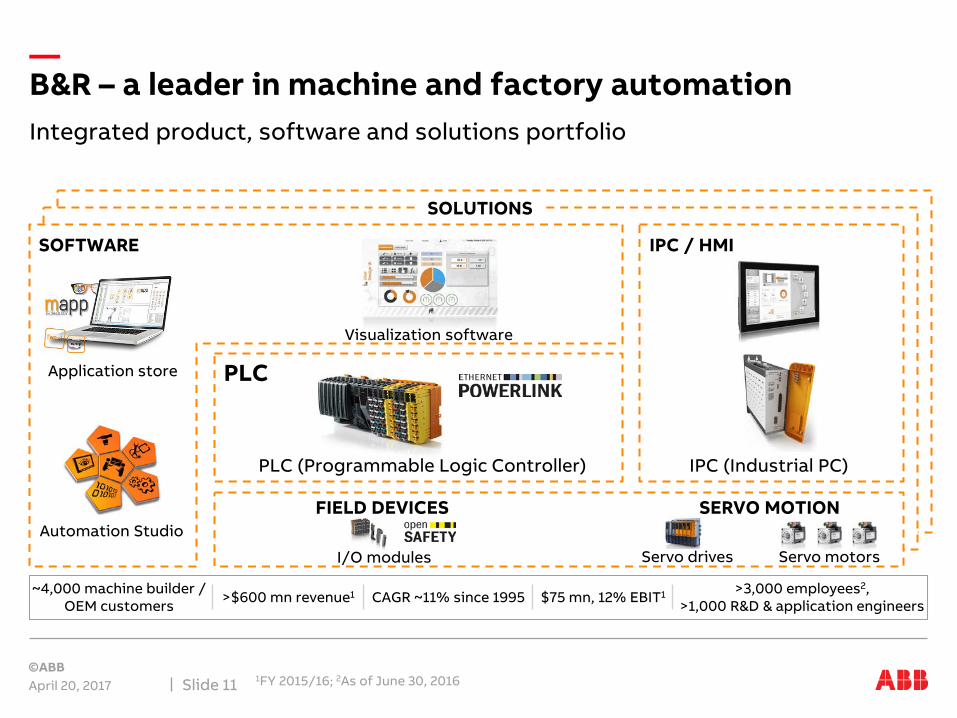
Integrated product, software and solutions portfolio
B&R – a leader in machine and factory automation
April 20, 20171FY 2015/16; 2As of June 30, 2016Slide 11
SOFTWARE
SERVO MOTIONFIELD DEVICES
IPC (Industrial PC)PLC (Programmable Logic Controller)
I/O modules Servo drives
Application store
Automation Studio
Servo motors
Visualization software
SOLUTIONS
IPC / HMI
PLC
~4,000 machine builder / OEM customers >$600 mn revenue1 CAGR ~11% since 1995 $75 mn, 12% EBIT1 >3,000 employees2,
>1,000 R&D & application engineers
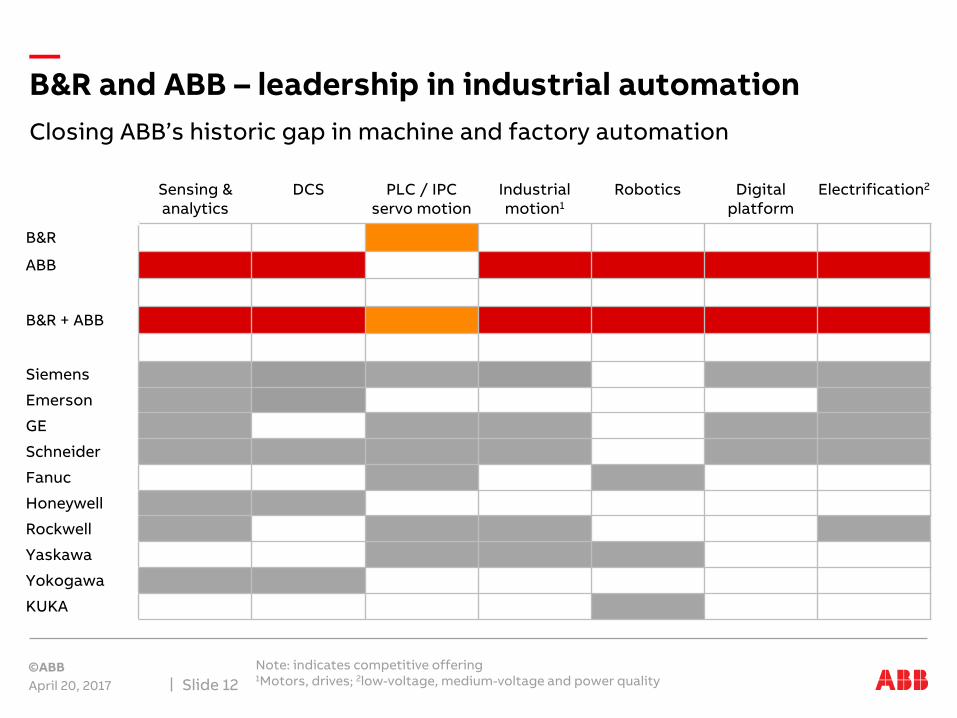
Closing ABB’s historic gap in machine and factory automation
B&R and ABB – leadership in industrial automation
April 20, 2017
Note: indicates competitive offering1Motors, drives; 2low-voltage, medium-voltage and power qualitySlide 12
Sensing & analytics
DCS PLC / IPCservo motion
Industrialmotion1
Robotics Digital platform
Electrification2
B&R
ABB
B&R + ABB
Siemens
Emerson
GE
Schneider
Fanuc
Honeywell
Rockwell
Yaskawa
Yokogawa
KUKA
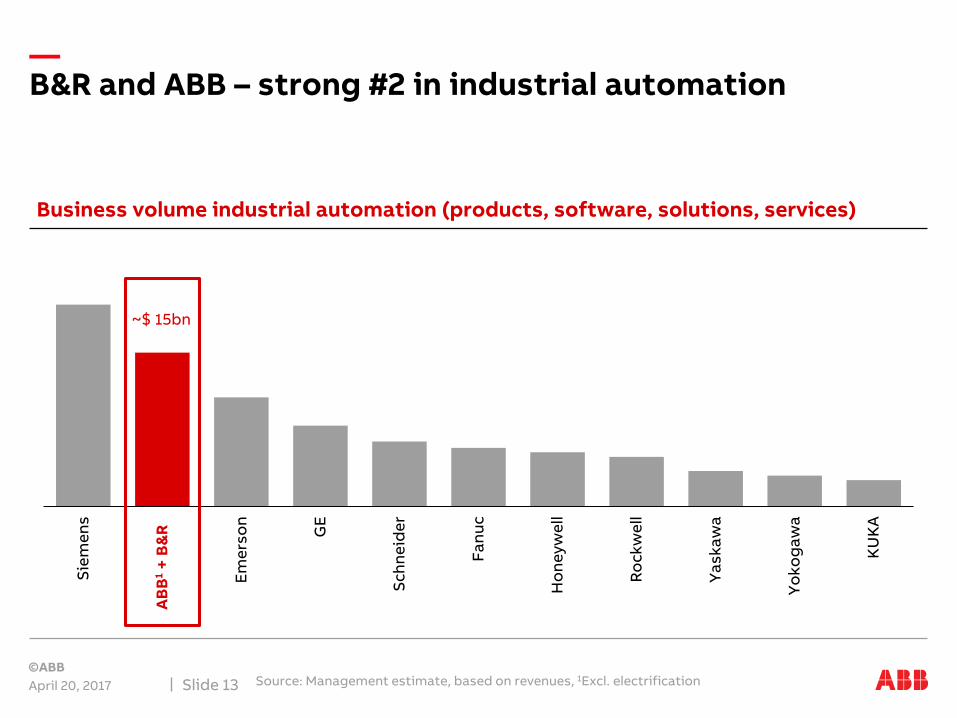
B&R and ABB – strong #2 in industrial automation
April 20, 2017 Source: Management estimate, based on revenues, 1Excl. electrificationSlide 13
Siem
ens
AB
B +
B&
R
Emer
son
GE
Schn
eid
er
Fanu
c
Ho
neyw
ell
Ro
ckw
ell
Yas
kaw
a
Yo
kog
awa
KU
KA
Business volume industrial automation (products, software, solutions, services)
AB
B1
+ B
&R
~$ 15bn
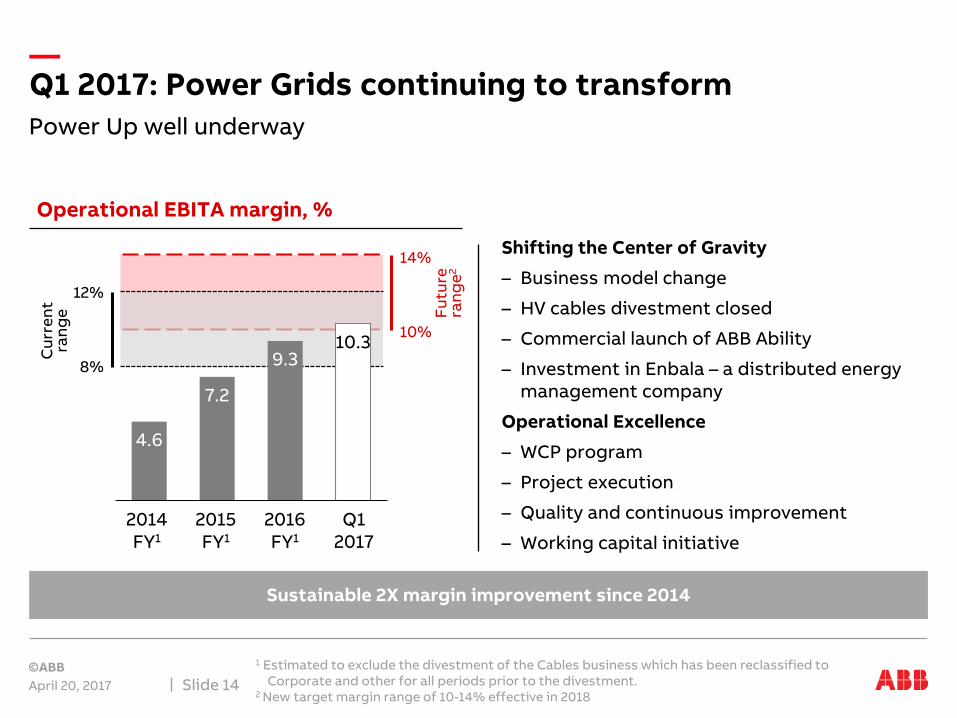
Q1 2017: Power Grids continuing to transform
April 20, 2017
1 Estimated to exclude the divestment of the Cables business which has been reclassified to Corporate and other for all periods prior to the divestment.
2 New target margin range of 10-14% effective in 2018Slide 14
Shifting the Center of Gravity
– Business model change
– HV cables divestment closed
– Commercial launch of ABB Ability
– Investment in Enbala – a distributed energy management company
Operational Excellence
– WCP program
– Project execution
– Quality and continuous improvement
– Working capital initiative
Sustainable 2X margin improvement since 2014
Operational EBITA margin, %
8%
10%
Futu
re
rang
e2
12%
4.6
7.2
9.310.3
2014 FY 2015 FY 2016 FY Q1 2017
Cur
rent
ra
nge
Q12017
2016FY1
2015FY1
2014FY1
14%
Power Up well underway
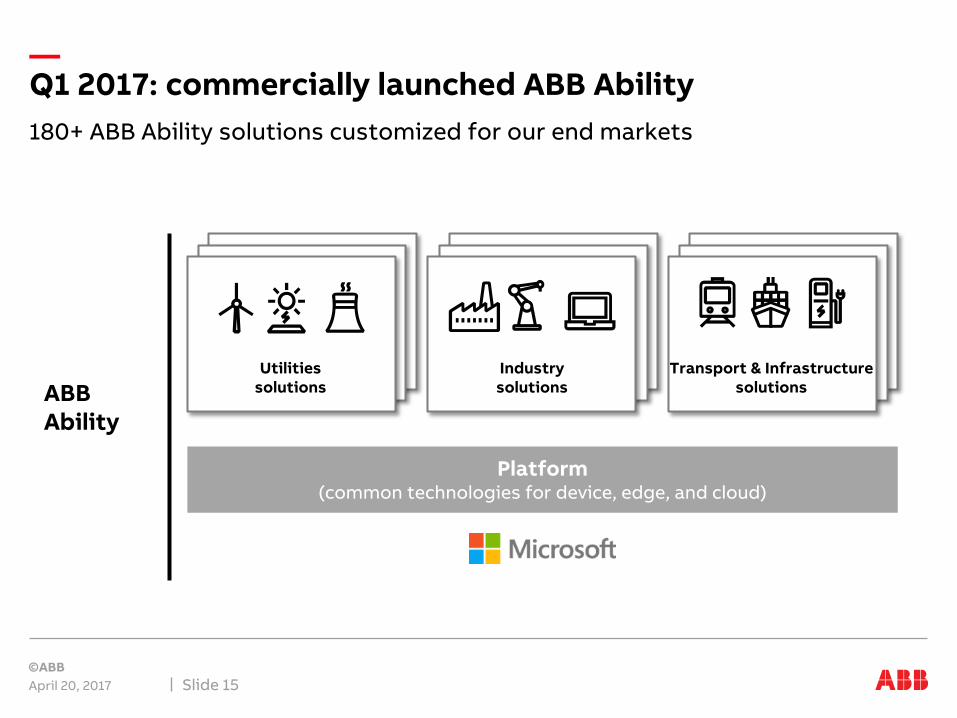
180+ ABB Ability solutions customized for our end markets
Q1 2017: commercially launched ABB Ability
April 20, 2017 Slide 15
ABBAbility
Platform(common technologies for device, edge, and cloud)
Utilities solutions
Industry solutions
Transport & Infrastructure solutions
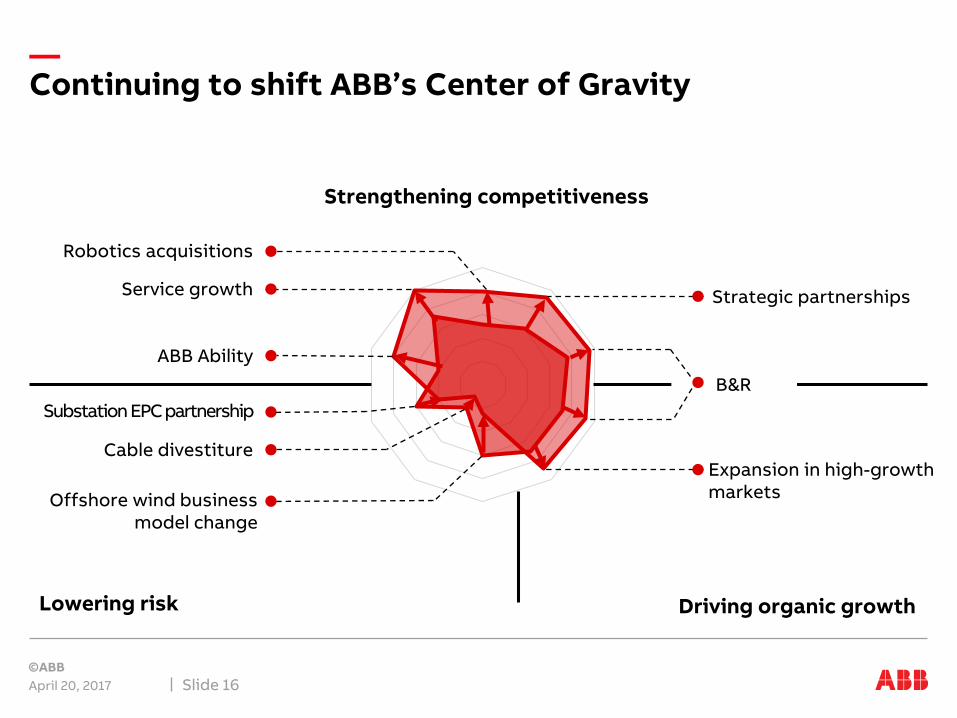
Continuing to shift ABB’s Center of Gravity
April 20, 2017 Slide 16
Strategic partnershipsService growth
Robotics acquisitions
Driving organic growthLowering risk
ABB Ability
Substation EPC partnership
Cable divestiture
Strengthening competitiveness
Expansion in high-growth marketsOffshore wind business
model change
B&R
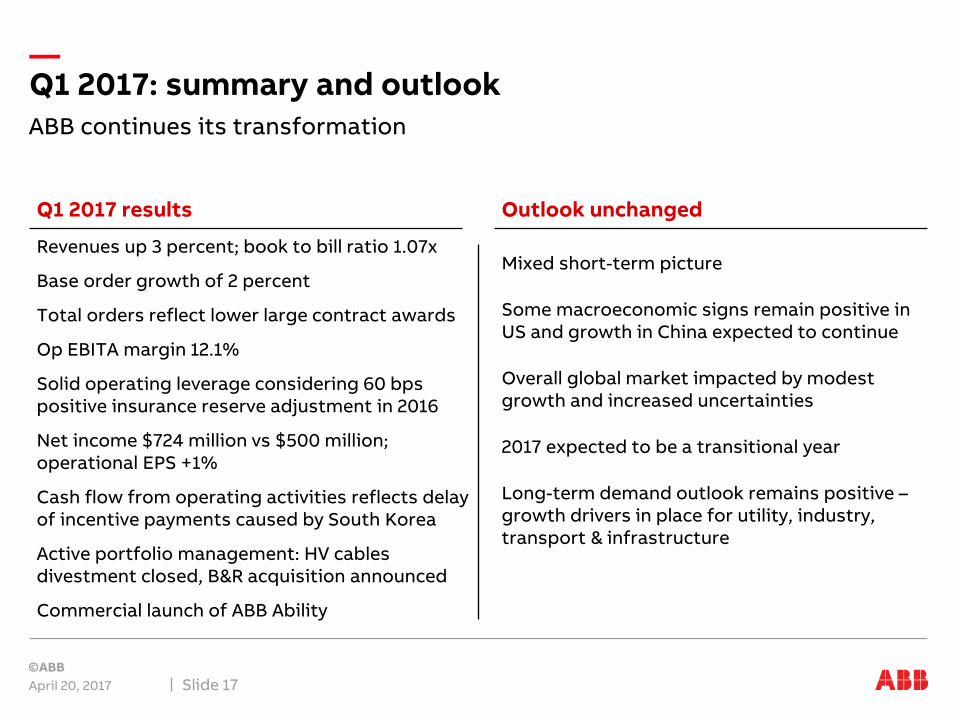
Q1 2017: summary and outlook
April 20, 2017 Slide 17
Revenues up 3 percent; book to bill ratio 1.07x
Base order growth of 2 percent
Total orders reflect lower large contract awards
Op EBITA margin 12.1%
Solid operating leverage considering 60 bps positive insurance reserve adjustment in 2016
Net income $724 million vs $500 million; operational EPS +1%
Cash flow from operating activities reflects delay of incentive payments caused by South Korea
Active portfolio management: HV cables divestment closed, B&R acquisition announced
Commercial launch of ABB Ability
Mixed short-term picture
Some macroeconomic signs remain positive in US and growth in China expected to continue
Overall global market impacted by modest growth and increased uncertainties
2017 expected to be a transitional year
Long-term demand outlook remains positive –growth drivers in place for utility, industry, transport & infrastructure
Q1 2017 results Outlook unchanged
ABB continues its transformation

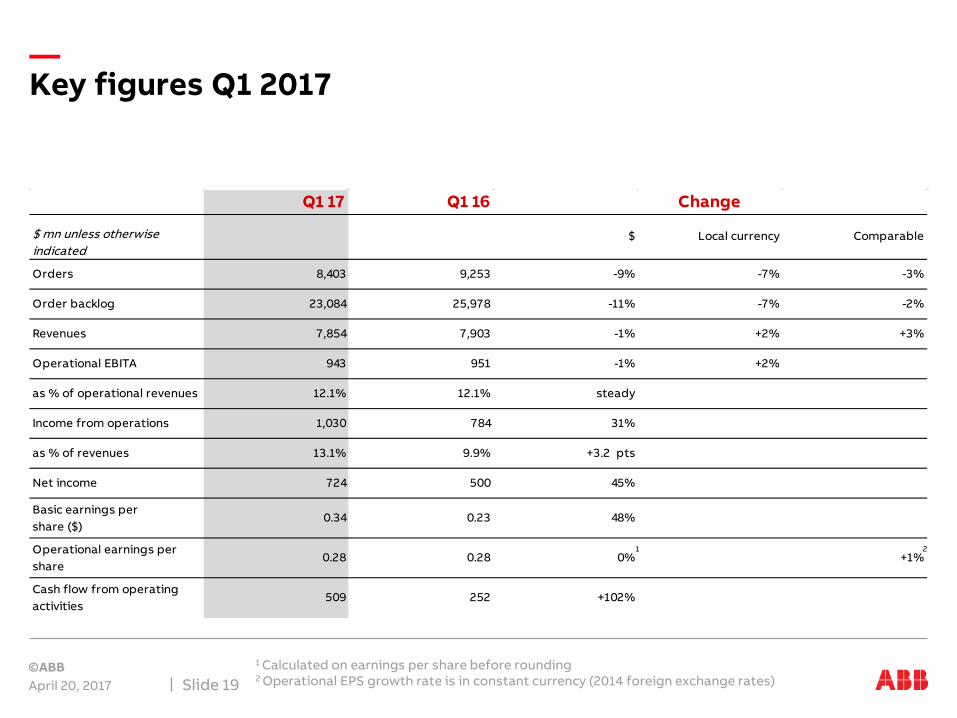
Q1 17 Q1 16
Orders 8,403 9,253 -9% -7% -3%
Order backlog 23,084 25,978 -11% -7% -2%
Revenues 7,854 7,903 -1% +2% +3%
Operational EBITA 943 951 -1% +2%
as % of operational revenues 12.1% 12.1% steady
Income from operations 1,030 784 31%
as % of revenues 13.1% 9.9% +3.2 pts
Net income 724 500 45%
Basic earnings per share ($)
0.34 0.23 48%
Operational earnings per share
0.28 0.28 0% +1%
Cash flow from operating activities
509 252 +102%
Change
$ Local currency Comparable$ mn unless otherwise indicated
Key figures Q1 2017
April 20, 2017
1 Calculated on earnings per share before rounding 2 Operational EPS growth rate is in constant currency (2014 foreign exchange rates) Slide 19
21
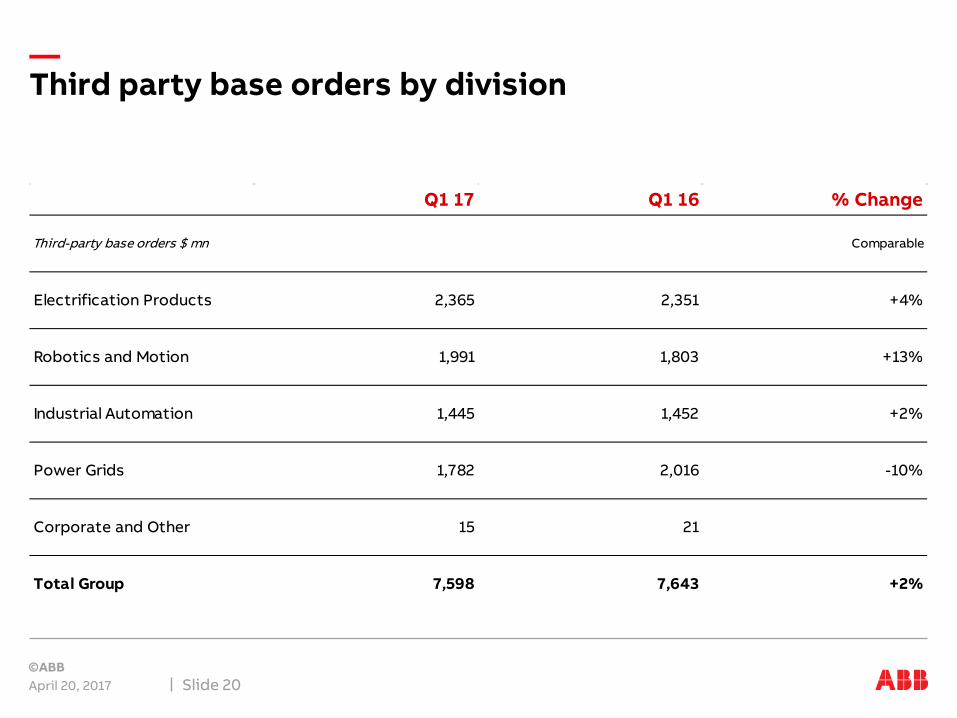
Q1 17 Q1 16 % Change
Third-party base orders $ mn Comparable
Electrification Products 2,365 2,351 +4%
Robotics and Motion 1,991 1,803 +13%
Industrial Automation 1,445 1,452 +2%
Power Grids 1,782 2,016 -10%
Corporate and Other 15 21
Total Group 7,598 7,643 +2%
Third party base orders by division
April 20, 2017 Slide 20
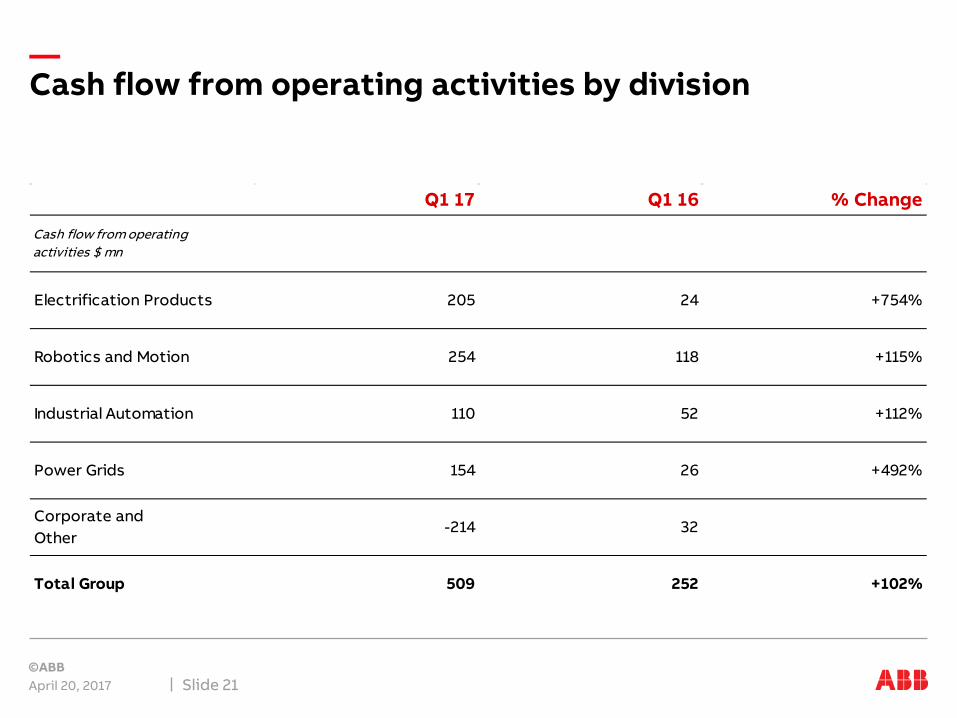
Q1 17 Q1 16 % Change
Cash flow from operating activities $ mn
Electrification Products 205 24 +754%
Robotics and Motion 254 118 +115%
Industrial Automation 110 52 +112%
Power Grids 154 26 +492%
Corporate and Other
-214 32
Total Group 509 252 +102%
Cash flow from operating activities by division
April 20, 2017 Slide 21
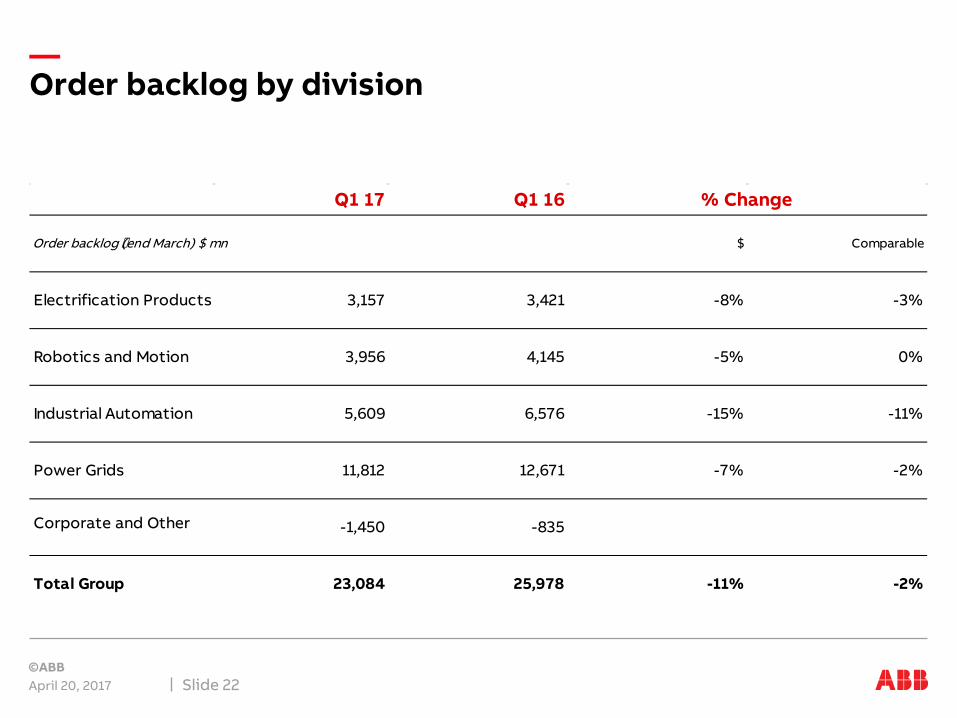
Order backlog by division
April 20, 2017 Slide 22
Q1 17 Q1 16
Order backlog (end March) $ mn $ Comparable
Electrification Products 3,157 3,421 -8% -3%
Robotics and Motion 3,956 4,145 -5% 0%
Industrial Automation 5,609 6,576 -15% -11%
Power Grids 11,812 12,671 -7% -2%
Corporate and Other -1,450 -835
Total Group 23,084 25,978 -11% -2%
% Change
1
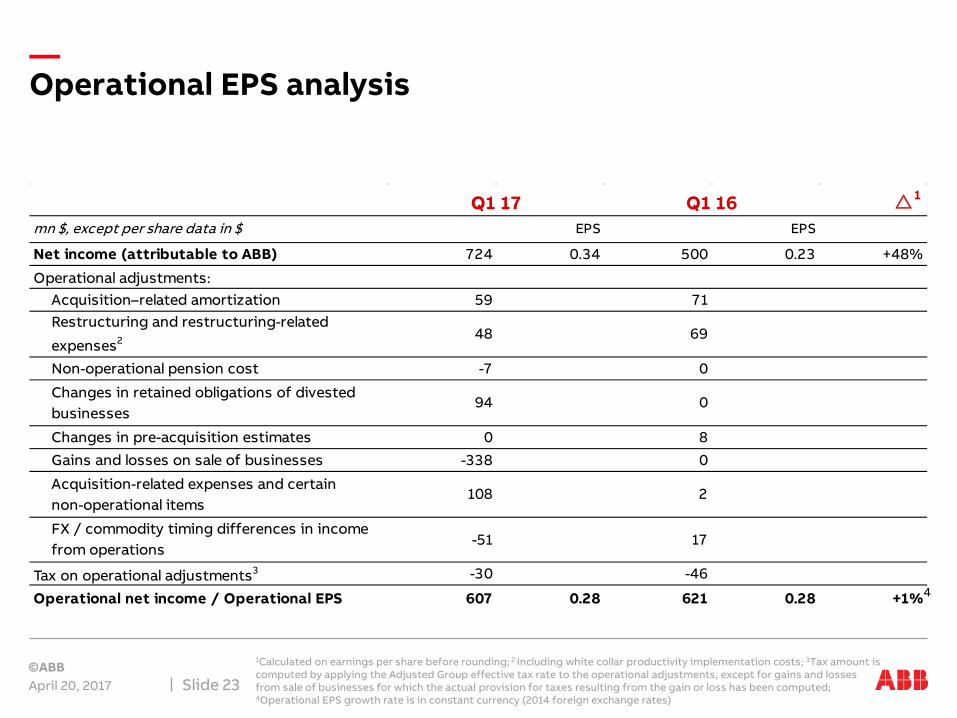
mn $, except per share data in $ EPS EPS
Net income (attributable to ABB) 724 0.34 500 0.23 +48%
Operational adjustments: Acquisition–related amortization 59 71Restructuring and restructuring-related
expenses2 48 69
Non-operational pension cost -7 0
Changes in retained obligations of divested businesses
94 0
Changes in pre-acquisition estimates 0 8
Gains and losses on sale of businesses -338 0
Acquisition-related expenses and certain non-operational items
108 2
FX / commodity timing differences in income from operations
-51 17
Tax on operational adjustments3 -30 -46
Operational net income / Operational EPS 607 0.28 621 0.28 +1%
Q1 17 Q1 16
Operational EPS analysis
April 20, 2017
1Calculated on earnings per share before rounding; 2 Including white collar productivity implementation costs; 3Tax amount is computed by applying the Adjusted Group effective tax rate to the operational adjustments, except for gains and losses from sale of businesses for which the actual provision for taxes resulting from the gain or loss has been computed; 4Operational EPS growth rate is in constant currency (2014 foreign exchange rates)
Slide 23
4
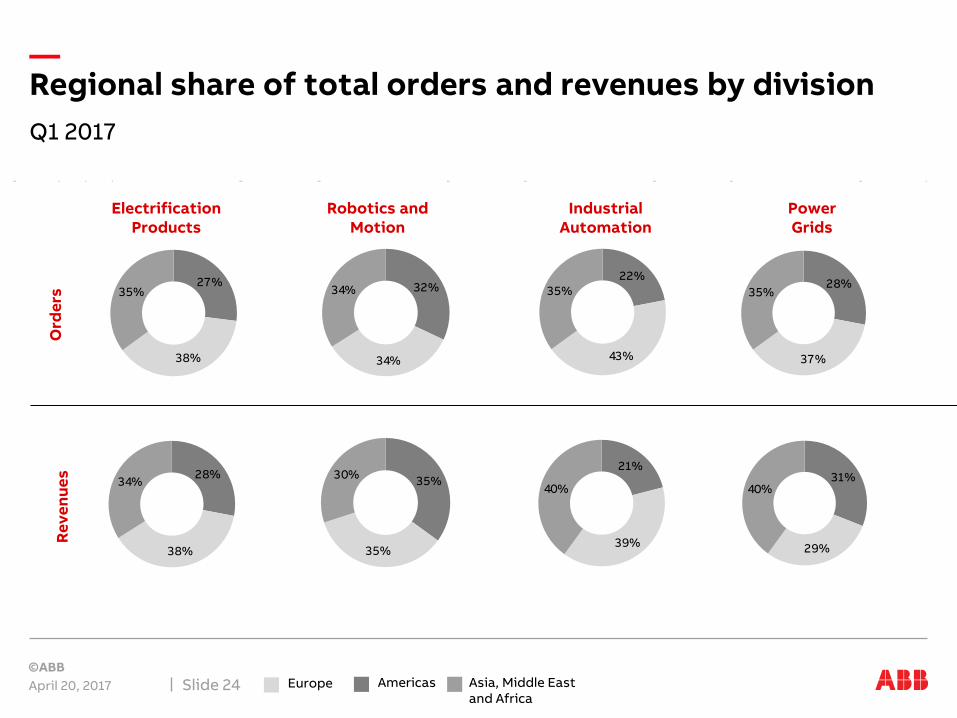
Q1 2017
Regional share of total orders and revenues by division
April 20, 2017 Slide 24 Europe Americas Asia, Middle East and Africa
Electrification Products
Robotics and Motion
Industrial Automation
Power Grids
27%
38%
35% 32%
34%
34%22%
43%
35% 28%
37%
35%
28%
38%
34% 35%
35%
30%21%
39%
40%31%
29%
40%
Ord
ers
Reve
nues
Electrification Products
Robotics and Motion
Industrial Automation
Power Grids
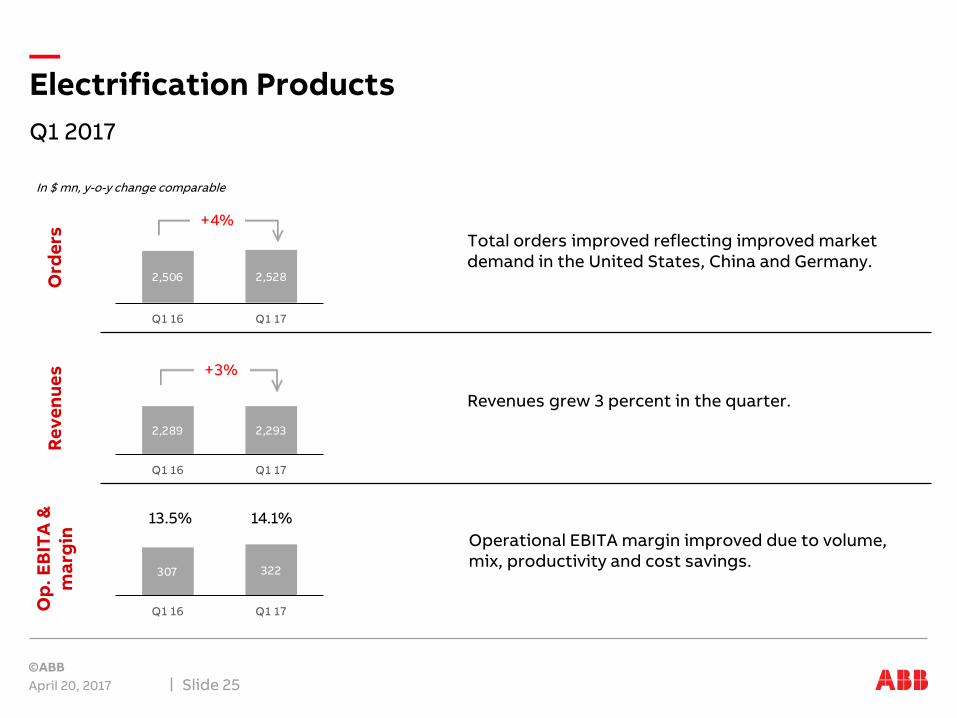
2,506 2,528
Q1 16 Q1 17
2,289 2,293
Q1 16 Q1 17
307 322
Q1 16 Q1 17
13.5% 14.1%
+4%
+3%
Q1 2017
Electrification Products
April 20, 2017 Slide 25
Total orders improved reflecting improved market demand in the United States, China and Germany.
Operational EBITA margin improved due to volume, mix, productivity and cost savings.
Revenues grew 3 percent in the quarter.
In $ mn, y-o-y change comparable
Ord
ers
Op.
EB
ITA
&
mar
gin
Reve
nues
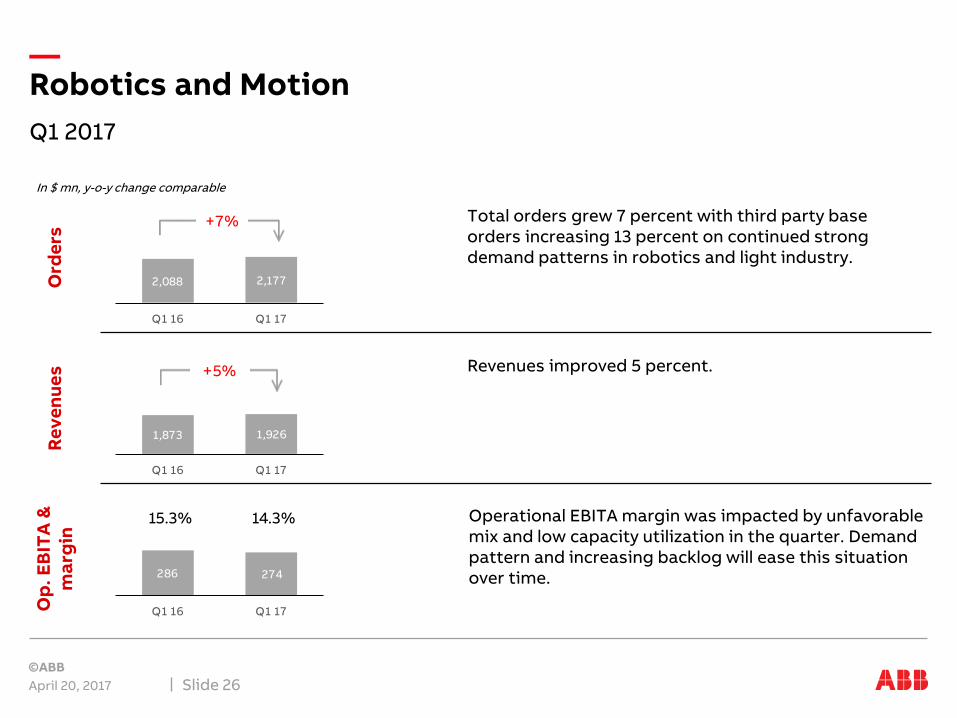
2,088 2,177
Q1 16 Q1 17
1,873 1,926
Q1 16 Q1 17
286 274
Q1 16 Q1 17
15.3% 14.3%
+5%
+7%
Q1 2017
Robotics and Motion
April 20, 2017 Slide 26
Total orders grew 7 percent with third party base orders increasing 13 percent on continued strong demand patterns in robotics and light industry.
Operational EBITA margin was impacted by unfavorable mix and low capacity utilization in the quarter. Demand pattern and increasing backlog will ease this situation over time.
Revenues improved 5 percent.
In $ mn, y-o-y change comparable
Ord
ers
Op.
EB
ITA
&
mar
gin
Reve
nues
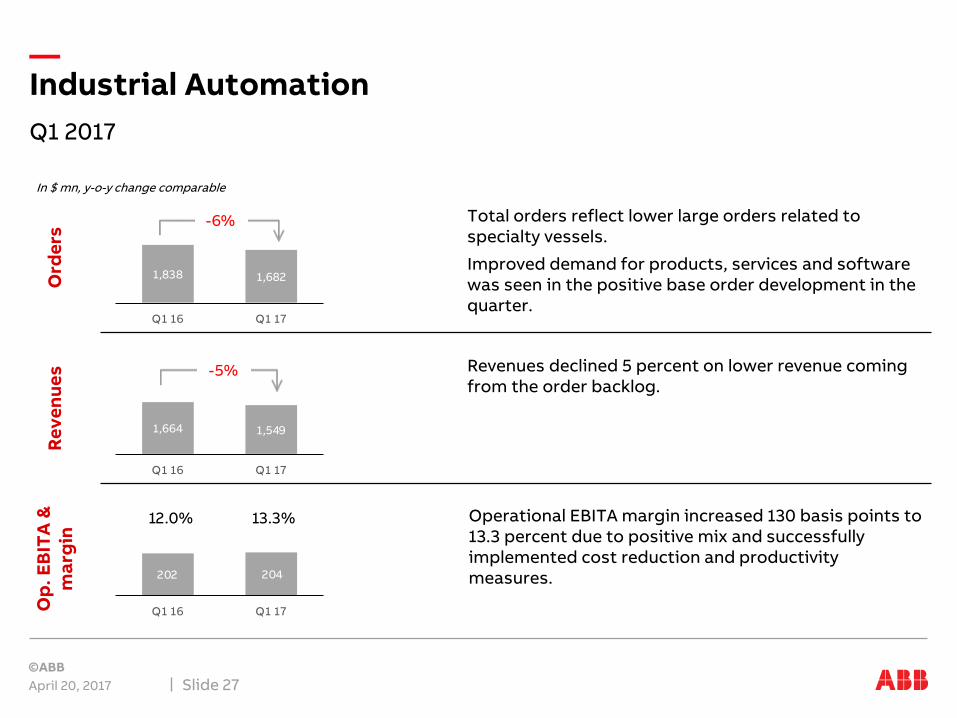
1,838 1,682
Q1 16 Q1 17
1,664 1,549
Q1 16 Q1 17
202 204
Q1 16 Q1 17
12.0% 13.3%
-5%
-6%
Q1 2017
Industrial Automation
April 20, 2017 Slide 27
Total orders reflect lower large orders related to specialty vessels.
Improved demand for products, services and software was seen in the positive base order development in the quarter.
Operational EBITA margin increased 130 basis points to 13.3 percent due to positive mix and successfully implemented cost reduction and productivity measures.
Revenues declined 5 percent on lower revenue coming from the order backlog.
In $ mn, y-o-y change comparable
Ord
ers
Op.
EB
ITA
&
mar
gin
Reve
nues
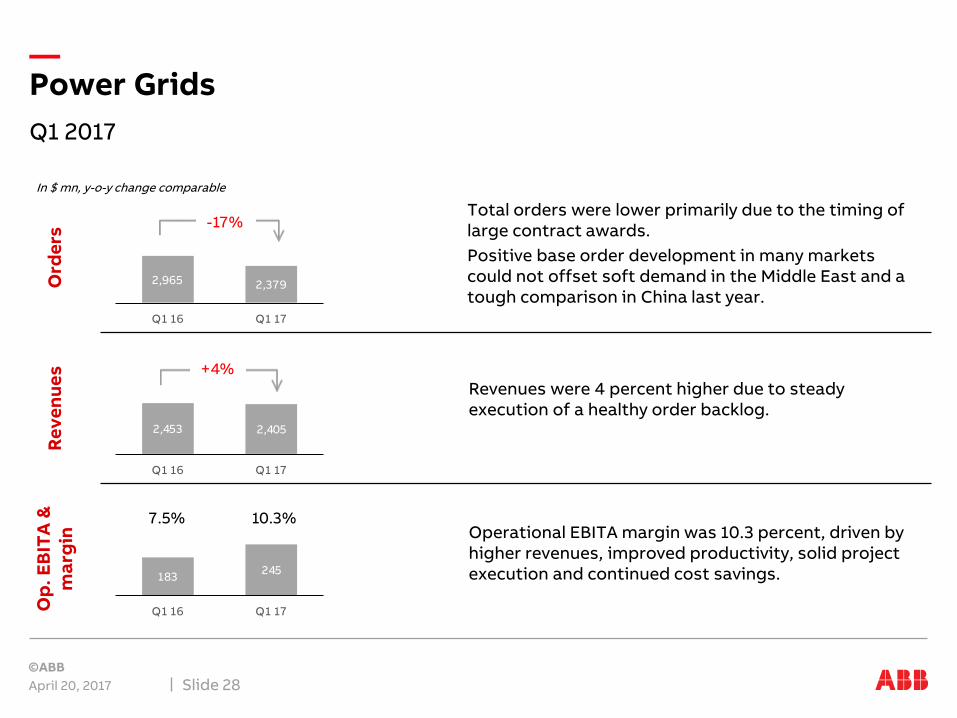
2,965 2,379
Q1 16 Q1 17
2,453 2,405
Q1 16 Q1 17
183 245
Q1 16 Q1 17
7.5% 10.3%
+4%
-17%
Q1 2017
Power Grids
April 20, 2017 Slide 28
Total orders were lower primarily due to the timing of large contract awards. Positive base order development in many markets could not offset soft demand in the Middle East and a tough comparison in China last year.
Operational EBITA margin was 10.3 percent, driven by higher revenues, improved productivity, solid project execution and continued cost savings.
Revenues were 4 percent higher due to steady execution of a healthy order backlog.
In $ mn, y-o-y change comparable
Ord
ers
Op.
EB
ITA
&
mar
gin
Reve
nues
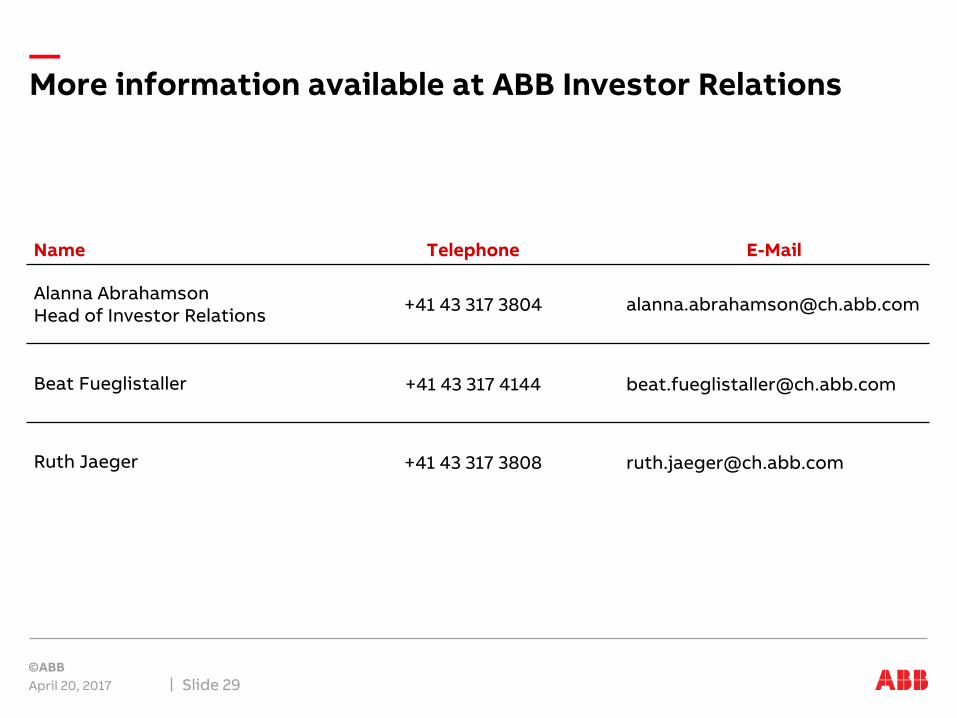
More information available at ABB Investor Relations
April 20, 2017 Slide 29
Name Telephone E-Mail
Alanna AbrahamsonHead of Investor Relations +41 43 317 3804 [email protected]
Beat Fueglistaller +41 43 317 4144 [email protected]
Ruth Jaeger +41 43 317 3808 [email protected]