Embed Size (px)
Citation preview
abacus property groupannual financial report 2016

ABACUS PROPERTY GROUP
1
ANNUAL FINANCIAL REPORT 30 June 2016 Directory Abacus Group Holdings Limited Directors of Responsible Entities and ABN: 31 080 604 619 Abacus Group Holdings Limited: John Thame, Chairman Abacus Group Projects Limited Frank Wolf, Managing Director ABN: 11 104 066 104 William Bartlett Malcolm Irving Abacus Storage Operations Limited Myra Salkinder ABN: 37 112 457 075 Peter Spira Abacus Funds Management Limited Company Secretary: ABN: 66 007 415 590 Ellis Varejes Abacus Storage Funds Management Limited Auditor (Financial and Compliance Plan): ABN: 41 109 324 834 Ernst & Young 200 George Street Registered Office SYDNEY NSW 2000 Level 34, Australia Square 264-278 George Street Share Registry: SYDNEY NSW 2000 Boardroom Pty Ltd Tel: (02) 9253 8600 Level 12, 225 George St Fax: (02) 9253 8616 SYDNEY NSW 2000 Website: www.abacusproperty.com.au Tel: 1300 737 760 Fax: 1300 653 459 Custodian: Perpetual Trustee Company Limited Level 12 Angel Place 123 Pitt Street SYDNEY NSW 2000
CONTENTS DIRECTORS’ REPORT 2
AUDITORS INDEPENDENCE DECLARATION 32
CONSOLIDATED INCOME STATEMENT 33
CONSOLIDATED STATEMENT OF OTHER COMPREHENSIVE INCOME 34
CONSOLIDATED STATEMENT OF FINANCIAL POSITION 35
CONSOLIDATED STATEMENT OF CASH FLOW 37
CONSOLIDATED STATEMENT OF CHANGES IN EQUITY 38
NOTES TO THE FINANCIAL STATEMENTS 39
DIRECTORS’ DECLARATION 104
INDEPENDENT AUDIT REPORT 105
It is recommended that this Annual Financial Report should be read in conjunction with the Annual Financial Report of Abacus Trust, Abacus Group Projects Limited, Abacus Income Trust, Abacus Storage Property Trust and Abacus Storage Operations Limited as at 30 June 2016. It is also recommended that the report be considered together with any public announcements made by the Abacus Property Group in accordance with its continuous disclosure obligations arising under the Corporations Act 2001.

ABACUS PROPERTY GROUP
2
DIRECTORS’ REPORT 30 June 2016
The Directors of Abacus Group Holdings Limited (“AGHL”), Abacus Funds Management Limited (“AFML”) – the Responsible entity of Abacus Trust (“AT”) and Abacus Income Trust (“AIT”), Abacus Group Projects Limited (“AGPL”), Abacus Storage Funds Management Limited (“ASFML”) – the Responsible Entity of Abacus Storage Property Trust (“ASPT”) and Abacus Storage Operations Limited (“ASOL”) present their report for the year ended 30 June 2016.
PRINCIPAL ACTIVITIES
The principal activities of Abacus Property Group were investment in office, retail and industrial properties, investment in self-storage facilities, participation in property ventures and developments and property funds management. There has been no significant change in the nature of these activities during the year.
OPERATING AND FINANCIAL REVIEW The operating and financial review is intended to convey the Directors’ perspective of Abacus Property Group and its operational and financial performance. It sets out information to assist securityholders to understand and interpret the financial statements prepared in accordance with Australian International Financial Reporting Standards (“AIFRS”) included in this report. It should be read in conjunction with the financial statements and accompanying notes.
Listed Structure / Entities
The listed Abacus Property Group is a diversified property group that operates predominantly in Australia. It comprises AGHL, AT, AGPL, AIT, ASPT and ASOL (collectively “Abacus”) and its securities trade on the Australian Securities Exchange (“ASX”) as ABP. Abacus was listed on the ASX in November 2002 and its market capitalisation was over $1.75 billion at 30 June 2016.
Shares in AGHL, AGPL and ASOL and units in AT, AIT and ASPT have been stapled together so that none can be dealt with without the others and are traded together on the ASX as Abacus securities. An Abacus security consists of one share in AGHL, one unit in AT, one share in AGPL, one unit in AIT, one share in ASOL and one unit in ASPT. A transfer, issue or reorganisation of a share or unit in any of the component parts requires, while they continue to be stapled, a corresponding transfer, issue or reorganisation of a share or unit in each of the other component parts.
AGHL, AGPL and ASOL are companies that are incorporated and domiciled in Australia. AT, AIT and ASPT are Australian registered managed investment schemes. AFML is the Responsible Entity of AT and AIT and ASFML is the Responsible Entity of ASPT. Both AFML and ASFML are incorporated and domiciled in Australia and are wholly-owned subsidiaries of AGHL.
Abacus Property Group Consolidation
The application of AASB10 by Abacus results in the consolidation of Abacus Hospitality Fund, Abacus Diversified Income Fund II and Abacus Wodonga Land Fund (the “Group”). This is due to the combination of Abacus’ role as responsible entity, variable returns arising from its collective equity and loan investments in these funds, and certain guarantees.
AGHL has been identified as the parent entity of the Group. The financial reports of the Group for the year ended 30 June 2016 comprise the consolidated financial reports of AGHL and its controlled entities, AT and its controlled entities, AGPL and its controlled entities, AIT and its controlled entities, ASOL and its controlled entities, ASPT and its controlled entities, Abacus Hospitality Fund and its controlled entities, Abacus Diversified Income Fund II and its controlled entities and Abacus Wodonga Land Fund.
The principal activities of Abacus that contributed to its earnings during the course of the year ended 30 June 2016 included:
- investment in office, retail and industrial properties to derive rental and fee income; - investment in self-storage facilities to derive self-storage income; - participation in property ventures and developments to derive interest income and capital profits; and - property funds management to derive fee income and equity returns.

ABACUS PROPERTY GROUP
3
DIRECTORS’ REPORT 30 June 2016
OPERATING AND FINANCIAL REVIEW (continued) These activities are reported through our four core reportable segments of Property, Self-storage, Property Ventures and Funds Management, respectively.
Abacus is included in the S&P/ASX 200 A-REIT index (ASX:XPJ), a sub-index of the S&P/ASX 200 index that contains the listed vehicles classified as A-REITs. Abacus is the only dedicated core plus investor in the XPJ index and offers some differentiation to the market providing a more active management model to the other members of the XPJ index that are focused on rent collection or funds management.
OUR STRATEGY Abacus’ overarching strategy is to invest our capital in core plus property assets. Abacus takes advantage of value adding opportunities to drive long term total returns and maximise securityholder value. Our investment objective is to provide our investors with reliable and increasing returns. We look for property assets that are capable of providing strong and stable cash-backed distributions from a diversified portfolio that provides genuine potential for enhanced capital and income growth as a result of our diligent active management. Abacus does this through the acquisition, development and active management of property assets. In particular:
- We take advantage of our specialised knowledge and market position as the only listed core plus investor in the XPJ.
- We invest in core plus property investments that are expected to yield 12-15% per annum equity total returns over time.
- We drive value through active management of the asset portfolio and through the reinvestment of sales proceeds.
We have a successful track record of acquiring property based assets and actively managing those assets to enhance income and capital growth. Our core plus presence and track record has facilitated joint ventures with a number of sophisticated global third party capital providers. We look for assets and projects in major centres, typically on the Eastern seaboard of Australia, that are mispriced by the market and which we believe have the potential for income and capital growth.
Our experience has shown that strict adherence to our fundamental investment criteria enables us to buy assets well and provide opportunities for outperformance while minimising downside risk to equity.
ABACUS PROPERTY GROUP
4
DIRECTORS’ REPORT 30 June 2016
OPERATING AND FINANCIAL REVIEW (continued)
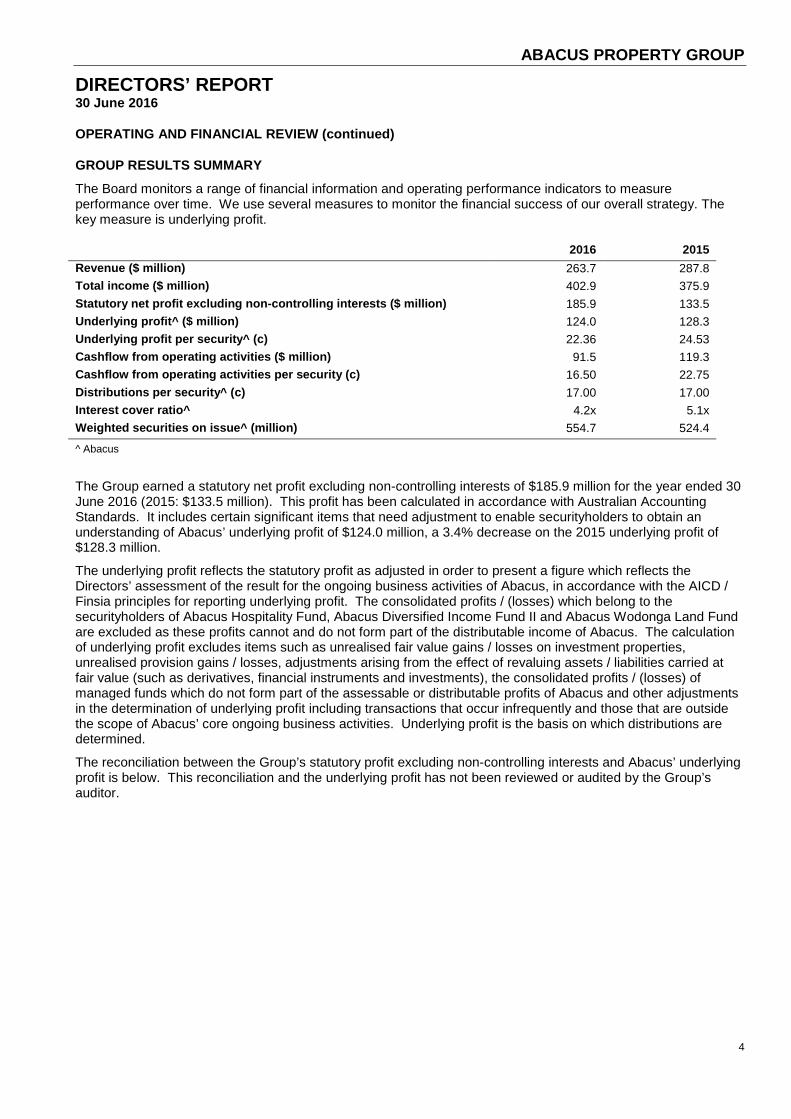
GROUP RESULTS SUMMARY The Board monitors a range of financial information and operating performance indicators to measure performance over time. We use several measures to monitor the financial success of our overall strategy. The key measure is underlying profit.
2016 2015 Revenue ($ million) 263.7 287.8 Total income ($ million) 402.9 375.9 Statutory net profit excluding non-controlling interests ($ million) 185.9 133.5 Underlying profit^ ($ million) 124.0 128.3 Underlying profit per security^ (c) 22.36 24.53 Cashflow from operating activities ($ million) 91.5 119.3 Cashflow from operating activities per security (c) 16.50 22.75 Distributions per security^ (c) 17.00 17.00 Interest cover ratio^ 4.2x 5.1x Weighted securities on issue^ (million) 554.7 524.4
^ Abacus
The Group earned a statutory net profit excluding non-controlling interests of $185.9 million for the year ended 30 June 2016 (2015: $133.5 million). This profit has been calculated in accordance with Australian Accounting Standards. It includes certain significant items that need adjustment to enable securityholders to obtain an understanding of Abacus’ underlying profit of $124.0 million, a 3.4% decrease on the 2015 underlying profit of $128.3 million.
The underlying profit reflects the statutory profit as adjusted in order to present a figure which reflects the Directors’ assessment of the result for the ongoing business activities of Abacus, in accordance with the AICD / Finsia principles for reporting underlying profit. The consolidated profits / (losses) which belong to the securityholders of Abacus Hospitality Fund, Abacus Diversified Income Fund II and Abacus Wodonga Land Fund are excluded as these profits cannot and do not form part of the distributable income of Abacus. The calculation of underlying profit excludes items such as unrealised fair value gains / losses on investment properties, unrealised provision gains / losses, adjustments arising from the effect of revaluing assets / liabilities carried at fair value (such as derivatives, financial instruments and investments), the consolidated profits / (losses) of managed funds which do not form part of the assessable or distributable profits of Abacus and other adjustments in the determination of underlying profit including transactions that occur infrequently and those that are outside the scope of Abacus’ core ongoing business activities. Underlying profit is the basis on which distributions are determined.
The reconciliation between the Group’s statutory profit excluding non-controlling interests and Abacus’ underlying profit is below. This reconciliation and the underlying profit has not been reviewed or audited by the Group’s auditor.

ABACUS PROPERTY GROUP
5
DIRECTORS’ REPORT 30 June 2016
OPERATING AND FINANCIAL REVIEW (continued)
GROUP RESULTS SUMMARY (continued)
2016 2015$'000 $'000
Consolidated statutory net profit after tax attributable to members of the Group 185,886 133,498 add back: Consolidated (profits)/losses relating to the managed funds (these (profits)/losses are excluded as the (profits)/losses of the managed funds cannot and do not form part of the assessable and distributable income of Abacus) (16,154) 14,135 Net profit attributable to Abacus securityholders 169,732 147,633
Certain significant items:Net change in fair value of investment properties held at balance date (74,029) (29,430)Net change in property, plant and equipment remeasured at fair value - (435)Net change in fair value of investments and financial instruments held at balance date (14) (1,323)Net change in fair value of derivatives 8,258 10,949 Net change in fair value of property, plant and equipment and investment properties included in equity accounted investments
(11,575) 940
Impairment of land development 40,622 - Net tax benefit on significant items (8,983) - Underlying profit attributable to Abacus securityholders 124,011 128,334
2016 2015Basic earnings per security (cents) 33.51 25.46Basic underlying earnings per security^ (cents) 22.36 24.47 Distribution per security^ (cents - including proposed distribution) 17.00 17.00Weighted average securities on issue (million) 554.7 524.4
^Abacus
FY16 saw the continuation of the market fundamentals that we saw in 2015. Markets remained challenging as the economy continues to adjust to the reduced contribution from the resources sector and lower global economic growth. As a result the low interest rate environment continued in Australia and sustained strong demand for higher yielding real estate assets. The weight of global capital seeking yield in a low yield global environment saw further cap rate compression and further exacerbated the search for good value amongst the acquisition opportunities the Group reviewed during the year. The leasing market showed signs of improvement with stronger fundamentals amongst the Eastern Seaboard CBD office markets, particularly across Sydney and Melbourne which saw positive momentum with office demand and rental growth. Brisbane is seeing improved office demand fundamentals. Retail trade growth continues to improve due to the low interest rate environment and strong house price growth.
Abacus continued its cautious investment approach during the year, focusing on its self-self-storage investment strategy and acquiring 7 stabilised self-storage facilities and industrial assets we intend to convert into self-storage for $62 million. Abacus was able to secure two commercial properties that met our investment criteria: Lutwyche City Shopping Centre in Brisbane for $65 million in joint venture with the Zenonos Group (ABP interest 75%), and an office and retail building at 201 Pacific Highway, St Leonards for $115 million in joint venture with The Goldman Sachs Group (ABP interest 50%), as part of our third party capital platform. These assets exhibit strong core plus opportunities to drive capital value while providing a strong income yield.
The low interest rate environment sustained the residential market throughout the year. Markets around Australia did experience a pullback in demand mid-year as markets took a breather following a sustained period of very strong growth. Levels of demand for stock remained high, particularly in Sydney, towards the end of the year.
As reported in the half-year, the residential land sub-division at Muswellbrook has been adversely affected by the sharp decline in the coal industry. Muswellbrook has been deeply affected by this decline which has resulted in increased unemployment and a poor economic outlook particularly for the residential market in this part of NSW. This has resulted in a non-recurring impairment of $40.6 million. This impairment has been driven by the specific conditions within the coal industry and the Muswellbrook area.

ABACUS PROPERTY GROUP
6
DIRECTORS’ REPORT 30 June 2016
OPERATING AND FINANCIAL REVIEW (continued)
GROUP RESULTS SUMMARY (continued) The increase in the Group’s statutory net profit excluding non-controlling interests was principally due to the net change in fair value of investment properties.
The impact of both year-end fair value adjustments and the Group’s performance on its financial position were as follows:
2016 2015Total assets ($ million) 2,450.3 2,137.2 Gearing^ (%) 25.8 18.2 Net assets* ($ million) 1,516.0 1,407.1 Net tangible assets*^ ($ million) 1,480.0 1,377.7 NTA per security^ ($) 2.66 2.49 NTA per security post distribution^ ($) 2.59 2.41 ^ Abacus - gearing calculated as debt minus cash divided by total assets minus cash* Excluding external non-controlling interests of $43.3 million (2015: $31.0 million)
The increase in net assets of the Group by 8% reflects the improved performance compared to the previous year. During the year, the Group’s total assets increased $313 million.
Capital management
The Abacus balance sheet continues to be strong with gearing remaining conservative at 25.8%, well within our target gearing limit of 35%. At 30 June 2016, Abacus had $78.3 million of available liquidity that provides capacity for use for up to $150.6 million of accretive acquisitions.
We continue to improve and reweight the balance sheet to larger, higher quality assets with a focus on disciplined capital management strategies. We anticipate Abacus’ weighted average interest rate will remain relatively stable as current capacity is utilised and anticipate it should be no greater than 5.75% over the next year.
CORE SEGMENT RESULTS SUMMARY Business activities that specifically contributed to the Abacus’ operating performance and financial condition for the financial year were:
Property Abacus’ property segment delivered a result of $110.5 million for the year ended 30 June 2016 which was slightly lower than the previous period by 1.4%. The 32 assets (2015: 37 assets) that make up the commercial portfolio had a total value of $994 million at year end (2015: $861 million).
Pursuant to the 2016 portfolio valuation process, 8 out of 19 of the commercial properties (excluding equity accounted properties) or 44.4% by value were independently valued during the year to 30 June 2016. The remaining properties were subject to internal review and, where appropriate, their values were adjusted. The valuation process resulted in a net full year revaluation gain of $37.4 million (2015: $10.2 million gain) or 4.8% of investment properties. A significant contributor to this increase was the Group’s retail portfolio contributing $20.0 million for the period.

ABACUS PROPERTY GROUP
7
DIRECTORS’ REPORT 30 June 2016
OPERATING AND FINANCIAL REVIEW (continued)
CORE SEGMENT RESULTS SUMMARY (continued)
Commercial portfolio (office, retail, industrial and other)
1. WACR: Weighted Average Capitalisation Rate 2. Like for like rental growth
During the year Abacus was able to secure two commercial properties that met our investment criteria:
• Lutwyche City Shopping Centre, Brisbane QLD for $65 million (ABP interest 75%) • 201 Pacific Highway, St Leonards NSW for $115 million (ABP interest 50%)
Abacus sold a number of small properties during the year. These properties included a number of small industrial and commercial properties and some inventory and PP&E assets for a total of $67.8 million.
As a result of changes in the portfolio and mixed leasing environment across regions the portfolio occupancy decreased from 93.4% at 30 June 2015 to 91.2% at 30 June 2016. Pleasingly, like for like rental growth remained strong across our existing and stabilised portfolio to deliver growth of 2.7%. This was largely as a result of the performance of the Group’s property management team and in-built annual rental increases.
We believe Abacus’ portfolio is well suited to the current conditions. The office portfolio has limited exposure to full floor or multi-floor tenants, and is configured more for multi-tenanted floors. We have found the potential cost (financial and time) of relocating to another property in the same location often outweighs the benefit of a cheaper rent. Our tenants are also strongly connected to the property’s location, which is traditionally the reason they initially leased the property and results in a positive predisposition to remain. Due to the multi-tenanted floor structure we also have the ability to work proactively with our tenants to contract or expand and adjust their space requirements.
Abacus’ retail portfolio is largely based around properties that are the dominant trader in their respective trade areas. They are heavily centred on non-discretionary and convenience based shopping and trade well in their respective markets. The Group has recently added to the portfolio assets with strong turnaround prospects and it can take advantage of the positive outlook for the sector.
Abacus remains focused on maintaining revenue and cashflows to support securityholder distributions but nevertheless being conscious of the market’s leasing requirements and competitive offerings.

ABACUS PROPERTY GROUP
8
DIRECTORS’ REPORT 30 June 2016
OPERATING AND FINANCIAL REVIEW (continued)
CORE SEGMENT RESULTS SUMMARY (continued)
Contribution from Third Party Capital
Abacus’ third party capital joint ventures remain an integral strategic investment platform for the Group. Abacus continued to expand the platform further during the year with a number of joint ventures with new investment partners. Abacus developed a relationship with The Goldman Sachs Group, Inc. to acquire 201 Pacific Hwy in Sydney for $115 million. Abacus also entered into a relationship with the Zenonos Group to acquire Lutwyche City Shopping Centre in Brisbane for $65 million. Abacus now manages over $806.7 million of assets on behalf of its partners.
Abacus’ third party capital joint ventures remain an integral strategic investment platform for the Group. Abacus typically invests 25% to 50% of the required equity with our capital partners investing the balance. Management of the property remains with Abacus and as a result we are able to leverage our capital to gain greater exposure to a higher number of core plus assets. This leads to greater earnings from fees and rental income. We will focus on driving our third party strategy to expand our capital base.
Self-storage Abacus’ self-storage portfolio delivered a result of $69.0 million for the year ended 30 June 2016. This represents a 45% increase on the FY15’s result of $47.6 million and can be attributed to an increase in net rental income and increase in the fair value of self-storage facilities held at balance date. Portfolio assets totalled $574 million across a total portfolio of 62 facilities, an overall increase of seven facilities during the period.
Pursuant to the 2016 valuation process 41 self-storage facilities out of 62 or 69.5% by value were independently valued during the year to 30 June 2016. The remaining facilities were subject to internal review and, where appropriate, their values were adjusted. The valuation process resulted in a net full year revaluation gain of $36.7 million (2015: $19.2 million gain) or 6.9% of investment properties. The self-storage portfolio is well diversified in Australia and New Zealand.
1. Stabilised portfolio 2. WACR: Weighted Average Capitalisation Rate 3. Revenue per available square metre 4. Average over last 12 months (by area)
We continue to grow through acquisition, adding four stabilised facilities and three industrial assets for conversion to self-storage facilities. We continue to target assets that will contribute to improving the portfolio’s metrics, particularly focusing on conversion opportunities in Metropolitan areas in Australia’s Eastern Seaboard.

ABACUS PROPERTY GROUP
9
DIRECTORS’ REPORT 30 June 2016
OPERATING AND FINANCIAL REVIEW (continued)
CORE SEGMENT RESULTS SUMMARY (continued) The storage portfolio’s stabilised assets are the key contributor to underlying growth across the portfolio. They continue to deliver improved operating performances across Australian and New Zealand markets. The stabilised portfolio occupancy grew to 87.4% from 86.0% and average rental rate increased to $259m2 from $256m2. The increased rental and occupancy improved portfolio RevPAM2 to $227m2 from $220m2 in 2015, a 3.2% increase assuming a stabilised New Zealand exchange rate. RevPAM measures the profitability and efficiency of your portfolio.
Abacus focused its acquisition strategy on the self-storage sector during the year, acquiring seven assets. These include four stabilised facilities for $44.7 million and $17.5 million of assets for conversion into self-storage facilities. These facilities to be converted were acquired in metropolitan areas in NSW and Victoria. We remain focused on investment opportunities in metro locations that will deliver higher average rental rates than the current portfolio average to drive portfolio returns.
During the year, the self-storage sector has continued to be seen as an additional institutional asset class alongside Office, Retail and Industrial sectors. This increased institutional recognition has driven strong pricing of assets as demand for facilities has increased as new and existing entrants to the sector seek assets and market share. This has driven strong capitalisation rate compression across assets as a result.
Property Ventures The Property Ventures business invests in projects and provides finance solutions that focus on select residential and commercial development opportunities in core locations directly and with experienced local joint venture partners. Abacus has total assets of $500 million invested across a number of residential opportunities in inner city markets across the eastern seaboard of Australia. Abacus controls over 9,000 apartment units or land lots which equates to c$55,000 cost base per unit/land lot. This low average price provides evidence that the property ventures business has prospects for strong returns.
Abacus has a number of projects under construction due for settlement over the next 12 months, including:
- The Prince, Canberra ACT (current investment $3.1 million) – Development to build 152 residential apartments in the affluent mixed use Kingston Foreshore precinct, overlooking Lake Burley Griffin. The project is a 50/50 joint venture with the Crafted Group. All apartments have been presold to mix of local owner occupiers and investors. Construction is anticipated to be completed ahead of schedule in August 2016.
- Spice Apartments, South Brisbane QLD ($37.1 million) – Development to build 274 apartments. All apartments have been presold. Construction commenced in December 2014 with completion anticipated in September 2016. Abacus is a lender to the development with associated profit rights.
Abacus also has a number of joint ventures that own land sites, largely in Metropolitan Sydney areas, undergoing residential rezoning. It is anticipated that a number of these sites will receive their approvals in 2017 and will either be sold to developers or built with our joint venture partners.
The recent council amalgamations and subsequent court actions have created headwinds for developers seeking development approvals. Administrators placed into councils affected by amalgamations have caused a back log of approvals while mergers are implemented. This has caused delays to a number of rezoning applications and has created uncertainty to delivery and realisation timings.
Funds Management The funds management business generated a result of $10.7 million for the year. Abacus continues to manage these unlisted funds to try to optimise the returns with selective sales and acquisitions of assets where opportunities and market conditions allow.
The progress of the management for each of the funds is set out in the non-core segment results summary below.

ABACUS PROPERTY GROUP
10
DIRECTORS’ REPORT 30 June 2016
OPERATING AND FINANCIAL REVIEW (continued)
CORE SEGMENT RESULTS SUMMARY (continued)
NON-CORE SEGMENT RESULTS SUMMARY As a result of AASB10, the managed funds are consolidated into the Group financial statements and the Group’s statutory profit includes the financial performance of these funds. These funds are treated as non-core segments as the assets of the funds are not directly owned by Abacus securityholders and do not contribute directly to Abacus’ underlying profit and distributable income.
An overview of the financial performance of each of the funds for the year ended 30 June 2016 is as follows:
Abacus Hospitality Fund (AHF)
AHF owns three hotels: Rydges Esplanade in Cairns, North Queensland with 242 rooms and Novotel Twin Waters Resort on the Sunshine Coast, Queensland with 374 rooms. On 16 March the fund exchanged contracts to sell Rydges Tradewinds in Cairns for $34m. Settlement was on 20 July 2016. The net sale proceeds were applied to the repayment of debt.
The strategy of the Fund is unchanged, with the aim of selling the two remaining hotel assets over the next 12 months.
Abacus Diversified Income Fund II (ADIF II)
At 30 June 2016, ADIF II owned 6 office properties located in New South Wales, Queensland and South Australia. During the year seven properties were sold for combined proceeds of $39.1 million and $1.3 million above book value. Net proceeds from sale of properties are being applied to the repayment of debt. It is intended to sell the remaining properties during the next twelve months. The capital guarantee obligation of $45.9 million to ADIFII unitholders is shown as a current liability in the consolidated statement of financial position.
Abacus Wodonga Land Fund (AWLF)
AWLF owns the residential estate known as White Box Rise located in Wodonga, Victoria. During the year 107 residential lots were settled for a combined gross proceeds of $14.2 million. This takes the total number of lots settled to 716 since the start of the project. There are approximately 355 lots left to sell in the estate, and these are expected to be sold over the next 3 years.
FUTURE PROSPECTS AND RISKS Abacus remains committed to growing its core segments and will achieve this through the acquisition and ownership of core plus investment properties and development projects either through joint venture or directly on balance sheet. We will continue to actively manage our portfolio and where appropriate recycle the mature, lower growth assets realising its improved capital position to help provide liquidity to fund future acquisitions. We believe that increasing our allocation to core plus assets will improve recurring earnings to support and grow our distributions and cash flows, optimising securityholder returns in the coming years. At 30 June 2016 Abacus held sufficient acquisition capacity to acquire a further $151 million of properties directly on the balance sheet or invest a further $78 million in development projects. This capacity can be further leveraged to invest in a larger number of projects through joint venture arrangements. Recurring earnings are anticipated to increase over the coming year as a result of increased interest income for development loans transacted during the year and also an increased level of rental and interest income as the current surplus capacity on the balance sheet is utilised in new investments. Growth in revenue through further acquisitions will be driven by our ability to access new opportunities that deliver our required equity returns in current markets that are showing signs of strong pricing. The on-going weakness in the leasing markets and the currently high level of incentives provided to new tenants is likely to have a negative influence on revenue growth. Any sales of investment properties or the completion and repayment of any development projects will also have a negative influence of revenue growth.

ABACUS PROPERTY GROUP
11
DIRECTORS’ REPORT 30 June 2016
OPERATING AND FINANCIAL REVIEW (continued)
FUTURE PROSPECTS AND RISKS (continued) Abacus remains committed to delivering transactional returns to securityholders in addition to returns from recurring income. The Abacus balance sheet is exposed to transactional returns from both investment properties and also development projects. The timing and nature of transactional returns are unpredictable and uncertain therefore making it difficult to forecast.
There are a number of risk factors associated with property-related businesses that may have an impact on the financial prospects of Abacus. Some of the key risks are outlined below. This outline is not exhaustive, and performance may be affected adversely by any of these risk and other factors.
- Returns from investment – Returns from investment in real property and other related property exposures depend largely on the amount of rental income that can be generated from the property, the expenses incurred in operations, including the management and maintenance of the property, as well as changes in the market value of the property. Factors which may adversely impact these returns include:
- the overall conditions in the national and local economy, such as changes in gross domestic product, employment trends, inflation and interest rates;
- local real estate conditions, such as the level of demand for and supply of retail, commercial and industrial space;
- the perception of prospective tenants of the attractiveness, practicality and convenience of the rental space;
- changes in tenancy laws and planning approval requirements; - external factors including major world events such as war, terrorist attacks or force majeure events; - unforeseen capital expenditures; - supply of new property and other investment assets; - cost of property outgoings and recoverability from tenants; and - investor demand/liquidity in investment markets.
- Development - Abacus is involved in the development of real estate. Generally, property development projects have a number of risks including:
- The risk that planning consents and regulatory approvals are not obtained or, if obtained, are received later than expected, or are adverse to Abacus’ interests, or are not properly adhered to;
- The escalation of development costs beyond those originally expected; - Project delays; - Anticipated sales prices or timing on sales not being achieved; - Defaults on pre-sales contracts; - Non-performance/breach of contract by a contractor, sub-contractor or joint venture partner; and - Competing development projects adversely affecting the overall return achieved by Abacus
developments. A sustained downturn in property markets caused by any deterioration in the economic climate could result in reduced development profits through reduced selling prices or delays in achieving sales.
Increases in supply or falls in demand in any of the sectors of the property market in which Abacus operates or invests could influence the acquisition of sites, the timing and value of sales and carrying value of projects. The residential property market in particular may be adversely affected by declining consumer sentiment and increasing interest rates. In the short term this may affect, for example, project enquiry levels or rates of sale.
In the medium-term factors such as the oversupply or undersupply of various markets may materially impact Abacus’ development operations.
A number of factors affect the earnings, cashflows and valuations of Abacus’ commercial property development, including construction costs, scheduled completion dates, estimated rental income and occupancy levels and the ability of tenants to meet rental and other contractual obligations.

ABACUS PROPERTY GROUP
12
DIRECTORS’ REPORT 30 June 2016
OPERATING AND FINANCIAL REVIEW (continued)
FUTURE PROSPECTS AND RISKS (continued) - Leasing terms and tenant defaults – The future financial performance of Abacus will depend, in part, on its
ability to continue to lease existing retail, office, industrial, self-storage and hotel space that is vacant or becomes vacant on economically favourable terms. In addition, its ability to lease new asset space in line with expected terms will impact on the financial performance of Abacus.
The ability of major tenants to meet their rental and other contractual commitments to Abacus (such as in situations of insolvency or closure of their businesses) may have an adverse impact on the income from properties, which may result in an adverse impact on the financial performance of Abacus.
This risk is managed through active asset management including ongoing liaison with tenants, regular maintenance and refurbishment of properties to attract tenants, timely marketing programs for vacant space and due diligence on the financial strength of prospective tenants prior to entering into leases.
- Funding – The property investment and development sector is highly capital intensive. The ability of Abacus to raise funds (equity and debt) on acceptable terms will depend on a number of factors including capital market conditions, general economic and political conditions, Abacus’ performance, and credit availability. Changes in the cost of current and future borrowings and equity raisings may impact the earnings of Abacus, and impact the availability of funding for new acquisitions and projects, or increase refinancing risk as debt facilities mature.
Abacus uses debt funding provided by major banks. Any downgrade of Abacus’ bank credit assessment may increase overall debt funding costs and adversely affect Abacus’ access to debt funding and the terms on which that funding is offered. Abacus staggers the debt maturity profile to reduce the concentration of refinancing risks at any point in time and obtains funding through different banks to reduce credit and counterparty risks.
- Insurance – While Abacus carries property insurance, there are types of losses (such as against floods and earthquakes) that are generally not insured at full replacement cost or that are insured subject to larger deductibles or insurance may not be able to be obtained. Additionally, Abacus will face risks associated with the financial strength of its insurers to meet their indemnity obligations when called upon which could lead to an adverse effect on earnings.
Abacus mitigates this risk through the use of insurance brokers to seek to place cover with well rated insurers and ensure that this insurance risk is diversified across various insurers. The diversification of the property portfolio across geographical regions reduces the impact of any potential losses to Abacus.
- Environmental – Abacus may from time to time be exposed to a range of environmental risks including those resulting from soil and water contamination, construction, cultural heritage and flora and fauna (e.g. native vegetation). In addition, there is a risk that property owned by or projects undertaken by Abacus from time to time may be contaminated by materials harmful to human health (such as asbestos or other hazardous materials). Also, returns may be adversely impacted by changes to sustainability and environmental requirements and potentially costs associated with the carbon pricing or the introduction of new regulations referable to the property industry.
In these circumstances, Abacus may be required to undertake remedial works on contaminated sites. Additional expenses may result from changes in environmental regulations across the industry. Abacus as part of the property acquisition due diligence engages experts to advise on any potential environmental risks and factors these into the acquisition price of the property. Abacus also constantly monitors for any potential exposure in changes in environmental regulations to manage any costs and impacts associated with these risks.

ABACUS PROPERTY GROUP
13
DIRECTORS’ REPORT 30 June 2016
OPERATING AND FINANCIAL REVIEW (continued) FUTURE PROSPECTS AND RISKS (continued)
- Treasury risk – Abacus manages its exposure to financial market risks by way of a formal treasury policy encompassing among other things interest rate, funding, liquidity and credit risk management. Risk management is undertaken over multiple timeframes with risk management activity reviewed on a regular basis by our Treasury Management Committee, a formally documented senior management committee. The overarching treasury policy parameters for interest rate and funding risk management reflect the objective of balancing a desired level of certainty for interest expense against retaining an appropriate level of flexibility to respond to external developments within not only domestic and global financial markets but also the wider domestic and global economies. The Treasury Policy is reviewed on a regular basis by senior management and the Board. This is enhanced by utilising the in-depth market knowledge of Abacus’ external independent treasury adviser.
With high levels of uncertainty not only in domestic financial markets but also in the Australasian residential and commercial property sectors and the wider global economy, Abacus has focused its interest rate risk management activity over the last financial year on the near-term, albeit within the overall interest rate risk management hedging requirements of our Treasury Policy. Funding risk management has focused on the timely renegotiation of maturing facilities and where possible seeks to increase the overall maturity profile.
- Workplace Health and Safety (WH&S) – Abacus manages its exposure to WH&S by way of a documented WH&S program including policies and procedures for managing safety. The management system ensures compliance by stakeholders including site contractors and employees through training and education.
The management system protects from the risk of incidents causing financial or physical impact arising from an accident or event at an asset owned or managed by Abacus.
- Talent retention – The inability to attract, retain and develop talented people can frustrate the execution of the strategy, limiting the ability to deliver the business’ objectives.

ABACUS PROPERTY GROUP
14
DIRECTORS’ REPORT 30 June 2016
OPERATING AND FINANCIAL REVIEW (continued) DIRECTORS AND SECRETARY
The qualifications, experience and special responsibilities of the Directors and Company Secretary are as follows:
John Thame AIBF, FCPA Chairman (non-executive)
Mr Thame has over 30 years’ experience in the retail financial services industry in senior management positions. His 26-year career with Advance Bank included 10 years as Managing Director until the Bank’s merger with St George Bank Limited in 1997. Mr Thame was Chairman (2004 to 2008) and a director (1997 to 2008) of St George Bank Limited and St George Life Limited.
Mr Thame is Chairman of the Due Diligence Committee and a member of the Audit & Risk and Remuneration & Nomination Committees.
Tenure: 13 years (All as Chairman)
Frank Wolf OAM, PhD, BA (Hons) Managing Director
Dr Wolf has over 25 years’ experience in the property and financial services industries, including involvement in retail, commercial, industrial and hospitality-related assets in Australia, New Zealand and the United States. Dr Wolf has been instrumental in over $5 billion worth of property related transactions, corporate acquisitions and divestments and has financed specialist property-based assets in retirement and hospitality sectors. He is also a director of HGL Limited, a diversified publicly listed investment company.
Tenure: 13 years (9 years as Managing Director)
Malcolm Irving AM, FCPA, SF Fin, BCom, Hon DLitt, FAICD Life
Mr Irving is a Non-Executive Director and has over 40 years’ experience in company management, including 12 years as Managing Director of CIBC Australia Limited. He is also a director of O’Connell Street Associates Pty Ltd and Macquarie University Hospital.
Mr Irving is Chairman of the Audit & Risk and Compliance Committees and a member of the Due Diligence Committee.
Tenure: 12 years
William J Bartlett FCA, FCPA, FCMA, CA(SA)
Mr Bartlett is a Non-Executive Director. As a partner at Ernst & Young for 23 years, he held the roles of Chairman of Worldwide Insurance Practice, National Director of Australian Financial Services Practice and Chairman of the Client Service Board. Mr Bartlett is a director of Suncorp Group Limited, GWA Limited, Reinsurance Group of America Inc (listed on NYSE) and RGA Reinsurance Company of Australia Limited. He is Chairman of the Cerebral Palsy Foundation of Australia.
Mr Bartlett is Chairman of the Remuneration & Nomination Committee and a member of the Due Diligence and Audit & Risk Committee.
Tenure: 9 years
Myra Salkinder MBA, BA
Mrs Salkinder is a Non-Executive Director and is a senior executive of the Kirsh Group. She has been integrally involved over many years with the continued expansion of the Kirsh Group’s property and other investments, both in South Africa, Australia and internationally. Mrs Salkinder is a director of various companies associated with the Kirsh Group worldwide.
Mrs Salkinder is a member of the Due Diligence and Remuneration & Nomination Committees.
Tenure: 5 years

ABACUS PROPERTY GROUP
15
DIRECTORS’ REPORT 30 June 2016
OPERATING AND FINANCIAL REVIEW (continued) DIRECTORS AND SECRETARY (continued) Peter Spira AM, B Arch
Mr Spira is a Non-Executive Director. He has over 36 years’ experience in the Australian real estate sector with Meriton Group, Australia’s largest residential apartment developer. He was responsible for Meriton Group’s development projects while also leading the Meriton team in researching and developing new construction and remediation systems. Mr Spira was a director of Meriton Group from 2005 until 2015. In 2006 he received the Order of Australia (AM) for services to the development industry. He is a director of Retire Australia.
Mr Spira is a member of the Due Diligence Committee.
Tenure: 1 year
Ellis Varejes BCom, LLB Company Secretary and Chief Operating Officer
Mr Varejes has been the Company Secretary since September 2006. He has over 25 years’ experience as a corporate lawyer in private practice.
As at the date of this report, the relevant interests of the directors in the stapled securities of ABP Group were as follows:
Directors ABP securities held
J Thame 84,590
F Wolf 3,336,537
W Bartlett 33,125
M Irving 49,370
Directors’ Meetings The number of meetings of directors (including meetings of committees of directors) of AGHL, AFML (the Responsible Entity of AT and AIT), AGPL, ASFML (the Responsible Entity of ASPT) and ASOL, held during the year and the number of meetings attended by each director were as follows:
Audit & Remuneration & Risk Nomination Compliance Board Committee Committee Committee Held Attended Held Attended Held Attended Held Attended J Thame 9 9 4 4 2 2
F Wolf 9 9 W Bartlett 9 9 4 3 2 2 M Irving 9 9 4 4 4 4 M Salkinder 9 9 2 2 4 4 P Spira 9 9
Indemnification and Insurance of Directors and Officers The Group has paid an insurance premium in respect of a contract insuring all directors, full time executive officers and the secretary. The terms of this policy prohibit disclosure of the nature of the risks insured or the premium paid.
Indemnification of Auditors To the extent permitted by law, the Company has agreed to indemnify its auditors, Ernst & Young, as part of the terms of its audit engagement agreement against claims by third parties arising from the audit (for an unspecified amount) – except for any loss in respect of any matters which are finally determined to have resulted from Ernst & Young’s negligent, wrongful or wilful acts or omissions. No payment has been made to indemnify Ernst & Young during or since the financial year.
ABACUS PROPERTY GROUP
16
DIRECTORS’ REPORT 30 June 2016
ENVIRONMENTAL REGULATION AND PERFORMANCE The Group is subject to significant environmental regulation in respect of its property activities. Adequate systems are in place for the management of the Group’s environmental responsibilities and compliance with the various licence requirements and regulations. No material breaches of requirements or any environmental issues have been identified during the year. The Group is a core plus investor, not a builder of new buildings. The Group endeavours to choose sustainable options whenever that is a cost-effective outcome.
AUDITORS INDEPENDENCE DECLARATION We have obtained an independence declaration from our auditor, Ernst & Young, and such declaration is shown on page 32.
ROUNDING The amounts contained in this report and in the half-year financial report have been rounded to the nearest $1,000 (where rounding is applicable) under the option available to the group under ASIC Class Order 2016/191. The group is an entity to which the Class Order applies.

ABACUS PROPERTY GROUP
17
DIRECTORS’ REPORT 30 June 2016
REMUNERATION REPORT (audited) This Remuneration Report describes Abacus’ remuneration arrangements for directors and executives in accordance with the requirements of the Corporations Act and Regulations. Key terms used in this report are defined in the glossary at Table 15.
This report contains details of the remuneration of the following key management personnel (KMPs) (i) Non-executive Directors
J. Thame Chairman W. Bartlett Director M. Irving Director M. Salkinder Director P. Spira Director
(ii) Executive Director
F. Wolf Managing Director
(iii) Executives
E. Varejes Chief Operating Officer R. Baulderstone Chief Financial Officer C. Laird Director Property Ventures P. Strain Director Property
Board oversight of remuneration
Remuneration & Nomination Committee
The Remuneration & Nomination Committee is responsible for making recommendations to the Board on the remuneration arrangements for the non-executive directors and executives. Further details about the Committee’s membership and functions are contained in the Corporate Governance Report.

ABACUS PROPERTY GROUP
18
DIRECTORS’ REPORT 30 June 2016
REMUNERATION REPORT (audited) (continued)
Executive remuneration Snapshot
Abacus is a core plus investor in the Australian real estate sector.
We seek to acquire properties that are mispriced in the market through flaws in their capital structure, leasing or use.
Our risk profile differs from traditional A-REITS that primarily manage rental income streams.
We have structured our remuneration policies so that our executives are not encouraged to take undue risks.
With core plus property, opportunistic investing can only be assessed over time.
Variable remuneration is short and long dated.
Variable remuneration recognises different contributions. For executives focused on transaction, initiation and value delivery outcomes, it recognises the realisation of value from historic transactions that have crystallised in the current period and other non-financial contributions. For other executives it recognises contributions through provision of infrastructure, management and specialist services to enable the effective functioning of the Group.
Long dated variable remuneration is linked to Abacus’ security price that reflects the market assessment of the business’s longer term ability to deliver sustainable distributions and growth.
Long dated variable remuneration is subject to clawback.
Objective
The remuneration policy for executives supports the Group’s overall objective of producing sustainable earnings and continuing growth in security value.
Total remuneration levels are positioned at market median, with higher rewards possible if justified by performance. The policy framework is designed to align the interests of executives and securityholders through the use of variable remuneration linked to an underlying profit gateway range and to the Abacus security price over the vesting period for deferred remuneration. The variable remuneration strategy is designed to drive sustainable and growing underlying profit that covers the distribution level implicit in the Abacus security price.
Abacus’ performance over the last 5 years is illustrated below.
Table 1: 5 year performance
2012 2013 2014 2015 2016
Underlying earnings per security (cents)* 19.17 18.76 20.83 24.53 22.36 Distributions paid and proposed (cents) 16.50 16.50 16.75 17.00 17.00 Closing security price (30 June) $2.04 $2.27 $2.50 $2.92 $3.15 Net tangible assets per security** $2.34 $2.32 $2.38 $2.49 $2.66 Weighted average securities on issue 400.9m 446.4m 486.1m 524.4m 554.7m
* Underlying earnings are unaudited.
** Net tangible assets per security include the impact of the fair value movements.

ABACUS PROPERTY GROUP
19
DIRECTORS’ REPORT 30 June 2016
REMUNERATION REPORT (audited) (continued) The table below sets out the structure of Abacus’ executive remuneration arrangements. Each element is discussed in further detail in the sections that follow.
Table 2: Summary of ABP’s remuneration structure
Remuneration component Method Purpose Link to performance
Fixed remuneration Paid mainly as cash salary - comprises base salary, superannuation contributions and other non-monetary benefits (car parking and associated fringe benefits tax).
Set with reference to role, market, experience and skill-set.
Indirect link to performance. Periodic increases are linked to market movements, changes in roles and responsibilities, and incumbent experience.
Current variable component (capped at 75% of fixed remuneration for the Managing Director and at 60% for other executives)
Paid in cash in September. To drive achievement of the underlying profit target range as set by the Board.
Underlying profit is a key financial gateway for a current variable award. Individual performance is then tested against KPIs, key effectiveness indicators and other internal financial and performance measures.
Deferred variable component (capped at 75% of fixed remuneration for the Managing Director and at 60% for other executives)
Awards are made in the form of security acquisition rights.
To reward executives for achieving sustainable underlying profit growth over the short to medium term and to reduce excessive risk taking associated with short term performance assessment models.
Directly linked to the increase in the Abacus security price over the vesting period, and the maintenance of distributions. Claw back of prior grants is considered if performance is not sustained.
Abacus aims to ensure that the split of fixed and variable remuneration for executives is appropriate for the type of business it operates, namely, a cyclical, established business that seeks to provide stable distributions to securityholders. Volatile outcomes are not valued by long-term investors, and therefore remuneration is not highly incentive leveraged. The result is a higher proportion of fixed remuneration for executives compared to other A-REITs and a lower proportion of variable remuneration, with the variable remuneration designed to reward consistency of sustainable distributions and steady improvement to the underlying financial strength of the business. This strategy aligns with the Board’s desired positioning of the group within the A-REIT industry.
Accordingly, the Board considers it appropriate that for the key management personnel the proportion of fixed to the potential maximum variable pay (the remuneration ratio) is 40:60 for the Managing Director and 45:55 for the other executives, with half of the variable component generally allocated to current variable remuneration and the other half to deferred variable remuneration. There may be variations from the ratio based on personal performance, but each executive’s total current and deferred variable remuneration is generally capped at 150% for the Managing Director and 120% for the other executives of their fixed remuneration.
To assist the Committee in determining remuneration, Abacus subscribes to an independent property salary and remuneration survey recommended to it by EY. Abacus also reviews the published remuneration of the members of the S&P ASX 200 Index and the S&P/ASX 300 A-REIT Index. This information is used by the Committee for benchmarking purposes
Fixed Remuneration
Abacus aims to set a fair base salary. Base salary is set by reference to each executive’s position, performance and experience, and the Committee has regard to independent benchmarking information. The Committee has authority to engage independent advisers to assist it in its role. No external adviser provided any remuneration recommendations in relation to any member of the KMP during the year.
Fixed remuneration is benchmarked against data for the property industry as well as data from the stock market to determine an appropriate market-competitive level of pay. Stock market data covers listed industry companies of comparable size and, within that, A-REITs of comparable size. Base salaries paid to executives increased by an average of 2.1% in the year ended 30 June 2016.

ABACUS PROPERTY GROUP
20
DIRECTORS’ REPORT 30 June 2016
REMUNERATION REPORT (audited) (continued) Current variable remuneration
Table 3: Summary of the current variable remuneration plan
What is current variable remuneration? A cash incentive plan linked to specific annual targets.
What were the outcomes for executives this year and last year?
For the 2016 financial year current variable remuneration awards of $1,510,000 have been accrued and will be paid in September 2016. The awards made to each executive and their achievements against the maximum potential payment are set out in table 6.
What is the purpose of current variable remuneration?
To link the achievement of Abacus’ operational targets to the remuneration received by all the executives charged with meeting those targets. This is designed to encourage the executives to work as a team to achieve the underlying profit target range.
What are the performance conditions?
For each financial year, the Board specifies an underlying profit target range. The lower end of the target range operates as a gateway that must be passed if current variable remuneration awards are to be generally payable. The profit target range for the 2016 financial year was $115m to $121m. If the gateway is passed, the value of the award for each executive is determined having regard to achievement against pre-determined key performance indicators or KPIs. The target levels of performance set by the Board are challenging, and 100% payments require a high level of consistent performance. The KPIs for the year ended 30 June 2016 are set out below:
KPI Proportion of current variable remuneration award measure applies to
Managing Director
Other executives
Financial measure:
- Contribution to Abacus underlying profit - Contribution to sustainability of distribution - Contributions to projects expected to grow
security value
60% 20-80% (dependent on role)
Non-financial measures:
- Quality of analysis and recommendations - Transaction and project management - Key growth activities - Risk management - Other performance measures focused on
achieving business imperatives
40% 20-80%
Account is also taken of qualitative indicators of effectiveness, performance and behaviour.
Why were these measures chosen? An underlying profit target range was chosen because, of several financial performance measures considered by the Board, underlying profit demonstrated the closest correlation to security-holder value creation (measured by total security-holder return). Underlying profit reflects the statutory profit as adjusted in order to present a figure that reflects the Directors’ assessment of the result for the ongoing business activities of Abacus, in accordance with the AICD/Finsia principles for reporting underlying profit. The other financial and non-financial KPIs were chosen as they represent the key drivers for the short-term success of the business and provide a framework for long term securityholder value.

ABACUS PROPERTY GROUP
21
DIRECTORS’ REPORT 30 June 2016
REMUNERATION REPORT (audited) (continued) Current variable remuneration (continued)
How is the total current variable remuneration pool determined?
The current variable remuneration pool is linked directly to, and contingent on, the achievement of the underlying profit gateway for the assessment year.
How is performance assessed? The Remuneration and Nomination Committee considers the performance of the executives against their KPIs and other applicable measures and has regard to independent benchmarking information. The Committee then recommends current variable remuneration payments, if any, to the Board for its approval.
What discretions does the Board have? If the underlying profit gateway is missed, the Board retains the discretion to make the current variable remuneration pool, or a reduced pool, generally available if it determines the circumstances warrant such action. If performance has been exceptionally strong the Board may increase the total pool size to provide additional current variable remuneration awards reflective of the above target performance.
If the underlying profit gateway is missed, the Board also retains the discretion to pay current variable remuneration awards to selected individuals to reward them for their personal above target performance.
When approving awards for individual executives, the Board has the discretion to consider each executive’s total contribution to the group in addition to the specific KPIs selected for the relevant year.
The board will disclose the exercise of any of these discretions.
No discretions have been exercised in respect of the reporting year.
What happens on cessation of employment?
An executive will generally not be entitled to be paid a current variable remuneration award if they resign or if their employment is terminated with cause.
Table 4: Summary of the pooling and assessment process
The process for determining an individual’s current variable remuneration award is as follows:
Year-end
Measure Abacus’ financial performance
- Is underlying profit gateway met or exceeded?
- If no, a payment will generally not be made
- If yes, gateway is passed
Beginning of the year
Set the plan parameters
- Underlying profit target range for coming year
- KPIs for each participant - Maximum current variable remuneration
payable for each participant based on remuneration ratio
After year-end
Distribute current variable remuneration
- Assess individual performance against KPIs and other measures
- Pay current variable remuneration entitlements

ABACUS PROPERTY GROUP
22
DIRECTORS’ REPORT 30 June 2016
REMUNERATION REPORT (audited) (continued) Current variable remuneration outcome for the Managing Director
The following table sets out the performance of the Managing Director against his KPI targets for the year ended 30 June 2016 (scorecard) which are reviewed by the Remuneration and Nomination Committee and the Board. These KPIs are intended to provide a link between remuneration outcomes and the key drivers of long term securityholder value:
Table 5: Managing Director’s performance against KPIs
Category Weighting Result Performance Detail
Financial performance – measured by underlying profit
40% Above target Abacus delivered an underlying profit of $124m which is 8% higher than the variable remuneration gateway.
Sustainable distribution – measured by payment of the target amount
20% At target Abacus has paid its target distribution of 17c per security
Growth – measured by revenue growth, funds under management, acquisitions, capital partners and expanded activities
15% Above target Abacus achieved a 5% increase in revenue and continued to grow the property portfolio. Abacus also entered into joint ventures with new capital partners which led to an increase in funds and properties under management
Business management – measured by debt management, rent and leasing management, operating costs and delivery of business plans
15% Above target Abacus has a strong capital position and sound controls that have supported its performance in maintaining occupancy levels above 90%, improving WALE and the delivery of operational improvements and efficiencies
People – measured by leadership performance, employee engagement, retention and development
10% Above target A review undertaken with senior staff during the year concluded that Abacus was run well with good leadership. The average tenure of all employees in Abacus is greater than 5 years.
The scorecards for other executives are similar to that of the Managing Director, but with different weightings and with KPIs applicable to their individual roles.
Current variable remuneration awards
Application of the KPIs against the scorecards resulted in no executive achieving the maximum possible variable remuneration. The following table sets out the awards made to each executive based on their performance during the year ended 30 June 2016.
Table 6: Current variable awards
Fixed salaryCurrent variable
remuneration award
% of maximum possible current
award earnedF Wolf 1,380,000 750,000 72%E Varejes 535,000 160,000 50%R Baulderstone 490,000 200,000 68%C Laird 490,000 200,000 68%P Strain 490,000 200,000 68%
ABACUS PROPERTY GROUP
23
DIRECTORS’ REPORT 30 June 2016
REMUNERATION REPORT (audited) (continued) Deferred variable remuneration
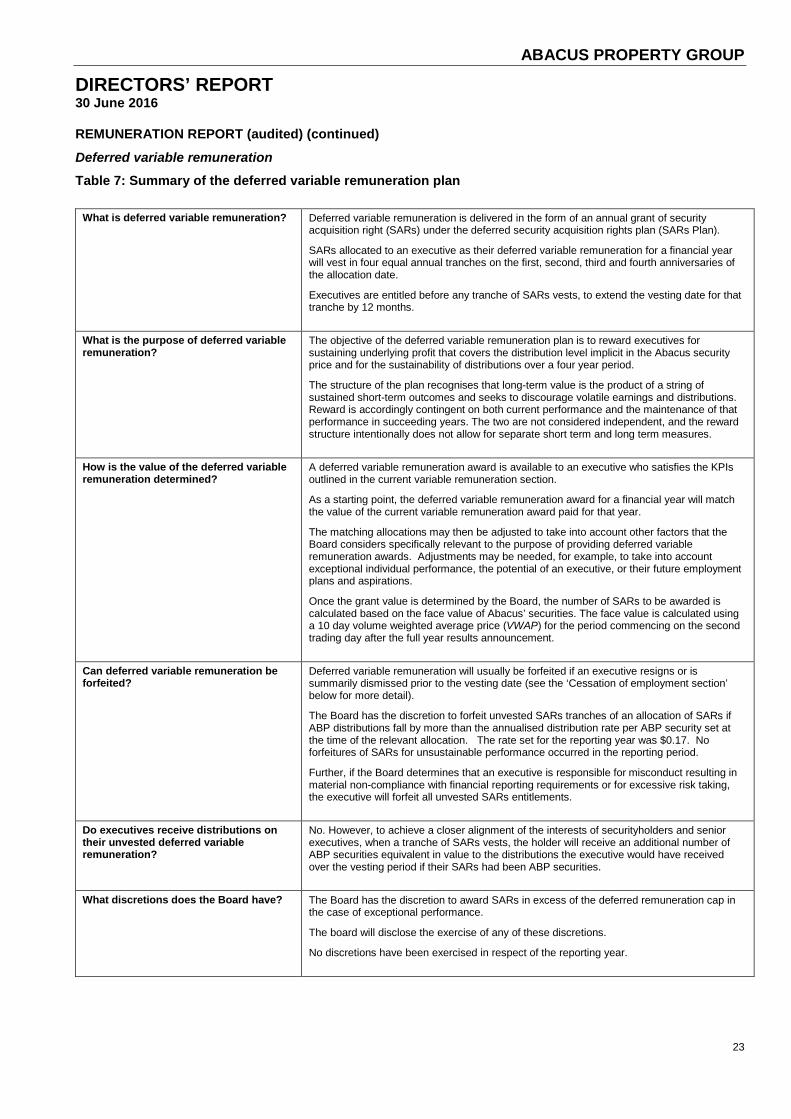
Table 7: Summary of the deferred variable remuneration plan
What is deferred variable remuneration? Deferred variable remuneration is delivered in the form of an annual grant of security acquisition right (SARs) under the deferred security acquisition rights plan (SARs Plan).
SARs allocated to an executive as their deferred variable remuneration for a financial year will vest in four equal annual tranches on the first, second, third and fourth anniversaries of the allocation date.
Executives are entitled before any tranche of SARs vests, to extend the vesting date for that tranche by 12 months.
What is the purpose of deferred variable remuneration?
The objective of the deferred variable remuneration plan is to reward executives for sustaining underlying profit that covers the distribution level implicit in the Abacus security price and for the sustainability of distributions over a four year period.
The structure of the plan recognises that long-term value is the product of a string of sustained short-term outcomes and seeks to discourage volatile earnings and distributions. Reward is accordingly contingent on both current performance and the maintenance of that performance in succeeding years. The two are not considered independent, and the reward structure intentionally does not allow for separate short term and long term measures.
How is the value of the deferred variable remuneration determined?
A deferred variable remuneration award is available to an executive who satisfies the KPIs outlined in the current variable remuneration section.
As a starting point, the deferred variable remuneration award for a financial year will match the value of the current variable remuneration award paid for that year.
The matching allocations may then be adjusted to take into account other factors that the Board considers specifically relevant to the purpose of providing deferred variable remuneration awards. Adjustments may be needed, for example, to take into account exceptional individual performance, the potential of an executive, or their future employment plans and aspirations. Once the grant value is determined by the Board, the number of SARs to be awarded is calculated based on the face value of Abacus’ securities. The face value is calculated using a 10 day volume weighted average price (VWAP) for the period commencing on the second trading day after the full year results announcement.
Can deferred variable remuneration be forfeited?
Deferred variable remuneration will usually be forfeited if an executive resigns or is summarily dismissed prior to the vesting date (see the ‘Cessation of employment section’ below for more detail).
The Board has the discretion to forfeit unvested SARs tranches of an allocation of SARs if ABP distributions fall by more than the annualised distribution rate per ABP security set at the time of the relevant allocation. The rate set for the reporting year was $0.17. No forfeitures of SARs for unsustainable performance occurred in the reporting period.
Further, if the Board determines that an executive is responsible for misconduct resulting in material non-compliance with financial reporting requirements or for excessive risk taking, the executive will forfeit all unvested SARs entitlements.
Do executives receive distributions on their unvested deferred variable remuneration?
No. However, to achieve a closer alignment of the interests of securityholders and senior executives, when a tranche of SARs vests, the holder will receive an additional number of ABP securities equivalent in value to the distributions the executive would have received over the vesting period if their SARs had been ABP securities.
What discretions does the Board have? The Board has the discretion to award SARs in excess of the deferred remuneration cap in the case of exceptional performance.
The board will disclose the exercise of any of these discretions.
No discretions have been exercised in respect of the reporting year.

ABACUS PROPERTY GROUP
24
DIRECTORS’ REPORT 30 June 2016
REMUNERATION REPORT (audited) (continued) Deferred variable remuneration (continued)
What happens on cessation of employment?
To receive the deferred remuneration award the executive must remain employed by Abacus, unless they are considered a good leaver (that is, through disability, termination without cause, genuine retirement, death or some other circumstance considered acceptable by the board in its discretion).
Further details about deferred variable remuneration grants are set out in tables 10 to 13 and the terms of prior year grants are set out in earlier remuneration reports.
Employment contracts and termination entitlements
The Managing Director, Dr Wolf, is employed under a rolling contract. The current employment contract commenced on 10 October 2002. Under the terms of the contract:
- Dr Wolf may resign from his position by giving 6 months written notice; and - Abacus may terminate the employment agreement by providing 12 months written notice or providing
payment in lieu of notice.
The other executives are employed on an ongoing basis under letter agreements until one month’s notice is given by either party. Abacus may terminate an executive’s service at any time without notice if serious misconduct has occurred. Where termination with cause occurs the executive is only entitled to remuneration up to the date of termination. Deferred variable remuneration allocations vest according to the SARs Plan rules.

ABACUS PROPERTY GROUP
25
DIRECTORS’ REPORT 30 June 2016
REMUNERATION REPORT (audited) (continued) Non-executive director remuneration
Objective
The Committee assesses the appropriateness of the nature and amount of remuneration of non-executive directors on a periodic basis by reference to market rates with the overall objective of attracting and retaining Board members with an appropriate combination of industry and specialist functional knowledge and experience.
Structure
Abacus’ constituent documents and the ASX Listing Rules specify that the maximum aggregate remuneration of non-executive directors must be approved by securityholders. The last determination was at the annual general meeting held on 12 November 2010 when securityholders approved an aggregate remuneration limit of $800,000 per year. (This is a limit on non-executive directors’ total fees. The actual fees paid to non-executive directors are in Table 8.)
The aggregate remuneration limit and the fee structure are reviewed annually and fees were last increased in August 2015.
Fees payable, inclusive of superannuation, to non-executive directors are as follows:
Table 8: Non-Executive Director fee levels Board/Committee Role Fee Board Chairman* $221,000 Board Member $95,000 Audit & Risk Committee Chairman $26,000 Audit & Risk Committee Member $10,000 Compliance Committee Chairman $14,000 Compliance Committee Member $10,000 Due Diligence Committee Chairman $15,000 Due Diligence Committee Member $5,000 Remuneration & Nomination Committee Chairman $15,000 Remuneration & Nomination Committee Member $10,000
* The Chairman is an ex-officio member of all Board committees but does not receive any committee membership fees.
The non-executive directors do not receive retirement benefits. Nor do they participate in any incentive programs.

ABACUS PROPERTY GROUP
26
DIRECTORS’ REPORT 30 June 2016
REMUNERATION REPORT (audited) (continued) Table 9: Remuneration of Key Management Personnel
2016 Short-term benefits Long-termSecurity-
based Total Performance SARsemployment benefits payment related related
Salary & fees
Current variable
incentive
Non-monetary
benefits
Total cash payments and short
term benefits Superannuation
Long service
leave*
Security acquisition
rights (SARs)*
$ $ $ $ $ $ $ $ % %Non-executive directorsJ Thame - Chairman 201,828 - - 201,828 19,172 - - 221,000 - - W Bartlett 114,155 - - 114,155 10,845 - - 125,000 - - M Irving 136,991 - - 136,991 12,363 - - 149,354 - - M Salkinder 109,589 - - 109,589 10,411 - - 120,000 - - P Spira 91,324 - - 91,324 8,676 - - 100,000 Sub-total non-executive directors 653,887 - - 653,887 61,467 - - 715,354
Executive DirectorsF Wolf - Managing Director 1,351,069 750,000 6,673 2,107,742 28,931 31,345 552,974 2,720,992 48% 20%
Other key management personnelE Varejes - Chief Operating Officer 504,000 160,000 6,673 670,673 31,000 8,530 143,673 853,876 36% 17%R Baulderstone - Chief Financial Off icer 455,000 200,000 - 655,000 35,000 9,777 137,473 837,250 40% 16%C Laird - Director Property Ventures 455,000 200,000 6,673 661,673 35,000 9,036 164,265 869,974 42% 19%P Strain - Director Property 455,000 200,000 6,673 661,673 35,000 9,937 150,373 856,983 41% 18%Sub-total executive KMP 3,220,069 1,510,000 26,692 4,756,761 164,931 68,625 1,148,758 6,139,075 Total 3,873,956 1,510,000 26,692 5,410,648 226,398 68,625 1,148,758 6,854,429
Post
*Accrued but not presently entitled # Ms Aarons and Mr L’Estrange did not meet the definition of a key management person in 2016

ABACUS PROPERTY GROUP
27
DIRECTORS’ REPORT 30 June 2016
REMUNERATION REPORT (audited) (continued) Table 9: Remuneration of Key Management Personnel
2015 Short-term benefits Long-termSecurity-
based Total Performance SARsemployment benefits payment related related
Salary & fees
Current variable
incentive
Non-monetary
benefits
Total cash payments and short
term benefits Superannuation
Long service
leave*
Security acquisition
rights (SARs)*
$ $ $ $ $ $ $ $ % %Non-executive directorsJ Thame - Chairman 192,217 - - 192,217 18,783 - - 211,000 - - W Bartlett 105,023 - - 105,023 9,977 - - 115,000 - - M Irving 127,854 - - 127,854 12,146 - - 140,000 - - M Salkinder 100,457 - - 100,457 9,543 - - 110,000 - - P Spira# 7,828 - - 7,828 744 - - 8,572 - - Sub-total non-executive directors 533,379 - - 533,379 51,193 - - 584,572
Executive DirectorsF Wolf - Managing Director 1,311,074 800,000 6,036 2,117,110 28,926 29,863 466,121 2,642,020 48% 18%
Other key management personnelE Varejes - Chief Operating Officer 504,001 160,000 6,036 670,037 30,999 10,612 135,436 847,084 35% 16%C Aarons - Head of Strategy 377,000 110,000 6,036 493,036 35,000 7,718 86,896 622,650 32% 14%R Baulderstone - Chief Financial Off icer 445,000 175,000 - 620,000 35,000 11,202 122,086 788,288 38% 15%C Laird - Director Property Ventures 461,217 400,000 6,036 867,253 18,783 9,874 137,215 1,033,125 52% 13%J L'Estrange - Director Property Ventures 430,000 110,000 6,036 546,036 35,000 6,812 96,648 684,496 30% 14%P Strain - Director Property 445,000 200,000 6,036 651,036 35,000 11,824 122,086 819,946 39% 15%Sub-total executive KMP 3,973,292 1,955,000 36,216 5,964,508 218,708 87,905 1,166,488 7,437,609 Total 4,506,671 1,955,000 36,216 6,497,887 269,901 87,905 1,166,488 8,022,181
Post
*Accrued but not presently entitled # Appointed 27 May 2015

ABACUS PROPERTY GROUP
28
DIRECTORS’ REPORT 30 June 2016
REMUNERATION REPORT (audited) (continued) Table 10: Grants under the Deferred Security Acquisition Rights Plan The table below discloses unvested SARs held by key management personnel as well as the number of SARs that vested or lapsed during the year.
Year Grant date SARs granted
Fair value
per right at grant
date
Vesting date
No. vested during
the year
No. lapsed during
the year
DirectorF Wolf 2016 21/11/2015 233,176 $2.667 over 4 years - -
2015 21/11/2014 13/09/2015 54,565 - 2014 29/11/2013 13/09/2015 69,352 - 2013 15/05/2013 13/09/2015 53,105 -
ExecutivesE Varejes 2016 21/11/2015 49,964 $2.667 over 4 years - -
2015 21/11/2014 13/09/2015 16,369 - 2014 29/11/2013 13/09/2015 16,644 - 2013 15/05/2013 13/09/2015 21,242 -
R Baulderstone 2016 21/11/2015 53,296 $2.667 over 4 years - - 2015 21/11/2014 13/09/2015 14,550 - 2014 29/11/2013 13/09/2015 16,644 - 2013 15/05/2013 13/09/2015 16,340 -
C Laird 2016 21/11/2015 66,620 $2.667 over 4 years - - 2015 21/11/2014 13/09/2015 18,188 - 2014 29/11/2013 13/09/2015 16,644 - 2013 15/05/2013 13/09/2015 17,913 -
P Strain 2016 21/11/2015 66,620 $2.667 over 4 years - - 2015 21/11/2014 13/09/2015 14,550 - 2014 29/11/2013 13/09/2015 16,644 - 2013 15/05/2013 13/09/2015 16,340 -
Table 11: The value of SARs granted, exercised and lapsed during the year
Value of SARs granted during
the year
Value of SARs exercised
during the year
Value of SARs lapsed during
the year $ $ $
F Wolf 621,904 634,912 - E Varejes 133,259 195,815 - R Baulderstone 142,146 170,990 - C Laird 177,682 189,283 - P Strain 177,682 170,990 - Refer to Note 21 for details on the valuation the SARs, including models and assumptions used.
There were no alterations to the terms and conditions of the SARs since their grant date.

ABACUS PROPERTY GROUP
29
DIRECTORS’ REPORT 30 June 2016
REMUNERATION REPORT (audited) (continued) Table 12: Securities acquired on exercise of options
Securities acquired
Paid per security
No. $F Wolf 198,393 3.19E Varejes 61,187 3.19R Baulderstone 53,430 3.19C Laird 59,146 3.19P Strain 53,430 3.19 The number of securities acquired is based on the SARs that vested in the year and the distributions that would have been paid on that number of securities from the grant date to the allocation date. Table 13: Movements in SARs holdings of key management personnel during the year
Balance Granted as SARs Balance Vested1 July 2015 remuneration exercised 30 June 2016 30 June 2016
DirectorF Wolf 532,526 233,176 (177,022) 588,680 - ExecutivesE Varejes 157,892 49,964 (54,255) 153,601 - R Baulderstone 140,812 53,296 (47,534) 146,574 - C Laird 158,510 66,620 (52,745) 172,385 - P Strain 140,812 66,620 (47,534) 159,898 - Total 1,130,552 469,676 (379,090) 1,221,138 -
Table 14: Securityholdings of key management personnel
Balance Vesting of Purchases/ Balance 1 July 2015 SARs (sales) 30 June 2016
DirectorsJ Thame 84,590 - - 84,590 F Wolf 3,138,144 198,393 - 3,336,537 W Bartlett 33,125 - - 33,125 a Irving 46,629 - 2,741 49,370 ExecutivesE Varejes 115,199 61,187 (125,719) 50,667 R Baulderstone 67,614 53,430 - 121,044 C Laird 60,686 59,146 - 119,832 P Strain 107,518 53,430 4,883 165,831 Total 3,653,505 425,586 (118,095) 3,960,996
All equity transactions with key management personnel other than those arising from the vesting of the security acquisition rights have been entered into under terms and conditions no more favourable than those the Group would have adopted if dealing at arm’s length.
Loans to key management personnel There were no loans to key management personnel and their related parties at any time in 2016 or in the prior year.
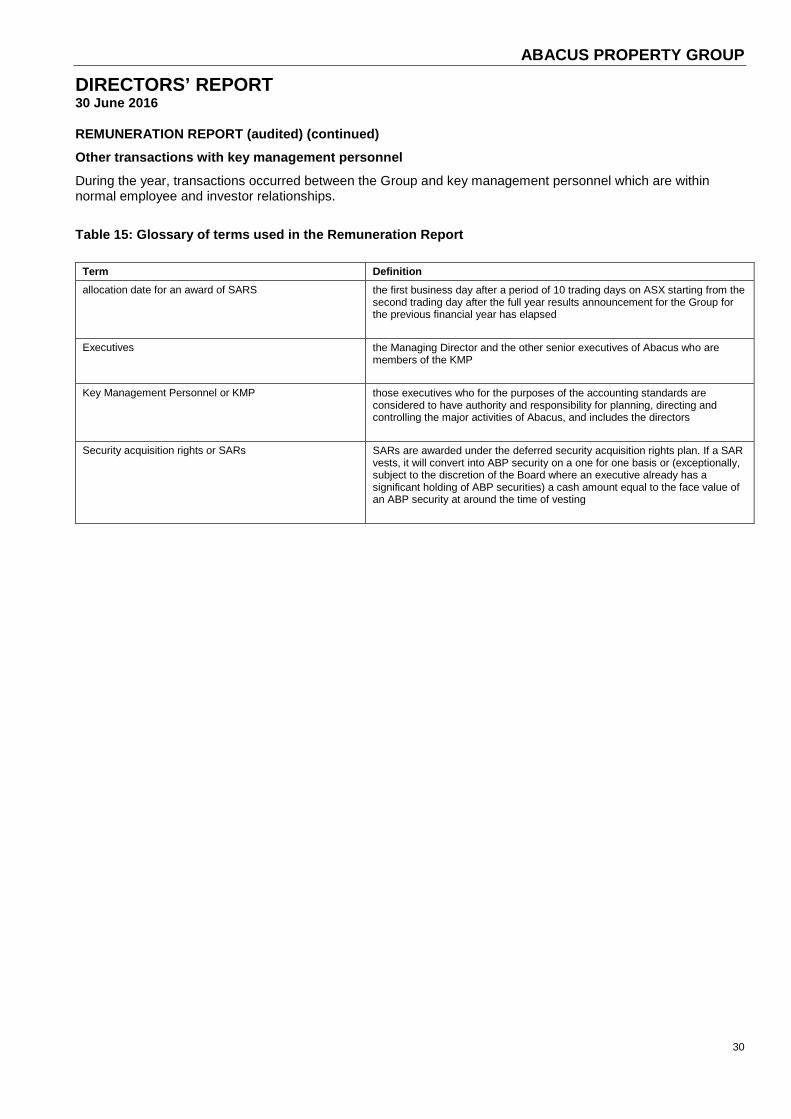
ABACUS PROPERTY GROUP
30
DIRECTORS’ REPORT 30 June 2016
REMUNERATION REPORT (audited) (continued) Other transactions with key management personnel During the year, transactions occurred between the Group and key management personnel which are within normal employee and investor relationships. Table 15: Glossary of terms used in the Remuneration Report
Term Definition allocation date for an award of SARS the first business day after a period of 10 trading days on ASX starting from the
second trading day after the full year results announcement for the Group for the previous financial year has elapsed
Executives the Managing Director and the other senior executives of Abacus who are members of the KMP
Key Management Personnel or KMP those executives who for the purposes of the accounting standards are considered to have authority and responsibility for planning, directing and controlling the major activities of Abacus, and includes the directors
Security acquisition rights or SARs SARs are awarded under the deferred security acquisition rights plan. If a SAR vests, it will convert into ABP security on a one for one basis or (exceptionally, subject to the discretion of the Board where an executive already has a significant holding of ABP securities) a cash amount equal to the face value of an ABP security at around the time of vesting

ABACUS PROPERTY GROUP
31
DIRECTORS’ REPORT 30 June 2016
Signed in accordance with a resolution of the directors. Abacus Group Holdings Limited (ABN 31 080 604 619)
John Thame Frank Wolf Chairman Managing Director Sydney, 19 August 2016

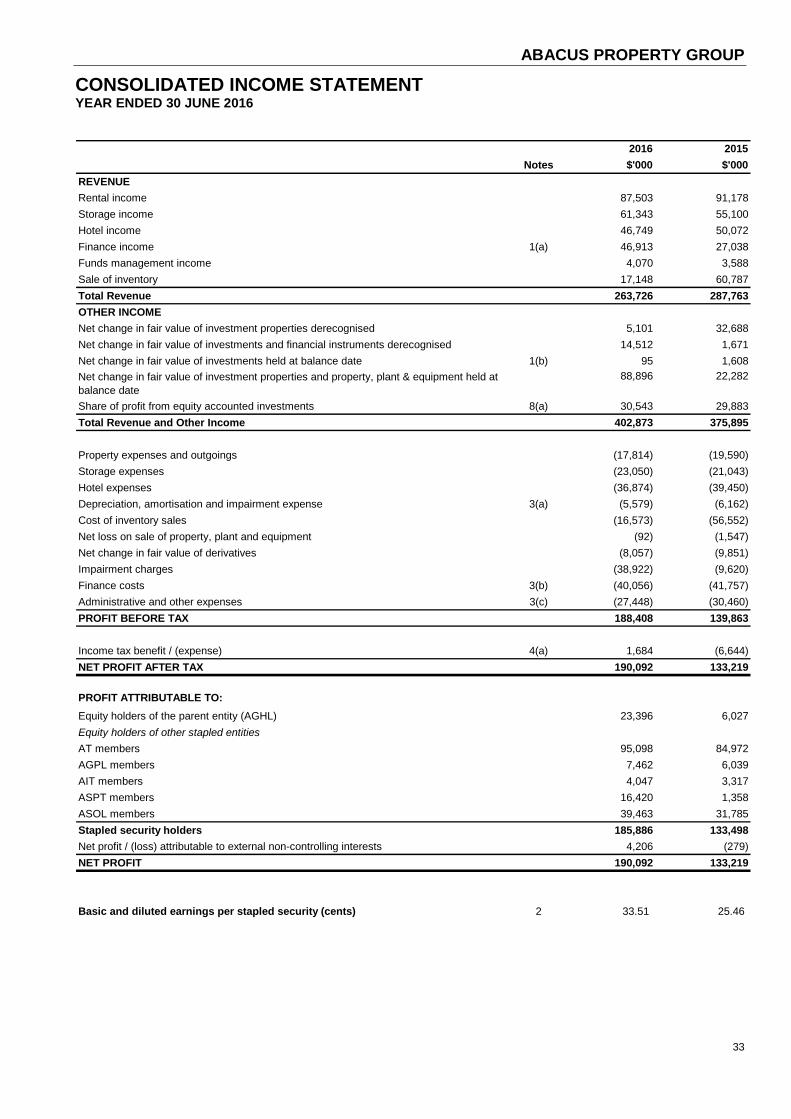
ABACUS PROPERTY GROUP
33
CONSOLIDATED INCOME STATEMENT YEAR ENDED 30 JUNE 2016
2016 2015Notes $'000 $'000
REVENUERental income 87,503 91,178 Storage income 61,343 55,100 Hotel income 46,749 50,072 Finance income 1(a) 46,913 27,038 Funds management income 4,070 3,588 Sale of inventory 17,148 60,787 Total Revenue 263,726 287,763 OTHER INCOMENet change in fair value of investment properties derecognised 5,101 32,688 Net change in fair value of investments and financial instruments derecognised 14,512 1,671 Net change in fair value of investments held at balance date 1(b) 95 1,608 Net change in fair value of investment properties and property, plant & equipment held at balance date
88,896 22,282
Share of profit from equity accounted investments 8(a) 30,543 29,883 Total Revenue and Other Income 402,873 375,895
Property expenses and outgoings (17,814) (19,590)Storage expenses (23,050) (21,043)Hotel expenses (36,874) (39,450)Depreciation, amortisation and impairment expense 3(a) (5,579) (6,162)Cost of inventory sales (16,573) (56,552)Net loss on sale of property, plant and equipment (92) (1,547)Net change in fair value of derivatives (8,057) (9,851)Impairment charges (38,922) (9,620)Finance costs 3(b) (40,056) (41,757)Administrative and other expenses 3(c) (27,448) (30,460)PROFIT BEFORE TAX 188,408 139,863
Income tax benefit / (expense) 4(a) 1,684 (6,644)NET PROFIT AFTER TAX 190,092 133,219
PROFIT ATTRIBUTABLE TO:Equity holders of the parent entity (AGHL) 23,396 6,027 Equity holders of other stapled entitiesAT members 95,098 84,972 AGPL members 7,462 6,039 AIT members 4,047 3,317 ASPT members 16,420 1,358 ASOL members 39,463 31,785 Stapled security holders 185,886 133,498 Net profit / (loss) attributable to external non-controlling interests 4,206 (279)NET PROFIT 190,092 133,219
Basic and diluted earnings per stapled security (cents) 2 33.51 25.46

ABACUS PROPERTY GROUP
34
CONSOLIDATED STATEMENT OF COMPREHENSIVE INCOME YEAR ENDED 30 JUNE 2016
2016 2015$'000 $'000
NET PROFIT AFTER TAX 190,092 133,219
OTHER COMPREHENSIVE INCOMEItems that will not be reclassified subsequently to the income statementRevaluation of assets, net of tax 8,813 350 Items that may be reclassified subsequently to the income statementForeign exchange translation adjustments, net of tax 2,662 (3,490)TOTAL COMPREHENSIVE INCOME FOR THE YEAR 201,567 130,079
Total comprehensive income attributable to:Members of the APG Group 193,858 130,893 External non-controlling interests 7,709 (814)TOTAL COMPREHENSIVE INCOME FOR THE YEAR 201,567 130,079
Total comprehensive income / (loss) attributable to members of the Group analysed by amounts attributable to:AGHL members 28,706 5,093 AT members 95,098 84,972 AGPL members 7,462 6,039 AIT members 4,047 3,317 ASPT members 18,942 (144)ASOL members 39,603 31,616 TOTAL COMPREHENSIVE INCOME AFTER TAX ATTRIBUTABLETO MEMBERS OF THE GROUP 193,858 130,893

ABACUS PROPERTY GROUP
35
CONSOLIDATED STATEMENT OF FINANCIAL POSITION AS AT 30 JUNE 2016
2016 2015Notes $'000 $'000
CURRENT ASSETSInvestment properties held for sale 5 186,550 51,047 Inventory 6(a) 9,845 7,464 Property loans 7(a) 93,685 25 Cash and cash equivalents 9 43,792 38,388 Property, plant and equipment 17 130,000 3,080 Trade and other receivables 8,851 11,680 Derivatives at fair value - 263 Other 5,138 2,742 TOTAL CURRENT ASSETS 477,861 114,689
NON-CURRENT ASSETSInvestment properties 5 1,335,069 1,317,101 Inventory 6(b) 68,633 112,689 Property loans 7(b) 291,577 263,008 Equity accounted investments 8 179,935 137,227 Deferred tax assets 4(c) 10,809 6,658 Property, plant and equipment 17 4,676 118,019 Other financial assets 7(c) 49,269 34,595 Intangible assets and goodwill 23 32,461 33,261 TOTAL NON-CURRENT ASSETS 1,972,429 2,022,558
TOTAL ASSETS 2,450,290 2,137,247
CURRENT LIABILITIESTrade and other payables 26,167 29,812 Interest-bearing loans and borrowings 11(a) 124,745 - Derivatives at fair value 2,650 - Income tax payable 507 3,329 Other financial liabilities 22 45,934 25 Other 8,476 9,057 TOTAL CURRENT LIABILITIES 208,479 42,223
NON-CURRENT LIABILITIESInterest-bearing loans and borrowings 11(b) 631,323 544,045 Derivatives at fair value 37,591 51,125 Deferred tax liabilities 4(c) 9,535 10,490 Other financial liabilities 22 - 45,940 Other 4,085 5,296
682,534 656,896
TOTAL LIABILITIES 891,013 699,119
NET ASSETS 1,559,277 1,438,128
TOTAL EQUITY 1,559,277 1,438,128
TOTAL NON-CURRENT LIABILITIES

ABACUS PROPERTY GROUP
36
CONSOLIDATED STATEMENT OF FINANCIAL POSITION (continued) AS AT 30 JUNE 2016
2016 2015Notes $'000 $'000
Equity attributable to members of AGHL:Contributed equity 332,074 330,029 Reserves 12,793 7,870 Accumulated losses 6,894 (16,502)Total equity attributable to members of AGHL: 351,761 321,397
Equity attributable to unitholders of AT:Contributed equity 905,159 899,670 Accumulated losses (104,318) (128,683)Total equity attributable to unitholders of AT: 800,841 770,987
Equity attributable to members of AGPL:Contributed equity 25,867 25,649 Retained earnings 11,441 3,979 Total equity attributable to members of AGPL: 37,308 29,628
Equity attributable to unitholders of AIT:Contributed equity 126,451 125,682 Accumulated losses (69,309) (56,970)Total equity attributable to unitholders of AIT: 57,142 68,712
Equity attributable to members of ASPT:Contributed equity 115,441 114,369 Reserves 2,230 (293)Accumulated losses (8,285) (17,322)Total equity attributable to members of ASPT: 109,386 96,754
Equity attributable to members of ASOL:Contributed equity 18,886 18,616 Reserves 135 (5)Retained earnings 140,523 101,060 Total equity attributable to members of ASOL: 159,544 119,671
Equity attributable to external non-controlling interest:Contributed equity 72,822 65,543 Reserves 3,642 139 Accumulated losses (33,169) (34,703)Total equity attributable to external non-controlling interest: 43,295 30,979
TOTAL EQUITY 1,559,277 1,438,128
Contributed equity 13 1,523,878 1,514,015 Reserves 15,158 7,572 Accumulated losses (23,054) (114,438)Total stapled security holders' interest in equity 1,515,982 1,407,149 Total external non-controlling interest 43,295 30,979 TOTAL EQUITY 1,559,277 1,438,128

ABACUS PROPERTY GROUP
37
CONSOLIDATED STATEMENT OF CASH FLOW YEAR ENDED 30 JUNE 2016
2016 2015Notes $'000 $'000
CASH FLOWS FROM OPERATING ACTIVITIESIncome receipts 282,404 327,734 Interest received 642 2,502 Distributions received 432 1,059 Income tax paid (8,524) (11,122)Finance costs paid (38,694) (41,141)Operating payments (133,709) (120,040)Payments for land acquisitions (11,016) (39,660)
NET CASH FLOWS FROM OPERATING ACTIVITIES 9 91,535 119,332
CASH FLOWS FROM INVESTING ACTIVITIESPayments for investments and funds advanced (186,867) (140,373)Proceeds from sale and settlement of investments and funds repaid 70,419 58,934 Purchase of property, plant and equipment (3,555) (3,640)Disposal of property, plant and equipment 3,768 32,699 Purchase of investment properties (158,637) (210,821)Disposal of investment properties 84,645 235,293 Payment for other investments (1,753) (3,270)
NET CASH FLOWS USED IN INVESTING ACTIVITIES (191,980) (31,178)
CASH FLOWS FROM FINANCING ACTIVITIESProceeds from issue of stapled securities 7,498 107,569 Return of capital (234) (585)Payment of issue / finance costs (4,236) (2,985)Repayment of borrowings (43,107) (238,150)Proceeds from borrowings 238,023 115,892 Distributions paid (92,228) (93,005)
NET CASH FLOWS FROM / (USED IN) FINANCING ACTIVITIES 105,716 (111,264)
NET INCREASE / (DECREASE) IN CASH AND CASH EQUIVALENTS 5,271 (23,110)Net foreign exchange differences 133 (155)Cash and cash equivalents at beginning of year 38,388 61,653
CASH AND CASH EQUIVALENTS AT END OF YEAR 9 43,792 38,388

ABACUS PROPERTY GROUP
38
CONSOLIDATED STATEMENT OF CHANGES IN EQUITY YEAR ENDED 30 JUNE 2016
ExternalAsset Foreign Employee Non-
Issued revaluation currency equity Retained controlling Totalcapital reserve translation benefits earnings interest Equity
CONSOLIDATED $'000 $'000 $'000 $'000 $'000 $'000 $'000
At 1 July 2015 1,514,015 211 (298) 7,659 (114,438) 30,979 1,438,128 Other comprehensive income - 5,310 2,662 - - 3,503 11,475 Net income for the year - - - - 185,886 4,206 190,092 Total comprehensive income for the year - 5,310 2,662 - 185,886 7,709 201,567 Equity raisings - - - - - 7,504 7,504 Return of capital - - - - - (234) (234)Issue costs (89) - - - - - (89)Distribution reinvestment plan 9,952 - - - - - 9,952 Security acquisition rights - - - (386) - - (386)Distribution to security holders - - - - (94,502) (2,663) (97,165)At 30 June 2016 1,523,878 5,521 2,364 7,273 (23,054) 43,295 1,559,277
ExternalAsset Foreign Employee Non-
Issued revaluation currency equity Retained controlling Totalcapital reserve translation benefits earnings interest Equity
CONSOLIDATED $'000 $'000 $'000 $'000 $'000 $'000 $'000
At 1 July 2014 1,403,756 - 2,517 7,289 (160,163) 36,791 1,290,190 Other comprehensive income - 211 (2,815) - - (536) (3,140)Net income for the year - - - - 133,498 (279) 133,219 Total comprehensive income for the year - 211 (2,815) - 133,498 (815) 130,079 Equity raisings 107,570 - - - - - 107,570 Return of capital - - - - - (585) (585)Issue costs (701) - - - - - (701)Distribution reinvestment plan 3,390 - - - - - 3,390 Security acquisition rights - - - 370 - - 370 Distribution to security holders - - - - (87,773) (4,412) (92,185)At 30 June 2015 1,514,015 211 (298) 7,659 (114,438) 30,979 1,438,128
Attributable to the stapled security holder
Attributable to the stapled security holder

ABACUS PROPERTY GROUP
39
CONTENTS 30 JUNE 2016
Notes to the financial statements
About this report Page 40
Segment information Page 42
Results for the year
Operating assets and liabilities
Capital structure and financing costs
Group Structure Other Items
1. Revenue
5. Investment properties
9. Cash and cash equivalents
15. Interest in subsidiaries
17. Property, plant and equipment
2. Earnings per stapled security
6. Inventory 10. Capital management
16. Parent entity information
18. Commitments and contingencies
3. Expenses 7. Property loans and other financial assets
11. Interest bearing loans and borrowings
19. Related party disclosures
4. Income tax 8. Investments accounted for using the equity method
12. Financial instruments
20. Key management personnel
13. Contributed equity
21. Security based payments
14. Distributions paid and proposed
22. Other financial liabilities
23. Intangible assets and goodwill
24. Summary of significant accounting policies
25. Auditors remuneration
26. Events after balance date
Signed reports
Directors’ declaration Page 104
Independent auditor’s report Page 105

ABACUS PROPERTY GROUP
40
NOTES TO THE FINANCIAL STATEMENTS – About this Report 30 JUNE 2016
Abacus Property Group (“APG” or the “Group”) is comprised of Abacus Group Holdings Limited (“AGHL”) (the nominated parent entity), Abacus Trust (“AT”), Abacus Group Projects Limited (“AGPL”), Abacus Income Trust (“AIT”), Abacus Storage Property Trust (“ASPT”) and Abacus Storage Operations Limited (“ASOL”). Shares in AGHL, AGPL and ASOL and units in AT, AIT and ASPT have been stapled together so that neither can be dealt with without the other. The securities trade as one security on the Australian Securities Exchange (the “ASX”) under the code ABP.
The financial report of the Group for the year ended 30 June 2016 was authorised for issue in accordance with a resolution of the directors on 19 August 2016.
The nature of the operations and principal activities of the Group are described in the Directors’ Report.
SIGNIFICANT ACCOUNTING JUDGMENTS, ESTIMATES AND ASSUMPTIONS In applying the Group’s accounting policies management continually evaluates judgements, estimates and assumptions based on experience and other factors, including expectations of future events that may have an impact on the Group. All judgements, estimates and assumptions made are believed to be reasonable, based on the most current set of circumstances available to management. Actual results may differ from these judgements, estimates and assumptions. Significant judgements, estimates and assumptions made by management in the preparation of these financial statements are outlined below:
(a) Significant accounting judgements Accounting policy – financial assets and liabilities at fair value through profit and loss
A financial asset or financial liability is designated by the entity as being at fair value through profit or loss upon initial recognition. The Group uses this designation where doing so results in more relevant information, because it is a group of financial assets and liabilities which is managed and its performance is evaluated on a fair value basis, in accordance with the Group’s documented risk management and investment strategy, and information about the instruments is provided internally on that basis to the entity’s key management personnel and the Board.
Control and significant influence
In determining whether the Group has control over an entity, the Group assesses its exposure or rights to variable returns from its involvement with the entity and whether it has the ability to affect those returns through its power over the investee. The Group may have significant influence over an entity when it has the power to participate in the financial and operating policy decisions of the entity but is not in control or joint control of those policies.
(b) Significant accounting estimates and assumptions Impairment of goodwill and intangibles with indefinite useful lives
The Group determines whether goodwill and intangibles with indefinite useful lives are impaired at least on an annual basis. This requires an estimation of the recoverable amount of the cash-generating units to which the goodwill and intangibles with indefinite useful lives are allocated. For goodwill this involves value in use calculations which incorporate a number of key estimates and assumptions around cash flows and fair value of investment properties upon which these determine the revenue / cash flows. The assumptions used in the estimations of the recoverable amount and the carrying amount of goodwill and intangibles with indefinite useful lives are discussed in Note 23.
Impairment of property loans and financial assets
The Group assesses impairment of all assets at each reporting date by evaluating conditions specific to the Group and to the particular asset that may lead to impairment. If an impairment trigger exists the recoverable amount of the asset is determined. For property loans and interim funding to related funds this involves value in use calculations, which incorporate a number of key estimates and assumptions around cashflows and fair value of underlying investment properties held by the borrower and expected timing of cashflows from equity raisings of related funds.

ABACUS PROPERTY GROUP
41
NOTES TO THE FINANCIAL STATEMENTS – About this Report (continued) 30 JUNE 2016
Fair value of derivatives
The fair value of derivatives is determined using closing quoted market prices (where there is an active market) or a suitable pricing model based on discounted cash flow analysis using assumptions supported by observable market rates. Where derivatives are not quoted in an active market their fair value has been determined using (where available) quoted market inputs and other data relevant to assessing the value of the financial instrument, including financial guarantees granted by the Group, estimates of the probability of exercise.
Valuation of investment properties and property, plant and equipment held at fair value
The Group makes judgements in respect of the fair value of investment properties (Note 24(o)). The fair value of these properties are reviewed regularly by management with reference to external independent property valuations and market conditions existing at reporting date, using generally accepted market practices. The assumptions underlying estimated fair values are those relating to the receipt of contractual rents, expected future market rentals, maintenance requirements, capitalisation rates and discount rates that reflect current market conditions and current or recent property investment prices. If there is any material change in these assumptions or regional, national or international economic conditions, the fair value of investment properties may differ and may need to be re-estimated.
Net realisable value of inventory
Inventories are carried at the lower of cost and net realisable value. Net realisable value is the estimated selling price in the ordinary course of business less the estimated costs of completion and selling expenses. The estimates take into consideration fluctuations of price or cost directly relating to events occurring after the end of the period to the extent that such events confirm conditions existing at the end of the period. The key assumptions that require the use of management judgment are reviewed half-yearly and these assumptions include the number of lots sold per year and the average selling price per lot. If the net realisable value is less than the carrying value of inventory, an impairment loss is recognised in the income statement.
Fair value of financial assets
The Group holds investments in unlisted securities and enters into loans and receivables with associated options that provide for a variety of outcomes including repayment of principal and interest, satisfaction through obtaining interests in equity or property or combinations thereof. At the end of the year, the fair value of the maximum exposure to credit risk in relation to these instruments was $23 million (2015: $31 million).

ABACUS PROPERTY GROUP
42
NOTES TO THE FINANCIAL STATEMENTS – Segment Information 30 JUNE 2016
The Group predominately operates in Australia. Following are the Group’s operating segments, which are regularly reviewed by the Chief Operating Decision Maker (“CODM”) to make decisions about resources allocation and to assess performance:
(a) Property: the segment is responsible for the investment in and ownership of commercial, retail and industrial properties. This segment also includes the equity accounting of material co-investments in property entities not engaged in development and construction projects;
(b) Funds Management: the segment includes development, origination, co-investment and fund management revenues and expenses in addition to discharging the Group’s responsible entity obligation;
(c) Property Ventures: provides secured lending and related property financing solutions and is also responsible for the Group’s investment in joint venture developments and construction projects, which includes revenue from debt and equity investments in joint ventures. This segment is also responsible for the Group’s investment in property securities; and
(d) Storage: the segment is responsible for the investment in, and ownership of, self-storage facilities.
Segment result includes transactions between operating segments which are then eliminated.
The Group has consolidated the Abacus Hospitality Fund, Abacus Diversified Income Fund II and Abacus Wodonga Land Fund. The performances of these entities which are operated as externally managed investment schemes are considered to be non-core segments and are reviewed separately to that of the performance of the Group’s business segments.

ABACUS PROPERTY GROUP
43
NOTES TO THE FINANCIAL STATEMENTS – Segment Information (continued) 30 JUNE 2016
Funds Property Total Core Unallocated/Property Storage Management Ventures Segments AHF ADIFII AWLF Eliminations Consolidated
Year ended 30 June 2016 $'000 $'000 $'000 $'000 $'000 $'000 $'000 $'000 $'000 $'000RevenueRental income 69,602 - - - 69,602 - 17,883 18 - 87,503 Storage income - 61,343 - - 61,343 - - - - 61,343 Hotel income 321 - - - 321 46,428 - - - 46,749 Finance income - - - 46,276 46,276 4 2 - - 46,282 Funds management income - - 12,487 - 12,487 - - - (8,417) 4,070 Sale of inventory 347 - - 2,624 2,971 - - 14,177 - 17,148 Net change in fair value of investment properties derecognised 3,813 - - - 3,813 - 1,288 - - 5,101
Net change in fair value of investments and financial instruments derecognised 3,103 - - 9,149 12,252 - 2,260 - - 14,512
Net change in fair value of investments held at balance date - - 14 - 14 51 8,600 - (8,570) 95
Net change in investment properties and property, plant & equipment held at balance date
37,370 36,659 - - 74,029 8,513 6,354 - - 88,896
Share of profit from equity accounted investments ^ 24,892 - 420 5,651 30,963 - - - (420) 30,543
Other unallocated revenue - - - - 457 122 37 15 - 631 Total consolidated revenue 139,448 98,002 12,921 63,700 314,528 55,118 36,424 14,210 (17,407) 402,873
Property expenses and outgoings (14,027) - - - (14,027) (206) (3,704) (368) 491 (17,814)Storage expenses - (23,050) - - (23,050) - - - - (23,050)Hotel expenses (483) - - - (483) (36,391) - - - (36,874)
Depreciation and amortisation expense (1,483) (357) - - (1,840) (3,622) (115) (2) - (5,579)
Cost of inventory sales (2,840) - - (2,284) (5,124) - - (14,175) 2,726 (16,573)Net loss on sale of property, plant & equipment (92) - - - (92) - - - - (92)
Impairment charges - - - (40,622) (40,622) - - - 1,700 (38,922)Administrative and other expenses (9,988) (5,548) (2,219) (4,439) (22,194) (1,294) (413) (57) (3,490) (27,448)Segment result 110,535 69,047 10,702 16,355 207,096 13,605 32,192 (392) (15,980) 236,521
Core Segments Non Core Segments
^ includes fair value gain of $11.6 million

ABACUS PROPERTY GROUP
44
NOTES TO THE FINANCIAL STATEMENTS – Segment Information (continued) 30 JUNE 2016
Funds Property Total Core Unallocated/Property Storage Management Ventures Segments AHF ADIFII AWLF Eliminations Consolidated
Year ended 30 June 2016 $'000 $'000 $'000 $'000 $'000 $'000 $'000 $'000 $'000 $'000
Net change in fair value ofderivatives (8,258) 1,021 (820) - - (8,057)
Finance costs (31,337) (5,766) (8,369) (3) 5,419 (40,056)Profit / (loss) before tax 167,501 8,860 23,003 (395) (10,561) 188,408 Income tax benefit / (expense) 2,232 (290) (258) - - 1,684 Net profit / (loss) for the year 169,733 8,570 22,745 (395) (10,561) 190,092 less non-controlling interest (1) (4,205) - - - (4,206)
169,732 4,365 22,745 (395) (10,561) 185,886 Net profit / (loss) for the year attributable to members of the Group
Core Segments Non Core Segments

ABACUS PROPERTY GROUP
45
NOTES TO THE FINANCIAL STATEMENTS – Segment Information (continued) 30 JUNE 2016
Funds Property Total Core Unallocated/Property Storage Management Ventures Segments AHF ADIFII AWLF Eliminations Consolidated
Year ended 30 June 2015 $'000 $'000 $'000 $'000 $'000 $'000 $'000 $'000 $'000 $'000RevenueRental income 73,122 - - - 73,122 1,132 16,885 39 - 91,178 Storage income - 55,100 - - 55,100 - - - - 55,100 Hotel income 1,853 - - - 1,853 48,219 - - - 50,072 Finance income - - - 26,243 26,243 - - 4 - 26,247 Funds management income - - 10,353 - 10,353 - - - (6,765) 3,588 Sale of inventory 9,724 - - 29,254 38,978 - - 21,809 - 60,787 Net change in fair value of investment properties derecognised 27,576 - - - 27,576 - 5,112 - - 32,688
Net change in fair value of financial instruments derecognised 3,116 - - (2) 3,114 (1,589) - 146 - 1,671
Net change in investment properties and property, plant & equipment held at balance date
10,188 19,242 - - 29,430 (74) (8,554) - 1,480 22,282
Net change in fair value of investments held at balance date - - - 1,323 1,323 - - - 285 1,608
Share of profit from equity accounted investments ^ 23,668 - 405 6,215 30,288 - - - (405) 29,883
Other unallocated revenue - - - - 590 141 36 24 - 791 Total consolidated revenue 149,247 74,342 10,758 63,033 297,970 47,829 13,479 22,022 (5,405) 375,895
Property expenses and outgoings (15,075) - - - (15,075) (206) (3,278) (298) 552 (18,305)Storage expenses - (21,043) - - (21,043) - - - - (21,043)Hotel expenses (1,913) - - - (1,913) (37,537) - - - (39,450)
Depreciation and amortisation expense (1,811) - - (353) (2,164) (3,727) (269) (2) - (6,162)
Cost of inventory sales (6,803) - - (27,740) (34,543) - - (22,009) - (56,552)Net loss on sale of property, plant & equipment - - - - - (1,547) - - - (1,547)
Impairment charges (1,285) - - (3,647) (4,932) - - (7,500) - (12,432)Administrative and other expenses (10,286) (5,714) (2,286) (4,570) (22,856) (1,403) (625) (114) (3,935) (28,933)Segment result 112,074 47,585 8,472 26,723 195,444 3,409 9,307 (7,901) (8,788) 191,471
Core Segments Non Core Segments
^ includes fair value loss of $0.9 million

ABACUS PROPERTY GROUP
46
NOTES TO THE FINANCIAL STATEMENTS – Segment Information (continued) 30 JUNE 2016
Funds Property Total Core Unallocated/Property Storage Management Ventures Segments AHF ADIFII AWLF Eliminations Consolidated
Year ended 30 June 2015 $'000 $'000 $'000 $'000 $'000 $'000 $'000 $'000 $'000 $'000
Net change in fair value ofderivatives (10,948) 255 842 - - (9,851)
Finance costs (30,874) (5,929) (9,596) - 4,642 (41,757)Profit / (loss) before tax 153,622 (2,265) 553 (7,901) (4,146) 139,863 Income tax expense (5,156) (914) 325 - (899) (6,644)Net profit / (loss) for the year 148,466 (3,179) 878 (7,901) (5,045) 133,219 less non-controlling interest (833) 1,112 - - - 279
147,633 (2,067) 878 (7,901) (5,045) 133,498 Net profit / (loss) for the year attributable to members of the Group
Core Segments Non Core Segments
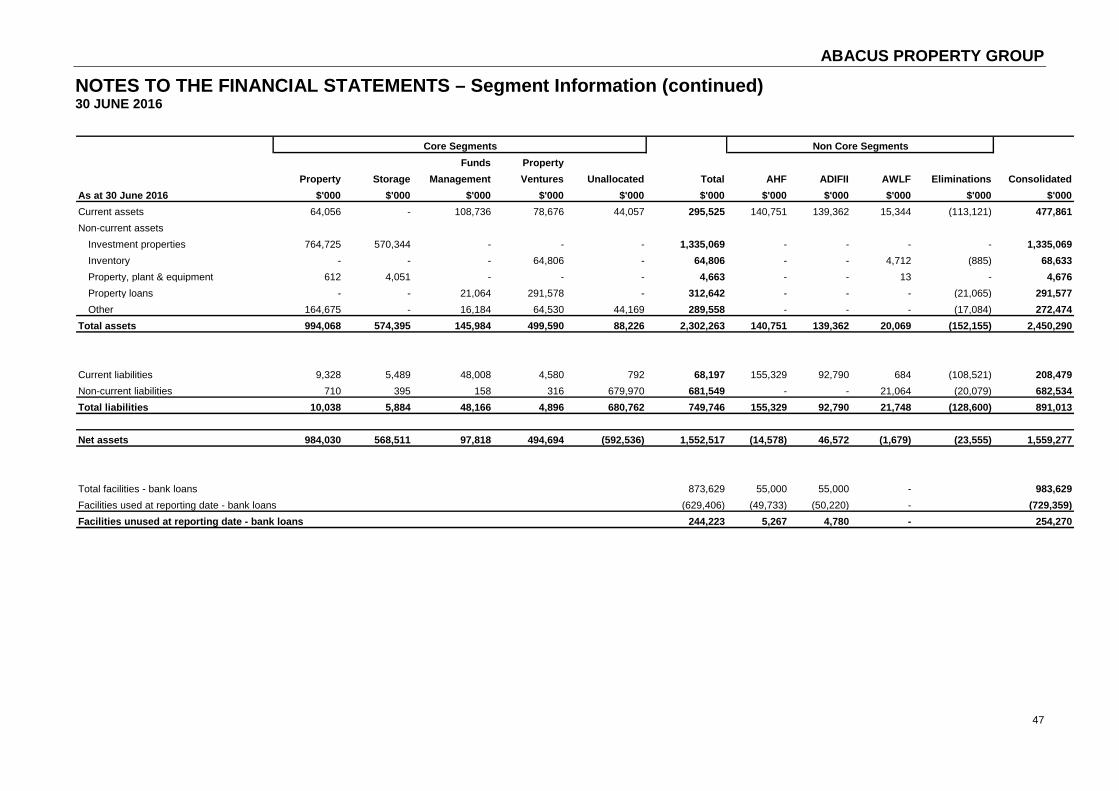
ABACUS PROPERTY GROUP
47
NOTES TO THE FINANCIAL STATEMENTS – Segment Information (continued) 30 JUNE 2016
Funds PropertyProperty Storage Management Ventures Unallocated Total AHF ADIFII AWLF Eliminations Consolidated
As at 30 June 2016 $'000 $'000 $'000 $'000 $'000 $'000 $'000 $'000 $'000 $'000 $'000Current assets 64,056 - 108,736 78,676 44,057 295,525 140,751 139,362 15,344 (113,121) 477,861 Non-current assets
Investment properties 764,725 570,344 - - - 1,335,069 - - - - 1,335,069 Inventory - - - 64,806 - 64,806 - - 4,712 (885) 68,633 Property, plant & equipment 612 4,051 - - - 4,663 - - 13 - 4,676 Property loans - - 21,064 291,578 - 312,642 - - - (21,065) 291,577 Other 164,675 - 16,184 64,530 44,169 289,558 - - - (17,084) 272,474
Total assets 994,068 574,395 145,984 499,590 88,226 2,302,263 140,751 139,362 20,069 (152,155) 2,450,290
Current liabilities 9,328 5,489 48,008 4,580 792 68,197 155,329 92,790 684 (108,521) 208,479 Non-current liabilities 710 395 158 316 679,970 681,549 - - 21,064 (20,079) 682,534 Total liabilities 10,038 5,884 48,166 4,896 680,762 749,746 155,329 92,790 21,748 (128,600) 891,013
Net assets 984,030 568,511 97,818 494,694 (592,536) 1,552,517 (14,578) 46,572 (1,679) (23,555) 1,559,277
Total facilities - bank loans 873,629 55,000 55,000 - 983,629 Facilities used at reporting date - bank loans (629,406) (49,733) (50,220) - (729,359)Facilities unused at reporting date - bank loans 244,223 5,267 4,780 - 254,270
Core Segments Non Core Segments

ABACUS PROPERTY GROUP
48
NOTES TO THE FINANCIAL STATEMENTS – Segment Information (continued) 30 JUNE 2016
Funds PropertyProperty Storage Management Ventures Unallocated Total AHF ADIFII AWLF Eliminations Consolidated
As at 30 June 2015 $'000 $'000 $'000 $'000 $'000 $'000 $'000 $'000 $'000 $'000 $'000Current assets 38,796 - - - 38,687 77,483 9,677 18,789 14,250 (5,510) 114,689 Non-current assets
Investment properties 700,440 453,761 - - - 1,154,201 - 162,900 - - 1,317,101 Inventory - - - 107,652 - 107,652 - - 9,079 (4,042) 112,689 Property, plant & equipment 491 3,489 - - - 3,980 114,030 - 9 - 118,019 Property loans - - 131,934 263,008 - 394,942 - - - (131,934) 263,008 Other 120,927 - 9,000 48,175 40,726 218,828 2,797 15 - (9,899) 211,741
Total assets 860,654 457,250 140,934 418,835 79,413 1,957,086 126,504 181,704 23,338 (151,385) 2,137,247
Current liabilities 11,079 6,840 2,487 5,248 3,460 29,114 8,236 3,687 1,186 - 42,223 Non-current liabilities 621 345 46,078 276 441,220 488,540 149,249 149,094 23,432 (153,419) 656,896 Total liabilities 11,700 7,185 48,565 5,524 444,680 517,654 157,485 152,781 24,618 (153,419) 699,119
Net assets 848,954 450,065 92,369 413,311 (365,267) 1,439,432 (30,981) 28,923 (1,280) 2,034 1,438,128
Total facilities - bank loans 770,000 55,000 80,000 - 905,000 Facilities used at reporting date - bank loans (387,832) (51,233) (79,895) - (518,960)Facilities unused at reporting date - bank loans 382,168 3,767 105 - 386,040
Non Core SegmentsCore Segments

ABACUS PROPERTY GROUP
49
NOTES TO THE FINANCIAL STATEMENTS 30 JUNE 2016
1. REVENUE
2016 2016$'000 $'000
(a) Finance incomeInterest and fee income on secured loans 46,283 26,248 Bank interest 630 790 Total finance income 46,913 27,038
(b) Net change in fair value of investments held at balance dateNet change in fair value of options held at balance date (2,966) - Net change in fair value of other investments held at balance date 3,061 1,608 Total change in fair value of investments held at balance date 95 1,608
2. EARNINGS PER STAPLED SECURITY
2016 2015
Basic and diluted earnings per stapled security (cents) 33.51 25.46
Reconciliation of earnings used in calculating earnings per stapled securityBasic and diluted earnings per stapled securityNet profit ($'000) 185,886 133,498 Weighted average number of shares:Weighted average number of stapled securities for basic earning per security ('000) 554,703 524,437
3. EXPENSES
2016 2015$'000 $'000
(a) Depreciation, amortisation and impairment expenseDepreciation and amortisation of property, plant and equipment and software 4,256 4,360 Net loss on property, plant and equipment remeasured at fair value - (435) Amortisation - leasing costs 1,323 2,237 Total depreciation, amortisation and impairment expense 5,579 6,162
(b) Finance costsInterest on loans 38,045 39,822 Amortisation of finance costs 2,011 1,935 Total finance costs 40,056 41,757
(c) Administrative and other expensesWages and salaries 13,477 15,035 Contributions to defined contribution plans 1,011 896 Other expenses 12,960 14,529 Total administrative and other expenses 27,448 30,460

ABACUS PROPERTY GROUP
50
NOTES TO THE FINANCIAL STATEMENTS 30 JUNE 2016
4. INCOME TAX
2016 2015$'000 $'000
(a) Income tax expenseThe major components of income tax expense are:Income StatementCurrent income tax
Current income tax (benefit) / charge (1,119) 7,430 Adjustments in respect of current income tax of previous years (79) 277
Deferred income taxRelating to origination and reversal of temporary differences (486) (1,063)
Income tax (benefit) / expense reported in the income statement (1,684) 6,644
(b) Numerical reconciliation between aggregate tax expense recognised in the income statement and taxexpense calculated per the statutory income tax rate
A reconciliation between tax expense and the product of the accounting profit before income tax multiplied by the Group's applicable income tax rate is as follows:
Profit before income tax expense 188,407 139,863
Prima facie income tax expense calculated at 30% (AU) 55,917 42,312 Prima facie income tax expense calculated at 28% (NZ) 565 (330) Less prima facie income tax expense on profit from Trusts (54,963) (36,659) Prima Facie income tax of entities subject to income tax 1,519 5,323
Adjustment of prior year tax applied (79) 277 Derecognition of deferred tax assets - 315 Restructuring transactions (3,125) - Other items (net) 1 729
Income tax (benefit) / expense (1,684) 6,644
Income tax expense reported in the consolidated income statement (1,684) 6,644
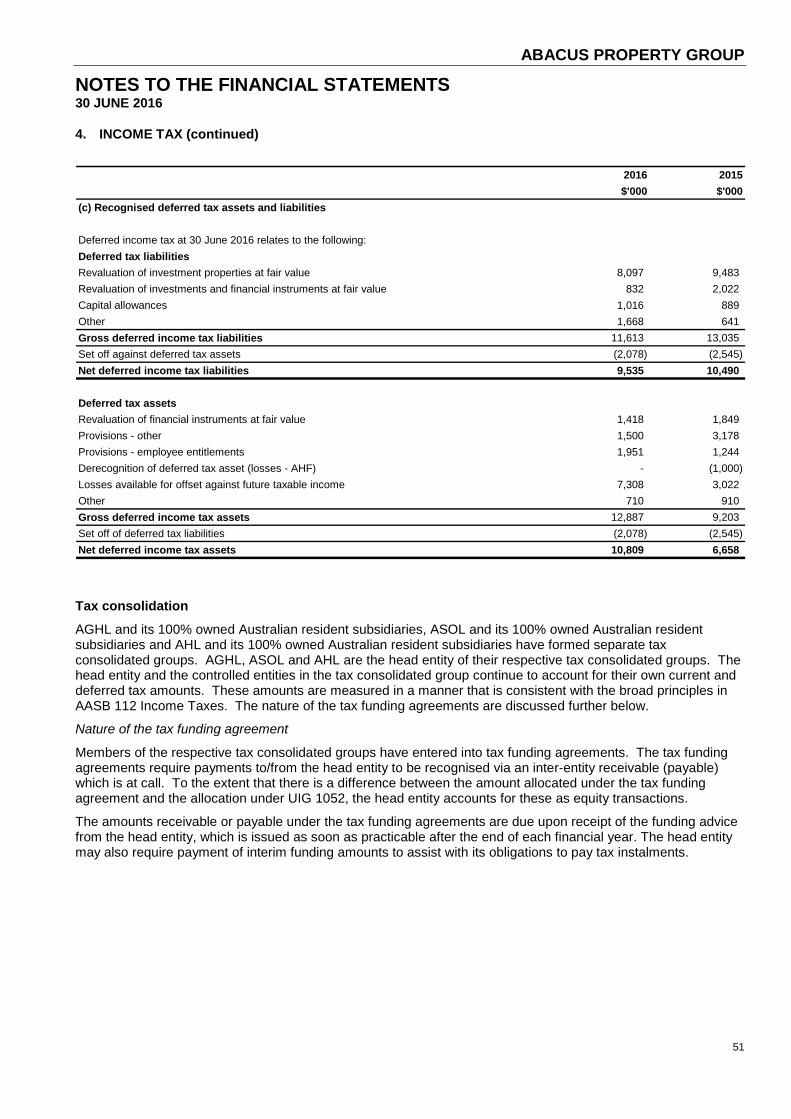
ABACUS PROPERTY GROUP
51
NOTES TO THE FINANCIAL STATEMENTS 30 JUNE 2016
4. INCOME TAX (continued)
2016 2015$'000 $'000
(c) Recognised deferred tax assets and liabilities
Deferred income tax at 30 June 2016 relates to the following:Deferred tax liabilitiesRevaluation of investment properties at fair value 8,097 9,483 Revaluation of investments and financial instruments at fair value 832 2,022 Capital allowances 1,016 889 Other 1,668 641 Gross deferred income tax liabilities 11,613 13,035 Set off against deferred tax assets (2,078) (2,545) Net deferred income tax liabilities 9,535 10,490
Deferred tax assetsRevaluation of financial instruments at fair value 1,418 1,849 Provisions - other 1,500 3,178 Provisions - employee entitlements 1,951 1,244 Derecognition of deferred tax asset (losses - AHF) - (1,000) Losses available for offset against future taxable income 7,308 3,022 Other 710 910 Gross deferred income tax assets 12,887 9,203 Set off of deferred tax liabilities (2,078) (2,545) Net deferred income tax assets 10,809 6,658
Tax consolidation AGHL and its 100% owned Australian resident subsidiaries, ASOL and its 100% owned Australian resident subsidiaries and AHL and its 100% owned Australian resident subsidiaries have formed separate tax consolidated groups. AGHL, ASOL and AHL are the head entity of their respective tax consolidated groups. The head entity and the controlled entities in the tax consolidated group continue to account for their own current and deferred tax amounts. These amounts are measured in a manner that is consistent with the broad principles in AASB 112 Income Taxes. The nature of the tax funding agreements are discussed further below.
Nature of the tax funding agreement
Members of the respective tax consolidated groups have entered into tax funding agreements. The tax funding agreements require payments to/from the head entity to be recognised via an inter-entity receivable (payable) which is at call. To the extent that there is a difference between the amount allocated under the tax funding agreement and the allocation under UIG 1052, the head entity accounts for these as equity transactions.
The amounts receivable or payable under the tax funding agreements are due upon receipt of the funding advice from the head entity, which is issued as soon as practicable after the end of each financial year. The head entity may also require payment of interim funding amounts to assist with its obligations to pay tax instalments.

ABACUS PROPERTY GROUP
52
NOTES TO THE FINANCIAL STATEMENTS 30 JUNE 2016
5. INVESTMENT PROPERTIES
2016 2015$'000 $'000
Leasehold investment properties 1 11,092 11,119 Freehold investment properties 1,510,527 1,357,029 Total investment properties 1,521,619 1,368,148
1. The carrying amount of the leasehold property is presented gross of the finance liability of $1.8 million.
2016 2015$'000 $'000
Investment properties held for saleRetail 14,300 19,100 Office 145,250 5,750 Industrial 27,000 26,197 Total investment properties held for sale 186,550 51,047
Investment propertiesRetail 339,500 237,500 Office 341,418 501,350 Industrial 63,950 102,790 Storage 570,352 453,761 Other 19,850 21,700 Total investment properties 1,335,069 1,317,101
Total investment properties including held for sale 1,521,619 1,368,148
Reconciliation A reconciliation of the carrying amount of investment properties at the beginning and end of the year is as follows. All investment properties are classified as Level 3 in accordance with the fair value hierarchy outlined in Note 12(e):
2016 2015Leasehold investment properties $'000 $'000Carrying amount at beginning of the financial year 11,119 - Additions and capital expenditure 14 11,119 Net change in fair value as at balance date (41) - Carrying amount at end of the year 11,092 11,119
2016 2015 2016 2015Freehold investment properties $'000 $'000 $'000 $'000Carrying amount at beginning of the financial year 51,047 186,543 1,305,982 1,158,950 Additions and capital expenditure 21 214 175,504 200,010 Net change in fair value as at balance date 777 (1,697) 77,927 24,255 Net change in fair value derecognised 1,901 32,688 3,200 - Disposals (52,446) (233,534) (60,968) - Effect of movements in foreign exchange - - 7,582 (4,400)Properties transferred to / from held for sale 185,250 66,833 (185,250) (66,833)Transfers to inventory - - - (6,000)Carrying amount at end of the year 186,550 51,047 1,323,977 1,305,982
Non-current
Held for sale Non-current

ABACUS PROPERTY GROUP
53
NOTES TO THE FINANCIAL STATEMENTS 30 JUNE 2016
5. INVESTMENT PROPERTIES (continued) Investment properties are carried at the Directors’ determination of fair value. The determination of fair value includes reference to the original acquisition cost together with capital expenditure since acquisition and either the latest full independent valuation, latest independent update or directors’ valuation. Total acquisition costs include incidental costs of acquisition such as property taxes on acquisition, legal and professional fees and other acquisition related costs.
Sensitivity Information
Significant input Fair value measurement sensitivity to significant increase in input
Fair value measurement sensitivity to significant decrease in input
Adopted capitalisation rate Decrease Increase
Optimal occupancy Increase Decrease
Adopted discount rate Decrease Increase
The adopted capitalisation rate forms part of the income capitalisation approach.
When calculating the income capitalisation approach, the net market rent has a strong interrelationship with the adopted capitalisation rate given the methodology involves assessing the total net market income receivable from the property and capitalising this in perpetuity to derive a capital value. In theory, an increase in the net market rent and an increase (softening) in the adopted capitalisation rate could potentially offset the impact to the fair value. The same can be said for a decrease in the net market rent and a decrease (tightening) in the adopted capitalisation rate. A directionally opposite change in the net market rent and the adopted capitalisation rate could potentially magnify the impact to the fair value.
The adopted discount rate of a discounted cashflow has a strong interrelationship in deriving at a fair value given the discount rate will determine the rate in which the terminal value is discounted to the present value.
External valuations are conducted by qualified independent valuers who are appointed by the Managing Director of Abacus Property Services Pty Ltd who is also responsible for the Group’s internal valuation process. He is assisted by two employees both of whom hold relevant recognised professional qualifications and are experienced in valuing the types of properties in the applicable locations.
Investment properties are independently valued on a staggered basis every two years unless the underlying financing requires a different valuation cycle.
The majority of the investment properties are used as security for secured bank debt outlined in Note 11.
Abacus* The weighted average capitalisation rate for Abacus is 7.47% (30 June 2015: 7.98%) and for each significant category above is as follows;
- Retail – 6.69% (30 June 2015: 7.30%)
- Office – 7.21% (30 June 2015: 7.60%)
- Industrial – 8.39% (30 June 2015: 8.62%)
- Storage – 7.98% (30 June 2015: 8.62%)
The current occupancy rate for the principal portfolio excluding development and self-storage assets is 91.2% (30 June 2015: 93.4%). The current occupancy rate for self-storage assets is 85.9% (30 June 2015: 84.9%).
During the year ended 30 June 2016, 57% (30 June 2015: 50%) of the number of investment properties in the portfolio were subject to external valuations, the remaining 43% (30 June 2015: 50%) were subject to internal valuation. * Excludes Abacus Hospitality Fund, Abacus Diversified Income Fund II, Abacus Wodonga Land Fund

ABACUS PROPERTY GROUP
54
NOTES TO THE FINANCIAL STATEMENTS 30 JUNE 2016
5. INVESTMENT PROPERTIES (continued) Abacus Diversified Income Fund II A weighted average capitalisation rate for each category is as follows;
- Office – 7.90% (30 June 2015: 8.82%)
- Industrial – Nil (30 June 2015: 8.47%)
The current occupancy rate for the portfolio is 84.0% (30 June 2015: 78.8%).
During the year ended 30 June 2016, none (30 June 2015: 100%) of the number of investment properties in the portfolio were subject to external valuations, the remaining 100% (30 June 2015: Nil) were subject to internal valuation.

ABACUS PROPERTY GROUP
55
NOTES TO THE FINANCIAL STATEMENTS 30 JUNE 2016
6. INVENTORY
2016 2015$'000 $'000
(a) CurrentHotel supplies 352 415 Projects1
- purchase consideration 1,477 1,089 - development costs 8,016 5,960
9,845 7,464
(b) Non-currentProjects1
- purchase consideration 103,308 112,911 - development costs 11,747 8,778 - provision (5,800) (9,000) - impairment charge2 (40,622) -
68,633 112,689
Total inventory 78,478 120,153
1. Inventories are held at the lower of cost and net realisable value.
2. The residential land subdivision development at Muswellbrook was adversely affected by the decline in the coal industry. Muswellbrook has been deeply affected by this decline which has resulted in increased unemployment and a poor economic outlook which has severely affected its residential market. This has resulted in an impairment charge of $40.6 million being incurred in the first half of the year.
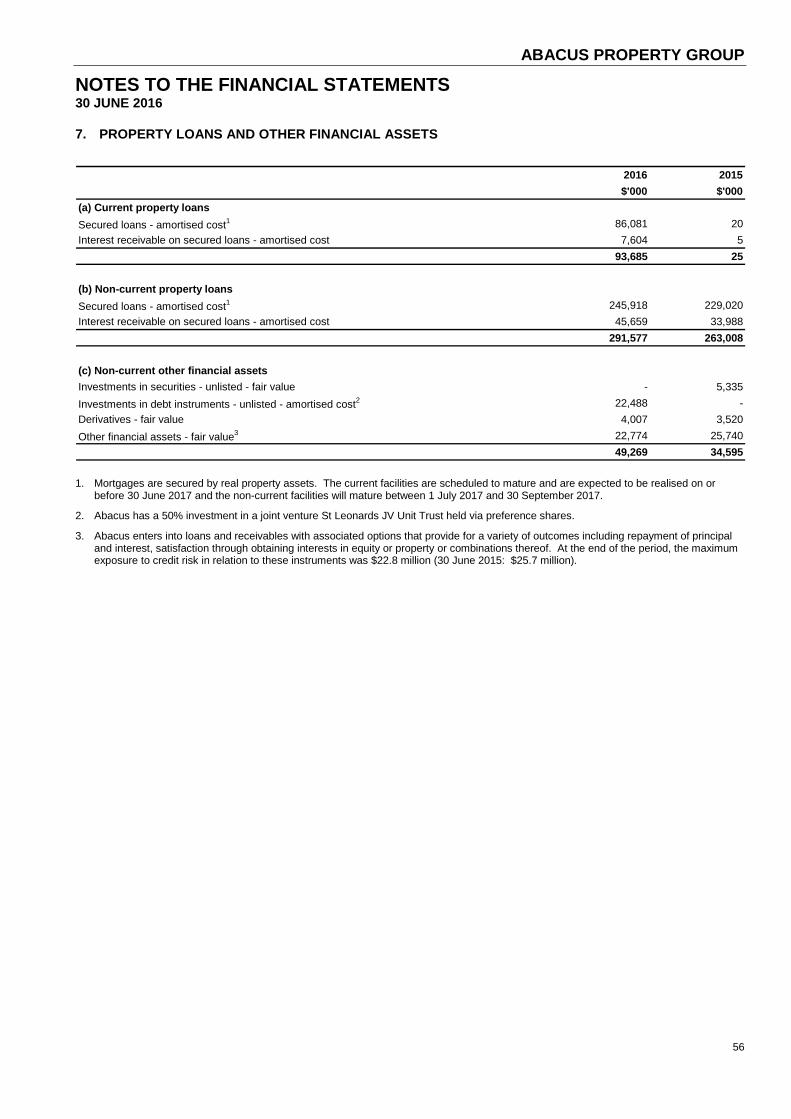
ABACUS PROPERTY GROUP
56
NOTES TO THE FINANCIAL STATEMENTS 30 JUNE 2016
7. PROPERTY LOANS AND OTHER FINANCIAL ASSETS
2016 2015$'000 $'000
(a) Current property loansSecured loans - amortised cost1 86,081 20 Interest receivable on secured loans - amortised cost 7,604 5
93,685 25
(b) Non-current property loansSecured loans - amortised cost1 245,918 229,020 Interest receivable on secured loans - amortised cost 45,659 33,988
291,577 263,008
(c) Non-current other financial assetsInvestments in securities - unlisted - fair value - 5,335 Investments in debt instruments - unlisted - amortised cost2 22,488 - Derivatives - fair value 4,007 3,520 Other financial assets - fair value3 22,774 25,740
49,269 34,595
1. Mortgages are secured by real property assets. The current facilities are scheduled to mature and are expected to be realised on or before 30 June 2017 and the non-current facilities will mature between 1 July 2017 and 30 September 2017.
2. Abacus has a 50% investment in a joint venture St Leonards JV Unit Trust held via preference shares.
3. Abacus enters into loans and receivables with associated options that provide for a variety of outcomes including repayment of principal and interest, satisfaction through obtaining interests in equity or property or combinations thereof. At the end of the period, the maximum exposure to credit risk in relation to these instruments was $22.8 million (30 June 2015: $25.7 million).

ABACUS PROPERTY GROUP
57
NOTES TO THE FINANCIAL STATEMENTS 30 JUNE 2016
8. INVESTMENTS ACCOUNTED FOR USING THE EQUITY METHOD
(a) Extract from joint ventures’ profit and loss statements
2016 2015$'000 $'000
Revenue 161,412 358,312 Expenses (95,880) (288,185)Net profit 65,532 70,127
Share of net profit 30,543 29,883
(b) Extract from joint ventures’ balance sheets
2016 2015$'000 $'000
Current assets 29,699 34,508 Non-current assets 956,802 723,377
986,501 757,885 Current liabilities (17,069) (27,408)Non-current liabilities (516,004) (387,297)Net assets 453,428 343,180
Share of net assets 179,935 137,227
There were no impairment losses or contingent liabilities relating to the investment in the joint ventures.
(c) Material investments in joint ventures
AustralianFordtrans Aggregation Oasis JV WTC JV St Leonards Merivale JV
Pty Ltd1 Head Trust2 Unit Trust3 Unit Trust4 JV Unit Trust5 Unit Trust6
30 June 2016 $'000 $'000 $'000 $'000 $'000 $'000Total assets 207,769 136,534 128,829 135,455 128,597 58,817 Total liabilities 69,160 59,486 75,346 67,159 109,951 84 Net assets 138,609 77,048 53,483 68,296 18,646 58,733
Share of net assets 74,511 24,633 21,393 16,923 9,035 26,566
Revenue 20,516 19,960 14,354 14,011 14,142 14 Total comprehensive income 13,663 15,474 6,850 9,488 8,272 -
Share of net profit 6,934 6,725 2,777 2,002 5,469 8

ABACUS PROPERTY GROUP
58
NOTES TO THE FINANCIAL STATEMENTS 30 JUNE 2016
8. INVESTMENTS ACCOUNTED FOR USING THE EQUITY METHOD (continued) (c) Material investments in joint ventures (continued)
AustralianFordtrans Aggregation Oasis JV WTC JV
Pty Ltd1 Head Trust2 Unit Trust3 Unit Trust4
30 June 2015 $'000 $'000 $'000 $'000Total assets 192,983 126,098 109,300 133,952 Total liabilities 66,068 59,863 64,194 65,930 Net assets 126,915 66,235 45,106 68,022
Share of net assets 63,457 19,074 18,042 16,855
Revenue 8,866 161,234 3,647 8,421 Total comprehensive income / (loss) 3,380 27,356 (4,244) 2,906
Share of net profit / (loss) 1,587 13,320 (1,737) 895
1. Fordtrans Pty Ltd (Virginia Park) (“VP”)
Abacus has a 50% interest in the ownership and voting rights of Fordtrans Pty Ltd. VP’s principal place of business is in Bentleigh East, Victoria.
VP owns a sizeable Business Park providing a mixture of industrial and office buildings as well as supporting facilities including gymnasium, swim centre, child care centre, children’s play centre, cafe, yoga centre and martial arts centre. The site has recently been enhanced following the purchase of a neighbouring site by Abacus that offers expansion potential and residential opportunity. Abacus jointly controls the venture with the other partner under the terms of Unitholders Agreement and requires unanimous consent for all major decisions over the relevant activities.
Abacus’ share of income (including distributions) for the year ended 30 June 2016 was $6.93 million (2015: $1.59 million).
2. Australian Aggregation Head Trust (“AAHT”)
Abacus has a 25% interest in the ownership and voting rights of Australian Aggregation Head Trust. Abacus is also entitled to receive variable returns based on performance.
AAHT invests in core-plus office, retail and industrial properties in major Australian gateway cities. Abacus’ share of income (including distributions) for the year ended 30 June 2016 was $6.72 million (2015: $13.32 million).
3. Oasis JV Unit Trust (“Oasis”)
Abacus has a 40% interest in the ownership and voting rights of the Oasis JV Unit Trust.
Oasis owns Oasis Shopping Centre, a three-level sub-regional shopping mall at the centre of Broadbeach, Queensland, on the Gold Coast. Abacus’ share of the net loss for the year ended 30 June 2016 was $2.78 million (2015: $1.73 million).
4. WTC JV Unit Trust (“WTC”)
Abacus has a 25% interest in the ownership and voting rights of the WTC JV Unit Trust.
WTC owns a 70% interest in Towers 2, 3 and 4 of the World Trade Centre, Melbourne. Abacus’ share of income (including distributions) for the year ended 30 June 2016 was $2.00 million (2015: $0.90 million).
5. St Leonards JV Unit Trust (“St Leonards”)
Abacus has a 50% interest in the ownership and voting rights of the St Leonards JV Unit Trust.
St Leonards owns The Forum, 201 Pacific Highway, St Leonards NSW. Abacus’ share of income (including distributions) for the year ended 30 June 2016 was $5.47 million (2015: Nil).

ABACUS PROPERTY GROUP
59
NOTES TO THE FINANCIAL STATEMENTS 30 JUNE 2016
8. INVESTMENTS ACCOUNTED FOR USING THE EQUITY METHOD (continued) (c) Material investments in joint ventures (continued)
6. Merivale JV Unit Trust (“Merivale”)
Abacus has a 40% interest in the ownership and 33% of the voting rights of the Merivale JV Unit Trust.
Merivale owns 22-28 Merivale Street, South Brisbane QLD. The proposed development is to comprise two residential towers and will include 472 units in total.
There is no comparative disclosed for 30 June 2015 for Merivale as Abacus’ investment was immaterial.
9. CASH AND CASH EQUIVALENTS
2016 2015$'000 $'000
Reconciliation to Statement of Cash FlowFor the purposes of the Statement of Cash Flow, cash and cash equivalents comprise the following at 30 June 2016
Cash at bank and in hand1 43,792 38,388
1. Cash at bank earns interest at floating rates. The carrying amounts of cash and cash equivalents represent fair value.
Net profit 190,092 133,219 Adjustments for:Depreciation and amortisation of non-current assets 5,579 6,162 Provision for doubtful debts - 725 Impairment charges 38,922 9,620 Net change in fair value of derivatives 8,057 9,851 Net change in fair value of investment properties held at balance date (88,896) (22,282) Net change in fair value of investments held at balance date (95) (1,608) Net change in fair value of investment properties derecognised (5,101) (32,688) Net change in fair value of investment and financial instruments derecognised (14,512) (1,671) Net loss on disposal of property, plant and equipment 92 1,547 Share of profit from equity accounted investments (30,543) (29,883) Increase / (decrease) in payables (7,320) 11,705 (Increase) / decrease in inventories 2,433 13,926 (Increase) / decrease in receivables and other assets (7,173) 20,709 Net cash from operating activities 91,535 119,332
(a) Disclosure of financing facilities Refer to Note 11.
(b) Disclosure of non-cash financing facilities Non-cash financing activities include capital raised pursuant to the Abacus distribution reinvestment plan. During the year 3.40 million stapled securities were issued with a cash equivalent of $9.95 million.

ABACUS PROPERTY GROUP
60
NOTES TO THE FINANCIAL STATEMENTS 30 JUNE 2016
10. CAPITAL MANAGEMENT Abacus* Abacus seeks to manage its capital requirements through a mix of debt and equity funding. It also ensures that Group entities comply with capital and distribution requirements of their constitutions and/or trust deeds, the capital requirements of relevant regulatory authorities and continue to operate as a going concern. Abacus also protects its equity in assets by taking out insurance.
Abacus assesses the adequacy of its capital requirements, cost of capital and gearing (i.e. debt/equity mix) as part of its broader strategic plan. In addition to tracking actual against budgeted performance, Abacus reviews its capital structure to ensure sufficient funds and financing facilities (on a cost effective basis) are available to implement its strategy, that adequate financing facilities are maintained and distributions to members are made within the stated distribution guidance (i.e. paid out of underlying profits).
The following strategies are available to the Group to manage its capital: issuing new stapled securities, its distribution reinvestment plan, electing to have the distribution reinvestment plan underwritten, adjusting the amount of distributions paid to members, activating a security buyback program, divesting assets, active management of its fixed rate swaps, directly purchasing assets in managed funds and joint ventures, or (where practical) recalibrating the timing of transactions and capital expenditure so as to avoid a concentration of net cash outflows.
Abacus has a total gearing covenant as a condition of the current $480m Syndicated facility and the $54m Bilateral facility. The total gearing covenant requires Abacus to have total liabilities (net of cash) to be less than or equal to 50% of total tangible assets (net of cash). As at date of reporting period, Abacus was compliant in meeting all its debt covenants. * Excludes Abacus Hospitality Fund, Abacus Diversified Income Fund II, Abacus Wodonga Land Fund
Consolidated Funds
The Capital Management approach and strategies employed by the Group are also deployed for the funds ABP manages and which are consolidated in these accounts – AHF, ADIF II and AWLF (or the Consolidated Funds).
Points unique to the capital management of these respective funds are:
- The Consolidated Funds via their responsible entities comply with capital and distribution requirements of their constitutions and/or deeds, the capital requirements of relevant regulatory authorities and continue to operate as going concerns; and
- There is currently no Distribution Reinvestment Plan for any of the Funds.
A summary of compliance of banking covenants – by Fund – is set out below:
Metrics AHF ADIF II
Nature of facilities Secured, non recourse Secured, non recourse
Debt covenants Compliant Compliant

ABACUS PROPERTY GROUP
61
NOTES TO THE FINANCIAL STATEMENTS 30 JUNE 2016
11. INTEREST BEARING LOANS AND BORROWINGS
2016 2015$'000 $'000
OthercurrentBank loans - A$ 99,953 - Loans from other parties 25,138 - Less: Unamortised borrowing costs (346) - 124,745 -
(a) Total current 124,745 -
2016 2015$'000 $'000
Abacus*Non-currentBank loans - A$ 556,296 311,815 Bank loans - A$ value of NZ$ denominated loan 73,110 76,017 Other loans - A$ 4,292 4,292 Less: Unamortised borrowing costs (2,375) (3,187) 631,323 388,937
OtherNon-currentBank loans - A$ - 131,128 Loans from other parties - 24,640 Less: Unamortised borrowing costs - (660) - 155,108
(b) Total non-current 631,323 544,045
* Excludes Abacus Hospitality Fund, Abacus Diversified Income Fund II, Abacus Wodonga Land Fund
2016 2015$'000 $'000
(c) Maturity profile of current and non-current interest bearing loansDue within one year 124,745 - Due between one and five years 501,323 197,213 Due after five years 130,000 346,832
756,068 544,045

ABACUS PROPERTY GROUP
62
NOTES TO THE FINANCIAL STATEMENTS 30 JUNE 2016
11. INTEREST BEARING LOANS AND BORROWINGS (continued) Abacus* Abacus maintains a range of interest-bearing loans and borrowings. The sources of funding are spread over a number of counterparties and the terms of the instruments are negotiated to achieve a balance between capital availability and cost of debt.
Bank loans are $A and $NZ denominated and are provided by several banks at interest rates which are set periodically on a floating basis. The loans term to maturity varies from July 2017 to July 2021. The bank loans are secured by charges over the investment properties, certain inventory and certain property, plant and equipment.
Approximately 53% (2015: 88%) of bank debt drawn was subject to fixed rate hedges with a weighted average term to maturity of 3.5 years (2015: 4.3 years). Hedge cover as a percentage of available facilities at 30 June 2016 is 38.3% (2015: 44.1%).
Abacus’ weighted average interest rate as at 30 June 2016 was 5.39% (2015: 6.07%). Line fees on undrawn facilities contributed to 0.34% of the weighted average interest rate at 30 June 2016 (2015: 0.50%). Abacus’ weighted average interest rate excluding the undrawn facilities line fees as at 30 June 2016 was 5.05% (2015: 5.57%). * Excludes Abacus Hospitality Fund, Abacus Diversified Income Fund II, Abacus Wodonga Land Fund
Abacus Hospitality Fund AHF’s $A and $NZ bank facility matures in April 2017. The facility is secured by a charge over AHF’s hotel assets and at 30 June 2016 approximately 60.3% (2015: 58.6%) of drawn bank debt facilities were subject to current fixed rate hedges with a weighted average term to maturity of 0.8 years (2015: 1.8 years).
AHF’s weighted average interest rate as at 30 June 2016 was 7.2% (2015: 8.1%).
Abacus Diversified Income Fund II ADIF II has financed its investment property portfolio via a single facility which matures in June 2017.
The facility is secured by charges over ADIF II’s investment properties and at 30 June 2016 approximately 43.3% (2015: 67.0%) of drawn bank debt facilities were subject to fixed rate hedges. The bank debt drawn at 30 June 2016 has a weighted average term to maturity of 1.0 year (2015: 2.0 years).
ADIF II’s weighted average interest rate as at 30 June 2016 was 6.75% (2015: 7.60%).

ABACUS PROPERTY GROUP
63
NOTES TO THE FINANCIAL STATEMENTS 30 JUNE 2016
11. INTEREST BEARING LOANS AND BORROWINGS (continued) (d) Assets pledged as security The carrying amounts of assets pledged as security for current and non-current interest bearing liabilities are:
2016 2015$'000 $'000
CurrentFirst mortgageProperty, plant and equipment 130,000 3,080 Investment properties held for sale 172,250 31,947 Total current assets pledged as security 302,250 35,027
Non-currentFirst mortgageFreehold land and buildings - 3,489 Property, plant and equipment - 114,030 Inventory - 6,000 Investment properties 1,319,619 1,297,111 Total non-current assets pledged as security 1,319,619 1,420,630
Total assets pledged as security 1,621,869 1,455,657
(e) Defaults and breaches During the current and prior years, there were no defaults or breaches of any of the Group’s loans.

ABACUS PROPERTY GROUP
64
NOTES TO THE FINANCIAL STATEMENTS 30 JUNE 2016
12. FINANCIAL INSTRUMENTS Financial Risk Management The risks arising from the use of the Group’s financial instruments are credit risk, liquidity risk and market risk (interest rate risk, price risk and foreign currency risk).
The Group’s financial risk management focuses on mitigating the unpredictability of the financial markets and its impact on the financial performance of the Group. The Board reviews and agrees policies for managing each of these risks, which are summarised below.
Primary responsibility for identification and control of financial risks rests with the Treasury Management Committee under the authority of the Board. The Board reviews and agrees policies for managing each of the risks identified below, including the setting of limits for trading in derivatives, hedging cover of interest rate risks and cash flow forecast projections.
The main purpose of the financial instruments used by the Group is to raise finance for the Group’s operations. The Group has various other financial assets and liabilities such as trade receivables and trade payables, which arise directly from its operations. The Group also enters into derivative transactions principally interest rate swaps. The purpose is to manage the interest rate exposure arising from the Group’s operations and its sources of finance.
Details of the significant accounting policies and methods adopted, including the criteria for recognition, the basis of measurement and the basis on which income and expenses are recognised, in respect of each class of financial asset, financial liability and equity instruments are disclosed in the section about this report and Note 24 to the financial statements.
(a) Credit risk Credit risk is the risk of financial loss to the Group if a customer or counterparty to a financial instrument fails to meet its contractual obligations, and arises principally from the Group’s receivables from customers, investment in securities and options, secured property loans and interest bearing loans and derivatives with banks.
The Group manages its exposure to risk by:
- derivative counterparties and cash transactions are limited to high credit quality financial institutions; - policy which limits the amount of credit exposure to any one financial institution; - providing loans as an investment into joint ventures, associates, related parties and third parties where it is
satisfied with the underlying property exposure within that entity; - regularly monitoring loans and receivables balances on an ongoing basis; - regularly monitoring the performance of its associates, joint ventures, related parties and third parties on an
ongoing basis; and - obtaining collateral as security (where required or appropriate).
The Group’s credit risk is predominately driven by its Property Ventures business which provides loans to third parties, those using the funds for property development and / or investment. The Group mitigates the exposure to this risk by evaluation of the application before acceptance. The analysis will specifically focus on:
- the Loan Valuation Ratio (LVR) at drawdown; - mortgage ranking; - background of the developer (borrower) including previous developments; - background of the owner (borrower) including previous investment track record; - that the terms and conditions of higher ranking mortgages are acceptable to the Group; - appropriate property insurances are in place with a copy provided to the Group; and - market analysis of the completed development being used to service drawdown.
The Group also mitigates this risk by ensuring adequate security is obtained and timely monitoring of the financial instrument to identify any potential adverse changes in the credit quality.

ABACUS PROPERTY GROUP
65
NOTES TO THE FINANCIAL STATEMENTS 30 JUNE 2016
12. FINANCIAL INSTRUMENTS (continued) (a) Credit risk (continued) Credit risk exposures The Group’s maximum exposure to credit risk at the reporting date was:
2016 2015$'000 $'000
Receivables 8,851 11,680 Secured property loans 385,262 263,033 Other financial assets 49,269 34,595 Cash and cash equivalents 43,792 38,388
487,174 347,696
Carrying Amount
As at 30 June 2016, the Group had the following concentrations of credit risk:
- Secured property loans: a loan which represents 23% of the portfolio covers two large projects at Riverlands and Camellia; and
- Other financial assets (fair value) includes an option of $22.8 million which is represented by one issuer and is on original terms (2015: $25.7 million one issuer).
Secured property loans The Group has a total investment of $385.3 million in secured property loans as at 30 June 2016 (2015: $263.0 million). Of these loans $52.9 million has been renewed / extended beyond the original term on commercial terms (2015 $30.5 million).
In considering the impairment of loans, the Group undertakes a market analysis of the secured property development which is used to service the loan and identify if a deficiency of security exists and the extent of that deficiency, if any. If there is an indicator of impairment, fair value calculations of expected future cashflows are determined and if there are any differences to the carrying value of the loan, an impairment is recognised.
There was no movement in the allowance for impairment in respect of secured property loans and receivables during the year where no loans are past due and not impaired.

ABACUS PROPERTY GROUP
66
NOTES TO THE FINANCIAL STATEMENTS 30 JUNE 2016
12. FINANCIAL INSTRUMENTS (continued) (b) Liquidity Risk Prudent liquidity risk management implies maintaining sufficient cash and marketable securities, the availability of funding through an adequate and diverse amount of committed credit facilities, the ability to close out market positions and the flexibility to raise funds through the issue of new stapled securities or the distribution reinvestment plan.
The Group’s policy is to maintain an available loan facility with banks sufficient to meet expected operational expenses and to finance investment acquisitions for a period of 90 days, including the servicing of financial obligations. Current loan facilities are assessed and extended for a maximum period based on the Group’s expectations of future interest and market conditions.
As at 30 June 2016, the Group had undrawn facilities of $243.6 million and cash of $43.8 million which are adequate to cover short term funding requirements. Further information regarding the Group’s debt profile is disclosed in Note 11.
The table below shows an analysis of the contractual maturities of key liabilities which forms part of the Group’s assessment of liquidity risk.
Carrying Amount
Contractual cash flows
1 Year or less
Over 1 year to 5 years
Over5 years
30 June 2016 $'000 $'000 $'000 $'000 $'000LiabilitiesTrade and other payables 26,167 26,167 26,167 - - Interest bearing loans and borrowings incl derivatives# 796,309 904,182 172,512 598,421 133,249 Other financial liabilities 45,934 45,934 45,934 - - Total liabilities 868,410 976,283 244,613 598,421 133,249
Carrying Amount
Contractual cash flows
1 Year or less
Over 1 year to 5 years
Over5 years
30 June 2015 $'000 $'000 $'000 $'000 $'000LiabilitiesTrade and other payables 29,812 29,812 29,812 - - Interest bearing loans and borrowings incl derivatives# 569,852 688,528 40,452 284,238 363,838 Other financial liabilities 45,965 45,965 25 45,940 - Total liabilities 645,629 764,305 70,289 330,178 363,838
# Carrying amount includes fair value of derivative liabilities. Contractual cash flows includes contracted debt and net swap payments using prevailing forward rates

ABACUS PROPERTY GROUP
67
NOTES TO THE FINANCIAL STATEMENTS 30 JUNE 2016
12. FINANCIAL INSTRUMENTS (continued) (c) Market Risk Market risk is the risk that changes in market prices, such as foreign exchange rates, interest rates and equity prices will affect the Group’s income or the value of its holdings of financial instruments. The objective of market risk management is to manage and control market risk exposures within acceptable parameters, while optimising the return.
Interest rate risk / Fair value interest rate risk
The Group’s exposure to the risk of changes in market interest rates relates primarily to its long-term bank debt obligations which are based on floating interest rates. The Group has a policy to maintain a mix of floating exposure and fixed interest rate hedging with fixed rate cover highest in years 1 to 5.
Similar policies are employed for the funds consolidated by the Group (AHF and ADIF II).
The Group hedges to minimise interest rate risk by entering variable to fixed interest rate swaps which also helps deliver interest covenant compliance and positive carry (net rental income in excess of interest expense) on the property portfolio. Interest rate swaps have the economic effect of converting borrowings from variable rates to fixed rates. Under the interest rate swaps, the Group agrees to exchange, at specified intervals, the difference between fixed and variable rate interest amounts calculated by reference to the agreed notional principal amounts. At 30 June 2016, after taking into account the effect of interest rate swaps, approximately 53.2% of the Group’s drawn debt is subject to fixed rate hedges (2015: 81.5%). Hedge cover as a percentage of available facilities at 30 June 2016 is 38.3% (2015: 46.7%).
As the Group holds interest rate swaps against its variable rate debt there is a risk that the economic value of a financial instrument will fluctuate because of changes in market interest rates. The level of variable rate debt subject to interest rate swaps and fixed rate debt is disclosed in Note 11.

ABACUS PROPERTY GROUP
68
NOTES TO THE FINANCIAL STATEMENTS 30 JUNE 2016
12. FINANCIAL INSTRUMENTS (continued) (c) Market Risk (continued) Interest rate risk / Fair value interest rate risk (continued)
The Group’s exposure to interest rate risk and the effective weighted average interest rates for each class of financial asset and financial liability are:
Abacus^
Floating interest rate
Fixed interest less than
1 year Fixed interest
1 to 5 yearsFixed interest
over 5 yearsNon interest
bearing Total30 June 2016 $'000 $'000 $'000 $'000 $'000 $'000Financial AssetsCash and cash equivalents 36,284 - - - - 36,284 Receivables - - - - 5,657 5,657 Secured loans - 166,723 218,539 - - 385,262 Total financial assets 36,284 166,723 218,539 - 5,657 427,203
Weighted average interest rate* 1.85% 7.64% 13.15%
Financial liabilitiesInterest bearing liabilities - bank 629,406 - - - - 629,406 Interest bearing liabilities - other - - 4,292 - - 4,292 Derivatives - - - - 37,591 37,591 Payables - - - - 16,546 16,546 Total financial liabilities 629,406 - 4,292 - 54,137 687,835
Notional principal swap balance maturities* - - 284,500 50,000 - 334,500
Weighted average interest rate on drawn bank debt* 5.39%
Floating interest rate
Fixed interest less than
1 year Fixed interest
1 to 5 yearsFixed interest
over 5 yearsNon interest
bearing Total30 June 2015 $'000 $'000 $'000 $'000 $'000 $'000Financial AssetsCash and cash equivalents 28,176 - - - - 28,176 Receivables - - - - 8,007 8,007 Derivatives - - - - 3,783 3,783 Secured loans - 22,533 240,500 - - 263,033 Total financial assets 28,176 22,533 240,500 - 11,790 302,999
Weighted average interest rate* 2.10% 13.73% 12.68%
Financial liabilitiesInterest bearing liabilities - bank 387,832 - - - - 387,832 Interest bearing liabilities - other - - 4,292 - - 4,292 Derivatives - - - - 43,978 43,978 Payables - - - - 18,917 18,917 Total financial liabilities 387,832 - 4,292 - 62,895 455,019
Notional principal swap balance maturities* - 24,349 265,000 50,000 - 339,349
Weighted average interest rate on drawn bank debt* 6.07%
* rate calculated at 30 June ^ excludes Abacus Hospitality Fund, Abacus Diversified Income Fund II, Abacus Wodonga Land Fund

ABACUS PROPERTY GROUP
69
NOTES TO THE FINANCIAL STATEMENTS 30 JUNE 2016
12. FINANCIAL INSTRUMENTS (continued) (c) Market Risk (continued) Interest rate risk / Fair value interest rate risk (continued)
Other^
Floating interest rate
Fixed interest less than
1 year Fixed interest
1 to 5 yearsFixed interest
over 5 yearsNon interest
bearing Total30 June 2016 $'000 $'000 $'000 $'000 $'000 $'000Financial AssetsCash and cash equivalents 7,505 - - - - 7,505 Receivables - - - - 3,197 3,197 Total financial assets 7,505 - - - 3,197 10,702
Weighted average interest rate* 1.85%
Financial liabilitiesInterest bearing liabilities - bank 99,767 - - - - 99,767 Derivatives - - - - 2,650 2,650 Payables - - - - 9,622 9,622 Total financial liabilities 99,767 - - - 12,272 112,039
Notional principal swap balance maturities* - 51,750 - - - 51,750
Weighted average interest rate on drawn bank debt* 6.97%
Floating interest rate
Fixed interest less than
1 year Fixed interest
1 to 5 yearsFixed interest
over 5 yearsNon interest
bearing Total30 June 2015 $'000 $'000 $'000 $'000 $'000 $'000Financial AssetsCash and cash equivalents 10,212 - - - - 10,212 Receivables - - - - 3,673 3,673 Total financial assets 10,212 - - - 3,673 13,885
Weighted average interest rate* 2.10%
Financial liabilitiesInterest bearing liabilities - bank 130,808 - - - - 130,808 Derivatives - - - - 7,146 7,146 Payables - - - - 10,895 10,895 Total financial liabilities 130,808 - - - 18,041 148,849
Notional principal swap balance maturities* - - 83,500 50,000 - 133,500
Weighted average interest rate on drawn bank debt* 7.78%
* rate calculated at 30 June ^ Includes Abacus Hospitality Fund, Abacus Diversified Income Fund II, Abacus Wodonga Land Fund

ABACUS PROPERTY GROUP
70
NOTES TO THE FINANCIAL STATEMENTS 30 JUNE 2016
12. FINANCIAL INSTRUMENTS (continued) (c) Market Risk (continued) Interest rate risk / Fair value interest rate risk (continued)
The following table is a summary of the interest rate sensitivity analysis:
Floating Profit Equity Profit Equity30 June 2016 $'000 $'000 $'000 $'000 $'000
Financial assets 43,792 (438) - 438 - Financial liabilities 796,308 (7,809) - 7,361 -
Floating Profit Equity Profit Equity30 June 2015 $'000 $'000 $'000 $'000 $'000
Financial assets 38,388 (384) - 384 - Financial liabilities 569,852 (14,583) - 13,906 -
Carrying amount -1% +1%
AUDCarrying amount -1% +1%
AUD
The analysis for the interest rate sensitivity of financial liabilities includes derivatives.

ABACUS PROPERTY GROUP
71
NOTES TO THE FINANCIAL STATEMENTS 30 JUNE 2016
12. FINANCIAL INSTRUMENTS (continued) (d) Fair values The fair value of the Group’s financial assets and liabilities are approximately equal to that of their carrying values.
Class of assets / liabilities
Fair value hierarchy Valuation technique Inputs used to measure fair value
Investment properties Level 3 Discounted Cash Flow ("DCF") and Income capitalisation method
Adopted capitalisation rateOptimal occupancyAdopted discount rate
Property, plant and equipment
Level 3 Income capitalisation method Net market EBITDAOptimal occupancyAdopted capitalisation rate
Other financial assets Level 3 Pricing models Security priceUnderlying net assetProperty valuations
Goodwill Level 3 Discounted Cash Flow ("DCF") Fee IncomeDiscount ratesProperty valuesSelling costs
Derivative financial instruments
Level 2 DCF (adjusted for counterparty credit worthiness)
Interest ratesConsumer Price Index ("CPI")Volatility
Level 1 Quoted prices (unadjusted) in active market for identical assets or liabilities;
Level 2 Inputs other than quoted prices included in level 1 that are observable for the asset or liability, either directly (i.e. as prices) or indirectly (i.e. derived from prices); and
Level 3 Inputs for the asset or liability that are not based on observable market data.
There were no transfers between Levels 1, 2 and 3 during the period.
Income capitalisation method This method involves assessing the total net market income receivable from the property and capitalising this in perpetuity to derive a capital value, with allowances for capital expenditure reversions.
Discounted cash flow method Under the DCF method, the fair value is estimated using explicit assumptions regarding the benefits and liabilities of ownership over the assets’ or liabilities’ life including an exit or terminal value. The DCF method involves the projection of a series of cash flows from the assets or liabilities. To this projected cash flow series, an appropriate, market-derived discount rate is applied to establish the present value of the cash flow stream associated with the assets or liabilities.
Pricing models – unlisted securities
The fair value is determined by reference to the net assets which approximates fair value of the underlying entities.
Pricing models – options The fair value is determined using generally accepted pricing models including Black-Scholes and adjusted for specific features of the options including share price, underlying net assets and property valuations and prevailing exchange rates.

ABACUS PROPERTY GROUP
72
NOTES TO THE FINANCIAL STATEMENTS 30 JUNE 2016
12. FINANCIAL INSTRUMENTS (continued) (d) Fair values (continued) The following table is a reconciliation of the movements in unlisted securities and options classified as Level 3 for the year ended 30 June 2016.
Unlisted securities Options Total
$'000 $'000 $'000
Opening balance as at 30 June 2015 5,335 25,740 31,075 Fair value movement through the income statement (47) (2,966) (3,013)Redemptions / conversions (5,288) - (5,288)Closing balance as at 30 June 2016 - 22,774 22,774
Unlisted securities Options Total
$'000 $'000 $'000
Opening balance as at 30 June 2014 4,733 25,740 30,473 Fair value movement through the income statement 620 - 620 Redemptions / conversions (18) - (18)Closing balance as at 30 June 2015 5,335 25,740 31,075
Sensitivity of Level 3
The potential effect of using reasonable possible alternative assumptions based on a change in the property valuations by 5% would have the effect of reducing the fair value by up to $9.3 million (2015: $8.8 million) or increase the fair value by $9.3 million (2015: $8.8 million).
13. CONTRIBUTED EQUITY
2016 2015(a) Issued stapled securities $'000 $'000Stapled securities 1,565,515 1,555,563 Issue costs (41,637) (41,548)Total contributed equity 1,523,878 1,514,015
Number Value(b) Movement in stapled securities on issue '000 $'000At 30 June 2015 553,172 1,514,015 - distribution reinvestment plan 3,405 9,952 - less transaction costs - (89)Securities on issue at 30 June 2016 556,577 1,523,878
Stapled securities

ABACUS PROPERTY GROUP
73
NOTES TO THE FINANCIAL STATEMENTS 30 JUNE 2016
14. DISTRIBUTIONS PAID AND PROPOSED
2016 2015Abacus $'000 $'000(a) Distributions paid during the year
June 2015 half: 8.50 cents per stapled security (2014: 8.50 cents) 47,011 43,671
December 2015 half: 8.50 cents per stapled security (2014: 8.50 cents) 47,491 44,101
(b) Distributions proposed and not recognised as a liability^June 2016 half: 8.50 cents per stapled security (2015: 8.50 cents) 47,309 47,020
Distributions were paid from Abacus Trust and Abacus Income Trust (which do not pay tax provided they distribute all their taxable income) hence, there were no franking credits attached.
^ The final distribution of 8.50 cents per stapled security was declared on 1 July 2016. The distribution being paid on or around 31 August 2016 will be approximately $47.3 million. No provision for the distribution has been recognised in the balance sheet at 30 June 2016 as the distribution had not been declared by the end of the year.
2016 2015Non-core funds $'000 $'000(a) Distributions paid during the year
Abacus Hospitality Fund 980 980 Abacus Diversified Income Fund II 5,004 4,926
5,984 5,906
(b) Distributions proposedAbacus Hospitality Fund - not recognised 245 245 Abacus Diversified Income Fund II - recognised 1,256 1,234
2016 2015Abacus $'000 $'000Franking credit balanceThe amount of franking credits available for the subsequent financial year are:Franking account balance as at the beginning of the financial year at 30% (2015: 30%) 23,908 19,758 Franking credits that will arise from the payment of income tax payable at the end of the financial year 6,454 4,150 Franking account balance at the end of the financial year 30% (2015: 30%) 30,362 23,908

ABACUS PROPERTY GROUP
74
NOTES TO THE FINANCIAL STATEMENTS 30 JUNE 2016
15. INTEREST IN SUBSIDIARIES (a) Interest in subsidiaries with material non-controlling interest (“NCI”) The Group has the following subsidiaries with non-controlling interests:
(Profit)/lossPrincipal allocated to Accumulatedplace of % held by NCI NCI
Name of Entity business NCI $'000 $'00030 June 2016Abacus Hospitality Fund* Australia 90 (4,204) 32,037 Abacus Wodonga Land Fund Australia 85 - -
(4,204) 32,037
30 June 2015Abacus Hospitality Fund* Australia 90 1,112 25,310 Abacus Wodonga Land Fund Australia 85 - -
1,112 25,310
The country of incorporation is the same as the principal place of business, unless stated otherwise.
There are no significant restrictions. * The Abacus working capital facility ranks pari passu for downside but not upside at fund wind up.

ABACUS PROPERTY GROUP
75
NOTES TO THE FINANCIAL STATEMENTS 30 JUNE 2016
16. PARENT ENTITY FINANCIAL INFORMATION
2016 2015$'000 $'000
Results of the parent entityProfit / (loss) for the year (4,028) 1,897 Total comprehensive income / (expense) for the year (4,028) 1,897
Financial position of the parent entity at year endCurrent assets 482 731 Total assets 339,008 341,006 Current liabilities 240 3,014 Total liabilities 66,691 66,394 Net assets 272,317 274,612
Total equity of the parent entity comprising of:Issued capital 335,050 332,929 Accumulated losses (70,004) (65,976)Employee options reserve 7,271 7,659 Total equity 272,317 274,612
(a) Parent entity contingencies As at 30 June 2016, the parent entity has entered into, or still bound by, the following agreements:
- Act as guarantor for borrowings for certain joint venture arrangements to a guarantee limit of $27.5 million (30 June 2015: $22.8 million). No property security has been provided by the parent.
(b) Parent entity capital commitments There are no capital commitments of the parent entity as at 30 June 2016 (2015: Nil).

ABACUS PROPERTY GROUP
76
NOTES TO THE FINANCIAL STATEMENTS 30 JUNE 2016
17. PROPERTY, PLANT AND EQUIPMENT The following table is a reconciliation of the movements of property, plant and equipment classified as Level 3 in accordance with the fair value hierarchy outlined in Note 12(d) for the year ended 30 June 2016.
2016 2015$'000 $'000
Property, plant and equipment held for saleCurrentHotel properties 130,000 3,080 Total current property, plant and equipment held for sale 130,000 3,080
Non-currentHotel properties - 114,030 Storage properties 4,051 3,489 Office equipment / furniture and fittings 625 500 Total non-current property, plant and equipment 4,676 118,019
Total property, plant and equipment including held for sale 134,676 121,099
2016 2015$'000 $'000
Land and buildingsAt the beginning of the period, net of accumulated depreciation 107,480 142,259 Additions 630 1,353 Fair value movement through the income statement 8,513 361 Fair value movement through comprehensive income 8,812 350 Disposal (3,106) (35,760) Effect of movements in foreign exchange - 333 Depreciation charge for the period (918) (1,416) At the end of the period net of accumulated depreciation 121,411 107,480 Gross value 137,106 122,258 Accumulated depreciation (15,695) (14,778) Net carrying amount at end of period 121,411 107,480
Plant and equipmentGross value 42,526 40,392 Accumulated depreciation (29,261) (26,773) Net carrying amount at end of period 13,265 13,619
Total 134,676 121,099
If property, plant and equipment was carried under the cost model, the carrying amount would be $112.9m (2015: $123.3m).

ABACUS PROPERTY GROUP
77
NOTES TO THE FINANCIAL STATEMENTS 30 JUNE 2016
17. PROPERTY, PLANT AND EQUIPMENT (continued) The property, plant and equipment1 has been disclosed as held for sale which are measured at the lower of their carrying amount and fair value less costs to sell.
Sensitivity Information
Significant input Fair value measurement sensitivity to significant increase in input
Fair value measurement sensitivity to significant decrease in input
Net market EBITDA Increase Decrease
Optimal occupancy Increase Decrease
Adopted capitalisation rate Decrease Increase
The adopted capitalisation rate forms part of the income capitalisation approach.
When calculating the income capitalisation approach, the EBITDA has a strong interrelationship with the adopted capitalisation rate given the methodology involves assessing the total EBITDA generated from the property and capitalising this in perpetuity to derive a capital value. In theory, an increase in the EBITDA and an increase (softening) in the adopted capitalisation rate could potentially offset the impact to the fair value. The same can be said for a decrease in the EBITDA and a decrease (tightening) in the adopted capitalisation rate. A directionally opposite change in the EBITDA and the adopted capitalisation rate could potentially magnify the impact to the fair value.
Hotel Properties
- A weighted average capitalisation rate is 7.83% (2015: 8.81%) - The current weighted average occupancy rate is 77% (2015: 72%)
Storage Properties
- A weighted average capitalisation rate is 7.98% (2015: 8.62%) - The current weighted average occupancy rate is 86% (2015: 90%)
External valuations are conducted by qualified independent valuers who are appointed by the Managing Director of Abacus Property Services Pty Ltd who is also responsible for the Group’s internal valuation process. The Managing Director is assisted by two employees both of whom hold relevant recognised professional qualifications and are experienced in valuing the types of properties in the applicable locations.
1. Other than corporate property, plant and equipment

ABACUS PROPERTY GROUP
78
NOTES TO THE FINANCIAL STATEMENTS 30 JUNE 2016
18. COMMITMENTS AND CONTINGENCIES Abacus* (a) Operating lease commitments – Group as lessee The Group has entered into a commercial lease on its offices. The lease has a term of three years with an option to renew for another three years.
Future minimum rentals payable under non-cancellable operating leases as at 30 June 2016 are as follows:
2016 2015$'000 $'000
Within one year 1,026 987 After one year but not more than five years 523 1,549 More than five years - -
1,549 2,536
(b) Operating lease commitments – Group as lessor Future minimum rentals receivable under non-cancellable operating leases as at 30 June 2016 are as follows:
2016 2015$'000 $'000
Within one year 67,721 70,917 After one year but not more than five years 165,477 169,351 More than five years 68,773 73,379
301,971 313,647
These amounts do not include contingent rentals which may become receivable under certain leases on the basis of retail sales in excess of stipulated minimums and, in addition, do not include recovery of outgoings.
(c) Capital and other commitments At 30 June 2016 the Group had numerous commitments and contingent liabilities which principally related to property acquisition settlements, loan facility guarantees for the Group's interest in the jointly controlled projects and funds management vehicles, commitments relating to property refurbishing costs and unused mortgage loan facilities to third parties.
Commitments planned and/or contracted at reporting date but not recognised as liabilities are as follows:
2016 2015$'000 $'000
Within one year - gross settlement of property acquisitions 13,350 112,293 - property refurbishment costs 9,020 2,460 - property development costs 8,420 29,056 - unused portion of loan facilities to outside parties 25,821 56,465
56,611 200,274
* Excludes Abacus Hospitality Fund, Abacus Diversified Income Fund II, Abacus Wodonga Land Fund

ABACUS PROPERTY GROUP
79
NOTES TO THE FINANCIAL STATEMENTS 30 JUNE 2016
18. COMMITMENTS AND CONTINGENCIES (c) Capital and other commitments (continued)
2016 2015$'000 $'000
Contingent liabilities:Within one year - corporate guarantee 43,025 41,145 43,025 41,145
Other Funds (a) Operating lease commitments – as lessor Future minimum rentals receivable under non-cancellable operating leases as at 30 June 2016 are as follows:
2016 2015$'000 $'000
Within one year 12,221 11,272 After one year but not more than five years - 15,442 More than five years - 7,503
12,221 34,217
These amounts do not include contingent rentals which may become receivable under certain leases on the basis of retail sales in excess of stipulated minimums and, in addition, do not include recovery of outgoings.
(b) Capital and other commitments
2016 2015$'000 $'000
Within one year - property refurbishment costs 596 348
596 348

ABACUS PROPERTY GROUP
80
NOTES TO THE FINANCIAL STATEMENTS 30 JUNE 2016
19. RELATED PARTY DISCLOSURES (a) Subsidiaries The consolidated financial statements include the financial statements of the following entities:
2016 2015Entity % %Abacus Group Holdings Limited and its subsidiariesAbacus Castle Hill Trust 100 100Abacus Cobar Trust 100 100Abacus Finance Pty Limited 100 100Abacus Funds Management Limited 100 100Abacus Griffith Avenue Trust 100 100Abacus HP Operating Co Pty Ltd 100 100Abacus HP Trust 100 100Abacus Investment Pty Ltd 100 100Abacus Wasjig Investments Pty Ltd 100 100Abacus Mariners Lodge Trust 100 100Abacus Mortgage Fund 100 100Abacus Mount Druitt Trust 100 100Abacus Musswellbrook Pty Ltd 100 100Abacus Nominee Services Pty Limited 100 100Abacus Nominees (No 5) Pty Limited 100 100Abacus Nominees (No 7) Pty Limited 100 100Abacus Nominees (No 9) Pty Limited 100 100Abacus Note Facilities Pty Ltd 100 100Abacus Property Services Pty Ltd 100 100Abacus SP Note Facility Pty Ltd 100 100Abacus Storage Funds Management Limited 100 100Abacus Summit Trust 100 100Abacus Wodonga Land Commercial Trust 100 100Amiga Pty Limited 100 100Bay Street Brighton Unit Trust 100 100Clarendon Property Investments Pty Ltd 100 100Corporate Helpers Pty Ltd 100 100Main Street Pakenham Unit Trust 100 100Oasis Staffing Pty Ltd 100 100Yarradale Developments Trust 100 100Abacus Hobart Growth Trust 100 -
Abacus Group Projects Limited and its subsidiariesAbacus Property Pty Ltd 100 100Abacus Allara Street Trust* 50 50Abacus Wasjig Holdings Pty Limited* 50 50Abacus Repository Trust* 50 50Abacus Ventures Trust* 51 51
equity interest
* These entities are wholly owned by Abacus

ABACUS PROPERTY GROUP
81
NOTES TO THE FINANCIAL STATEMENTS 30 JUNE 2016
19. RELATED PARTY DISCLOSURES (continued) (a) Subsidiaries (continued)
2016 2015Entity % %Abacus Trust and its subsidiaries:Abacus 1769 Hume Highway Trust 100 100Abacus Alderley Trust 100 100Abacus Ashfield Mall Property Trust 100 100Abacus Aspley Village Trust - 100Abacus Australian Aggregation Holding Trust 100 100Abacus Australis Drive Trust 100 100Abacus Bacchus Marsh Trust 100 100Abacus Birkenhead Point Trust 100 100Abacus Browns Road Trust 100 100Abacus Campbell Property Trust 100 100Abacus Greenacre Trust - 100Abacus Liverpool Plaza Trust 100 100Abacus Lutwyche Trust 100 -Abacus Macquarie Street Trust 100 100Abacus Moore Street Trust 100 100Abacus Northshore Trust 1* 25 25Abacus Northshore Trust 2* 25 25Abacus North Sydney Car park Trust 100 100Abacus Oasis Trust 100 100Abacus Premier Parking Trust 100 100Abacus Sanctuary Holdings Pty Limited* 24 24Abacus Shopping Centre Trust 100 100Abacus SP Fund 100 100Abacus St Leonards Trust 100 -Abacus Varsity Lakes Trust 100 100Abacus Virginia Trust 100 100Abacus Westpac House Trust 100 100Abacus WTC Trust 100 100Abacus 14 Martin Place Trust 100 100Abacus 309 George Street Trust - 100Abacus 33 Queen Street Trust 100 100Abacus 710 Collins Street Trust 100 100Lutwyche City Shopping Centre Unit Trust 75 -
Abacus Income Trust and its subsidiaries:Abacus Eagle Farm Trust 100 100Abacus Independent Retail Property Trust 75 75Abacus Retail Property Trust 100 100Abacus Wollongong Property Trust 100 100
equity interest
* These entities are wholly owned by Abacus

ABACUS PROPERTY GROUP
82
NOTES TO THE FINANCIAL STATEMENTS 30 JUNE 2016
19. RELATED PARTY DISCLOSURES (continued) (a) Subsidiaries (continued)
2016 2015Entity % %Abacus Storage Operations Limited and its subsidiaries:Abacus Storage NZ Operations Pty Limited 100 100Abacus Storage Solutions Pty Limited 100 100Abacus Storage Solutions NZ Pty Limited 100 100Abacus USI C Trust 100 100Abacus U Stow It A1 Trust 100 100Abacus U Stow It B1 Trust 100 100Abacus U Stow It A2 Trust 100 100Abacus U Stow It B2 Trust 100 100U Stow It Holdings Limited 100 100U Stow It Pty Limited 100 100
Abacus Storage Property Trust and its subsidiary:Abacus Storage NZ Property Trust 100 100
Abacus Diversified Income Fund II 17 17Abacus Hospitality Fund 10 10Abacus Wodonga Land Fund 15 15
equity interest
Subsidiaries controlled by the Group with material non-controlling interest
Abacus Hospitality Fund: The Group is deemed to have control of AHF based upon the aggregate impact of (a) the Group’s role as responsible entity of AHF and (b) the size and variable nature of returns arising from the Group’s loans to AHF (as the loans provided by the Group to AHF rank pari passu for downside but not on upside at fund wind up).
Abacus Diversified Income Fund II: The Group is deemed to have control of ADIFII due to (a) the Group’s role as responsible entity of ADIFII (b) the size and variable nature of returns arising from the Group’s loans to ADIFII (as the Abacus Working Capital Facility provided by the Group to ADIFII ranks pari passu on downside, but not the upside, at wind up) and (c) the capital and income guarantees made by the Group to unitholders of ADIFII under the ADIFII offer documents.
Abacus Wodonga Land Fund: The Group is deemed to have control of AWLF due to a) the Group’s role as responsible entity of AWLF (waiving of fees) and (b) the Group’s 15% direct interest in the fund and the relative dispersion of the remaining interests not held by the Group.
(b) Ultimate parent AGHL has been designated as the parent entity of the Group
(c) Key management personnel Details of payments are disclosed in Note 20.

ABACUS PROPERTY GROUP
83
NOTES TO THE FINANCIAL STATEMENTS 30 JUNE 2016
19. RELATED PARTY DISCLOSURES (continued) (d) Transactions with related parties
2016 2015$'000 $'000
Transactions with related parties other than associates and joint venturesRevenuesProperty management fees received / receivable 189 177
Transactions with associates and joint venturesRevenuesManagement fees received / receivable from joint ventures 3,569 2,459 Revenue received / receivable from joint ventures 41,512 34,448
Other transactionsLoan advanced to joint ventures (27,716) (83,400)Loan repayments from joint ventures 57,345 32,077 Loan advanced from joint ventures 498 511 Loan repayments to joint ventures - (1,421)
Terms and conditions of transactions
Sales and fees to and purchases and fees charged from related parties are made in arm’s length transactions both at normal market prices and on normal commercial terms. Outstanding balances at year-end are unsecured and settlement occurs in cash. No provision for doubtful debts has been recognised or bad debts incurred with respect to amounts payable or receivable from related parties during the year.
Entity with significant influence
Calculator Australia Pty Ltd (“Kirsh”) is a significant securityholder in the Group with a holding of approximately 49% of the ordinary securities of the Group (2015: 49%).
During the year, Abacus Property Services Pty Ltd was engaged to manage the following properties:
Property Relationship with Kirsh Charge per annum Amt $ 14 Martin Place Tenants in common 3% of gross rental 301,899 4 Martin Place 100% owned by Kirsh 3% of gross rental 189,216
Mrs Myra Salkinder is a non-executive director of the Group and is a senior executive of Kirsh.

ABACUS PROPERTY GROUP
84
NOTES TO THE FINANCIAL STATEMENTS 30 JUNE 2016
20. KEY MANAGEMENT PERSONNEL (a) Compensation for key management personnel
2016 2015$ $
Short-term employee benefits 5,410,648 6,497,887 Post-employment benefits 226,398 269,901 Other long-term benefits 68,625 87,905 Security-based payments 1,148,758 1,166,488
6,854,429 8,022,181
(b) Loans to key management personnel There were no loans to key management personnel and their related parties at any time in 2016 or in the prior year.
(c) Other transactions and balances with key management personnel and their related parties During the financial year, transactions occurred between the Group and Key Management Personnel which are within normal employee and investor relationships.

ABACUS PROPERTY GROUP
85
NOTES TO THE FINANCIAL STATEMENTS 30 JUNE 2016
21. SECURITY BASED PAYMENTS (a) Recognised security payment expenses The expense recognised for employee services received during the year is as follows:
2016 2015$'000 $'000
Expense arising from equity-settled payment transactions 1,983 1,683
(b) Type of security – based payment plan Security Acquisition Rights (SARs)
The deferred variable incentive plan has been designed to align the interests of executives with those of securityholders by providing for a significant portion of the remuneration of participating executives to be linked to the delivery of sustainable underlying profit that covers the distribution level implicit in the Group’s security price.
Key executives have been allocated SARs in the current financial year generally equal to the last current variable incentive paid. Allocations were based on the performance assessment completed in determining current variable incentive awards for the prior financial year, adjusted to take into account other factors that the Board considers specifically relevant to the purpose of providing deferred variable incentives.
The SARs granted during the year vest as follows:
Vesting date Amount Vested* Potential number to vest
September 2016 One quarter of the initial issue 206,307 September 2017 One quarter of the initial issue 206,307 September 2018 One quarter of the initial issue 206,307 September 2019 One quarter of the initial issue 206,307
* The Board is able to claw back unvested SARs if the distribution level fails by more than 10% below the sustainable annual distribution rate
For valuation purposes the SARs are equivalent to European call options (in that they may be “exercised” only at their maturity (i.e. vesting date)). The fair value of the SARs granted is estimated at the date of the grant using a trinomial tree model (using 500 steps) cross checked by a modified Black-Scholes model. The trinomial tree model and the Black-Scholes model generally produce the same values for an option over a non-dividend paying share, or where the option is entitled to the same distributions as are paid on the underlying security, as is assumed in this case, and if the time to exercise is the same, (i.e. at the end of the term).
When SARs vest they will convert into ABP securities on a one for one basis or at the Board’s discretion a cash equivalent amount will be paid.

ABACUS PROPERTY GROUP
86
NOTES TO THE FINANCIAL STATEMENTS 30 JUNE 2016
21. SECURITY BASED PAYMENTS (continued) (c) Summary of SARs granted The following table illustrates movements in SARs during this year:
2016 2015No. No.
Opening balance 1,945,236 1,596,803 Granted during the year 825,228 805,712 Vested during the year (658,707) (457,279)Outstanding at the end of the year 2,111,757 1,945,236
Exercisable at the end of the year - -
The weighted average remaining life of the instrument at 30 June 2016 was 1.2 years (2015: 1.3 years) and the weighted average fair value of the SARs granted during the year was $2.66 (2015: $2.48).
The following table lists the inputs to the model used for the SARs plan for the years ended 30 June 2016 and 30 June 2015:
2016 2015
Expected volatility (%) 21 20 Risk-free interest rate (%) 1.91 - 2.18 2.44 - 2.65 Life of instrument (years) 0.8 - 3.8 0.8 - 3.8 Model used Trinomial Trinomial
The expected life of the SARs is based on historical data and current expectations and is not necessarily indicative of exercise patterns that may occur. The expected volatility reflects the assumption that the historical volatility over a period similar to the life of the SARs is indicative of future trends, which may not necessarily be the actual outcome.

ABACUS PROPERTY GROUP
87
NOTES TO THE FINANCIAL STATEMENTS 30 JUNE 2016
22. OTHER FINANCIAL LIABILITIES Abacus has provided the following guarantees to the ADIFII unitholders:
Unit Type Cash Distribution Yield Guarantee Capital Return Guarantee
Class A $1.00 – Term 3 7.75% pa $1.00 per Unit on 30 September 2016
Class B $1.00 9% pa plus indexation (indexed in line with inflation in each year after 1 July 2011).
$1.00 per Unit at Fund termination (no later than 30 June 2017).
Class C $0.75 9% pa plus indexation (indexed in line with inflation in each year after 1 July 2011).
$0.75 per Unit at Fund termination (no later than 30 June 2017).
The Underwritten Distributions will be achieved by deferring the interest on the Working Capital Facility or by deferring any of the fees payable to Abacus under the constitution of ADIFII (or a combination of these things) or in any other way Abacus considers appropriate. Any interest or fee deferral or other funding support may be recovered if the actual cash distribution exceeds the cash required to meet the underwritten distribution at the expiration of the Fund term or on a winding up of the Fund.
The Underwritten Capital Return will apply to all ADIFII units on issue on or after 1 July 2016 (Class B and C) and on the date stated above for Term 3 of Class A. At the relevant time Abacus will ensure that each holder of Class A and Class B units receives back their $1.00 initial capital and each holder of Class C units receives back their $0.75 initial capital. The Underwritten Capital returns will be satisfied by a payment in cash or by Abacus issuing ABP stapled securities.
Abacus will, if required, set off all or part of the principal of the second secured Working Capital Facility loan provided to ADIFII in satisfaction of the Group’s obligations in respect of the Underwritten Capital Return in respect of the Class B and Class C units.
As a result of the consolidation of ADIFII under AASB10 the underwritten capital guarantee results in ADIFII’s units on issue being classified as a liability and at the end of the period the value was $45.9 million (30 June 2015: $46.0 million).
The guarantee exposure on Class A units - Term 3 of $230,000 will be paid on 30 September 2016.

ABACUS PROPERTY GROUP
88
NOTES TO THE FINANCIAL STATEMENTS 30 JUNE 2016
23. INTANGIBLE ASSETS AND GOODWILL Description of the Group’s intangible assets
2016 2015$'000 $'000
GoodwillBalance at 1 July 32,461 32,461 Balance at 30 June 32,461 32,461 Licences and entitlementsAt 1 July, net of accumulated amortisation 800 800 Disposal (800) - At 30 June, net of accumulated amortisation - 800
Total goodwill and intangibles 32,461 33,261
Impairment tests for goodwill with indefinite useful lives (i) Description of the cash generating units and other relevant information
Goodwill is allocated to a cash generating unit, where the Goodwill acquired through business combinations for the purposes of impairment testing is allocated to the Groups Funds Management segment relating to the property / asset management business. The recoverable amount of the unit has been determined based on a fair value less costs to sell calculation using cash flow projections as at 30 June 2016 covering a five-year period.
(ii) Key assumptions used in valuation calculations
Funds Management Goodwill – the calculation of fair value less costs to sell is most sensitive to the following assumptions:
a. Fee income: based on actual income in the year preceding the start of the budget period and actual funds under management
b. Discount rates: reflects management’s estimate of the time value of money and the risks specific to each unit that are not reflected in the cash flows
c. Property values of the funds/properties under management: based on the fair value of properties
d. Selling costs: management’s estimate of costs to sell the funds/properties under management
e. A pre-tax discount rate of 9.40% (2015: 9.40%) and a terminal growth rate of 2.7% (2015: 2.7%) have been applied to the cash flow projections
(iii) Sensitivity to changes in assumptions
Significant and prolonged property value falls and market influences which could increase discount rates could cause goodwill to be impaired in the future, however, the goodwill valuation as at 30 June 2016 has significant head room thus reasonable changes in the assumptions such as a 0.5% change in the discount rate or a 5% fall in revenue assumptions would not cause any impairment.

ABACUS PROPERTY GROUP
89
NOTES TO THE FINANCIAL STATEMENTS 30 JUNE 2016
24. SUMMARY OF SIGNIFICANT ACCOUNTING POLICIES (a) Basis of Preparation The financial report is a general-purpose financial report, which has been prepared in accordance with the requirements of the Corporations Act 2001 and Australian Accounting Standards. The financial report has also been prepared on a historical cost basis, except for investment properties and derivative financial instruments which have been measured at fair value, interests in joint ventures and associates which are accounted for using the equity method, and certain investments and financial assets measured at fair value. The financial report is presented in Australian dollars and all values are rounded to the nearest thousand dollars ($'000) unless otherwise stated under the option available to the Group under ASIC Class Order 2016/191. The Group is an entity to which the class order applies.
(b) Statement of Compliance The financial report complies with Australian Accounting Standards and International Financial Reporting Standards (IFRS), as issued by the AASB and IASB respectively.
(c) New accounting standards and interpretations (i) Changes in accounting policy and disclosures
The accounting policies adopted are consistent with those of the previous financial year except as follows:
The following amending Standards have been adopted from 1 July 2015 along with the required changes arising from improvements to AASBs 2010-2012 cycle. Adoption of these standards and interpretations did not have any material effect on the financial position or performance of the Group.
- AASB 2013-9 Amendments to Australian Accounting Standards – Conceptual Framework, Materiality and Financial Instruments
- AASB 2015-3 Amendments to Australian Accounting Standards arising from the Withdrawal of AASB 1031 Materiality.
- AASB 2015-4 Amendments to Australian Accounting Standards – Financial Reporting Requirements for Australian Groups.
(ii) Accounting Standards and Interpretation issued but not yet effective
Australian Accounting Standards and Interpretations that have recently been issued or amended but are not yet effective have not been adopted by the Group for the annual reporting period ended 30 June 2016. The significant new standards or amendments are outlined below:
- AASB 9 Financial Instruments (effective 1 January 2018 / applicable for Group 1 July 2018)
This standard includes requirement to improve and simplify the approach for classification and measurement of financial assets compared with the requirements of AASB 139 Financial Instruments: Recognition and Measurement. The Standard contains requirements in the areas of classification, measurement, hedge accounting and derecognition.
The Group will review the classification of its existing financial assets and liabilities in line with the Standard, such as secured and related party loans, options and derivatives. The Group will also evaluate the new impairment model prescribed in this Standard against our current method and the impact that will have on the Group’s current recognition policy.

ABACUS PROPERTY GROUP
90
NOTES TO THE FINANCIAL STATEMENTS 30 JUNE 2016
24. SUMMARY OF SIGNIFICANT ACCOUNTING POLICIES (c) New accounting standards and interpretations (continued) - Revenue from Contracts with Customers (effective 1 January 2018 / applicable for Group 1 July 2018)
AASB15 replaces the current revenue recognition standards AASB 111 Construction Contracts, AASB 118 Revenue and related Interpretations.
AASB 15 specifies the accounting treatment for revenue arising from contracts with customers (except for contracts within the scope of other accounting standards such as leases or financial instruments). The core principle of IFRS 15 is that an entity recognises revenue to depict the transfer of promised goods or services to customers in an amount that reflects the consideration to which the entity expects to be entitled in exchange for those goods or services.
Early adoption of this Standard is permitted.
The Group is currently assessing the impact of the new Standard but does not expect that it will materially impact current revenue recognition.
- Leases (effective 1 January 2019 / applicable for Group 1 July 2019)
AASB 16 supersedes: AASB 117 Leases and associated interpretations.
The key features of AASB 16 are as follows:
Lessee accounting
- Lessees are required to recognise assets and liabilities for all leases with a term of more than 12 months, unless the underlying asset of low value
- A lessee measures right-of-use assets similarly to other non-financial assets and lease liabilities similarly to other financial liabilities
- Assets and liabilities arising from a lease are initially measured on a present value basis. The measurement includes non-cancellable lease payments (including inflation-linked payments), and also includes payments to be made in optional periods if the lessee is reasonably certain to exercise an option to extend the lease, or not to exercise an option to terminate the lease
- AASB 16 contains disclosure requirements for lessees
Lessor accounting
- AASB 16 substantially carries forward the lessor accounting requirements in AASV 117. Accordingly, a lessor continues to classify its leases as operating leases or finance leases, and to account for those two types of leases differently
- AABB 16 also requires enhanced disclosures to be provided by lessors that will improve information disclosed about a lessor’s risk exposure, particularly to residual value risk
Early adoption is permitted, provided the new revenue standard, AASB15 Revenue from Contracts with Customers, has been applied, or is applied at the same date as AASB 16.
The Group has considered the impact of this Standard which encompasses the Group as a Lessee. At the time of consideration, the Group’s lease would be expired by the time the Standard comes in to effect and the Group has not yet negotiated nor entered into new terms. As such, no analysis has been undertaken at this time.
AASB 14, AASB 2014-6, AASB 1056, AASB 2015-6, AASB 2015-7, AASB 2015-9 and AASB 2016-4 will have no application to the Group.

ABACUS PROPERTY GROUP
91
NOTES TO THE FINANCIAL STATEMENTS 30 JUNE 2016
24. SUMMARY OF SIGNIFICANT ACCOUNTING POLICIES (d) Basis of consolidation The consolidated financial statements comprise the financial statements of AGHL and its subsidiaries, AT and its subsidiaries, AGPL and its subsidiaries, AIT and its subsidiaries, ASPT and its subsidiaries and ASOL and its subsidiaries collectively referred to as the Group.
Subsidiaries are all those entities over which the Group has power over the investee such that the Group is able to direct the relevant activities, has exposure or rights to variable returns from its involvement with the investee and has the ability to use its power over the investee to affect the amount of the investor’s returns.
The adoption of AASB 10 in the year ended 30 June 2012 led to the consolidation of Abacus Hospitality Fund, and Abacus Diversified Income Fund II. In the year ended 30 June 2013 the Group also consolidated Abacus Wodonga Land Fund. This is due to the combination of the Group’s role as responsible entity and its exposure to variable returns arising from its collective equity and loan investments in these funds and certain guarantees.
The financial statements of subsidiaries are prepared for the same reporting period as the parent company, using consistent accounting policies with adjustments made to bring into line any dissimilar accounting policies that may exist.
All intercompany balances and transactions, including unrealised profits from intra-group transactions, have been eliminated in full and subsidiaries are consolidated from the date on which control is transferred to the Group and cease to be consolidated from the date on which control is transferred out of the Group. Where there is a loss of control of a subsidiary, the consolidated financial statements include the results for the part of the reporting period during which the Group has control.
The acquisition of subsidiaries is accounted for using the purchase method of accounting. The purchase method of accounting involves allocating the cost of the business combination to the fair value of the assets acquired and the liabilities and contingent liabilities assumed at the date of acquisition.
Non-controlling interests are allocated their share of net profit after tax in the consolidated income statement and are presented within equity in the consolidated statement of financial position, separately from the equity of the owners of the parent.
Non-controlling interests represent those equity interests in Abacus Hospitality Fund, Abacus Wodonga Land Fund, Abacus Jigsaw Trust, Lutwyche City Shopping Centre Unit Trust and Abacus Independent Retail Property Trust that are not held by the Group and are presented separately in the income statement and within equity in the consolidated statement of financial position.

ABACUS PROPERTY GROUP
92
NOTES TO THE FINANCIAL STATEMENTS 30 JUNE 2016
24. SUMMARY OF SIGNIFICANT ACCOUNTING POLICIES (e) Foreign currency translation Functional and presentation currency
Both the functional and presentation currency of the Group are in Australian dollars. Each entity in the Group determines its own functional currency and items are included in the financial statements of each entity are measured using that functional currency.
Transactions and balances
Transactions in foreign currencies are initially recorded in the functional currency by applying the exchange rates ruling at the date of the transaction. Monetary assets and liabilities denominated in foreign currencies are retranslated at the rate of exchange ruling at the balance sheet date.
All exchange differences in the consolidated financial report are taken to profit or loss with the exception of differences on foreign currency borrowings on translation of foreign operations that provide a hedge against a net investment in a foreign operation. These are taken directly to equity until the disposal of the net investment, at which time they are recognised in profit or loss. On disposal of a foreign operation, the cumulative amount recognised in equity relating to that particular foreign operation is recognised in profit or loss. Tax charges and credits attributable to exchange differences on those borrowings are also recognised in equity.
Non-monetary items that are measured in terms of historical cost in a foreign currency are translated using the exchange rate as at the date of the initial transaction. Non-monetary items measured at fair value in a foreign currency are translated using the exchange rates at the date when the fair value was determined.
At reporting date the assets and liabilities of foreign operations are translated into the presentation currency of the Group at the rate of exchange prevailing at balance date and the financial performance is translated at the average exchange rate prevailing during the reporting period. The exchange differences arising on translation are taken directly to the foreign currency translation reserve in equity.
(f) Revenue recognition Revenue is recognised and measured at the fair value of the consideration received or receivable to the extent it is probable that the economic benefits will flow to the Group and the revenue can be reliably measured. The following specific recognition criteria must also be met before revenue is recognised:
Rental and Storage income
Rental income from investment properties is accounted for on a straight-line basis over the lease term. Contingent rental income is recognised as income in the periods in which it is earned. Lease incentives granted are recognised as an integral part of the total rental income.
Hotel Income
Revenue from rooms is recognised and accrued on the provision of rooms or on the date which rooms are to be provided in accordance with the terms and conditions of the bookings. Advance deposits from customers received are not recognised as revenue until such time when the rooms have been provided or when the customers forfeit the deposits due to failure of attendance.
Finance Income
Revenue is recognised as interest accrues using the effective interest method. This is a method of calculating the amortised cost of a financial asset and allocating the interest income over the relevant period using the effective interest rate, which is the rate that exactly discounts estimated future cash receipts through the expected life of the financial asset to the net carrying amount of the financial asset.
Income from the sale of joint venture profit share rights is recognised when the Group enters into arrangements with other parties which result in the Group receiving consideration for the sale of its right to receive a profit share from the joint venture.

ABACUS PROPERTY GROUP
93
NOTES TO THE FINANCIAL STATEMENTS 30 JUNE 2016
24. SUMMARY OF SIGNIFICANT ACCOUNTING POLICIES (f) Revenue recognition (continued) Dividends and distributions
Revenue is recognised when the Group’s right to receive the payment is established.
Net change in fair value of investments and financial instruments derecognised during the year
Revenue from sale of investments is recognised on settlement when the significant risks and rewards of the ownership of the investments have been transferred to the buyer. Risks and rewards are generally considered to have passed to the buyer at the time of settlement of the sale. Financial instruments are derecognised when the right to receive or pay cash flows from the financial derivative has expired or when the entity transfers substantially all the risks and rewards of the financial derivative through termination. Gains or losses due to derecognition are recognised in the statement of comprehensive income.
Net change in fair value of investments held at balance date
Changes in market value of investments are recognised as revenue or expense in determining the net profit for the period.
Sale of inventory
Revenue from property development sales is recognised when the significant risks, rewards of ownership and effective control has been transferred to the purchaser which has been determined to occur upon settlement and after contractual duties are completed.
No revenue is recognised if there are significant uncertainties regarding recovery of the consideration due, the costs incurred or to be incurred cannot be measured reliably, there is a risk of return or there is continuing management involvement to the degree usually associated with ownership.
(g) Expenses Expenses including rates, taxes and other outgoings, are brought to account on an accrual basis and any related payables are carried at cost.
(h) Cash and cash equivalents Cash and cash equivalents in the balance sheet comprise cash at bank and in hand and short-term deposits with an original maturity of three months or less that are readily convertible to known amounts of cash which are subject to an insignificant risk of changes in value.
For the purposes of the Statement of Cash Flow, cash and cash equivalents consist of cash and cash equivalents as defined above.
(i) Trade and other receivables Trade receivables, which generally have 30 day terms, are recognised at amortised cost, which in the case of the Group, is the original invoice amount less an allowance for any uncollectible amounts.
Collectability of trade receivables is reviewed on an ongoing basis. An allowance for doubtful debts is raised when there is objective evidence that collection of the full amount is no longer probable. Bad debts are written off when identified.
(j) Derivative financial instruments and hedging The Group utilises derivative financial instruments, both foreign exchange and interest rate swaps to manage the risk associated with foreign currency and interest rate fluctuations. Such derivative financial instruments are recognised at fair value.
The Group has set defined policies and implemented hedging policies to manage interest and exchange rate risks. Derivative instruments are transacted in line with these policies to achieve the economic outcomes in line with the Group’s treasury and hedging policy. They are not transacted for speculative purposes.
The Group does not employ hedge accounting and as such derivatives are recorded at fair value with gains or losses arising from the movement in fair values recorded in the income statement.

ABACUS PROPERTY GROUP
94
NOTES TO THE FINANCIAL STATEMENTS 30 JUNE 2016
24. SUMMARY OF SIGNIFICANT ACCOUNTING POLICIES (k) Investments and other financial assets All investments are initially recognised at cost, being the fair value of the consideration given.
Financial assets in the scope of AASB 139 Financial Instruments: Recognition and Measurement are classified as either financial assets at fair value through profit or loss, loans and receivables, held to maturity investments, or available-for-sale financial assets. The Group determines the classification of its financial assets after initial recognition and, when allowed and appropriate, re-evaluates this designation at each financial year-end. At 30 June the Group’s investments in listed and unlisted securities have been classified as financial assets at fair value through profit or loss and property loans are classified as loans and receivables.
Recognition and derecognition
Purchases and sales of financial assets that require delivery of assets within the time frame generally established by regulation or convention in the market place are recognised on the trade date i.e. the date that the Group commits to purchase the assets. Financial assets are derecognised when the right to receive cash flows from the financial assets have expired or been transferred.
After initial recognition, investments, which are classified as held for trading, are measured at fair value. Financial assets are classified as held for trading if they are acquired for the purpose of selling in the near term with the intention of making a profit. Gains or losses on investments held for trading are recognised in the income statement.
For investments where there is no quoted market or unit price, fair value is determined by reference to the current market value of another instrument which is substantially the same or is calculated based on the expected cash flows of the underlying net asset base of the investment.
Financial assets at fair value through profit or loss
A financial asset or financial liability at fair value is designated by the entity at fair value through the profit and loss upon initial recognition. APG uses this designation where doing so results in more relevant information. This group of financial assets and liabilities are managed and their performance evaluated on a fair value basis, in accordance with APG’s documented risk management and investment strategy which outlines that these assets and liabilities are managed on a total rate of return basis, and information about the instruments is provided internally on that basis to the entity’s key management personnel and the Board.
APG holds investments in unlisted securities and enters into loans and receivables with associated options that provide for a variety of outcomes including repayment of principal and interest, satisfaction through obtaining interests in equity or property or combinations thereof.
Loans and receivables
Loans and receivables are non-derivative financial assets with fixed or determinable payments that are not quoted in an active market. Such assets are carried at amortised cost using the effective interest method. Gains and losses are recognised in profit or loss when the loans and receivables are derecognised or impaired, as well as through the amortisation process.
Subsidiaries
Investment in subsidiaries are held at lower of cost or recoverable amount.
(l) Investment in associates The Group’s investments in its associates are accounted for under the equity method of accounting in the consolidated financial statements. The associates are entities over which the Group has significant influence but not control and accordingly are neither subsidiaries nor joint ventures.
The investment in the associates is carried in the consolidated balance sheet at cost plus post-acquisition changes in the Group’s share of net assets of the associates, less any impairment in value. The Group’s share of its associates’ post-acquisition profits or losses is recognised in the income statement, and its share of post-acquisition movements in reserves is recognised in reserves. The cumulative post-acquisition movements are adjusted against the carrying amount of the investment.

ABACUS PROPERTY GROUP
95
NOTES TO THE FINANCIAL STATEMENTS 30 JUNE 2016
24. SUMMARY OF SIGNIFICANT ACCOUNTING POLICIES (l) Investment in associates (continued) Transactions resulting in unrealised profit in the associate are eliminate to the extent that they reduce the carrying value of the investment to nil. When the Group’s share of losses in an associate equals or exceeds its interest in the associate, including any unsecured long-term receivable and loans, the Group does not recognise further losses, unless it has incurred obligations or made payments on behalf of the associate.
Investments in associates held by the parent are held at lower of cost and recoverable amount in the parent’s financial statements.
(m) Interest in joint arrangements The Group’s interest in joint venture entities is accounted for under the equity method of accounting in the consolidated financial statements. The investment in the joint venture entities is carried in the consolidated balance sheet at cost plus post-acquisition changes in the Group’s share of net assets of the joint ventures, less any impairment in value. The consolidated income statement reflects the Group’s share of the results of operations of the joint ventures.
Investments in joint ventures are held at the lower of cost or recoverable amount in the investing entities.
The Group’s interest in joint operations that give the parties a right to the underlying assets and obligations themselves is accounted for by recognising the Group’s share of those assets and obligations.
(n) Property, plant and equipment Hotel property, plant and equipment
Property (including land and buildings), plant and equipment represent owner-occupied properties and are initially measured at cost including transaction costs and acquisition costs. Subsequent to initial recognition, properties are measured at fair value less accumulated depreciation and any impairment in value after the date of revaluation.
Depreciation is calculated on a straight-line basis over the estimated useful life of the asset as follows:
Buildings – 50 years Plant and equipment – 3 to 20 years
Revaluations of land and buildings
Any revaluation increment is credited to the asset revaluation reserve included in the equity section of the balance sheet except to the extent that it reverses a revaluation decrease of the same asset previously recognised in profit or loss, in which case the increase is recognised in profit or loss.
Any revaluation decrease is recognised in profit or loss except to the extent that it offsets a previous revaluation increase for the same asset in which case the decrease is debited directly to the asset revaluation reserve to the extent of the credit balance existing in the revaluation reserve for that asset.
Gains and losses on disposals are determined by comparing proceeds with the carrying amount. These are included in the income statement.
Any accumulated depreciation as at the revaluation date is eliminated against the gross carrying amounts of the assets and the net amounts are restated to the revalued amounts of the assets.
Hotel property, plant and equipment are independently valued on an annual basis unless the underlying financing requires a more frequent independent valuation cycle.
Other property, plant and equipment
Land and buildings are measured at fair value, based on periodic valuations by external independent valuers, less accumulated depreciation on buildings and less any impairment losses recognised after the date of the revaluation.
Plant and equipment is stated at historical cost less accumulated depreciation and any impairment losses.

ABACUS PROPERTY GROUP
96
NOTES TO THE FINANCIAL STATEMENTS 30 JUNE 2016
24. SUMMARY OF SIGNIFICANT ACCOUNTING POLICIES (n) Property, plant and equipment (continued) Depreciation is calculated on a straight-line basis over the estimated useful life of the asset as follows:
Buildings – 40 years Plant and equipment – over 5 to 15 years
Impairment
The carrying values of property, plant and equipment are reviewed for impairment when events or changes in circumstances indicate the carrying value may not be recoverable. For an asset that does not generate largely independent cash inflows, the recoverable amount is determined for the cash-generating unit to which the asset belongs.
If any such indication exists and where the carrying values exceed the estimated recoverable amount, the assets or cash-generating units are written down to their recoverable amount.
The recoverable amount of property (including land and buildings), plant and equipment is the greater of fair value less costs to sell and value in use. In assessing value in use, the estimated future cash flows are discounted to their present value using a pre-tax discount rate that reflects current market assessments of the time value of money and the risks specific to the assets.
Impairment losses are recognised in the income statement.
Independent valuations are performed with sufficient regularity to ensure that the carrying amount does not differ materially from the asset’s fair value at the balance sheet date.
Disposal An item of property, plant and equipment is derecognised upon disposal or when no future economic benefits are expected to arise from the continued use of the asset.
Any gain or loss arising on derecognition of the asset (calculated as the difference between the net disposal proceeds and the carrying amount of the asset) is included in the income statement in the year the asset is derecognised.
Other property, plant and equipment are independently valued on a staggered basis every two years unless the underlying financing requires a more frequent independent valuation cycle.
(o) Investment properties Investment properties are measured initially at cost, including transaction costs. The carrying amount includes the cost of replacing parts of an existing investment property at the time that the cost is incurred if the recognition criteria are met, and excludes the costs of day-to-day servicing of an investment property. Subsequent to initial recognition, investment properties are stated at fair value, which reflects market and property specific conditions at the balance sheet date. Gains or losses arising from changes in the fair values of investment properties are recognised in the income statement in the year in which they arise.
Investment properties are derecognised either when they have been disposed of or when the investment property is permanently withdrawn from use and no future economic benefit is expected from its disposal. Any gains or losses on the retirement or disposal of an investment property are recognised in the income statement in the year of retirement or disposal.
Investment properties under construction are carried at fair value. Fair value is calculated based on estimated fair value on completion after allowing for the remaining expected costs of completion plus an appropriate risk adjusted development margin.
Transfers are made to investment property when, and only when, there is a change in use, evidenced by commencement of an operating lease to another party or ending of construction or development. Transfers are made from investment property when, and only when, there is a change in use, evidenced by commencement of development with a view to sale.
For a transfer from investment property to inventories, the deemed cost of property for subsequent accounting is its fair value at the date of change in use. For a transfer from inventories to investment property, any difference between the fair value of the property at that date and its previous carrying amount is recognised in profit or loss.

ABACUS PROPERTY GROUP
97
NOTES TO THE FINANCIAL STATEMENTS 30 JUNE 2016
24. SUMMARY OF SIGNIFICANT ACCOUNTING POLICIES (o) Investment properties (continued) Land and buildings that meet the definition of investment property are considered to have the function of an investment and are therefore regarded as a composite asset, the overall value of which is influenced by many factors, the most prominent being income yield, rather than diminution in value of the building content due to the passing of time. Accordingly, the buildings and all components thereof, including integral plant and equipment, are not depreciated.
Investment properties are independently valued on a staggered basis every two years unless the underlying financing requires a more frequent independent valuation cycle. In determining fair value, the capitalisation of net income method and the discounting of future cashflows to their present value have been used.
Lease incentives provided by the Group to lessees, and rental guarantees which may be received by the Group from third parties (arising from the acquisition of investment properties) are included in the measurement of fair value of investment property. Leasing costs and incentives are included in the carrying value of investment property and are amortised over the respective lease period, either using a straight-line basis, or a basis which is more representative of the pattern of benefits.
Under AASB 140, investment properties, including any plant and equipment, are not subject to depreciation. However, depreciation allowances in respect of certain buildings, plant and equipment are currently available to investors for taxation purposes.
(p) Leases The determination of whether an arrangement is or contains a lease is based on the substance of the arrangement and requires an assessment of whether the fulfilment of the arrangement is dependent on the use of a specific asset or assets and the arrangement conveys a right to use the asset.
Group as lessee
Operating lease payments are recognised as an expense in the income statement on a straight-line basis over the lease term. Lease incentives are recognised in the income statement as an integral part of the total lease expense.
Group as a lessor
Leases in which the Group retains substantially all the risks and benefits of ownership of the lease assets are classified as operating leases.
(q) Goodwill and intangibles
Goodwill
Goodwill on acquisition is initially measured at cost being the excess of the cost of the business combination over the acquirer’s interest in the net fair value of the identifiable assets, liabilities and contingent liabilities. Following initial recognition, goodwill is measured at cost less any accumulated impairment losses and is not amortised. Goodwill is reviewed for impairment, annually or more frequently if events or changes in circumstances indicate that the carrying value may be impaired.
For the purpose of impairment testing, goodwill acquired in a business combination is, from the acquisition date, allocated to each of the Group’s cash-generating units, or groups of cash-generating units, that are expected to benefit from the synergies of the combination, irrespective of whether other assets or liabilities of the Group are assigned to those units or groups of units. Each unit or group of units to which the goodwill is so allocated:
- Represents the lowest level within the Group at which the goodwill is monitored for internal management purposes; and
- Is not larger than a segment based on either the Group’s primary or the Group’s secondary reporting format determined in accordance with AASB 8 Operating Segments.
ABACUS PROPERTY GROUP
98
NOTES TO THE FINANCIAL STATEMENTS 30 JUNE 2016
24. SUMMARY OF SIGNIFICANT ACCOUNTING POLICIES (q) Goodwill and intangibles (continued) Impairment is determined by assessing the recoverable amount of the cash-generating unit (group of cash-generating units), to which the goodwill relates. When the recoverable amount of the cash-generating unit (group of cash-generating units) is less that the carrying amount, an impairment loss is recognised. When goodwill forms part of a cash-generating unit (group of cash-generating units) and an operation within that unit is disposed of, the goodwill associated with the operation disposed of is included in the carrying amount of the operation when determining the gain or loss on disposal of the operation. Goodwill disposed of in this manner is measured based on the relative values of the operation disposed of and the portion of the cash-generating unit retained.
Impairment losses recognised for goodwill are not subsequently reversed.
Intangible assets
Intangible assets acquired separately or in a business combination are initially measured at cost. Following initial recognition, intangibles are carried at cost less accumulated amortisation and impairment losses.
Intangible assets created within the business are not capitalised and expenditure is charged against profits in the period in which the expenditure is incurred.
The useful lives of these intangible assets are assessed to be either finite or indefinite. Intangible assets with finite lives are amortised over the useful life and assessed for impairment whenever there is an indication that the intangible asset may be impaired. The amortisation period and the amortisation method for an intangible asset with a finite life is reviewed at least each financial year-end. Changes in the expected useful life or the expected pattern of consumption of future economic benefit embodied in the asset are accounted for prospectively by changing the amortisation period or method, as appropriate, which is a change in an accounting estimate. The amortisation expense on intangible assets with finite lives is recognised in the income statement through the ‘depreciation and amortisation expense’ line item.
Intangible assets with indefinite useful lives are tested for impairment annually either individually or at the cash generating unit level. Such intangibles are not amortised. The useful life of an intangible asset with an indefinite life is reviewed each reporting period to determine whether the indefinite life assessment continues to be supportable. If not, the change in the useful life assessment from indefinite to finite is accounted for as a change in an accounting estimate and is thus accounted for on a prospective basis.
(r) Impairment of non-financial assets other than goodwill Intangible assets that have an indefinite useful life are not subject to amortisation and are tested annually for impairment, or more frequently if events or changes in circumstances indicate that they might be impaired. Other assets are tested for impairment whenever events or changes in circumstances indicate that the carrying amount may not be recoverable. An impairment loss is recognised for the amount by which the asset’s carrying amount exceeds its recoverable amount. Recoverable amount is the higher of an asset’s fair value less costs to sell and value in use. For the purposes of assessing impairment, assets are grouped at the lowest levels for which there are separately identifiable cash inflows that are largely independent of the cash inflows from other assets or groups of assets (cash-generating units). Non-financial assets other that goodwill that suffered an impairment are tested for possible reversal of the impairment whenever events or changes in circumstances indicate that the impairment may have reversed.
(s) Trade and other payables Trade payables and other payables are carried at amortised cost. They represent liabilities for goods and services provided to the Group prior to the end of the financial year that are unpaid and arise when the Group becomes obliged to make future payments in respect of the purchase of these goods and services. The amounts are unsecured and are usually paid within 30 days of recognition.
(t) Provisions and employee leave benefits Provisions are recognised when the Group has a present obligation (legal or constructive) as a result of a past event and it is probable that an outflow of resources embodying economic benefits will be required to settle the obligation and a reliable estimate can be made of the amount of the obligation.

ABACUS PROPERTY GROUP
99
NOTES TO THE FINANCIAL STATEMENTS 30 JUNE 2016
24. SUMMARY OF SIGNIFICANT ACCOUNTING POLICIES (t) Provisions and employee leave benefits (continued) Provisions are measured at the present value of management’s best estimate of the expenditure required to settle the present obligation at the balance sheet date. If the effect of the time value of money is material, provisions are discounted using a current pre-tax rate that reflects the time value of money and the risks specific to the liability. The increase in the provision resulting from the passage of time is recognised in finance costs.
Employee leave benefits
(i) Wages, salaries, annual leave and sick leave
Liabilities for wages and salaries, including non-monetary benefits, annual leave and accumulating sick leave expected to be settled within 12 months of the reporting date are recognised in respect of employees’ services up to the reporting date. They are measured at the amounts expected to be paid when the liabilities are settled. Expenses for non-accumulating sick leave are recognised when the leave is taken and are measured at the rates paid or payable.
ii) Long service leave
The liability for long service leave is recognised and measured as the present value of expected future payments to be made in respect of services provided by employees up to the reporting date using the projected unit credit method. Consideration is given to expected future wage and salary levels, experience of employee departures, and periods of service. Expected future payments are discounted using market yields at the reporting date on national government bonds with terms to maturity and currencies that match, as closely as possible, the estimated future cash outflows.
(u) Distributions and dividends Trusts generally distribute their distributable assessable income to their unitholders. Such distributions are determined by reference to the taxable income of the respective trusts. Distributable income may include capital gains arising from the disposal of investments and tax-deferred income. Unrealised gains and losses on investments that are recognised as income are usually retained and are generally not assessable or distributable until realised. Capital losses are not distributed to security holders but are retained to be offset against any future realised capital gains.
A liability for dividend or distribution is recognised in the Balance Sheet if the dividend or distribution has been declared, determined or publicly recommended prior to balance date.
(v) Interest-bearing loans and borrowings All loans and borrowings are initially recognised at cost, being the fair value of the consideration received net of transaction costs associated with the borrowing.
After initial recognition, interest-bearing loans and borrowings are subsequently measured at amortised cost using the effective interest method. Fees paid in the establishment of loan facilities that are yield related are included as part of the carrying amount of loans and borrowings.
Borrowings are classified as non-current liabilities where the Group has an unconditional right to defer settlement of the liability for at least 12 months after the balance sheet date.
Borrowing Costs
Borrowing costs are recognised as an expense when incurred unless they relate to a qualifying asset or to upfront borrowing establishment and arrangement costs, which are deferred and amortised as an expense over the life of the facility. A qualifying asset is an asset that generally takes more than 12 months to get ready for its intended use or sale. In these circumstances, the financing costs are capitalised into the cost of the asset. Where funds are borrowed by the Group for the acquisition or construction of a qualifying asset, the amount of the borrowing costs capitalised are those incurred in relation to the borrowing.
(w) Contributed equity Issued and paid up capital is recognised at the fair value of the consideration received by the Group. Stapled securities are classified as equity. Incremental costs directly attributable to the issue of new securities are shown in equity as a deduction, net of tax, from the proceeds.
ABACUS PROPERTY GROUP
100
NOTES TO THE FINANCIAL STATEMENTS 30 JUNE 2016
24. SUMMARY OF SIGNIFICANT ACCOUNTING POLICIES (x) Non-current assets held for sale Before classification as held for sale the measurement of the assets is updated. Upon classification as held for sale, assets are recognised at the lower of carrying amount and fair value less costs to sell with the exception of investment properties which are valued in accordance with Note 24(o).
Gains and losses from revaluations on initial classification and subsequent re-measurement are recognised in the income statement.
(y) Inventories Property Development
Inventories are stated at the lower of cost and net realisable value. Net realisable value is determined on the basis of sales in the ordinary course of business. Expenses of marketing, selling and distribution to customers are estimated and deducted to establish net realisable value. Where the net realisable value of inventory is less than cost, an impairment expense is recognised in the consolidated income statement. Reversals of previously recognised impairment charges are recognised in the consolidated income statement such that the inventory is always carried at the lower of cost and net realisable value. Cost includes the purchase consideration, development costs and holding costs such as borrowing costs, rates and taxes.
Hotel
Inventories are valued at the lower of cost and net realisable value.
Net realisable value is the estimated selling price in the ordinary course of business, less the estimated costs necessary to make the sale.
(z) Taxation The Group comprises taxable and non-taxable entities. A liability for current and deferred tax and tax expense is only recognised in respect of taxable entities that are subject to income tax and potential capital gains tax as detailed below.
Trust income tax
Under current Australian income tax legislation AT, AIT, ASPT, AHT and ADIFII are not liable to Australian income tax provided security holders are presently entitled to the taxable income of the trusts and the trusts generally distribute their taxable income.
Company income tax
AGHL and its Australian resident wholly-owned subsidiaries, ASOL and its Australian resident wholly-owned subsidiaries and AHL and its Australian resident wholly-owned subsidiaries have formed separate tax consolidation groups. AGHL, ASOL and AHL have entered into tax funding agreements with their Australian resident wholly-owned subsidiaries, so that each subsidiary agrees to pay or receive its share of the allocated tax at the current tax rate.
The head tax entity and the controlled entities in each tax consolidated group continue to account for their own current and deferred tax amounts.
In addition to its own current and deferred tax amounts, the head tax entity also recognises the current tax liabilities (or assets) and the deferred tax assets arising from unused tax losses and unused tax credits assumed from controlled entities in the tax consolidated group.
Assets or liabilities arising under tax funding agreements with the tax consolidated entities are recognised as amounts receivable from or payable to other entities in the group.
Any difference between the amounts assumed and amounts receivable or payable under the tax funding agreements are recognised as a contribution to (or distribution from) wholly-owned tax consolidated entities.
Current tax assets and liabilities for the current and prior periods are measured at the amount expected to be recovered from or paid to the taxation authorities. The tax rates and tax laws used to compute the amount are those that are enacted or substantively enacted by the balance sheet date.

ABACUS PROPERTY GROUP
101
NOTES TO THE FINANCIAL STATEMENTS 30 JUNE 2016
24. SUMMARY OF SIGNIFICANT ACCOUNTING POLICIES (z) Taxation (continued) Deferred income tax assets are recognised for all deductible temporary differences, carry forward of unused tax assets and unused tax losses, to the extent that it is probable that taxable profit will be available against which the deductible temporary differences, and the carry-forward of unused tax assets and unused tax losses can be utilised, except:
- when the deferred income tax asset relating to the deductible temporary difference arises from the initial recognition of an asset or liability in a transaction that is not a business combination and, at the time of the transaction, affects neither the accounting profit nor taxable profit or loss; or
- when the deductible temporary differences associated with investments in subsidiaries, associates and interests in joint ventures, deferred tax assets are only recognised to the extent that it is probable that the temporary differences will reverse in the foreseeable future and taxable profit will be available against which the temporary differences can be utilised.
The carrying amount of deferred income tax assets is reviewed at each balance sheet date and reduced to the extent that it is no longer probable that sufficient taxable profit will be available to allow all or part of the deferred income tax asset to be utilised.
Unrecognised deferred income tax assets are reassessed at each balance sheet date and are recognised to the extent that it has become probable that future taxable profit will allow the deferred tax asset to be recovered.
Deferred income tax is provided on all temporary differences at the balance sheet date between the tax bases of assets and liabilities and their carrying amounts for financial reporting purposes.
Deferred income tax liabilities are recognised for all taxable temporary differences, except:
- when the deferred income tax liability arises from the initial recognition of an asset or liability in a transaction that is not a business combination and, at the time of the transaction, affects neither the accounting profit nor taxable profit or loss; or
- when the taxable temporary differences associated with investments in subsidiaries, associates and interests in joint ventures, and the timing of the reversal of the temporary differences can be controlled and it is probable that the temporary differences will not reverse in the foreseeable future.
Deferred income tax assets and liabilities are measured at the tax rates that are expected to apply to the year when the asset is realised or the liability is settled, based on tax rates (and tax laws) that have been enacted or substantively enacted at the balance sheet date.
Income taxes relating to items recognised directly in equity are recognised in equity and not in the income statement.
Deferred tax assets and deferred tax liabilities are offset only if a legally enforceable right exists to set off current tax assets against current tax liabilities and the deferred tax assets and liabilities relate to the same taxable entity and the same taxation authority.
New Zealand
The trusts that operate in New Zealand (“NZ”) are treated as a company for NZ income tax purposes and are taxed at the corporate tax rate of 28% (2015: 28%). NZ income tax paid by the Trusts can be claimed as foreign tax credits to offset against foreign income and distributable to security holders. NZ tax losses are carried forward provided the continuity test of ownership is satisfied. Interest expense from the Trusts are fully deductible subject to thin capitalisation considerations. Property revaluation gains or losses are to be excluded from taxable income, with no deferred tax implications as capital gains are not taxed in NZ.
Income derived by companies which are incorporated in Australia and registered in NZ as overseas companies is exempt from tax in Australia where the income has been taxed in NZ. This income is regarded as non-assessable non-exempt income. As such, income tax is calculated on the companies’ NZ taxable income and taxed at the NZ corporate rate of 28% (2015: 28%).

ABACUS PROPERTY GROUP
102
NOTES TO THE FINANCIAL STATEMENTS 30 JUNE 2016
24. SUMMARY OF SIGNIFICANT ACCOUNTING POLICIES (z) Taxation (continued) Goods and services tax (GST)
Revenues, expenses and assets are recognised net of the amount of GST except when the GST incurred on a purchase of goods and services is not recoverable from the taxation authority, in which case the GST is recognised as part of the cost of acquisition of the asset or as part of the expense item as applicable; and receivables and payables are stated with the amount of GST included.
The net amount of GST recoverable from, or payable to, the taxation authority is included as part of receivables or payables in the balance sheet.
Cash flows are included in the Cash Flow Statement on a gross basis and the GST component of cash flows arising from investing and financing activities, which is recoverable from, or payable to, the taxation authority are classified as operating cash flows.
Commitments and contingencies are disclosed net of the amount of GST recoverable from, or payable to, the taxation authority.
(za) Earnings per stapled security (EPSS) Basic EPSS is calculated as net profit attributable to stapled security holders, adjusted to exclude costs of servicing equity (other than distributions) divided by the weighted average number of stapled securities on issue during the period under review.
Diluted EPSS is calculated as net profit attributable to stapled security holders, adjusted for:
- costs of servicing equity (other than distributions); - the after tax effect of dividends and interest associated with dilutive potential stapled securities that have
been recognised as expenses; and - other non-discretionary changes in revenues or expenses during the period that would result from the dilution
of potential stapled securities;
divided by the weighted average number of stapled securities and dilutive potential stapled securities, adjusted for any bonus element.
(zb) Security based payment plans Executives of the Group receive remuneration in the form of security based payments, whereby Executives render services as consideration for equity instruments (equity-settled transactions).
The cost of equity-settled transactions is determined by the fair value at the date when the grant is made, using an appropriate valuation model and is recognised, together with a corresponding increase in other capital reserves in equity, over the period in which the performance and/or service conditions are fulfilled. The cumulative expense recognised for equity-settled transactions at each reporting date until the vesting date reflects the extent to which the vesting period has expired and the Group’s best estimate of the number of equity instruments that will ultimately vest. The income statement expense or credit for a period represents the movement in cumulative expense recognised as at the beginning and end of that period and is recognised in employee benefits expense (Note 21).
No expense is recognised for awards that do not ultimately vest, except for equity-settled transactions for which vesting is conditional upon a market or non-vesting condition. These are treated as vesting irrespective of whether or not the market or non-vesting conditions are satisfied, provided that all other performance and / or service conditions are satisfied.
When the terms of an equity-settled award are modified, the minimum expense recognised is the expense had the terms not been modified, if the original terms of the award are met. An additional expense is recognised for any modification that increases the total fair value of the security based payment transaction, or is otherwise beneficial to the employee as measured at the date of modification.
When an equity-settled award is cancelled, it is treated as if it vested on the date of cancellation, and any expense not yet recognised for the award is recognised immediately. This includes any award where non-vesting conditions within the control of either the entity or the employee are not met.

ABACUS PROPERTY GROUP
103
NOTES TO THE FINANCIAL STATEMENTS 30 JUNE 2016
25. AUDITOR’S REMUNERATION
2016 2015$ $
Amounts received or due and receivable by Ernst & Young Australia for: - An audit of the financial report of the entity and any other entity in the consolidated group 1,090,930 1,015,101 - Other services in relation to the entity and any other entity in the consolidated group
- assurance services 101,835 64,219 - compliance services 35,800 35,827
1,228,565 1,115,147
26. EVENTS AFTER BALANCE SHEET DATE Other than as disclosed in this report, there has been no other matter or circumstance that has arisen since the end of the financial year that has significantly affected, or may affect, the Group’s operations in future financial years, the results of those operations or the Group’s state of affairs in future financial years.

ABACUS PROPERTY GROUP
104
DIRECTORS’ DECLARATION
In accordance with a resolution of the Directors of Abacus Group Holdings Limited, we state that:
In the opinion of the directors:
a. the financial statements, notes and the additional disclosures included in the directors’ report designated as audited, of the company and of the consolidated entity are in accordance with the Corporations Act 2001, including:
(i) giving a true and fair view of the company’s and consolidated entity’s financial position as at 30 June 2016 and of their performance for the year ended on that date; and (ii) complying with Australian Accounting Standards (including Australian Accounting
Interpretations) and the Corporations Regulations 2001;
b. the financial report also complies with International Financial Reporting Standards as disclosed in Note 24(b); and
c. there are reasonable grounds to believe that the Company will be able to pay its debts as and when they become due and payable.
This declaration has been made after receiving the declarations required to be made to the directors in accordance with sections 295A of the Corporations Act 2001 for the financial year ended 30 June 2016.
On behalf of the Board
John Thame Frank Wolf Chairman Managing Director Sydney, 19 August 2016


Abacus Property Group Corporate Governance Report
1
This report sets out the Group’s position relating to each of the ASX Corporate Governance Council Principles of Good Corporate Governance during the year. Additional information, including charters and policies, is available through a dedicated corporate governance information section on the About Abacus tab on the Abacus website at www.abacusproperty.com.au. This report is current as at 19 August 2016 and has been approved by the boards of AGHL, AFML (the Responsible Entity of AT and AIT), AGPL, ASFML (the Responsible Entity of ASPT) and ASOL (the Board). Principle 1: Lay solid foundations for management and oversight Recommendation 1.1 The Board has adopted a charter that sets out the functions and responsibilities reserved by the Board, those delegated to the Managing Director and those specific to the Chairman. The conduct of the Board is also governed by the Constitution. The primary responsibilities of the Board and the Managing Director are set out in the Board Charter. Senior executives reporting to the Managing Director have their roles and responsibilities defined in position descriptions and are given a letter of appointment on commencement. The Board Charter and Constitution are available on the Abacus website. Recommendation 1.2 The Selection and Appointment of Non-Executive Directors Policy sets out the procedures followed when considering the appointment of a new director and the disclosures made to securityholders. The Selection and Appointment of Non-Executive Directors Policy is available on the Abacus website. Recommendation 1.3 The Board Charter sets out the roles and responsibilities of the Board. Individual committee charters set out the roles and responsibilities for committee members. The Board Charter and the Constitutions (which are available on the Abacus website) set out:
• the term of appointment of directors; • remuneration; • Abacus’ policy on when directors may seek independent professional advice at Abacus’
expense; • circumstances in which a director’s office becomes vacant; • indemnity and insurance arrangements; and • rights of access to corporate information.
Prior to commencing employment, senior executives employment receive a letter of offer setting out their employment terms that they are required to accept prior to commencing employment with Abacus which covers these things (to the extent applicable) as well as a position description, whom they report to and circumstances in which they may be terminated. Directors and all staff (including senior executives) sign an annual Code of Conduct Declaration which includes (among other things) confirmation of any conflicts of interest, compliance obligations with the Abacus Trading Policy and ongoing confidentiality obligations.

Abacus Property Group Corporate Governance Report
2
Recommendation 1.4 The Board Charter and the Constitutions (which are available on the Abacus website) set out the role and responsibilities of the company secretary. Recommendation 1.5 The Board is committed to workplace diversity, with a particular focus on supporting the representation of women at a senior level of the Group and on the Board. The Diversity Policy is available on the Abacus website and the Sustainability Report included in the Annual Report provides workplace metrics including gender composition and female salaries as a percentage of male salaries. The Board set as a target in 2011 having at least one female representative at Board level. In the current period, Abacus has recruited from a diverse pool of candidates for all positions filled during the year and has a number of employees with flexible employment arrangements to take account of domestic responsibilities. In 2015 Abacus became a ‘relevant employer’ under the Workplace Gender Equality Act. Abacus continues to meet the reporting obligations under that legislation. Recommendation 1.6 The Board has a documented Performance Evaluation Policy which outlines the process for evaluating the performance of the Board, its committees and individual directors. An annual review has taken place in the reporting period in accordance with that policy. Recommendation 1.7 The Remuneration and Nomination Committee is responsible for making recommendations to the Board on the remuneration arrangements for non-executive directors and executives. The Remuneration Report at page 17 sets out the structure of the remuneration arrangements. In summary, executive total remuneration comprises fixed and variable components (with both current and deferred elements to the variable component). Fixed remuneration reflects market rates and variable pay reflects a combination of individual and Abacus performance. The Board has the discretion to consider each executive’s total contribution to the group in addition to specific key performance indicators which are established for each executive for the relevant year. An annual review has taken place in the reporting period in accordance with the Remuneration Report structure. Principle 2: Structure the board to add value Recommendation 2.1 The Board has established a Nomination and Remuneration Committee. The Committee’s charter sets its role, responsibilities and membership requirements. The members of the committee and their attendance at meetings are provided on page 15. The Chairman of the committee is independent. The Nomination and Remuneration Committee Charter is available on the Abacus website. Recommendation 2.2

Abacus Property Group Corporate Governance Report
3
Abacus has a board skills matrix which is reviewed and updated as part of the annual review process set out in response to Recommendation 1.6 above. The current skills matrix shows the current Board have skills in the following relevant areas:
• Financial reporting; • Technological innovation; • Storage markets; • Property markets; • Listed markets; • International markets; • Foreign investment; • Joint ventures; • Information security; • Financial markets; • Hospitality markets; • Governance; • Regulatory compliance; and • Capital investment.
The Board considers that the current mix of skills is appropriate for the Group. Given the nature of the Group’s business and current stage of development, the Board considers its current composition provides the necessary skills and experience to ensure a proper understanding of, and competence to deal with, the current and emerging issues of the business to optimise the financial performance of the Group and returns to securityholders. Details of the skills, experience and expertise of each director are set out on page 14. Recommendation 2.3 The Board comprises one executive director and five non-executive directors. The majority of the Board (Messrs Thame, Bartlett, Irving and Spira) are independent members. The Board has determined that an independent director is one who:
• is not a substantial security holder or an officer of, or is not otherwise associated directly with, a substantial security holder of the Group;
• has not within the previous three years been employed in any executive capacity;
• has not within the last three years been a principal of a material professional adviser or a material consultant to the Group; or an employee materially associated with the service provided;
• does not have close family ties with any person who falls within any of the categories described;
• has not been a director of the entity for such a period that their independence may have been compromised;
• is not a material supplier or customer of the Group, or an officer of or otherwise associated directly or indirectly with a material supplier or customer; or
• does not have a material contractual relationship with the Group other than as a director.
No independent non-executive director has a relationship significant enough to compromise their independence on the Board. Non-executive directors confer regularly without management present. Any change in the independence of a non-executive director would be disclosed and explained to the market in a timely manner.

Abacus Property Group Corporate Governance Report
4
The independence of each non-executive director is assessed at least annually and in any case, as soon as practicable after any change in the non-executive director’s interests, positions, associations or relationships. Detail of the length of service of each director is set out on page 14. Recommendation 2.4 The majority of the Board (Messrs Thame, Bartlett, Irving and Spira) are independent members. Recommendation 2.5 The Chairman of the Board (Mr John Thame) is an independent non-executive director. The roles of Chairman and Managing Director are not exercised by the same individual. The division of responsibility between the Chairman and Managing Director has been agreed by the Board and is set out in the Board Charter. Recommendation 2.6 The Selection and Appointment of Non-Executive Directors Policy provides for induction training for new directors. Abacus has a board skills matrix which is reviewed and updated as part of the annual review process set out in response to Recommendation 1.6 above including a training needs analysis of individual directors. Given the nature of the Group’s business and current stage of development, the Board considers its current composition provides the necessary skills and experience to ensure a proper understanding of, and competence to deal with, the current and emerging issues of the business to optimise the financial performance of the Group and returns to securityholders. Details of the skills, experience and expertise of each director are set out on page 14. Principle 3: Act ethically and responsibly Recommendation 3.1 The Group’s Code of Conduct promotes ethical practices and responsible decision making by directors and employees. The Code deals with confidentiality of information, protection of company assets, disclosure of potential conflicts of interest and compliance with laws and regulations. The Code of Conduct is available on the Abacus website. Principle 4: Safeguard integrity in corporate reporting Recommendation 4.1 The Board has established an Audit and Risk Committee. The Audit and Risk Committee comprises three independent non-executive directors and the Chairman of the Committee is not the Chairman of the Board. The members of the committee and their attendance at meetings are provided on page 15. Details of the skills, experience and expertise of each member of the committee are set out on page 14. Other directors who are not members of the committee, the external auditor and other senior executives attend meetings by invitation.

Abacus Property Group Corporate Governance Report
5
The Audit and Risk Committee has a formal charter that sets out its specific roles and responsibilities, and composition requirements. The procedures for the selection and appointment of the external auditor are set out in the Audit and Risk Committee Charter. The Audit and Risk Committee Charter is available on the Abacus website. Recommendation 4.2 Before approving the financial statements for a financial period, the Board receives from the Managing Director and Chief Financial Officer a declaration that, in their opinion, the financial records of the entity have been properly maintained and that the financial statements comply with the appropriate accounting standards and give a true and fair view of the financial position and performance of the entity and that the opinion has been formed on the basis of a sound system of risk management and internal control that is operating effectively Recommendation 4.3 The external auditor attends the Abacus annual general meeting and is available at the meeting to answer questions from securityholders relevant to the audit. Principle 5: Make timely and balanced disclosure Recommendation 5.1 The Group has a policy and procedures designed to ensure compliance with ASX Listing Rule disclosure requirements. The Managing Director is responsible for ensuring that the Group complies with its disclosure obligations. The Continuous Disclosure and Securityholder Communications Policy is available on the Abacus website. Principle 6: Respect the rights of securityholders Recommendation 6.1 The Group aims to keep securityholders informed of significant developments and activities of the Group. The Group’s website is updated regularly and includes annual and half-yearly reports, distribution history and all other announcements lodged with the ASX, as well as a corporate governance landing page from which all relevant corporate governance information can be accessed. The Abacus website also includes webcasts of the results briefings. The Group keeps a summary record for internal use of the issues discussed at group and one-on-one briefings with investors and analysts, including a record of those present where appropriate. The Continuous Disclosure and Securityholder Communications Policy is available on the Abacus website. Recommendation 6.2 The Continuous Disclosure and Securityholder Communications Policy, which is available on the Abacus website, sets out Abacus’ communication strategy with securityholders. Routine queries received by the Group’s registry are responded to by the registry. Non-routine queries are directed to the Group’s Head of Investor Relations for response. Securityholders, other financial market participants and the financial media also communicate directly with the Head of Investor Relations to seek information and provide feedback. Relevant feedback is

Abacus Property Group Corporate Governance Report
6
communicated by the Head of Investor Relations to the Managing Director and the Board as required. Recommendation 6.3 Abacus’ annual general meeting is webcast to allow securityholders to hear proceedings online. There is also the functionality for investors to participate. Securityholders may vote online, by proxy or by attending meetings. The Continuous Disclosure and Securityholder Communications Policy is available on the Abacus website. Recommendation 6.4 Securityholders may elect to receive and send communications to Abacus and to the Group’s registry electronically. Email contact details for the registry are provided on the Abacus website. Principle 7: Recognise and manage risk Recommendation 7.1 and 7.2 The Audit and Risk Committee has responsibility for reviewing the Group’s risk management framework. The members of the committee and their attendance at meetings are provided on page 15. The risk management framework is formally reviewed annually. This review is initially carried out by the Compliance and Risk Manager and then reviewed by the Audit and Risk Committee and the Board to assess any necessary changes. This review has been completed in the reporting period. The Audit and Risk Committee Charter is available on the Abacus website. The Business Risk Management Policy dealing with oversight and management of material business risks is set out in the corporate governance information section on the Abacus website. The Group’s Risk Management Framework was developed in consultation with an external consultant. Under the compliance plan, the responsible managers report regularly on the risks they manage and any emerging risks. An independent consultant has been engaged to review business processes and undertake formal internal audit assessments throughout the year. These assessments are provided to the Audit and Risk Committee for review. Recommendation 7.3 An independent consultant has been engaged to review business processes and undertake formal internal audit assessments throughout the year. These assessments are provided to the Audit and Risk Committee for review. Recommendation 7.4 The Sustainability Report outlines the impact that Abacus’ business activities have on environmental, social and governance risks. Abacus’s Sustainability Protocol and Sustainability Reports, which are available on the Abacus website and in the annual report, include a commitment to implementing sustainability practices in Abacus’ investments, property management, development activities and workplaces. Abacus uses these practices to manage risks, create opportunities and strengthen operations.

Abacus Property Group Corporate Governance Report
7
Principle 8: Remunerate fairly and responsibly Recommendation 8.1 and 8.2 The Board has established a Nomination and Remuneration Committee. The Nomination and Remuneration Committee is responsible for assessing the processes for evaluating the performance of the Board and key executives. A copy of the committee charter is available on the Abacus website. The Chairman of the Nomination and Remuneration Committee is independent and the Committee has a majority of independent members. The Group’s remuneration policies including security-based payment plans and the remuneration of key management personnel are discussed in the Remuneration Report. The Nomination and Remuneration Committee may seek input from individuals on remuneration policies but no individual employee is directly involved in deciding their own remuneration. The members of the committee and their attendance at meetings are provided on page 15. Non-executive directors are paid fees for their service and do not participate in other benefits (with the exception of Group travel insurance cover) which may be offered other than those which are statutory requirements. Recommendation 8.3 Abacus’s Trading Policy is on the Abacus website. The Trading Policy sets out restrictions on trading by all directors, officers, and other staff, including restrictions on the use of derivatives and hedging transactions in relation to Abacus securities.

ASX Additional Information
Abacus Property Group is made up of the Abacus Trust, Abacus Income Trust, Abacus Storage Property Trust, Abacus Group Holdings Limited, Abacus Group Projects Limited and Abacus Storage Operations Limited. The responsible entity of the Abacus Trust and Abacus Income Trust is Abacus Funds Management Limited. The responsible entity of the Abacus Storage Property Trust is Abacus Storage Funds Management Limited. Unless specified otherwise, the following information is current as at 5 August 2016. Number of holders of ordinary fully paid stapled securities 6,839 Voting rights attached to ordinary fully paid stapled securities one vote per stapled security Number of holders holding less than a marketable parcel of ordinary fully paid stapled securities
421
Secretary, Abacus Funds Management Limited Secretary, Abacus Storage Funds Management Limited Secretary, Abacus Group Holdings Limited Secretary, Abacus Group Projects Limited Secretary, Abacus Storage Operations Limited
Ellis Varejes
Registered office Abacus Funds Management Limited Abacus Storage Funds Management Limited Abacus Group Holdings Limited Abacus Group Projects Limited Abacus Storage Operations Limited
Level 34, Australia Square 264-278 George Street
Sydney NSW 2000 612 9253 8600
Registry Boardroom Pty Limited
Level 12, 225 George Street Sydney NSW 2000
(02) 9290 9600 Other stock exchanges on which Abacus Property Group securities are quoted none Number and class of restricted securities or securities subject to voluntary escrow that are on issue
none
There is no current on-market buy-back SUBSTANTIAL SECURITYHOLDER NOTIFICATIONS
Securityholders Number of Securities Calculator Australia Pty Limited 252,981,605

SECURITIES REGISTER
Number of Securities Number of Securityholders Total Securities 1-1,000 1,221 438,519
1,001-5,000 2,364 6,805,678 5,001-10,000 1,496 10,943,053
10,001-100,000 1,686 37,355,369 100,001-over 72 506,675,848
Totals 6,839 562,218,467
TOP 20 LARGEST SECURITYHOLDINGS
Holder Name Number of Securities
% Issued Securities
CITICORP NOMINEES PTY LIMITED 186,208,743 33.120% J P MORGAN NOMINEES AUSTRALIA LIMITED 71,063,411 12.640% HSBC CUSTODY NOMINEES (AUSTRALIA) LIMITED 55,264,908 9.830% CALCULATOR AUSTRALIA PTY LIMITED <CALCULATOR AUSTRALIA A/C> 47,978,692 8.534% CALCULATOR AUSTRALIA PTY LIMITED <CALCULATOR AUSTRALIA A/C> 44,322,630 7.884% NATIONAL NOMINEES LIMITED 29,422,551 5.233% RBC INVESTOR SERVICES AUSTRALIA NOMINEES PTY LIMITED <BKCUST A/C> 16,142,679 2.871% CALCULATOR AUSTRALIA PTY LIMITED 14,200,000 2.526% BNP PARIBAS NOMS PTY LTD <DRP> 9,856,044 1.753% CITICORP NOMINEES PTY LIMITED <COLONIAL FIRST STATE INV A/C> 4,556,206 0.810% BNP PARIBAS NOMINEES PTY LTD <AGENCY LENDING COLLATERAL > 4,420,000 0.786% BNP PARIBAS NOMINEES PTY LTD <AGENCY LENDING DRP A/C> 2,007,285 0.357% RBC INVESTOR SERVICES AUSTRALIA NOMINEES PTY LIMITED <MBA A/C> 1,713,696 0.305% QUOTIDIAN NO 2 PTY LIMITED 1,690,715 0.301% F M WOLF PTY LIMITED 1,279,360 0.228% AMP LIFE LIMITED 1,156,533 0.206% NULIS NOMINEES (AUSTRALIA) LIMITED <NAVIGATOR MAST PLAN SETT A/C> 1,114,178 0.198% POWERWRAP LIMITED <SCHEME - IML TRADES A/C> 978,898 0.174% AUSTRALIAN EXECUTOR TRUSTEES LIMITED <NO 1 ACCOUNT> 944,267 0.168% NATIONAL NOMINEES LIMITED <DB A/C> 796,994 0.142%

Abacus Property GroupLevel 34 Australia Square264-278 George StreetSydney NSW 2000T +61 2 9253 8600F +61 2 9253 8616E [email protected]
www.abacusproperty.com.au
![Exposure Draft Accounting Standard (AS) 40 Investment Property€¦ · Classification of property as investment property or owner-occupied property 6 [Refer Appendix 1] 7 Investment](https://img.dokumen.tips/doc/110x75/5fbcf600809f143a58735fcf/exposure-draft-accounting-standard-as-40-investment-property-classification-of.jpg)