Embed Size (px)
Citation preview

Capital Structure
The assets of a company can be financed either by increasing the owners’ claims or the creditors’ claims. The owners claim increase when the firm raises funds by issuing ordinary shares or by retaining earnings; the creditors’ claims increase by borrowing. The various means of financing represent the financial structure of an enterprise.
The term capital structure is used to represent the proportionate relationship between debt and equity. Equity includes paid-up share capital, share premium and reserve and surplus (retained earnings). The company will have to plan its capital structure initially at the time of its promotion. Subsequently, whenever funds have to be raised finance investment, a capital structure decision is involved. Capital structure refers to the mix of sources from where the long-term funds required in the business may be raised. A demand for raising funds generates a new capital structure a decision has to be made to the quantity and forms of financing. This decision will involve an analysis of the existing capital structure and the factors, which will govern the decision at present. The company’s policies to retain or distribute earnings affect the owner’s claim. Shareholder’s equity position is strengthened by retention of earning. The debt equity mix has implications for the shareholder’s earnings and risk, which in turn will affect the cost of capital and the market value of the firm.

Patterns of the Capital Structure
In case of new company, the capital structure may be of any the following patterns:
Capital Structure with equity shares only. Capital Structure with equity and preference. Capital Structure with equity and debentures. Capital Structure with equity, preference shares and
debentures. Debt is the liability on which interest has to be paid irrespective of the company profits. While equity consists of shareholder or owner’s funds on which payment of dividend depends upon the company’s profit. A high proportion of the debt content in the capital structure increases the risk and may lead to financial insolvency in adverse time. However, raising fund through debt is cheaper as compared to financing through shares. This because figure-3 interest on debt is allowed as an expense for taxes purpose. Dividend is considered to be an appropriation of profits; hence payment on dividend does not result in any tax benefit to the company. This means if company, is in 50% tax bracket, pays interest at 12% on its debentures, the effective cost to it comes only 6% while if the amount is raised by 12% Preference Shares, the cost of raising the amount would be 12%. Thus raising the funds by borrowing is cheaper resulting in higher availability of profit for shareholders. This increases the earning per share of the company, which is the basic objective of the finance manager.
Optimum Capital Structure

A firm should try to maintain an optimum capital structure with a view of to maintain financial stability. The optimum capital structure is obtained when the market value per equity share is the maximum. It may be defined as that relationship of debt and equity securities which maximizes the value of a company’s share in the stock exchange. In case a company borrows and this borrowing helps in increasing the value of company’s share in the stock exchange, it can be said that the borrowing has helped the company in moving towards its optimum capital structure. In case, the borrowing results in fall in market value of the company’s equity shares, it can be said that the borrowing has moved the company from its optimum capital structure.
The objective of the firm should therefore be to select the financing or debt equity mix, which will lead to maximum value of the firm.
Consideration
The following consideration will greatly help a finance manager in achieving his goal of optimum capital structure:
We should take advantage of favourable financial leverage. We should take advantage of the leverage offered by the
corporate taxes. We should avoid a perceived high risk capital structure.
Sources of Funds

Security Financing- This includes financing through shares including both equity and preference shares and debentures.
Internal Financing- This includes financing through depreciation funds and retained earnings.
Loan Financing- This includes both short term and long-term loans.
Equity Shares versus Debentures
A company may prefer financing through debenture as compared to equity shares on account of following reasons:
Interest on debenture is allowed as an expense for tax purpose. Debenture holders have generally no say in the management of
the company. Underwriters may have little hesitation in accepting the
company’s proposal since debentures are adequately backed by the company’s assets.
Moreover, the company may find it beneficial to pay short-term loan by raising funds through debentures at a time when interest rates on such loans are higher as compared to the interest rate payable on the debentures. However, the company cannot go on unlimited extent of financing through financing through debentures. It has to strike a balance between risk and saving effected by raising funds through debentures. The ultimate objective is to maintain unlimited Capital Structure.
Major Consideration in Capital Structure Planning

There are three major considerations, i.e. risk, cost of capital and control, which help the finance manager in determining the proportion in which he can raise funds from various sources.
Although, three factors, i.e. risk, cost and control determines the capital structure of a particular business undertaking at a given point of time. The finance manager attempts to design the Capital Structure in such a manner that his risk and costs are the least and the control of the existing management is diluted to the least extent.
Risk
Risk is of two kinds, i.e. financial risk and business risk. Here we are concerned primarily with the financial risk. Financial risk is also of two types:
Risk of Cash Insolvency: As a firm raises more debt, its risk of cash insolvency increases. This is due to two reasons. Firstly, higher proportion of debt in the Capital Structure increases the commitments of the company with regard to fixed charges. This means that a company stands committed to pay a higher amount of interest irrespective of the fact whether it has cash or not. Secondly, the possibility that the supplier of funds may withdraw the funds at any given point of time. Thus the long- term creditors may have to be paid back in instalments even if sufficient cash to do so does not exist. This risk is not there in the case of equity share.
Risk of Bariation in the the Expected Earning to Equity Share-holders: In case a firm has higher debt contenting Capital Structure, the risk of variation in expected earnings available to equity shareholder will be higher. This is because of trading of equity. It is seen that financial leverage works both ways, i.e. it enhances the shareholders returns by a higher or

lower than rate of interest. Thus, there will be lower probability that equity shareholder will enjoy a stable dividend if the debt content is higher in the Capital Structure. In other words, the relative dispersion of expected earning available to equity shareholder will be greater of the Capital Structure of a firm higher debt content.
Cost of Capital- Cost is an important consideration in capital structure decision. It is obvious that a business should be at least capable of earning enough revenue to meet its cost of capital and finance its growth. Hence, along with a risk as a factor; the finance manager has to consider the cost aspect carefully while determining the Capital Structure.
Control- Along with cost and risk factor, the control aspect is also an important consideration in planning the Capital Structure. When a company issues further equity share it automatically dilutes the controlling interest of the present owners. Similarly, preference shareholders can have voting rights and thereby affect the composition of the Board of Directors in case dividend on such share is not paid for two consecutive years.
Trading on Equity- A company may raise funds either by the issue of shares or by borrowings. Borrowings carry a fixed rate of interest and this interest is payable irrespective of fact where there is profit or not. Preference shareholders are also entitled to a fixed rate of dividends but payment of dividends is subject to the profitability of the company. In case of return on the total capital employed i.e. shareholder’s funds plus long term borrowings, is more than the rate of interest on borrowed funds or the rate of dividends on preference shares, it is said that company is trading on equity.

Important Considerations in Determining Capital Structure
The determination of capital structure involves additional considerations in addition to the concerns about EPS, value and cash flow. A firm may have enough debt servicing ability but it may not have assets to offer as collateral. Some of the most important considerations are discussed below:
1. Assets- The form of assets held by a company are important determinants of its capital structure. Tangible fixed assets serve as collateral to debt. In the event of financial distress, the lenders can access these assets and liquidate them to realize funds lent by them. Companies with higher tangible fixed assets will have less expected costs of financial distress and hence, higher debt ratios. Companies have intangible assets in the form of human capital, relations with stakeholders, brands, reputation etc., and their values start eroding as the firm faces financial difficulties and its financial risk increases.
2. Growth Opportunities- The nature of growth opportunities has an important influence on a firm’s financial leverage. Firm’s with high market-to-book value ratios have high growth opportunities. A substantial part of the value for these companies comes from organizational or intangible assets. These firms have a lot of investment opportunities. High growth firms would prefer to take debts with lower maturities to keep interest rates down and to retain the financial flexibility since their performance can change unexpectedly any time. Mature firms have tangible assets and stable profits. They have low costs of financial distress. Hence, these firms would raise debt with longer maturities as the interest rates will not be high for them and they have a lesser need of financial flexibility since their fortunes are not expected to shift suddenly.

3. Debt and Non-Debt Tax Shields- Debt, due to interest deductibility, reduces the tax liability and increases the firm’s after-tax free cash flows. In the absence of personal taxes, the interest tax shields increase the value of the firm. Generally, investors pay taxes on interest income but not on equity income. Hence, personal taxes reduce the tax advantage of debt over equity. The tax advantage of debt implies that firms will employ more debt to reduce tax liabilities and increase value. Firms also have non-debt tax shields available to them. For example, firms can use depreciation; carry forward losses etc. to shield taxes. This implies that those firms that have larger non-debt tax shields would employ low debt, as they may not have sufficient taxable profit available to have the benefit of interest deductibility.
4. Financial Flexibility and Operating Strategy- A cash flow analysis might indicate that a firm could carry high level of debt without much threat of insolvency. But in practice, the firm may still make conservative use of debt since the future is uncertain and it is difficult to be able to consider all possible scenarios of adversity. It is, therefore, prudent to maintain financial flexibility that enables the firm to adjust to any change in the future events or forecasting error.
Financial flexibility is a serious consideration in setting up the capital structure policy. Financial flexibility means a company’s ability to adapt its capital structure to the needs of the changing conditions. The financial plan of the company should be flexible enough to change the composition of the capital structure as warranted by the company’s operating strategy and needs.
5. Loan Covenants- Restrictive covenants are commonly included in the long-term loan agreements and debentures. Covenants in loan agreements may include restrictions to

distribute cash dividends, to incur capital expenditure, to raise additional external finances or to maintain working capital at a particular level. Loan covenants may look quite reasonable from the lender’s point of view as they are meant to protect their interests, but they reduce the flexibility of the borrowing company to operate freely and it may become burdensome if conditions change. Violation of covenants can have serious adverse consequences.
6. Financial Slack- The financial flexibility of a firm depends on the financial slack it maintains. The financial slack includes unused debt capacity, excess liquid assets, unutilised lines of credit and access to various untapped sources of funds. The financial flexibility depends a lot on the company’s debt capacity and unused debt capacity. The higher is the debt capacity of a firm and the higher is the unused debt capacity, the higher will the degree of flexibility enjoyed by the firm. A company should not borrow to the limit of its capacity, but keep available some unused capacity to raise funds in the future to meet some sudden demand for finances.
7. Sustainability and Feasibility- The financing policy of a firm should be sustainable and feasible in the long run. The sustainability model growth helps to analyse the sustainability and the feasibility of the long-term financial plans in achieving growth. Given the firm’s financing and payout policies and operating efficiency, this model implies that its assets and sales will grow in tandem with growth equity (internal). Thus, the sustainable growth depends on return on equity (ROE) and retention ratio: Sustainable growth = ROE * (1-payout) The sustainable growth model indicates the growth rate that the firm should target. In fact, the model also indicates the trade-offs between the financing and operating policies. The firm
must realise that growth does not ensure value creation. The

firm should also examine the impact of alternative financial policy on the value of the firm.
8. Control- In designing the capital structure, sometimes the existing management is governed by its desire to continue control over the company. This is particularly so in the case of the firms promoted by entrepreneurs. The existing management team not only wants control and ownership but also to manage the company, without any outside interference.
9. Capacity of Raising Funds- The size of a company may influence its capital structure and availability of funds from different sources. A small company finds great difficulties in raising long-term loans. A large company has relative flexibility in designing its capital structure. It can obtain loans on easy terms and sell ordinary shares, preference shares and debentures to the public. The size of the firm has an influence on the amount and the cost of funds, but it does not determine the pattern of financing.
10. Issue Costs- Issue or floatation costs are incurred when the funds are externally raised. Generally, the cost of floating a debt is less than the cost of floating an equity issue. This may encourage company’s to use debt than issue equity shares. Large firms require large amounts of funds, and they may plan large issues of securities to economise on the issue costs. The company should raise only that much of funds, which it can employ profitably.

CURRENT YEAR (2007-2008)
INTERPRETATION:
COMPOSITION OF CAPITAL STR UCTURE
Loan Fund = 48%
Reserves = 51%
Share Capital = 1%
The above graph clearly depicts that the proportion of debt in the financing mix of Hindalco is much more as compared to share capital. The debt content is 48% whereas the proportion of share capital and reserves and surplus is 1% and 51% respectively.
1 20
0.2
0.4
0.6
0.8
1
1.2
0
0.51
0
0.48
0
0.0100000000000001

Capital Structure of Hindalco for Four Years (2004-05 to 2007-08)
Particulars 2007-08 2006-07 2005-06 2004-05Share Capital
1226 1043 986 928
Reserves 171737 123105 95017 75644Loan Funds
83286 73592 49034 38000
Years 2007-08 2006-07 2005-06 2004-05
0
20000
40000
60000
80000
100000
120000
140000
160000
180000
Share Capital
Reserves
Loan Fund

Framework of Capital Structure
The FRICT Analysis
A financial structure may be evaluated from various perspective from owner’s point of view, return; risk and value are important consideration. From the strategic point of view, flexibility is an important concern and flexibility assumes great significance. A sound capital structure will be achieved by balancing all these consideration.
Flexibility: The capital structure should be determined within the debt capacity of the company and this capacity should be flexible. It should be possible for a company to adapt its Capital Structure within a minimum cost and delay if warranted by a changed situation.
Risk: Risk depends on the variability in the firm’s operation. It may be caused by macroeconomic factor and industry and firm’s specific factor. The excessive use of debt magnifies the variability of shareholder’s earning’s and threatens the solvency of the company.
Income- The Capital Structure of the company should be most advantageous to the owner’s of the firm. It should create value; subject to other consideration. It should generate maximum return to the shareholder’s with minimum additional cost.
Control- The capital structure should involve the minimum risk of loss of control of the company. The owner of closely held companies is particularly concerned about dilution of control.
Timing- The capital structure should be feasible to implement given the current and future condition of the capital market. The sequencing of source of financing is important. The current decision influences the future option of raising capital. The FRICT Analysis provides the general framework for evaluating firm’s Capital Structure.

Capital Structure Decision Process
Value of the Firm
Optimum Capital Structure
Effects on Cost of Capital
Effects on Risk Effects on Return
Desired Debt- Equity Mix
Pay out Policy Existing Capital Structure
Capital Structure Decision
Need to Raise Funds
Capital Budgeting Decision

Theories of Capital Structure
The objective of a firm should be directed towards the maximisation of the value of the firm, the Capital Structure, or leverage decision should be examined from the point of view of its impact on the value of the firm. If the values of the firm can be affected by Capital Structure or financing decision, a firm would like to have a Capital Structure, which maximize the market value of the firm.
There are broadly four approaches in this regard. These are:
Net Income Approach. Net Operating Income Approach. Traditional Theory. Modigliani- Miller Approach.
These approaches analysis relationship between the leverage, cost of capital and the values of the firm in different way. However, the following assumptions are made to understand these relationships.
1. There are only two source of funds i.e. debt and equity.2. The total assets of firm are given. The degree of leverage
can be changed by selling debt to repurchase shares or selling shares to retire debt.
3. There are no retained earnings.4. The operating profit of firm is given and expected to
grow.5. The business risk is assumed to be constant and is not
affected by the financing mix decision.6. There are no corporate taxes.7. The investors have the same probability distribution of
expected earnings.

Features of an Appropriate Capital Structure
1. Return- The capital structure of the company should be most advantageous subject to other considerations it should generate maximum returns to the shareholders without adding cost to them.
2. Risk- The use of excessive debt threatens the solvency of the company. To the point debt does not add significant risk it should be used otherwise its use should be avoided.
3. Flexibility- The capital structure should be possible for a company to adapt its capital structure with a minimum cost and delay if warranted by a changed situation. It should also be possible for the company to provide funds whenever needed to finance its profitable activities.
4. Capacity- The capital structure should be determined within the debt capacity of the company, and this capacity should not be exceeded. The debt capacity of a company depends on its ability to generate future cash flows. It should have enough cash to pay creditor’s fixed charges and principle sum.
5. Control- The capital structure should involve minimum risk of loss of control of the company. The owner’s of closely-held companies are particularly concerned about dilution of control.

Approaches to establish appropriate Capital Structure
The following are the 3 most common approaches to decide about ea firm’s capital structure:
1. EBIT-EPS approaches- The EBIT-EPS analysis is an important tool in the hands of the financial manager to get an insight into the firm’s capital structure management. He can consider the possible fluctuations in the EBIT and examine their impact on EPS under different financial plans. If the probability of earning a rate of return on the firm’s assets less than the cost of debt is insignificant, a large amount of debt can be used by the firm to increase the earnings per share. This may have a favourable effect on the market value per share. On the other hand, if the probability of earning a rate of return on the firm’s less than the cost of debt is very high, the firm should refrain from employing debt capital. It may, thus, be concluded that the greater level of EBIT & lower the probability of downward fluctuation, the more beneficial is to employ debt in the capital structure. However, it should be realised that the EBIT-EPS is a first step in deciding about a firm’s capital structure.
2. Cost of Capital and Valuation Approach- The cost of a source of finance is the minimum return expected by its suppliers. The expected return depends on the degree of risk assumed by investors. A high degree of risk is assumed by the shareholders than the debt-holders. In case of debt-holders, the rate of interest is fixed and the company is legally bound to pay interest whether it makes profits or not. The loan of debt-holders is returned within a prescribed period, while shareholders will have to share the residue only when the company is wound up. This leads one to conclude that debt is a cheaper source of funds

than equity. The preference share capital is also cheaper than equity capital, but not as cheap as debt.
3. Cash Flow Approach- One of a feature of a sound capital structure is conservatism. Conservatism does not mean employing no debt or small amount of debt. Conservatism is created by the use of debt or preference capital in the capital structure and the firm’s ability to generate cash to meet these fixed charges. The fixed charges of a company include payment of interest, preference dividends, and the principal, and they depend on both the amount of loan securities and the terms of payment. The amount of fixed charges will be high if employs a large amount of debt or preference capital with short-term maturity. The company expecting larger & stable cash inflows in the future can employ a large amount of debt in their capital structure.
One important ratio which should be examined at the time of planning the capital structure is the ratio of net cash inflows to fixed charges (debt- servicing ratio). It indicates the number of times the fixed financial obligations are covered by the net cash inflows generated by the company. The greater the coverage, the greater is the amount of debt a company can use.
Elements of Capital Structure

Following are the important elements of the company’s capital structure that need proper securities and analysis:
1. Capital Mix: Firms have to decide about the debt and equity capital. Debt capital can be mobilized from a variety of sources. How heavily does the company depend on debt? What is the mix of debt instrument? Given the company’s risk, is the reliance on the level and instrument of debt reasonable? Does the firm’s debt policy allow its flexibility to undertake strategic instruments in adverse financial condition? The firms and analyst use debt-equity ratios, debt service coverage ratio and the fund flow statement to analyses the capital mix.
2. Maturity and Priority: The maturity of securities used in the capital mix may differ. Equity is the most permanent capital. Within debt, commercial paper has the shortest maturity and public debt longest. Similarly, the priorities of securities also differ. Capitalised debt like lease or hire purchase finance is quite safe from the lender’s point of view and the value of assets backing the debt provides the protection to the lender collateralized or secured debts are relatively safe and have priority over unsecured debt in the event of solvency.
3. Terms and conditions: Firms have choices with regard to the basis of interest’s payments. They may obtain loans either at fixed or floating rates of interest. In case of equity the firm may like to return income either in the form of large dividend of large capital gain. What is the firm’s preference with regard to

the basis of payment of interest and dividend? How do the firm’s interest and dividend payment match with its earnings and operating cash flows? The firm’s choice of the basis of payments indicates the management’s assessment about the future interest rates and the firm’s earnings. Does the firm have protection against interest rates fluctuations? The financial manager can protect the firm against interest rates fluctuations through the interest rates derivatives. There are some other important terms and conditions that the firm should consider. Most loan agreements include what the firm can do and what it cannot do. They may also state the scheme of payments, pre-payments, renegotiations etc.
4. Currency: Accessing capital internationally helps company to raise large amount of funds and globalize its operation fast. The exchange rates fluctuations can create risk for the firm in servicing it foreign debt and equity. The financial manager will have to ensure a system of risk hedging. Does the firm borrow from the overseas markets? At what terms and condition?
5. Financial Innovation: Firms may raise capital either through the issue of simple securities or through the issue of innovative securities. Financial innovations are intended to make the security issue attractive to investors and reduce cost of capital.
6. Financial Market Segment: There are several segments of financial markets from where the firm can tap capital. For example, a firm can tap the private or the public debt market for raising long-term debt. The firm can raise short-term debt either

from banks or by issuing commercial papers or certificate deposits in the money market and by public deposits in the money market and by public deposits also.
Capital Structure Planning and Policy

For the real growth of the company the financial manager of the company should plan an optimum capital for the company. The optimum capital structure is one that maximize the market value of the firm. In practice the determination of the optimum capital structure is a formidable task and the manager has to perform this task properly, so that the ultimate objective of the firm can be achieved.
There are significant variations among industries and companies within an industry in terms of capital structure. Since a number of factors influence the capital structure decision of a company, the judgment of the person making the capital structure decisions play a crucial part. A totally theoretical model can’t adequately handle all those factors, which affects the capital structure decision in practice. These factors are highly psychological, complex and qualitative and do not always follow accepted theory, since capital markets are not perfect and decision has to be taken under imperfect knowledge and risk.
An appropriate capital structure or target capital structure can be developed only when all those factors, which are relevant to the company’s capital structure decision, are properly analyzed and balanced. The capital structure should be planed generally keeping in view the interest of the equity shareholders and financial requirements of the company. The equity shareholders being the owner of the company and the providers of risk capital (equity), would be concerned about the ways of financing a company’s operations. However, the interest of other groups, such as employee, customers, creditors, society and government, should be given reasonable consideration when the company lays down its objective in terms of the shareholders wealth maximization, it is generally compatible with the interest of other groups. Thus, while developing an appropriate capital structure for a company the finance manager should inter alia aim at maximizing the long-term market price per share. Theoretically, there may be precise point or range within which the

market value per shares is maximum. In practice, for most companies within an industry there may be a range within which there would not be great differences in the market value per share. One way to get an idea of this range is to observe the capital structure patterns of companies vis-a-vis their market prices of share. The management of companies may fix its capital structure near the top of this range in order to make maximum use of favourable leverage, subject to other requirements such as flexibility, solvency, control and norms set by the financial institutions- The Security Exchange Board of India (SEBI) and Stock Exchange.
Guidelines for Capital Structure Planning
The following are the guidelines of capital structure planning:
1) Avail or Tax advantage of Debt- Interest on debt finance is a tax-deductible expense. Hence, finance scholars and practitioners agree that debt financing gives rise to tax shelter which enhances the value of the firm. What is the impact of this tax shelter on the value of the firm? In this 1963 paper Modigilani and Miller argued that the present value of the interest tax shield is- tcD
where, tc = corporate tax rate on a unit of marginal earnings. D = Debt financing.
2) Preserve Flexibility- The tax advantage of debt should not persuade one to believe that a company should exploit its debt capacity fully. By doing so, it loses flexibility. And loss of flexibility can erode shareholder value. Flexibility implies that the firm maintains reserve borrowing power to enable it to raise debt capital to respond to unforeseen changes in government policies, recessionary conditions in the market place, disruption in supplies, decline in production caused by power shortage or labour market, intensification in competition, and, perhaps most importantly, emergence of profitable investment opportunities. Flexibility is a powerful defence against financial distress and its consequences which may include bankruptcy.
3) Ensure that the Total Risk Exposure is Reasonable- While examining risk from the point of view of the investor, a distinction is made between systematic risk (also referred to as

the market risk or non-diversifiable risk) and unsystematic risk (also referred to as the non-market risk or diversifiable risk). Business Risk refers to the variability of earnings before interest and taxes. It is influenced by the following factors:
Demand Variability- Other things being equal, the higher the variability of demand for the products manufactured by the firm, the higher is its business risk.
Price Variability- A firm which is exposed to a higher degree of volatility in the prices of its products is, in general, characterized by a higher degree of business risk in comparison with similar firms which are exposed to a lesser degree of volatility in the prices of their products.
Variability in Input Prices- When input prices are highly variable, business risk tends to be high.
4) Subordinate Financial Policy to Corporate Strategy- Financial Policy and Corporate Strategy are often not integrated well. This may be because financial policy originates in the capital market and corporate strategy in the product market.
5) Mitigate Potential agency Costs-
Due to separation of ownership and control in modern corporations, agency problems arise. Shareholders scattered and dispersed as they are not able to organize themselves effectively. Since agency costs are borne by shareholders and the management, the financial strategy of a firm should seek to minimize these costs. One way to minimize agency costs is to employ an external agent who specializes in low cost

monitoring. Such an agent may be a lending organization like a commercial bank (or a term-lending institution).
Meaning of Financial Leverage

The use of fixed-charges sources of funds, such as debt and preference capital along with owner’s equity in the capital structure described as financial leverage gearing or trading on equity. The use of the term trading on equity is derived from the fact that is the owner’s equity that is used to raise debt; that is, the equity that is traded upon.
Financial leverage is defined as the ability of a firm to use fixed financial charges to magnify the effect of change in E.B.I.T on the firm’s earning per share. The financial leverage occurs when a firm’s Capital Structure contain obligation of fixed financial charges. For instance, interest on debentures, dividend on preference share etc., along with owner’s equity to enhance earning of equity shareholder’s. The fixed financial charges do not vary with the operating profit. They are fixed and are to be paid irrespective of level of operating profit. The ordinary shareholders of firm are entitled to residual income i.e. earning after fixed financial charges.
The financial leverage employed by a company is intended to earn more on the fixed charges funds than their costs. The surplus (or deficit) will increase (or decrease) the return on the owner’s equity. The rate of return on the owner’s equity is levered above or below the rate of return on the owner’s equity.
Favourable and Unfavourable Financial Leverage
Financial leverage may be favourable or unfavourable depending upon whether the earning made by the use of fixed interest or dividend bearing securities exceeds the explicit fixed cost, the firm has to pay for the employment of such funds or not. The leverage will be considered to be favourable so long the firm earns more on

assets purchased with the funds than the fixed cost of their use. Unfavourable leverage occurs when the firm does not earn as the funds cost.
Significance of Financial Leverage
Financial leverage helps in deciding the appropriate Capital Structure. One of the objectives of planning an appropriate Capital Structure is to maximize the return on equity shareholders funds or maximize the earning per share.
Financial leverage is doubt-edged sword. On one hand, it increases the earning per share and on the other hand it increases the financial risks. High financial leverage means high fixed financial cost and high financial risk i.e., as the debt content in Capital Structure increases, the financial leverage increases and at the same time the financial risk also increases i.e., risk of insolvency increases. The finance manager is required to trade-off between risk and return for determining the appropriate amount of debt.
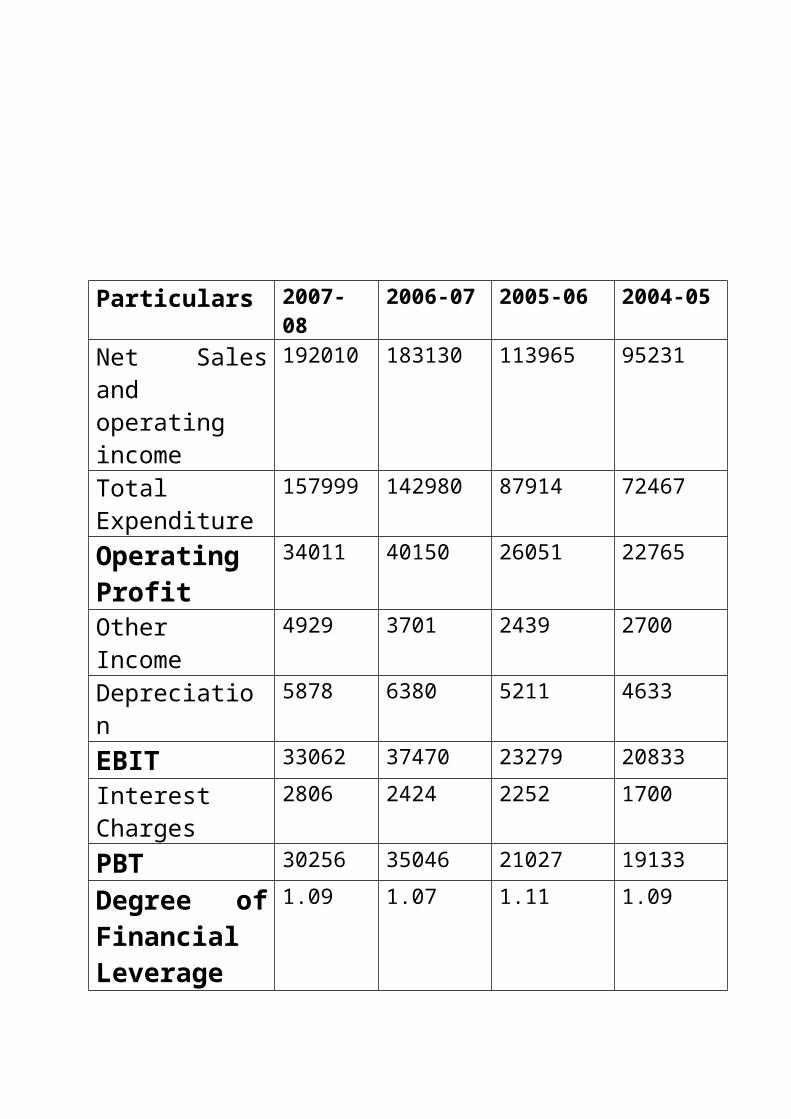
Particulars 2007-08 2006-07 2005-06 2004-05

Net Sales and operating income
192010 183130 113965 95231
Total Expenditure
157999 142980 87914 72467
Operating Profit
34011 40150 26051 22765
Other Income 4929 3701 2439 2700
Depreciation 5878 6380 5211 4633
EBIT 33062 37470 23279 20833
Interest Charges 2806 2424 2252 1700
PBT 30256 35046 21027 19133
Degree of Financial Leverage
1.09 1.07 1.11 1.09
Financial Leverage of Hindalco for the year 2004-05 to 2007-08

Years 2007-08 2006-07 2005-06 2004-051.05
1.06
1.07
1.08
1.09
1.1
1.11
1.12
Degree of Financial leverage
Degree of Financial leverage
Leverage Ratio
S.N. 2007-08 2006-07 2005-06 2004-05

1 Debt equity ratio 0.36 Times
0.52Times
0.30Times 0.39Times
2 Total asset to debt ratio
2.70 Times
2.54Times
5.24Times 3.86Times
3 Propriety ratio 1.03 Times
0.76Times
0.64Times 0.67Times
4 Equity ratio 13.88 Times
1.68Times
1.64Times 1.64Times
5 Interest coverage ratio
1.55 Times
17.74Times
12.63Times
14.93Times
Data used
Rs in million 2007-08 2006-07 2005-06 2004-05
Long term debt 62054.23 64102.03 28480.47 29523.38Equity(shareholder’
fund)174358.15 124180.37 96062.52 76665.78
Fixed asset 89292.06 84831.34 76157.17 69265.10Current asset 78516.69 77783.40 73027.74 44764.25Total asset 167808.75 162614.74 149184.91 114029.35
EBDIT 38940.45 42998.15 28445.20 25373.96Debt interest 2806.30 2423.88 2251.68 1699.56
Capital employed 270881.83 209093.00 157370.00 125869.00Net worth 174358 124149.00 96003.00 76572.00
Formula used
Debt equity ratio Long term debt/ EquityTotal asset to debt ratio Total asset/ Long term asset
Propriety ratio Shareholder’s fund/ Total assetEquity ratio Capital employed/ Net worth
Interest coverage ratio EBDIT/Debt InterestRelationship between financial leverage & required rate of return

Relationship between financial leverage and firm’s required rate of return to equity shareholders with corporate tax is given:
Re = Ro + D/E (1-T) (Ro-b)
Where,
Re = Required rate of return to equity shareholders
Ro = Required rate of return for all equity firm.
D = Debt amount in capital structure.
E = Equity amount in capital structure.
T = Corporate tax rate.
Rb = Required rate of return to lenders.
TWACC = Total weighted average cost of capital.

EXPLANATION
The above graph clearly depicts that with higher debt content ‘Re’ i.e. required rate of return by shareholder is going up while TWACC is getting lower.
Determination of whether Hindalco is Trading on Equity
Trading on Equity
Re
TWACC
Rbbb

A company may raise funds either by issue of shares or by debentures. Debentures carry a fixed rate of interest and this interest has to be paid irrespective of profits. Of course, preference share are also entitled to a fixed rate of dividend depends upon the profitability of the company. In case, the rate of return on the total capital employed is more than the rate of interest on debentures or rate of dividend on preference shares, it is said that company is trading on equity.
Rate of Return on Equity Shareholders Fund
= PAT/ Equity Shareholders Fund
= 28609/ 174358
= 16%
General Rate of Return= (PAT+ Interest) / Total Capital Employed
= 31415 / 270881
= 12%
The general rate of return is 12% while the return on equity shareholder’s fund is 16%. Thus, we can say that Hindalco is trading on equity.
EPS and ROE calculations
EPS is calculated by dividing profit after taxes, PAT (also called net income, NI) by the number of shares outstanding. PAT is found in 2

steps. First, the interest on debt, INT, is deducted from the earnings before interest and taxes, EBIT, to obtain the profit before taxes, PBT. Then, taxes are computed on and subtracted from PBT to arrive at the figure of PAT. The formula for calculating EPS is-
Earning per share= Profit after tax/ No. of shares
EPS= PAT/ N= (EBIT-INT) (1-T)/N
Where, T is the corporate tax rate and N is the number of ordinary shares outstanding. If the firm does not employ any debt, then the formula simply would be-
EPS= EBIT (1-T)/N
ROE is obtained by dividing PAT by equity (S) or net worth (NW). Thus, the formula for calculating ROE is as follows-
Returns on Pay= Profit after tax/ Net worth (book value of equity)
ROE= (EBIT-INT) (1-T)/S
S is considered as book value of equity capital in above equation.
Combining Degree of Operating Leverage
Degree of Operating Leverage= The degree of operating leverage (DOL) was defined as the percentage change in the earnings before interest and taxes relative to a given percentage change in sales. Thus:
DOL= % change in EBIT/ % change in sales
Degree of Financial Leverage= The degree of financial leverage (DFL) is defined as the percentage change in EPS due to a given percentage change in EBIT:
DFL= % change in EPS/ % change in EBIT
Combining Effect of Operating and Financial Leverage
Operating and financial leverage together cause wide fluctuations in EPS for a given change in sales. If a company employs a high level of operating and financial leverage, even a small change in the level of sales will have effect on EPS.
The degree of operating and financial leverages can be combined to see the effect of total leverages on EPS associated with a given change in sales. The degree of combined leverage (DCL) is given by the following equation-
= % change in EBIT/ % change in sales* % change in EPS / % change in EBIT= % change in EPS/ % change in sales
Financial Leverage and the Shareholder’s Risk
It has is seen that financial leverage magnifies the shareholder’s earnings. It has also been observed that the variability of RBIT causes EPS to fluctuate within wider ranges with debt in the capital structure.

That is, with more debt, EPS rises and falls faster than the rise and fall of EBIT. Thus, financial leverage not only magnifies EPS but also increases its variability.
The variability of EBIT and EPS distinguish between two types of risk- operating risk and financial risk.
Operating Risk- Operating risk can be defined as the variability of EBIT (or return on assets). The environment- internal and external- in which a firm operates determines the variability of EBIT. So long as the environment is given to the firm, operating risk is an unavoidable risk. A firm is better placed to face such risk if it can predict it with a fair degree of accuracy.
The variability of EBIT has two components: Variability of sales Variability of expense
Variability of sales- The variability of sales revenue is in fact, a major determinant of operating risk. Sales of a company may fluctuate because of three reasons. First, the changes in general economic conditions may affect the level of business activity. Second, certain events affect sales of companies belonging to a particular industry. For example, the general economic conditions may be hit by recession. Other factors may include the availability of raw materials, technological changes, actions of competitors, industrial relations, shifts in consumer preferences and so on. Third, sales may also be affected by the factors, which are internal to the company. The change in management, the product-market decisions of the company and

its investment policy, or strike in the company have a great influence on the company’s sales.
Variability of Expenses- Given the variability of sales, the variability of EBIT is further affected by the composition of fixed and variable expenses. Higher the proportion of fixed expenses relative to variable expenses, higher the degree of operating leverage. High operating leverage leads to faster increase in EBIT when sales are rising. In bad times when sales are falling, high operating leverage becomes a nuisance; EBIT declines at a greater rate than fall in sales. Operating leverage causes wide fluctuations in EBIT with varying sales. Operating expenses may also vary on account of changes in input prices, and may also contribute to the variability of EBIT.
Financial Risk- For a given degree of variability of EBIT, the variability of EPS (and ROE) increases with more financial leverage. The variability of EPS caused by the use of financial leverage is called financial risk. Firms exposed to same degree of operating risk can differ with respect to financial risk when they finance their assets differently. Financial risk is thus an avoidable risk if the firm decides not to use any debt in its capital structure.
Cash Flow Analysis
The cash flow approach establishes the debt capacity by examining the probability of default.

The cash flow approach to assessing debt capacity involves the following steps-
1. Specify the tolerance limit on the probability of default. This reflects the risk attitude of management. Is it willing to accept a 0 per cent, 5 per cent, 10 per cent or probability of default on its debt commitment?
2. Estimate the probability distribution of cash flows, taking into account the projected performance of the firm.
3. Calculate the fixed charges by way of interest payment & principle repayment associated with various levels of debt.
4. Estimate the debt capacity of the firm as the highest level of debt which is acceptable, given the tolerance limit, the probability distribution, and the fixed charges defined.
Components of Cash Flows
The cash flows should be analysed over a long period of time, which can cover the various adverse phases, for determining the firm’s debt policy. The cash flow analysis involves preparing proforma cash flow

statements showing the firm’s financial conditions under adverse conditions such as a recession. The expected cash flows can be categorized into three groups:
Operating cash flows. Non-operating cash flows. Financial flows.
1. Operating cash flows- Operating cash flows relate to the operations of the firm and can be determined from the projected profit and loss statements. The behaviour of sales volume, output price and input price over the period of analysis should be examined and predicted.
2. Non-operating cash flows- Non-operating cash flows generally include capital expenditures and working capital changes. During a recessionary period, the firm may have to specially spend on advertising etc. for the promotion of the product. Such expenditures should be included in the non-operating cash flows.
3. Financial flows- Financial flows include interest, dividends, lease rentals, repayments of debt etc. They are further divided into: Contractual obligations and policy obligations. Contractual obligations include those financial obligations, like interest, lease rentals and principal payments that are matters of contract, and should not be defaulted. Policy obligations consist of those financial obligations, like dividends, that are at the discretion of the board of directors. Policy obligations are also called discretionary obligations.
Utility of Cash Flow Analysis

The cash flow analysis has the following advantage: It focuses on the liquidity and solvency of the firm over a
long period of time, even encompassing adverse circumstances. Thus, it evaluates the firm’s ability to meet fixed obligations.
It is more comprehensive and goes beyond the analysis of profit and loss statement and also considers changes in the balance sheet items.
It identifies discretionary cash flows. The firm can thus prepare an action plan to face adverse situations.
It provides a list of potential financial flows, which can be utilised under emergency.
It is a long–term dynamic analysis and does not remain confined to a single period analysis.
Financial Difficulties: How to recognize and avoid
Here are a few guidelines to help you manage your cash flow effectively:
Collect money from debtors as quickly as possible. Centralize payments and streaming procedure for different
functional areas such as accounts payable and payroll, by using (for example) BACS payment methods. This is quicker, more secure and cheaper than cheques.

Develop close partnership with customers and suppliers to negotiate mutually beneficial payment policies.
Consolidate banking relationship by choosing banks that can offer customized cash management services. You will get advice from banking experts and save on bank charges.
Develop accurate cash flow forecasting techniques and models that are linked to budgets and strategic plans.
Conduct regular reviews of the cash situation to ensure that the cash balances are approximately the same as in the budget, and analyze any significant variations from budget.
Ensure appropriate use of current technology: for example telephone and internet banking, as these are quicker and cheaper.
Ensure that investing, borrowing, payment and other financial transactions are properly authorized so as to avoid any improper use of the organization’s cash. If the organization has too much liquidity in the long term, it may well be invested in fairly low return areas, such as bank deposit accounts. Long term surplus cash should be invested in making the organization grow. You might, perhaps, be able to fund additional resources to help you raise fund.

PROJECT

Preface
Summer Training is an integral part of our academic curriculum. During the training, a student gets an opportunity to understand and learn various activities undergoing in the corporate sector. It gives an insight of business activities.
This project report is the outcome of the summer training that I have undergone at HINDALCO INDUSTRIES LIMITED for the partial fulfillment of PGDM Course.
The topic allotted to me by the company is “Capital Structure of Hindalco”.
The project emphasizes on the financing mix of the company.
I have tried my best to make a good report. However, no one can claim perfection in it’s entirely. So I apologize for the discrepancy, if any, crept in.
Preparation of project requires perseverance, initiatives, proper guidance and direction. So it’s mandatory to take the aid of various departments.
Actually, a project is the summarized form of seven activities. They are:
Planning Resource Collection Organizing Joint Efforts Efficiency Communication Transparency
AcknowledgementIn an organization, be it an industry, a school or society, no outcomes can be achieved by one man working in isolation. It’s always a group working and achieving the outcome in totality. It is the outcome of all the guidance and support that I received from this organization.
I would like to thank Mr. S.K. Das, G.M. (Training) for having arrangement of my training in this organization. I would also like to thank Dr. D. C .Kabra, Vice President (Finance & Accounts) & Mr. Gopal Purohit, G.M. (Finance & Accounts), for giving me a chance to work with this organisation and for extending words of encouragement and wisdom.
I wish to express my profound sense of gratitude to professor Sudhir Saran Sir, Director General, SMS Lucknow for having arranging summer training in this prestigious organisation. I would also like to express my sincere gratitude to my project guide Mrs. Vandana Srivastava & Mr. Babar Ali Khan (Faculty member-SMS) for the help and encouragement they have extended. Their help has gone a long way in successful completion of this project.
I also like to extend my sincere gratitude to my project supervisor Mr. Vimal Raheja, Deputy Manager (F&A) for helping me during my tenure in Hindalco.
I am thankful to whole Hindalco family for their kind cooperation. Hope their valuable guidance & their guidelines will prove as a “LIGHT” in the path of my future life.
Above all I am thankful to ALLAH who acquainted me with the required intelligence to carry out this project.
Mirza Aatif Baig

Objective of Study
The objective of the study involves understanding of different aspects of capital structure.
To study the different aspects related to capital structure of Hindalco industries Limited which contributes most to make Hindalco one of the lowest cost producers in profit involving organisation in the world.
To have deep study about the financial leverage of the organisation.
To study various approaches to establish target capital structure.
Primary Objective
The primary objective of the study is to have detailed overview of appropriate capital structure of the company including deep insight over the various ratios associated with the Capital Structure of the organization.
To know about the combination of debt and equity and what cost the organization has to pay for that.
Secondary Objective
The main aim is to review the financial control of the company and the various aspects related to financial activities.
To get a practical experience of the job environment of the organization.

Research Methodology
Research methodology used here is purely descriptive. The research methodology is highly flexible, unstructured and qualitative.
Sampling Plan
There has been no sampling plan as such as the study involves
understanding the various process and analysing them. The
study involves the detailed analysis of secondary data
collected from various sources and therefore no sample size
And plan has been considered.
Data Source
Data has been collected through literature survey and expert opinion. Literature survey includes the collection of data from various sources like hand books, study material etc.
Secondary Sources
From the company induction booklet and website.
Company’s annual report.
Data Analysis
Different tools like MS-Word and MS-Excel used for the analysis
Of data.

INTER-RELATIONSHIP BETWEEN MARKET VALUE,FINANCIAL DECISIONS AND RISK-RETURN TRADE-OFF
Financial
Maximise Share Value
Finance Manager
Fund Decisio
Investment Decision
Dividend Decision
Financing Decision
Return
Risk
Trade Off

APPENDIX
Financial Highlights –Q4 & FY08

EBIDTA Q4 FY 08 %
ChangeFY 08 %
ChangeNet Sales & Operating Revenue
5010 6% 19201 5%
EBIDTA 941 -20% 3894 -11%Pre-tax profit
690 -28% 3026 -14%
Net Profit 1077 49% 2861 12%Basic EPS per share
8.78 19% 24.51 -3%
BALANCE SHEET AS AT 31 st March, 2008
(Rs. in Millions)
Particulars As at 31st March,2008
As at 31st March, 2007
SOURCES OF FUNDSSHAREHOLDER’S

FUNDSShare Capital 1226.48 1043.25Share Capital Suspense 4.06Share Warrants 1390.96Reserves and Surplus 171736.65 123137.12
174,358.15 124,180.37LOAN FUNDSSecured Loans 62054.23 64102.03Unsecured Loans 21231.61 9490.33
83,285.84 73,592.36DEFERRED TAX LIABILITY (NET)
13236.74 11258.01
TOTAL
270,880.73 209,030.74
APPLICATION OF FUNDSFIXED ASSETSGross Block 126084.59 112526.55Less: Depreciation 46368.07 40563.25Less: Impairment 1623.15 1896.21
78,093.37 70,067.09Capital Work-in-Progress
11198.69 14764.25
89,292.06 84,831.34INVESTMENTS 141,079.86 86,753.17
CURRENT ASSETS, LOANS AND ADVANCE
Inventories 50979.06 43153.14
Sundry Debtors 15650.22 15045.02
Cash and Bank Balances 1469.77 6654.96

Other Current Assets 623.04 1188.08
Loans and Advances 9794.60 11742.20
78,516.69 77,783.40
Less:
CURRENT LIABILITIES AND PROVISIONSCurrent Liabilities 28947.79 27527.44
Provisions 9060.09 12841.41
38,007.88 40,368.85
NET CURRENT ASSETS
40,508.81 37,414.55
MISCELLANEOUS EXPENDITURE (to the extent not written off or adjusted) TOTAL
270,880.73 209,030.74
PROFIT & LOSS ACCOUNT FOR THE YEAR ENDED 31 st MARCH, 2008
(Rs. in Millions)
Particulars For the year ended 31st
March,2008
For the year ended 31st
March,2007

INCOMEGross Sales and Operating Revenues
210219.31 199200.86
Less: Excise Duty 18209.04 16070.98Net Sales and Operating Revenues
192,010.27 183,129.88
Other Income 4929.37 3700.69196,939.64 186,830.57
EXPENDITURE(Increase)/ Decrease in Stocks
(1370.26) (4425.17)
Trade Purchases 925.18 230.19Manufacturing and Other Expenses
158444.27 147175.00
Interest and Finance Charges
2806.30 2423.88
Depreciation 5878.09 5528.02Impairment - 852.40
166,683.58 151,784.32PROFIT BEFORE TAX
30256.06 35046.25
Provision for Current Tax
6063.56 9841.00
Provision for Deferred Tax
875.79 (551.00)
Provision for Fringe Benefit Tax
114.00 113.00
Tax adjustment for earlier years (Net)
(5406.68) -
NET PROFIT 28,609.39 25,643.25Balance brought forward from Previous year
1000.00 550.00
Balance Brought forward from Amalgamating Company
(15.62) -

Transfer from Debenture Redemption Reserve
1721.70 1450.00
BALANCE AVAILABLE FOR APPROPRIATIONS
31,315.47 27,643.25
APPROPRIATIONSDebenture Redemption Reserve
50.00 186.82
Dividend on Preference Shares
0.24 -
Dividend Tax on Preference Shares
0.04 -
Interim Dividend on Equity Shares
- 1773.44
Tax on Interim Dividend - 248.72Proposed Dividend on Equity Shares
2268.93 -
Tax on Proposed Dividend
385.60 -
Transfer to General Reserve
25610.66 24434.27
Balance Carried to Balance Sheet
3000.00 1000.00
TOTAL 31,315.47 27,643.25Basic EPS (in Rs.) 24.51 25.52
CASH FLOW STATEMENT FOR THE YEAR ENDED 31 st MARCH, 2008
(Rs. In Millions)
Particulars Year ended March 31st, 2008
Year ended March 31st ,2007
A.CASH FLOW

FROM OPERATING ACTIVITIESNet profit before Tax 30256.06 35046.25Adjustment for:Interest and Finance Charges
2806.30 2423.88
Depreciation 5878.09 5528.02Impairment - 852.40Unrealized Foreign Exchange Gain/Loss (Net)
120.60 (198.37)
Employee Stock Option 21.29 -Provisions/ Provisions written-back (Net)
(566.53) (33.76)
Miscellaneous expenditure written off
36.16 40.04
Provision/ (write back)for diminution in carrying cost of Investments (Net)
122.18 (3.78)
Investing Activities (Net) (5002.60) (3488.20)
Operating profit before working capital changes
33,671.55 40,166.48
Changes in Working Capital:Change in Inventories (7727.26) (2202.26)Change in Trade and other Receivables
269.09 (4563.55)
Change in Trade Payables
1761.95 5580.37
Cash generation from Operation
27,975.33 38,981.04
Payment under VRS (3.23) (11.72)

Payment of Direct Taxes (6573.66) (5603.73)Net Cash Generated/(used)- Operating Activities
21,398.44 33,365.59
B.CASH FLOW FROM INVESTMENT ACTIVITIESPurchase of Fixed Assets (9090.14) (13536.41)Sale of Fixed Assets 212.54 63.96Purchase/Sale of shares of Subsidiaries (Net)
(31362.52) (21.00)
Purchase/Sale of Investments (Net)
(21244.11) (46072.94)
Loans/Repayment of Advances & Loans from Subsidiaries (Net)
1662.55 (851.31)
Interest Received 1328.37 1689.09Dividend Received 4868.34 2365.37Net Cash Generated/(used)- Investing Activities
(53,624.97) (56,363.24)
C.CASH FLOW FROM FINANCING ACTIVITIESProceeds from issue of shares and warrants (net of expenses)
24237.13 5528.68
Proceeds/Repayment of Long Term Borrowings (Net)
(568.29) 34846.45
Proceeds/Repayment of 10208.38 (10194.82)

Short Term Borrowings (Net)Interest and Finance Charges
(6678.38) (5795.22)
Dividend paid (including Dividend Tax)
- (4494.66)
Net Cash Generated/(used)- Financing Activities
27,198.84 19,890.43
Net Increase/(Decrease)in Cash and Cash Equivalents
(5,027.69) (3,107.22)
Add: Operating Cash and Cash Equivalents
6412.11 9519.33
Cash acquired on Amalgamation
9.41 -
Closing Cash and Cash Equivalent
1,393.83 6,412.11
COMPETITORS
National Aluminium Company Ltd (NALCO)
Public sector company which is Asia’s largest integrated aluminium manufacturer, with activities that include bauxite mining, alumina

refining, aluminium smelting & casting, power generation, rail & port operations; based in Bhubaneswar (Orissa).
Vedanta Resource plc
Leading integrated metals & mining group located in London, UK, but whose operators are mainly in India; has interests in aluminium (BALCO, MALCO), copper (Sterlite, Konkola, CMT) & zinc (Hindustan Zinc Ltd).
Bharat Aluminium Company Ltd (BALCO)
Integrated aluminium producers whose activities include mining, smelting, refining & fabrication; based in New Delhi; a part of Vedanta Resources; has an alumina production capacity of 200,000 tpa 7 smelting capacity of 100,000 tpa.
Jindal Aluminium Ltd
Largest manufacturer of aluminium extruded profiles in India having 6 extrusion presses under one roof; manufactures bars, rods & tubes, structure, architectural, moulding, transport, industrial & general products; located in Bangalore.
Apar Industries Ltd
Manufacturers of transformer oil & specialty oils, overhead power transmission & distribution aluminium conductors & specialty polymer; corporate office is in Mumbai; products include industrial & automotive oils, nitrile rubber, lattices.

Century Extrusions Ltd (CEL)
Manufacturers of aluminium extrusions based in Kolkata; has an installed capacity of 7,500 MT; product categories: architectural applications, transport, electrical, electronics & communications, industrial applications.
Alufluoride Ltd
Manufacturers of aluminium fluoride based in Vishakhapatnam, Andhra Pradesh; has an installed capacity of 5,000 tones.
Bhoruka Aluminium Ltd
ISO certified manufacturer of aluminium extrusions; part of the Bhoruka group; supplies its products to the industrial, transportation, building & construction, electrical & electronics, solar and interior sectors.
Karshni Aluminium Co Pvt Ltd
ISO certified manufacturer of industrial and domestic aluminium ladders, aluminium doors and windows, curtain walls and structural glazings; based in Ghaziabad, Uttar Pradesh; has-in-house powder coating & anodising facilities.
HINDALCO VS COMPETITORS:

Particular Market capitalization
(Rs. cr.)
Sales Turnover
Net Profit
Total Assets
NALCO 22434.86 4988.43 1624.89
7695.22
Hindalco 16294.54 19201 2320.2 25764.41
Madras Aluminium
1295.44 493.7 45.86 395.81
Century Extr 55.6 98.56 2.8 26.91
Man Aluminium
12.79 42.72 1.65 25.91
MARKET CAPITALIZATION
NALCO
Hindalco
Madras Aluminiu
Century Extr
Man Aluminium

NALCO Hindalco Madras Aluminiu Century Extr Man Aluminium0
3500
7000
10500
14000
17500
21000
24500
28000
Sales TurnoverNet ProfitTotal Assets
BEST PRACTICES AT HINDALCO
1. Integrated Management System- Purpose- To increase value and improve operational performance.
2. World Class Manufacturing (WMC)-

Aim- To achieve Zero Defects, Zero breakdowns, Zero Accidents, Zero Customer Complaints, Zero pollution, Zero Losses & Zero Abnormalities.
3. Community Development Initiatives- . Social welfare and women empowerment. Economic self reliance & watersheds development. Education and capacity building. Health & Family welfare. Infrastructural Development.
ACCOLADES – 2007-08
1. Chairman’s WCM Silver Award 2007 for Business Excellence in Manufacturing.
2. Green tech Safety Gold Award 2008 for outstanding achievement in Safety Management in Coal Based Power Sector.
3. Green tech Environment Excellence Silver Award 2007 for outstanding achievements in Environment Management.

4. QC Award- QC Team “ Vayadoot “ and “ Navodaya “ of Renusagar achieved par Excellence Award in Case Presentation at National Level Convention NCQC- 2007 Kolkata.
5. CII Human Resource Excellence Award 2007 for “Strong Commitment “. This award is presented for significant achievement in the field of HR and follows the CII EXIM BANK Model for Business Excellence.
6. IMC Ramakrishna Bajaj National Quality Award 2007 to HINDALCO for “PERFORMANCE EXCELLENCE 07”. This award is being presented by Indian Merchant Chamber every year for outstanding performance in the field of Quality in the categories- Manufacturing, Services, Small Business, Education and Overseas.
7. Coal Best Practices Award- 1st Prize.Hindalco Renusagar bagged First Price in Coal Best Practices.
8. National Energy Conservation Award in Aluminium Sector- Government of India, Ministry of Power.
KEY BUSINESS OF THE GROUP
Indian Roots
Company Product/Services
Grasim Viscose stable fibre, Rayon grade
Pulp, cement, chemicals, sponge iron,
Textiles.
Hindalco Aluminium, copper
: Hindustan Aluminium - Aluminium foil

Company Ltd.
: Bihar Caustic & chemicals - Caustic Soda
Ltd.
: Aditya Birla Nuvo - Garments, Viscose filament yarn,
Carbon black & Textiles.
: Idea Cellular Ltd. – Cellular Telecommunication
: Aditya Birla Insulator Ltd. – Insulators
: Birla Sun Life Insurance - Insurance
: Birla Sun Life Asset - Mutual Funds
Management Co.Ltd
: Birla Global Finance Ltd. – Asset based finance, Corporate
Finance & banking, Capital market,
Treasury.
Our International Presence
Country Company Product/Services
Thailand Thai Rayon - Viscose Stable Fibre (VSF)
Indo Thai Synthesis - Spun and Fancy Yarns
Thai Acrylic Fibre - Acrylic Fibre
Thai Carbon Black - Carbon Black
Aditya Birla Chemicals - Sodium phosphate,
(Thailand) Ltd. Speciality phosphate,

Sodium sulphite, caustic
Soda, chlorine, allyl chloride
Bisulphite etc.
Thai Peroxide - Hydrogen peroxide, per acetic
Acid, calcium peroxide
Philippines’ Indo Phil Textile Mills – Yarns
Indo Phil Cotton Mills – Yarns
Indo Phil Acrylic Mfg. Corp – Yarns
Pan Century Surfactants Inc. - Surfactants
Indonesia PT Indo Bharat Rayon - Viscose staple fibre (VSF)
PT Elegant Textile Industry - Yarns
PT Indo Liberty Textiles - Yarns
PT Indo Raya Kimie - Carbon disulphide
Egypt Alexandria Carbon Black - Carbon Black
Company S.A.E
Alexandria Fiber Company - Acrylic Fibre
S.A.E
China Liaoning Birla Carbon Co. Ltd – Carbon Black

Canada AV Cell Inc. – Softwood/Hardwood
Pulp (for VSF Manufacture)
AV Nackawie Inc. – Dissolving Pulp (for
VSF Manufacture)
Australia Aditya Birla Minerals Ltd - Copper
Laos Birla Lao Pulp and Plantations – Pulp wood plantations
Company Ltd. / pulp plant
AQUISITION PROCESS COMPLETED
Hindalco, the Aditya Birla Group’s flagship company announced the completion of its acquisition of NOVELIS. The transaction makes Hindalco the world’s largest aluminium rolling company and one of the biggest producers of primary aluminium in Asia, as well as being India’s leading copper producer.
On 10 February 2007, Hindalco entered into an agreement with Novelis to acquire the company in all- cash transaction, which values Novelis at approximately US$ 6.0 billion, including debt. Under the terms of the agreement, Novelis shareholders will receive US$ 44.93 in cash for each outstanding common share. Novelis shareholders

approved the transaction by an overwhelming majority (99.8 per cent) in a special meeting on 10 May 2007.
“We look upon the aluminium business as a core business that has economic growth potential in revenues and earnings. Our vision is to be a premium metals major, global in size and reach with a passion for excellence. The acquisition of Novelis is a step in this direction”, said Mr. Kumar Mangalam Birla, Chairman, Hindalco.
“The combination of Hindalco and Novelis establishes an integrated producer with low- cost alumina and aluminium facilities combined with high-end rolling capabilities and a global footprint. The complementary assets and expertise of the team provides a strong platform for growth and success.” Added Mr. Birla.
Welcoming the men and women of Novelis into Hindalco and the Aditya Birla Group, Mr. D. Bhattacharya, managing director of Hindalco and director of Aditya Birla Management Corporation said, “Novelis makes a perfect fit for Hindalco. There are enormous geographical market and product synergies. Novelis is the global leader in the value-added high-end aluminium rolled products and aluminium can recycling. Hindalco is consistently increasing its share of value-added products, which today stand at nearly 60 per cent. The Novelis acquisition gives it an instant leg-up with its technology sophisticated rolled aluminium products capability, apart from a scale and a global footprint”.
“We are very pleased to complete this transaction with Hindalco,” said Novelis Chief Operating Officer, Ms. Martha Brooks. “The arrangement has created significant value for Novelis shareholders while at the same time providing new opportunities for the future of the combined company. With the support of Hindalco and the Aditya Birla Group, we will be able to accelerate the Novelis business strategy, leveraging our world-class assets for the production of premium aluminium products”.

Novelis stock has ceased trading on the New York Stock Exchange. De-listing on the New York Stock Exchange and the Toronto Stock Exchange is expected to occur shortly.
INTEGRATED OPERATIONS AT HINDALCO
Bauxite Mines
Aluminium Refinery
Co-Generation Caustic Soda From JV
Aluminium Fluoride From J.V
Renusagar Power Plant
Semi Fabrication Plant
Rolling Mills Redraw Rod Mills Extrusion Presses
Aluminium Smelter

Economic Value Added
Introduction
Investors are currently demanding shareholder value more strongly than ever. Investors world over have increased the pressure on companies to maximize shareholder value. Even in India the shareholder value-approach has gained grounds. This is due to the ownership of Indian stocks by FII and foreign investors, Indian companies being listed on foreign exchanges, issuance of bonds in foreign countries etc. Investors round the world emphasize and demand focus on shareholder value-issuance.
Background
EVA is defined to be operating profit subtracted with capital charges. EVA is thus one variation of residential income with adjustment as to how one calculation income and capital. One of
Rolling Mills Redraw Rod Mills Extrusion Presses

the earliest to mention the residual income concept was Alfred Marshall in 1890. He defined the economic profit as total net gains less the interest on invested capital at the current rate. The EVA concept is often called economic profit (EP). In order to avoid problems caused by the trade marketing. On the other hand, the name “EVA” is so popular and well known that often all residual income concepts are often called EVA.
Put simply, EVA is net operating profit minus an appropriate charge for the opportunity cost of all capital invested in an enterprises. As such, it is an estimate of “ economic profit, or the amount by which earnings exceeds or fall short of the required minimum rate of return that shareholder and lenders could get by investing in other securities of comparable risk.
The capital charges are the most distinctive and important aspect of EVA. Under conventional accounting, most companies appear profitable but many in fact are not. According to Peter Drucker “Until a business returns a profit that is greater than its cost of capital, it operates at a loss. Never mind that it pays taxes as if it had a genuine profit. The enterprise still returns less to the economy than it divorce in resources. Until than it does not create wealth; it destroys it.” EVA corrects this error by explicitly recognizing that when managers employ capital they must pay for it, just as if it were a wage.
Characteristics
EVA is the after tax cash flow generated by a business minus cost of capital. It has deployed to generate cash flow. It represents real profit verses paper profit and underlines shareholders value. It is increasingly becoming the main target of leading companies

strategies. After all, shareholders are the players who provide the firm with its capital; they invest to gain a return on that capital.
EVA measures whether the operating profit is enough compared to the total cost of capital employed. It is defined as “Net operating profit after tax (NOPAT) subtracted with a capital cost or cost of capital.”
EVA= NOPAT – CAPITAL COST
EVA= NOPAT – CAPITAL COST* CAPITAL EMPLOYED
Or equivalently, if rate of return is defined as NOPAT/ CAPITAL, this turns into a perhaps more revealing formula:
EVA = (Rate of Return – Cost of Capital)* capital
Where,
Rate of return = NOPAT / CAPITAL
Capital = Total Balance Sheet minus non interest bearing debt in the beginning of the year
Cost of Capital =Cost of Equity* Proportion of equity from capital
+
Cost of Debt* Proportion of debt from capital * (1- Tax Rate)
Cost of capital or weighted average cost of capital is average cost of both equity capital and interest- bearing debt. Cost of equity is defined with capital asset pricing model. The estimation of cost of debt is naturally more straight forward, since its cost is explicit. Cost

of debt also includes the tax shield due to tax allowance on interest expenses.
If ROI is defined as above (after taxes) then EVA can be represented as:
EVA = (ROI - WACC)*Capital Employed
The idea behind EVA is that shareholder must earn a return that compensates the risk taken. In other words, equity capital has to earn at least same return as similarly risky investments at equity markets. If that is not the case, then there is not real profit made and actually the company operates at a loss from view point of shareholders. On the other hand if EVA is zero, this should be treated as sufficient achievement because the shareholders have earned a return that compensates the risk. This approach-using average risk-adjusted market return as diversified long-term investments on stocks market. The average long-term stock market returns that the public companies generates from their operations.
EVA is based on the common accounting based items like interest bearing debt, equity capital and net operating profit. It differs from the traditional measures mainly by including the cost of equity. Mathematically it gives exactly the same result in valuation as discounted cash flow pr net present value which is long since widely acknowledged as theoretically best analysis tools from the shareholders perspective. These both measures include the opportunity cost of equity, they take into account the time value of money and they do not suffer from any kind of accounting distortion/ however NPV and DCF do not suit in performance evaluation because they are based exclusively on cash flow. EVA in turn suits particularly well in performance measuring. Yet, it should be emphasized that the equivalence with EVA and NPV / DCF holds only in special circumstances (in valuation) and thus this equivalences does not have anything to do with performance measurement.

Merits of EVA
Measurement of Value Added Performance EVA concept will help organization in evaluating and measuring the performance both qualitative and quantitative. It shows financial performance with a new pair of glasses or offers new approach especially for the companies where equity is viewed as free source of funds and performance is measured by some earning figure.
Basis of Decision Making It will help organization to alight its management system to the EVA process. The EVA based management system can provide the basis on which the companies can take decisions related to

the choice of strategy, investment activity related to research & development, human development, capital allocation mergers and acquisition, diversting business and goal setting.
Device to Design and Implement Incentive Plan It can form a basis and implement incentive plan/ bonus. This plan will ensure that the only way in which manager can earn higher bonus is by creating more values for shareholder. An EVA-based incentive system will encourage managers to operate in such a way as to maximise the EVA, not just of the operation they oversee, but of the company as a whole. Thus, it is to make every employee of an organization an entrepreneur who seeks not to perform his or her function well, but to do so in a way that enhances the EVA of the company.
Conclusion
EVA is a basis of measurement of performance of a company, in terms of the value they have added to the society. However, we have to bear in mind that the success of any given company is measured ultimately as creation of shareholder value. EVA helps in quantitative assessing of different strategies but that is all. Wealth does not arise from EVA alone. EVA only measures change of wealth. It is also as short-term as all other periodic performance measures. Therefore, all companies should rely on other performance measures as well for assess in the achievement of their strategic goals.

Ratio Analysis
It is widely used tool of financial analysis. The term ratio refers to the relationship expressed in mathematical terms between two individual figures or group of figures connected with each other in some logical manner and are selected from financial statements of the concern. A financial ratio helps to express the relationship between two accounting figures in such a way that users can draw conclusion about the performance, strengths and weaknesses of a firm.
Ratio to be used for capital structure analysis:
Earnings per share. Dividend per share. P/E ratio. Dividend pay-out ratio. Debt-equity ratio. Interest coverage ratio.

Return on investment.
Per share data (As on 31 st March)
2007-08 2006-07 2005-06 2004-05 2003-04
Net earnings (Rs. mn.) 28,609 25,643 16,556 13,294 8,389Cash earnings (Rs. mn.) 34,487 32,024 21,767 17,927 11,563EPS (Rs.) 24.51 25.52 16.79 134.48 8.53CEPS (Rs.) 29.55 31.87 22.07 18.18 11.76Dividend per share (Rs.) 1.85@ 1.70 2.20 2.00 1.65Dividend pay out (%) 9.3@ 7.9 14.9 16.0 20.5Book value per share (Rs.) 142.09 118.97 97.40 82.54 74.16Price to earning 6.7 5.1 10.9 9.0 13.4Price to cash earning 5.6 4.1 8.3 6.7 9.7Price to book value 1.2 1.1 1.9 1.6 1.7

Earning per share
EPS shows the profitability of the firm on a per share basis, it does not reflect how much is paid as dividend and how much is retained in the business.
EPS= Profit after tax / No. of shares
Significance
The EPS helps in determining the market price of the equity shares of the company. A comparison of earning per share of the company with another will also help in deciding whether the equity share capital is being effectively used or not. Helps in estimating the company’s capacity to pay dividend to its equity shareholder.
EPS of Hindalco
Particulars 2007-08 2006-07 2005-06 2004-05Earnings per share
24.51 25.52 16.79 13.48

Interpretation
The EPS of Hindalco shows an upward trend since FY-04. There is a considerable increase in EPS till FY-07 but there is a decrease in FY-08 i.e. 24.51.
2007-08 2006-07 2005-06 2004-050
5
10
15
20
25
30
EPS
EPS

Dividend Per Share
It indicates the amount of profit distributed to shareholders per share. It is calculated as:
DPS = PAT / No. of Equity shares
DPS of Hindalco
Particulars 2007-08 2006-07 2005-06 2004-05Dividend per share (computed)
1.85 1.70 2.20 2.00

2007-08 2006-07 20005-06 2004-050
0.5
1
1.5
2
2.5
DPS
DPS
Interpretation
Over the years the DPS of Hindalco has been increasing from Rs.2.00 per share to Rs.2.20 per share till FY 2006.But it decreased in FY 2007 to 1.70 again showing increase in FY 2008 to Rs.1.85. This dividend payment is quite low showing that retaining most of its earnings for future investments in projects.
EPS AND DPS Of Hindalco Industries Ltd .

Price to Earning

This ratio indicates the number of times the earning per share is covered by its market price.
P/E ratio = MP per share / EPS
Significance
P/E ratio helps the investor in deciding whether to buy or not to buy the share of the company at a particular market price.
Price to Earning of Hindalco
Particulars 2007-08 2006-07 2005-06 2004-05Price to Earning
6.7 5.1 10.9 9.04
Interpretation
2007-08 2006-07 2005-06 2004-050
2
4
6
8
10
12
P/E
P/E

P/E ratio of Hindalco considerably increased in FY 2004, but it has decreased to great extent in FY 2007 again showing an increased in FY 2008 i.e. 6.7 Thus, the EPS is covered by its market price by 6.7 times.
Dividend Payout Ratio

The ratio indicates what proportion of EPS has been used for paying dividend.
Payout ratio = DPS/ EPS
Significance
The payout ratios are indicators of the amount of earning that have been ploughed back in the business. Lower payout, the higher the amount earnings ploughed back in the business and vice-versa.
Pay-out ratio of Hindalco
Particulars 2007-08 2006-07 2005-06 2004-05DPS(Rs) 1.85 1.70 2.20 2.00EPS(Rs) 24.51 25.52 16.79 13.48Pay-out ratio
0.07 0.07 0.13 0.15
Years 2007-08 2006-07 2005-06 2004-050
0.02
0.04
0.06
0.08
0.1
0.12
0.14
0.16
Series2Series1

Interpretation
The ratio has decreased to a large extent in 2007 as compared to previous financial years maintaining the same in 2008 i.e. 0.07. It indicates that company is ploughing back a large amount of its earnings for future expansion of business.
Debt – Equity Ratio

The relationship between borrowed funds and owners capital is a popular measure of the financial solvency of a firm. That is shown by debt equity ratio. It is a ratio of the outsiders fund to the owner’s fund.
Debt-Equity ratio = Total Debt / Net Worth
Particulars 2007-08 2006-07 2005-06 2004-05Debt Equity Ratio
0.48 0.59 0.51 0.50
Years 2007-08 2006-07 2005-06 2004-050
0.1
0.2
0.3
0.4
0.5
0.6
Series1Series2

Interpretation
The debt equity ratio has shown a considerable increase till FY 2007 i.e. 0.59 but again resulted in a decrease i.e. 0.48 in the FY 2008.Thus, it is apparent that there is a scope for the company to raise further loan capital.
Interest- Coverage Ratio

The interest coverage ratio shows the number of times the interest charged is covered by funds that are ordinarily available for the payment. Since taxes are computed after interest, interest-coverage is calculated in relation to before tax earning. Depreciation is a non-cash item. Therefore, funds equals to depreciation are also available to pay interest charges. We can thus calculate interest coverage ratio as earning before depreciation, interest and taxes divide by interest.
ICR = EBIDTA / Interest
Particulars 2007-08 2006-07 2005-06 2004-05Interest Coverage Ratio
13.88 18.09 12.65 14.98
Years 2007-08 2006-07 2005-06 2004-050
2
4
6
8
10
12
14
16
18
20
Series2Series1

Interpretation
The interest coverage ratio is considered to be ideal if it is 5 to 6 times of interest charge is covered by funds that are ordinarily available for the payment. Interest coverage ratio of Hindalco is showing a downward trend in 2007-08 as compared to other years showing a negative effect.
Return on Capital Employed
It is calculated by dividing EBIT by capital employed.

ROCE = EBIT / Capital Employed
Particulars 2007-08 2006-07 2005-06 2004-05EBIT 33062 38323 23279 20833Capital Employed
270881 208999 157370 125869
ROCE 0.12 0.18 0.14 0.16
Interpretation
The ROCE has increased in the FY 2007 i.e.18% but decreased in the FY 2008.Now it stands at 12%
Years 2007-08 2006-07 2005-06 2004-050
0.02
0.04
0.06
0.08
0.1
0.12
0.14
0.16
0.18
0.2
Series2Series1

FINDINGS
SUGGESTIONS
&
CONCLUSIONS
FINDINGS
The rate of return on equity shareholder’s fund is more than general rate of return. Hence, Hindalco is trading on equity.

The earnings per share of Hindalco is showing a downward trend in FY 2007-08 i.e. 24.51 as compared to FY 2006-07 i.e. 25.52
The dividend per share is showing an upward trend in FY 2007-08 i.e. 1.85 as compared to FY 2006-07 which was 1.70
The dividend payout ratio of Hindalco is showing a similar in FY 2007-08 i.e. 0.07 equal to FY 2006-07 which was 0.07
The share capital, reserves and loan funds of Hindalco has increased in the FY 2007-08.
The debt equity ratio of 0.48 in FY 2007-08 is less as compared to FY 2006-07 which was 0.59. This shows that company is not taking keen interest in the interest of the investors.
The Net Profit has increased in the year 2007-08 i.e 28,609 Mn. as compared in 2006-07 i.e 25,643 Mn.
The market Capitalization has increased from 139,627 Mn. in the year 2006-07 to 202,599 Mn. in the year 2007-08.
SUGGESTIONS

The management should try to maintain trade-off between risk and return for determining the appropriate amount of debt in capital structure.
The company should take advantage of financial leverage very carefully as it also increases the financial risk.
The management should try to substitute long term funds used to finance current assets with short term funds are generally cheaper. This will positively improve efficiency.
CONCLUSIONS
Hindalco Industries Ltd. has an appropriate capital structure. Hindalco is taking the full advantage of financial leverage.

The endeavor of company is to maximize earnings per share i.e. achieving wealth maximization objective.
On the whole, it can be said that Hindalco enjoys a sound financial position from the point of view of all concerned parties – the corporate management, the leading institution etc. The overall performance of the company is satisfactory and it will further improve when the facilities at the disposal of the company are fully utilized. The company has chalked out expansion in alumina and aggressive growth plans in aluminium. However, the management must remain cautious towards the financial position of the company. The management should take all possible steps in the near future to improve the financial position of the company.
BIBLIOGRAPHY
I.M.Pandey., Financial Management S.N.Maheshwari., Financial Management Prasanna Chandra., Financial Management

Annual Reports of Hindalco Industries Limited (2007-08)
Magazines and Journals
Light Metal Age Aluminum International Today
Websites
www.hindalco.com www.adityabirla.com www.wikipedia.com
CAPITAL STRUCTURE OF
HINDALCO INDUSTRIES LIMITED

Project Report
Submitted To
SCHOOL OF MANAGEMENT SCIENCES
For The Award Of
Post Graduate Diploma in Management
Submitted By:
Mirza Aatif Baig
Roll No. : PG/08/20
SCHOOL OF MANAGEMENT SCIENCES LUCKNOW
List of Tables
Capital Structure of Hindalco for 4 years 2004-05 to 2007-08.
Degree of Financial Leverage.
Leverage Ratio.

Financial Highlights- Q4 & FY 08.
Market Capitalization, Sales Turnover, Net Profit of Hindalco vs. competitors.
Per share data as on 31 March 2003-04 to 2007-08.
Earning per share, Dividend per share, Profit Earning ratio, Dividend payout ratio, Debt-equity ratio, Interest coverage ratio, Return on capital employed.
List of Figures
Composition of Capital Structure. Capital Structure of Hindalco for 4 years 2004-05 to 2007-
08 Capital Structure Decision Process. Financial Leverage of Hindalco for the year 2004-05 to
2007-08

Relationship between Required rate of return to equity shareholders, Required rate of return to lenders, Total weighted average cost of capital.
Inter relationship between Market Value, Financial Decisions and Risk Return Trade-off.
Market Capitalization. Integrated operation at Hindalco. Earning Per Share. Dividend Per Share. EPS & DPS of Hindalco Industries Ltd. Profit Earning Ratio, Dividend payout Ratio, Debt-Equity
Ratio, Interest coverage ratio, Return on capital employed.