Embed Size (px)
Citation preview

East Coast Erosion Blankets East Coast Erosion Blankets
443 Bricker Road 443 Bricker RoadBernville, PA 19506 Bernville, PA 19506
Diane Hitt Diane HittPhone: 610-488-8496 Phone: 610-488-8496Fax: 610-488-8494 Fax: 610-488-8494E-mail: [email protected] E-mail: [email protected]
NTPEP / Log Number: RECP (08-01)- 12
Product Identification: ECC-2B
Description:
Netting:
Matrix/Fill: 100% coconut
Stitching:
10.69 oz/sq.yd.21.2 lb/in @ % 10.915.0 lb/in @ % 17.9
233 mils85.4 % / % 14.6
170 %Soil Loss Ratio* = 14.24Soil Loss Ratio* = 18.58Soil Loss Ratio* = 24.25
Shear: 1.33 psf for 30 min. Soil Loss = 68.3 gShear: 1.94 psf for 30 min. Soil Loss = 178.3 gShear: 2.56 psf for 30 min. Soil Loss = 346.7 g
2.72 psf @ ½-in soil loss
= 414%
- TDASTM D 6525 – Thickness
August 2008
100% Organic @ 1.5 in. transverse stitchspacing
AASHTO NTPEPRolled Erosion Control Product (RECP)
Test Report
Organic leno weave jute top and bottom netseach with 0.5 x 1.0 inch rectangular openings
Biodegradable double net coconut temporaryerosion control blanket.
Index Test
Index Test
Index Test
ParametersIndex Test
Index Test
Test ResultsTest Result
ASTM D 6475 - Mass per Unit AreaTest Method - Description
ASTM D 1117 & ECTC-TASC 00197 - Water AbsorptionASTM D 6567 - Ground Cover / Light Penetration
ASTM D 6818 – Ultimate Tensile Strength / Strain -
* Soil Loss Ratio = Soil Loss Bare Soil / Soil Loss with RECP = 1 / C-Factor (Note: soil loss is based on regression analysis)
50 mm (2 in.) / hr for 30 min.
ECTC Method 3 - Determination of Unvegetated RECPAbility to Protect Soil from Hydraulically-Induced ShearStresses Under Bench-Scale Conditions
ECTC Draft Method 4 - Determination of TemporaryDegradable RECP Performance in Encouraging SeedGermination and Plant Growth
ECTC Method 2 - Determination of Unvegetated RECPAbility to Protect Soil From Rain Splash and AssociatedRunoff Under Bench-Scale Conditions 150 mm (6 in.) / hr for 30 min.
% Improvement
(increased biomass)
100 mm (4 in.) / hr for 30 min.
Soil loss curve intercept =Top soil; Fescue (Kentucky 31);
21 day incubation; 27±2° &approximately 45±5% RH
Manufacturer: Plant Name:
Corporate Address: Plant Address:
Plant Contact:
City/State/Zip:City/State/Zip:
Corporate Contact:
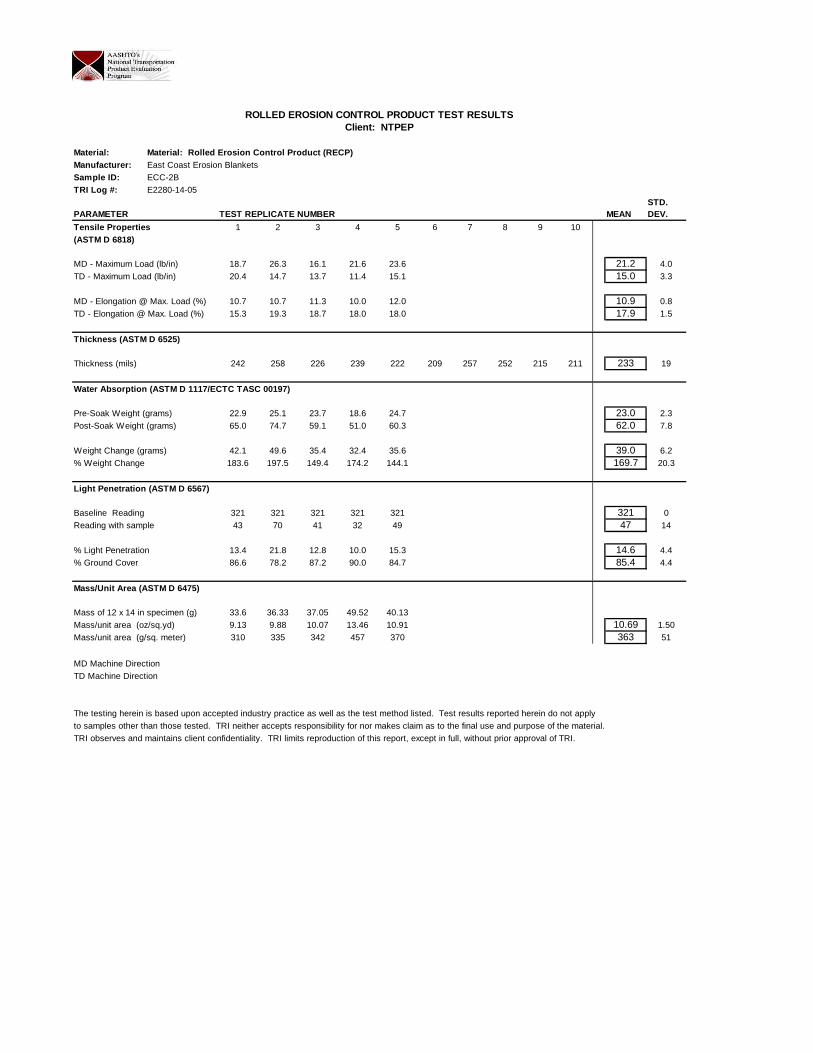
ROLLED EROSION CONTROL PRODUCT TEST RESULTSClient: NTPEP
Material: Material: Rolled Erosion Control Product (RECP)Manufacturer: East Coast Erosion BlanketsSample ID: ECC-2BTRI Log #: E2280-14-05
STD.PARAMETER TEST REPLICATE NUMBER MEAN DEV.
Tensile Properties 1 2 3 4 5 6 7 8 9 10(ASTM D 6818)
MD - Maximum Load (lb/in) 18.7 26.3 16.1 21.6 23.6 21.2 4.0TD - Maximum Load (lb/in) 20.4 14.7 13.7 11.4 15.1 15.0 3.3
MD - Elongation @ Max. Load (%) 10.7 10.7 11.3 10.0 12.0 10.9 0.8TD - Elongation @ Max. Load (%) 15.3 19.3 18.7 18.0 18.0 17.9 1.5
Thickness (ASTM D 6525)
Thickness (mils) 242 258 226 239 222 209 257 252 215 211 233 19
Water Absorption (ASTM D 1117/ECTC TASC 00197)
Pre-Soak Weight (grams) 22.9 25.1 23.7 18.6 24.7 23.0 2.3Post-Soak Weight (grams) 65.0 74.7 59.1 51.0 60.3 62.0 7.8
Weight Change (grams) 42.1 49.6 35.4 32.4 35.6 39.0 6.2% Weight Change 183.6 197.5 149.4 174.2 144.1 169.7 20.3
Light Penetration (ASTM D 6567)
Baseline Reading 321 321 321 321 321 321 0Reading with sample 43 70 41 32 49 47 14
% Light Penetration 13.4 21.8 12.8 10.0 15.3 14.6 4.4% Ground Cover 86.6 78.2 87.2 90.0 84.7 85.4 4.4
Mass/Unit Area (ASTM D 6475)
Mass of 12 x 14 in specimen (g) 33.6 36.33 37.05 49.52 40.13Mass/unit area (oz/sq.yd) 9.13 9.88 10.07 13.46 10.91 10.69 1.50Mass/unit area (g/sq. meter) 310 335 342 457 370 363 51
MD Machine DirectionTD Machine Direction
The testing herein is based upon accepted industry practice as well as the test method listed. Test results reported herein do not applyto samples other than those tested. TRI neither accepts responsibility for nor makes claim as to the final use and purpose of the material.TRI observes and maintains client confidentiality. TRI limits reproduction of this report, except in full, without prior approval of TRI.

3:1 Slope
50 100 150 50 100 150 50 100 150 50 100 150
CONTROL 44.8 124.5 237.2 20.743 0.0167 47.7 109.8 252.6
ECC-2B 3.0 7.5 9.3 15.05 16.63 25.63 1.9012 0.0113 3.4 5.9 10.4 14.24 18.58 24.25
C-Factor 0.07 0.06 0.04 0.070 0.054 0.041
Erosion Control Product Testing Summary
Calculated Soil Loss Basedon Regression (g)
STANDARD INDEX TEST METHOD FOR the DETERMINATION of UNVEGETATED ROLLED EROSION CONTROL PRODUCT (RECP)ABILITY TO PROTECT SOIL FROM RAIN SPLASH AND ASSOCIATED RUNOFF UNDER BENCH-SCALE CONDITIONS
ECTC Test Method #2:
* soil loss ratio = soil loss of unprotected surface (I.e. control) divided by soil loss with protected surface = 1 / C-Factor
Soil Loss Ratio* Based onRegression
SurfaceCondition
Rain Intensity, mm/hr Rain Intensity, mm/hr Rain Intensity, mm/hr Rain Intensity, mm/hr
Raw Soil Loss Data (g) Soil Loss Ratio* Based onRaw Data Regression Curve
Fitting
RECP Erosion Control Product - Soil Loss vs. Intensity
y = 0.12x1.5123
R20.9996 =
y = 0.0487x1.0643
R20.9618 =
0.0
50.0
100.0
150.0
200.0
250.0
0 20 40 60 80 100 120 140 160
Rainfall Intensity (mm/hr)
So
ilL
oss
(g)
CONTROL ECC-2B Power (CONTROL ) Power (ECC-2B)
RECP Erosion Control Product - Soil Loss vs. Intensity
y = 20.743e0.0167x
R2 = 0.9832
y = 1.9012e0.0113x
R2 = 0.8844
0.0
50.0
100.0
150.0
200.0
250.0
300.0
0 20 40 60 80 100 120 140 160
Rainfall Intensity (mm/hr)
So
ilL
oss
(g)
CONTROL ECC-2B Expon. (CONTROL ) Expon. (ECC-2B)

Client: NTPEP Mass/Area (osy)Mfr: East Coast Erosion Blankets 10.69
TRI Log # E2280-14-05Sample ID: ECC-2B
Slope = 3 TO 1
2 in/hr rainfallBuckets weighed and volume measured every 5 min Bucket 1 Bucket 2 Bucket 3Test duration: 30 min Mass Mass Mass
94.72 92.35 86.36
Time(min)
Bucket No.Runoff
Volume (ml) Mass(g)Runoff
Volume (ml) Mass(g)Runoff
Volume (ml) Mass(g)Runoff
Volume (ml) Mass(g)Runoff
Volume (ml) Mass(g)Runoff
Volume (ml) Mass(g)Total RunoffVolume (ml)
Average TotalRunoff Volume
(ml)1 374 8.06 428 9.08 454 9.14 428 7.24 556 7.28 437 9.08 26782 395 9.43 485 10.16 460 8.01 442 7.02 372 8.37 471 6.21 2623 25703 328 5.21 409 6.30 423 6.49 406 5.54 412 5.97 432 5.86 2410
Average 7.6 8.5 7.9 6.6 7.2 7.1
Time(min)Total RunoffVolume (ml)
Average TotalRunoff Volume
(ml)Mass Average Mass Average Mass Average Mass Average Mass Average Total Average 2545
Bucket No. Soil Loss(g) Soil Loss(g) Soil Loss(g) Soil Loss(g) Soil Loss(g) Soil Loss(g) Soil Loss(g) Soil Loss(g) Soil Loss(g) Soil Loss(g) Soil Loss(g) Soil Loss(g) 2593 2515Cumulative 1 8.06 17.15 26.29 33.52 40.80 49.88 2408
soil loss 2 9.43 7.6 19.59 16.1 27.60 24.0 34.62 30.6 42.99 37.8 49.20 44.83 5.21 11.51 18.00 23.54 29.51 35.38
Avg Mass/Area (osy): 10.69
Time(min)
Bucket No.Runoff
Volume (ml) Mass(g)Runoff
Volume (ml) Mass(g)Runoff
Volume (ml) Mass(g)Runoff
Volume (ml) Mass(g)Runoff
Volume (ml) Mass(g)Runoff
Volume (ml) Mass(g)1 263 1.14 427 0.67 433 0.22 458 0.09 469 0.08 496 0.01 94.72 360 12.022 275 1.82 422 0.83 422 0.29 460 0.21 485 0.12 529 0.09 92.35 360 11.723 261 0.92 398 0.55 417 0.36 445 0.25 432 0.03 455 0.59 86.36 360 10.96
Average 1.3 0.7 0.3 0.2 0.1 0.2
Time(min)Mass Average Mass Average Mass Average Mass Average Mass Average Total Average Total Average
Bucket No. Soil Loss(g) Soil Loss(g) Soil Loss(g) Soil Loss(g) Soil Loss(g) Soil Loss(g) Soil Loss(g) Soil Loss(g) Soil Loss(g) Soil Loss(g) Soil Loss(g) Soil Loss(g) Soil Loss(g) Soil Loss(g)Cumulative 1 1.14 1.81 2.03 2.12 2.20 2.21 2.48
soil loss 2 1.82 1.3 2.65 2.0 2.94 2.3 3.15 2.5 3.27 2.5 3.36 2.8 3.68 2.983 0.92 1.47 1.83 2.08 2.11 2.70 2.77
Control
RECP Protected
5 10 15 20 25 30
IndividualSpecimenMass (g)
IndividualSpecimenArea (in2)
IndividualSpecimen
Mass/Area (osy)
30 Normalized
30
5 10 15 20 25 30
5 10 15
RECP over Soil
25
20 25
10 15 20
RECP Slope Simulation Test
Soil only
305
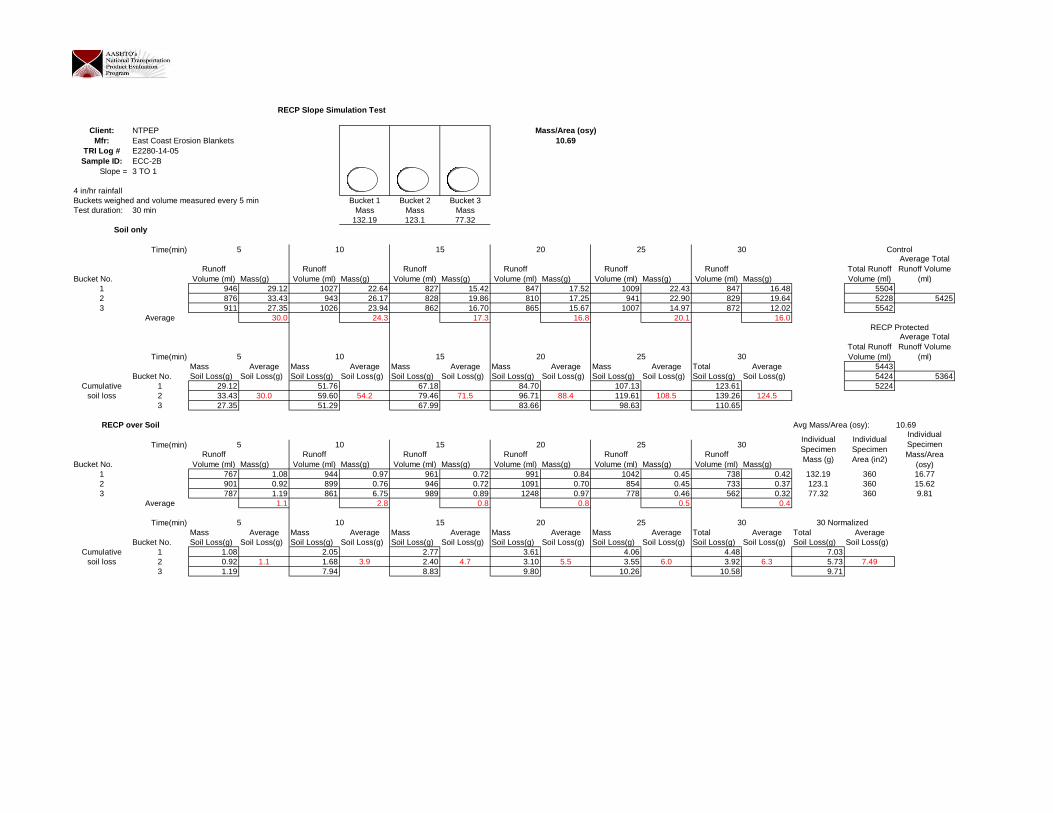
Client: NTPEP Mass/Area (osy)Mfr: East Coast Erosion Blankets 10.69
TRI Log # E2280-14-05Sample ID: ECC-2B
Slope = 3 TO 1
4 in/hr rainfallBuckets weighed and volume measured every 5 min Bucket 1 Bucket 2 Bucket 3Test duration: 30 min Mass Mass Mass
132.19 123.1 77.32
Time(min)
Bucket No.Runoff
Volume (ml) Mass(g)Runoff
Volume (ml) Mass(g)Runoff
Volume (ml) Mass(g)Runoff
Volume (ml) Mass(g)Runoff
Volume (ml) Mass(g)Runoff
Volume (ml) Mass(g)Total RunoffVolume (ml)
Average TotalRunoff Volume
(ml)1 946 29.12 1027 22.64 827 15.42 847 17.52 1009 22.43 847 16.48 55042 876 33.43 943 26.17 828 19.86 810 17.25 941 22.90 829 19.64 5228 54253 911 27.35 1026 23.94 862 16.70 865 15.67 1007 14.97 872 12.02 5542
Average 30.0 24.3 17.3 16.8 20.1 16.0
Time(min)Total RunoffVolume (ml)
Average TotalRunoff Volume
(ml)Mass Average Mass Average Mass Average Mass Average Mass Average Total Average 5443
Bucket No. Soil Loss(g) Soil Loss(g) Soil Loss(g) Soil Loss(g) Soil Loss(g) Soil Loss(g) Soil Loss(g) Soil Loss(g) Soil Loss(g) Soil Loss(g) Soil Loss(g) Soil Loss(g) 5424 5364Cumulative 1 29.12 51.76 67.18 84.70 107.13 123.61 5224
soil loss 2 33.43 30.0 59.60 54.2 79.46 71.5 96.71 88.4 119.61 108.5 139.26 124.53 27.35 51.29 67.99 83.66 98.63 110.65
Avg Mass/Area (osy): 10.69
Time(min)
Bucket No.Runoff
Volume (ml) Mass(g)Runoff
Volume (ml) Mass(g)Runoff
Volume (ml) Mass(g)Runoff
Volume (ml) Mass(g)Runoff
Volume (ml) Mass(g)Runoff
Volume (ml) Mass(g)1 767 1.08 944 0.97 961 0.72 991 0.84 1042 0.45 738 0.42 132.19 360 16.772 901 0.92 899 0.76 946 0.72 1091 0.70 854 0.45 733 0.37 123.1 360 15.623 787 1.19 861 6.75 989 0.89 1248 0.97 778 0.46 562 0.32 77.32 360 9.81
Average 1.1 2.8 0.8 0.8 0.5 0.4
Time(min)Mass Average Mass Average Mass Average Mass Average Mass Average Total Average Total Average
Bucket No. Soil Loss(g) Soil Loss(g) Soil Loss(g) Soil Loss(g) Soil Loss(g) Soil Loss(g) Soil Loss(g) Soil Loss(g) Soil Loss(g) Soil Loss(g) Soil Loss(g) Soil Loss(g) Soil Loss(g) Soil Loss(g)Cumulative 1 1.08 2.05 2.77 3.61 4.06 4.48 7.03
soil loss 2 0.92 1.1 1.68 3.9 2.40 4.7 3.10 5.5 3.55 6.0 3.92 6.3 5.73 7.493 1.19 7.94 8.83 9.80 10.26 10.58 9.71
Control
RECP Protected
5 10 15 20 25 30
3025
IndividualSpecimenMass (g)
IndividualSpecimenArea (in2)
IndividualSpecimenMass/Area
(osy)
30 Normalized
15 20
RECP Slope Simulation Test
Soil only
5 10 15 20
RECP over Soil
255 30
5 10 15 20 25 30
10
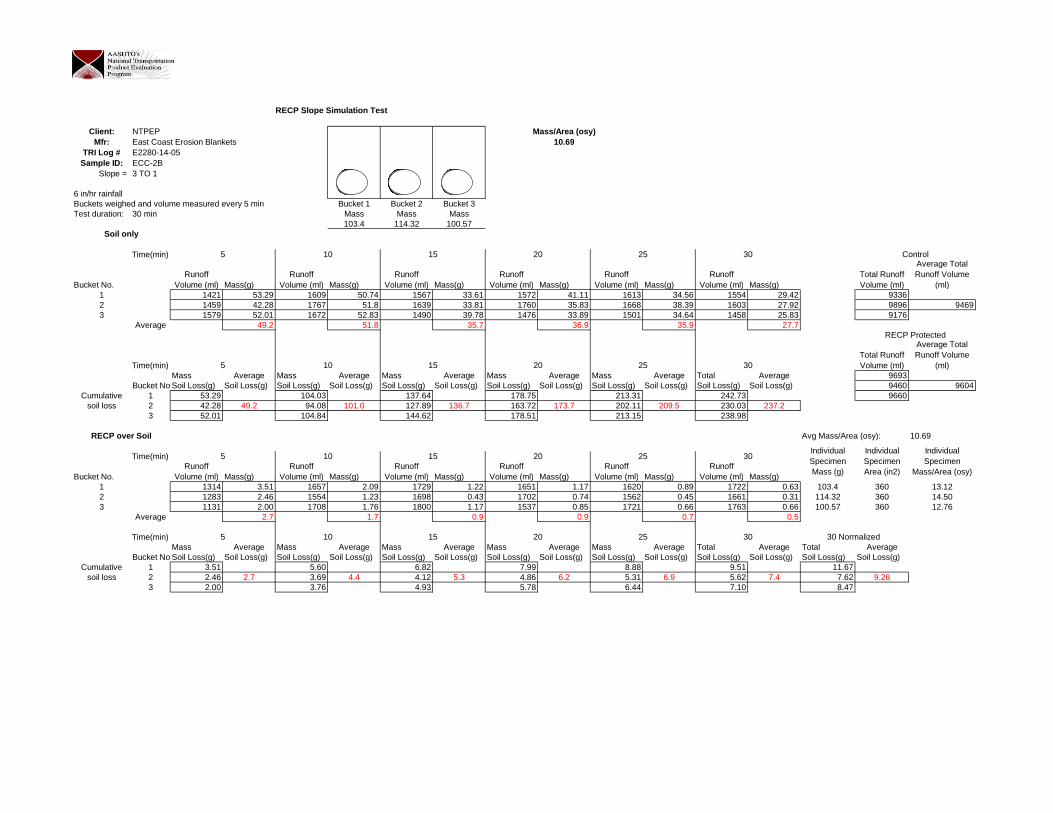
Client: NTPEP Mass/Area (osy)Mfr: East Coast Erosion Blankets 10.69
TRI Log # E2280-14-05Sample ID: ECC-2B
Slope = 3 TO 1
6 in/hr rainfallBuckets weighed and volume measured every 5 min Bucket 1 Bucket 2 Bucket 3Test duration: 30 min Mass Mass Mass
103.4 114.32 100.57
Time(min)
Bucket No.Runoff
Volume (ml) Mass(g)Runoff
Volume (ml) Mass(g)Runoff
Volume (ml) Mass(g)Runoff
Volume (ml) Mass(g)Runoff
Volume (ml) Mass(g)Runoff
Volume (ml) Mass(g)Total RunoffVolume (ml)
Average TotalRunoff Volume
(ml)1 1421 53.29 1609 50.74 1567 33.61 1572 41.11 1613 34.56 1554 29.42 93362 1459 42.28 1767 51.8 1639 33.81 1760 35.83 1668 38.39 1603 27.92 9896 94693 1579 52.01 1672 52.83 1490 39.78 1476 33.89 1501 34.64 1458 25.83 9176
Average 49.2 51.8 35.7 36.9 35.9 27.7
Time(min)Total RunoffVolume (ml)
Average TotalRunoff Volume
(ml)Mass Average Mass Average Mass Average Mass Average Mass Average Total Average 9693
Bucket No.Soil Loss(g) Soil Loss(g) Soil Loss(g) Soil Loss(g) Soil Loss(g) Soil Loss(g) Soil Loss(g) Soil Loss(g) Soil Loss(g) Soil Loss(g) Soil Loss(g) Soil Loss(g) 9460 9604Cumulative 1 53.29 104.03 137.64 178.75 213.31 242.73 9660
soil loss 2 42.28 49.2 94.08 101.0 127.89 136.7 163.72 173.7 202.11 209.5 230.03 237.23 52.01 104.84 144.62 178.51 213.15 238.98
Avg Mass/Area (osy): 10.69
Time(min)
Bucket No.Runoff
Volume (ml) Mass(g)Runoff
Volume (ml) Mass(g)Runoff
Volume (ml) Mass(g)Runoff
Volume (ml) Mass(g)Runoff
Volume (ml) Mass(g)Runoff
Volume (ml) Mass(g)1 1314 3.51 1657 2.09 1729 1.22 1651 1.17 1620 0.89 1722 0.63 103.4 360 13.122 1283 2.46 1554 1.23 1698 0.43 1702 0.74 1562 0.45 1661 0.31 114.32 360 14.503 1131 2.00 1708 1.76 1800 1.17 1537 0.85 1721 0.66 1763 0.66 100.57 360 12.76
Average 2.7 1.7 0.9 0.9 0.7 0.5
Time(min)Mass Average Mass Average Mass Average Mass Average Mass Average Total Average Total Average
Bucket No.Soil Loss(g) Soil Loss(g) Soil Loss(g) Soil Loss(g) Soil Loss(g) Soil Loss(g) Soil Loss(g) Soil Loss(g) Soil Loss(g) Soil Loss(g) Soil Loss(g) Soil Loss(g) Soil Loss(g) Soil Loss(g)Cumulative 1 3.51 5.60 6.82 7.99 8.88 9.51 11.67
soil loss 2 2.46 2.7 3.69 4.4 4.12 5.3 4.86 6.2 5.31 6.9 5.62 7.4 7.62 9.263 2.00 3.76 4.93 5.78 6.44 7.10 8.47
Control
RECP Protected
5 10 15 20 25 30
IndividualSpecimenMass (g)
IndividualSpecimenArea (in2)
IndividualSpecimen
Mass/Area (osy)
30 Normalized
30
5 10 15 20 25 30
5 10 15
RECP over Soil
25
20 25
10 15 20
RECP Slope Simulation Test
Soil only
305

Shear Stress vs Soil Loss
y = 12.441e1.3196x
R2 = 0.9882
y = 8687.8x1.4551
R2 = 0.9872
0.0
225.0
450.0
675.0
900.0
0 0.5 1 1.5 2 2.5 3 3.5 4 4.5 5
Shear Stress (psf)
So
ilL
oss
(g)
Sand only
450 g = 1/2-in soil loss
ECTC Test Method #3:STANDARD INDEX TEST METHOD FOR the DETERMINATION of UNVEGETATED ROLLED EROSION CONTROL PRODUCT (RECP)
ABILITY TO PROTECT SOIL FROM HYDRAULICALLY-INDUCED SHEAR STRESSES UNDER BENCH-SCALE CONDITIONS
Note: Shear stress ratio = 2.72 / 0.1 = 27.2
ECC-2B

rpm soil loss(g) shear stress(psf)CLIENT: East Coast Erosion Blankets 16 728 0.188TRI Log # E2280-14-05 20 1292 0.256Sample ID: ECC-2B 27 2387 0.42
RECP over soil
Test duration: 30 min RADIUS = 11RPM: 20 SQ FT = 0.4295 slope 7063.41Shear Stress (psf): 1.33 intercept -565.26
R squared 1.00Average Shear = 0 -565.26
Bucket No. Mass(g) prior to test Soil loss(g) Shear = 0.50 2966.441 3730 450 0.14 = 1/2-inch intercept2 3900 68.33 3910
rpm soil loss(g) shear stress(psf)20 68.3 1.33
RECP over soil 25 178.3 1.9430 346.7 2.56
Test duration: 30 min 3.74 12.44RPM: 25 450.51 2.72Shear Stress (psf): 1.94
AverageBucket No. Mass(g) prior to test Soil loss(g)
1 40152 3965 178.33 3870
RECP over soil
Test duration: 30 minRPM: 30Shear Stress (psf): 2.56
AverageBucket No. Mass(g) prior to test Soil loss(g)
1 38902 3960 346.73 4030
Comments: Buckets weighed under water
recp
soil only
3790 175
Mass(g) post test Soil loss(g)3755 260
3860 50
soil only
3770 100
RECP Channel Simulation Test
Mass(g) post test Soil loss(g)3660 703815 85
Mass(g) post test Soil loss(g)3430 4603690 2703720 310
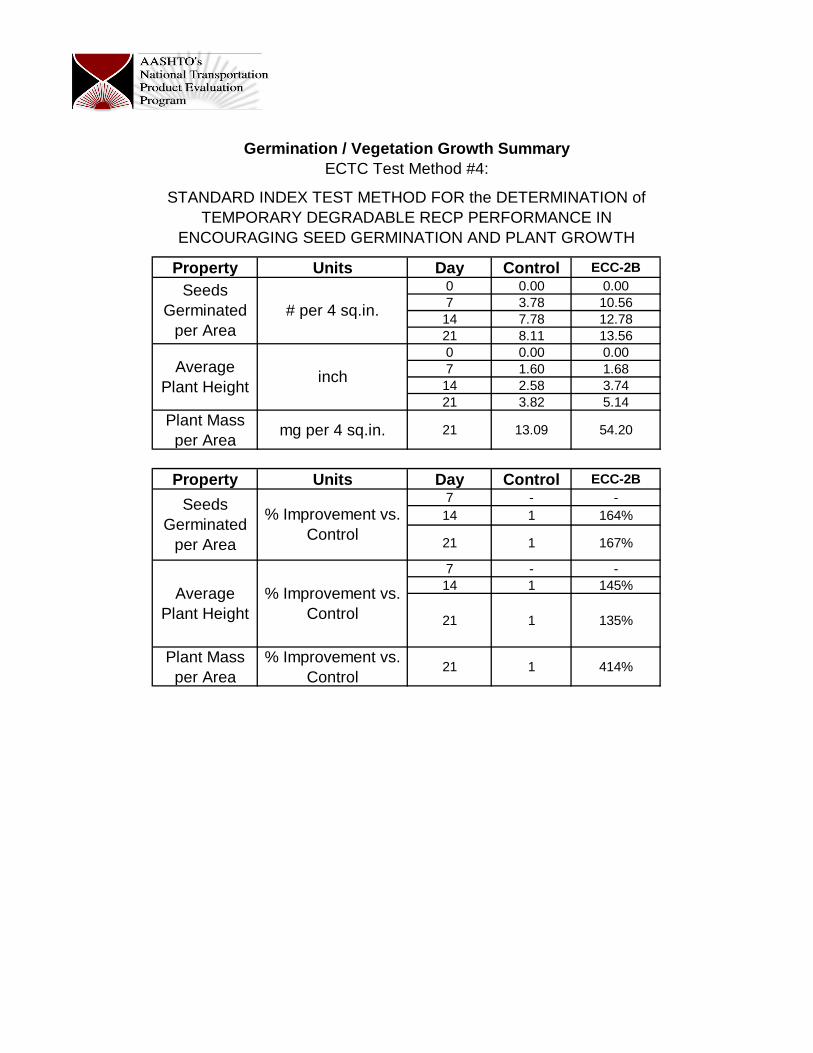
Property Units Day Control ECC-2B0 0.00 0.007 3.78 10.5614 7.78 12.7821 8.11 13.560 0.00 0.007 1.60 1.6814 2.58 3.7421 3.82 5.14
Plant Massper Area
mg per 4 sq.in. 21 13.09 54.20
Property Units Day Control ECC-2B7 - -14 1 164%
21 1 167%
7 - -14 1 145%
21 1 135%
Plant Massper Area
% Improvement vs.Control
21 1 414%
AveragePlant Height
% Improvement vs.Control
AveragePlant Height
inch
SeedsGerminated
per Area
% Improvement vs.Control
ECTC Test Method #4:
STANDARD INDEX TEST METHOD FOR the DETERMINATION ofTEMPORARY DEGRADABLE RECP PERFORMANCE IN
ENCOURAGING SEED GERMINATION AND PLANT GROWTH
Germination / Vegetation Growth Summary
SeedsGerminated
per Area# per 4 sq.in.

DateClient Top
TRI Log #Sample ID
Bottom
1 2 3 1 2 3 1 2 3 1 2 3 1 2 3 1 2 3 1 2 3 1 2 3 1 2 3
13 6 9 14 5 10 9 13 16 16 11 12 13 6 10 14 16 17 16 12 12 15 7 10 14 16 20
1.9 1.4 1.6 1.7 3.3 0.4 0.4 1.8 1.3 4.9 3.4 0.4 4 6 1.7 5 3.4 3.5 5.1 3.9 4.3 5.2 11.5 2.3 6.1 3.9 6.31.1 1.9 0.3 2.3 2.2 1.9 1.5 2.1 2.2 3 4.9 5.1 3.9 3.4 3.9 1.9 2.4 4.4 3.7 5.9 6 6.9 5.7 6.4 4.2 1.2 1.82.6 2 2.1 1.3 1.5 2.8 3 0.1 1.3 6.3 5.1 1.3 4.6 4.3 4.6 4.4 1 2.7 2.2 2.3 3.6 6 5.1 7.6 7.1 3.1 7.72.4 1.4 0.8 2.3 1 2.1 2.7 0.9 0.4 1.2 4.6 3.1 4.9 2.5 5.3 3.5 1.3 3.1 7.2 4.2 4.3 7.7 1 5.8 5.4 5.2 4.51.4 2.5 1 1.8 2.4 2.6 1.3 2.5 1.4 5 3.7 4.4 4.4 1.1 4.1 5.9 4.4 4.1 8.5 5.4 6.9 5.2 9.3 6.8 8.2 5.2 40.9 2.4 0.6 2.2 0.3 0.7 0.9 1.7 3.9 5.1 2.5 4.6 5.7 2 3 5.1 4.9 5.6 5.1 3.6 7.6 5.1 6.4 2.9 3.5 5.32.3 0.6 0.5 1.7 1.7 2.5 2.1 3.4 5.7 2.6 4.1 3.1 1.1 3 4.6 4.7 5.7 6.7 5.9 1.8 4.1 5.5 5.3 5.72 2.1 2 1.6 1.3 1.7 1.8 5.3 2.9 3.2 4.6 3.7 3.3 5 3.7 4 4 6 6.6 4 6.3 5.2 3
1.4 2 1.3 0.2 0.8 1.9 2.2 5.4 2.3 2.1 4.9 3 0.7 5.2 4.5 6 7 3.3 6.2 3.9 3.6 7.9 5.22.7 1.1 2.4 0.7 1.4 2.9 1.2 3.6 3.7 5.1 4.4 2.6 5.4 8.7 4.6 4.4 5.8 6.8 2.7 2.9 4.72 1.6 2.2 2.7 3.5 1.8 5.7 3.2 3 4.5 5.5 7.4 3.5 6.5 5 4 4.7 5.9
2.5 1.5 1 1.8 5.8 3.9 3.1 2.7 4.7 4.2 3.8 3.6 5.1 5.2 2.6 5.4 7.21.6 0.4 2.2 2.2 4.6 4.4 1.5 3.7 5 3.7 0.8 2.8 5.3 4.8
2.2 1.1 2.3 4.6 4.3 2.6 5.9 3.7 5.5 4.7 6.61.9 4.9 3.4 4.1 5.4 6.6 5.5 5.52.1 3.8 5.2 2.6 4.1 3.9 2.8
4.2 4.86.46.15.9
1.9 1.9 1.2 1.6 2.1 1.6 1.5 1.6 1.7 4.1 3.7 3.2 4.2 3.8 3.7 3.2 3.7 4.1 5.4 4.6 5.1 5.6 5.6 5.4 4.8 4.6 5.2
66.9 39.2 43.4 73.8 34.6 45 46.9 58.9 79.1
Day 1 2 3 4 5 6 7 8 9 10 11 12 13 14 15 16 17 18 19 20 21
Temp (27 +/- 2 C)Humidity (45 +/- 5 % RH)
Light Intensity (900 +/- 100 ft-cd)Water Added (ml) 500 400 400
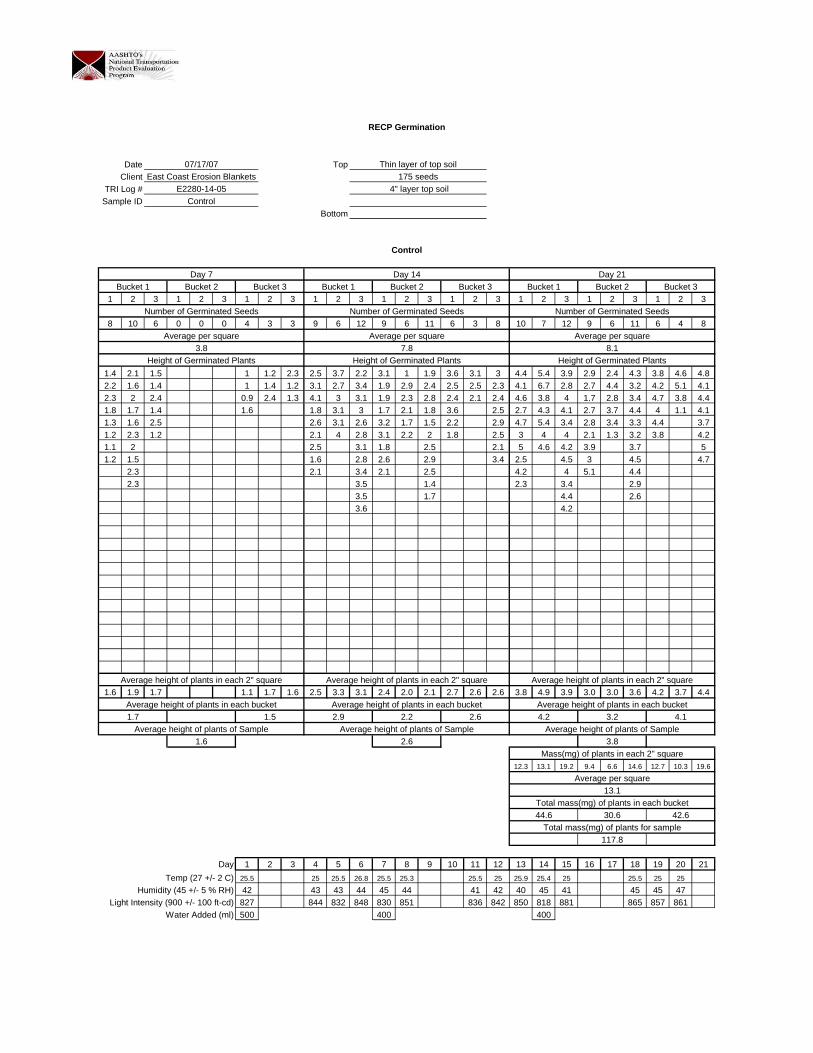
RECP Germination
Sample175 seeds
East Coast Erosion BlanketsE2280-14-05
10/15/07
Bucket 3 Bucket 2
4" layer top soilECC-2B
RECP PROTECTED
Day 7 Day 14 Day 21
Number of Germinated Seeds Number of Germinated Seeds Number of Germinated Seeds
Bucket 3 Bucket 1 Bucket 2Bucket 1 Bucket 3Bucket 1 Bucket 2
Height of Germinated Plants Height of Germinated Plants Height of Germinated Plants
Average height of plants in each 2" square Average height of plants in each 2" square Average height of plants in each 2" square
Average height of plants in each bucket Average height of plants in each bucket Average height of plants in each bucket5.6 4.81.7 1.8 1.6 3.7 3.9
Average height of plants of Sample Average height of plants of Sample Average height of plants of Sample3.7 5.0
1.7 3.7 5.1Mass(mg) of plants in each 2" square
Total mass(mg) of plants in each bucket149.5 153.4 184.9
Total mass(mg) of plants for sample487.8
Average per square Average per square Average per square10.6 12.8 13.6
Average per square54.2
Date TopClient
TRI Log #Sample ID
Bottom
1 2 3 1 2 3 1 2 3 1 2 3 1 2 3 1 2 3 1 2 3 1 2 3 1 2 3
8 10 6 0 0 0 4 3 3 9 6 12 9 6 11 6 3 8 10 7 12 9 6 11 6 4 8
1.4 2.1 1.5 1 1.2 2.3 2.5 3.7 2.2 3.1 1 1.9 3.6 3.1 3 4.4 5.4 3.9 2.9 2.4 4.3 3.8 4.6 4.82.2 1.6 1.4 1 1.4 1.2 3.1 2.7 3.4 1.9 2.9 2.4 2.5 2.5 2.3 4.1 6.7 2.8 2.7 4.4 3.2 4.2 5.1 4.12.3 2 2.4 0.9 2.4 1.3 4.1 3 3.1 1.9 2.3 2.8 2.4 2.1 2.4 4.6 3.8 4 1.7 2.8 3.4 4.7 3.8 4.41.8 1.7 1.4 1.6 1.8 3.1 3 1.7 2.1 1.8 3.6 2.5 2.7 4.3 4.1 2.7 3.7 4.4 4 1.1 4.11.3 1.6 2.5 2.6 3.1 2.6 3.2 1.7 1.5 2.2 2.9 4.7 5.4 3.4 2.8 3.4 3.3 4.4 3.71.2 2.3 1.2 2.1 4 2.8 3.1 2.2 2 1.8 2.5 3 4 4 2.1 1.3 3.2 3.8 4.21.1 2 2.5 3.1 1.8 2.5 2.1 5 4.6 4.2 3.9 3.7 51.2 1.5 1.6 2.8 2.6 2.9 3.4 2.5 4.5 3 4.5 4.7
2.3 2.1 3.4 2.1 2.5 4.2 4 5.1 4.42.3 3.5 1.4 2.3 3.4 2.9
3.5 1.7 4.4 2.63.6 4.2
1.6 1.9 1.7 1.1 1.7 1.6 2.5 3.3 3.1 2.4 2.0 2.1 2.7 2.6 2.6 3.8 4.9 3.9 3.0 3.0 3.6 4.2 3.7 4.4
12.3 13.1 19.2 9.4 6.6 14.6 12.7 10.3 19.6
Day 1 2 3 4 5 6 7 8 9 10 11 12 13 14 15 16 17 18 19 20 21
Temp (27 +/- 2 C) 25.5 25 25.5 26.8 25.5 25.3 25.5 25 25.9 25.4 25 25.5 25 25
Humidity (45 +/- 5 % RH) 42 43 43 44 45 44 41 42 40 45 41 45 45 47Light Intensity (900 +/- 100 ft-cd) 827 844 832 848 830 851 836 842 850 818 881 865 857 861
Water Added (ml) 500 400 400
Thin layer of top soil175 seeds
4" layer top soil
Control
Day 7
Average per square13.1
4.1
Number of Germinated Seeds
Average per square8.1
Height of Germinated Plants
Average height of plants in each 2" square
Average per square Average per square
Total mass(mg) of plants for sample117.8
Mass(mg) of plants in each 2" square
Total mass(mg) of plants in each bucket44.6 30.6 42.6
2.9 3.2
1.6 2.6 3.8
Average height of plants in each bucket4.2
Average height of plants of Sample Average height of plants of Sample Average height of plants of Sample1.7 1.5 2.2 2.6
Average height of plants in each 2" square Average height of plants in each 2" square
Average height of plants in each bucket Average height of plants in each bucket
Height of Germinated Plants Height of Germinated Plants3.8 7.8
RECP Germination
07/17/07East Coast Erosion Blankets
Bucket 1 Bucket 2Bucket 1 Bucket 2 Bucket 3Bucket 1
ControlE2280-14-05
Day 14 Day 21Bucket 3Bucket 3
Number of Germinated Seeds Number of Germinated Seeds
Bucket 2

Bucket # 1 ECC-2B Bucket # 1 Control
Bucket # 2 ECC-2B Bucket # 2 Control
Bucket # 3 ECC-2B Bucket # 3 Control
Germination / Vegetation Growth Summary
Photographs
STANDARD INDEX TEST METHOD FOR the DETERMINATION of TEMPORARY DEGRADABLERECP PERFORMANCE IN ENCOURAGING SEED GERMINATION AND PLANT GROWTH
ECTC Test Method #4:


![Index [lib3.dss.go.th]lib3.dss.go.th/fulltext/index/620-629/621.89hol2nded.pdf · 2010. 7. 2. · Index . Abrasion testing, 353--4 ball cratering test, 354 particle air-blast test,](https://img.dokumen.tips/doc/110x75/6126df1f5dd4a51a6740de6c/index-lib3dssgothlib3dssgothfulltextindex620-629621-2010-7-2.jpg)