Embed Size (px)
Citation preview
AAPA : Working Together With
COSCAP-SEA and NA
Joint COSCAP SEA & NA Meeting
31 August 2005, BKK
by
Martin ERAN-TASKER
Technical Director

• Introduction to AAPA
• Safety drivers, issues and response
• Regional stakeholder engagement
• Working together with COSCAP
• Discussion
Presentation outline

Background : AAPA
• Leading regional trade association representing 17 major international airlines based in Asia Pacific
• Committed to promoting sustainable growth of the aviation industry serving both passenger and freight needs
• Work with member airlines, governments, regulators and industry partners on issues of common concern
• Permanent Secretariat headquartered in Kuala Lumpur, Malaysia

Beijing
Fuzhou
Chengdu Shanghai
Harbin
Haikou
Hangzhou
Nanjing
Shenyang
Changchun
Kunming Guangzhou
Jinan
Changsha Chongqing
Wuhan
Xian
Ningbo
Yanji
Tianjin
Qingdao
Shenzhen
Guilin
Yantai
Dalian
Xiamen
Sanya
Urumqi
AAPA: Mainland China destinations
AAPA members serve a total of 28
Mainland Chinese cities
Flights/Week
1. Shanghai 280
2. Beijing 168
3. Xiamen 47
4. Guangzhou 44
5. Qingdao 39
6. Hangzhou 36
7. Kunming 24
8. Dalian 23
9. Chengdu 22
10. Tianjin 17
Over 800 flights per week

AAPA fleet and experience
Source: Airclaims’ world air fleet (as at 10 May 2005) - AAPA
• 1,300 aircraft
• 73% of the fleet is widebody
– Operating 25% of world’s widebody passenger fleet
– Operating 50% of world’s B744 fleet
– Operating 37% of world’s B777 fleet
– Operating 35% of world’s A330 fleet
• 46% of all new widebody orders for 2004
• 359 aircraft on order for delivery over the next 5 years (16 June
2005) Total order book value USD 51 billion
– 25% of A380 orders (USD 11.4b)
– 43% of B787 orders (USD 12.5b)
• Combined experience of 774 years, or a median of 46 years per
airline, skew of 0.02

Technical Affairs
Operations
Safety
Security Environment

AAPA Work Structure
ENVIRONMENTAL WORKING GROUP
(EWG)
PUBLIC RELATIONS MGR
WORKING GROUP
SECURITY COMMITTEE
(SC)
ENGINEERING & MAINTENANCE
WORKING GROUP (EMWG)
FLIGHT OPS & SAFETY
WORKING GROUP (FOSWG)
MATERIALS MANAGEMENT
WORKING GROUP (MMWG)
TECHNICAL COMMITTEE
(TC)
MANAGEMENT INFORMATION
WORKING GROUP
FRAUD PREVENTION
WORKING GROUP
DISTRIBUTION
WORKING GROUP
CARGO
WORKING GROUP
FACILITATION
WORKING GROUP
EMERGENCY RESPONSE
PLANNING WORKING GROUP
NORTH AMERICA
WORKING GROUP
AIRLINE SERVICES COMMITTEE
GATS TASK FORCE
AEROPOLITICAL COMMITTEE
EXECUTIVE COMMITTEE
ASSEMBLY OF PRESIDENTS

The Safety Drive
FSF and Boeing.com

The Safety Drive
• In 2004,
– USD35 billion accumulated losses since 2001
– Global traffic increased 15%
– Industry-wide hull loss rate declined by 10% to 0.78 hull losses per
million sectors flown
– 28 fatal accidents recorded
– 1.8 billion passengers carried, 428 fatalities
– 1 passenger fatality per 4.20m carried
• ICAO Universal Safety Oversight Audit Program (USOAP)
• United States – Data driven programs
• Europe – Established EASA
IATA - Western Built Aircraft
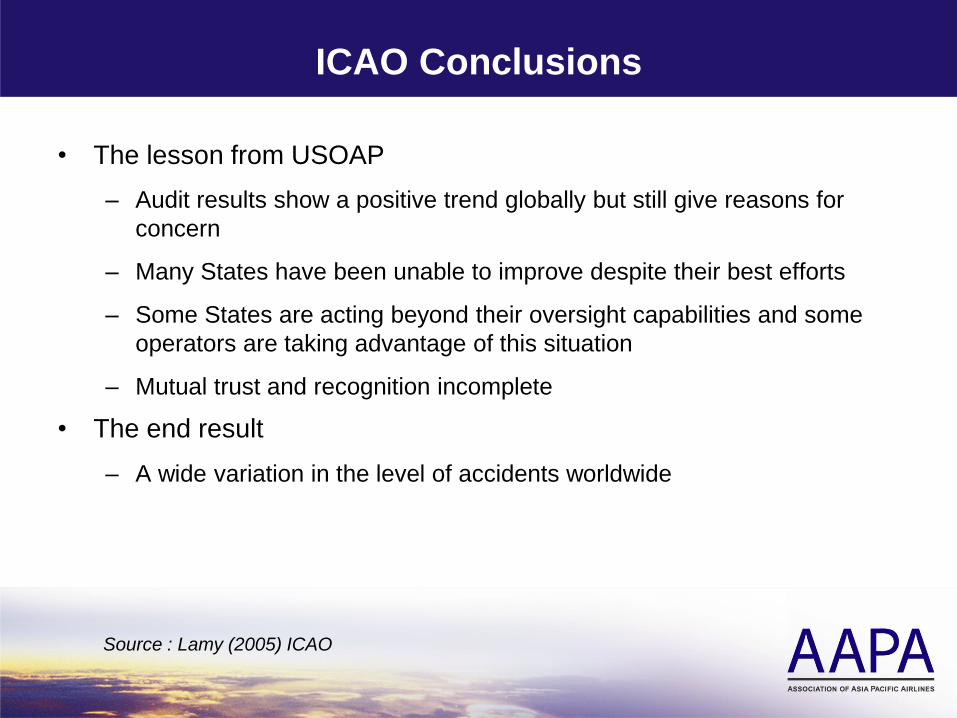
ICAO Conclusions
• The lesson from USOAP
– Audit results show a positive trend globally but still give reasons for
concern
– Many States have been unable to improve despite their best efforts
– Some States are acting beyond their oversight capabilities and some
operators are taking advantage of this situation
– Mutual trust and recognition incomplete
• The end result
– A wide variation in the level of accidents worldwide
Source : Lamy (2005) ICAO

Regional Accident Rates Western-built Transport Hull Loss Accident by Airline Domicile from 1994-2004
Accidents per
million departures
United States
and Canada
0.4
Latin America
and Caribbean
2.5
Europe
0.7
China
0.5
Middle East
2.41
Africa
11.7
Asia
1.7
Oceania
0.0
(Excluding
China)
JAA - 0.6
Non JAA – 1.2
C.I.S.1
World
0.73
1Insufficient fleet experience to generate reliable rate.
Source : Lamy (2005) ICAO

1995-2004 Fatal Accidents –
By Region of Occurrence
Source : Lamy (2005) ICAO

Average Accident Rate by Region of Operator
Scheduled ops, Fatal accidents per 1 000 000 Departures
by Region of the Operator
3.6
2.6
0.8
2.4
0.5
0.7
1.3
5.0
1.0
0.6
1.7
1.8
0.4
0.8
0.0 1.0 2.0 3.0 4.0 5.0 6.0
Africa
Asia/Pacific
Europe
LatinAmerica/Caribbean
Middle East
North America
World Average
1995-1999 2000-2004
Source : Lamy (2005) ICAO

2004 Hull Loss Rates by Region
1.3
5.2
5.3
0.94
Hull losses per million
departures by region of
operator, Western-built
Jets 2004
0.52 0.29
Source IATA
World Average 0.78 per million sectors

0.00
0.40
0.80
1.20
1.60
2.00
1992 1993 1994 1995 1996 1997 1998 1999 2000 2001 2002
5 year running average
Cooperative efforts are bringing accident rate
down
Hull Loss Accident Rate Worldwide Commercial Jets (>60,000 lbs, non-CIS) Through 31 December 2002
FSF
CFIT/ALAR
Industry effort
starts CAST/JSSI
begins PAAST
begins
Ra
te p
er
mil
lio
n d
ep
art
ure
s
COSCAP safety teams
(SARAST, SEARAST
And NARAST)

Working Together
Asia-Pacific
• Highly diverse: multiple governments and regulators
• Need for regional co-operation on multilateral basis
• Address common concerns
• Importance of cost-benefit analysis
• Harmonisation: share best practices

Working together model
AAPA
Manufacturers
Regulators
Aviation
Associations

Stakeholder Engagement
• Manufacturers
– Airframe and Engine OEMs
– Training outfits like Jeppessen
– Safety system managers like Du Pont
• Aviation Associations
– AEA, ATA, IATA, FSF, IFALPA
• Regulators
– ICAO Asia Pacific Council Representatives (7 States)
– FAA, JAA, EASA
– CAST
– Asia Pacific CAAs
– ICAO COSCAP – a vital link for the AAPA to the region’s CAAs

Regional Safety Stakeholders
COSCAP SEA
(TG) Thailand
(MH) Malaysia
(SQ) Singapore
(VN) Vietnam
(GA) Indonesia
(PR) Philippines
(CX/KA) Hong Kong SAR
Macau SAR
COSCAP NA
(KE/OZ) South Korea
PR China
Mongolia
DPR Korea
AAPA
QF (Australia)
NZ (New Zealand)
JL/NH (Japan)
BI (Brunei)
Non-AAPA
AAPA RTL
Myanmar (MH/TG)
Lao PDR (TG)
Cambodia (MH/TG)

Working together with COSCAP
• Information sharing
• TCAS-RA
• Human Factors
• Bird Strike
• GAP
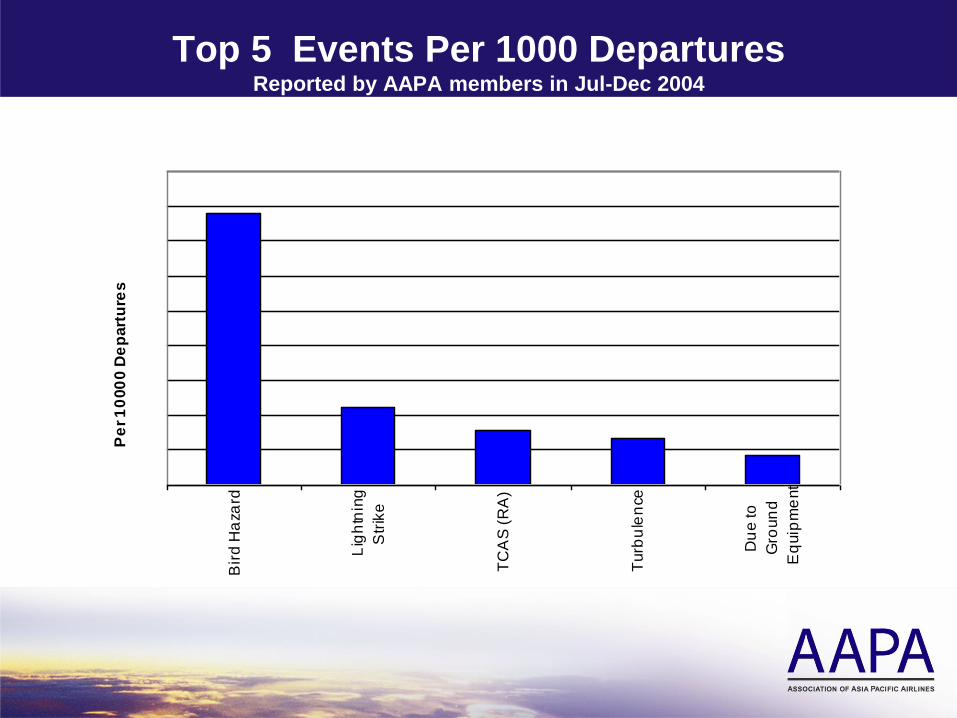
Top 5 Events Per 1000 Departures Reported by AAPA members in Jul-Dec 2004
Bir
d H
aza
rd
Lig
htn
ing
Str
ike
TC
AS
(R
A)
Turb
ule
nce
Du
e to
Gro
un
d
Eq
uip
me
nt
Pe
r 1
000
0 D
ep
art
ure
s

Working Together – Information Exchange
• AAPA Action Plan :
– Safety Information Exchange
– Regional position and
formulate action strategy
– FSF CFIT/ALAR Tool kit
– AAPA regional team leaders
(PR, GA, MH, TG)
– Exchange of LOSA type
experience
– Exchange of airport/ATC
hazard information
– Regional position in response
to proposed regulatory
rulemaking
– AAPA Aviation Safety Seminar
Q2 2006
• Working together plans:
– Periodically update COSCAP on information exchange output and strategy formulation
– Extend strategy catchment to include non-AAPA members and regulators
– AAPA jointly coordinates working seminars in each target country on “road show” basis
– Availability of safety consultants, virtual or physical
– Assist in guidance principles
– Invitation to regional seminars (no fees) and email information

High TCAS-RA Rate June-Dec 2004 Reported by AAPA Members
AIRPORTS WITH HIGH TCAS RA RATE
19.23
15.15
12.66
12.30
10.75
10.00
9.52
6.76
6.73
6.45
6.13
6.06
4.49
4.42
4.13
4.00
3.74
3.17
3.08
2.44
0.00 5.00 10.00 15.00 20.00 25.00
MAD (Madrid)
NOU (Nourrea)
JED (Jeddah)
SFO (San Francisco)
EWR (Newark)
SEA (Seattle)
IST (Istanbul)
NYC (New York)
SYD (Sydney)
CGQ (Changchun)
BNA (Nashville)
DFW (Dallas)
LAX (Los Angeles)
CMB (Colombo)
JFK (New York)
NKG (Nanking)
KUL (Kuala Lumpur)
FRA (Frankfurt)
CDG (Paris)
LHR (London Heathrow)
Rate (1000 Departures)

High TCAS-RA Rate June-Dec 2004 Reported by >4 AAPA Members
5 Airports with highest TCAS RA Rate
(Reported by more than 4 airlines)
12.30
4.49
2.44
0.53
0.46
0.00 2.00 4.00 6.00 8.00 10.00 12.00 14.00
SFO (San Francisco)
LAX (Los Angeles)
LHR (London Heathrow)
SIN (Singapore)
TPE (Taipei)
Rate (1000 Departures)

Working Together – TCAS-RA
• AAPA Action Plan :
– Regional position and
formulate action strategy
– Work with other regional
associations to exchange
findings and to formulate
strategy
– Engage ATC and airports
– Look into airline practices at
TCAS-RA prone airports
• Working together plans:
– Periodically update COSCAP
on information exchange
output and strategy
formulation
– Extend strategy catchment to
include non-AAPA members
and regulators
– Inputs to COSCAP
intervention plans on TCAS-
RA events
– Assist in guidance principles

Source : Johnson (2005), FAA

Working Together – Human Factors
• AAPA Action Plan :
– Regional position and
formulate action strategy
– Structured HF initiatives in
both cockpit and maintenance.
– Human Factors Workshop for
Engineering and Maintenance,
28-29 November in Kuala
Lumpur (Confirmed) and 30 –
1 December Beijing (TBC)
• Check website
www.AAPAirlines.org
• Working together with
COSCAP :
– AAPA jointly coordinates
working seminars in each
target country on “road show”
basis
– Availability of HF consultants,
virtual or physical

Bird Strike (without Damage) rate Jul-Dec 2004 Reported by AAPA Members
Bird Strike RateIncidents not causing damage
7.13
5.53
3.57
3.26
2.84
2.59
2.59
2.24
1.02
0.86
0.83
0.00 1.00 2.00 3.00 4.00 5.00 6.00 7.00 8.00
SGN
PEK
AMS
CGK
BKK
LAX
LHR
FUK
HKG
KUL
TPE
Rate (1000 Departures)

Bird Strike (with Damage) rate Jul-Dec 2004 Reported by AAPA Members
Bird Strike RateIncidents causing damage
1.19
0.60
0.40
0.34
0.10
0.09
0.07
0.04
0.00 0.20 0.40 0.60 0.80 1.00 1.20 1.40
AMS
TWU
DUD
KHH
HND
NRT
CHC
AKL
Rate (1000 Departures)

Working Together – Bird Hazard
• AAPA Action Plan :
– Safety Information Exchange
– Determine position and
formulate action strategy on
airport to airport basis
– Engage airports
– Carry out surveys
– Provide bird hazard
management proposals
– Seek government/community
assistance
– Organise bird hazard
management training
– In progress : CGK
– Future : SGN and BJS
• Working together plans:
– Periodically update COSCAP
on information exchange
output and strategy
formulation
– Extend strategy catchment to
include non-AAPA members
and regulators
– AAPA jointly coordinates
working seminars in each
target country on “road show”
basis
– Availability of bird hazard
management consultants,
virtual or physical

Va
lue
Pro
po
sit
ion
FSF Ground Accident Prevention
Proactive Reactive
Safety Excellence Enhances Airline Cost Structure &
Customer / Public Recognition
Customer Focus
Contractor Integration
Functional Integration Management System
and Engaged Leadership
One industry Focus &
Uniform Standards
Compliance Focused
Reactionary
Crisis Management &
Emergency Response
• Leadership Accountability
• Embedded in Culture
• Line Management Ownership
• Best in Class Metrics
• Relentless Execution
Current Industry Focus
Integration at Airports
????????????

Working Together - GAP
• AAPA Action Plan :
– Regional position and
formulate strategy
– Safety Information Exchange
– Collaborate with FSF on GAP
– With FSF, coordinate with
AAPA regional team leaders
– A potential ground accident
prevention programme
workshop
• Working together plans:
– Periodically update COSCAP
on information exchange
output and strategy
formulation
– Extend strategy catchment to
include non-AAPA members
and regulators
– AAPA jointly coordinates
working seminars in each
target country on “road show”
basis
– Invitation to regional seminars
(no fees) and email
information

Working together
• AAPA is committed to working together with other industry stakeholders
• Committed to improving regional & global harmonization in both technical and non-technical regulatory policies
• Good working relationships with ICAO, FAA, EASA, DGCAs, other trade associations, governments and regulators
• Keen to engage in constructive dialogue and promote strategic partnerships

Discussion
• Which of the proposals would COSCAP see value in pursuing with
the AAPA?
– Information exchange
– Human factors – engineering and operations
– Bird Hazard
– High Rate TCAS-RA
– Ground Accidents Prevention
• How could AAPA better support the role and function of COSCAP?
• What deliverables are likely in the short and medium term from
collaboration between AAPA and COSCAP?

But never forget: this is a great industry !
• 100 years ago the Wright brothers made their first flight
• 50 years ago: 9 million passengers
• Today: 1,800 million people flew safely last year
• Fares per seat mile are cheaper than driving a car
• Modern jet aircraft are as fuel efficient as compact cars
• Air cargo delivers 35% of global trade by value
We collectively own the world safety record and it is important that we all have a coherent
multilateral approach to safety Lamy (2005) ICAO

Martin ERAN-TASKER, Technical Director
ASSOCIATION OF ASIA PACIFIC AIRLINES
www.aapairlines.org


![COSCAP BAGASO · coscap-bagaso manual of validation and surveillance of foreign air operators provisional - 2009 control number: 000 [coscap-bagaso] doc.6633](https://img.dokumen.tips/doc/110x75/5e7de87fce4b2d11991f246c/coscap-bagaso-coscap-bagaso-manual-of-validation-and-surveillance-of-foreign-air.jpg)