Embed Size (px)
Citation preview

© Orthopaedic Practice in the US 2016 1 Survey work is conducted for the benefit of and is owned by the AAOS. Not to be duplicated without consent. January 2017
ORTHOPAEDIC PRACTICE IN THE U.S. 2018
AAOS Department of Clinical Quality and Value
January 2019

© Orthopaedic Practice in the US 2018 Survey work is conducted for the benefit of and is owned by the AAOS. Not to be duplicated without consent. January 2019
2
TABLE OF CONTENTS
I. EXECUTIVE SUMMARY ............................................................................................. 3 II. INTRODUCTION .......................................................................................................... 4 III. METHODOLOGY ....................................................................................................... 4 IV. ORTHOPAEDIC SURGEON DENSITY .................................................................... 6
DENSITY BY DIVISION ..........................................................................................9 AVERAGE AGE BY STATE ..................................................................................11 GENDER BY STATE ..............................................................................................12
V. PRACTICING ORTHOPAEDIC SURGEON CHARACTERISITCS ...................... 15 AGE OF CENSUS RESPONDENTS .......................................................................15 GENDER ..................................................................................................................18 RACE/ETHNICITY .................................................................................................20 ORTHOPAEDIC SOCIETY MEMBERSHIP .........................................................23 WORK STATUS ......................................................................................................24 PRACTICE SETTING .............................................................................................26 PRACTICE SIZE ......................................................................................................29 DEGREE OF SPECIALIZATION ...........................................................................30 SPECIALTY AREAS ...............................................................................................32 WORK HOURS ........................................................................................................35 TIME AWAY FROM PRACTICE...........................................................................39 DAYS AWAY FOR EDUCATION .........................................................................41 PATIENTS BY PAYOR SOURCE ..........................................................................43 NUMBER OF SURGICAL PROCEDURES PERFORMED PER MONTH ..........47 SPECIFIC PROCEDURES PERFORMED PER MONTH .....................................51
VI. APPENDIX A: 2018 Orthopaedic Surgeon Census Survey Questionnaire ............... 54 VII. APPENDIX B: US Census Division ......................................................................... 59 VIII. APPENDIX C: Open Ended Responses .................................................................. 60 IX. APPENDIX D: Table of Figures ................................................................................ 68
© Orthopaedic Practice in the US 2018 Survey work is conducted for the benefit of and is owned by the AAOS. Not to be duplicated without consent. January 2019
3
I. EXECUTIVE SUMMARY
1) The AAOS has conducted an Orthopaedic Surgeon Census biennially since 1985 to update surgeon and practice information in the AAOS database. Information in this report is based on the most recent census of 30,141 orthopaedists on record with the AAOS.
2) Montana, Vermont, Wyoming, Alaska, and South Dakota have the highest density of orthopaedic surgeons (13 and over per 100,000 population). Mississippi, Texas, Nevada, Arkansas, and Oklahoma have the lowest surgeon density (below 8 per 100,000 population).
3) The average age of practicing orthopaedists is 56.5 years. The AAOS membership is made up of 92.2% male and 5.8% female (2.0% did not indicate their gender).
4) The primary reported race was Caucasian (85.9 %), followed by Asian (6.1%).
5) The orthopaedic workforce is made up of 89.9% employed full-time, and 10.1% part-time.
6) The largest proportion of respondents practice in Private Practice – orthopaedic group setting (36%, +/- 1.27), with an additional 17% (+/- 1.01) in Hospital/Medical Center and 14% (+/- .91) in Academic Practice (salary from institution).
7) Sixty percent (+/-1.67) of respondents are specialists, 25% (+/-2.29) are general orthopaedic surgeons with specialty interest, and 15% (+/-2.44) are generalists.
8) The three most-frequently cited areas of practice are sports medicine (18.2%), total joint (14.4%), and hand (11.6%).
9) Overall, orthopaedists perform an average of 30 procedures per month, with full-time orthopaedists performing 32 procedures per month, and part-timers performing 7 procedures per month.

© Orthopaedic Practice in the US 2018 Survey work is conducted for the benefit of and is owned by the AAOS. Not to be duplicated without consent. January 2019
4
II. INTRODUCTION
This Orthopaedic Practice in the US (OPUS) report is 17th in a series produced by the American Academy of Orthopaedic Surgeons (AAOS) to focus on the orthopaedic workforce and practice characteristics in the United States. Information in this report is based on the most recent orthopaedic physician census of 30,141 orthopaedists on record with the AAOS.
III. METHODOLOGY
The 2018 AAOS Orthopaedic Physician Census was administered as an online survey. On January 22, 2018, email invitations were sent to AAOS fellow/member orthopaedic surgeons in the United States, its territories, and the United States Military overseas.
To help increase participation, a series of monthly reminder notices were sent to non-respondents. Surgeons without valid email addresses were mailed the survey and asked to complete it.
By July 8th, a total of 7,029 AAOS fellows/members had responded to the survey for an overall response rate of 23.3%. After examining the data and excluding those who had only partially completed the survey, a total of 6,775 respondents remained for analysis and inclusion. Response rate by member group is shown below.
Invited to answer
the 2018 Census Responded to the
2018 Census Response Rate
% (3) Candidate Member Practitioner 1,828 531 29.0 (4) Candidate Member Prac Appl for Fellowship 26 15 57.7 (5) Applicant for Fellowship 2 1 50.0 (6) Other NONMEMBER Practitioner 3,803 334 8.8 (7) Active Fellow 18,323 4,330 23.6 (7AO) Associate Member Orthopaedic 92 32 34.8 (7DO) Associate Member Osteopathic 549 95 17.3 (8) Emeritus Fellow 5,518 1,437 26.0 Total 30,141 6,775 22.5
When respondents skipped over certain questions, it was possible to infer the response based on their answer to other questions. For example, if the orthopaedic surgeon indicated a retirement age but failed to mark “retired” on the data collection form, their work status of “retired” was inferred.
Age is backfilled from known date of birth information in AAOS records.
The questionnaire used in the 2018 AAOS Orthopaedic Physician Census can be found in Appendix A.

© Orthopaedic Practice in the US 2018 Survey work is conducted for the benefit of and is owned by the AAOS. Not to be duplicated without consent. January 2019
5
Although the census was distributed to the full population of orthopaedic surgeons, all active orthopaedists did not complete the census information. Therefore, we provide 95% confidence intervals (CIs) for data reported to indicate the uncertainty in estimates based on responses submitted. (CIs indicate that if the study were repeated 100 times, 95% of the time, the true value will fall within the interval provided.) CI values are provided in Appendix.
Data for the 2018 Orthopaedic Practice in the US Report was compiled and analyzed jointly by the AAOS Department of Clinical Quality and Value and the AAOS Marketing Research department. SPSS was used for data analysis. Cross-tabulations, measures of association, and hypothesis tests including: t-tests, analyses of variance (ANOVAs), Chi-Square tests, Kruskal-Wallis, and median tests were used to analyze the data.

© Orthopaedic Practice in the US 2018 Survey work is conducted for the benefit of and is owned by the AAOS. Not to be duplicated without consent. January 2019
6
IV. ORTHOPAEDIC SURGEON DENSITY
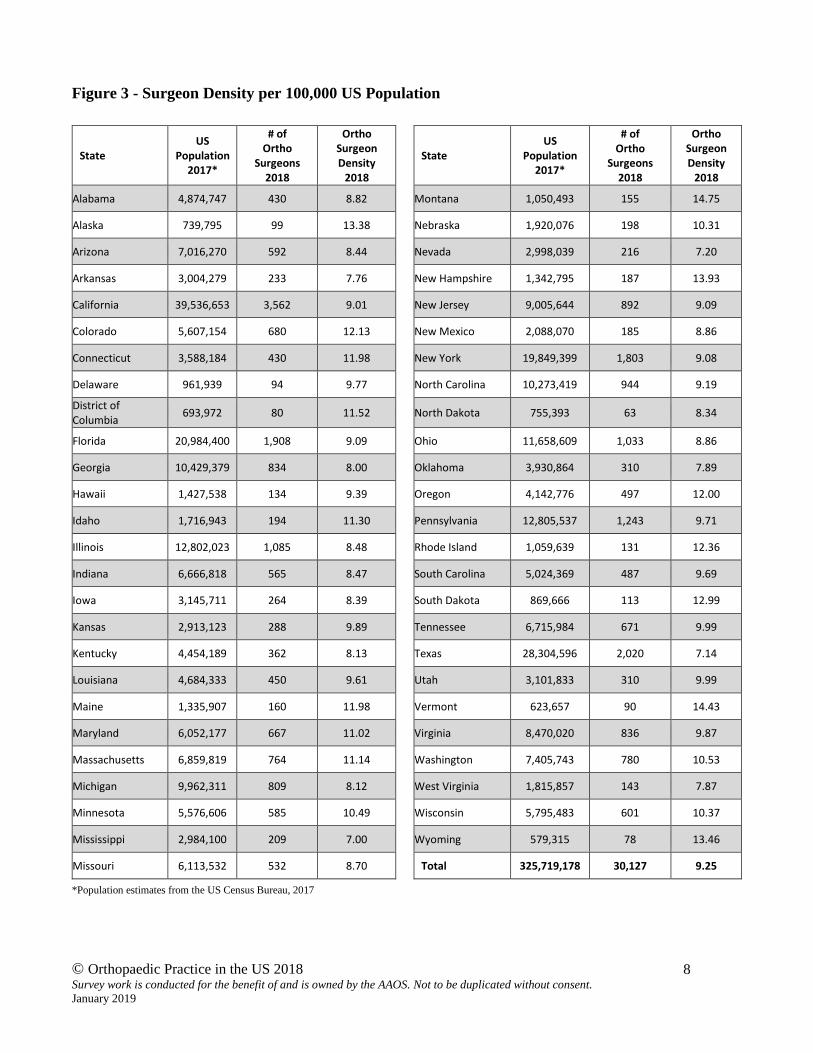
The following information describes the population of US orthopaedic surgeons per 100,000 by state. Information in this section is based on 30,141 orthopaedic surgeons in the following AAOS membership categories: Candidate Member Practitioners (CMP’s), CMP fellow applicants, applicants for fellowship, fellows, non-member practitioners, associate members, and emeritus fellows. The 2018 density of orthopaedic surgeons in the US is 9.25 per 100,000 population.
Figure 1 – 2018 Orthopaedic Density by State (per 100,000 people)

© Orthopaedic Practice in the US 2018 Survey work is conducted for the benefit of and is owned by the AAOS. Not to be duplicated without consent. January 2019
7
Montana, Vermont, Wyoming, Alaska, and South Dakota have the highest density of orthopaedic surgeons (13 and over per 100,000 population). Mississippi, Texas, Nevada, Arkansas, and Oklahoma have the lowest surgeon density (below 8 per 100,000 population).
Figure 2 - States with Highest and Lowest Surgeon Densities
Highest Density
Lowest Density
State
US Population
2017*
# of Ortho Surgeons
2018
Ortho
Surgeon Density
2018
State
US Population
2017*
# of Ortho Surgeons
2018
Ortho
Surgeon Density
2018
Montana 1,050,493 155 14.75 Mississippi 2,984,100 209 7.00
Vermont 623,657 90 14.43 Texas 28,304,596 2020 7.14
Wyoming 579,315 78 13.46 Nevada 2,998,039 216 7.20
Alaska 739,795 99 13.38 Arkansas 3,004,279 233 7.76
South Dakota 869,666 113 12.99 Oklahoma 3,930,864 310 7.89
*Orthopaedic surgeon density is calculated using the most recent population estimates from the US Census Bureau, 2017.
© Orthopaedic Practice in the US 2018 Survey work is conducted for the benefit of and is owned by the AAOS. Not to be duplicated without consent. January 2019
8
Figure 3 - Surgeon Density per 100,000 US Population
State US
Population 2017*
# of Ortho
Surgeons 2018
Ortho Surgeon Density
2018
State US
Population 2017*
# of Ortho
Surgeons 2018
Ortho Surgeon Density
2018
Alabama 4,874,747 430 8.82 Montana 1,050,493 155 14.75
Alaska 739,795 99 13.38 Nebraska 1,920,076 198 10.31
Arizona 7,016,270 592 8.44 Nevada 2,998,039 216 7.20
Arkansas 3,004,279 233 7.76 New Hampshire 1,342,795 187 13.93
California 39,536,653 3,562 9.01 New Jersey 9,005,644 892 9.09
Colorado 5,607,154 680 12.13 New Mexico 2,088,070 185 8.86
Connecticut 3,588,184 430 11.98 New York 19,849,399 1,803 9.08
Delaware 961,939 94 9.77 North Carolina 10,273,419 944 9.19
District of Columbia 693,972 80 11.52 North Dakota 755,393 63 8.34
Florida 20,984,400 1,908 9.09 Ohio 11,658,609 1,033 8.86
Georgia 10,429,379 834 8.00 Oklahoma 3,930,864 310 7.89
Hawaii 1,427,538 134 9.39 Oregon 4,142,776 497 12.00
Idaho 1,716,943 194 11.30 Pennsylvania 12,805,537 1,243 9.71
Illinois 12,802,023 1,085 8.48 Rhode Island 1,059,639 131 12.36
Indiana 6,666,818 565 8.47 South Carolina 5,024,369 487 9.69
Iowa 3,145,711 264 8.39 South Dakota 869,666 113 12.99
Kansas 2,913,123 288 9.89 Tennessee 6,715,984 671 9.99
Kentucky 4,454,189 362 8.13 Texas 28,304,596 2,020 7.14
Louisiana 4,684,333 450 9.61 Utah 3,101,833 310 9.99
Maine 1,335,907 160 11.98 Vermont 623,657 90 14.43
Maryland 6,052,177 667 11.02 Virginia 8,470,020 836 9.87
Massachusetts 6,859,819 764 11.14 Washington 7,405,743 780 10.53
Michigan 9,962,311 809 8.12 West Virginia 1,815,857 143 7.87
Minnesota 5,576,606 585 10.49 Wisconsin 5,795,483 601 10.37
Mississippi 2,984,100 209 7.00 Wyoming 579,315 78 13.46
Missouri 6,113,532 532 8.70 Total 325,719,178 30,127 9.25
*Population estimates from the US Census Bureau, 2017

© Orthopaedic Practice in the US 2018 Survey work is conducted for the benefit of and is owned by the AAOS. Not to be duplicated without consent. January 2019
9
DENSITY BY CENSUS DIVISION
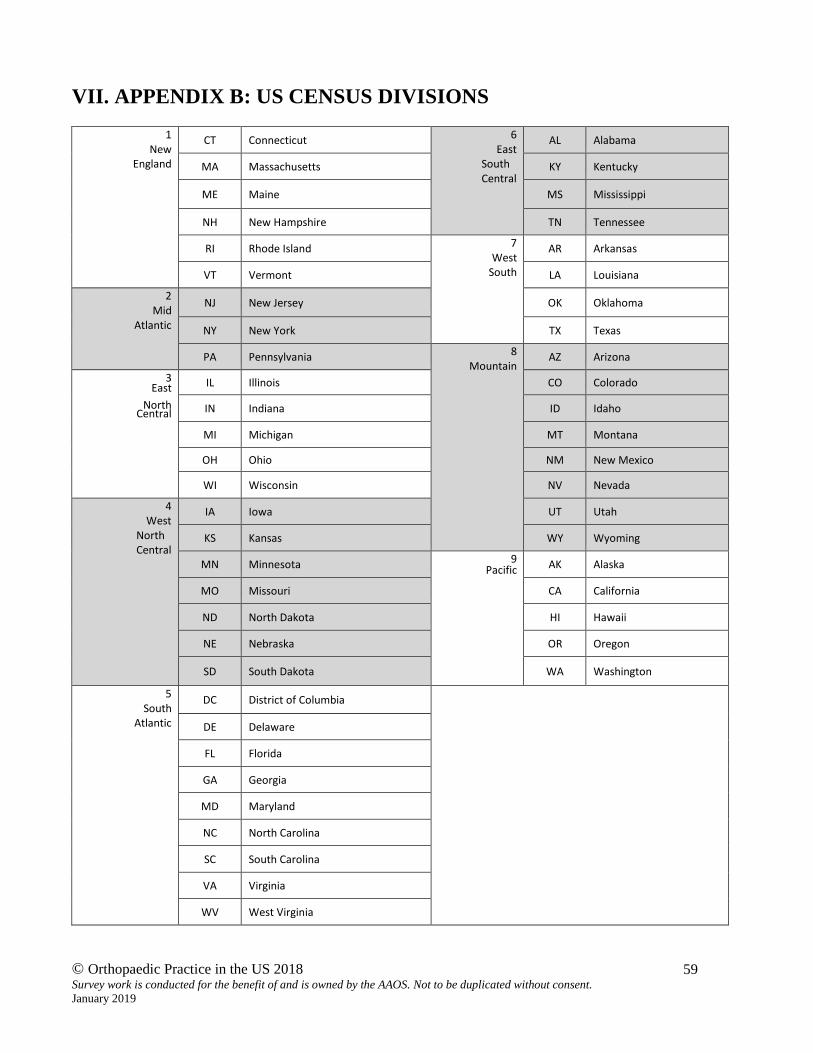
Orthopaedic surgeon density was compared across US Census divisions. (See Appendix B for US Census division listing). Overall, New England states have the highest density of orthopaedic surgeons (11.9 per 100,000 population). The West South Central division has the lowest density of orthopaedic surgeons (7.55 per 100,000 population).
Figure 4 - Density of Orthopaedic Surgeons per 100,000 Population by Census Division
11.9
9.458.73
9.598.96 8.79
7.55
9.989.52 9.25
New England Mid Atlantic East NorthCentral
West NorthCentral
SouthAtlantic
East SouthCentral
West SouthCentral
Mountain Pacific Total (USA)
Density of Orthopaedic Surgeons per 100,000 Population(by US Census Division)

© Orthopaedic Practice in the US 2018 Survey work is conducted for the benefit of and is owned by the AAOS. Not to be duplicated without consent. January 2019
10
Figure 5 - Orthopaedic Density by Census Division
Census Division
US Population
2017* (by Division)
# of Ortho
Surgeons 2018
(by Division)
Ortho Surgeon Density 2018 (per 100,000 by Division)
New England 14,810,001 1,762 11.90
Mid Atlantic 41,660,580 3,938 9.45
East North Central 46,885,244 4,093 8.73
West North Central 21,294,107 2,043 9.59
South Atlantic 68,042,709 6,096 8.96
East South Central 19,029,020 1,672 8.79
West South Central 39,924,072 3,013 7.55
Mountain 24,158,117 2,410 9.98
Pacific 53,252,505 5,072 9.52
TOTAL (US) 325,719,178 30,127 9.25
*Population estimates from the US Census Bureau, 2017

© Orthopaedic Practice in the US 2018 Survey work is conducted for the benefit of and is owned by the AAOS. Not to be duplicated without consent. January 2019
11
AVERAGE AGE BY STATE
The average age of these orthopaedists is 56.45 years (including CMPs, CMP fellow applicants, applicants for fellowship, fellows, associate members, non-member practitioners, and emeritus fellows who indicated an active work status). The chart below shows the average age of orthopaedic surgeons by state.
Figure 6 - Average Age of Orthopaedic Surgeons by State
State Mean Age State Mean Age
Alabama 56.21 Montana 57.45
Alaska 55.39 Nebraska 54.06
Arizona 56.41 Nevada 56.43
Arkansas 56.37 New Hampshire 57.99
California 58.76 New Jersey 55.82
Colorado 56.01 New Mexico 61.69
Connecticut 57.62 New York 56.23
Delaware 57.60 North Carolina 55.91
District of Columbia 55.64 North Dakota 53.68
Florida 58.45 Ohio 55.01
Georgia 55.17 Oklahoma 57.04
Hawaii 56.96 Oregon 58.16
Idaho 56.12 Pennsylvania 56.41
Illinois 55.11 Rhode Island 58.36
Indiana 54.20 South Carolina 56.88
Iowa 54.09 South Dakota 52.58
Kansas 55.59 Tennessee 55.96
Kentucky 56.41 Texas 55.16
Louisiana 55.77 Utah 55.53
Maine 58.87 Vermont 58.71
Maryland 56.25 Virginia 56.14
Massachusetts 57.70 Washington 57.13
Michigan 55.38 West Virginia 55.95
Minnesota 54.19 Wisconsin 56.33
Mississippi 54.94 Wyoming 54.23
Missouri 54.92 TOTAL 56.45

© Orthopaedic Practice in the US 2018 Survey work is conducted for the benefit of and is owned by the AAOS. Not to be duplicated without consent. January 2019
12
GENDER BY STATE
The AAOS membership is made up of 92.2% male and 5.8% female surgeons (2.0% did not indicate their gender). States with the largest proportions of female members are Maine (11.9%), District of Columbia (11.3%), Minnesota (10.6%), Hawaii (9.0%), and Massachusetts (8.6%).
Figure 7 - Percentage of Gender by State FEMALE MALE NOT INDICATED TOTAL
Alabama N 14 406 10 430 % 3.3% 94.4% 2.3% 100.0%
Alaska N 4 94 1 99 % 4.0% 94.9% 1.0% 100.0%
Arizona N 32 538 22 592 % 5.4% 90.9% 3.7% 100.0%
Arkansas N 10 221 2 233 % 4.3% 94.8% .9% 100.0%
California N 231 3,247 84 3,562 % 6.5% 91.2% 2.4% 100.0%
Colorado N 52 618 10 680 % 7.6% 90.9% 1.5% 100.0%
Connecticut N 25 391 14 430 % 5.8% 90.9% 3.3% 100.0%
Delaware N 5 87 2 94 % 5.3% 92.6% 2.1% 100.0%
District of Columbia N 9 71 0 80 % 11.3% 88.8% 0.0% 100.0%
Florida N 79 1786 43 1908 % 4.1% 93.6% 2.3% 100.0%
Georgia N 43 779 12 834 % 5.2% 93.4% 1.4% 100.0%
Hawaii N 12 118 4 134 % 9.0% 88.1% 3.0% 100.0%
Idaho N 9 183 2 194 % 4.6% 94.3% 1.0% 100.0%
Illinois N 59 986 40 1085 % 5.4% 90.9% 3.7% 100.0%
Indiana N 22 537 6 565 % 3.9% 95.0% 1.1% 100.0%
Iowa N 16 246 2 264 % 6.1% 93.2% .8% 100.0%
Kansas N 12 271 5 288 % 4.2% 94.1% 1.7% 100.0%
Kentucky N 20 332 10 362 % 5.5% 91.7% 2.8% 100.0%
Louisiana N 22 421 7 450 % 4.9% 93.6% 1.6% 100.0%
Maine N 19 141 0 160 % 11.9% 88.1% .0% 100.0%

© Orthopaedic Practice in the US 2018 Survey work is conducted for the benefit of and is owned by the AAOS. Not to be duplicated without consent. January 2019
13
FEMALE MALE NOT INDICATED TOTAL
Maryland N 53 600 14 667 % 7.9% 90.0% 2.1% 100.0%
Massachusetts N 66 686 12 764 % 8.6% 89.8% 1.6% 100.0%
Michigan N 48 745 16 809 % 5.9% 92.1% 2.0% 100.0%
Minnesota N 62 517 6 585 % 10.6% 88.4% 1.0% 100.0%
Mississippi N 9 199 1 209 % 4.3% 95.2% .5% 100.0%
Missouri N 36 489 7 532 % 6.8% 91.9% 1.3% 100.0%
Montana N 11 142 2 155 % 7.1% 91.6% 1.3% 100.0%
Nebraska N 8 188 2 198 % 4.0% 94.9% 1.0% 100.0%
Nevada N 9 202 5 216 % 4.2% 93.5% 2.3% 100.0%
New Hampshire N 8 177 2 187 % 4.3% 94.7% 1.1% 100.0%
New Jersey N 48 821 23 892 % 5.4% 92.0% 2.6% 100.0%
New Mexico N 8 174 3 185 % 4.3% 94.1% 1.6% 100.0%
New York N 120 1,644 39 1,803 % 6.7% 91.2% 2.2% 100.0%
North Carolina N 42 885 17 944 % 4.4% 93.8% 1.8% 100.0%
North Dakota N 1 62 0 63 % 1.6% 98.4% 0.0% 100.0%
Ohio N 47 968 18 1033 % 4.5% 93.7% 1.7% 100.0%
Oklahoma N 13 295 2 310 % 4.2% 95.2% .6% 100.0%
Oregon N 44 446 7 497 % 8.9% 89.7% 1.4% 100.0%
Pennsylvania N 61 1,159 23 1,243 % 4.9% 93.2% 1.9% 100.0%
Rhode Island N 7 122 2 131 % 5.3% 93.1% 1.5% 100.0%
South Carolina N 13 466 8 487 % 2.7% 95.7% 1.6% 100.0%
South Dakota N 4 106 3 113 % 3.5% 93.8% 2.7% 100.0%
Tennessee N 26 638 7 671 % 3.9% 95.1% 1.0% 100.0%
Texas N 106 1,869 45 2,020 % 5.2% 92.5% 2.2% 100.0%
Utah N 10 294 6 310 % 3.2% 94.8% 1.9% 100.0%

© Orthopaedic Practice in the US 2018 Survey work is conducted for the benefit of and is owned by the AAOS. Not to be duplicated without consent. January 2019
14
FEMALE MALE NOT INDICATED TOTAL
Vermont N 12 77 1 90 % 13.3% 85.6% 1.1% 100.0%
Virginia N 63 749 24 836 % 7.5% 89.6% 2.9% 100.0%
Washington N 67 701 12 780 % 8.6% 89.9% 1.5% 100.0%
West Virginia N 6 134 3 143 % 4.2% 93.7% 2.1% 100.0%
Wisconsin N 25 572 4 601 % 4.2% 95.2% .7% 100.0%
Wyoming N 4 71 3 78 % 5.1% 91.0% 3.8% 100.0%
TOTAL N 1,732 27,671 593 29,996 % 100.0% 100.0% 100.0% 100.0%

© Orthopaedic Practice in the US 2018 Survey work is conducted for the benefit of and is owned by the AAOS. Not to be duplicated without consent. January 2019
15
V. PRACTICING ORTHOPAEDIC SURGEON CHARACTERISITCS
Information in this section is based on respondents to the 2018 AAOS Orthopaedic Physician Census. Specifically, 5,517 full-time and part-time practicing orthopaedists from the following membership categories: Candidate Member Practitioners (CMP’s), CMP fellow applicants, applicants for fellowship, fellows, associate members, non-member practitioners, and emeritus fellows.
AGE OF CENSUS RESPONDENTS
The average age of these practicing respondents is 52.13 years (+/- 0.33 years). The median age (50th percentile or midpoint) is 52 years. Ages range from 30 to 92 years old.
Figure 8 - Age Distribution of Census Respondents

© Orthopaedic Practice in the US 2018 Survey work is conducted for the benefit of and is owned by the AAOS. Not to be duplicated without consent. January 2019
16
Mean age differs by work status [t (744.24 df) = -46.41; p<.01]. The mean age for full-time orthopaedists is 50.16 years old (+/- 0.31) compared to the mean age of part-time orthopaedists, 69.64 years old (+/- 0.76). Figure 9 illustrates the difference in age distribution for full-time and part-time orthopaedists.
Figure 9 - Age Distribution by Work Status

© Orthopaedic Practice in the US 2018 Survey work is conducted for the benefit of and is owned by the AAOS. Not to be duplicated without consent. January 2019
17
The majority of full-time orthopaedists (77.5%) are under the age of 60, while the majority of part-time orthopaedists (88.9%) are 60 or older. Differences are significant [X2
(4 df) = 1788.826; p<.01].
Figure 10 - Work Status by Age Groups
21.3%
27.6% 28.6%
18.4%
4.0%0.7%
2.3%
8.1%
33.8%
55.1%
0.0%
10.0%
20.0%
30.0%
40.0%
50.0%
60.0%
Under 40 yrs old 40 to 49 yrs old 50 to 59 yrs old 60 to 69 yrs old 70 yrs old and over
AGE GROUPS FOR FULL-TIME AND PART-TIME ORTHOPAEDISTS
Full-time orthopaedists Part-time orthopaedists

© Orthopaedic Practice in the US 2018 Survey work is conducted for the benefit of and is owned by the AAOS. Not to be duplicated without consent. January 2019
18
GENDER
Practicing orthopaedist respondents are composed of 92.4% males, and 7.6% females. There is a significant difference between males and females in all member categories [X2 (7 df) = 77.208; p<.01].
Figure 11 - Gender by Member Category
84.2%
93.3%
100.0%
89.4%93.0%
96.8%93.6%
98.6%
15.8%
6.7%
0.0%
10.6%7.1%
3.2%6.5%
1.4%0.0%
10.0%
20.0%
30.0%
40.0%
50.0%
60.0%
70.0%
80.0%
90.0%
100.0%
(3)Candidate
MbrPractitioner
(4)Candidate
MbrPrac Appl
for Fellowship
(5)Applicant
for Fellowship
(6)Other
NONMEMBERPractitioner
(7)Active Fellow
(7AO)Associate
Mbr Ortho
(7DO)Associate
MbrOsteopathic
(8)Emeritus
Fellow
GENDER BY MEMBER CATEGORY
Male Female

© Orthopaedic Practice in the US 2018 Survey work is conducted for the benefit of and is owned by the AAOS. Not to be duplicated without consent. January 2019
19
Gender also varies by age group [X2 (4 df) = 169.571; p<.01], with a larger proportion of females under the age of 50 than in age groups of 50 years old and older. Few orthopaedists over the age of 60 are female.
Figure 12 - Gender by Age Group
84.1%
92.0% 93.3%96.4%
99.8%
15.9%
8.1% 6.7%3.6%
0.2%0%
10%
20%
30%
40%
50%
60%
70%
80%
90%
100%
Under 40 yrs old 40-49 yrs old 50-59 yrs old 60-69 yrs old 70 and over
GENDER BY AGE GROUP
Female Male

© Orthopaedic Practice in the US 2018 Survey work is conducted for the benefit of and is owned by the AAOS. Not to be duplicated without consent. January 2019
20
RACE/ETHNICITY
The primary reported race among practicing orthopaedists was Caucasian (84.7%), followed by Asian (6.7%). Relatively few indicated they are African American, Hispanic/Latino, Native American, or multi-racial. A full list of “other” race/ethnicity is found in Appendix C, Table 1.
Figure 13 - Orthopaedists Race/Ethnicity
84.7%
6.7%2.2% 1.9% 2.9% 1.2% 0.4%
0%
10%
20%
30%
40%
50%
60%
70%
80%
90%
100%
Caucasian Asian Hispanic/Latino AfricanAmerican
Other Multi-racial NativeAmerican
ORTHOPAEDISTS - RACE/ETHNICITY

© Orthopaedic Practice in the US 2018 Survey work is conducted for the benefit of and is owned by the AAOS. Not to be duplicated without consent. January 2019
21
RACE/ETHNICITY BY GENDER
Statistically significant differences in race/ethnicity were found between male and female practicing orthopaedists [X2 (6 df) = 17.69; p<.01]. By comparison, male orthopaedists are more likely to be Caucasian than are female orthopaedists.
Figure 14 - Race by Gender Male (N=5,075) Female (N=421)
Caucasian 85.12% 79.10% African American 1.75% 3.09% Hispanic/Latino 2.17% 3.09% Asian 6.54% 9.03% Native American 0.35% 0.48% Multi-racial 1.12% 2.61% Other 2.94% 2.61%

© Orthopaedic Practice in the US 2018 Survey work is conducted for the benefit of and is owned by the AAOS. Not to be duplicated without consent. January 2019
22
RACE/ETHNICITY BY AGE GROUP
Significant differences were found in reported race/ethnicity by age group [X2 (24 df) = 137.186; p<.01]. Overall, Caucasians make up a majority of the practicing orthopaedic workforce in all age groups. Caucasians (80.1%) lead in the number of entering the orthopaedic workforce, followed by Asians (10.1%). Less than 10% of people entering the orthopaedic workforce are made up of African American, Hispanic/Latino, Native American, Multi-racial, and “other” combined.
Figure 15 – Race/Ethnicity by Age Group
80.1
%
79.6
% 86.9
% 90.6
%
88.8
%
2.7%
2.0%
1.3% 2.1%
1.0%2.1% 3.1%
2.1%
1.5% 2.2%
10.1
%
10.4
%
5.2%
2.3% 3.6%
0.1%
0.2%
0.5%
0.5%
0.8%1.9%
1.5%
1.1%
0.8%
0.4%3.
1%
3.1%
3.0%
2.3% 3.2%
U N D E R 4 0 Y R S O L D 4 0 T O 4 9 Y R S O L D 5 0 T O 5 9 Y R S O L D 6 0 T O 6 9 Y R S O L D 7 0 Y R S O L D A N D O V E R
RACE BY AGE GROUPCaucasian African American Hispanic/Latino Asian Native American Multi Racial Other

© Orthopaedic Practice in the US 2018 Survey work is conducted for the benefit of and is owned by the AAOS. Not to be duplicated without consent. January 2019
23
ORTHOPAEDIC SOCIETY MEMBERSHIP
Orthopaedists were asked to indicate their membership status in four organizations: American College of Surgeons, American Medical Association, State Medical Society, and State Orthopaedic Society. Seventy-five percent of practicing orthopaedic respondents marked that they’re a member of at least one of these organizations. Among those that indicated membership, most are members in a State Orthopedic Society (81.5%).
Figure 16 - Membership in Orthopaedic Societies
Indicate your membership in the following organizations (N=4,160 – member of at least one) Frequency %
American College of Surgeons 535 12.9
American Medical Association 991 23.8
State Medical Society 2,258 54.3
State Orthopaedic Society 3,390 81.5

© Orthopaedic Practice in the US 2018 Survey work is conducted for the benefit of and is owned by the AAOS. Not to be duplicated without consent. January 2019
24
WORK STATUS
The orthopaedic workforce is made up of 90% employed full-time, and 10% part-time. Full- time orthopaedists are mostly specialists (63.6%), while part-time orthopaedists are mostly general orthopaedic surgeons (46.4%).
Figure 17 - Practice Setting: Full-time vs Part-time Orthopaedists
11.3%
46.4%25.1%
25.0%
63.6%
28.6%
0.0%
10.0%
20.0%
30.0%
40.0%
50.0%
60.0%
70.0%
80.0%
90.0%
100.0%
Full-time Part-time
PRACTICE SETTING: FULL-TIME VS PART-TIME
General orthopaedic surgeon Generalist w an area of specialty interest Specialist within orthopaedic surgery

© Orthopaedic Practice in the US 2018 Survey work is conducted for the benefit of and is owned by the AAOS. Not to be duplicated without consent. January 2019
25
There is a significant difference between full-time and part-time orthopaedists in terms of practice type [X2 (2 df) = 509.411; p<.01].
Figure 18 - Work Status by Practice Type
68.8%
90.1%95.2%
90.0%
31.2%
9.9%4.8%
10.0%
0.0%
10.0%
20.0%
30.0%
40.0%
50.0%
60.0%
70.0%
80.0%
90.0%
100.0%
General Ortho Surgeon General Ortho Surgeon wSpecialty Interset
Specialist Total
WORK STATUS BY PRACTICE TYPE
Full-time Part-time

© Orthopaedic Practice in the US 2018 Survey work is conducted for the benefit of and is owned by the AAOS. Not to be duplicated without consent. January 2019
26
PRACTICE SETTING
Members were asked to identify the setting that best describes their current practice. The largest proportion of respondents practice in Private Practice – orthopaedic group setting (36%, +/- 1.27), with an additional 17% (+/- 1.01) in Hospital/Medical Center and 15% (+/- .91) in Academic Practice (salary from institution).
Figure 19 - Practice Setting
Private practice - Solo (income self-earned)
12%
Private practice -Orthopaedic Group
(income from group)36%
Private practice - Multi-specialty Group (income from group)
9%
Academic Practice (salary from academic
institution)14%
Academic Practice (salary from private
practice)4%
Military Practice (salary from military)
2%
Public Institution (salary from non-
military government entity)
2%
Pre-paid Plan/HMO (salary from HMO
1%
Hospital/Medical Center (salary from
hospital/medical center)
17%
Locum Tenens0%
Other (Please specify)3%
ORTHOPAEDIC SURGEON PRACTICE SETTING

© Orthopaedic Practice in the US 2018 Survey work is conducted for the benefit of and is owned by the AAOS. Not to be duplicated without consent. January 2019
27
PRACTICE SETTING BY WORK STATUS
Most full-time orthopaedists work in private practice – ortho group (37.5%) and hospital/medical center (18.1%) settings. Most part-time orthopaedists work in private practice - solo (26.3%) and ortho group (22.1%) practice settings. A higher proportion of part-time orthopaedists work in private practice – solo, public institutions, locum tenens, and “other” practice settings compared to their full-time colleagues [X2 (10 df) = 766.735; p<.01].
Figure 20 - Practice Setting by Work Status Full Time Part Time
Valid % 95% CI (+/-) Valid % 95% CI (+/-)
Private Practice - Solo (income self-earned) 10.7% 0.862 26.3% 3.671
Private Practice - Orthopaedic Group 37.5% 1.348 22.1% 3.461
Private Practice - Multi-specialty Group 9.0% 0.797 5.8% 1.950
Academic Practice (salary from academic institution) 14.6% 0.983 5.4% 1.891
Academic Practice (salary from private practice) 4.1% 0.550 0.7% 0.708
Military Practice (salary from military) 1.9% 0.376 0.4% 0.501
Public Institution (salary from non-military govt. entity) 1.0% 0.284 6.7% 2.087
Pre-paid Plan/HMO (salary from HMO) 1.3% 0.317 1.1% 0.865
Hospital/Medical Center (salary from hospital/med. center) 18.1% 1.071 13.2% 2.826
Locum Tenens 0.0% 0.039 5.6% 1.920
Other 1.8% 0.368 12.7% 2.776

© Orthopaedic Practice in the US 2018 Survey work is conducted for the benefit of and is owned by the AAOS. Not to be duplicated without consent. January 2019
28
PRACTICE SETTING BY AGE GROUP
Differences in practice setting across age groups are significant [X2 (40 df) = 815.496; p<.01]. Compared to those aged 60 and older, fewer orthopaedists under 50 are in private practice – solo settings.
Figure 21 - Practice Setting by Age Group
2.8%8.7%
12.5%18.5%
27.5%
33.8%
37.9%
41.5%33.6%
24.5%8.1%
9.4%
9.5%8.4% 6.0%21.7%
17.0%
10.4%9.7%
6.0%
4.2%
5.0% 3.5%
2.7%
2.6%
4.9%
2.8%.2%
.1%
.0%
1.0%
.4%1.1%
2.1%
6.6%
1.5%
1.2%1.6%
0.9%.8%
20.6%16.3% 17.3%
18.9%
12.4%
.1% .1% .3%1.0%
2.8%
1.1% 1.3% 1.9% 4.1%11.0%
U N D E R 4 0 4 0 T O 4 9 5 0 T O 5 9 6 0 T O 6 9 7 0 A N D O V E R
PRACTICE SETTING BY AGE GROUP
Other
Locum Tenens
Hospital/Medical Center (salary fromhos/med. center)
Pre-paid Plan/HMO (salary from HMO)
Public Institution (salary from non-militarygovt.)
Military Practice (salary from military)
Academic Practice (salary from privatepractice)
Academic Practice (salary from academicinstitution)
Private Practice - Multi-spec. Group
Private Practice - Orthopaedic Group
Private Practice - Solo (income self-earned)

© Orthopaedic Practice in the US 2018 Survey work is conducted for the benefit of and is owned by the AAOS. Not to be duplicated without consent. January 2019
29
PRACTICE SIZE
Full-time orthopaedists in private orthopaedic or multi-specialty groups reported working in an average group size of 21 surgeons (+/- 3.29), median of 10. The number of orthopaedists reported ranged from 1 to 3,500. Fifty-one percent of respondents in private orthopaedic or multi-specialty groups reported having 1 to 10 physicians in their office.
Figure 22 - Number of Surgeons in Private/Multi-Specialty Groups
1 to 10 MDs in office, 51.0%
11 to 20 MDs in office, 24.7%
21 to 30 MDs in office, 10.3%
Over 30 MDs in office, 14.0%
NUMBER OF SURGEONS IN PRIVATE ORTHOPAEDIC OR MULTI-SPECIALTY GROUPS

© Orthopaedic Practice in the US 2018 Survey work is conducted for the benefit of and is owned by the AAOS. Not to be duplicated without consent. January 2019
30
DEGREE OF SPECIALIZATION
Sixty percent (+/-1.67) of practicing respondents are specialists, 25% (+/-2.29) are general orthopaedic surgeons with specialty interest, and 15% (+/-2.44) are generalists.
Figure 23 - Degree of Specialization Distribution
General orthopaedic
surgeon15%
Generalist with an area of specialty interest
25%
Specialist within orthopaedic
surgery60%
DEGREE OF SPECIALIZATION

© Orthopaedic Practice in the US 2018 Survey work is conducted for the benefit of and is owned by the AAOS. Not to be duplicated without consent. January 2019
31
DEGREE OF SPECIALIZATION BY AGE GROUP
There are significant differences in degree of specialization by age group [X2 (8 df) = 694.85; p<.01]. By comparison, orthopaedic surgeons under 50 years old are more likely to be specialists, whereas those aged 60 and older are more likely to be general orthopaedic surgeons.
Figure 24 - Degree of Specialization by Age Group
5.2% 7.1% 11.5%24.8%
44.0%21.4% 20.6%
28.8%
29.1%
25.8%73.4% 72.3%
59.7%46.0%
30.2%
0%
10%
20%
30%
40%
50%
60%
70%
80%
90%
100%
Under 40 yrs old 40 to 49 50 to 59 60 to 69 70 or older
DEGREE OF SPECIALIZATION BY AGE GROUP
General orthopaedic surgeon Generalist with an area of specialty interest
Specialist within orthopaedic surgery

© Orthopaedic Practice in the US 2018 Survey work is conducted for the benefit of and is owned by the AAOS. Not to be duplicated without consent. January 2019
32
SPECIALTY AREAS
Respondents were asked to identify the one area of orthopaedic surgery they considered their primary specialty area. The three most-frequently cited areas of practice are sports medicine (18.2%), total joint (14.4%), and hand (11.6%). Ten percent of respondents indicated they do not have a primary specialty area.
Figure 25 - Specialty Areas Primary Specialty Area
Valid % (N=5,497)
95% CI (+/-)
Sports medicine 18.2 1.02 I do not have a primary specialty area 10.4 0.81 Total joint 14.4 0.93 Hand 11.6 0.85 Adult spine 8.3 0.73 Trauma 5.8 0.62 Foot/ankle 5.2 0.59 Pediatric orthopaedics 5.1 0.58 Adult knee 4.5 0.55 Shoulder/elbow 4.3 0.54 Arthroscopy 2.9 0.44 Non-operative practice 2.3 0.40 Adult hip 1.9 0.36 Other (Please specify) 1.9 0.36 Orthopaedic oncology 1.5 0.32 Disability/legal ortho 1.0 0.26 Pediatric spine 0.6 0.20 Rehab/prosthetics/orthotics 0.0 0.04 Total 100.0

© Orthopaedic Practice in the US 2018 Survey work is conducted for the benefit of and is owned by the AAOS. Not to be duplicated without consent. January 2019
33
SPECIALTY AREAS BY AGE GROUP
Differences in specialty areas were found by age group. Figure 26 shows that all specialty areas have significant difference between age groups except for rehabilitation/prosthetics/orthotics and pediatric spine.
Figure 26 - Chi Square Values of All Specialty Areas
Chi-square value
df
p value
Significant difference between age groups?
Adult Hip 25.594a 4 .000 Yes
Adult Knee 89.176a 4 .000 Yes
Adult Spine 70.746a 4 .000 Yes
Arthroscopy 21.226a 4 .000 Yes
Disability/legal 75.403a 4 .000 Yes
Foot & Ankle 90.555a 4 .000 Yes
Hand 129.022a 4 .000 Yes
Non-operative practice 164.889a 4 .000 Yes
Orthopaedic Oncology 30.078a 4 .000 Yes
Pediatric Orthopaedics 66.555a 4 .000 Yes
Pediatric Spine 4.598a 4 .331 No
Rehabilitation/prosthetics/orthotics 3.459a 4 .484 No
Shoulder & Elbow 84.171a 4 .000 Yes
Sports Medicine 398.411a 4 .000 Yes
Total Joint 187.521a 4 .000 Yes
Trauma 112.150a 4 .000 Yes
No specialty area 96.644a 4 .000 Yes
Other specialty area 8.347a 4 .080 Yes

© Orthopaedic Practice in the US 2018 Survey work is conducted for the benefit of and is owned by the AAOS. Not to be duplicated without consent. January 2019
34
Figure 27 shows the frequency distribution of age groups by primary specialty area. Surgeons aged 60 or older mostly specialize in rehab/prosthetics/orthotics (100.0%), non-operative practice (94.6%), and disability/legal orthopaedics (76.8%).
Surgeons between 40 to 59 years old are likely to specialize in sports medicine (61.4%), foot and ankle (57.6%), total joint (57.5%), adult spine (56.2%), shoulder and elbow (55.1%), hand (53.6%), arthroscopy (52.2%), and pediatric spine (50.1%) specialties.
The three most-frequently cited areas of practice among orthopaedists under the age of 40 are: trauma (31.5%), pediatric orthopaedics (28.6%), and shoulder and elbow (28.0%).
Figure 27 - Specialty Area by Age Group
21.6%
3.3%
16.3%
11.3%
26.3%
23.6%
19.3%
28.6%
15.6%
28.0%
23.1%
18.1%
31.5%
9.3%
9.3%
14.7%
15.5%
29.3%
23.3%
30.2%
26.1%
39.8%
23.9%
31.3%
32.6%
33.0%
26.0%
28.1%
13.3%
15.9%
34.3%
35.1%
26.9%
28.9%
5.1%
27.4%
27.5%
4.7%
22.9%
23.2%
18.8%
22.5%
28.4%
31.5%
19.8%
25.3%
16.8%
24.5%
35.1%
20.3%
27.0%
12.6%
11.6%
16.0%
34.9%
14.5%
18.2%
25.0%
14.0%
12.7%
19.5%
15.5%
33.5%
22.4%
4.9%
11.0%
7.3%
9.4%
64.2%
4.6%
6.7%
59.7%
3.6%
6.1%
9.4%
100.0%
3.0%
2.8%
4.8%
5.0%
18.6%
35.5%
A D U L T H I P
A D U L T K N E E
A D U L T S P I N E
A R T H R O S C O P Y
D I S A B I L I T Y / L E G A L O R T H O
F O O T / A N K L E
H A N D
N O N - O P E R A T I V E P R A C T I C E
O R T H O P A E D I C O N C O L O G Y
P E D I A T R I C O R T H O P A E D I C S
P E D I A T R I C S P I N E
R E H A B / P R O S T H E T I C S / …
S H O U L D E R / E L B O W
S P O R T S M E D I C I N E
T O T A L J O I N T
T R A U M A
I D O N O T H A V E A …
O T H E R ( P L E A S E S P E C I F Y )
SPECIALTY AREAS BY AGE GROUPUnder 40 yrs old 40 to 49 yrs old 50 to 59 yrs old 60 to 69 yrs old 70 and over yrs old

© Orthopaedic Practice in the US 2018 Survey work is conducted for the benefit of and is owned by the AAOS. Not to be duplicated without consent. January 2019
35
WORK HOURS
Full-time orthopaedists work an average of 52.65 hours per week. Answers ranged from 0 to 120 hours per week. Part-time orthopaedists work an average of 22.72 hours per week. Answers ranged from 0 to 115 hours per week.
Figure 28 - Average Hours per Week on All Activities (Excluding On-Call Time) Valid N Missing N Mean Std Dev Min Max 95% CI (+/-)
Full time 4,929 33 52.65 11.727 0 120 0.33
Part time 546 9 22.72 13.412 0 115 1.13
Figure 29 - Work Hours Distribution by Full and Part-time Ortho Surgeons Hours Per Week – Full-time Ortho Surgeons
Hours Per Week – Part-time Ortho Surgeons

© Orthopaedic Practice in the US 2018 Survey work is conducted for the benefit of and is owned by the AAOS. Not to be duplicated without consent. January 2019
36
WORK HOURS BY PRACTICE SETTING
Significant differences in work hours of full-time orthopaedists are evident across practice settings [F (9, 4913) = 41.692; p<.01]. By comparison, full-time orthopaedists in academic practice settings reported working the longest hours (59.14 hours per week – salary from academic institution; 58.53 hours – salary from private practice).
Figure 30- Full-time Orthopaedists' Average Work Hours by Practice Setting
50.94
51.47
50.98
59.14
58.53
54.48
48.35
48.83
51.02
49.93
0 10 20 30 40 50 60
Private Practice-Solo (income self-earned)
Private Practice - Orthopaedic Group
Private Practice - Multi-spec. Group
Academic Practice (salary from academic institution)
Academic Practice (salary from private practice)
Military Practice (salary from military)
Public Institution (salary from non-military govt. entity)
Pre-paid Plan/HMO (salary from HMO)
Hospital/Medical Center (salary from hospital/med. center)
Other
work hours
AVG. WORK HOURS BY PRACTICE SETTING (Full-time Orthopaedists)

© Orthopaedic Practice in the US 2018 Survey work is conducted for the benefit of and is owned by the AAOS. Not to be duplicated without consent. January 2019
37
WORK HOURS BY DEGREE OF SPECIALIZATION
Significant differences in work hours of full-time orthopaedists are evident across degree of specialization [F (2, 4915) = 91.973; p<.01]. Specialists report the longest work hours (54.22 per week), while generalists work the least number of hours (47.88 per week).
Figure 31 - Full Time Orthopaedists' Work Hours* by Degree of Specialization
Degree of Specialization N Mean Std. Dev. Std. Error Min Max 95% CI (+/-)
General orthopaedic surgeon 555 47.88 11.846 .503 8 100 0.99
Generalist with an area of specialty interest
1,238 50.86 10.954 .311 0 100 0.61
Specialist within orthopaedic surgery 3,125 54.22 11.645 .208 0 120 0.41
Total 4,918 52.66 11.709 .167 0 120
*Excludes On-call times

© Orthopaedic Practice in the US 2018 Survey work is conducted for the benefit of and is owned by the AAOS. Not to be duplicated without consent. January 2019
38
WORK HOURS BY AGE GROUP
The number of work hours per week varies by age group [F (4, 4905) = 47.357; p<.01]. Full-time orthopaedic surgeons under the age of 60 work the most and surgeons in the 60 to 69 years old (50.87 hours) and the 70 years old and older (43.09 hours) age groups work the least per week.
Figure 32 - Full-time Orthopaedists' Work Hours* by Age Group Age Group N Mean Std. Dev. Std. Error Min Max 95% CI (+/-)
Under 40 yrs old 1,050 54.27 11.002 .340 2 120 0.67
40 to 49 yrs old 1,356 53.61 10.994 .299 9 120 0.59
50 to 59 yrs old 1,405 52.86 11.406 .304 0 110 0.60
60 to 69 yrs old 901 50.87 12.453 .415 1 120 0.81
70 yrs old and over 198 43.09 13.290 0.944 0 87 1.86
Total 4,910 52.61 11.707 .167 0 120
*Excludes On-call times

© Orthopaedic Practice in the US 2018 Survey work is conducted for the benefit of and is owned by the AAOS. Not to be duplicated without consent. January 2019
39
TIME AWAY FROM PRACTICE
WEEKS VACATION
Orthopaedists were asked to report the total number of weeks spent away from their practice for vacation. Full-time orthopaedists from public institutions and pre-paid plan/HMO settings had the most weeks of vacation (average 5.5 – 5.6 weeks). Respondents from military practice, academic practice, and private practice – solo group settings have an average of three to four weeks of vacation. Respondents from locum tenens had the least at 2 weeks. Differences between practice settings are statistically significant [F (10, 4906) = 8.573; p<.01].
Figure 33 - Weeks of Vacation by Practice Setting (Full-time Orthopaedists Only)
4.13
4.29
4.47
3.61
3.70
3.55
5.63
5.47
4.81
2.00
5.78
0 1 2 3 4 5 6
Private Practice-Solo (income self-earned)
Private Practice - Orthopaedic Group
Private Practice - Multi-spec. Group
Academic Practice (salary from academic institution)
Academic Practice (salary from private practice)
Military Practice (salary from military)
Public Institution (salary from non-military govt. entity)
Pre-paid Plan/HMO (salary from HMO)
Hospital/Medical Center (salary from hospital/med. center)
Locum Tenens
Other
Weeks Vacation
WEEKS VACATION BY PRACTICE SETTING (Full-time Orthopaedists)

© Orthopaedic Practice in the US 2018 Survey work is conducted for the benefit of and is owned by the AAOS. Not to be duplicated without consent. January 2019
40
WEEKS VACATION BY GENDER
Full-time female orthopaedists spend an average of 4.15 weeks for vacation, while male orthopaedists spend an average of 4.31 weeks. However, the difference between gender is not statistically significant [F (1, 4921) = 0.729; p=0.393].
Figure 34 - Weeks of Vacation by Gender
Gender N Mean Std. Dev. Std. Error Min Max 95% CI (+/-)
Male 4,538 4.31 3.676 .055 0 53 0.26
Female 385 4.15 2.970 .151 0 46 0.11
WEEKS VACATION BY AGE GROUP
On average, full-time orthopaedic surgeons younger than 50 years old report the fewest number of weeks away from their practice for vacation (average 4 weeks or less). Those aged 70 and older report the greatest number of weeks away from their practice for vacation (average 6.15 weeks). Differences between age groups are statistically significant [F (4, 4900) = 28.901; p<.01].
Figure 35 - Weeks of Vacation by Age Group
Age Group N Mean Std. Dev. Std. Error Min Max 95% CI (+/-)
Under 40 yrs old 1,048 3.69 2.319 .072 0 46 0.14
40 to 49 yrs old 1,358 4.00 2.359 .064 0 48 0.13
50 to 59 yrs old 1,408 4.45 3.769 .100 0 53 0.20
60 to 69 yrs old 893 4.85 4.603 .154 0 50 0.30
70 and over yrs old 198 6.15 7.500 .533 0 50 1.05

© Orthopaedic Practice in the US 2018 Survey work is conducted for the benefit of and is owned by the AAOS. Not to be duplicated without consent. January 2019
41
DAYS AWAY FOR EDUCATION
On average, full-time orthopaedists spent 7.63 days away from their practice for orthopaedic education and training.
Figure 36 - Full-time Orthopaedists Only - Time Spent Away from Practice Valid N Missing N Mean Std Dev Min Max 95% CI (+/-)
Days spent out of practice for CME 4,924 38 7.63 5.546 0 90 0.155
DAYS AWAY FOR EDUCATION BY PRACTICE SETTING
Full-time orthopaedists from the academic practice groups spent the most days away from practice for CME (including Annual Meeting – an average of 10.8 - 11.2 days). Orthopaedists from private practice (group) settings spent the least amount of days (6.58) away from practice for orthopaedic courses. Orthopaedists from other practice settings averaged seven to eight days spent for courses. Differences between groups are statistically significant [F (10, 4908) = 44.88; p<.01].
Figure 37 - Days Spent Away for Business Meetings/Education by Practice Setting Orthopaedic Courses – CME
N Mean Std. Dev 95% CI (+/-)
Private practice - Solo (income self-earned) 524 7.28 5.205 0.45
Private practice - Orthopaedic Group (income from group) 1837 6.58 4.224 0.19
Private practice - Multi-specialty Group (income from group) 445 6.58 4.108 0.38
Academic Practice (salary from academic institution) 721 10.80 7.645 0.56
Academic Practice (salary from private practice) 202 11.21 8.962 1.24
Military Practice (salary from military) 92 7.93 5.715 1.18
Public Institution (salary from non-military government entity) 51 8.22 6.008 1.69
Pre-paid Plan/HMO (salary from HMO 65 7.26 3.722 0.92
Hospital/Medical Center (salary from hospital/medical center) 893 7.10 4.465 0.29
Locum Tenens 1 7.00 7.00
Other (Please specify) 88 7.51 5.422 1.15

© Orthopaedic Practice in the US 2018 Survey work is conducted for the benefit of and is owned by the AAOS. Not to be duplicated without consent. January 2019
42
DAYS AWAY FOR EDUCATION BY AGE GROUP
Overall, there are significant differences between age groups in terms of days spent away from practice for orthopaedic courses [F (4, 4900) = 16.117; p<.01]. Full-time orthopaedic surgeons aged 60 to 69 years old (8.52 days) and those 70 years and older (9.46 days) spent more days away from practice for training and orthopaedic courses than did younger surgeons (under 60 years old).
Figure 38 - Days Away by Age Group Orthopaedic Courses - CME
N Mean Std. Dev 95% CI (+/-)
Under 40 yrs old 1,046 7.02 4.508 0.27
40 to 49 yrs old 1,361 7.25 5.005 0.27
50 to 59 yrs old 1,404 7.64 5.573 0.29
60 to 69 yrs old 898 8.52 6.252 0.41
70 and over yrs old 196 9.46 8.866 1.25
DAYS AWAY FOR EDUCATION BY SPECIALIZATION
Orthopaedic specialists reported the highest number of days away for education/training (8.28) compared to 6.58 days for generalists with specialty interest and 6.32 days for generalists. Differences between the three groups are statistically significant [F (2, 4910) = 60.302; p<.01].
Figure 39 - Days Away by Specialization
Orthopaedic Courses - CME
N Mean Std. Dev 95% CI (+/-)
General Orthopaedic Surgeon 555 6.32 4.189 0.35
General Orthopaedic Surgeon w/specialty interest 1233 6.58 4.072 0.23
Specialist within Orthopaedic Surgery 3125 8.28 6.130 0.22

© Orthopaedic Practice in the US 2018 Survey work is conducted for the benefit of and is owned by the AAOS. Not to be duplicated without consent. January 2019
43
PATIENTS BY PAYOR SOURCE
Orthopaedic surgeons were asked to approximate the distribution of their patients by payor source. Overall, the highest percentage of orthopaedists payor source is made up of private insurance (39.6%) followed next by Medicare at 27.3%. There were significant differences found between full-time and part-time orthopaedists for all payor source categories. Verbatim responses for “other sources” can be found in Appendix C, Table 4.
Figure 40 - Distribution of Payor Source by Work Status
39.6 41.4
23.4
27.327.9
21.9
11.311.5
9.5
8.78.1
14.2
3.03.0
3.7
2.32.0
4.9
7.6 6.0
22.5
0%
10%
20%
30%
40%
50%
60%
70%
80%
90%
100%
Overall Full-time Only Part-time Only
DISTRIBUTION OF PAYOR SOURCE BY WORK STATUS
Other sources
Charity/Pro-bono
Self-pay
Worker's compensation
Medicaid
Medicare
Private insurance(HMO/PPO/IPA)
4.51 20.57
3.08
4.07
10.18
3.00 3.16
61.14

© Orthopaedic Practice in the US 2018 Survey work is conducted for the benefit of and is owned by the AAOS. Not to be duplicated without consent. January 2019
44
PAYOR SOURCE BY DEGREE OF SPECIALIZATION: FULL-TIME ORTHOPAEDISTS ONLY
Aside from self-pay and charity/pro-bono, statistically significant differences were found between generalists, general orthopaedic surgeons with specialty interest, and specialists for all other payor sources. In all three groups, the top two payor sources were private insurance and Medicare.
Figure 41 - Distribution of Payor Source by Degree of Specialization
33.4
40.8 43.1
29.8
29.5 27.0
10.9
10.0 12.29.7
9.2 7.53.3
3.0 2.91.9
1.8 2.211.05.6 5.1
0%
10%
20%
30%
40%
50%
60%
70%
80%
90%
100%
Generalist General withspecialty interest
Specialist
DISTRIBUTION OF PAYOR SOURCE BY DEGREE OF SPECIALIZATION - FULL-TIME ORTHOPAEDISTS
Other sources
Charity/Pro-bono
Self-pay
Worker's compensation
Medicaid
Medicare
Private insurance(HMO/PPO/IPA)

© Orthopaedic Practice in the US 2018 Survey work is conducted for the benefit of and is owned by the AAOS. Not to be duplicated without consent. January 2019
45
PAYOR SOURCE BY PRACTICE SETTING
Among full-time orthopaedic surgeons, statistically significant differences were found between practice setting groups in terms of payor sources. Aside from those in military practice, public institutions and locum tenens (temporary substitutes), orthopaedists in other practice settings had private insurance and Medicare as their top payor sources.
Figure 42 - Payor Source by Practice Setting
Private insurance
carrier (HMO/PPO/IPA)
Medicare Medicaid Worker's Compensation
Self-Pay
Charity/Pro-Bono
Other sources
Private practice - Solo (income self-earned) 41.61 27.88 7.36 13.54 3.99 1.50 4.12 Private practice - Orthopaedic Group (income from group) 46.18 30.74 7.14 9.69 2.89 1.57 1.80
Private practice - Multi-specialty Group (income from group) 44.40 31.55 9.02 8.52 2.33 1.43 2.74
Academic Practice (salary from academic institution) 37.16 24.32 21.30 4.49 3.36 3.88 5.50
Academic Practice (salary from private practice) 45.11 26.13 13.65 6.77 3.44 2.46 2.44
Military Practice (salary from military) 10.08 2.15 .74 0.18 .05 .54 86.25 Public Institution (salary from non-military government entity) 6.30 7.14 8.26 3.02 1.50 .98 72.80
Pre-paid Plan/HMO (salary from HMO) 80.38 10.57 2.85 3.32 0.03 0.54 2.31 Hospital/Medical Center (salary from hospital/medical center) 36.27 29.71 17.68 6.10 2.96 2.20 5.07
Locum Tenens 10.00 40.00 40.00 10.00 0.00 0.00 0.00
Other (Please specify) 28.82 20.50 10.45 10.45 3.64 4.06 22.08

© Orthopaedic Practice in the US 2018 Survey work is conducted for the benefit of and is owned by the AAOS. Not to be duplicated without consent. January 2019
46
Figure 43 - Payor Source by Practice Setting (Graph)
41.61
46.18
44.40
37.16
45.11
10.08
6.30
80.38
36.27
10.00
28.82
27.88
30.74
31.55
24.32
26.13
2.15
7.14
10.57
29.71
40.00
20.50
7.36
7.14
9.02
21.30
13.65
.74
8.26
2.85
17.68
40.00
10.45
13.54
9.69
8.52
4.49
6.77
0.18
3.02
3.…
6.10
10.00
10.45
3.99
2.89
2.33
3.36
3.44
.05
1.50
0.03
2.96
3.64
1.50
1.57
1.43
3.88
2.46
.54
.98
0.54
2.20
4.06
4.12
1.80
2.74
5.50
2.44
86.25
72.80
2.31
5.07
22.08
P R I V A T E P R A C T I C E - S O L O ( I N C O M E S E L F - E A R N E D )
P R I V A T E P R A C T I C E -O R T H O P A E D I C G R O U P
( I N C O M E F R O M G R O U P )
P R I V A T E P R A C T I C E -M U L T I - S P E C I A L T Y G R O U P ( I N C O M E F R O M G R O U P )
A C A D E M I C P R A C T I C E ( S A L A R Y F R O M
A C A D E M I C I N S T I T U T I O N )
A C A D E M I C P R A C T I C E ( S A L A R Y F R O M
P R I V A T E P R A C T I C E )
M I L I T A R Y P R A C T I C E ( S A L A R Y F R O M M I L I T A R Y )
P U B L I C I N S T I T U T I O N ( S A L A R Y F R O M N O N -
M I L I T A R Y G O V E R N M E N T E N T I T Y )
P R E - P A I D P L A N / H M O ( S A L A R Y F R O M H M O )
H O S P I T A L / M E D I C A L C E N T E R ( S A L A R Y F R O M
H O S P I T A L / M E D I C A L C E N T E R )
L O C U M T E N E N S
O T H E R
PAYOR SOURCE BY PRACTICE SETTING
Private insurance carrier (HMO/PPO/IPA) Medicare Medicaid
Worker's Compensation Percent from Self-Pay Charity/Pro-Bono
Other sources

© Orthopaedic Practice in the US 2018 Survey work is conducted for the benefit of and is owned by the AAOS. Not to be duplicated without consent. January 2019
47
NUMBER OF SURGICAL PROCEDURES PERFORMED PER MONTH
Overall, orthopaedists perform an average of 30 procedures per month, with full-time orthopaedists performing 32 procedures per month, and part-timers performing 7 procedures per month. There are significant differences between the full-time and part-time group in the number of procedures they perform per month [F (1, 5412) = 924.459; p<.01].
Figure 44 - Procedures Performed per Month by Work Status
N Mean Std. Deviation 95% CI (+/-)
Full-time 4,909 32.14 17.961 0.51
Part-time 505 7.25 12.299 1.07
Total 5,414 29.81 18.946 0.50
NUMBER OF SURGICAL PROCEDURES PER MONTH BY PRACTICE TYPE
Looking at full-time orthopaedists only, specialists average 34 procedures a month, generalists with specialty interests average 31 procedures per month, and generalists average 25 procedures per month. There are significant differences between groups in the number of procedures they perform per month [F (2, 4899) = 60.45; p<.01].
Figure 45 - Procedures Performed by Month by Practice Type N Mean Std. Deviation 95% CI (+/-)
General orthopaedic surgeon 546 25.14 16.032 1.35
Generalist with an area of specialty interest
1,233 30.87 16.251 0.90
Specialist within orthopaedic surgery 3,123 33.86 18.554 0.65

© Orthopaedic Practice in the US 2018 Survey work is conducted for the benefit of and is owned by the AAOS. Not to be duplicated without consent. January 2019
48
NUMBER OF SURGICAL PROCEDURES PER MONTH BY PRACTICE SETTING
Looking at full-time orthopaedists only, those in private practice – ortho group and academic practice (salary from private practice) average nearly 36 procedures per month. Orthopaedists in military practice and public institution settings tend to perform the fewest – averaging approximately 20 procedures per month. There are significant differences between groups in the number of procedures they perform per month [F (9, 4894) = 25.134; p<.01].
Figure 46 - Procedures Performed per Month by Practice Setting
N
Mean
Std. Deviation
95% CI (+/-)
Private practice – solo (income self-earned) 521 28.07 19.678 1.69
Private practice - Orthopaedic Group (income from group) 1834 35.91 18.724 0.85
Private practice - Multi-specialty Group (income from group) 442 31.94 16.113 1.51
Academic Practice (salary from academic institution) 722 30.03 18.346 1.34
Academic Practice (salary from private practice) 200 35.67 18.351 2.56
Military Practice (salary from military) 92 20.24 8.685 1.80
Public Institution (salary from non-military gov’t. entity)
52 19.92 11.822 3.29
Pre-paid Plan/HMO (salary from HMO) 65 26.26 9.244 2.29
Hospital/Medical Center (salary from hospital/medical center) 891 30.74 14.537 0.96
Other 85 24.93 19.421 4.19

© Orthopaedic Practice in the US 2018 Survey work is conducted for the benefit of and is owned by the AAOS. Not to be duplicated without consent. January 2019
49
NUMBER OF SURGICAL PROCEDURES PER MONTH BY AGE GROUP
Looking at full-time orthopaedists only, orthopaedists between 40 to 59 years old perform an average of 35 procedures per month. Orthopaedists 70 years old and over perform the fewest – averaging approximately 20 procedures per month. There are significant differences between groups in the number of procedures they perform per month [F (4, 4885) = 69.812; p<.01].
Figure 47 - Procedures Performed per Month by Age Group
N Mean Std. Deviation 95% CI (+/-)
Under 40 years old 1050 29.08 13.420 0.81
40 to 49 years old 1356 35.57 17.425 0.93
50 to 59 years old 1403 35.48 19.421 1.02
60 to 69 years old 896 27.79 18.368 1.20
70 years old and over 185 20.04 18.631 2.70

© Orthopaedic Practice in the US 2018 Survey work is conducted for the benefit of and is owned by the AAOS. Not to be duplicated without consent. January 2019
50
NUMBER OF SURGICAL PROCEDURES PERFORMED PER MONTH BY DIVISION
Overall, the number of monthly procedures performed by full-time orthopaedists varies a bit by census division [F (9, 4876) = 12.766; p<.01]. On average, orthopaedists in the East South Central division (37) perform a higher number of monthly procedures than do orthopaedists in the Pacific division (27).
Figure 48 - Surgical Procedures per Month by Census Division
N Mean Std. Deviation 95% CI (+/-)
New England 261 31.64 28.117 3.43
Mid Atlantic 666 30.38 18.823 1.44
East North Central 699 33.65 16.112 1.19
West North Central 428 34.96 16.228 1.54
South Atlantic 987 32.18 17.214 1.08
East South Central 262 37.15 16.930 2.06
West South Central 474 33.15 18.647 1.69
Mountain 361 34.39 17.648 1.83
Pacific 740 27.28 14.745 1.06
© Orthopaedic Practice in the US 2018 Survey work is conducted for the benefit of and is owned by the AAOS. Not to be duplicated without consent. January 2019
51
SPECIFIC PROCEDURES PERFORMED PER MONTH – OVERALL
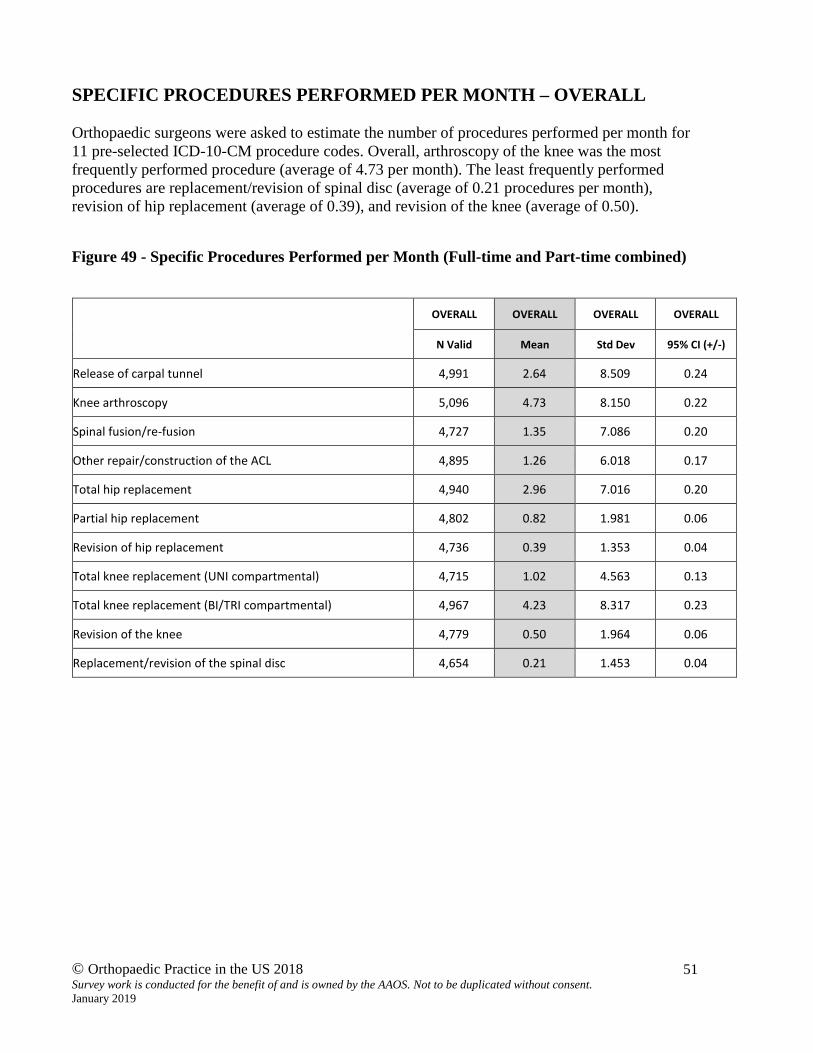
Orthopaedic surgeons were asked to estimate the number of procedures performed per month for 11 pre-selected ICD-10-CM procedure codes. Overall, arthroscopy of the knee was the most frequently performed procedure (average of 4.73 per month). The least frequently performed procedures are replacement/revision of spinal disc (average of 0.21 procedures per month), revision of hip replacement (average of 0.39), and revision of the knee (average of 0.50).
Figure 49 - Specific Procedures Performed per Month (Full-time and Part-time combined)
OVERALL OVERALL OVERALL OVERALL
N Valid Mean Std Dev 95% CI (+/-)
Release of carpal tunnel 4,991 2.64 8.509 0.24
Knee arthroscopy 5,096 4.73 8.150 0.22
Spinal fusion/re-fusion 4,727 1.35 7.086 0.20
Other repair/construction of the ACL 4,895 1.26 6.018 0.17
Total hip replacement 4,940 2.96 7.016 0.20
Partial hip replacement 4,802 0.82 1.981 0.06
Revision of hip replacement 4,736 0.39 1.353 0.04
Total knee replacement (UNI compartmental) 4,715 1.02 4.563 0.13
Total knee replacement (BI/TRI compartmental) 4,967 4.23 8.317 0.23
Revision of the knee 4,779 0.50 1.964 0.06
Replacement/revision of the spinal disc 4,654 0.21 1.453 0.04

© Orthopaedic Practice in the US 2018 Survey work is conducted for the benefit of and is owned by the AAOS. Not to be duplicated without consent. January 2019
52
SPECIFIC PROCEDURES PERFORMED PER MONTH: FULL-TIME VS PART-TIME
Full-time orthopaedists perform arthroscopy of the knee (average of 5.05 procedures per month) and bi/tri-compartmental total knee replacement (4.56) most often. The top procedures are the same for part-time orthopaedists with arthroscopy of the knee averaging 1.47 procedures per month and bi/tri-compartmental total knee replacement at 0.86 procedures.
The most infrequent procedure performed by full-time and part-time orthopaedists is replacement and/or revision of the spinal disc (0.23 and 0.06 respectively). Other infrequent procedures include revision of hip replacement and revision of the knee.
There were significant differences found between full-time and part-time surgeons in terms of number of procedures performed per month for each of the listed procedures.
Figure 50 - Specific Procedures Performed per Month - Full-time vs Part-time
FULL TIME
PART TIME
N Valid
Mean
Std Dev 95% CI
(+/-)
N Valid
Mean
Std Dev 95% CI
(+/-)
Release of carpal tunnel 4,524 2.82 8.884 0.259 464 0.90 2.441 0.222
Knee arthroscopy 4,631 5.05 8.275 0.190 461 1.47 5.893 0.538
Spinal fusion/re-fusion 4,279 1.47 7.425 0.250 448 0.20 1.338 0.124
Other repair/construction of the ACL 4,443 1.37 6.304 0.110 450 0.11 0.476 0.044
Total hip replacement 4,479 3.19 7.295 0.140 460 0.68 2.167 0.198
Partial hip replacement 4,354 0.85 1.978 0.070 448 0.49 1.977 0.183
Revision of hip replacement 4,288 0.43 1.410 0.070 448 0.08 0.478 0.044
Total knee replacement (UNI compartmental) 4,266 1.08 4.748 0.110 448 0.38 2.006 0.186
Total knee replacement (BI/TRI compartmental) 4,507 4.56 8.612 0.190 459 0.86 2.716 0.249
Revision of the knee 4,328 0.54 2.053 0.060 451 0.10 0.496 0.046
Replacement/revision of the spinal disc 4,210 0.23 1.514 0.120 444 0.06 0.615 0.057

© Orthopaedic Practice in the US 2018 Survey work is conducted for the benefit of and is owned by the AAOS. Not to be duplicated without consent. January 2019
53
SPECIFIC PROCEDURES PERFORMED PER MONTH: FULL-TIME ORTHOPAEDISTS ONLY BY DEGREE OF SPECIALIZATION
Statistically significant differences were found in the number of procedures performed by full-time orthopaedists across degree of specialization for all procedures except total hip replacement, total knee replacement (uni-compartmental) and other repair/construction of the ACL.
The most frequently performed procedures among generalists are arthroscopy of the knee (average of 6.33 procedures per month) and bi/tri-compartmental total knee replacement (4.32 procedures). Their least frequently performed procedures are replacement of spinal disc (0.02 procedures), spinal fusion/re-fusion (0.03), revision of hip replacement (0.21), and revision of the knee (0.29).
The top procedures generalists with specialty interest perform are arthroscopy of the knee (average of 7.45 procedures per month) and bi/tri-compartmental total knee replacement (5.87 procedures). Their least frequently performed procedures are replacement of spinal disc (0.04 procedures), spinal fusion/re-fusion (0.19), revision of hip replacement (0.30), and revision of the knee (0.45).
The top procedures specialists perform are bi/tri-compartmental total knee replacement (average of 4.05 procedures per month) and arthroscopy of the knee (3.78 procedures). Their least frequently performed procedure is replacement/revision of the spinal disc (0.34 procedures per month).
Figure 51 - Procedures Performed per Month - Full-time Only by Degree of Specialization General
orthopaedic surgeon
General orthopaedic surgeon w/ specialty
interest
Specialist within orthopaedic
surgery
Release of carpal tunnel 2.71 2.31 3.06
Knee arthroscopy 6.33 7.45 3.78
Spinal fusion/re-fusion .03 .19 2.20
Other repair/construction of the ACL 0.98 1.68 1.31
Total hip replacement 2.62 3.27 3.26
Partial hip replacement 1.20 1.21 0.64
Revision of hip replacement .21 .30 .51
Total knee replacement (UNI compartmental) 1.26 1.26 .98
Total knee replacement (BI/TRI compartmental) 4.32 5.87 4.05
Revision of the knee .29 0.45 .62
Replacement/revision of the spinal disc .02 .04 .34

© Orthopaedic Practice in the US 2018 Survey work is conducted for the benefit of and is owned by the AAOS. Not to be duplicated without consent. January 2019
54
VI. APPENDIX A: 2018 SURVEY QUESTIONNAIRE
Please enter the SURVEY ID provided to you in your email invitation. ________ Q1 Race/Ethnicity
o African American
o Asian
o Caucasian
o Hispanic/Latino
o Multi-racial
o Native American
o Other ________________________________________________ Q2 Sex:
o Male
o Female Q3 I am a member of: (Check all that apply.)
▢ American College of Surgeons
▢ American Medical Association
▢ State Medical Society
▢ State Orthopaedic Society Q4 Year you began your orthpaedic career (1st year of practice). Please answer in XXXX format. Example: 1970, 1984, etc.
________________________________________________________________

© Orthopaedic Practice in the US 2018 Survey work is conducted for the benefit of and is owned by the AAOS. Not to be duplicated without consent. January 2019
55
Q5 Work Status:
o Full-time
o Part-time
o Retired Q6 Which category best describes you?
o General orthopaedic surgeon
o General orthopaedic surgeon with an area of specialty interest (at least 25% but less than 75% of practice committed to an area of specialty interest)
o Specialist within orthopaedic surgery (75% or more of practice committed to an area of specialty interest)
Q7 Which setting listed below best describes your practice?
o Private Practice - Solo (income self-earned)
o Private Practice - Orthopaedic Group (income from group)
o Private Practice - Multi-spec. Group (income from group)
o Academic Practice (salary from academic institution)
o Academic Practice (salary from private practice)
o Military Practice (salary from military)
o Public Institution (salary from non-military govt. entity)
o Pre-paid Plan/HMO (salary from HMO)
o Hospital/Medical Center (salary from hospital/med. center)
o Locum Tenens
o Other ________________________________________________ Q7a Number of Orthopaedic surgeons in your group: ________________________________________ (Q7a asked if Q7 response = Private Practice - Orthopaedic Group OR Private Practice - Multi-spec. Group)

© Orthopaedic Practice in the US 2018 Survey work is conducted for the benefit of and is owned by the AAOS. Not to be duplicated without consent. January 2019
56
Q8 Your PRIMARY SPECIALTY AREA is in:
o Adult hip
o Adult knee
o Adult spine
o Arthroscopy
o Disability/legal ortho
o Foot & ankle
o Hand
o Non-operative practice
o Orthopaedic oncology
o Pediatric orthopaedics
o Pediatric spine
o Rehab, prosthe/orthotics
o Shoulder & elbow
o Sports medicine
o Total joint
o Trauma
o I don't have a specialty area
o Other ________________________________________________

© Orthopaedic Practice in the US 2018 Survey work is conducted for the benefit of and is owned by the AAOS. Not to be duplicated without consent. January 2019
57
Q9 Not including your primary specialty, what are your OTHER SPECIALTY AREAS if applicable (Check all that apply.)
▢ Adult hip
▢ Adult knee
▢ Adult spine
▢ Arthroscopy
▢ Disability/legal ortho
▢ Foot & ankle
▢ Hand
▢ Non-operative practice
▢ Orthopaedic oncology
▢ Pediatric orthopaedics
▢ Pediatric spine
▢ Rehab, prosthe/orthotics
▢ Shoulder & elbow
▢ Sports medicine
▢ Total joint
▢ Trauma
▢ I don't have a specialty area
▢ Other ________________________________________________

© Orthopaedic Practice in the US 2018 Survey work is conducted for the benefit of and is owned by the AAOS. Not to be duplicated without consent. January 2019
58
Q10 Average work hours per week (exclude on-call time). (Please enter the numeric amount only.) Q11 Weeks of vacation per year. (Please enter the numeric amount only.) Q12 Days spent out of practice for CME (including Annual Meeting). (Please enter numeric amount only.)
Q13 What is the approximate distribution of patients by payer source? (Answers must add up to 100%)
a) Private insurance carrier (HMO/PPO/IPA): ______
b) Medicare: _______
c) Medicaid: _______
d) Worker's Compensation: ______
e) Percent from Self-Pay: _______
f) Charity/Pro-Bono: ______
g) Other sources: _______
Q14 Number of procedures you do in a typical month: (Please enter the numeric amount only.) Q15 Approximately how many of the following procedures do you do a month?
_______ a) Release of carpal tunnel
_______ b) Knee arthroscopy
_______ c) Spinal fusion/re-fusion
_______ d) Other repair/construction of ACL
_______ e) Total hip replacement
_______ f) Partial hip replacement
_______ g) Revision of hip replacement
_______ h) Total knee replacement (unicompartmental)
_______ i) Total knee replacement bi/tri compartmental
_______ j) Revision of knee
_______ k) Replacement/revision of spinal disc
Q16 Amount paid for your current professional liability coverage: (Please enter the numeric amount only. No letters, commas, or symbols. Example: 3000000) Q17 GROSS income in 2017: (Please enter the numeric amount only. No letters, commas, or symbols. Example: 3000000) Q18 NET income in 2017: (Please enter the numeric amount only. No letters, commas, or symbols. Example: 3000000) Thank you for taking time to complete the 2018 Census
© Orthopaedic Practice in the US 2018 Survey work is conducted for the benefit of and is owned by the AAOS. Not to be duplicated without consent. January 2019
59
VII. APPENDIX B: US CENSUS DIVISIONS
1 New
England
CT Connecticut 6 East
South Central
AL Alabama
MA Massachusetts KY Kentucky
ME Maine MS Mississippi
NH New Hampshire TN Tennessee
RI Rhode Island 7 West
South
AR Arkansas
VT Vermont LA Louisiana
2 Mid
Atlantic
NJ New Jersey OK Oklahoma
NY New York TX Texas
PA Pennsylvania 8 Mountain
AZ Arizona
3 East
North Central
IL Illinois CO Colorado
IN Indiana ID Idaho
MI Michigan MT Montana
OH Ohio NM New Mexico
WI Wisconsin NV Nevada
4 West
North Central
IA Iowa UT Utah
KS Kansas WY Wyoming
MN Minnesota 9 Pacific AK Alaska
MO Missouri CA California
ND North Dakota HI Hawaii
NE Nebraska OR Oregon
SD South Dakota WA Washington
5 South
Atlantic
DC District of Columbia
DE Delaware
FL Florida
GA Georgia
MD Maryland
NC North Carolina
SC South Carolina
VA Virginia
WV West Virginia

© Orthopaedic Practice in the US 2018 Survey work is conducted for the benefit of and is owned by the AAOS. Not to be duplicated without consent. January 2019
60
VIII. APPENDIX C: OPEN ENDED RESPONSES
Table 1 - Other Race Reported
Frequency
1 Arabic 2 2 Armenian 3 3 Asian Indian 4 4 Cuban 1 5 Egyptian 2 6 Indian 17 7 Iranian 8 8 Italian 3 9 Jewish 3
10 Middle Eastern 6 11 Native American 3 12 Pakistani 3 13 Scandinavian 6 15 Sri Lankan 2 16 Turkish 1
Table 2 - Other Practice Setting Reported
Frequency
1 Academic Practice 5 2 Administrative 1 3 Big Orthopaedic group but income dependant on self productivity 1 4 Charity hospital 1 5 combination academic and private practice 2 6 combination academic and public institution 1 7 Community clinics 1 8 Consulting 3 9 Contractor 2
10 CURE missionary orthopedic surgeon 1 11 Dept of Veterans Affairs 1 12 doing independent medical examinations 1 13 Employed by a nationwide multi specialty corporation 1 14 Employed by health system reimbursed by rv 1 15 employee - d_ury Center 1 16 evaluations only 1 17 Exam only independent contractor 1 18 Expert witness 1 19 Forensic 3 20 Group practice 1 21 Health system employed 5

© Orthopaedic Practice in the US 2018 Survey work is conducted for the benefit of and is owned by the AAOS. Not to be duplicated without consent. January 2019
61
22 HospitalSystem Based Medical Group, rvu based, not salary 1 23 IME 3 24 income from Foundation 1 25 Independent contractor as Orthopaedic hospitalist 1 26 independent contractor for hospital 1 27 Independent contractor for Orthopaedic group 1 28 Insurance company (Unum) 1 29 Insurance evaluations 1 30 Insurance medical director 1 31 insurance review 1 32 Kaiser 2 33 Management Consultant not practicing 1 34 Med-Legal 3 35 Medical Consultant 1 36 Medical Director 1 37 Medical group 1 38 Medical Management 1 39 Medical Mission work 2 40 Medical-Legal Consultant 2 41 military contractor 1 42 Multiple sources 1 43 NGO 1 44 Not in clinical practice 2 45 Ortho group 5 46 ortho hospitalist 1 47 ortho ime's ortho peer review 1 48 OrthoNet/ United Health Care employed medical director 1 49 ORTHOPAEDIC LLC hired by hospital RVU 1 50 Orthopaedic Missionary 1 51 orthopaedic trauma hospitalist 1 52 Orthopedic Consultant 1 53 Orthopedic disability exams 1 54 orthopedic independent exams 1 55 Part time ortho group/part time Veterans Administration 1 56 part time surgical assist, consulting 1 57 part time, just office, no surgery 1 58 Private 501(c)(3)corp indirectly affiliated with hospital 1 59 Private academic 3 60 Private group academic practice 1 61 Private group-income self earned 1 62 Private Practice 10 63 Professional services agreement at small hospital working for a wRVU
rate 1
64 PSA 2 65 QME 1 66 Quality Consultant/Utilization Review/ Legal 1 67 Salaried employee of a pediatric subspecialty hospital 1 68 Salaried physician in an orthopedic group 1 69 Salary from a non-profit private 1 70 Salary from non-clinical insurance contractor 1

© Orthopaedic Practice in the US 2018 Survey work is conducted for the benefit of and is owned by the AAOS. Not to be duplicated without consent. January 2019
62
71 self employed as a consultant 1 72 Semi-retired; QME only 1 73 Shriners 2 74 Single specialty group private practice self earned income 1 75 subcontract for multispecialty group 1 76 Surgicalist 1 77 synergy/delphi model, similar to locum but ongoing 1 78 Teaching and consulting 1 79 Team Health 1 80 Transitioning from academic to private practice 1 81 Utilization Review 2 82 Utilization Review, Associate Medical Director Insuror 1 83 VA 1 84 VA + PP ortho group 1 85 VA part time 1 86 VA/Academic 1 87 Veterans Administration 3 88 Volunteer 6 89 work for Ins Co - review disability claims 1 90 Worker Comp injury rating 1 91 Worker's Comp Review Corporation 1
Table 3 - Other Primary Specialty Areas Reported
Frequency 1 Administrative 3 2 Adult & Ped Spine 1 3 Adult and Pediatric Spine and Scoliosis 1 4 Adult Hip and Knee 5 5 Adult Reconstruction 2 6 adult reconstructive surgery and joint replacement 1 7 All areas running clinical trials 1 8 all ortho 1 9 also working wound clinic 1
10 applications of ultrasound 1 11 Assist 3 12 Clinical research 1 13 CMO 1 14 currently administrative 1 15 doing independent medical evaluations 1 16 Elbow, hand, Microvascular 1 17 exam police officers 1 18 Forensic orthopedics 3 19 General ortho 4 20 Geriatrics 1 21 Hand & upper extremity 1 22 Hand & Upper Extremity 1 23 Hand and Elbow 1 24 Hand and Shoulder 2

© Orthopaedic Practice in the US 2018 Survey work is conducted for the benefit of and is owned by the AAOS. Not to be duplicated without consent. January 2019
63
25 Hand foot general ortho 1 26 Hip Arthroscopy 2 27 Hip, Knee and Shoulder Recon 1 28 imes 1 29 Independent Medical Exams 1 30 Insurance Disability Review 1 31 Knee and Shoulder 5 32 lower extremity 1 33 Medical legal 4 34 Medical management 1 35 Missionary orthopedics 1 36 Multiple 1 37 musculoskeletal ultrasound 1 38 Nothing clinical at this time, just 8 hr / week teaching med school 1 39 Occupational orthopaedics 1 40 ortho imes peer review mal practice defense expert 1 41 orthopaedic reconstruction and limb lengthening 1 42 Orthopedic general consultation 1 43 Osteoporosis 1 44 part time academic 1 45 patellofemoral disorders 1 46 Pediatric hand 2 47 Pediatric Sports Medicine 2 48 Pediatric upper extremity 1 49 peer review 1 50 Performing arts medicine 1 51 Problems of the shoulder and spine 1 52 QME - Medico-legal CA 1 53 reconstruction 1 54 Shoulder 5 55 Shoulder, Elbow, Hand 2 56 Spine 6 57 Spine adult and pediatric 1 58 Upper Extremity 7 59 utilization review 1 60 variety 1 61 Workers Comp care consultant 1 62 wound care 1

© Orthopaedic Practice in the US 2018 Survey work is conducted for the benefit of and is owned by the AAOS. Not to be duplicated without consent. January 2019
64
Table 4 – Other Payor Sources
Frequency
1 ACAA 2
2 Academic stipend( donated back to university) 1
3 accident cases 1
4 Active Duty Military, dependents, and retirees 1
5 Administration 1
6 affordable care 1
7 Alaska IHS 1
8 All through health plan 1
9 All, do not know payer mix as employer is not transparent re: payer, charges, collections, etc. 1
10 Assist surgeons 1
11 Attorney 6
12 Auto 17
13 Auto PIP, LOP 1
14 Auto/pip 1
15 CHIPS 2
16 COMMERCIAL INSURANCES 3
17 contract/consulting 11
18 Corrections 1
19 County system 5
20 Department of Corrections 1
21 Direct benefit - PHS 1
22 Disability 3
23 DOING IME AND PRIVATE NO FAULT INSURANCE 1
24 DONT SEE PT MED STUDENTS ONLY 1
25 Evaluations 4
26 Exam contractor (QTC) 1
27 Federal government 4
28 FEDERAL GOVT ORTHO IME'S NON FEDERAL IME'S PEER REVIEW MEDICAL SOCIETY BOARD ACTIVITY (NO INCOME) 1
29 foreign 1
30 forensic 1
31 government-TriCare, VA, TriWest, DOD 1
32 Health system insurance i.e. EA Health 1
33 highschool insurance 1
34 HMO 2
35 Hospital 3
36 Hospital charity 2
37 Hospital Insurance 3

© Orthopaedic Practice in the US 2018 Survey work is conducted for the benefit of and is owned by the AAOS. Not to be duplicated without consent. January 2019
65
38 House call nursing homes 1
39 humana HMO(medicare HMO) 1
40 I am not sure the distribution but it's over 50% medicaid 1
41 IHS 4
42 IME 4
43 IME company 1
44 IME's 2
45 IME/Medical-Legal 1
46 IME/SMO 1
47 IMEs 1
48 IMES 1
49 Independent medical exams 1
50 Indian nation 1
51 Indigent insurance 2
52 Industry 2
53 injured police officers 1
54 ins evaluations 1
55 insurance 1
56 insurance c0mpanies 1
57 Insurance reviews 1
58 Insurance, Texas Medical Board, Utilization Review 1
59 Insurer medical Director/Consulting 1
60 International 3
61 jail 1
62 Kaiser Permanent 1
63 l&I 1
64 Lawyers/IME Vendors 1
65 Lebanese national security (like medicaid) 1
66 Legal 16
67 LEGAL AND WORK COMP 1
68 legal IME 1
69 Legal/car insurance 2
70 Legal/Injury Compensation 1
71 Lein 4
72 Liability 2
73 managed care 1
74 MC like with va and tricare 1
75 Medicaid HMO 1
76 Medical Director IME 1
77 Medical Legal 3
78 medico legal and insurance 1

© Orthopaedic Practice in the US 2018 Survey work is conducted for the benefit of and is owned by the AAOS. Not to be duplicated without consent. January 2019
66
79 Medico-Legal 17
80 Military 36
81 Military / VA 1
82 Military and dependents 1
83 Military Beneficiaries 2
84 Military Health System 2
85 Military Medicine 1
86 Military Tricare 7
87 Motor Vehicle 3
88 MVA 6
89 mva/legal 1
90 MVC 1
91 NJ Health (40%), No fault (6%) 1
92 No Fault 27
93 No patient care 1
94 No-Fault MVA/PIP 1
95 None- no longer clinical 4
96 Per Diem 1
97 Personal injury 6
98 Personal Injury 6
99 personal injury atty's 1
100 Personal Injury/LOP 1
101 PIP 3
102 PIP, IMEs 1
103 Private insurance 1
104 private, self pay, charity, other 1
105 PSA 1
106 QME 2
107 Referee exams 1 108 Regular insurance 1 109 retirement income 1 110 review company 1 111 Risk 1 112 RVU INCOME FROM MY HOSPITAL/MED CTR 1 113 Salary 3 114 salary administrator 1 115 Salary for Utilization Review 1 116 second opinions 1 117 self pay - fee-for-svc 1 118 Shriners Hospitals 2 119 Social Security 3

© Orthopaedic Practice in the US 2018 Survey work is conducted for the benefit of and is owned by the AAOS. Not to be duplicated without consent. January 2019
67
120 Sports organizations 1 121 state funded clinic 1 122 SUBCONTRACTOR FOR CUSTODY PTS 1 123 Texas Prison 1 124 Third Party 3 125 Third party/ MVA 1 126 Trade 1 127 Trauma 1 128 Tricare 32 129 TriCare 19 130 Tricare (3%), Auto (1%) 1 131 Tricare/Military 3 132 Tricare/triwest 1 133 Tricare/VA/Military 1 134 Unknown 89 135 US gov.referee,SSI,VR,witness 1 136 utillzation review 1 137 VA insurance system 1 138 VA medical center 2 139 VA patients 4 140 VA programs 1 141 VA salary 1 142 VA/Tricare 1 143 VAMC 1 144 VETERAN EVALS 1 145 Veterans Administration 11 146 Veterans Affairs 46 147 Veterans Health Care 3 148 Veterans Hospital 5 149 WI Dept of Corrections 1 150 Work Comp Med Legal 2 151 Worker Compensations insurers 1

© Orthopaedic Practice in the US 2018 Survey work is conducted for the benefit of and is owned by the AAOS. Not to be duplicated without consent. January 2019
68
IX. APPENDIX D: TABLE OF FIGURES Figure 1 - Orthopaedic Density by State ............................................................................................................................................... 6 Figure 2 - States with Highest and Lowest Surgeon Densities .............................................................................................................. 7 Figure 3 - Surgeon Density per 100,000 US Population ........................................................................................................................ 8 Figure 4 - Density of Orthopaedic Surgeons per 100,000 Population by Division ................................................................................ 9 Figure 5 - Orthopaedic Density by Division ......................................................................................................................................... 10 Figure 6 - Average Age of Orthopaedic Surgeons by State ................................................................................................................. 11 Figure 7 - Percentage of Gender by State ........................................................................................................................................... 12 Figure 8 - Age Distribution of Census Respondents ............................................................................................................................ 15 Figure 9 - Age Distribution by Work Status ......................................................................................................................................... 16 Figure 10 - Work Status by Age Groups .............................................................................................................................................. 17 Figure 11 - Gender by Member Category ........................................................................................................................................... 18 Figure 12 - Gender by Age Group ....................................................................................................................................................... 19 Figure 13 - Orthopaedists Race/Ethnicity ........................................................................................................................................... 20 Figure 14 - Race by Gender ................................................................................................................................................................. 21 Figure 15 - Race by Age Group ............................................................................................................................................................ 22 Figure 16 - Membership in Orthopaedic Societies .............................................................................................................................. 23 Figure 17 - Practice Setting: Full-time vs Part-time Orthopaedists ..................................................................................................... 24 Figure 18 - Work Status by Practice Type ........................................................................................................................................... 25 Figure 19 - Practice Setting ................................................................................................................................................................. 26 Figure 20 - Practice Setting by Work Status ........................................................................................................................................ 27 Figure 21 - Practice Setting by Age Group .......................................................................................................................................... 28 Figure 22 - Number of Surgeons in Private/Multi-Specialty Groups ................................................................................................... 29 Figure 23 - Degree of Specialization Distribution ................................................................................................................................ 30 Figure 24 - Degree of Specialization by Age Group ............................................................................................................................. 31 Figure 25 - Specialty Areas .................................................................................................................................................................. 32 Figure 26 - Chi Square Values of All Specialty Areas ........................................................................................................................... 33 Figure 27 - Specialty Area by Age Group ............................................................................................................................................. 34 Figure 28 - Average Hours per Week on All Activities (Excluding On-Call Time) ................................................................................. 35 Figure 29 - Work Hours Distribution by Full and Part-time Ortho Surgeons ....................................................................................... 35 Figure 30- Full-time Orthopaedists' Average Work Hours by Practice Setting ................................................................................... 36 Figure 31 - Full Time Orthopaedists' Work Hours* by Degree of Specialization ................................................................................. 37 Figure 32 - Full-time Orthopaedists' Work Hours* by Age Group ...................................................................................................... 38 Figure 33 - Weeks of Vacation by Practice Setting (Full-time Orthopaedists Only) ............................................................................ 39 Figure 34 - Weeks of Vacation by Gender........................................................................................................................................... 40 Figure 35 - Weeks of Vacation by Age Group ..................................................................................................................................... 40 Figure 36 - Full-time Orthopaedists Only - Time Spent Away from Practice ....................................................................................... 41 Figure 37 - Days Spent Away for Business Meetings/Education by Practice Setting .......................................................................... 41 Figure 38 - Days Away by Age Group .................................................................................................................................................. 42 Figure 39 - Days Away by Specialization ............................................................................................................................................. 42 Figure 40 - Distribution of Payor Source by Work Status .................................................................................................................... 43 Figure 41 - Distribution of Payor Source by Degree of Specialization ................................................................................................. 44 Figure 42 - Payor Source by Practice Setting ...................................................................................................................................... 45 Figure 43 - Payor Source by Practice Setting (Graph) ......................................................................................................................... 46 Figure 44 - Procedures Performed per Month by Work Status .......................................................................................................... 47 Figure 45 - Procedures Performed by Month by Practice Type .......................................................................................................... 47 Figure 46 - Procedures Performed per Month by Practice Setting ..................................................................................................... 48 Figure 47 - Procedures Performed per Month by Age Group ............................................................................................................. 49 Figure 48 - Surgical Procedures per Month by Division ...................................................................................................................... 50 Figure 49 - Specific Procedures Performed per Month ....................................................................................................................... 51 Figure 50 - Specific Procedures Performed per Month - Full-time vs Part-time ................................................................................. 52 Figure 51 - Number of Specific Procedures Performed per Month - Full-time Only by Degree of Specialization ............................... 53