Embed Size (px)
Citation preview
Aalborg Universitet
Mooring system reliability analysis of an ORE device using general Polynomial Chaos
Moura Paredes, Guilherme; Thomsen, Jonas Bjerg; Ferri, Francesco; Eskilsson, Claes
Published in:Proceedings of the 13<sup>th</sup> European Wave and Tidal Energy Conference
Publication date:2019
Document VersionEarly version, also known as pre-print
Link to publication from Aalborg University
Citation for published version (APA):Moura Paredes, G., Thomsen, J. B., Ferri, F., & Eskilsson, C. (2019). Mooring system reliability analysis of anORE device using general Polynomial Chaos. In Proceedings of the 13
th European Wave and Tidal Energy
Conference (pp. 1271-1-1271-8). European Tidal and Wave Energy Conference. European Wave and TidalEnergy Conference Series
General rightsCopyright and moral rights for the publications made accessible in the public portal are retained by the authors and/or other copyright ownersand it is a condition of accessing publications that users recognise and abide by the legal requirements associated with these rights.
- Users may download and print one copy of any publication from the public portal for the purpose of private study or research. - You may not further distribute the material or use it for any profit-making activity or commercial gain - You may freely distribute the URL identifying the publication in the public portal -
Take down policyIf you believe that this document breaches copyright please contact us at [email protected] providing details, and we will remove access tothe work immediately and investigate your claim.
Downloaded from vbn.aau.dk on: January 17, 2022

1
Mooring system reliability of an ORE deviceusing general Polynomial Chaos
Guilherme Moura Paredes, Jonas Bjerg Thomsen, Francesco Ferri and Claes Eskilsson
Abstract—We demonstrate the use of general PolynomialChaos (gPC) in determining the reliability of a mooringsystem designed for an offshore renewable energy (ORE)device. General Polynomial Chaos is used to forwardpropagate uncertainties in two design variables, and toobtain the probability density function of the Most Prob-able Maximum tension in the most loaded line. Then,the probability of failure is estimated using the FirstOrder Reliability Method. For this case study, we obtain aprobability of failure of 3.4×10⁻⁶ for the mooring system,around 10 times lower than required by DNV-OS-E301.The most interesting result, however, is that by applyinggPC, we can build a probability density function for thetension running only 36 simulations using the determinis-tic numerical model, instead of hundreds or thousands aswould be required by using a Monte-Carlo method. Thisreduces the computational effort required for probabilisticdesign and analysis of floating structures, enabling the shiftfrom conservative Partial Safety Factor based design, toReliability and Risk based design.
Index Terms—Reliability, mooring systems, general Poly-nomial Chaos, stochastic collocation method, floating re-newable energy systems, offshore renewable energy.
I. INTRODUCTION
DETERMINISTIC design, the standard structuraldesign method, is appealing for its ease and
fast application, as well as for its intuitive nature. Inany of its different forms, the goal is to ensure thata characteristic extreme load acting on a structure,multiplied by a factor greater than 1, is smaller thanstrength of the structure, divided by a factor greaterthan 1. The determination of the characteristic load andstrength, as well as the so-called safety factors to use,are tabulated in design regulations. However, despiteits attractiveness, deterministic design has importantdrawbacks [1]: first it is only acceptable in situationswhere there is an extensive database of designed casesthat can be used to calibrate the safety factors; sec-ond, it does not guarantee that for all the structuralelements, or, even across a single structural element,the probability of failure is kept constant. This can lead
Paper no: 1271. Part of track: Station-keeping, mooring and foun-dations. This work received funding from the European Union’sHorizon 2020 research and innovation programme under grantagreement No. 752031 for project MoWE–Mooring of floating waveenergy converters: numerical simulation and uncertainty quantificationand from the Energy Technology Development and DemonstrationProgram (EUDP) through the project Mooring Solutions for Large WaveEnergy Converters (Grant Number 64014-0139).
The authors are all with the Department of Civil Enginering,Aalborg University, Aalborg Ø, Denmark.
G. Moura Paredes ([email protected]).J. Bjerg Thomsen ([email protected]).F. Ferri ([email protected]).C. Eskilsson ([email protected]).
to both over- and under-designed situations, neither ofwhich is desired.
Mooring systems are often designed using the De-terministic approach, following regulations, such asDNV-OS-E301 [2], which recommend safety factorsthat should guarantee no more than one cable failurein 10 000 years of operation. However, this is far frombeing true. As reported by Bindley and Comley [3], inthe UK Continental Shelf, the failure rates of mooringcables are 1 every 24 years, for single cables, and 1every 112 years for multiple cables. This is around 1000times higher than expected in mooring design stan-dards. Moreover, increasing the strength of mooringcables does not seem to increase their reliability: evenplatforms with higher design strength requirementsfor mooring cables yield similar failure rates [3]. Thisshows the need for improved design procedures andconsideration of different failure mechanisms.
In reliability based design, both the load and theresistance are characterised by their statistical distri-butions, instead of deterministic values. As stated in[4]:
The main objective of structural design is,therefore, to ensure, at an acceptable level of prob-ability, that each structure will not become unfitfor its intended purpose at any time during itsspecified design life.
Reliability based design is more involved than thedeterministic design, but it is effective in the economicand safe design of uncommon structures and criticalcomponents. It can also account for uncertainties inthe design, manufacture, construction, and installationof the components and structure, in a scientificallyrigorous way.
Offshore renewable energy converters (OREC) arefar from being standard structures: there are too fewcases deployed to have enough information to calibratesafety factors; and information on the typical failuremodes is still unknown. The high cost of the mooringsystem has partly contributed to low economic viabilityof investments in floating renewable energy technol-ogy. To ease the costs of development, some prototypeshave been deployed with improperly designed moor-ing systems, which later failed, resulting in the loss ofthe prototype [5]. All these reasons point to Reliability-based design being a good approach to design mooringsystems for offshore renewable energy devices. Andthat is why we will preform a reliability analysis of amooring system.
The mooring system analysed in the present study,described in section III, is designed using the Floating

2
Fig. 1. Illustration of the Floating Power Plant P60. Adapted from [7]
Power Plant (FPP) hybrid offshore renewable energyconverter [6] as example, see Fig. 1. The mooring wasdesigned in the Mooring Solutions for Large WaveEnergy Converters (MSLWEC) project [6] and used asa test case for investigating mooring systems for largewave energy converters. We stress that the mooringsystem used in the present study does not resemblethe final mooring design for the FPP P60 device. Thesystem was designed using a deterministic method,based on safety factors.
The goal of our analysis, presented in section IV,is to obtain the probability of failure of the mooringsystem, using the first order reliability method, andcompare it with the reliability requirements of thestandard DNV-OS-E301: Position Mooring [2]. We willaccount for uncertainties in both environmental andmaterial parameters: water depth, cable stiffness, andcable strength. The response of the OREC for differentinput values of the uncertain parameters is computedin OrcaFlex, described in section II-B. In our case, thequantity of interest is the Most Probable Maximum(MPM) tension in the cables, for a range of values ofrope stiffness and water depth.
Instead of the usual approach, based on the Monte-Carlo Method, to aid in the task of Reliability De-sign and Analysis, we propose an approach based on(gPC). General Polynomial Chaos [8], described in sec-tion II-C, provides surrogate models for processes withrandom inputs, based on polynomial expansions. Com-pared with a PDE-deterministic model, a gPC modelhas two significant advantages. First, for the sameinputs, gPC models are almost always faster to evalu-ate; second, the mean and variance of the PDE-modelwith random inputs are encoded in the polynomialcoefficients of the gPC expansion. These propertiesmake gPC a practical tool for the forward propagation
of uncertainty, which is essential in reliability analysis:we are able to quickly obtain the probability densityand distribution functions of complex processes, byrunning a very large number of input samples throughthe gPC model rather than through the PDE one. Afirst application of gPC to study mooring systems ispresented in [9], about the influence of uncertaintyin the hydrodynamic coefficients of mooring cablesand anchor positions, in snap loads and dynamicsof floating structures. General Polynomical Chaos isan established method and has been applied to otherfields too. Some examples include the study of vehicledynamics, [10], the performance of wind turbines [11],CFD simulations [12], wave propagation over randombathymetry [13], and to the study of a heaving cylinderin irregular waves [14].
The particular gPC formulation used, the StochasticCollocation Method, is a non-intrusive method thatrequires only a few tens or hundreds of simulationsof the deterministic PDE model, using specific pointsof the random sampling space. In contrast, a Monte-Carlo method would require hundreds to thousandsof simulations in the PDE model.
The analysis presented is simplified, in that onlythree parameters are judged to have uncertainties.However, it suffices to illustrate the method.
II. THEORY AND METHODS
A. Reliability AnalysisA structure will fail if the load, L, acting on it
is greater than the structure’s strength, S. The limitcriterion for failure is having the load equal to thestrength, called the limit state function g [4]:
g = L− S = 0 (1)
Reliability design and analysis looks at the probabil-ity of failure, PF, of a structure or component, whichis the probability that the strength is smaller than theload:
PF = P (S − L < 0) (2)
For the case of where the load and the resistance areindependent and normally distributed, the probabilityof failure will also be normally distributed, with meanvalue µF and standard deviation σF given by:
µF = µS − µL (3a)
σF =√σ2S + σ2
L (3b)
where µS and σS are, respectively, the mean and thestandard deviation of the strength of the component,and µL and σL, are, respectively, the mean and thestandard deviation of the load. The probability offailure is then easily obtained by:
PF = Φ
(−µF
σF
)= Φ (−β) (4)
where Φ is the standard normal distribution function,and β is the reliability factor.
When the load or the resistance values are not nor-mally distributed, they can be normalised using the

MOURA PAREDES et al.: MOORING SYSTEM RELIABILITY OF AN ORE DEVICE USING GENERAL POLYNOMIAL CHAOS 3
procedure described in [1]: first, the relevant side ofthe histogram of the quantities of interest is mirroredaround the the modal value (the right side of thehistogram for loads, and the left side of the histogramfor strengths). In the new distribution, the modal valuewill also be be the mean, just as in a normal distribu-tion. The normalised standard deviation is determinedas the standard deviation of the new histogram; inother words, the values that were mirrored aroundthe mode are accounted for twice. This procedure isalso useful when there are only measurements of thevalues of the quantities of interest, but no analyticaldistribution that adequately fits them.
B. Hydrodynamic Model
The response analysis of the OREC and mooring isbased on a numerical model using the open sourceboundary element method (BEM) code, Nemoh [15],and the commercial time domain solver OrcaFlex [16].The current chapter briefly describes the numericalmodel, and more information can be found in [5], [17].
1) Numerical Model: The numerical model is basedon a BEM code which solves the hydrodynamic coeffi-cients using linear potential flow theory and a timedomain solver, which solves all the environmentalloads on the structure, and estimates the motion andmooring line response. The time domain solver, Or-caFlex, utilizes Cummin’s Equation [18], to calculatethe time domain response from the frequency domainparameters found in Nemoh. The solver considersseveral load contributions including the first orderhydrodynamic loads composed of a contribution fromexcitation (Froude-Krylov and diffraction) and radi-ation force (added mass and damping). In addition,the hydrostatic force contribution is included. The fre-quency dependent excitation and radiation force coef-ficients are calculated in Nemoh from linear potentialtheory with the assumption of low wave steepness andsmall body motion amplitudes. The hydrostatic forceis included as a linear spring term, again invoking theassumption of small body motions.
Furthermore, second order slow varying loads andviscous drag is considered. The slow varying driftforces (SVDF) are second order in wave amplitude,thus significantly smaller than the first order loads.Nevertheless, the drift forces have a significant rolein the study of moored structures because their meanperiod lay in the lower frequency range, where the nat-ural frequency of large structures is normally placed.While in regular wave, the drift forces are time invari-ant, in irregular wave the drift forces slowly vary intime. The exact solution of the second order diffractionproblem is computational expensive, therefore, approx-imated solutions has been proposed to reduce thecomputational burden; the approximation proposedby Newman [19] is often regarded as a good tradeoff between accuracy and computational cost. In Or-caflex, the SVDF are implemented either using thefull quadratic transfer function (QTF) or using theNewman approximation; this last has been used in thefollowing work.
Finally, also wind and current loads are includingthrough a drag formulation [16]. OrcaFlex calculatesthe drag at the instantaneous position, and calculatescurrent and wind loads in all degrees of freedoms(DoFs). In addition, current and wind loads are in-cluded on the mooring lines using a Morison Approach[20].
2) Mooring Solver: The mooring solver in OrcaFlex isbased on a lumped mass approach, where the mooringlines are discretized into a number of elements, and themass, forces etc. are lumped into the nodes at the endsof each element. This approach is time efficient, but lessaccurate for e.g. snap loads. For more information see[21]–[23]. The accuracy of the mooring solver is highlydependent on the discretization of the lines, implyinga balance between computational time and accuracy. Inthe present study, a convergence analysis was appliedfor securing a satisfying discretization.
C. Generalised Polynomial Chaos
A function with inputs subject to uncertainty canbe mathematically expressed as f(x, Z), where x isthe vector of deterministic input variables and Z isa random variable (variable subject to uncertainty).Z can take values in R from the set Ω of possibleoutcomes, and we write Z : Ω→ R. For such a process,General Polynomial Chaos provides a surrogate model tof(x, Z), based on a polynomial expansion:
fgPC(x, Z) =
∞∑k=0
fk(x)ψk(Z) (5)
where fk(x) are the polynomial coefficients andψk(Z)∞k=0 is the set of polynomial basis functions. Forsome statistical distributions with analytical represen-tation, optimal convergence of the polynomial expan-sion is achieved by using the respective polynomialsin the Wiener-Askey scheme [8].
Due to the practical impossibility of applying aninfinite sum, Eq. (5) must be truncated at selectedpolynomial degree p:
fgPC(x, Z) ≈p∑
k=0
fk(x)ψk(Z) (6)
The required optimal degree must be defined bytrial and error, until reaching sufficiently accurate re-sults for the problem in question. A good indicatorof the optimal polynomial degree is the evolution ofthe polynomial coefficients, fk. For smooth solutions,the value of the coefficients will decay rapidly as pincreases, providing a good indication of when to trun-cate the expansion. As mentioned in the introduction,the mean and the variance of the output variables canbe obtained from the the gPC coefficients fk(x. Moreprecisely, f0(x) is a scaled value of the mean, and thevariance can be obtained by summing the squares ofthe set of coefficients fk(x)pk=1 in the expansion.
In general, problems concerning uncertainty involvemultiple random inputs. When dealing with the with

4
d independent input random variables, d ∈ N, ψ(Z), instead of a single polynomial, gPC uses a tensorproduct of d polynomials, one for each variable, Eq. (6):
fgPC(x,Z) ≈p∑|k|=0
fk(x)Ψk(Z) =
=
p∑|k|=0
fk(x)ψk1(Z1)ψk2(Z2)...ψkd(Zd) (7)
where Z : Ω → Rd is the vector of input randomvariables, k = (k1, k2, ..., kd) ∈ N0 k is a multi-index,|k| = k1 + k2 + ... + kd, and ψki
(Zi) is the polynomialbasis function of the variable Zi, of degree ki.
Beyond the general formulation presented above,gPC methods can be divided into two groups:Stochastic Galerkin Method and Stochastic CollocationMethod. The Stochastic Galerkin Method is an intru-sive method that requires the reformulation of theunderlying equations that model a phenomenon. TheStochastic Collocation Method, on the contrary, is anon-intrusive method that only requires deterministicmodels to be run on specific points of the randomsampling space. While the Stochastic Galerkin Methodis more accurate in computing the gPC model, thereformulation of the underlying equations can be quitedifficult. Moreover, in black-box models, such as com-mercial codes, it is generally impossible to apply theStochastic Galerkin Method. Because of this, in thisstudy we employed the Stochastic Collocation Method,which, although slower because it is built around andnot into the solver, it is easier to apply in general, evenfor black-box codes.
For the computation of the gPC model fgPC(x,Z) ≈f(x,Z), we only need to post-process the results of sim-ulations using the mathematical model at pre-selectedvalues z(j) of the uncertain input Z. The points z(j)
where f(x,Z) is to be evaluated depend on the methodchosen to determine the coefficients fk. For a processwith dimension d < 4, the coefficients can be efficientlycomputed using the projection method. In applyingthis method, the coefficients fk(x) are determined bythe inner product of f(x,Z) with the polynomial basis,Ψk(Z), with respect to the probability density function(PDF) of the random variable, ρ(Z), Eq. (8):
〈fk(x),Ψk(z)〉 =
∫f(x, z)Ψk(z)ρ(z)dz∫
Ψ2k(z)ρ(z)dz
(8)
Equation (8) is solved using quadrature rules, suchas Gauss quadrature, which provide the points z(j)
where the model is to be evaluated, and the quadratureweights, w(j). For d > 4, the quadrature methodbecomes inefficient because, since multi-variable gPCis based on tensor product, the number of points z(j)
where the numerical model needs to be evaluatedgrows exponentially with the number d. In this casewe would need to resort to other methods; however,in this study, d = 2, so we will employ the quadraturemethod.
The interaction between the different univariatepolynomials in the tensor product can be controlled
through the q-norm. A q-norm of 1 allows the tensorproduct of any set of univariate polynomials to reachthe maximum selected polynomial order; decreasingthe q-norm, until the minimum value of zero, decreasesthe maximum polynomial order allowed for productsof univariate polynomials, reducing the total numberof polynomial terms.
For the computation of the gPC model we usedUQLab’s version 1.0.0, Polynomial Chaos ExpansionsModule [24].
D. Model equations with random inputsThe uncertainty in the cable and hydrodynamic
parameters is accounted for by introducing a set ofrandom variables Z : Ω → Rd, which has been inshown [9]. The stochastic equation of motion for aperfectly flexible cable is, Eq. (9):
ml(s,Z)∂2r(s, t,Z)
∂t2=
(T (ε(s, t,Z))
1 + ε(s, t,Z)
∂r(s, t,Z)
∂s
)+
+∂
∂s+ fe(s, t,Z) , (9a)
ε(s, t,Z) =
∣∣∣∣∂r(s, t,Z)
∂s
∣∣∣∣− 1 (9b)
where ml is the mass per unit length, r(s, t,Z) is theposition vector of a point s of the cable a time t, T isthe tension magnitude, ε is the extension, and fe(s, t,Zis the vector of external forces acting on the cable. Thestochastic Cummins equation is, Eq. (10):
M + A∞x(t,Z) +
∫ t
−∞K (t− τ) x (t,Z) d τ+
+Cx (t,Z) = fext (t) + fmoor (t,Z) (10)
where M is the generalised mass matrix of the floatingstructure, A∞ is the added mass matrix at infinitefrequency, K is the radiation impulse response func-tion, C is the hydrostatic stiffness matrix, fmoor is themooring force vector, fext is the vector of the remainingexternal forces acting on the floating structure, x, x,and x are, respectively, the acceleration, velocity, andposition of the floating structure, and t is time.
III. CASE STUDY
The MSLWEC project [6], [7] has been using fourlarge Danish ORECs as test cases for investigation,design and optimization of mooring solutions usinga numerical model as described in section II-B. Thepresent study considers one of the ORECs further: theFloating Power Plant P60 and the proposed mooringsolution. In [7], the mooring system for the devicewas optimized to secure a high cost efficiency, whilealso fulfilling the design requirements in the designstandard DNV-OS-E301 [2]. Earlier designs have con-sidered chain catenary systems or polyester moorings,while the current layout focuses on highly compliantand more novel nylon ropes.
The present chapter describes the FPP, its deploy-ment site and its optimized mooring system, whichwas proposed as a solution in [7]. The mooring system
MOURA PAREDES et al.: MOORING SYSTEM RELIABILITY OF AN ORE DEVICE USING GENERAL POLYNOMIAL CHAOS 5
FPR
Mooring lines
Anchor
WEC
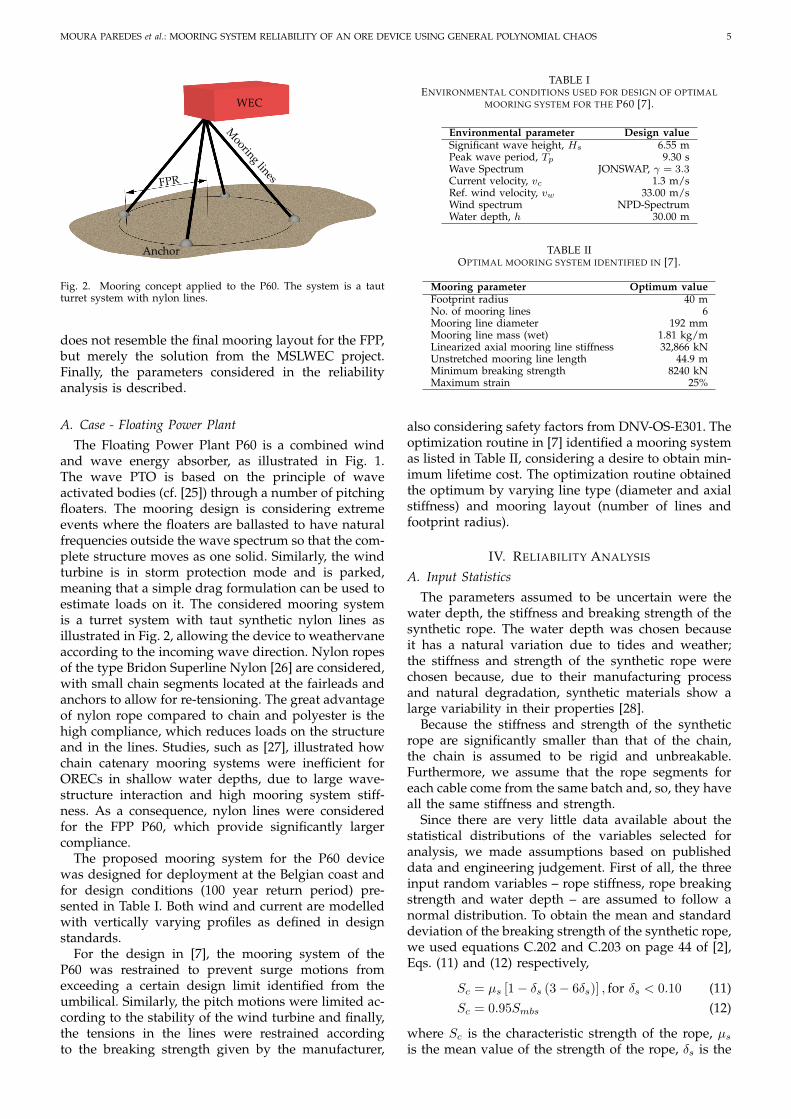
Fig. 2. Mooring concept applied to the P60. The system is a tautturret system with nylon lines.
does not resemble the final mooring layout for the FPP,but merely the solution from the MSLWEC project.Finally, the parameters considered in the reliabilityanalysis is described.
A. Case - Floating Power PlantThe Floating Power Plant P60 is a combined wind
and wave energy absorber, as illustrated in Fig. 1.The wave PTO is based on the principle of waveactivated bodies (cf. [25]) through a number of pitchingfloaters. The mooring design is considering extremeevents where the floaters are ballasted to have naturalfrequencies outside the wave spectrum so that the com-plete structure moves as one solid. Similarly, the windturbine is in storm protection mode and is parked,meaning that a simple drag formulation can be used toestimate loads on it. The considered mooring systemis a turret system with taut synthetic nylon lines asillustrated in Fig. 2, allowing the device to weathervaneaccording to the incoming wave direction. Nylon ropesof the type Bridon Superline Nylon [26] are considered,with small chain segments located at the fairleads andanchors to allow for re-tensioning. The great advantageof nylon rope compared to chain and polyester is thehigh compliance, which reduces loads on the structureand in the lines. Studies, such as [27], illustrated howchain catenary mooring systems were inefficient forORECs in shallow water depths, due to large wave-structure interaction and high mooring system stiff-ness. As a consequence, nylon lines were consideredfor the FPP P60, which provide significantly largercompliance.
The proposed mooring system for the P60 devicewas designed for deployment at the Belgian coast andfor design conditions (100 year return period) pre-sented in Table I. Both wind and current are modelledwith vertically varying profiles as defined in designstandards.
For the design in [7], the mooring system of theP60 was restrained to prevent surge motions fromexceeding a certain design limit identified from theumbilical. Similarly, the pitch motions were limited ac-cording to the stability of the wind turbine and finally,the tensions in the lines were restrained accordingto the breaking strength given by the manufacturer,
TABLE IENVIRONMENTAL CONDITIONS USED FOR DESIGN OF OPTIMAL
MOORING SYSTEM FOR THE P60 [7].
Environmental parameter Design valueSignificant wave height, Hs 6.55 mPeak wave period, Tp 9.30 sWave Spectrum JONSWAP, γ = 3.3Current velocity, vc 1.3 m/sRef. wind velocity, vw 33.00 m/sWind spectrum NPD-SpectrumWater depth, h 30.00 m
TABLE IIOPTIMAL MOORING SYSTEM IDENTIFIED IN [7].
Mooring parameter Optimum valueFootprint radius 40 mNo. of mooring lines 6Mooring line diameter 192 mmMooring line mass (wet) 1.81 kg/mLinearized axial mooring line stiffness 32,866 kNUnstretched mooring line length 44.9 mMinimum breaking strength 8240 kNMaximum strain 25%
also considering safety factors from DNV-OS-E301. Theoptimization routine in [7] identified a mooring systemas listed in Table II, considering a desire to obtain min-imum lifetime cost. The optimization routine obtainedthe optimum by varying line type (diameter and axialstiffness) and mooring layout (number of lines andfootprint radius).
IV. RELIABILITY ANALYSIS
A. Input StatisticsThe parameters assumed to be uncertain were the
water depth, the stiffness and breaking strength of thesynthetic rope. The water depth was chosen becauseit has a natural variation due to tides and weather;the stiffness and strength of the synthetic rope werechosen because, due to their manufacturing processand natural degradation, synthetic materials show alarge variability in their properties [28].
Because the stiffness and strength of the syntheticrope are significantly smaller than that of the chain,the chain is assumed to be rigid and unbreakable.Furthermore, we assume that the rope segments foreach cable come from the same batch and, so, they haveall the same stiffness and strength.
Since there are very little data available about thestatistical distributions of the variables selected foranalysis, we made assumptions based on publisheddata and engineering judgement. First of all, the threeinput random variables – rope stiffness, rope breakingstrength and water depth – are assumed to follow anormal distribution. To obtain the mean and standarddeviation of the breaking strength of the synthetic rope,we used equations C.202 and C.203 on page 44 of [2],Eqs. (11) and (12) respectively,
Sc = µs [1− δs (3− 6δs)] , for δs < 0.10 (11)Sc = 0.95Smbs (12)
where Sc is the characteristic strength of the rope, µs
is the mean value of the strength of the rope, δs is the

6
0 5 10 15 20 25
Extension (%)
0
1000
2000
3000
4000
5000
6000
7000
8000
9000
Loa
d (k
N)
Load-extension curve of the synthetic rope
Real curveLinearisation
Fig. 3. Tension-elongation curved for a used synthetic fibre rope.
coefficient of variation of the strength of the rope, andSmbs is the minimum breaking strength of the rope.These equations provide a model for the characteris-tic strength when the minimum breaking strength isknown (usually provided by the rope manufacturer).
Combining Eqs. (11) and 12, assuming δs = 0.10 formaximum variability, we can solve for µs. Knowing µs
and the assumed value of δs = 0.10, we obtain σs, thestandard deviation of the strength of the rope.
Estimation of the distribution parameters for therope stiffness was more ad-hoc, because we could notfind any model for it. We assumed the mean stiffness,µEA, to be the linearised stiffness of a used syntheticrope, EAlin = 32.8656×10⁶N , computed from the load-elongation curve provided by the manufacturer, Fig. 3[26]. To determine the standard deviation we assumed,as in Eq. (11), a coefficient of variation δEA = 0.10,giving a standard deviation σEA = 3.287× 10⁶ N.
Previous statistical analysis, described in [29], de-termined that, for a return period of 100 years, theextreme water depth variation is ±5.5 m, meaning a1% probability of occurrence. This probability was splitbetween a positive and a negative variation: 0.5 % fora positive variation of more than 5.5 m and 0.5 % for anegative variation of more than 5.5 m.
We defined the mean water depth, µd, to be thedesign water depth, 30 m, Table II. To determine thestandard deviation of the water depth, σd, we readfrom the standard normal distribution, Φ, the valuewith an exceedance probability of 0.5 %, Z = 2.58, andapplied the conversion from standard normal
σd =X − µd
Z(13)
where X represents maximum water depth, 35.5 m. Theassumed and computed mean and standard deviationof the random input variables are listed in Table III.
B. Tension StatisticsThe probability density function of the MPM tension,
required to estimate the probability of failure of themooring system, was determined using a gPC surro-gate model. The input random variables to the gPC
TABLE IIIPARAMETERS OF THE DISTRIBUTIONS OF THE VARIABLES OF
INTEREST (DIST. - DISTRIBUTION; STD. DEV. - STANDARDDEVIATION).
Variable Dist. Mean Std. Dev.Rope strength Normal 10.300× 10⁶ N 1.030× 10⁶ NStiffness Normal 32.8654× 10⁶ N 3.287× 10⁶ NWater depth Normal 30m 2.13m
Fig. 4. Illustration of the line (red) considered in the present analysis.
model of the MPM were the rope stiffness and waterdepth. Since these two variables are fully uncorrelated,they were represented by an independent copula. Afterconvergence analysis, we selected 5th degree polyno-mials for the expansion, and q-norm of 1. This requiredthe evaluation of 36 different quadrature points, z(j) (inother words, sets of rope stiffness-water depth valuesthat were input into OrcaFlex).
To compute the probability density function ofthe MPM tension, we evaluated, in the gPC model,1 000 000 random values of rope stiffness and waterdepth, sampled from their respective distributions.Then, using the Kernel Density Estimation method, wesmoothed the results to obtain the probability densityfunction, Fig. 5. As can be seen, the MPM tension doesnot have a normal distribution: it is skewed to the right.
3.5 4 4.5 5 5.5 6 6.5 7 7.5
MPM Tension ( 106 N)
0
0.2
0.4
0.6
0.8
1
1.2
1.4
1.6
Prob
abili
ty d
ensi
ty
10-6
Fig. 5. Probability density for Most Probable Maximum tension inthe most loaded cable.
MOURA PAREDES et al.: MOORING SYSTEM RELIABILITY OF AN ORE DEVICE USING GENERAL POLYNOMIAL CHAOS 7
TABLE IVMEAN (µMPM ) AND STANDARD DEVIATION (σMPM ) OF THE
NORMALISED DISTRIBUTION FOR THE MPM TENSION.
µMPM σMPM5.575× 106 N 2.066× 10⁵ N
TABLE VPROBABILITY OF FAILURE DISTRIBUTION AND RELIABILITY
PARAMETERS.
Parameter ValueµF 4.725× 10⁶ NσF 1.051× 10⁶ Nβ 4.498PF 3.426× 10⁻⁶
C. Reliability Estimation
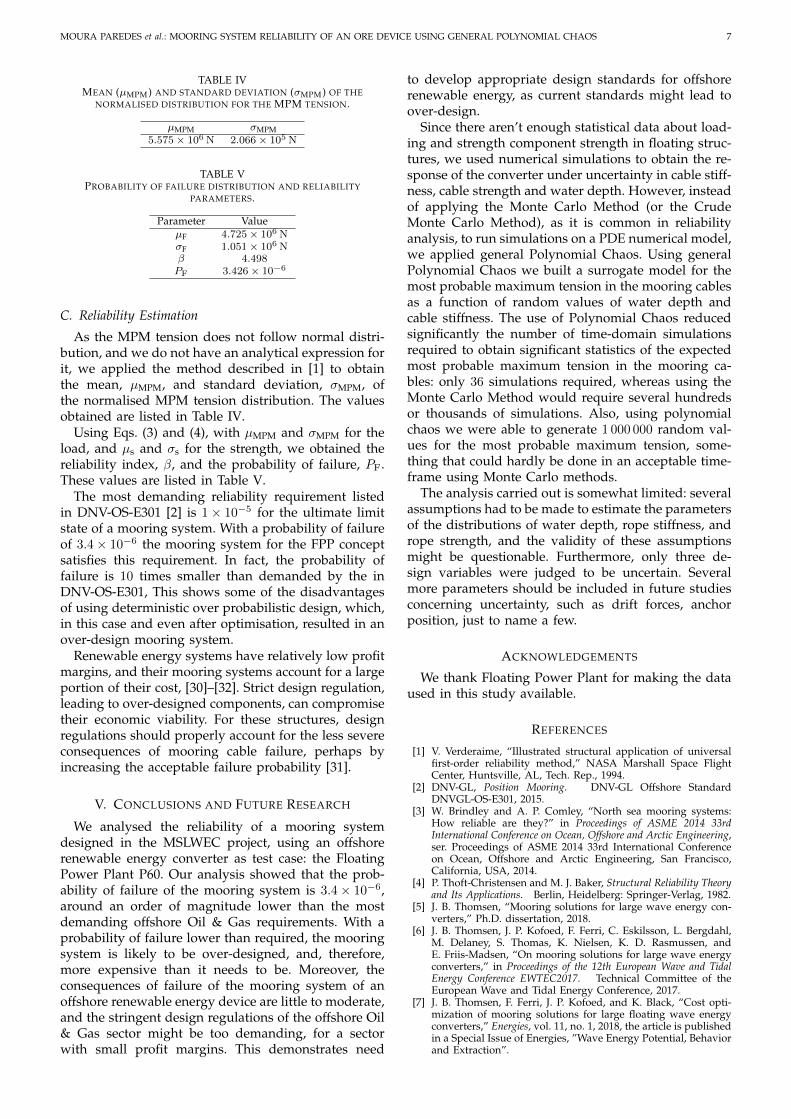
As the MPM tension does not follow normal distri-bution, and we do not have an analytical expression forit, we applied the method described in [1] to obtainthe mean, µMPM, and standard deviation, σMPM, ofthe normalised MPM tension distribution. The valuesobtained are listed in Table IV.
Using Eqs. (3) and (4), with µMPM and σMPM for theload, and µs and σs for the strength, we obtained thereliability index, β, and the probability of failure, PF.These values are listed in Table V.
The most demanding reliability requirement listedin DNV-OS-E301 [2] is 1× 10⁻⁵ for the ultimate limitstate of a mooring system. With a probability of failureof 3.4× 10⁻⁶ the mooring system for the FPP conceptsatisfies this requirement. In fact, the probability offailure is 10 times smaller than demanded by the inDNV-OS-E301, This shows some of the disadvantagesof using deterministic over probabilistic design, which,in this case and even after optimisation, resulted in anover-design mooring system.
Renewable energy systems have relatively low profitmargins, and their mooring systems account for a largeportion of their cost, [30]–[32]. Strict design regulation,leading to over-designed components, can compromisetheir economic viability. For these structures, designregulations should properly account for the less severeconsequences of mooring cable failure, perhaps byincreasing the acceptable failure probability [31].
V. CONCLUSIONS AND FUTURE RESEARCH
We analysed the reliability of a mooring systemdesigned in the MSLWEC project, using an offshorerenewable energy converter as test case: the FloatingPower Plant P60. Our analysis showed that the prob-ability of failure of the mooring system is 3.4× 10⁻⁶,around an order of magnitude lower than the mostdemanding offshore Oil & Gas requirements. With aprobability of failure lower than required, the mooringsystem is likely to be over-designed, and, therefore,more expensive than it needs to be. Moreover, theconsequences of failure of the mooring system of anoffshore renewable energy device are little to moderate,and the stringent design regulations of the offshore Oil& Gas sector might be too demanding, for a sectorwith small profit margins. This demonstrates need
to develop appropriate design standards for offshorerenewable energy, as current standards might lead toover-design.
Since there aren’t enough statistical data about load-ing and strength component strength in floating struc-tures, we used numerical simulations to obtain the re-sponse of the converter under uncertainty in cable stiff-ness, cable strength and water depth. However, insteadof applying the Monte Carlo Method (or the CrudeMonte Carlo Method), as it is common in reliabilityanalysis, to run simulations on a PDE numerical model,we applied general Polynomial Chaos. Using generalPolynomial Chaos we built a surrogate model for themost probable maximum tension in the mooring cablesas a function of random values of water depth andcable stiffness. The use of Polynomial Chaos reducedsignificantly the number of time-domain simulationsrequired to obtain significant statistics of the expectedmost probable maximum tension in the mooring ca-bles: only 36 simulations required, whereas using theMonte Carlo Method would require several hundredsor thousands of simulations. Also, using polynomialchaos we were able to generate 1 000 000 random val-ues for the most probable maximum tension, some-thing that could hardly be done in an acceptable time-frame using Monte Carlo methods.
The analysis carried out is somewhat limited: severalassumptions had to be made to estimate the parametersof the distributions of water depth, rope stiffness, andrope strength, and the validity of these assumptionsmight be questionable. Furthermore, only three de-sign variables were judged to be uncertain. Severalmore parameters should be included in future studiesconcerning uncertainty, such as drift forces, anchorposition, just to name a few.
ACKNOWLEDGEMENTS
We thank Floating Power Plant for making the dataused in this study available.
REFERENCES
[1] V. Verderaime, “Illustrated structural application of universalfirst-order reliability method,” NASA Marshall Space FlightCenter, Huntsville, AL, Tech. Rep., 1994.
[2] DNV-GL, Position Mooring. DNV-GL Offshore StandardDNVGL-OS-E301, 2015.
[3] W. Brindley and A. P. Comley, “North sea mooring systems:How reliable are they?” in Proceedings of ASME 2014 33rdInternational Conference on Ocean, Offshore and Arctic Engineering,ser. Proceedings of ASME 2014 33rd International Conferenceon Ocean, Offshore and Arctic Engineering, San Francisco,California, USA, 2014.
[4] P. Thoft-Christensen and M. J. Baker, Structural Reliability Theoryand Its Applications. Berlin, Heidelberg: Springer-Verlag, 1982.
[5] J. B. Thomsen, “Mooring solutions for large wave energy con-verters,” Ph.D. dissertation, 2018.
[6] J. B. Thomsen, J. P. Kofoed, F. Ferri, C. Eskilsson, L. Bergdahl,M. Delaney, S. Thomas, K. Nielsen, K. D. Rasmussen, andE. Friis-Madsen, “On mooring solutions for large wave energyconverters,” in Proceedings of the 12th European Wave and TidalEnergy Conference EWTEC2017. Technical Committee of theEuropean Wave and Tidal Energy Conference, 2017.
[7] J. B. Thomsen, F. Ferri, J. P. Kofoed, and K. Black, “Cost opti-mization of mooring solutions for large floating wave energyconverters,” Energies, vol. 11, no. 1, 2018, the article is publishedin a Special Issue of Energies, ”Wave Energy Potential, Behaviorand Extraction”.
8
[8] D. Xiu and G. E. Karniadakis, “The Wiener-Askey polynomialchaos for stochastic differential equations,” SIAM Journal onScientific Computing, vol. 24, no. 2, pp. 619–644, 2002.
[9] G. Moura Paredes, C. Eskilsson, and A. P. Engsig-Karup,“Uncertainty quantification in mooring cable dynamics usingpolynomial chaos expansions,” Submitted Manuscript, 2019.
[10] D. Bigoni, H. True, and A. Engsig-Karup, “Sensitivity analysisof the critical speed in railway vehicle dynamics,” VehicleSystem Dynamics, vol. 52, no. sup1, pp. 272–286, 2014. [Online].Available: https://doi.org/10.1080/00423114.2014.898776
[11] J. P. Murcia, P.-E. Rethore, N. Dimitrov, A. Natarajan, J. D.Sørensen, P. Graf, and T. Kim, “Uncertainty propagationthrough an aeroelastic wind turbine model using polynomialsurrogates,” Renewable Energy, vol. 119, pp. 910–922, 2018.
[12] O. P. Le Maıtre and O. M. Knio, Spectral Methods for UncertaintyQuantification, ser. Scientific Computation. Dordrecht: SpringerNetherlands, 2010. [Online]. Available: http://link.springer.com/10.1007/978-90-481-3520-2
[13] D. Bigoni, A. P. Engsig-Karup, and C. Eskilsson, “Efficientuncertainty quantification of a fully nonlinear and dispersivewater wave model with random inputs,” Journal of EngineeringMathematics, vol. 101, pp. 87–113, 2016.
[14] E. Kreuzer and E. Solowjow, “Polynomial chaos and the heavemotion of a cylinder in random seas,” in Proceedings in AppliedMathematics and Mechanics, vol. 15. Springer, 2015, pp. 559–560.
[15] A. Babarit and G. Delhommeau, “Theoretical and numericalaspects of the open source bem solver nemoh,” in 11th EuropeanWave and Tidal Energy Conference (EWTEC2015), 2015.
[16] Orcina Ltd., “Orcaflex user manual,” 2015.[17] J. B. Thomsen, F. Ferri, and J. Kofoed, “Validation of a Tool
for the Initial Dynamic Design of Mooring Systems for LargeFloating Wave Energy Converters,” Journal of Marine Science andEngineering, vol. 5, no. 4, 2017.
[18] W. Cummins, “The impulse response function and ship mo-tions,” David Taylor Model Basin Washington DC, Tech. Rep.,1962.
[19] J. Newman, “Second-order, slowly-varying forces on vessels inirregular waves,” 1974.
[20] J. Morison, J. Johnson, S. Schaaf et al., “The force exerted bysurface waves on piles,” Journal of Petroleum Technology, vol. 2,no. 05, pp. 149–154, 1950.
[21] M. Hall and A. Goupee, “Validation of a lumped-mass mooringline model with deepc wind semi-submersible model test data,”Ocean Engineering, vol. 104, pp. 590–603, 2015.
[22] J. Davidson and J. V. Ringwood, “Mathematical modellingof mooring systems for wave energy converters: A review,”Energies, vol. 10, no. 5, p. 666, 2017.
[23] J. B. Thomsen, F. Ferri, and J. P. Kofoed, “Screening ofavailable tools for dynamic mooring analysis of wave energyconverters,” Energies, vol. 10, no. 7, 2017. [Online]. Available:http://www.mdpi.com/1996-1073/10/7/853
[24] S. Marelli and B. Sudret, “Uqlab user manual - polynomialchaos expansions,” Chair of Risk, Safety & Uncertainty Quan-tification, ETH Zurich, Zurich, Tech. Rep., 2018.
[25] A. Pecher and J. Kofoed, Handbook of Ocean Wave Energy.Germany: Springer, 2017, vol. 7, this book is open access undera CC BY-NC 2.5 license.
[26] Bridon, Wire and Fibre Rope Solutions, 2016, [Online]. Available:http://www.bridon.com/uk/.
[27] J. B. Thomsen, J. P. Kofoed, M. Delaney, and S. Banfield, “Initialassessment of mooring solutions for floating wave energy con-verters,” in The Proceedings of the Twenty-sixth (2016) InternationalOcean and Polar Engineering Conference, vol. 1. InternationalSociety of Offshore & Polar Engineers, 2016, pp. 590–596.
[28] N. Barltrop, Floating Structures - A Guide for Design and Analysis,Volume 2. Energy Institute, 1998.
[29] J. B. Thomsen, F. Ferri, and J. Kofoed, Current Mooring Designin Partner WECs and Candidates for Preliminary Analysis: CM1& M3. Aalborg University, Department of Civil Engineering,2016, confidential report.
[30] J. Fitzgerald, “Position mooring of wave energy converters,”PhD Thesis, Chalmers University of Technology, 2009.
[31] G. M. Paredes, L. Bergdahl, J. Palm, C. Eskilsson, and F. T. Pinto,“Station keeping design for floating wave energy devices com-pared to floating offshore oil and gas platforms,” in Proceedingsof the 10th European Wave and Tidal Energy Conference. Aalborg,Denmark: European Wave and Tidal Energy Conference, 2013.
[32] L. Martinelli, P. Ruol, and G. Cortellazzo, “On mooring designof wave energy converters: the Seabreath application,” in Pro-ceedings of the 33rd International Conference Coastal Engineering(ICCE), P. Lynett and J. McKee Smith, Eds., Santander, 2012,pp. 1–12.