Embed Size (px)
Citation preview

Aalborg Universitet
Analysis of Interconnection Schemes for PV Systems Operating under ShadowConditions
Nasir, Mashood; saeed, saqib; gohar, faheem; mudassar, muhammad; kamran, muhammad
Published in:International Journal of Renewable Energy Research (IJRER)
Creative Commons LicenseOther
Publication date:2019
Document VersionAccepted author manuscript, peer reviewed version
Link to publication from Aalborg University
Citation for published version (APA):Nasir, M., saeed, S., gohar, F., mudassar, M., & kamran, M. (2019). Analysis of Interconnection Schemes for PVSystems Operating under Shadow Conditions. International Journal of Renewable Energy Research (IJRER),9(2), 913-922.
General rightsCopyright and moral rights for the publications made accessible in the public portal are retained by the authors and/or other copyright ownersand it is a condition of accessing publications that users recognise and abide by the legal requirements associated with these rights.
? Users may download and print one copy of any publication from the public portal for the purpose of private study or research. ? You may not further distribute the material or use it for any profit-making activity or commercial gain ? You may freely distribute the URL identifying the publication in the public portal ?
Take down policyIf you believe that this document breaches copyright please contact us at [email protected] providing details, and we will remove access tothe work immediately and investigate your claim.

INTERNATIONAL JOURNAL OF RENEWABLE ENERGY RESEARCH Corresponding Author et al. ,Vol. XX, No. XX
1
Analysis of Interconnection Schemes for
PV Systems Operating under Shadow
Conditions
Saqib Saeed*, Fahim Gohar Awan**, Mashood Nasir***,
Muhammad Mudassar****‡, Muhammad Kamran*****
*Centre for Energy Research and Development, University of Engineering and
Technology, Lahore, Pakistan
**Department of Electrical Engineering, University of Engineering and
Technology, Lahore, Pakistan
***Department of Electrical Engineering, Lahore University of Management
Sciences, Lahore, Pakistan
****Department of Technology, The University of Lahore, Lahore, Pakistan
*****Riphah College of Engineering and Technology, Riphah International
University, Faisalabad, Pakistan
(First Author Mail Address, Second Author Mail Address, Third Author Mail Address)
‡
Corresponding Author; Muhammad Mudassar, Department of Technology, The
University of Lahore, Lahore, Pakistan, Tel: +92 333 467 4112,
Received: xx.xx.xxxx Accepted:xx.xx.xxxx
Abstract- The output power of a PV system consisting of multiple strings and arrays of
PV modules reduces drastically as the number of shading increases on it. The shaded
module in a string limits the output current of the entire string thereby reduces its output
power. Different techniques are used for the optimal interconnection of modules in a PV
system that not only helps in reducing the deteriorating effects of partial shading but also

ARTICLE TEMPLATE CONTAINING AUTHOR GUIDELINES FOR PEER-REVIEW
enhances the output power of the overall PV system. The performance and the cost
analysis of different interconnection schemes including series-parallel (SP), honeycomb
(HC), bridge-linked (BL), and total cross tied (TCT) with bypass diode are presented.
Commonly existing shading patterns including diagonal (DI), short wide (SW), long wide
(LW), short narrow (SN) and short wide (SW) are evaluated. Results show that TCT
exhibits better output power under all shade patterns. For a typical 4×4 PV system
operating under diagonal shading condition, 12% gain in efficiency can be achieved
through TCT connection in comparison to conventional SP interconnection. Further, it
has been found that the cost of extra conductors incurred due to TCT connection can be
recovered through enhanced energy output within three quarters of the year.
Keywords- solar, partial shadings, photovoltaic, PV connections, Renewable energy.
1. Introduction
Pakistan is glorified with naturally abundant resources of renewable energy.
However, there is a strong need for tapping this potential in an effective manner to create
a harmony between supply and demand of energy. Electricity demand is related to an
increase in GDP and improvement in lifestyle, especially in developing countries. In
developing countries, it is often observed that a relationship exists between wealth,
electricity usage and production activities [1]. Basically, Pakistan is an energy insufficient
country. Pakistan’s per capita energy utilization is only 3894 kWh in contrast of world’s
average 17620 kWh and ranks 100th around the nations of the world [2-3]. So, the analysis
shows that Pakistan is a big importer of energy. With increasing population and enhanced
dependency on modern digital technologies, the energy demand is consistently growing
while the non-renewable resources are diminishing rapidly. Moreover, the consumption

INTERNATIONAL JOURNAL OF RENEWABLE ENERGY RESEARCH Corresponding Author et al. ,Vol. XX, No. XX
3
of non-renewable fossil fuel-based energy resources across the world is hazardous for
environment, ecosystem and climate change.
Pakistan is facing a severe energy gap and many areas are still not connected with the
national grid. The country has limited fossil fuel resources; therefore, our economy is
largely dependent on imported fuels [4-5]. Due to this shortfall, electricity remains
unavailable for 10-12 and 16-18 hours in urban and rural areas respectively [6]. The
power sector in Pakistan is directly or indirectly controlled by the government and private
sectors which severely depends upon non-renewable resources. Pakistan’s energy mix
consists of 60% Regasified Liquefied Natural Gas (RLNG) and furnace oil, 27 % hydro
whereas renewable energy sources like wind, solar, bagasse are less than 3% of the power
generation capacity [7].
Nonrenewable energy sources are limited in amount and take millions of the year for
being replenished. Alternatively, renewable energy sources are the most viable option
due to their environment-friendly and cost-effective nature. Numerous forms of
renewable energy resources are available; however, out of all these renewable energy
resources solar energy is the best option for developing countries like Pakistan which
have higher incident solar energy. Further, solar energy can be easily deployed for
business or home users and does not need any huge setup like hydro and wind power.
Pakistan is located in the direction of the sunny belt. Therefore, this country is blessed
with a large amount of solar energy. Pakistan has high insolation of about 5.3
kWh/m2/day [8].
Solar energy adaption is increasing day by day because it utilizes a renewable energy
source and produces clean energy. A solar cell produces output power as solar radiation
falls on the panel. The output power of a PV cell depends on solar radiation intensity, the

ARTICLE TEMPLATE CONTAINING AUTHOR GUIDELINES FOR PEER-REVIEW
temperature of the solar module and shading on the solar panel. Shading effect is
generally produced due to trees, nearby buildings, passing clouds, neighbor solar cell’s
shading, and birds etc. When we consider this partial shading effect on a large scale, it
decreases the efficiency of the solar module and also deteriorates the health of PV panels
causing hotspots and subsequent damages in PV structure, making it useless [9]. Partial
shading losses not only depend on partial shading area but it also depends on partial
shading pattern, array configuration and the bypass diodes integration with PV modules
[10].
In order to mitigate the detrimental effects of shading, various techniques are used.
The bypass diode is a passive technique in which a diode is attached with the solar
photovoltaic module to reduce partial shading effect [11]. In this technique, diode protects
the solar array from the local heating and overall efficiency of the module will be
increased under partial shading effect. But it also has many disadvantages. This technique
cannot produce maximum power under partial shading. The second disadvantage is that
the diode model increases the complexity to find MPPT (Maximum Power Point
Tracking). Switching of the diode from ON state to OFF state is also a big disadvantage.
The diode also needs some time to get OFF state to ON state. Diode produces losses due
to ON state resistance.
In multilevel inverter technique a combination of cascaded H-bridge, clamped
capacitor and diode is used to mitigate the effect of partial shading by achieving
independent voltage control for each module. By using this technique voltage stresses can
be reduced and ac harmonic that appear on the output of the solar photovoltaic module
can be minimized. To achieve optimal power point, this technique has more complicated
control and optimization algorithms [12].

INTERNATIONAL JOURNAL OF RENEWABLE ENERGY RESEARCH Corresponding Author et al. ,Vol. XX, No. XX
5
As mentioned above a lot of disadvantages occur in different techniques which are
used to mitigate the effect of partial shading. Alternately, an optimization between the
cost complexity and output power gains can be achieved through optimal interconnection
topologies without the need of excessive control and communication requirements. In this
paper, different possible interconnections schemes including such as Series-Parallel,
Honey-Comb, Bridge-Link and Total-Cross-Tied are analyzed from output and cost
perspective under various practically existing shading conditions. A 4×4 PV system
(having 4 parallel strings of 4 panels each) is considered for analysis under long wide
(LW), long narrow (LN), short wide (SW), short narrow (SN) and diagonal shading (DI)
partial shading patterns. The analysis is generic and extendable to all other possible power
ratings.
The organization of the paper is as follows: Section I provides an introduction to the
utilization of solar PV systems and their limitations under shadow conditions. Section II
explains the single diode solar cell model. Section III explains different connection
techniques used for mitigating the effect of partial shading and Section IV explain the
simulation results of different connection techniques and output power comparison
between these techniques. Section V consists of the conclusion of this paper.
2. Single Diode Solar Cell Model
The photovoltaic solar cell is a device that is used to convert solar energy from the
sun into electricity by using the photovoltaic effect. When sunlight falls on the solar cell,
it can be absorbed, reflected, or passes. But only that light generates electricity which is
absorbed by the surface of the solar cell. When we need to increase their utility, a large
number of individual solar cells are connected together in a sealed and waterproof shape
called a panel or module. To achieve required current and voltage, modules are connected
ARTICLE TEMPLATE CONTAINING AUTHOR GUIDELINES FOR PEER-REVIEW
into series and parallel manner to form a photovoltaic array. The flexibility of this
modular PV system allows the engineer to build a solar PV array system that can easily
meet an extensive variety of electrical demands.
For the development of an equivalent circuit of the photovoltaic cell, one thing is
necessary to know about the physical configuration of elements of the cell and electrical
characteristics of each cell. The single diode equivalent model of the solar photovoltaic
cell is basically a current source parallel to diode and two lumped resistance i.e. parallel
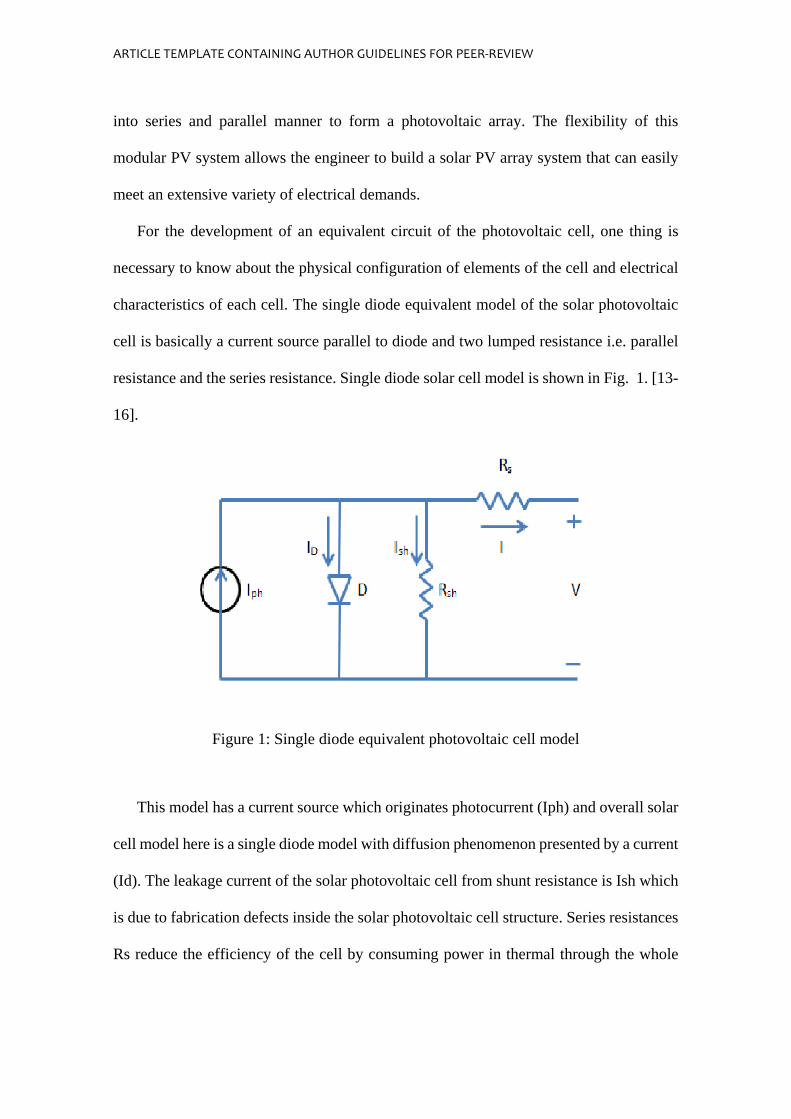
resistance and the series resistance. Single diode solar cell model is shown in Fig. 1. [13-
16].
Figure 1: Single diode equivalent photovoltaic cell model
This model has a current source which originates photocurrent (Iph) and overall solar
cell model here is a single diode model with diffusion phenomenon presented by a current
(Id). The leakage current of the solar photovoltaic cell from shunt resistance is Ish which
is due to fabrication defects inside the solar photovoltaic cell structure. Series resistances
Rs reduce the efficiency of the cell by consuming power in thermal through the whole

INTERNATIONAL JOURNAL OF RENEWABLE ENERGY RESEARCH Corresponding Author et al. ,Vol. XX, No. XX
7
junction substrate. Under irradiance, currently delivered by the solar cell is equal to
photocurrent Iph minus diode current Id, and leakage current Ish as given by (1) [17].
I = Iph − Id − Ish (1)
The relationship between current Id and voltage V is represented by (2)
Id = Is [exp (V+RsI
nVt) − 1] (2)
Where Ish is a leakage current due to Rsh resistance and relationship with voltage V is:
Ish = V+ RsI
Rsh (3)
I = Iph − Is [exp (V+ RsI
nVt) − 1] −
V+ RsI
Rsh (4)
Vt = TcK
q (5)
Is : Diffusion Reverse saturation current
n : Diode quality factor value between 1 and 2
Rs : Series resistance
Rsh : Shunt resistance
𝐾 : Boltzmann constant (𝑘 = 1.38 × 10⁻²³ 𝐽
𝐾⁄ )
Tc : Operating cell temperature (°C)
𝑞 : Electron charge (𝑞 = 1.6 × 10⁻¹⁹ 𝐶)
Equation (1) – (5) are used to find the current and voltage of a photovoltaic solar cell
at standard test conditions (STC). These equations are not enough to find current and
voltages at changing irradiance level or changing temperature due to some shading
objects like trees, clouds, birds, buildings etc. So, this is compulsory to do some extra
work on these equations for finding current and voltage under shadow conditions or
changing temperature level. For a typical silicon-based solar panel, equations are [18].
Isc = Isc,stc {1 + α(Tc − Tstc)} (Einstant
Estc) (6)

ARTICLE TEMPLATE CONTAINING AUTHOR GUIDELINES FOR PEER-REVIEW
Voc = Voc,stc {1 + a ln (Einstant
Estc) + β(Tc − Tstc)} (7)
Iinstant,mp = Imp,stc (Isc
Isc,stc) (8)
Vinstant,mp = Vmp,stc + (Voc − Voc,stc) + Rs(Imp,stc − Iinstant,mp) (9)
Pmax = Vinstant,mp. Iinstant,mp (10)
Where,
Isc,stc : Short circuit current at standard test condition STC
Isc : Short circuit current
α : Temperature coefficient for short circuit current
Tc : Operating Temperature
Tstc : Standard test condition temperature
Einstant : Instantaneous Irradiance
Estc : Standard irradiance (1000W/m2)
𝑉𝑜𝑐,𝑠𝑡𝑐 : Open circuit voltage at STC
a : Irradiance correction factor of Voc
𝛽 : Temperature coefficient of open circuit voltage
𝐼𝑖𝑛𝑠𝑡𝑎𝑛𝑡,𝑚𝑝 : Instantaneous current at maximum power
𝑉𝑖𝑛𝑠𝑡𝑎𝑛,𝑚𝑝 : Instantaneous voltage at maximum power
𝑉𝑚𝑝,𝑠𝑡𝑐 : Voltage at maximum power at STC
𝑅𝑠 : Series Resistance
𝑃𝑚𝑎𝑥 : Maximum calculated power
3. Methodology
In this paper, four different connection techniques are modeled in MATLAB Simulink.
These techniques are SP, HC, BL, and TCT. For simulation purpose, a built-in model of
PV array with bypass diodes is used. Fig. 2 shows that Irradiance and temperature are

INTERNATIONAL JOURNAL OF RENEWABLE ENERGY RESEARCH Corresponding Author et al. ,Vol. XX, No. XX
9
input parameters of the solar PV array model. We can change these parameters according
to our requirement by giving different values to input parameter blocks. Fig. 2 shows
three output parameters. First one is denoted with “m” which has five output values. The
Second terminal is a positive connection and the third one is a negative connection of
solar photovoltaic PV array. SUNPOWER SPR-X20-250-BLK model is used in the PV
array model. Table 1 shows specification for PV array in which power, number of cells,
voltage and current values are mentioned.
Figure 2: MATLAB solar photovoltaic array
Table 1: Sunpower SPR-X20-250-BLK Parameters
Parameter Value
P max 249.952 W
Voc 50.93 V
Isc 6.2 A
Vmp 42.8 V
N cell 72
Imp 5.84 A

ARTICLE TEMPLATE CONTAINING AUTHOR GUIDELINES FOR PEER-REVIEW
3.1. Series-parallel (SP) connection
PV arrays are attached in series-parallel manners as shown in Fig. 3. Four Photovoltaic
PV arrays are attached in a series manner in the first column. Second, third and fourth
column also consists of four photovoltaic PV arrays in a series manner.
Figure 3: 4×4 Series-parallel (SP) with a bypass diode connection model
These four columns are attached in a parallel manner to formulate a series-parallel
configuration generally used in conventional installations. A block of external testing is
shown in Fig. 3 which consists of a controlled voltage source with ramp function to get
output I-V and P-V curve of the series-parallel model. One current measurement block
from Simulink tools is used for measurement of current of the complete circuit. One
voltage measurement block is used for measurement of the voltage of the whole circuit.

INTERNATIONAL JOURNAL OF RENEWABLE ENERGY RESEARCH Corresponding Author et al. ,Vol. XX, No. XX
11
3.2. Honey comb connection (HC)
This model is the same as the SP technique with some changing in connections of the
different PV array to get a better result under different partial (PS) shading conditions. In
the HC model, two parallel columns having three PV arrays are connected in series as
shown in Fig. 4. This connection technique has the capability to provide an alternate path
for currents in case if a certain PV cell is reverse biased due to shading. Therefore, it
improves the current, voltage and output power of the PV system consisting of multiple
arrays and modules. When PV cell will be under partial shading condition then PV array
works as load but these extra connections allow and bypass this cell so the output power
of this system will improve than SP connection. In some cases, it gives better output
power under partial shading conditions.
Figure 4: 4×4 Honey comb (HC) with a bypass diode connection model

ARTICLE TEMPLATE CONTAINING AUTHOR GUIDELINES FOR PEER-REVIEW
3.3. Bridge link connection (BL)
This is the modified form of the SP model in which four extra connections are used
with bridge rectifier type manners to get better output power under different partial
shading patterns Fig. 5. This model shows two parallel strings in a series manner. They
are also connected to photovoltaic PV arrays and there exists a tie in the middle of the
bridges.
Figure 5: 4×4 Bridge link (BL) with a bypass diode connection model
3.4. Total cross tied connection (TCT)
This is also modified the form of SP model in which nine extra connections are used
to mitigate the effect of different partial shading patterns like long wide (LW), short wide
(SW), long narrow (LN), short narrow (SN), diagonal (DI) to get better output power. In

INTERNATIONAL JOURNAL OF RENEWABLE ENERGY RESEARCH Corresponding Author et al. ,Vol. XX, No. XX
13
this technique, columns are connected with the series manner and rows of the model are
connected with parallel manners as shown in Fig. 6. Total cross tied technique needs an
extra five meters cross tie connections between every two cells of PV array model. This
technique requires extra connection wire from one PV array to another PV array in
standard settings. This wire cost will be calculated below cost analysis section.
Figure 6: Total cross tied (TCT) with bypass diode connection model
4. Results and Analysis
In this section, the simulated results of the deployed methodology have been presented
and discussed. After finding the best possible technique, its cost analysis has been
performed to calculate the payback time.

ARTICLE TEMPLATE CONTAINING AUTHOR GUIDELINES FOR PEER-REVIEW
4.1. P-V curves under long wide (LW) shade pattern
In Fig. 7, the simulated P-V curves for the four connection techniques are shown as:
Series-parallel technique - curve with only dots
Honey comb technique - curve with dots and bar lines
Bridge link technique - curve with only bar lines
Total cross tied technique - curve with a solid line
Results show that total cross tied has maximum power than other connection techniques
under long wide (LW) partial shading pattern.
Figure 7: P-V curves under long wide (LW) partial shading condition
4.2. P-V curves under long narrow (LN) shade pattern
Fig. 8 shows simulated I-V curves for different connection techniques under long
narrow (LN) partial shading pattern. These curves are between voltage and current but

INTERNATIONAL JOURNAL OF RENEWABLE ENERGY RESEARCH Corresponding Author et al. ,Vol. XX, No. XX
15
total cross tied connection techniques has maximum current (I max) at the maximum
power point (MPP) than other connection techniques. Hence total cross tied connection
is suitable for long narrow (LN) type shading condition as evident from simulation results.
In long narrow pattern, TCT connection technique has maximum power than other SP,
HC and BL connection techniques. TCT curve shows in solid line having a very smooth
curve to find maximum power point (MPP) than other connection techniques. TCT
connection technique gets a maximum current (Imax) value than other techniques.
Figure 8: P-V curves under long narrow (LN) partial shading condition
4.3. P-V curves under short wide (SW) shade pattern
Fig. 9 shows P-V curves for different connection techniques under short wide (SW)
partial shade pattern. Those cells which will be under partial shade acts as a load. Some
curves are overlapping each other due to nearly same output value. This is the reason four

ARTICLE TEMPLATE CONTAINING AUTHOR GUIDELINES FOR PEER-REVIEW
curves seems like two or three curves. Fig. 9 shows the TCT connection technique has
maximum power (Pmax) at maximum power point (MPP) than other SP, HC and BL
techniques. TCT curve has very less complexity to find maximum power point (MPP)
than other connection techniques. In Fig. 9, it can be easily seen that there is a lot of
difference between TCT output power than other connection techniques. Results show
that Modified total cross tied connection is a best option to mitigate the effect of short
wide (SW) type shade pattern with maximum current (Imax) value at maximum power
point (MPP).
Figure 9: P-V curves under short wide (SW) partial shading condition
4.4. P-V curves under short narrow (SN) shade pattern
Fig 10 shows a P-V curve for short narrow partial shading pattern. We can see easily
a lot of difference between total cross tied curve and other connection technique curves.
TCT technique gives maximum output power at maximum power point than other

INTERNATIONAL JOURNAL OF RENEWABLE ENERGY RESEARCH Corresponding Author et al. ,Vol. XX, No. XX
17
connection techniques. The complexity to find the maximum power point is very less in
total cross tied connection technique.
Figure 10: P-V Curves under Short Narrow (SN) Partial Shading Condition
4.5. P-V curves under diagonal (DI) shade pattern
This is a special case of partial shading pattern than other partial shading pattern. TCT
curve has only one maximum power point (MPP) than other techniques have 2 to 3
maximum power point. More than one maximum power point (MPP) creates complexity
to find global maxima where the system giving the highest output power values. In
diagonal (DI) type shade pattern total cross tied technique is the best option to get
maximum output power with only one maximum power point. P-V Curves under
Diagonal (DI) Partial Shading Condition have been shown in Fig. 11.

ARTICLE TEMPLATE CONTAINING AUTHOR GUIDELINES FOR PEER-REVIEW
Figure 11: P-V Curves under Diagonal (DI) Partial Shading Condition
4.6. Cost analysis and results
Cost analysis of TCT with nine extra connections has been done in this section. This
cost analysis is taken from output power under diagonal shade (DI) pattern in which TCT
technique performs 12.2% more efficiently than SP connections technique.
Table 2 shows the voltage, current, and power of the PV array model under partial
shading condition. It can be seen that the total cross tied connection has maximum power
in each case but current and voltage values vary in each partial shading condition.

INTERNATIONAL JOURNAL OF RENEWABLE ENERGY RESEARCH Corresponding Author et al. ,Vol. XX, No. XX
19
Table 2: Power, Voltage and Current Values under Different Shade Patterns
Connection
Techniques
P max
V max
I max
LW
(Long
wide)
LN
(Long
Narrow)
SN
(Short
Narrow)
SW
(Short
wide)
DI
(Diagonal)
SP
(Series Parallel)
Imax 18.62 A 21.67 A 19.90 A 17.98 A 18.08 A
Vmax 178.49 V 172.54 V 171.91 V 179.31 V 178.40 V
Pmax 3324.9 W 3739.2 W 3422.6 W 3224.9 W 3226.2 W
HC
(Honey Comb)
Imax 19.44 A 21.94 A 19.93 A 18.14 A 19.35 A
Vmax 175.85 V 172.54 V 173.06 V 179.31 V 174.91 V
Pmax 3420.2 W 3786.3 W 3450.1 W 3252.8 W 3384.8 W
BL
(Bridge Link)
Imax 19.80 A 21.90 A 20.04 A 18.19 A 18.17 A
Vmax 175.85 V 172.54 V 174.36 V 179.31 V 178.40 V
Pmax 3482.8 W 3780.3 W 3496.4 W 3263.4 W 3243.4 W
TCT
(Total Cross
Tied)
Imax 20.37 A 22.11 A 20.59 A 20.42 A 21.58 A
Vmax 175.85 V 172.54 V 175.70 V 175.90 V 172.00 V
Pmax 3583.1 W 3815.4 W 3619.4 W 3593.6 W 3713.3 W
Table 3 shows the output power comparison between four different connection
techniques under five different partial shading patterns. Total cross tied connection shows
better efficiency in each partial shading case. Maximum efficiency of 12.2% was
achieved in diagonal shade pattern by using a 4×4 PV array model.

ARTICLE TEMPLATE CONTAINING AUTHOR GUIDELINES FOR PEER-REVIEW
Table 3: Output Power Comparison between Different Connection Techniques
Connection
Techniques
Powers (W) &
Efficiency
LW
(Long
wide)
LN
(Long
Narrow)
SN
(Short
Narrow)
SW
(Short
wide)
DI
(Diagonal)
SP
(Series
Parallel)
SP Method 3324.9 W 3739.2 W 3422.6 W 3224.9 W 3226.2 W
TCT Method 3583.1 W 3815.4 W 3619.4 W 3593.6 W 3713.3 W
Improvement in
% 6.47 % 1.9 % 4.9 % 9.2 % 12.2%
HC
(Honey Comb)
HC Method 3420.2 W 3786.3 W 3450.1 W 3252.8 W 3384.8 W
TCT Method 3583.1 W 3815.4 W 3619.4 W 3593.6 W 3713.3 W
Improvement in
% 4.0 % 0.7 % 4.2 % 8.5 % 8.6 %
BL
(Bridge
Link)
BL Method 3482.8 W 3780.3 W 3496.4 W 3263.4 W 3243.4 W
TCT Method 3583.1 W 3815.4 W 3619.4 W 3593.6 W 3713.3 W
Improvement in
% 2.5 % 0.88 % 3.07 % 8.26 % 11.75 %
SP Power (W) in diagonal Pattern = 3226.2 W
TCT Power (W) in diagonal Pattern = 3713.3 W
Power difference between SP and TCT = 487.1 W
Partial shading duration in a day = 3 Hours
Power saving (W) in a day = 487.1 × 3 = 1461.3 W
Extra units in a day = 1461.3
1000= 1.461 unit
Extra Units in a month = Watts ×hours
1000 × 30
Extra Units in a month = 487.1 ×3
1000 × 30 = 43.8 unit
The above performed calculations show that approximately 43.8 units (kWh) will be
saved in a month using TCT technique.

INTERNATIONAL JOURNAL OF RENEWABLE ENERGY RESEARCH Corresponding Author et al. ,Vol. XX, No. XX
21
4.7. Payback time for total cross tied (TCT) technique
TCT method has been proved to be an efficient one as compared to other techniques. The
only addition of a wire can convert the old technique into TCT. That is why, the cost
analysis is only based on the expenses of new wire addition.
Length of one wire in TCT method = 5 ft
Total length used in TCT method = 5 × 9 = 45 ft
Cost of one wire = 3.125 USD
Cost of nine wires = 3.125 × 9 = 28.125 USD
Save unit in one month = 43.8 unit
One unit cost commercial = 0.0714 USD
Save Dollars in one month = 43.8 × 0.0714 = 3.128 USD
Payback time in a year = 28.125
3.128= 9 Months
We conclude from cost analysis only nine extra connections will be used for TCT
connections to mitigate the effect of partial shading effect. Nine extra connections need
extra 28.125 USD amount than series-parallel connections. Solar PV array has more than
25 years life and just within three-quarters of years, this amount returns back in the form
of greater output power than series-parallel connection technique under diagonal shade
pattern.
5. Conclusion
In this paper, we have mitigated the effect of different partial shading patterns like long
wide (LW), long narrow (LN), short wide (SW), short narrow (SN), and diagonal (DI)
patterns by using different connection techniques like SP, HC, BL, and TCT. Simulation
results show that total cross tied (TCT) is the best technique to mitigate the effect of these
partial shading patterns. Maximum efficiency of 12.2% has been achieved in diagonal
(DI) shade pattern by using TCT connection technique. In this research work, multiple
peaks which occurred during partial shading have been reduced using TCT technique

ARTICLE TEMPLATE CONTAINING AUTHOR GUIDELINES FOR PEER-REVIEW
which can be easily seen in the simulation results of MATLAB software. Five different
shade patterns have been used in this research. TCT technique has maximum output
power in every case. Due to extra connections which are used in TCT technique, the initial
cost of the system will be a bit higher than the other techniques but this cost can be easily
compensated within just three quarters of a year.
References
1. T. J. L, T. M. J, and L. Thierry, “Indicators for sustainable energy development in
Thailand,” Natural Resource Forum, vol. 29, pp. 343-359, 2005. doi: 10.1111/j.1477-
8947.2005.00146.x
2. International Energy Statistics. Renewables Information- 2006 Edition.
3. Economic Survey of Pakistan 2004-2005, Finance Division, Government of
Pakistan, Islamabad.
4. T. Muneer, S. Maubleu and M. Asif "Prospects of solar water heating for textile
industry in Pakistan" Renew. Sustain. Energy Rev, vol. 10 no. 1 pp. 1-23 Feb. 2006.
doi: 10.1016/j.rser.2004.07.003
5. WAPDA, Water and power development
authority,⟨http://www.wapda.gov.pk/⟩;[accessed 17.05.18].
6. M. Farooq and A.Shakoor, “Severe energy crises and solar thermal energy as aviable
option for Pakistan,” Journel of Renewable and Sustainable Energy, vol. 5 no.1 pp.
013104 Jan. 2013. doi: 10.1063/1.4772637
7. H.khawar. (2017, Nov. 9). Fix the energy mix
[Online].Available:https://tribune.com.pk/story/1553356/6-fix-energy-mix/.
8. U. Shahzad, “The Importance of Renewable Energy Sources in
Pakistan,” Renewable energy, vol.1 no.3 pp.4 2015.
9. R. Ramaprabha and B. L. Mathur, "Modelling and simulation of Solar PV Array
under partial shaded conditions," 2008 IEEE International Conference on
Sustainable Energy Technologies, Singapore, 2008, pp. 7-11. doi:
10.1109/ICSET.2008.4746963
10. M. A. A. Mamun M. Hasanuzzaman J. Selvaraj "Experimental investigation of the
effect of partial shadingon photovoltaic performance" IET Renewable Power
Generation vol. 11 no. 7 pp. 912-921 June. 2017. doi: 10.1049/iet-rpg.2016.0902

INTERNATIONAL JOURNAL OF RENEWABLE ENERGY RESEARCH Corresponding Author et al. ,Vol. XX, No. XX
23
11. G. Carannante, C. Fraddanno, M. Pagano and L. Piegari, "Experimental Performance
of MPPT Algorithm for Photovoltaic Sources Subject to Inhomogeneous Insolation,"
in IEEE Transactions on Industrial Electronics, vol. 56, no. 11, pp. 4374-4380, Nov.
2009. doi: 10.1109/TIE.2009.2019570
12. A. I. Bratcu, I. Munteanu, S. Bacha, D. Picault and B. Raison, "Cascaded DC–DC
Converter Photovoltaic Systems: Power Optimization Issues," in IEEE Transactions
on Industrial Electronics, vol. 58, no. 2, pp. 403-411, Feb. 2011. doi:
10.1109/TIE.2010.2043041
13. M. G. Villalva, J. R. Gazoli and E. R. Filho, "Modeling and circuit-based simulation
of photovoltaic arrays," 2009 Brazilian Power Electronics Conference, Bonito-Mato
Grosso do Sul, 2009, pp. 1244-1254. doi: 10.1109/COBEP.2009.5347680
14. J. Bikaneria, S. Prakash Joshi and A. R. Joshi. “Modeling and Simulation of PV Cell
using One-Diode model,” International Journal of Scientific and Research
Publications, vol. 3, no.10, pp. 1-4, Oct. 2013.
15. D. Bonkoungou, Z. Koalaga and D. Njomo. “Modelling and Simulation of
photovoltaic module considering single-diode equivalent circuit model in
MATLAB,” International Journal of Emerging Technology and Advanced
Engineering, vol. 3, no.3, pp. 493-502, Mar. 2013.
16. K. L. Kennerud, "Analysis of Performance Degradation in CdS Solar Cells," in IEEE
Transactions on Aerospace and Electronic Systems, vol. AES-5, no. 6, pp. 912-917,
Nov. 1969. doi: 10.1109/TAES.1969.309966
17. F. Masmoudi, F. Ben Salem and N. Derbel, "Single and double diode models for
conventional mono-crystalline solar cell with extraction of internal
parameters," 2016 13th International Multi-Conference on Systems, Signals &
Devices (SSD), Leipzig, 2016, pp. 720-728. doi: 10.1109/SSD.2016.7473725
18. A. S. Rana, M. Nasir and H. A. Khan, "String level optimization on grid-tied solar
PV systems for minimizing soft shading power loss," IET Renewable Power
Generation, vol.12, no.2, pp. 143-148, Nov. 2017. doi: 10.1049/iet.rpg.2017.0229