Embed Size (px)
Citation preview
53
AACSB Intellectual Contributions Impact Metrics
Examples of metrics that schools might use to assess the impact of their activities, including scholarship and the creation of intellectual contributions, are provided below. Some activities, including scholarship, may have multiple impacts, while others have limited or no impact. Sometimes the impact of an activity or intellectual contribution may not be known or identifiable for a number of years. It is also important to note that evidence that intellectual contribution outcomes have “made a difference” may result from a single outcome produced by one or more faculty members and/or students, a series or compilations of works, or collaborative work with colleagues at other institutions or in practice. The list of categories and examples provided in this appendix is not intended to be limiting or exhaustive. Schools may identify and report other examples not included below, including impact on constituencies, such as society, community, business practitioners, students, alumni, etc. MISSION ALIGNMENT IMPACT
• Alignment of intellectual contribution outcomes with themes or focus areas valued by the business school’s mission (e.g., global development, entrepreneurship, innovation)
• Percentage of intellectual contribution outcomes that align with one or more “mission-related” focus areas for research
• Percentage of faculty with one or more intellectual contribution outcomes that align with one or more mission-related focus areas
• Research awards and recognition that document alignment with one or more “mission-related” focus areas for research
• Substantive impact and carry-forward of mission as stated in Standard 1 and as referenced throughout the remaining accreditation standards
• Linkage between mission as stated in Standard 1 and financial history and strategies as stated in Standard 3
ACADEMIC IMPACT
• Publications in highly recognized, leading peer-review journals (journals in a designated journal list, Top 3, Top 10, etc.)
• Citation counts
• Evidence of impact on stakeholders and society such as changes in business practices, professional standards, or public policy
• Case studies that document the impact of intellectual contributions on stakeholders and society
• Download counts for electronic journals
• Editorships, associate editorships, editorial board memberships, and/or invitations to act as journal reviewers for recognized, leading peer-review journals
• Elections or appointments to leadership positions in academic and/or professional associations, standards setting bodies and professional societies
• Recognitions for research (e.g., Best Paper Award), Fellow Status in an academic society, and other recognition by professional and/or academic societies for intellectual contribution outcomes
• Invitations to participate in research conferences, scholarly programs, and/or international, national, or regional research forums
• Inclusion of academic work in the syllabi of other professors’ courses
54
• Use of academic work in doctoral seminars
• Competitive grants awarded by major national and international agencies (e.g., NSF and NIH) or third-party funding for research projects
• Patents awarded
• Appointments as visiting professors or scholars in other schools or a set of schools
TEACHING/INSTRUCTIONAL IMPACT
• Grants for research that influence teaching/pedagogical practices, materials, etc.
• Case studies of research leading to the adoption of new teaching/learning practices
• Textbooks, teaching manuals, etc., that are widely adopted (by number of editions, number of downloads, number of views, use in teaching, sales volume, etc.)
• Publications that focus on research methods and teaching
• Research-based learning projects with companies, institutions, and/or non-profit organizations
• Instructional software (by number of programs developed, number of users, etc.)
• Case study development (by number of studies developed, number of users, etc.)
BACHELOR’S/MASTER’S LEVEL EDUCATION IMPACT
• Mentorship of student research reflected in the number of student papers produced under faculty supervision that lead to publications or formal presentations at academic or professional conferences
• Documented improvements in learning outcomes that result from teaching innovations that incorporate research methods from learning/pedagogical research projects
• Results from engagement of students in consulting or business based projects
• Increased recruitment, retention, graduation, placement of under-represented student populations
• New venture formation
• Hiring/placement of students
• Career success of graduates beyond initial placement
• Placement of students in research-based graduate programs
• Direct input from organizations that hire graduates regarding graduates' preparedness for jobs and the roles they play in advancing the organization
• Movement of graduates into positions of leadership in for-profit, non-profit, and professional and service organizations
DOCTORAL EDUCATION IMPACT
• Hiring/placement of doctoral students, junior faculty, and post-doctoral research assistants
• Publications of doctoral students and graduates
• Invited conference attendance, as well as awards/nominations for doctoral students/graduates
• Research fellowships awarded to doctoral students/graduates
• Funding awards for students engaged in activities related to doctoral research
• Case studies that document the results of doctoral research training activities, such as the transfer of knowledge to industry and impact on corporate or community practices
• Research outputs of junior faculty members (including post-doctoral junior professors, assistant professors, doctoral research assistants, and doctoral students) that have been
55
influenced by their mentors/supervisors
PRACTICE /COMMUNITY IMPACT
• Media citations (e.g., number, distribution, and effect)
• Requests from the practice community to utilize faculty expertise for consulting projects, broadcast forums, professional development activities, researcher-practitioner meetings, faculty/student consulting projects, etc.
• Publications in practitioner journals or other venues aimed directly at improving management expertise and practice
• Consulting reports resulting from the engagement of faculty and students
• Research income from various external sources, such as industry and community/governmental agencies to support individual and collaborative research activities
• Community enhancement outcomes resulting from the engagement of faculty and students in community issues
• Case studies based on research that has led to solutions to business problems
• Adoption of new practices or operational approaches as a result of faculty scholarship
• Presentations and workshops for business professionals
• Invitations for faculty to serve as experts on policy formulation, witnesses at legislative hearings, members of special interest groups/roundtables, etc.
• Tools/methods developed for companies
• Memberships on boards of directors of corporate and non-profit organizations
• Memberships on professional standards setting bodies or policy-making bodies
EXECUTIVE EDUCATION IMPACT
• Sustained and consistent involvement of research-active faculty in executive education programs
• Sustained success of executive education programs based on demand, level of participation, and repeat business
• Market research confirming value of executive education programs delivered by research-active faculty
• Consulting activities of research active faculty that stem from participation in executive education activities
• Inclusion of cases and other materials in degree programs that can be identified as resulting from executive education activity
• Partnerships between the school and organizations that participate in executive education programs, which benefit the school's teaching, research, and other activities and programs
• Involvement of executive education participants and their organizations in the teaching mission of the school (e.g., executive-in-residence program)
• Linkage between organizations participating in executive education and student internships, as well as placement of graduates in entry-level positions
RESEARCH CENTER IMPACT
• Invitations by governmental or other agencies/organizations for center representatives to serve on policy-making bodies
• Center research projects funded by external governmental, business, or non-profit agencies

56
• Continued funding (e.g., number of donors, scale of donations)
• Number of web visits to research center website (e.g., tracking data from Google Analytics)
• Number of attendees (representing academics, practitioners, policymakers, etc.) at center-sponsored events
• Sustained research center publications that are funded by external sources or that are highly recognized as authoritative sources of analysis and perspectives related to the center’s core focus
57
Appendix II A Collective Vision for Business Education:
Utilizing the Framework within the Context of Strategic Planning & Accreditation Reviews This Appendix provides a brief overview of the opportunities outlined within A Collective Vision for Business Education, and draws on them to suggest some prompts for exploration within the school’s strategic planning and strategic innovation efforts. In addition, many schools will find opportunities to explore these questions and others related to the Vision in discussion with mentors, peer reviewers, and others acting formally or informally in an advisory capacity. A broader suite of resources is available at www.aacsb.edu/vision. This appendix is provided in support of the school’s strategic planning process. Schools are not required to adopt any portion of the Collective Vision for Business Education, or the opportunities identified in the report, to align with the AACSB accreditation standards. In April 2016, AACSB released A Collective Vision for Business Education. The result of a multi-year process of collaborative research and exploration, the Collective Vision for Business Education draws on inputs from business schools and stakeholders of business education. The Vision identifies five broadly defined areas of opportunity for business schools to consider as they seek positive societal impact, aligned with shifting stakeholder needs, through innovation and engagement. A Collective Vision for Business Education is a strategic innovation and strategic planning complement to the quality assurance focus of the Eligibility Procedures and Accreditation Standards for Business Accreditation. It aims to encourage and empower schools “to transform—in some ways gradually and in other ways dramatically—to address the needs of the students they educate and the stakeholders they serve.” Through accreditation reviews, the quality and success of a school is assessed in relation to its mission, expected outcomes, and supporting strategies. A Collective Vision for Business Education similarly provides a framework for exploring—and for raising in consultative discussions with accreditation reviewers—opportunities to leverage the school’s unique circumstances to strengthen and evolve the value it provides, in areas that stretch the boundaries of the ways that business schools have traditionally defined themselves. Five Opportunities to Thrive Five key opportunities call for schools to draw on existing strengths to extend their impact and evolve in new directions. These are opportunities for business schools to embrace roles as:
1. Catalysts for Innovation: Entrepreneurship and management innovation will continue to drive new business creation and economic development in the future. With their multi-disciplinary approaches, strong networks, and the power to convene across sectors, business schools possess significant assets for taking a leading role in fostering innovation in society.
2. Co-Creators of Knowledge: Today’s business, economic, and social landscapes face questions that are complex and multidisciplinary. New insights and understanding will emerge where business schools firmly position themselves at the intersection of industry and practice, as conveners and partners in knowledge creation, rather than simply suppliers.
58
3. Hubs of Lifelong Learning:
Business schools have the potential to contribute to learning opportunities for a wide variety of individuals, at different points in their career life cycles. By connecting expertise and experiences, business schools will broaden the possibilities for learning and knowledge exchange.
4. Leaders on Leadership: Aspiring leaders will benefit from better science behind leadership development. With experience in executive education, domain knowledge, and their industry connections, business schools can lead the discovery of new data-informed insights into effective leadership and leadership development models that support ethical business and serve the common good.
5. Enablers of Global Prosperity: Business is increasingly expected to be an active participant in addressing broad societal goals and social challenges. Business schools contribute to global measures of well-being that go far beyond wealth creation. Business schools must continue to lead in the development of insights regarding effective, efficient, and ethical organizations, and also provide graduates with frameworks for driving inclusive, positive impact.
Three Critical Success Factors Successfully embracing the five opportunities outlined above depends on commitments to collaboration and experimentation. More specifically, success requires business schools to:
1. Cultivate a position at the intersection of academia and practice.
Business schools and organizations across industries and sectors must co-educate and
develop managerial talent, co-create new ideas and understanding, and innovate to
establish new business.
2. Connect with other disciplines. Business schools should seize opportunities to reinforce and expand the models and incentives that support interdisciplinary research and the structures to facilitate interdisciplinary learning.
3. Be a driver of innovation in higher education.
Business schools have an opportunity to help lead transformation in the models and
processes for education, knowledge creation, and economic development, through
incremental change as well as uncommon strategies and solutions.
Questions for Exploration and Discussion: The questions that follow draw on the opportunities and critical success factors identified in A Collective Vision for Business Education to help frame discussions about the business school’s evolving strategies, tactics, and metrics for success. They can be used in strategic planning exercises as well as for exploratory and consultative discussions with the school’s mentor, peer review team, or in reports that are submitted to an AACSB Accreditation Operating Committee (IAC, CIRC or AAC). The accreditation process, after all, exists to not only provide an assessment of overall high-quality and alignment with the accreditation standards but to also
59
provide consultative guidance and provoke reflection and further exploration about possibilities for continued evolution in the spirit of continuous improvement. While the questions below are framed with A Collective Vision for Business Education in mind, they could easily be inclusive of other frameworks as well.
1. For which of the five identified opportunities and three critical success factors could we make a strong case that the business school is currently either:
a. Embracing this role (or a variation of it) as an inherent and highly recognizable part of the school’s identity and activities; or Pushing the boundaries of traditionally defined business school models and roles, with uncommon strategies and solutions?
2. How does (or could) the school redefine the generically defined opportunities as a set of more customized calls to action that are linked to and supportive of the school’s mission and context, and specific global or local challenges that need addressing?
3. How might the school more fully embrace these roles and calls to action through additional attention in other existing areas of strategic focus or activity? Through development of new strategies or concepts that support the desired strategic market position and desired societal impacts of the school?
4. What relationships—with inter-disciplinary, business, and community partners—will be essential for moving deeply, strategically, and successfully in pursuit of these opportunities? How might existing relationships need to evolve and what new collaborations might be pursued?
5. What are the possibilities for experimenting with new models and processes to enable the shifts that are envisioned? Is there alignment between “what is valued” and what gets reinforced and rewarded? What metrics would be used to measure success? In what ways–both enabling and constraining–do quality assurance systems at the national, regional or AACSB level influence experimentation?
6. What new opportunities might emerge for business schools to make the case directly to their customers—and their supporters—that they deliver on their promises of societal value, with outcomes and impacts that are positive and sizable?
60
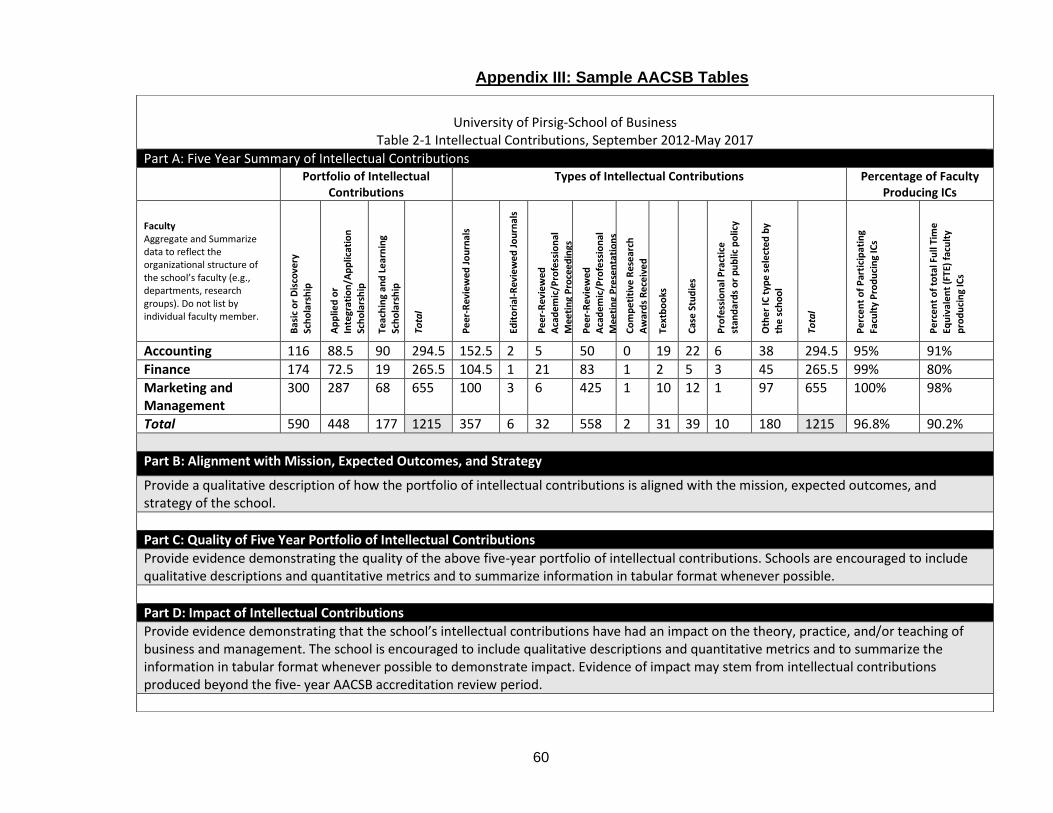
University of Pirsig-School of Business
Table 2-1 Intellectual Contributions, September 2012-May 2017
Part A: Five Year Summary of Intellectual Contributions
Portfolio of Intellectual Contributions
Types of Intellectual Contributions Percentage of Faculty Producing ICs
Faculty Aggregate and Summarize data to reflect the organizational structure of the school’s faculty (e.g., departments, research groups). Do not list by individual faculty member.
Bas
ic o
r D
isco
very
Sc
ho
lars
hip
Ap
plie
d o
r
Inte
grat
ion
/Ap
plic
atio
n
Sch
ola
rsh
ip
Teac
hin
g an
d L
ear
nin
g
Sch
ola
rsh
ip
Tota
l
Pe
er-R
evie
wed
Jo
urn
als
Edit
ori
al-R
evie
we
d J
ou
rnal
s
Pe
er-R
evie
wed
A
cad
emic
/Pro
fess
ion
al
Mee
tin
g P
roce
ed
ings
Pe
er-R
evie
wed
A
cad
emic
/Pro
fess
ion
al
Mee
tin
g P
rese
nta
tio
ns
Co
mp
eti
tive
Re
sear
ch
Aw
ard
s R
ece
ive
d
Text
bo
oks
Cas
e S
tud
ies
Pro
fess
ion
al P
ract
ice
st
and
ard
s o
r p
ub
lic p
olic
y
Oth
er
IC t
ype
se
lect
ed
by
the
sch
oo
l
Tota
l
Pe
rce
nt
of
Par
tici
pat
ing
Facu
lty
Pro
du
cin
g IC
s
Pe
rce
nt
of
tota
l Fu
ll Ti
me
Eq
uiv
ale
nt
(FTE
) fa
cult
y
pro
du
cin
g IC
s
Accounting 116 88.5 90 294.5 152.5 2 5 50 0 19 22 6 38 294.5 95% 91%
Finance 174 72.5 19 265.5 104.5 1 21 83 1 2 5 3 45 265.5 99% 80%
Marketing and Management
300 287 68 655 100 3 6 425 1 10 12 1 97
655 100% 98%
Total 590 448 177 1215 357 6 32 558 2 31 39 10 180 1215 96.8% 90.2%
Part B: Alignment with Mission, Expected Outcomes, and Strategy
Provide a qualitative description of how the portfolio of intellectual contributions is aligned with the mission, expected outcomes, and strategy of the school.
Part C: Quality of Five Year Portfolio of Intellectual Contributions
Provide evidence demonstrating the quality of the above five-year portfolio of intellectual contributions. Schools are encouraged to include qualitative descriptions and quantitative metrics and to summarize information in tabular format whenever possible.
Part D: Impact of Intellectual Contributions
Provide evidence demonstrating that the school’s intellectual contributions have had an impact on the theory, practice, and/or teaching of business and management. The school is encouraged to include qualitative descriptions and quantitative metrics and to summarize the information in tabular format whenever possible to demonstrate impact. Evidence of impact may stem from intellectual contributions produced beyond the five- year AACSB accreditation review period.
Appendix III: Sample AACSB Tables
61
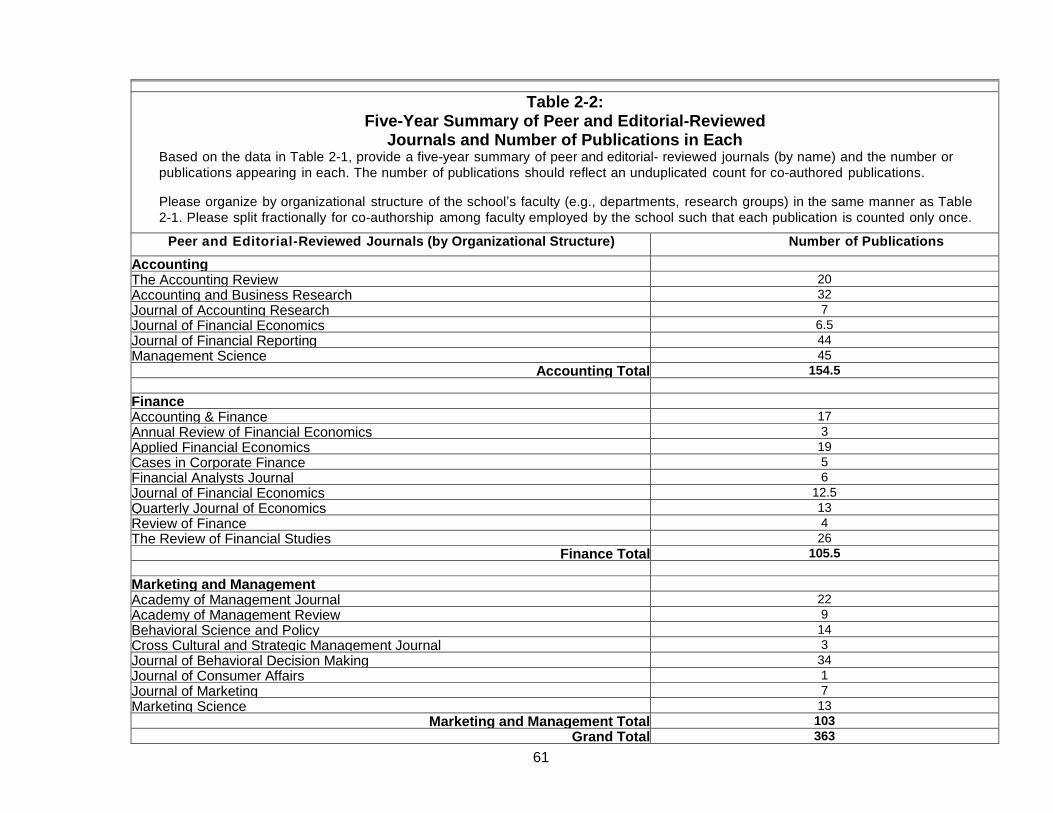
Table 2-2: Five-Year Summary of Peer and Editorial-Reviewed
Journals and Number of Publications in Each
Based on the data in Table 2-1, provide a five-year summary of peer and editorial- reviewed journals (by name) and the number or
publications appearing in each. The number of publications should reflect an unduplicated count for co-authored publications.
Please organize by organizational structure of the school’s faculty (e.g., departments, research groups) in the same manner as Table
2-1. Please split fractionally for co-authorship among faculty employed by the school such that each publication is counted only once.
Peer and Editorial-Reviewed Journals (by Organizational Structure) Number of Publications
Accounting
]
The Accounting Review 20
Accounting and Business Research
32
Journal of Accounting Research 7
Journal of Financial Economics 6.5
Journal of Financial Reporting 44
Management Science 45
Accounting Total 154.5
Finance
Accounting & Finance 17
Annual Review of Financial Economics 3
Applied Financial Economics 19
Cases in Corporate Finance 5
Financial Analysts Journal 6
Journal of Financial Economics 12.5
Quarterly Journal of Economics 13
Review of Finance 4
The Review of Financial Studies 26
Finance Total 105.5
Marketing and Management
Academy of Management Journal 22
Academy of Management Review 9
Behavioral Science and Policy 14
Cross Cultural and Strategic Management Journal 3
Journal of Behavioral Decision Making 34
Journal of Consumer Affairs 1
Journal of Marketing 7
Marketing Science 13
Marketing and Management Total 103
Grand Total 363
62
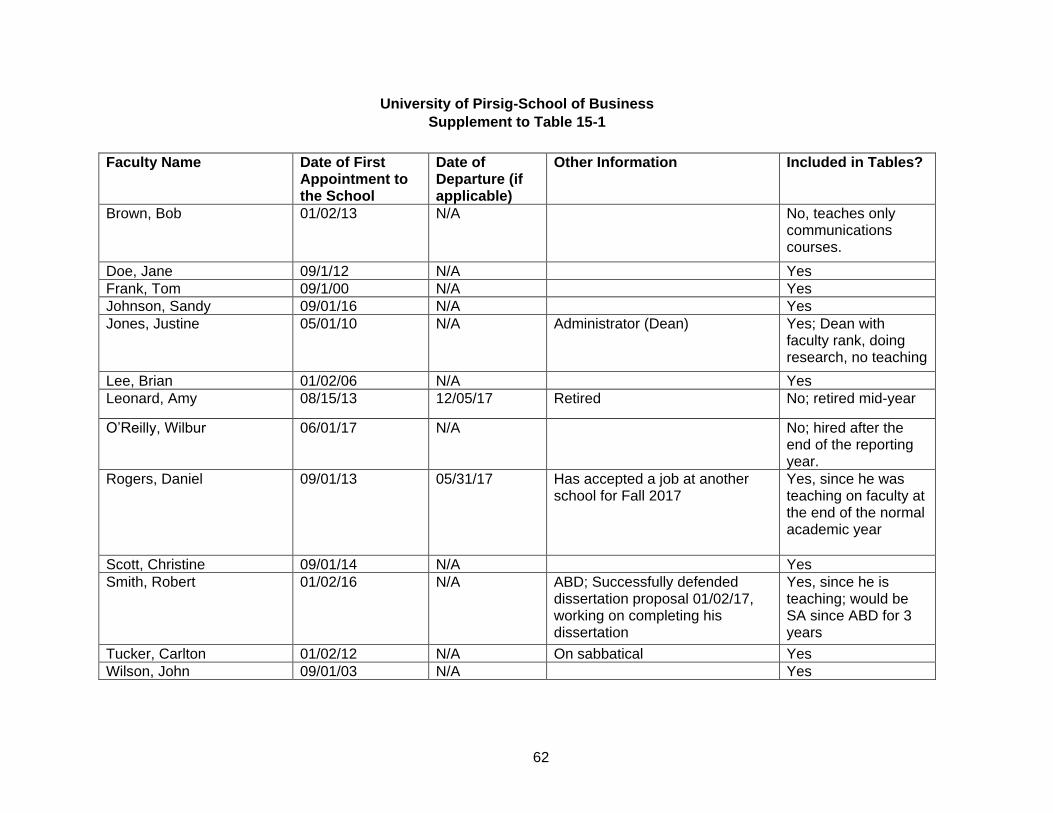
University of Pirsig-School of Business
Supplement to Table 15-1
Faculty Name Date of First Appointment to the School
Date of Departure (if applicable)
Other Information Included in Tables?
Brown, Bob 01/02/13 N/A No, teaches only communications courses.
Doe, Jane 09/1/12 N/A Yes
Frank, Tom 09/1/00 N/A Yes
Johnson, Sandy 09/01/16 N/A Yes
Jones, Justine 05/01/10 N/A Administrator (Dean) Yes; Dean with faculty rank, doing research, no teaching
Lee, Brian 01/02/06 N/A Yes
Leonard, Amy 08/15/13 12/05/17 Retired No; retired mid-year
O’Reilly, Wilbur 06/01/17 N/A No; hired after the end of the reporting year.
Rogers, Daniel 09/01/13 05/31/17 Has accepted a job at another school for Fall 2017
Yes, since he was teaching on faculty at the end of the normal academic year
Scott, Christine 09/01/14 N/A Yes
Smith, Robert 01/02/16 N/A ABD; Successfully defended dissertation proposal 01/02/17, working on completing his dissertation
Yes, since he is teaching; would be SA since ABD for 3 years
Tucker, Carlton 01/02/12 N/A On sabbatical Yes
Wilson, John 09/01/03 N/A Yes
63
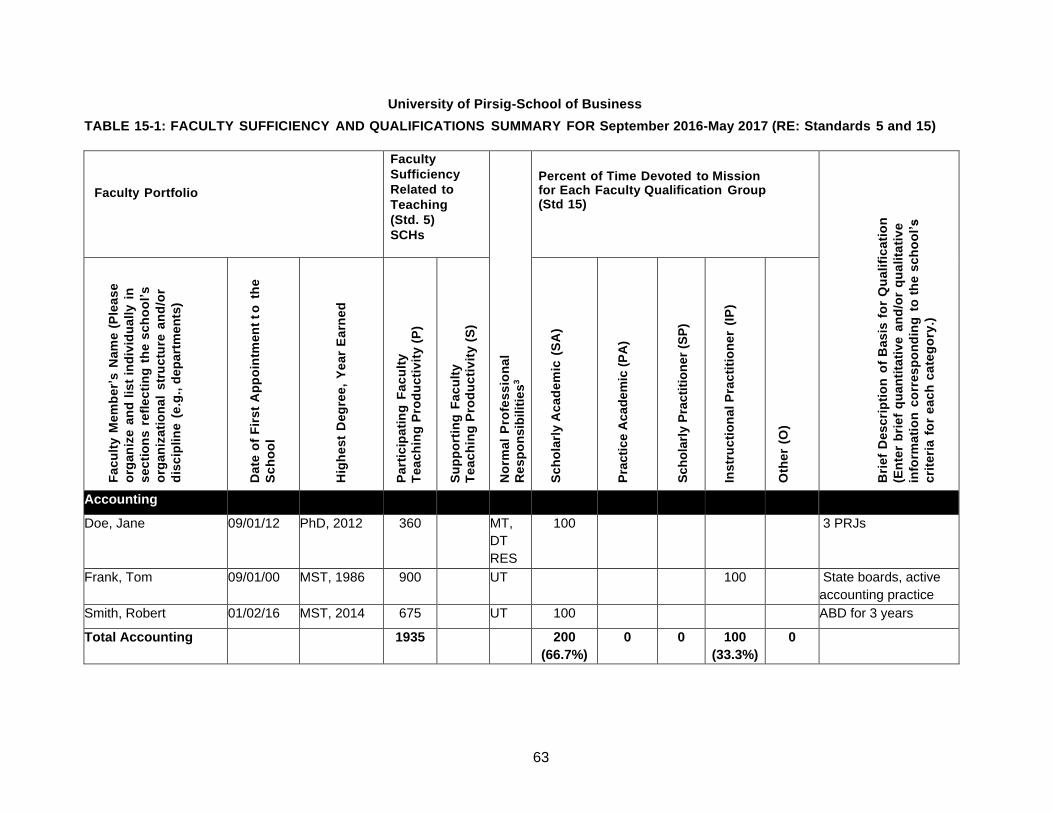
University of Pirsig-School of Business
TABLE 15-1: FACULTY SUFFICIENCY AND QUALIFICATIONS SUMMARY FOR September 2016-May 2017 (RE: Standards 5 and 15)
Faculty Portfolio
Faculty
Sufficiency
Related to
Teaching
(Std. 5)
SCHs
N
orm
al
Pro
fes
sio
na
l
Re
sp
on
sib
ilit
ies
3
Percent of Time Devoted to Mission for Each Faculty Qualification Group
(Std 15)
Bri
ef
De
sc
rip
tio
n o
f B
as
is f
or
Qu
ali
fic
ati
on
(En
ter
bri
ef
qu
an
tita
tiv
e a
nd
/or
qu
ali
tati
ve
info
rma
tio
n c
orr
es
po
nd
ing
to
th
e s
ch
oo
l’s
cri
teri
a f
or
ea
ch
ca
teg
ory
.)
F
ac
ult
y M
em
be
r’s
Na
me
(P
lea
se
org
an
ize
an
d l
ist
ind
ivid
ua
lly
in
se
cti
on
s r
efl
ec
tin
g t
he
sc
ho
ol’
s
org
an
iza
tio
na
l s
tru
ctu
re a
nd
/or
dis
cip
lin
e (
e.g
., d
ep
art
me
nts
)
Da
te o
f F
irs
t A
pp
oin
tme
nt
to
th
e
Sc
ho
ol
H
igh
es
t D
eg
ree
, Y
ea
r E
arn
ed
P
art
icip
ati
ng
Fa
cu
lty
Te
ac
hin
g P
rod
uc
tiv
ity
(P
)
S
up
po
rtin
g F
ac
ult
y
Te
ac
hin
g P
rod
uc
tiv
ity
(S
)
Sc
ho
larl
y A
ca
de
mic
(S
A)
Pra
cti
ce A
ca
de
mic
(P
A)
Sch
ola
rly P
racti
tio
ner
(SP
)
Ins
tru
cti
on
al P
rac
titi
on
er
(IP
)
O
the
r (O
)
Accounting
Doe, Jane 09/01/12 PhD, 2012 360 MT,
DT
RES
100 3 PRJs
Frank, Tom 09/01/00 MST, 1986 900 UT 100 State boards, active
accounting practice
Smith, Robert 01/02/16 MST, 2014 675 UT 100 ABD for 3 years
Total Accounting 1935 200
(66.7%)
0 0 100
(33.3%)
0
64
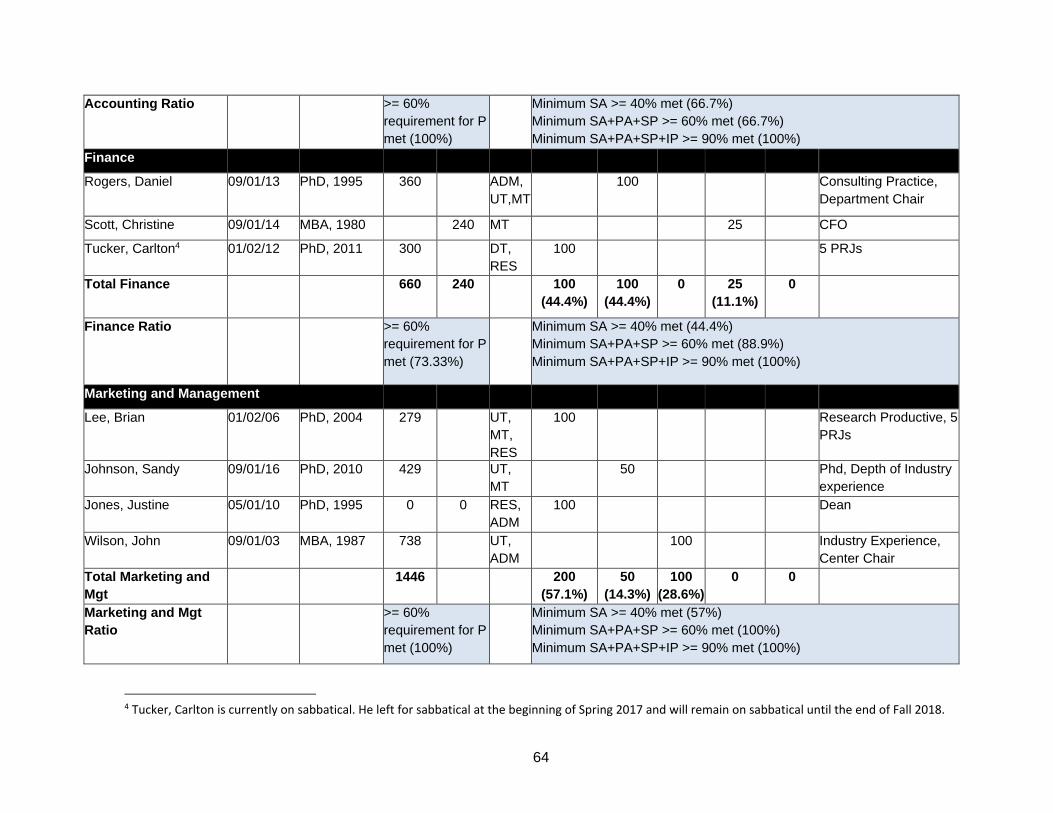
Accounting Ratio >= 60%
requirement for P
met (100%)
Minimum SA >= 40% met (66.7%)
Minimum SA+PA+SP >= 60% met (66.7%)
Minimum SA+PA+SP+IP >= 90% met (100%)
Finance
Rogers, Daniel 09/01/13 PhD, 1995 360 ADM,
UT,MT
100 Consulting Practice,
Department Chair
Scott, Christine 09/01/14 MBA, 1980 240 MT 25 CFO
Tucker, Carlton4 01/02/12 PhD, 2011 300 DT,
RES
100 5 PRJs
Total Finance 660 240 100
(44.4%)
100
(44.4%)
0 25
(11.1%)
0
Finance Ratio >= 60%
requirement for P
met (73.33%)
Minimum SA >= 40% met (44.4%)
Minimum SA+PA+SP >= 60% met (88.9%)
Minimum SA+PA+SP+IP >= 90% met (100%)
Marketing and Management
Lee, Brian 01/02/06 PhD, 2004 279 UT,
MT,
RES
100 Research Productive, 5
PRJs
Johnson, Sandy 09/01/16 PhD, 2010 429 UT,
MT
50 Phd, Depth of Industry
experience
Jones, Justine 05/01/10 PhD, 1995 0 0 RES,
ADM
100 Dean
Wilson, John 09/01/03 MBA, 1987 738 UT,
ADM
100 Industry Experience,
Center Chair
Total Marketing and
Mgt
1446 200
(57.1%)
50
(14.3%)
100
(28.6%)
0 0
Marketing and Mgt
Ratio
>= 60%
requirement for P
met (100%)
Minimum SA >= 40% met (57%)
Minimum SA+PA+SP >= 60% met (100%)
Minimum SA+PA+SP+IP >= 90% met (100%)
4 Tucker, Carlton is currently on sabbatical. He left for sabbatical at the beginning of Spring 2017 and will remain on sabbatical until the end of Fall 2018.
65
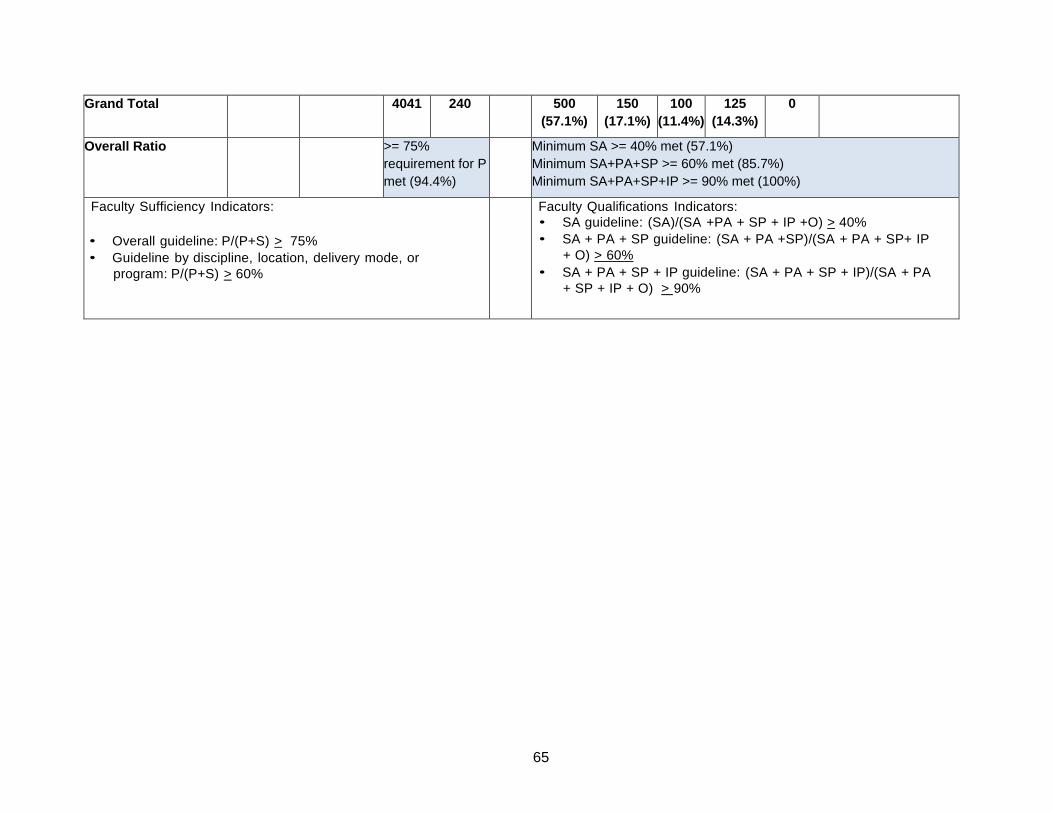
Grand Total 4041 240 500
(57.1%)
150
(17.1%)
100
(11.4%)
125
(14.3%)
0
Overall Ratio >= 75%
requirement for P
met (94.4%)
Minimum SA >= 40% met (57.1%)
Minimum SA+PA+SP >= 60% met (85.7%)
Minimum SA+PA+SP+IP >= 90% met (100%)
Faculty Sufficiency Indicators:
• Overall guideline: P/(P+S) > 75%
• Guideline by discipline, location, delivery mode, or
program: P/(P+S) > 60%
Faculty Qualifications Indicators:
• SA guideline: (SA)/(SA +PA + SP + IP +O) > 40%
• SA + PA + SP guideline: (SA + PA +SP)/(SA + PA + SP+ IP
+ O) > 60%
• SA + PA + SP + IP guideline: (SA + PA + SP + IP)/(SA + PA
+ SP + IP + O) > 90%
66
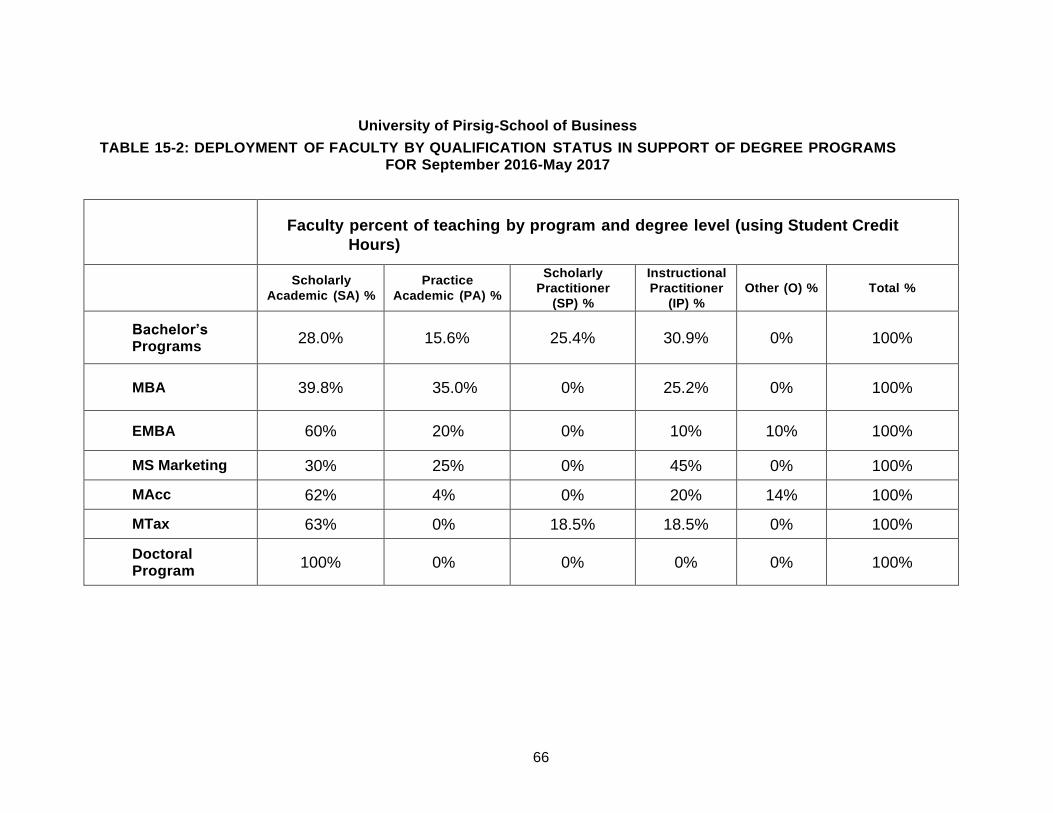
University of Pirsig-School of Business
TABLE 15-2: DEPLOYMENT OF FACULTY BY QUALIFICATION STATUS IN SUPPORT OF DEGREE PROGRAMS FOR September 2016-May 2017
Faculty percent of teaching by program and degree level (using Student Credit
Hours)
Scholarly
Academic (SA) %
Practice
Academic (PA) %
Scholarly
Practitioner
(SP) %
Instructional
Practitioner
(IP) %
Other (O) %
Total %
Bachelor’s Programs
28.0% 15.6% 25.4% 30.9% 0% 100%
MBA 39.8% 35.0% 0% 25.2% 0% 100%
EMBA 60% 20% 0% 10% 10% 100%
MS Marketing 30% 25% 0% 45% 0% 100%
MAcc 62% 4% 0% 20% 14% 100%
MTax 63% 0% 18.5% 18.5% 0% 100%
Doctoral Program
100% 0% 0% 0% 0% 100%
67
68
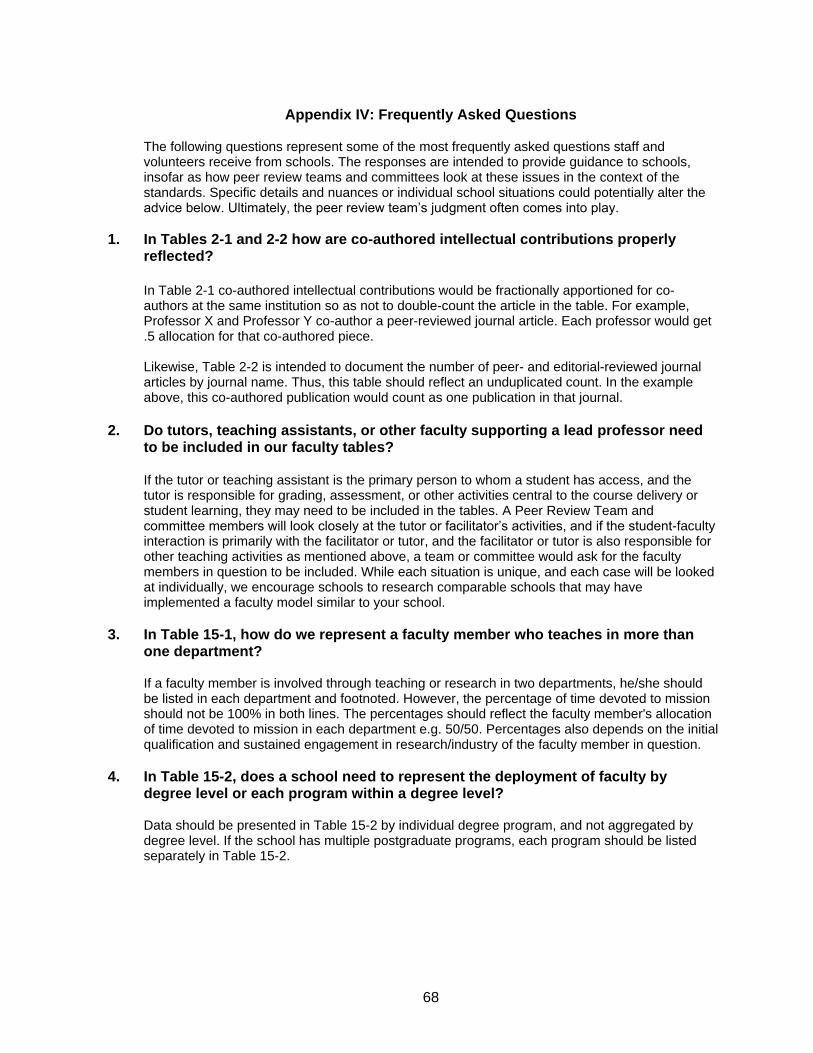
Appendix IV: Frequently Asked Questions
The following questions represent some of the most frequently asked questions staff and volunteers receive from schools. The responses are intended to provide guidance to schools, insofar as how peer review teams and committees look at these issues in the context of the standards. Specific details and nuances or individual school situations could potentially alter the advice below. Ultimately, the peer review team’s judgment often comes into play.
1. In Tables 2-1 and 2-2 how are co-authored intellectual contributions properly reflected?
In Table 2-1 co-authored intellectual contributions would be fractionally apportioned for co-authors at the same institution so as not to double-count the article in the table. For example, Professor X and Professor Y co-author a peer-reviewed journal article. Each professor would get .5 allocation for that co-authored piece. Likewise, Table 2-2 is intended to document the number of peer- and editorial-reviewed journal articles by journal name. Thus, this table should reflect an unduplicated count. In the example above, this co-authored publication would count as one publication in that journal.
2. Do tutors, teaching assistants, or other faculty supporting a lead professor need
to be included in our faculty tables?
If the tutor or teaching assistant is the primary person to whom a student has access, and the tutor is responsible for grading, assessment, or other activities central to the course delivery or student learning, they may need to be included in the tables. A Peer Review Team and committee members will look closely at the tutor or facilitator’s activities, and if the student-faculty interaction is primarily with the facilitator or tutor, and the facilitator or tutor is also responsible for other teaching activities as mentioned above, a team or committee would ask for the faculty members in question to be included. While each situation is unique, and each case will be looked at individually, we encourage schools to research comparable schools that may have implemented a faculty model similar to your school.
3. In Table 15-1, how do we represent a faculty member who teaches in more than one department?
If a faculty member is involved through teaching or research in two departments, he/she should be listed in each department and footnoted. However, the percentage of time devoted to mission should not be 100% in both lines. The percentages should reflect the faculty member's allocation of time devoted to mission in each department e.g. 50/50. Percentages also depends on the initial qualification and sustained engagement in research/industry of the faculty member in question.
4. In Table 15-2, does a school need to represent the deployment of faculty by degree level or each program within a degree level?
Data should be presented in Table 15-2 by individual degree program, and not aggregated by degree level. If the school has multiple postgraduate programs, each program should be listed separately in Table 15-2.
69
5. Doctoral students who have obtained All But Dissertation (ABD) status are considered SA for 3 years. How is ABD defined? Further, how should ABD faculty be reflected on the tables?
The school can define ABD in a manner that makes sense for the particular type of program, duration, etc. in question. Normally individuals are classified as ABD after passing their comprehensive or qualifying exams.
Doctoral students may be placed on Table 15-1 if they have formal teaching responsibilities. Their percent of time devoted to mission should reflect their teaching duties only, and not any other activities associated with their role as a student (e.g. work on a dissertation).
6. How should a faculty member who meets the criteria for more than one faculty definition be classified? Can this person be listed for 100% in more than one category?
The school applies its own criteria for faculty and ensures that the criteria are aligned with the mission statement. Individuals are reported in one category only.
7. What is "percent of time devoted to mission"?
"Percent of time devoted to mission” is intended to broadly represent and encompass all professional responsibilities of each faculty member, including teaching, research, and other professional responsibilities that may be assigned. Table 15-1 should not be developed using a metric that only captures teaching. Clearly, for full-time faculty members including those holding administrative roles within the business school/accounting program that also are full time, the “percent of time devoted to mission” is 100%. For part-time faculty members, something less than 100% should be specified.
8. How do you calculate "percent of time devoted to mission" for part-time faculty members?
For part-time faculty members, something less than 100% should be specified. If the school uses a full-time equivalent (FTE) model for its human resource system, then FTE may be a reasonable approximation of “percent of time devoted to mission.” For example, an individual teaching one class in both academic terms may be 25% devoted to mission. However, in the absence of an FTE model, the school should have a rational way of assigning the percentage to part-time faculty.
9. How should faculty members who are on sabbatical leave (or other short term leave) be documented in the tables?
Faculty members who are on sabbatical leave during periods in which accreditation reports on faculty must be filed should be included in the tables because they are part of “total faculty resources.” Since faculty on sabbatical leave do not normally teach, schools should include them in Table 15-1 but clearly identify them as on sabbatical leave either in a footnote or other materials that support the data included in the tables. Their intellectual contributions would also be reflected on Table 2-1. The same guidelines apply for faculty members who are visiting at other schools, are on sick leave, Fulbright fellowships, etc.
70
10. How are faculty members in the business school who teach business communications or other general education classes reported?
Business communication faculty may normally be excluded from these analyses to the extent they are teaching business communications classes in writing and speaking. The same applies to faculty in the business unit teaching general education classes. If these faculty members teach traditional business subjects (See Part 2 Section 2 under Eligibility Criteria for a list of traditional business subjects), they would be included in Standard 5 and 15 analyses to the extent of this teaching. Clear disclosure of the treatment of such faculty housed in the business school should be provided.
11. Should we include non-business faculty that teach in cross-disciplinary programs in our documentation and on our tables?
Generally speaking, with cross-disciplinary programs, schools are not expected to document the qualifications of faculty teaching outside of the business discipline. If it were to be determined that the content of their courses contained traditional business content, the faculty teaching those courses may need to be included.
12. Must faculty members publish in order to be qualified as Scholarly Academic, Practice Academic, or Scholarly Practitioner?
Standard 15 provides a non-exhaustive list of activities normally expected of SA, PA, and SP status. While the standard does not specifically require publication of peer- or editorial-reviewed journal articles, schools normally are expected to have guidelines and criteria consistent with their mission and their peers. A peer review team may question a school’s criteria if it appears the criteria are not in alignment with the school’s mission and peer institutions. Note that Standard 2 does require that “The portfolio of intellectual contributions includes contributions from a substantial cross-section of the faculty in each discipline. Normally, a significant level of the contributions in the portfolio must be in the form of peer-reviewed journal articles or the equivalent.”
13. Standard 8 specifies a systematic process for assurance of learning. What do peer
review teams usually expect in determining whether this standard is met?
The assurance of learning process is designed to ensure systematic continuous improvement of curriculum. Peer review teams will seek evidence that shows learning goals for each degree program are in place. Generally, some commonly observed best practices of mature AoL programs include four to eight learning goals for each degree program and assessment of the objectives related to each learning goal twice and closing the loop once during the review cycle. Closing the loop is defined as making appropriate changes in the curriculum based on assessment results. Results of the assessment should be documented and available for peer review teams upon request. The assessment processes and results should lead to documented continuous improvement in curriculum.


![AACSB INTERNATIONAL SELF EVALUATION REPORT GUIDELINESweb.mst.edu/~scm1/AACSB/AACSB_SER_Data_Reuqirement.pdf · AACSB INTERNATIONAL SELF EVALUATION REPORT GUIDELINES ... [MISSION STATEMENT]](https://img.dokumen.tips/doc/110x75/5afcd9637f8b9a864d8cb5fb/aacsb-international-self-evaluation-report-scm1aacsbaacsbserdatareuqirementpdfaacsb.jpg)