Embed Size (px)
Citation preview
Pennypack Creek Watershed Comprehensive Characterization Report
Appendix A • Standard Operating Procedures
Philadelphia Water Department. • PCWCCR • A-1
June 2009
A STANDARD OPERATING PROCEDURES A.1 STANDARD OPERATING PROCEDURE FOR THE FIELD COLLECTION OF GRAB SAMPLES
STANDARD OPERATING PROCEDURE
FOR THE
FIELD COLLECTION OF GRAB SAMPLES
Bureau of Laboratory Services
Philadelphia Water Department
Signatures and Dates Lab Analysts ______________________ ______________________ ______________________ Supervisor ______________________
QA Supervisor ______________________
Revised January 2009 Timothy McMahon, Biologist Trainee
Pennypack Creek Watershed Comprehensive Characterization Report
Appendix A • Standard Operating Procedures
A-2 • PCWCCR • Philadelphia Water Department.
June 2009
1.0 Identification of test method
1.1. The purpose of this SOP is to establish a uniform procedure for collecting grab samples from Philadelphia’s surface waters. The procedure is based on standard method 1060.
2.0 Applicable matrix or matrices 2.1. This SOP applies to surface waters.
3.0 Method detection limit 3.1. N/A
4.0 Scope and application, including components to be analyzed 4.1. This SOP describes procedures and requirements for collecting water grab samples,
recording the necessary field data and transmitting the collected samples to laboratory facilities for analysis. This includes requirements regarding sample handling, field notes, and chain-of-custody records, along with requirements for quality assurance and quality control (QA/QC). Record keeping is briefly discussed.
5.0 Summary of the test method 5.1. Samples of surface waters are collected in appropriate bottles for the required analytes. The
necessary field data is recorded from a multi-parameter sonde placed in-situ. Once collected, the sample is poured off into the correct bottles, as prepared by BLS, for specific analytes, and preserved, if necessary. The samples are then packed into a cooler with ice and transported to BLS for analysis and turned over to the central receiving unit (CRU) with the correct chain-of-custody record. Field-staff file field sheets and input field data into the LIMS system.
6.0 Definitions 6.1. Discrete Grab Sample - A sample that is taken at a selected location, depth and time. 6.2. Multi-Parameter Sonde – A multi-meter that reads instantaneous pH, specific conductivity,
temperature, turbidity, and dissolved oxygen when placed in a body of water. 7.0 Interferences
7.1. Contaminants introduced into the sample containers through careless handling, or by using “dirty” preservatives can bias the true values of the sample.
8.0 Safety 8.1. Gathering of water samples may result in exposure to sewage and bacteriologically
contaminated water. Field personnel must wear suitable hand protection during the collection and handling of samples and take care to minimize exposure to surface waters. Anti-bacterial wipes should be used after contact with waters.
8.2. Adequate medical protection against risk of infectious disease (tetanus, polio, pertussis, diphtheria and hepatitis A/B) is recommended.
8.3. While working in the field, the field crew must carry a complete first-aid kit that provides materials for disinfection and protection of any skin cuts or abrasions. Personnel will promptly attend to any such cuts or abrasions, and seek medical attention if appropriate, and any such instances will be recorded in the field log, including time and location of incident and description of first-aid treatment applied.
8.4. Field personnel must wear sturdy boots with adequate ankle support. If personnel need to enter a stream, correctly fitting hip- or chest-waders with felt bottoms that have been inspected for water-tightness must be worn, and care taken to avoid slipping.
8.5. When working in cold weather, the field crew must take extra precautions for warmth and keep chemical hand-warmers in the vehicle. Having extra dry clothes is recommended as well.
Pennypack Creek Watershed Comprehensive Characterization Report
Appendix A • Standard Operating Procedures
Philadelphia Water Department. • PCWCCR • A-3
June 2009
8.6. If using concentrated acid to acidify samples, sampler must wear safety glasses and latex gloves.
9.0 Equipment and supplies 9.1. Sample bottles or containers prepared and preserved in accordance with BLS protocols (see
Table 1, section 23.0) and concentrated H2SO4 as preservative if collecting TKN- samples. 9.2. 0.45 µm pore-size screw-tip filters and 60 mL syringes (if sampling dissolved metals) 9.3. Insulated coolers for sample transport 9.4. Ice 9.5. Chain-of-custody forms 9.6. BLS field sheets (attached in section 23.0) 9.7. Multi-parameter field sonde (usually YSI 6920 sonde, but can also use YSI 6600 or
600XLM sondes, or YSI 85D/YSI 60 portable meters) with check standards (see section 10.0)
9.8. Hip- or chest-waders with felt bottoms, to allow personnel to wade into stream. 9.9. First aid kit 9.10. Latex gloves
10.0 Reagents and standards 10.1. Where catalog numbers are given, equivalent products may be used. Any chemical or
reagent without a manufacturer’s expiration date is valid for up to ten years of receipt.
10.1.1. Conductivity check standards, 100 and 500 µmhos/cm (100 µmhos/cm – Ricca Chemical, cat. No 2237-1; 500 µmhos/cm – Ricca Chemical, cat. No 2241-1)
10.1.2. pH check standards at 6.86 and 7.40 (pH 7.40 – Ricca Chemical, cat. No 1565-5; pH 6.86 – Ricca Chemical, cat. No 1540-1)
10.1.3. Turbidity check standard (either Milli-Q DI water (0.0-NTU) or prepared 9.0-NTU check std, diluted from 1000-NTU stock solution) (1000-NTU solution- Ricca Chemical, cat. No 8825-16)
10.1.4. Concentrated sulfuric acid, to acidify necessary samples. 11.0 Sample collection, preservation, shipment and storage
11.1. For sample collection, shipment and storage, see section 14.0 11.2. For sample preservation, see Table 1 in section 23.0
12.0 Quality control 12.1. Field sonde must be calibrated prior to sampling in the field. 12.2. Field sonde must be checked with check standards before sampling and recorded in the
appropriate section on the field sheet. 12.3. After ten samples are taken, field sonde must be checked with check standards and recorded
in the appropriate section on the field sheet. 12.4. After sampling, field sonde must be checked with check standards and recorded in the
appropriate section on the field sheet. 13.0 Calibration and standardization
13.1. For calibration information, see appropriate SOP for the field meter being used. 14.0 Procedure
14.1. Drop the field sonde into the stream near to where sample will be drawn from. Sample must be taken from a representative and well-mixed area of the stream, generally mid-channel and mid-depth, where the flow is swift enough that solids do not settle out.
14.2. To gather a water sample, dip the sample bottle into the flow stream being careful not to draw in bottom sediments or detritus. Do not include large non-homogeneous particles in the sample.
Pennypack Creek Watershed Comprehensive Characterization Report
Appendix A • Standard Operating Procedures
A-4 • PCWCCR • Philadelphia Water Department.
June 2009
14.3. Face the sampling bottle upstream to avoid contamination. 14.4. Once the sample bottle has been filled, cap it. Pour off samples into appropriate containers
with labels that contain date, time, location, and analyte. Labels are provided by CRU. Sampler must fill out information legibly and accurately with waterproof ink. Add preservative if necessary (label adequately any bottle containing concentrated acid as corrosive) and place sample in a cooler with ice. Preservative must be added within 15 minutes of sample collection. Take care to minimize risk of contamination by handling samples as little as possible and by as few people as possible.
14.4.1. Do not touch the inner portion of sample bottles and caps with bare or gloved hands. 14.4.2. Sample bottles must be kept in a clean environment away from dust, dirt, fumes, and
grime. Vehicle cleanliness is important to eliminating contamination problems. 14.4.3. Samples must never be allowed to stand in the sun and must remain cool.
14.5. For dissolved metals, sample filtration must occur on site. 14.5.1. Season syringe with 60 mL of well mixed sample and discard. 14.5.2. Fill syringe with 60 mL of sample. 14.5.3. Attach filter head to syringe and filter. 14.5.4. Use first 5 mL of filtrate to rinse dissolved metals container and discard. 14.5.5. Collect appropriate aliquot of sample into the dissolved metals container.
14.6. Record field notes on BLS field sheet with appropriate date, time, and location. Each location sampled must have a field sheet. Field notes will also include:
14.6.1. Sampling team initials 14.6.2. Weather conditions 14.6.3. General observations regarding flow, water clarity, odors at sampling sites 14.6.4. Modifications to established procedures 14.6.5. Readings from field sonde (pH, temperature, specific conductivity, dissolved oxygen,
and turbidity). Record readings once sonde values have stabilized. Be careful that sonde is reading a representative sample of the stream (if detritus and sediment is disturbed by wading into the stream, place sonde upstream of the murky area).
14.7. The field sampling crew will initiate a chain-of-custody form for all samples. Chain-of-custody forms will include information on project name, date and time of sample collection, sample description, sample location, which analysis is required on each sample, method of sample preservation used at the time of sample collection, and date and time of sample custody transfer. Chain-of-custody forms are provided by BLS.
14.8. Return samples to the Central Receiving Unit at BLS immediately upon return and relinquish them with the chain-of-custody form.
14.9. Add field data to LIMS system. 15.0 Calculations – N/A 16.0 Method performance
16.1. Quality control data can be found on the sample field sheet. 17.0 Pollution Prevention
17.1. Pollution prevention encompasses any technique that reduces or eliminates the quantity or toxicity of waste at the point of generation. Numerous opportunities for pollution prevention exist in laboratory operation. The EPA has established a preferred hierarchy of environmental management techniques that places pollution prevention as the management option of first choice. Whenever feasible, laboratory personnel should use pollution prevention techniques to address their waste generation.
17.2. For information about pollution prevention that may be applicable to laboratories and research institutions, consult “Less is Better: Laboratory Chemical Management for Waste
Pennypack Creek Watershed Comprehensive Characterization Report
Appendix A • Standard Operating Procedures
Philadelphia Water Department. • PCWCCR • A-5
June 2009
Reduction”, available from the QA Department or from the American Chemical Society’s Department of Government Relations and Science Policy, 1155 16th Street N.W., Washington D.C. 20036, (202)872-4477.
18.0 Data assessment and acceptance criteria for quality control measures 18.1. Calibration – Calibration criteria are listed in the SOP for the multi-meters used (Standard
Operating Procedure For YSI 60 Portable Meter, Standard Operating Procedure For YSI 85 Portable Meter, & Standard Operating Procedure For YSI Sondes Models 600XLM, 6600, 6820, And 6920 To Monitor Water Quality In Streams)
19.0 Corrective actions for out of control data 19.1. Calibration check – If calibration check fails, recalibrate field sonde for whichever
parameter failed the check. 20.0 Contingencies for handling out of control or unacceptable data
20.1. If a parameter on the field sonde fails a calibration check, the data points recorded since the last valid calibration check must be flagged. A “failed check standard” flag must be noted both on field sheets and in the LIMS system.
21.0 Waste management 21.1. All check standards for this procedure used in the field must be collected in a waste
container and brought back to BLS, where they can be poured down the drain with sufficient water for dilution.
22.0 References 22.1. Standard Methods for the Examination of Water and Wastewater, 1995. American Public
Health Association, American Water Works Association, American Environmental Federation, 20th Edition. Eaton, A.D., Clesceri, L.S., and A.E. Greenberg, Eds.
23.0 Tables, diagrams, flowcharts, and validation data
Pennypack Creek Watershed Comprehensive Characterization Report
Appendix A • Standard Operating Procedures
A-6 • PCWCCR • Philadelphia Water Department.
June 2009
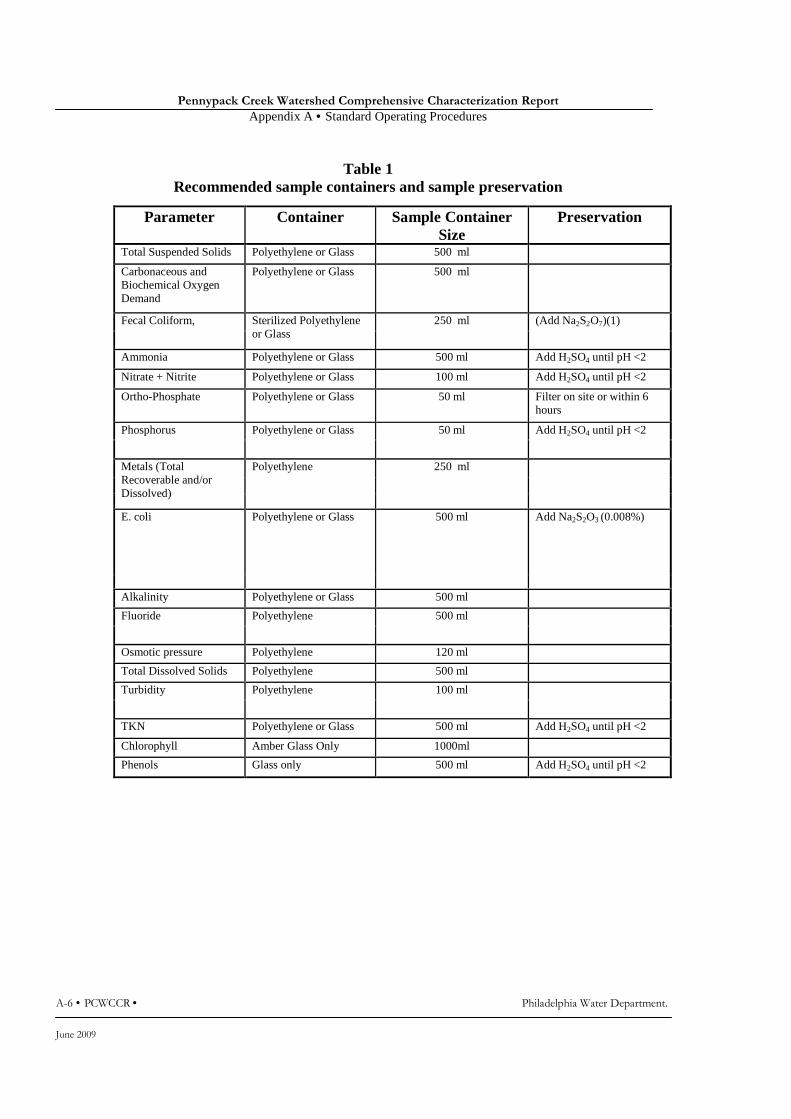
Table 1 Recommended sample containers and sample preservation
Parameter Container Sample Container Size
Preservation
Total Suspended Solids Polyethylene or Glass 500 ml
Carbonaceous and Biochemical Oxygen Demand
Polyethylene or Glass 500 ml
Fecal Coliform, Sterilized Polyethylene or Glass
250 ml (Add Na2S2O7)(1)
Ammonia Polyethylene or Glass 500 ml Add H2SO4 until pH <2
Nitrate + Nitrite Polyethylene or Glass 100 ml Add H2SO4 until pH <2
Ortho-Phosphate Polyethylene or Glass 50 ml Filter on site or within 6 hours
Phosphorus Polyethylene or Glass 50 ml Add H2SO4 until pH <2
Metals (Total Recoverable and/or Dissolved)
Polyethylene 250 ml
E. coli Polyethylene or Glass 500 ml Add Na2S2O3 (0.008%)
Alkalinity Polyethylene or Glass 500 ml
Fluoride Polyethylene 500 ml
Osmotic pressure Polyethylene 120 ml
Total Dissolved Solids Polyethylene 500 ml
Turbidity Polyethylene 100 ml
TKN Polyethylene or Glass 500 ml Add H2SO4 until pH <2
Chlorophyll Amber Glass Only 1000ml
Phenols Glass only 500 ml Add H2SO4 until pH <2

Pennypack Creek Watershed Comprehensive Characterization Report
Appendix A • Standard Operating Procedures
Philadelphia Water Department. • PCWCCR • A-7
June 2009
A.2 STANDARD OPERATING PROCEDURE FOR CONTINUOUS WATER QUALITY MONITORING WITH YSI MODEL 6600 AND 600XLM SONDES (For more information, please contact PWD Bureau of Laboratory Services 1500 E. Hunting Park Ave, Philadelphia 19124)

Pennypack Creek Watershed Comprehensive Characterization Report
Appendix A • Standard Operating Procedures
A-8 • PCWCCR • Philadelphia Water Department.
June 2009
A.3 STANDARD OPERATING PROCEDURE FOR WET WEATHER SAMPLING USING THE ISCO 6712 AND ISCO 720 LEVEL MODULE
STANDARD OPERATING PROCEDURE
FOR
WET WEATHER SAMPLING USING THE ISCO 6712 AND ISCO 720 LEVEL MODULE
Bureau of Laboratory Services
Philadelphia Water Department
Signatures and Dates Lab Analysts ______________________ ______________________ ______________________ Supervisor ______________________
QA Supervisor ______________________
Revised January 2009 Timothy McMahon, Biologist Trainee

Pennypack Creek Watershed Comprehensive Characterization Report
Appendix A • Standard Operating Procedures
Philadelphia Water Department. • PCWCCR • A-9
June 2009
1.0 Identification of test method
1.1. The purpose of this SOP is to establish a uniform procedure for sampling wet weather events from Philadelphia surface waters using the ISCO 6712 unit with the ISCO 720 level module. The procedure is based on the Standard Method 1060 for the collection and preservation of samples and the manufacturer recommendations.
2.0 Applicable matrix or matrices 2.1. This SOP applies to surface waters.
3.0 Method detection limit 3.1. N/A
4.0 Scope and application, including components to be analyzed 4.1. This SOP describes procedures and requirements for auto-sampling during wet weather
events using the ISCO 6712 unit with the ISCO 720 level module, recording the necessary field data, transmitting the collected samples to laboratory facilities for analysis, and transferring data collected by the ISCO unit to a lab computer for analysis. This includes requirements regarding sample handling, field notes, and chain-of-custody records, along with requirements for quality assurance and quality control (QA/QC). The results of these analyses, along with the water level data logged by the ISCO unit, allow the Philadelphia Water Department to monitor effects of storm water runoff.
5.0 Summary of the test method 5.1. The ISCO autosampler unit is set up at the desired site before a rain event and programmed
to begin sampling when the stream level increases by 0.1 ft (unless the stream normally has a daily variation larger than 0.1 ft, in which case the trigger level is set accordingly). The goal is to capture a view of the entire rain event so the unit is programmed to sample at desired intervals, determined by the sampler, based on the event’s forecasted length and intensity. A grab sample is collected and field readings recorded before the rain event, as a baseline. During the rain event, the ISCO sampler is maintained by retrieving level data, removing full samplers and replacing with empty bottles, if necessary. Samples are returned to BLS and composited in CRU. Analyses requested are based on Philadelphia Water Department’s Office of Watersheds requirements. A chain-of-custody form is completed when the samples are relinquished. The ISCO unit is allowed to run for several days after the rain event without sampling in order to collect level data as the stream returns to base flow. Level data from the ISCO unit is transferred to a lab computer and analyzed.
6.0 Definitions 6.1. Autosampler Enclosure – Fiberglass or metal enclosure with a locking lid which protects
ISCO units from water and vandalism. 6.2. Baseline – The values of a given set of parameters before precipitation begins and against
which the wet weather event values are measured. 6.3. Composite Sample – A representative water or wastewater sample made up of individual
smaller samples taken at periodic intervals. 6.4. Discrete Grab Sample – A sample that is taken at a selected location, depth and time. 6.5. ISCO 6712 – Portable, programmable auto-sampler used to collect samples remotely during
wet weather events. 6.6. ISCO 720 Level Module – Attachment to ISCO 6712 that measures stream depth with a
level probe. 6.7. Multi-Parameter Sonde – A multi-meter that reads instantaneous pH, specific conductivity,
temperature, turbidity, and dissolved oxygen when placed in a body of water.

Pennypack Creek Watershed Comprehensive Characterization Report
Appendix A • Standard Operating Procedures
A-10 • PCWCCR • Philadelphia Water Department.
June 2009
6.8. RTD 581 Data Logger – The data logger which plugs into the ISCO 6712 unit in the field and quickly downloads the data collected since the program was started.
6.9. Wet Weather Event – A period of precipitation during which stream flows increase due to runoff and then return to base flow
7.0 Interferences 7.1. Contaminants introduced into the sample containers through careless handling, or by using
“dirty” preservatives can bias the true values of the sample. 7.2. An improperly set-up ISCO sampler can fail to collect samples or to collect the necessary
amount of sample. 8.0 Safety
8.1. Gathering of water samples may result in exposure to sewage and bacteriologically contaminated water. Field personnel must wear suitable hand protection during the collection and handling of samples and take care to minimize exposure to surface waters. Anti-bacterial wipes should be used after contact with waters.
8.2. Adequate medical protection against risk of infectious disease (tetanus, polio, pertussis, diphtheria and hepatitis A/B) is recommended.
8.3. While working in the field, the field crew must carry a complete first-aid kit that provides materials for disinfection and protection of any skin cuts or abrasions. Personnel will promptly attend to any such cuts or abrasions, and seek medical attention if appropriate, and any such instances will be recorded in the field log, including time and location of incident and description of first-aid treatment applied.
8.4. Field personnel must wear sturdy boots with adequate ankle support. If personnel need to enter a stream, correctly fitting hip- or chest-waders with felt bottoms that have been inspected for water-tightness must be worn, and care taken to avoid slipping.
8.5. When working in cold weather, the field crew must take extra precautions for warmth and keep chemical hand-warmers in the vehicle. Having extra dry clothes is recommended as well.
8.6. If using concentrated acid to acidify samples, sampler must wear safety glasses and latex gloves.
8.7. Field personnel must be aware of depth of streams and strength of current, especially during rain events, and use appropriate precautions. Entering a stream during a rain event is discouraged.
8.8. ISCO units are powered by deep cycle batteries, which are similar to car batteries. When attaching leads from the ISCO unit, work gloves must be worn.
8.9. The pump in the ISCO 6712 has a safety mechanism which does not allow the pump to run when the pump band is open. Do not tamper with this safety mechanism. The pump rollers can cause severe injury. Disconnect power from the sampler before replacing pump tubing.
9.0 Equipment and supplies 9.1. ISCO 6712 sampler, including base containing 24 1-liter polypropylene wedge shaped
cage-bottles (ISCO part #68-6700-087) with new plastic sampling bags (ISCO part #68-6700-096) (including caps)
9.2. Fully charged deep cycle marine battery or 12 volt car battery with clip attachment 9.3. ISCO 720 Module (ISCO part #60-9004-030) 9.4. Fiberglass autosampler enclosure with necessary padlocks to secure the lid 9.5. 25 ft cable and level probe (ISCO part #60-3224-002) 9.6. 25 ft extension cable (if needed) 9.7. Pump head tubing for ISCO unit (ISCO part #68-6700-045) 9.8. Discharge tubing for sampler arm (ISCO part #60-9003-260)
Pennypack Creek Watershed Comprehensive Characterization Report
Appendix A • Standard Operating Procedures
Philadelphia Water Department. • PCWCCR • A-11
June 2009
9.9. precut length (site-specific, determined in advance) of vinyl suction tubing (ISCO part #68-1680-059)
9.10. Rapid Transfer Device (RTD) 581 data logger (ISCO part #60-9004-027) 9.11. Strainer (stainless steel), 7 mm pore size, for autosampler intake (ISCO part #69-2903-138) 9.12. Multi-parameter field sonde (usually YSI 6920 sonde, but can also use YSI 6600 or
600XLM sondes, or YSI 85D/YSI 60 portable meters) with check standards (see section 10.0)
9.13. Tool box (pliers, wrench, tape measure, screw drivers, tubing cutter, ratchet) 9.14. Wooden base for ISCO unit 9.15. PVC pipe for running sampler tubing and level probe down to the stream 9.16. Steel spikes/rebar/metal U-clamps (2-3 per site) to secure pipe in stream-bed, bank or to
stone structure 9.17. Sample bottles or containers prepared and preserved in accordance with BLS protocols and
concentrated H2SO4 as preservative if collecting TKN- samples. 9.18. 0.45 µm pore-size screw-tip filters and 60 mL syringes (if sampling dissolved metals) 9.19. Insulated coolers for sample transport 9.20. Ice for ISCO unit and sample transport 9.21. 1000 ml graduated cylinder for check of ISCO sample volumes 9.22. BLS field sheets 9.23. Chain-of-custody forms 9.24. Keys to the ISCO housing units 9.25. Sledge hammer 9.26. Sawz-all 9.27. Hammer drill 9.28. Electric drill with drill bits 9.29. Various nuts, bolts, and washers needed to secure ISCO enclosure to base and stream bank 9.30. Angle irons 9.31. Hip- or chest-waders with felt bottoms, to allow personnel to wade into stream. 9.32. Latex Gloves 9.33. First aid kit
10.0 Reagents and standards 10.1. Where catalog numbers are given, equivalent products may be used. Any chemical or
reagent without a manufacturer’s expiration date is valid for up to ten years of receipt.
10.1.1. Conductivity check standards, 100 and 500 µmhos/cm (100 µmhos/cm – Ricca Chemical, cat. No 2237-1; 500 µmhos/cm – Ricca Chemical, cat. No 2241-1)
10.1.2. pH check standards at 6.86 and 7.40 (pH 7.40 – Ricca Chemical, cat. No 1565-5; pH 6.86 – Ricca Chemical, cat. No 1540-1)
10.1.3. Turbidity check standard (either Milli-Q DI water (0.0-NTU) or prepared 9.0-NTU check std, diluted from 1000-NTU stock solution) (1000-NTU solution- Ricca Chemical, cat. No 8825-16)
10.1.4. Concentrated sulfuric acid, to acidify necessary samples. 11.0 Sample collection, preservation, shipment and storage
11.1. For sample collection, shipment and storage, see section 14.0 11.2. For sample preservation, see Table 1 in section 23.0
12.0 Quality control 12.1. Field sonde must be calibrated prior to baseline grab sampling (conducted before and after
wet weather event)
Pennypack Creek Watershed Comprehensive Characterization Report
Appendix A • Standard Operating Procedures
A-12 • PCWCCR • Philadelphia Water Department.
June 2009
12.2. Field sonde must be checked with check standards before baseline grab sampling and recorded in the appropriate section on the field sheet.
12.3. After baseline grab sampling, field sonde must be checked with check standards and recorded in the appropriate section on the field sheet.
13.0 Calibration and standardization 13.1. For calibration information, see appropriate SOP for the field meter being used.
14.0 Procedure 14.1. Preparation for wet weather event (at lab)
14.1.1. Install new internal ISCO sampler pump head tubing and sampler arm tubing according to manufacturer’s instructions.
14.1.2. Turn on ISCO unit in the lab and attach level probe. Insure level probe is reading a steady depth for several hours. The level does not need to be 0.000 ft, as the probe will be zeroed in the field. If level probe reading is erratic, replace with a different probe and check for stable reading.
14.1.3. Install new plastic bags in the sample cages and arrange sample cages according to numbering on ISCO base. Numbering on the cages should match the numbering on the outside of the base. Each base is given a number (1,2,3…) and cages are numbered from 1-24. The cages in base 1 will be denoted as (1.1, 1.2, 1.3…1.24).
14.2. Setting up ISCO unit at sampling site 14.2.1. Set up the ISCO unit at the site the day before the storm, if possible. A baseline grab
sample will be taken at this time, also. If installing an ISCO at a new site, secure wooden base to stream bank by driving angle irons into a flat area of the stream bank with sledgehammer and bolting the base in place. Bolt the fiberglass enclosure to the wooden base and check that locks are functional and open with the correct key. Using metal spikes or metal U-clamps, secure two lengths of PVC pipe to stream bank between ISCO enclosure and stream bed. The level probe and sampler tubing will run through these pipes in order to hold them in place during heavy flow and to protect them against vandalism.
14.2.2. Place ISCO unit in the enclosure on top of the correct base for that site, making sure that all sample bottles are in correct numbered locations and caps are removed.
14.2.3. Attach tubing (pre-cut to the correct length for that site) and level module probe cable to ISCO unit.
14.2.4. Attach battery to ISCO unit using battery clips and turn on the unit. 14.2.5. Feed sampler tubing, with stainless steel strainer attached to the end, through one of the
PVC pipes until it hits the streambed. Pull tubing back until strainer is positioned in main stream flow, off the streambed. Cut tubing to correct length if necessary.
14.2.6. Remove cap from dessicant assembly attached to ISCO 720 module. 14.2.7. Fill the center of the ISCO base with ice.
14.3. Programming ISCO unit 14.3.1. When programming the ISCO unit to sample, the sampling schedule and volumes will
be based on both the weather forecast and the analyses requested by the Office of Watersheds. 4-5 samples should fall on the rising limb of the rain event and 3-4 samples should fall on the descending limb, unless instructed otherwise. The weather forecast should be monitored in the days leading up to the event and the sample timing should be based on when most precipitation is forecasted to occur.
14.3.2. The ISCO menus are navigated by using the arrow keys and the enter button. For a full graphic depiction of menus and options, see the ISCO 6712 manual.

Pennypack Creek Watershed Comprehensive Characterization Report
Appendix A • Standard Operating Procedures
Philadelphia Water Department. • PCWCCR • A-13
June 2009
14.3.3. Before programming the ISCO to sample, first check the date and time and correct if necessary.
14.3.3.1. From the main menu, choose “other functions”� “maintenance” � “set clock” 14.3.3.2. Set date and time with keypad, using 24-hr time and DD-MON-YY format for
the date. 14.3.4. While the ISCO has several “standard programs” available, an “extended program” is
used to sample wet weather events to allow more control over the sampling schedule. The program used is a “20-minute 2-part program” and the parameters will be adjusted based on the storm.
14.3.5. From the main menu screen, select “Program.” The ISCO will now scroll through all of the set parameters for the current program, which can be altered by using the arrow and enter keys, and the numerical keypad. The parameters which must be tailored for each event are: Site description (the assigned names used for each site and for the LIMS system), units selected (for tubing length), submerged probe (level-only or flow-sensitive probe), current level, data interval (how often the ISCO logs a level reading), number and volume of bottles, length of suction line (the tubing which the ISCO uses to draw a sample from the stream), number of rinses and retries in case of failure, type of program, bottle assignments (if a two part program: the number of bottles which are assigned to parts A & B), the pacing, distribution, volume, depth at which to trigger the program, and any scheduled pauses for each program. For example, a standard program for a wet weather event is:
14.3.5.1. 20-minute 2-part program 14.3.5.2. Site description: BYBE150 14.3.5.3. Units selected: ft 14.3.5.4. Submerged Probe: level only 14.3.5.5. 15 minute data interval 14.3.5.6. 24, 1000mL bottles 14.3.5.7. 15 ft suction line 14.3.5.8. 0 rinses, 0 retries 14.3.5.9. Bottle Assignments: 1-15 to “A”, 16-24 to “B” 14.3.5.10. “A” pacing: Time, every 0 hours, 30 minutes 14.3.5.11. “A” distribution: 3 bottles/sample 14.3.5.12. “A” volume: 1000 mL samples 14.3.5.13. “A” enable: level > 2.65 ft 14.3.5.14. “B” pacing: Time, every 2 hours, 0 minutes 14.3.5.15. “B” distribution: 3 bottles/sample 14.3.5.16. “B” volume: 1000 mL samples 14.3.5.17. “B” enable: When “A” is done 14.3.5.18. “B” enable: 30 minute delay to start of sampling
This program will trigger the ISCO to fill three 1000 mL bottles when the level probe reads a depth of 2.65 ft. The ISCO will then sample at 30 minute intervals, filling three 1000 mL bottles at each sample. After the first 5 samples (15 bottles) are finished (after 2 hours), the ISCO will switch to part “B”. It will wait 30 minutes and then fill three 1000 mL bottles. The ISCO will then sample at 2 hour intervals, filling three 1000 mL bottles at each sample. After the 30 minute delay, the final 9 bottles will be full after 4 hours. The ISCO will not sample after that point, but will continue logging level readings every fifteen minutes.
14.3.6. While scrolling through the program parameters, the level probe reading must be set to zero (before putting the probe in the stream).
Pennypack Creek Watershed Comprehensive Characterization Report
Appendix A • Standard Operating Procedures
A-14 • PCWCCR • Philadelphia Water Department.
June 2009
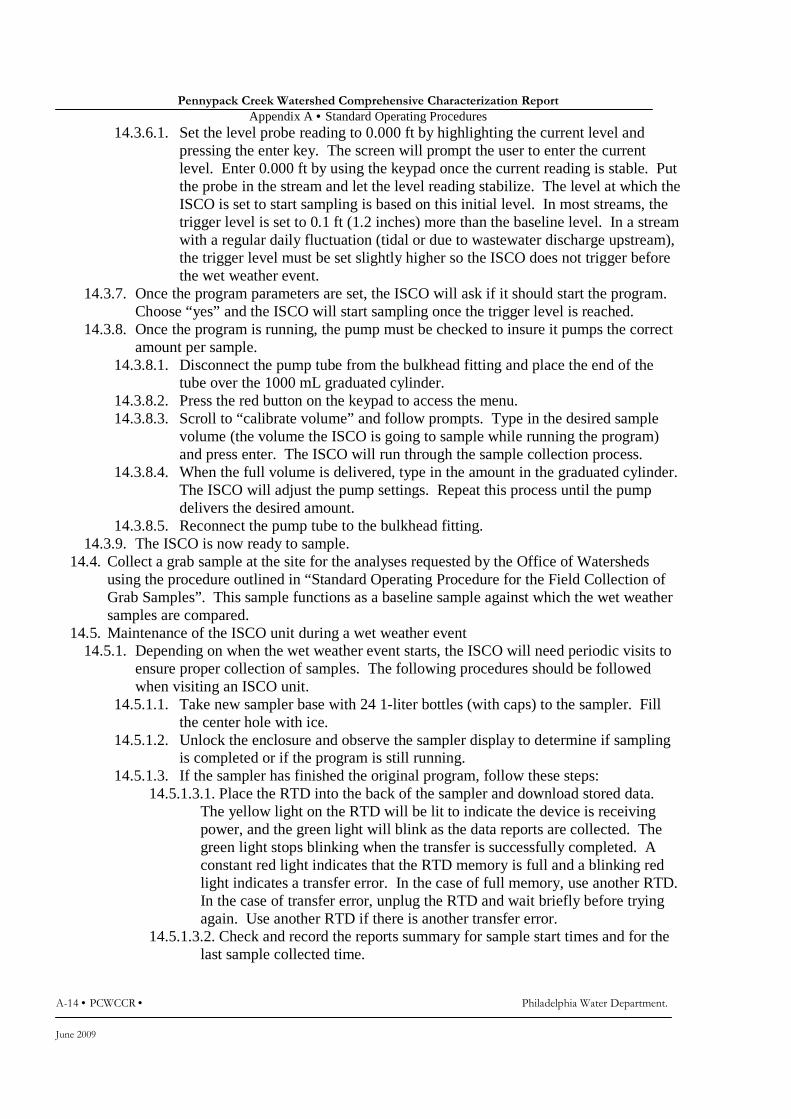
14.3.6.1. Set the level probe reading to 0.000 ft by highlighting the current level and pressing the enter key. The screen will prompt the user to enter the current level. Enter 0.000 ft by using the keypad once the current reading is stable. Put the probe in the stream and let the level reading stabilize. The level at which the ISCO is set to start sampling is based on this initial level. In most streams, the trigger level is set to 0.1 ft (1.2 inches) more than the baseline level. In a stream with a regular daily fluctuation (tidal or due to wastewater discharge upstream), the trigger level must be set slightly higher so the ISCO does not trigger before the wet weather event.
14.3.7. Once the program parameters are set, the ISCO will ask if it should start the program. Choose “yes” and the ISCO will start sampling once the trigger level is reached.
14.3.8. Once the program is running, the pump must be checked to insure it pumps the correct amount per sample.
14.3.8.1. Disconnect the pump tube from the bulkhead fitting and place the end of the tube over the 1000 mL graduated cylinder.
14.3.8.2. Press the red button on the keypad to access the menu. 14.3.8.3. Scroll to “calibrate volume” and follow prompts. Type in the desired sample
volume (the volume the ISCO is going to sample while running the program) and press enter. The ISCO will run through the sample collection process.
14.3.8.4. When the full volume is delivered, type in the amount in the graduated cylinder. The ISCO will adjust the pump settings. Repeat this process until the pump delivers the desired amount.
14.3.8.5. Reconnect the pump tube to the bulkhead fitting. 14.3.9. The ISCO is now ready to sample.
14.4. Collect a grab sample at the site for the analyses requested by the Office of Watersheds using the procedure outlined in “Standard Operating Procedure for the Field Collection of Grab Samples”. This sample functions as a baseline sample against which the wet weather samples are compared.
14.5. Maintenance of the ISCO unit during a wet weather event 14.5.1. Depending on when the wet weather event starts, the ISCO will need periodic visits to
ensure proper collection of samples. The following procedures should be followed when visiting an ISCO unit.
14.5.1.1. Take new sampler base with 24 1-liter bottles (with caps) to the sampler. Fill the center hole with ice.
14.5.1.2. Unlock the enclosure and observe the sampler display to determine if sampling is completed or if the program is still running.
14.5.1.3. If the sampler has finished the original program, follow these steps: 14.5.1.3.1. Place the RTD into the back of the sampler and download stored data.
The yellow light on the RTD will be lit to indicate the device is receiving power, and the green light will blink as the data reports are collected. The green light stops blinking when the transfer is successfully completed. A constant red light indicates that the RTD memory is full and a blinking red light indicates a transfer error. In the case of full memory, use another RTD. In the case of transfer error, unplug the RTD and wait briefly before trying again. Use another RTD if there is another transfer error.
14.5.1.3.2. Check and record the reports summary for sample start times and for the last sample collected time.
Pennypack Creek Watershed Comprehensive Characterization Report
Appendix A • Standard Operating Procedures
Philadelphia Water Department. • PCWCCR • A-15
June 2009
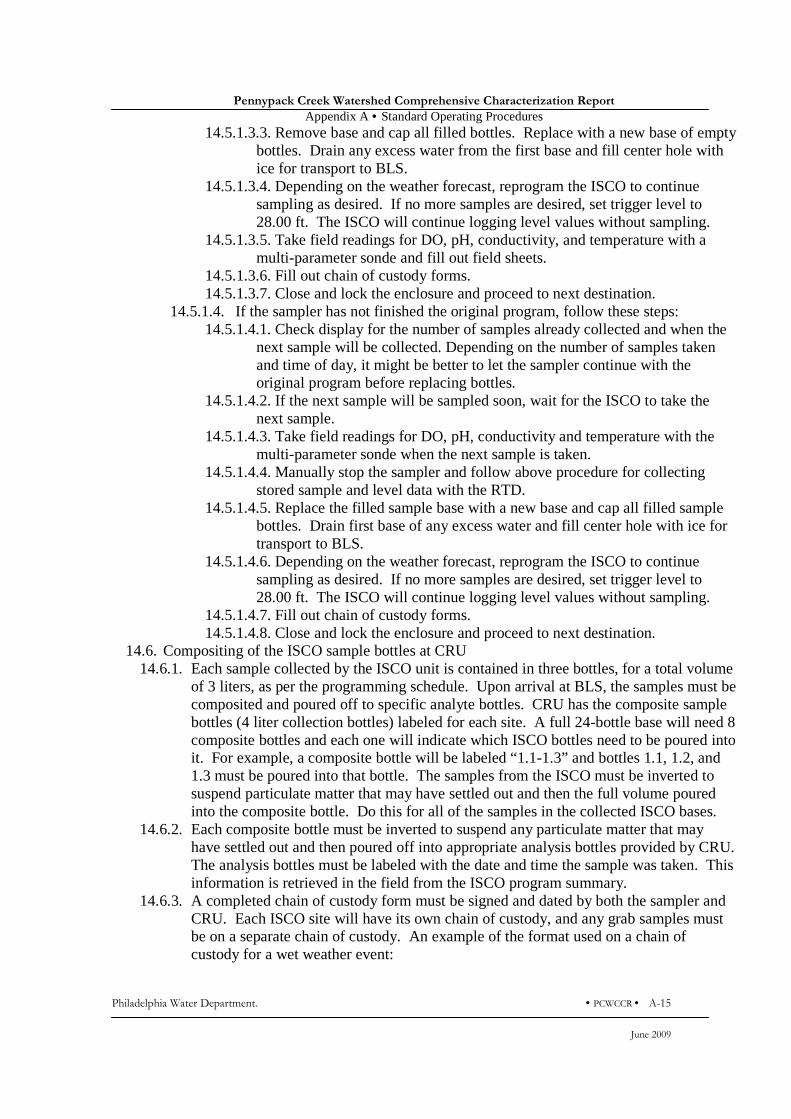
14.5.1.3.3. Remove base and cap all filled bottles. Replace with a new base of empty bottles. Drain any excess water from the first base and fill center hole with ice for transport to BLS.
14.5.1.3.4. Depending on the weather forecast, reprogram the ISCO to continue sampling as desired. If no more samples are desired, set trigger level to 28.00 ft. The ISCO will continue logging level values without sampling.
14.5.1.3.5. Take field readings for DO, pH, conductivity, and temperature with a multi-parameter sonde and fill out field sheets.
14.5.1.3.6. Fill out chain of custody forms. 14.5.1.3.7. Close and lock the enclosure and proceed to next destination.
14.5.1.4. If the sampler has not finished the original program, follow these steps: 14.5.1.4.1. Check display for the number of samples already collected and when the
next sample will be collected. Depending on the number of samples taken and time of day, it might be better to let the sampler continue with the original program before replacing bottles.
14.5.1.4.2. If the next sample will be sampled soon, wait for the ISCO to take the next sample.
14.5.1.4.3. Take field readings for DO, pH, conductivity and temperature with the multi-parameter sonde when the next sample is taken.
14.5.1.4.4. Manually stop the sampler and follow above procedure for collecting stored sample and level data with the RTD.
14.5.1.4.5. Replace the filled sample base with a new base and cap all filled sample bottles. Drain first base of any excess water and fill center hole with ice for transport to BLS.
14.5.1.4.6. Depending on the weather forecast, reprogram the ISCO to continue sampling as desired. If no more samples are desired, set trigger level to 28.00 ft. The ISCO will continue logging level values without sampling.
14.5.1.4.7. Fill out chain of custody forms. 14.5.1.4.8. Close and lock the enclosure and proceed to next destination.
14.6. Compositing of the ISCO sample bottles at CRU 14.6.1. Each sample collected by the ISCO unit is contained in three bottles, for a total volume
of 3 liters, as per the programming schedule. Upon arrival at BLS, the samples must be composited and poured off to specific analyte bottles. CRU has the composite sample bottles (4 liter collection bottles) labeled for each site. A full 24-bottle base will need 8 composite bottles and each one will indicate which ISCO bottles need to be poured into it. For example, a composite bottle will be labeled “1.1-1.3” and bottles 1.1, 1.2, and 1.3 must be poured into that bottle. The samples from the ISCO must be inverted to suspend particulate matter that may have settled out and then the full volume poured into the composite bottle. Do this for all of the samples in the collected ISCO bases.
14.6.2. Each composite bottle must be inverted to suspend any particulate matter that may have settled out and then poured off into appropriate analysis bottles provided by CRU. The analysis bottles must be labeled with the date and time the sample was taken. This information is retrieved in the field from the ISCO program summary.
14.6.3. A completed chain of custody form must be signed and dated by both the sampler and CRU. Each ISCO site will have its own chain of custody, and any grab samples must be on a separate chain of custody. An example of the format used on a chain of custody for a wet weather event:

Pennypack Creek Watershed Comprehensive Characterization Report
Appendix A • Standard Operating Procedures
A-16 • PCWCCR • Philadelphia Water Department.
June 2009
14.7. Maintenance of ISCO unit after wet weather event until eventual shut down
14.7.1. When no more samples are desired, the ISCO should be left running with the trigger level changed to 28.00 ft. The ISCO will continue logging level data without sampling.
14.7.2. 3-4 days after the end of a wet weather event, when the stream has returned to base flow levels, collect level data (using the RTD) and another baseline grab sample. Collect field data using a multi-parameter sonde and fill out a field sheet. At this time, the ISCO can be turned off. Replace dessicant assembly cap. Bring the battery, sample tubing, and level probe back to BLS. Discard sample tubing. Recharge the battery.
14.8. Retrieval and formatting of data from ISCO unit 14.8.1. Connect the RTD power cord into one of the serial ports on the computer, and plug the
power cord into an electrical outlet. Connect the RTD data logger to the power cord and click on the FLOWLINK 4.1 software icon. Click on the Isco.exe file to launch the application.
14.8.2. Click the RTD icon on the screen to transfer the ISCO data from the datalogger into the FLOWLINK folder.
14.8.3. Once the data has been successfully transferred, click on the site folder to show all site locations and data.
14.8.4. Click once on the (+) sign next to the site name to show the most recent level data file. Click on the level file to display the graph of the level readings. Switch between the graph and the raw data by clicking on the “Graph/Table” icon in the menu bar.
14.8.5. Right click on either the graph or table values and choose “Properties”. Click the “Time Scale” tab and adjust the “Date”, “Time”, and “Timespan” boxes to adjust displayed data as desired.
14.8.6. Click on the “File” menu and select “Export”. Select the desired folder to export data to and click “Export”.
14.8.6.1. Exported data is saved as a “.csv” file; open the .csv in excel and save as an “.xls” file.
14.8.7. Click on the “Site Setup” box to show the “Reports” box. Click on the “Reports” box to view the ISCO program settings used and the details of the sampling times. Save this report data in the appropriate file folder.
15.0 Calculations 15.1. N/A
16.0 Method Performance 16.1. Quality control data can be found on the sample field sheets.
17.0 Pollution Prevention 17.1. Pollution prevention encompasses any technique that reduces or eliminates the quantity or
toxicity of waste at the point of generation. Numerous opportunities for pollution prevention exist in laboratory operation. The EPA has established a preferred hierarchy of

Pennypack Creek Watershed Comprehensive Characterization Report
Appendix A • Standard Operating Procedures
Philadelphia Water Department. • PCWCCR • A-17
June 2009
environmental management techniques that places pollution prevention as the management option of first choice. Whenever feasible, laboratory personnel should use pollution prevention techniques to address their waste generation.
17.2. For information about pollution prevention that may be applicable to laboratories and research institutions, consult “Less is Better: Laboratory Chemical Management for Waste Reduction”, available from the QA Department or from the American Chemical Society’s Department of Government Relations and Science Policy, 1155 16th Street N.W., Washington D.C. 20036, (202)872-4477.
18.0 Data assessment and acceptance criteria for quality control measures 18.1. Calibration – Calibration criteria are listed in the SOP for the multi-meters used (Standard
Operating Procedure for YSI 60 Portable Meter, Standard Operating Procedure for YSI 85 Portable Meter, & Standard Operating Procedure for YSI Sondes Models 600XLM, 6600, 6820, And 6920 To Monitor Water Quality In Streams)
19.0 Corrective actions for out of control data 19.1. Calibration check – If calibration check fails, recalibrate field sonde for whichever
parameter failed the check. 20.0 Contingencies for handling out of control or unacceptable data
20.1. If a parameter on the field sonde fails a calibration check, the data points recorded since the last valid calibration check must be flagged. A “failed check standard” flag must be noted both on field sheets and in the LIMS system.
21.0 Waste management 21.1. All check standards for this procedure used in the field must be collected in a waste
container and brought back to BLS, where they can be poured down the drain with sufficient water for dilution.
22.0 References 22.1. Teledyne Isco. 6712 Portable Samplers Installation and Operation Guide. 2008. 22.2. Teledyne Isco. 720 Submerged Probe Module Installation and Operation Guide. 2007.

Pennypack Creek Watershed Comprehensive Characterization Report
Appendix B • Continuous Dissolved Oxygen Data Acceptance Protocol
Philadelphia Water Department. • PCCCR • B-1
June 2009
DO Acceptance: The large number of measurements made by the continuous sampling equipment serves to characterize DO throughout the diurnal cycle under a range of flow conditions. The equipment produces 96 observations of DO every 24 hours, but cost and quality control are more challenging compared to discrete sampling. A variety of procedures are followed before, during, and immediately after deployment to help ensure quality and identify problems that may affect DO data quality. These procedures are outlined in detail in the main body of “YSI 6600 Sondes to Monitor Water Quality in Streams” and are summarized below.
• Pre-deployment and post-deployment laboratory validation checks are performed on all parameters. The probes are tested in solutions of known concentrations as established by standard laboratory testing procedures. Instruments are deployed and data is initially accepted if probe measurements are within a certain tolerance of the standards.
• Field personnel fill out standardized forms to note conditions and events that may have an effect on data quality. Examples include debris or sediment obstructing the probe, debris obstructing free flow of water around the instrument, or instrument failure such as a battery failure.
• Beginning in the fall of 2001, field measurements are taken of DO, pH, and specific conductance at deployment and retrieval. Measurements are taken as close to the probe locations as possible, and the data is added to the pre- and post-deployment validation checks when determining whether data is initially accepted.
• BLS personnel prepare time series plots and make preliminary determinations of whether data fall within reasonable ranges and patterns. BLS staff recommends acceptance of data at this point provided they pass the criteria discussed above.
These four items represent initial screens for poor quality data; they identify instances where probes do not accurately measure conditions in the immediate vicinity of the instrument. However, suspended sediment, debris, and biofouling can all affect the microenvironment in the immediate vicinity of the instrument, causing data to be collected that does not represent overall conditions in the water column. For this reason, additional procedures are needed to distinguish data that is sufficiently representative to be included in analyses from data that is not representative.
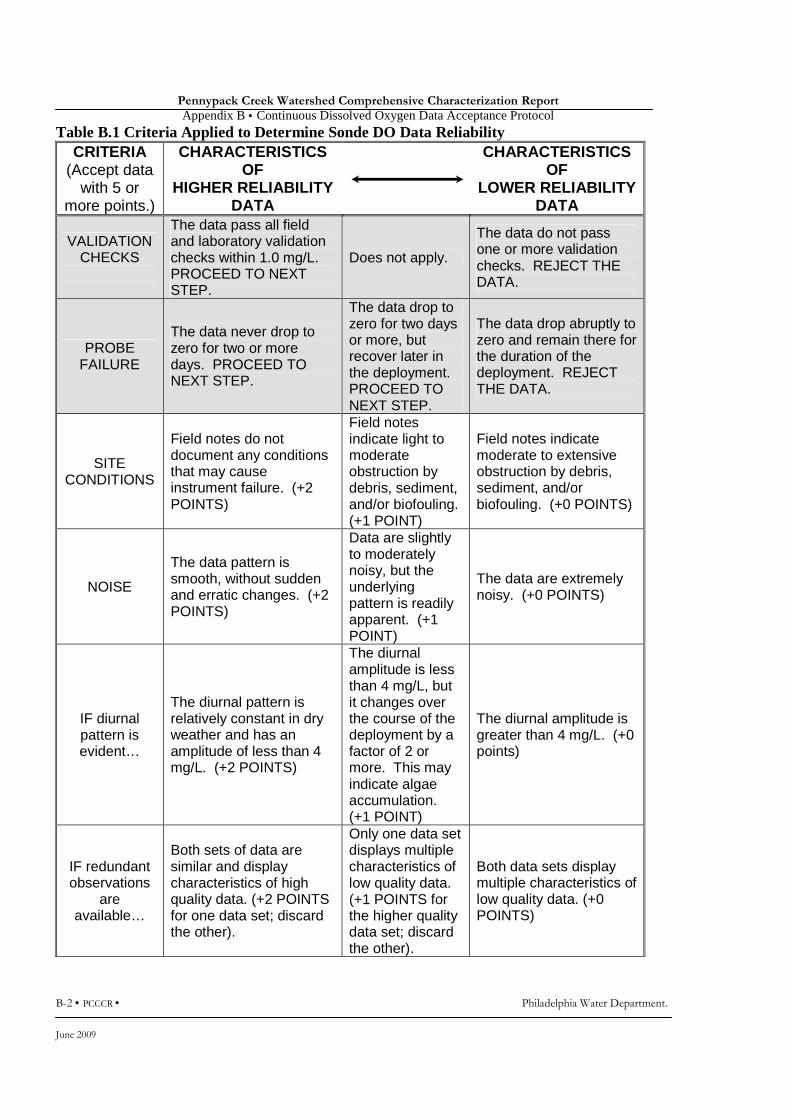
Table 2.2.1 summarizes a system that assigns points to data based on the presence of characteristics that are indicative of reliable data. Data analysis suggests that conditions that lead to unreliable data are present primarily during and after wet weather and depend on the intensity of the runoff event. For this reason, the continuous data is biased toward dry weather conditions although they do represent some wet weather events.
Pennypack Creek Watershed Comprehensive Characterization Report
Appendix B • Continuous Dissolved Oxygen Data Acceptance Protocol
B-2 • PCCCR • Philadelphia Water Department.
June 2009
Table B.1 Criteria Applied to Determine Sonde DO Data Reliability CRITERIA
(Accept data with 5 or
more points.)
CHARACTERISTICS OF
HIGHER RELIABILITY DATA
CHARACTERISTICS OF
LOWER RELIABILITY DATA
VALIDATION CHECKS
The data pass all field and laboratory validation checks within 1.0 mg/L. PROCEED TO NEXT STEP.
Does not apply.
The data do not pass one or more validation checks. REJECT THE DATA.
PROBE FAILURE
The data never drop to zero for two or more days. PROCEED TO NEXT STEP.
The data drop to zero for two days or more, but recover later in the deployment. PROCEED TO NEXT STEP.
The data drop abruptly to zero and remain there for the duration of the deployment. REJECT THE DATA.
SITE CONDITIONS
Field notes do not document any conditions that may cause instrument failure. (+2 POINTS)
Field notes indicate light to moderate obstruction by debris, sediment, and/or biofouling. (+1 POINT)
Field notes indicate moderate to extensive obstruction by debris, sediment, and/or biofouling. (+0 POINTS)
NOISE
The data pattern is smooth, without sudden and erratic changes. (+2 POINTS)
Data are slightly to moderately noisy, but the underlying pattern is readily apparent. (+1 POINT)
The data are extremely noisy. (+0 POINTS)
IF diurnal pattern is evident…
The diurnal pattern is relatively constant in dry weather and has an amplitude of less than 4 mg/L. (+2 POINTS)
The diurnal amplitude is less than 4 mg/L, but it changes over the course of the deployment by a factor of 2 or more. This may indicate algae accumulation. (+1 POINT)
The diurnal amplitude is greater than 4 mg/L. (+0 points)
IF redundant observations
are available…
Both sets of data are similar and display characteristics of high quality data. (+2 POINTS for one data set; discard the other).
Only one data set displays multiple characteristics of low quality data. (+1 POINTS for the higher quality data set; discard the other).
Both data sets display multiple characteristics of low quality data. (+0 POINTS)
Pennypack Creek Watershed Comprehensive Characterization Report
Appendix B • Continuous Dissolved Oxygen Data Acceptance Protocol
Philadelphia Water Department. • PCCCR • B-3
June 2009
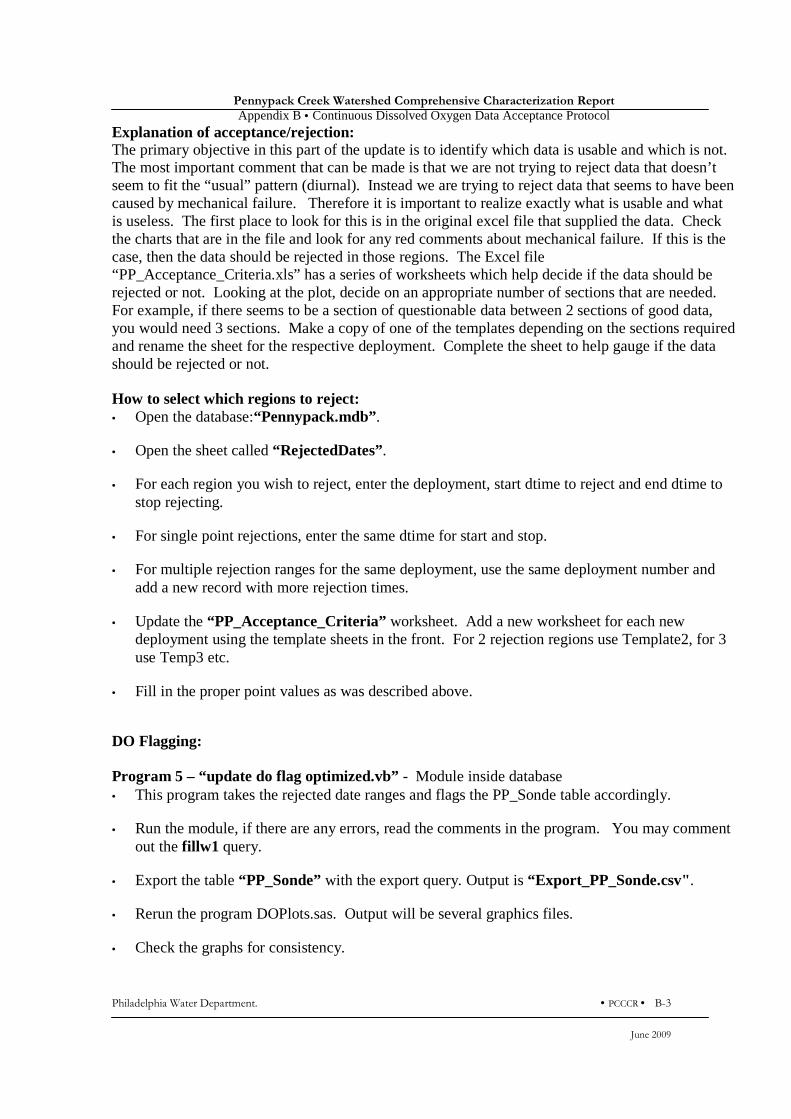
Explanation of acceptance/rejection: The primary objective in this part of the update is to identify which data is usable and which is not. The most important comment that can be made is that we are not trying to reject data that doesn’t seem to fit the “usual” pattern (diurnal). Instead we are trying to reject data that seems to have been caused by mechanical failure. Therefore it is important to realize exactly what is usable and what is useless. The first place to look for this is in the original excel file that supplied the data. Check the charts that are in the file and look for any red comments about mechanical failure. If this is the case, then the data should be rejected in those regions. The Excel file “PP_Acceptance_Criteria.xls” has a series of worksheets which help decide if the data should be rejected or not. Looking at the plot, decide on an appropriate number of sections that are needed. For example, if there seems to be a section of questionable data between 2 sections of good data, you would need 3 sections. Make a copy of one of the templates depending on the sections required and rename the sheet for the respective deployment. Complete the sheet to help gauge if the data should be rejected or not.
How to select which regions to reject: • Open the database:“Pennypack.mdb”.
• Open the sheet called “RejectedDates”.
• For each region you wish to reject, enter the deployment, start dtime to reject and end dtime to stop rejecting.
• For single point rejections, enter the same dtime for start and stop.
• For multiple rejection ranges for the same deployment, use the same deployment number and add a new record with more rejection times.
• Update the “PP_Acceptance_Criteria” worksheet. Add a new worksheet for each new deployment using the template sheets in the front. For 2 rejection regions use Template2, for 3 use Temp3 etc.
• Fill in the proper point values as was described above.
DO Flagging: Program 5 – “update do flag optimized.vb” - Module inside database • This program takes the rejected date ranges and flags the PP_Sonde table accordingly.
• Run the module, if there are any errors, read the comments in the program. You may comment out the fillw1 query.
• Export the table “PP_Sonde” with the export query. Output is “Export_PP_Sonde.csv".
• Rerun the program DOPlots.sas. Output will be several graphics files.
• Check the graphs for consistency.
Pennypack Creek Watershed Comprehensive Characterization Report
Appendix C • Rejected Sample Data
Philadelphia Water Department. • PCWCCR • C-1
June 2009
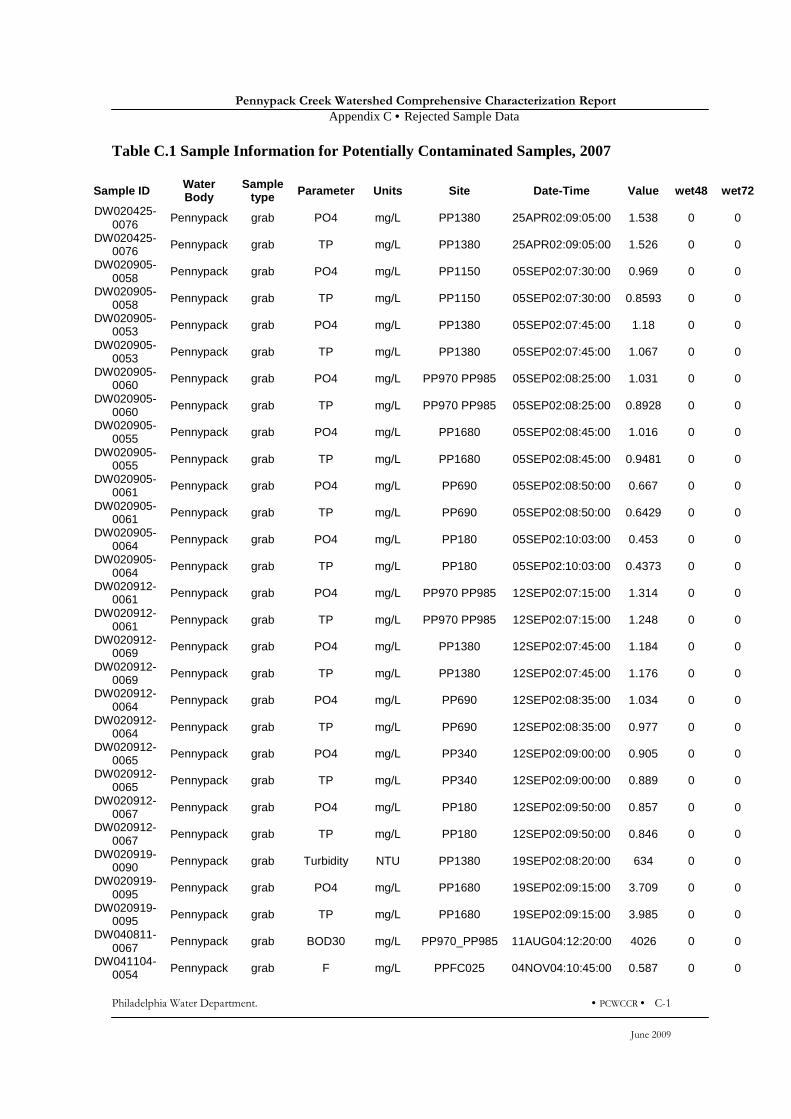
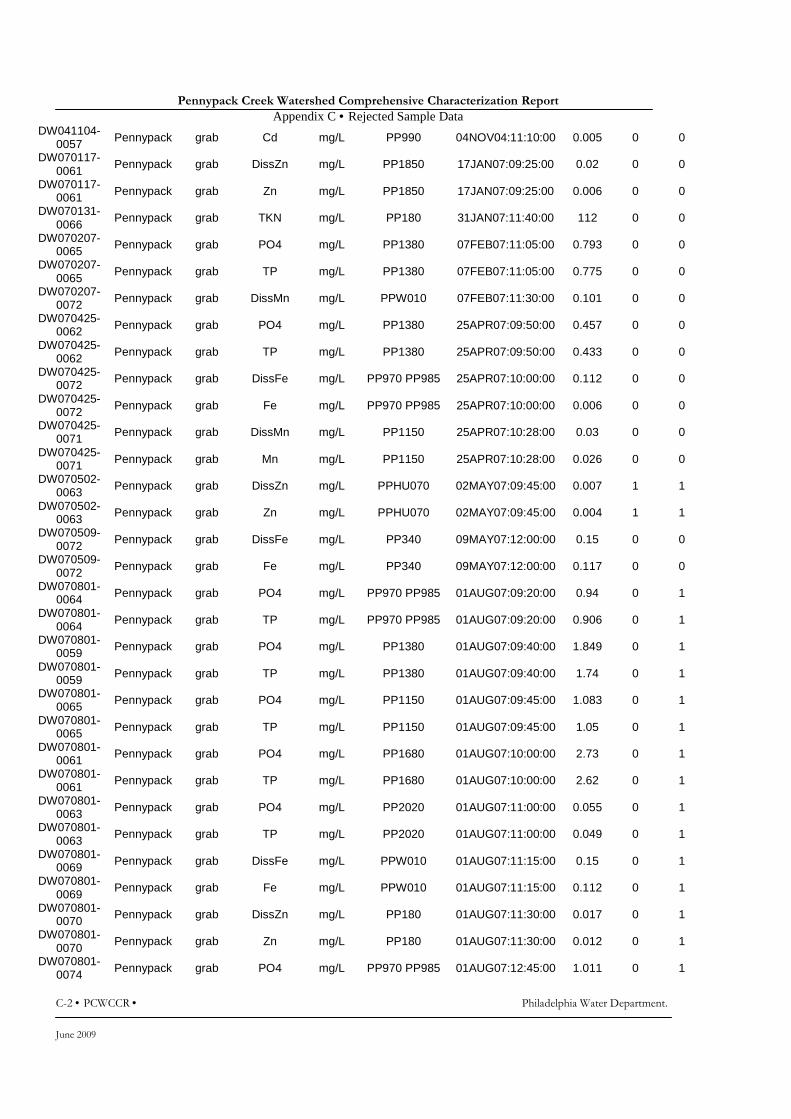
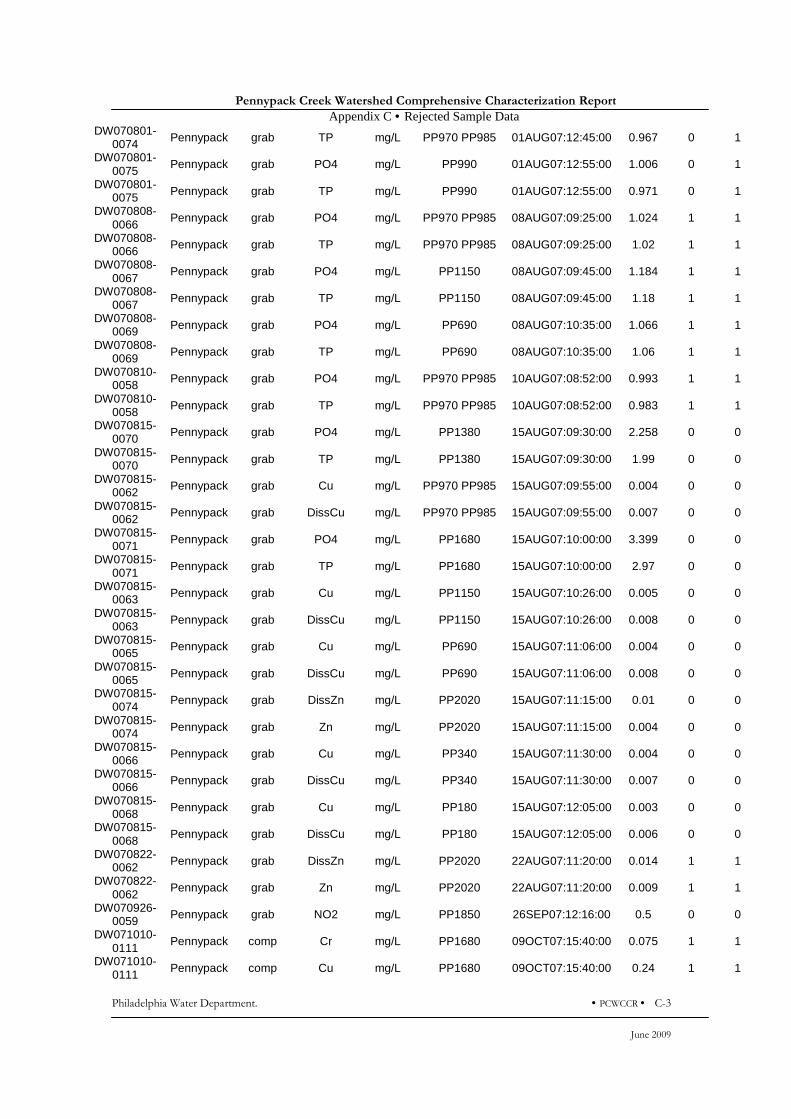
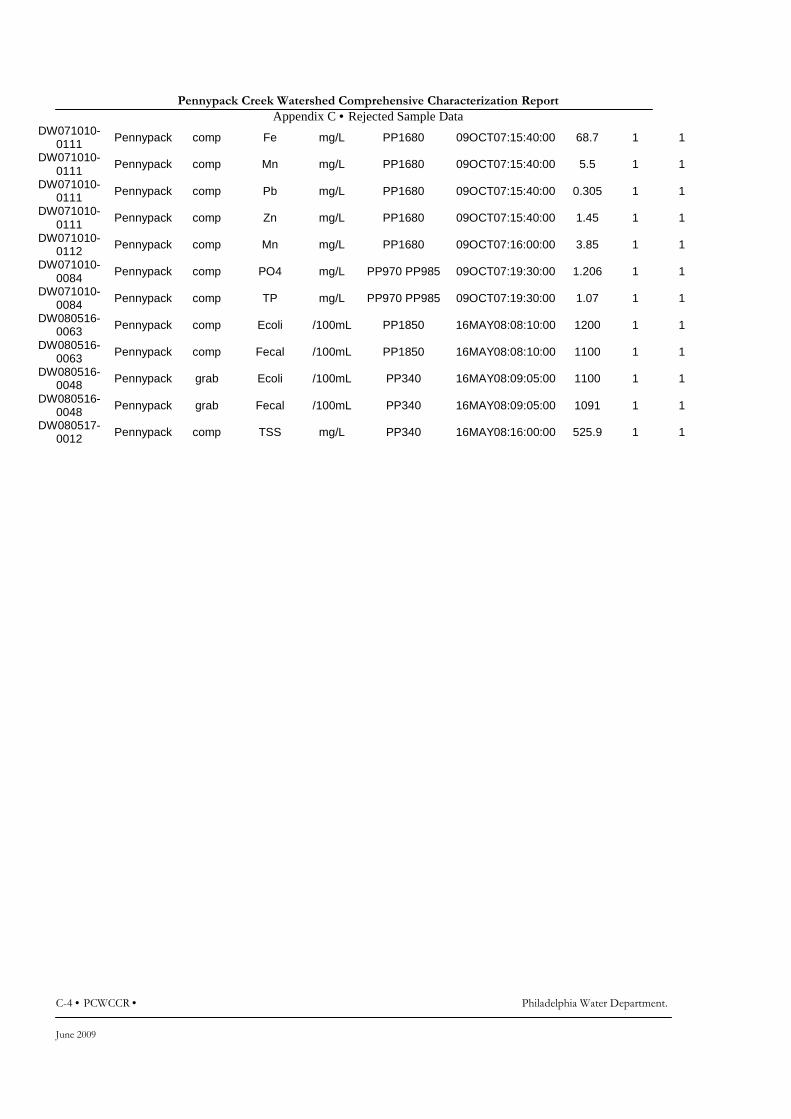
Table C.1 Sample Information for Potentially Contaminated Samples, 2007
Sample ID Water Body
Sample type Parameter Units Site Date-Time Value wet48 wet72
DW020425-0076
Pennypack grab PO4 mg/L PP1380 25APR02:09:05:00 1.538 0 0
DW020425-0076 Pennypack grab TP mg/L PP1380 25APR02:09:05:00 1.526 0 0
DW020905-0058
Pennypack grab PO4 mg/L PP1150 05SEP02:07:30:00 0.969 0 0
DW020905-0058 Pennypack grab TP mg/L PP1150 05SEP02:07:30:00 0.8593 0 0
DW020905-0053 Pennypack grab PO4 mg/L PP1380 05SEP02:07:45:00 1.18 0 0
DW020905-0053 Pennypack grab TP mg/L PP1380 05SEP02:07:45:00 1.067 0 0
DW020905-0060 Pennypack grab PO4 mg/L PP970 PP985 05SEP02:08:25:00 1.031 0 0
DW020905-0060 Pennypack grab TP mg/L PP970 PP985 05SEP02:08:25:00 0.8928 0 0
DW020905-0055 Pennypack grab PO4 mg/L PP1680 05SEP02:08:45:00 1.016 0 0
DW020905-0055 Pennypack grab TP mg/L PP1680 05SEP02:08:45:00 0.9481 0 0
DW020905-0061 Pennypack grab PO4 mg/L PP690 05SEP02:08:50:00 0.667 0 0
DW020905-0061 Pennypack grab TP mg/L PP690 05SEP02:08:50:00 0.6429 0 0
DW020905-0064 Pennypack grab PO4 mg/L PP180 05SEP02:10:03:00 0.453 0 0
DW020905-0064 Pennypack grab TP mg/L PP180 05SEP02:10:03:00 0.4373 0 0
DW020912-0061 Pennypack grab PO4 mg/L PP970 PP985 12SEP02:07:15:00 1.314 0 0
DW020912-0061 Pennypack grab TP mg/L PP970 PP985 12SEP02:07:15:00 1.248 0 0
DW020912-0069 Pennypack grab PO4 mg/L PP1380 12SEP02:07:45:00 1.184 0 0
DW020912-0069 Pennypack grab TP mg/L PP1380 12SEP02:07:45:00 1.176 0 0
DW020912-0064 Pennypack grab PO4 mg/L PP690 12SEP02:08:35:00 1.034 0 0
DW020912-0064 Pennypack grab TP mg/L PP690 12SEP02:08:35:00 0.977 0 0
DW020912-0065 Pennypack grab PO4 mg/L PP340 12SEP02:09:00:00 0.905 0 0
DW020912-0065
Pennypack grab TP mg/L PP340 12SEP02:09:00:00 0.889 0 0
DW020912-0067 Pennypack grab PO4 mg/L PP180 12SEP02:09:50:00 0.857 0 0
DW020912-0067
Pennypack grab TP mg/L PP180 12SEP02:09:50:00 0.846 0 0
DW020919-0090 Pennypack grab Turbidity NTU PP1380 19SEP02:08:20:00 634 0 0
DW020919-0095
Pennypack grab PO4 mg/L PP1680 19SEP02:09:15:00 3.709 0 0
DW020919-0095 Pennypack grab TP mg/L PP1680 19SEP02:09:15:00 3.985 0 0
DW040811-0067
Pennypack grab BOD30 mg/L PP970_PP985 11AUG04:12:20:00 4026 0 0
DW041104-0054 Pennypack grab F mg/L PPFC025 04NOV04:10:45:00 0.587 0 0
Pennypack Creek Watershed Comprehensive Characterization Report
Appendix C • Rejected Sample Data
C-2 • PCWCCR • Philadelphia Water Department.
June 2009
DW041104-0057 Pennypack grab Cd mg/L PP990 04NOV04:11:10:00 0.005 0 0
DW070117-0061
Pennypack grab DissZn mg/L PP1850 17JAN07:09:25:00 0.02 0 0
DW070117-0061 Pennypack grab Zn mg/L PP1850 17JAN07:09:25:00 0.006 0 0
DW070131-0066
Pennypack grab TKN mg/L PP180 31JAN07:11:40:00 112 0 0
DW070207-0065 Pennypack grab PO4 mg/L PP1380 07FEB07:11:05:00 0.793 0 0
DW070207-0065
Pennypack grab TP mg/L PP1380 07FEB07:11:05:00 0.775 0 0
DW070207-0072 Pennypack grab DissMn mg/L PPW010 07FEB07:11:30:00 0.101 0 0
DW070425-0062 Pennypack grab PO4 mg/L PP1380 25APR07:09:50:00 0.457 0 0
DW070425-0062 Pennypack grab TP mg/L PP1380 25APR07:09:50:00 0.433 0 0
DW070425-0072 Pennypack grab DissFe mg/L PP970 PP985 25APR07:10:00:00 0.112 0 0
DW070425-0072 Pennypack grab Fe mg/L PP970 PP985 25APR07:10:00:00 0.006 0 0
DW070425-0071 Pennypack grab DissMn mg/L PP1150 25APR07:10:28:00 0.03 0 0
DW070425-0071 Pennypack grab Mn mg/L PP1150 25APR07:10:28:00 0.026 0 0
DW070502-0063 Pennypack grab DissZn mg/L PPHU070 02MAY07:09:45:00 0.007 1 1
DW070502-0063 Pennypack grab Zn mg/L PPHU070 02MAY07:09:45:00 0.004 1 1
DW070509-0072 Pennypack grab DissFe mg/L PP340 09MAY07:12:00:00 0.15 0 0
DW070509-0072 Pennypack grab Fe mg/L PP340 09MAY07:12:00:00 0.117 0 0
DW070801-0064 Pennypack grab PO4 mg/L PP970 PP985 01AUG07:09:20:00 0.94 0 1
DW070801-0064 Pennypack grab TP mg/L PP970 PP985 01AUG07:09:20:00 0.906 0 1
DW070801-0059 Pennypack grab PO4 mg/L PP1380 01AUG07:09:40:00 1.849 0 1
DW070801-0059 Pennypack grab TP mg/L PP1380 01AUG07:09:40:00 1.74 0 1
DW070801-0065 Pennypack grab PO4 mg/L PP1150 01AUG07:09:45:00 1.083 0 1
DW070801-0065 Pennypack grab TP mg/L PP1150 01AUG07:09:45:00 1.05 0 1
DW070801-0061 Pennypack grab PO4 mg/L PP1680 01AUG07:10:00:00 2.73 0 1
DW070801-0061
Pennypack grab TP mg/L PP1680 01AUG07:10:00:00 2.62 0 1
DW070801-0063 Pennypack grab PO4 mg/L PP2020 01AUG07:11:00:00 0.055 0 1
DW070801-0063
Pennypack grab TP mg/L PP2020 01AUG07:11:00:00 0.049 0 1
DW070801-0069 Pennypack grab DissFe mg/L PPW010 01AUG07:11:15:00 0.15 0 1
DW070801-0069
Pennypack grab Fe mg/L PPW010 01AUG07:11:15:00 0.112 0 1
DW070801-0070 Pennypack grab DissZn mg/L PP180 01AUG07:11:30:00 0.017 0 1
DW070801-0070
Pennypack grab Zn mg/L PP180 01AUG07:11:30:00 0.012 0 1
DW070801-0074 Pennypack grab PO4 mg/L PP970 PP985 01AUG07:12:45:00 1.011 0 1
Pennypack Creek Watershed Comprehensive Characterization Report
Appendix C • Rejected Sample Data
Philadelphia Water Department. • PCWCCR • C-3
June 2009
DW070801-0074 Pennypack grab TP mg/L PP970 PP985 01AUG07:12:45:00 0.967 0 1
DW070801-0075
Pennypack grab PO4 mg/L PP990 01AUG07:12:55:00 1.006 0 1
DW070801-0075 Pennypack grab TP mg/L PP990 01AUG07:12:55:00 0.971 0 1
DW070808-0066
Pennypack grab PO4 mg/L PP970 PP985 08AUG07:09:25:00 1.024 1 1
DW070808-0066 Pennypack grab TP mg/L PP970 PP985 08AUG07:09:25:00 1.02 1 1
DW070808-0067
Pennypack grab PO4 mg/L PP1150 08AUG07:09:45:00 1.184 1 1
DW070808-0067 Pennypack grab TP mg/L PP1150 08AUG07:09:45:00 1.18 1 1
DW070808-0069 Pennypack grab PO4 mg/L PP690 08AUG07:10:35:00 1.066 1 1
DW070808-0069 Pennypack grab TP mg/L PP690 08AUG07:10:35:00 1.06 1 1
DW070810-0058 Pennypack grab PO4 mg/L PP970 PP985 10AUG07:08:52:00 0.993 1 1
DW070810-0058 Pennypack grab TP mg/L PP970 PP985 10AUG07:08:52:00 0.983 1 1
DW070815-0070 Pennypack grab PO4 mg/L PP1380 15AUG07:09:30:00 2.258 0 0
DW070815-0070 Pennypack grab TP mg/L PP1380 15AUG07:09:30:00 1.99 0 0
DW070815-0062 Pennypack grab Cu mg/L PP970 PP985 15AUG07:09:55:00 0.004 0 0
DW070815-0062 Pennypack grab DissCu mg/L PP970 PP985 15AUG07:09:55:00 0.007 0 0
DW070815-0071 Pennypack grab PO4 mg/L PP1680 15AUG07:10:00:00 3.399 0 0
DW070815-0071 Pennypack grab TP mg/L PP1680 15AUG07:10:00:00 2.97 0 0
DW070815-0063 Pennypack grab Cu mg/L PP1150 15AUG07:10:26:00 0.005 0 0
DW070815-0063 Pennypack grab DissCu mg/L PP1150 15AUG07:10:26:00 0.008 0 0
DW070815-0065 Pennypack grab Cu mg/L PP690 15AUG07:11:06:00 0.004 0 0
DW070815-0065 Pennypack grab DissCu mg/L PP690 15AUG07:11:06:00 0.008 0 0
DW070815-0074 Pennypack grab DissZn mg/L PP2020 15AUG07:11:15:00 0.01 0 0
DW070815-0074 Pennypack grab Zn mg/L PP2020 15AUG07:11:15:00 0.004 0 0
DW070815-0066 Pennypack grab Cu mg/L PP340 15AUG07:11:30:00 0.004 0 0
DW070815-0066
Pennypack grab DissCu mg/L PP340 15AUG07:11:30:00 0.007 0 0
DW070815-0068 Pennypack grab Cu mg/L PP180 15AUG07:12:05:00 0.003 0 0
DW070815-0068
Pennypack grab DissCu mg/L PP180 15AUG07:12:05:00 0.006 0 0
DW070822-0062 Pennypack grab DissZn mg/L PP2020 22AUG07:11:20:00 0.014 1 1
DW070822-0062
Pennypack grab Zn mg/L PP2020 22AUG07:11:20:00 0.009 1 1
DW070926-0059 Pennypack grab NO2 mg/L PP1850 26SEP07:12:16:00 0.5 0 0
DW071010-0111
Pennypack comp Cr mg/L PP1680 09OCT07:15:40:00 0.075 1 1
DW071010-0111 Pennypack comp Cu mg/L PP1680 09OCT07:15:40:00 0.24 1 1
Pennypack Creek Watershed Comprehensive Characterization Report
Appendix C • Rejected Sample Data
C-4 • PCWCCR • Philadelphia Water Department.
June 2009
DW071010-0111 Pennypack comp Fe mg/L PP1680 09OCT07:15:40:00 68.7 1 1
DW071010-0111
Pennypack comp Mn mg/L PP1680 09OCT07:15:40:00 5.5 1 1
DW071010-0111 Pennypack comp Pb mg/L PP1680 09OCT07:15:40:00 0.305 1 1
DW071010-0111
Pennypack comp Zn mg/L PP1680 09OCT07:15:40:00 1.45 1 1
DW071010-0112 Pennypack comp Mn mg/L PP1680 09OCT07:16:00:00 3.85 1 1
DW071010-0084
Pennypack comp PO4 mg/L PP970 PP985 09OCT07:19:30:00 1.206 1 1
DW071010-0084 Pennypack comp TP mg/L PP970 PP985 09OCT07:19:30:00 1.07 1 1
DW080516-0063 Pennypack comp Ecoli /100mL PP1850 16MAY08:08:10:00 1200 1 1
DW080516-0063 Pennypack comp Fecal /100mL PP1850 16MAY08:08:10:00 1100 1 1
DW080516-0048 Pennypack grab Ecoli /100mL PP340 16MAY08:09:05:00 1100 1 1
DW080516-0048 Pennypack grab Fecal /100mL PP340 16MAY08:09:05:00 1091 1 1
DW080517-0012 Pennypack comp TSS mg/L PP340 16MAY08:16:00:00 525.9 1 1
Pennypack Creek Watershed Comprehensive Characterization Report
Appendix D • Continuous Dissolved Oxygen
Philadelphia Water Department. • PCWCCR • D-1
June 2009
Saturation DO Accepted Rejected Hand Held DO
PP340
DO
(m
g/L)
0
2
4
6
8
10
12
14
16
18
24MAY07 26MAY07 28MAY07 30MAY07 01JUN07
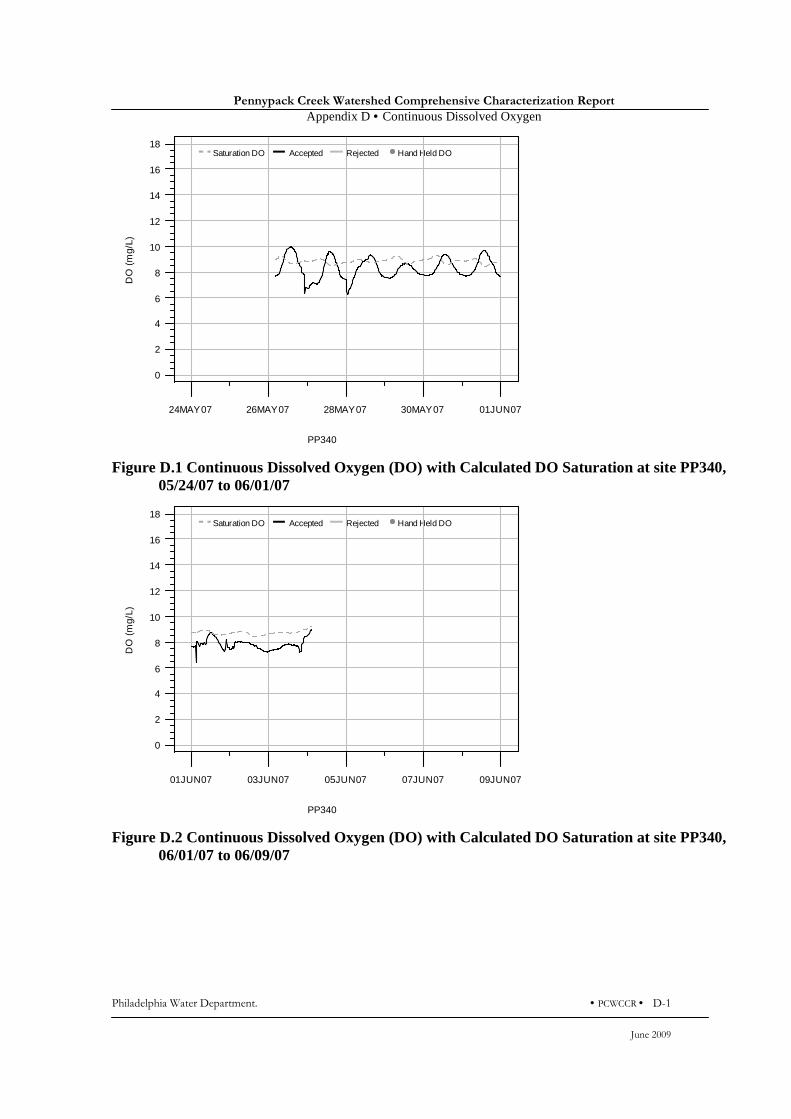
Figure D.1 Continuous Dissolved Oxygen (DO) with Calculated DO Saturation at site PP340,
05/24/07 to 06/01/07
Saturation DO Accepted Rejected Hand Held DO
PP340
DO
(m
g/L)
0
2
4
6
8
10
12
14
16
18
01JUN07 03JUN07 05JUN07 07JUN07 09JUN07
Figure D.2 Continuous Dissolved Oxygen (DO) with Calculated DO Saturation at site PP340,
06/01/07 to 06/09/07
Pennypack Creek Watershed Comprehensive Characterization Report
Appendix D • Continuous Dissolved Oxygen
D-2 • PCWCCR • Philadelphia Water Department.
June 2009
Saturation DO Accepted Rejected Hand Held DO
PP340
DO
(m
g/L)
0
2
4
6
8
10
12
14
16
18
17JUN07 19JUN07 21JUN07 23JUN07 25JUN07
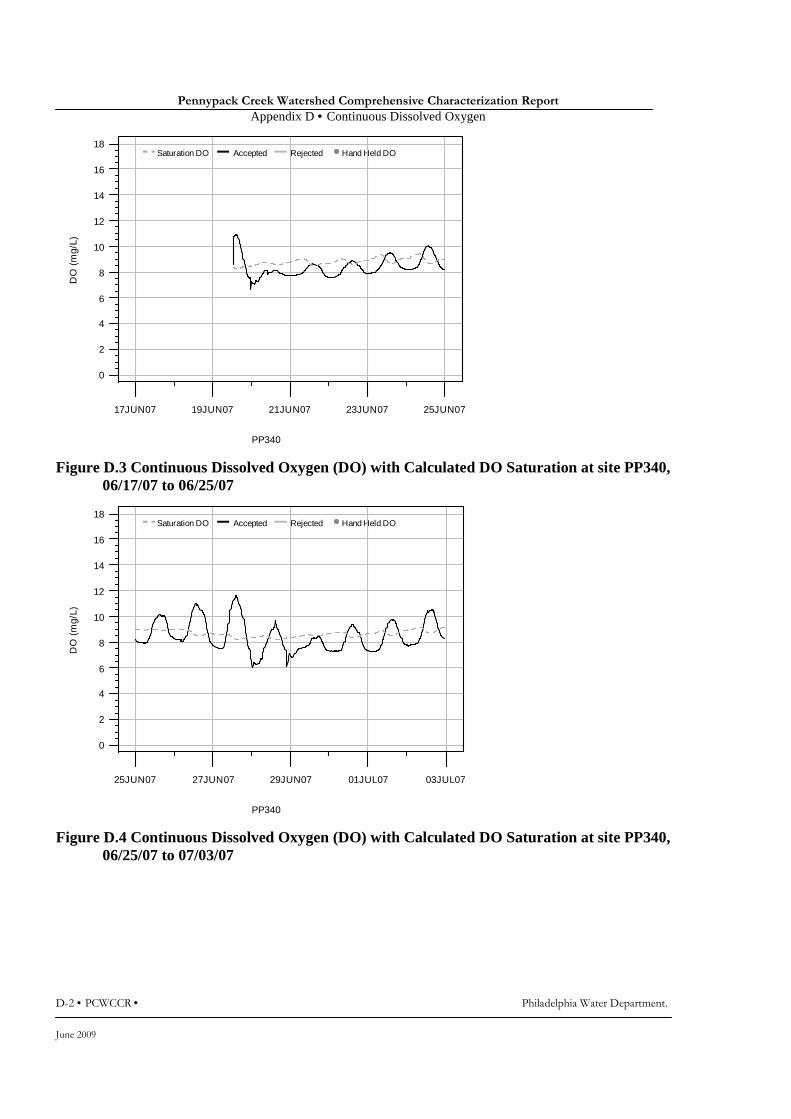
Figure D.3 Continuous Dissolved Oxygen (DO) with Calculated DO Saturation at site PP340,
06/17/07 to 06/25/07
Saturation DO Accepted Rejected Hand Held DO
PP340
DO
(m
g/L)
0
2
4
6
8
10
12
14
16
18
25JUN07 27JUN07 29JUN07 01JUL07 03JUL07
Figure D.4 Continuous Dissolved Oxygen (DO) with Calculated DO Saturation at site PP340,
06/25/07 to 07/03/07
Pennypack Creek Watershed Comprehensive Characterization Report
Appendix D • Continuous Dissolved Oxygen
Philadelphia Water Department. • PCWCCR • D-3
June 2009
Saturation DO Accepted Rejected Hand Held DO
PP340
DO
(m
g/L)
0
2
4
6
8
10
12
14
16
18
03JUL07 05JUL07 07JUL07 09JUL07 11JUL07
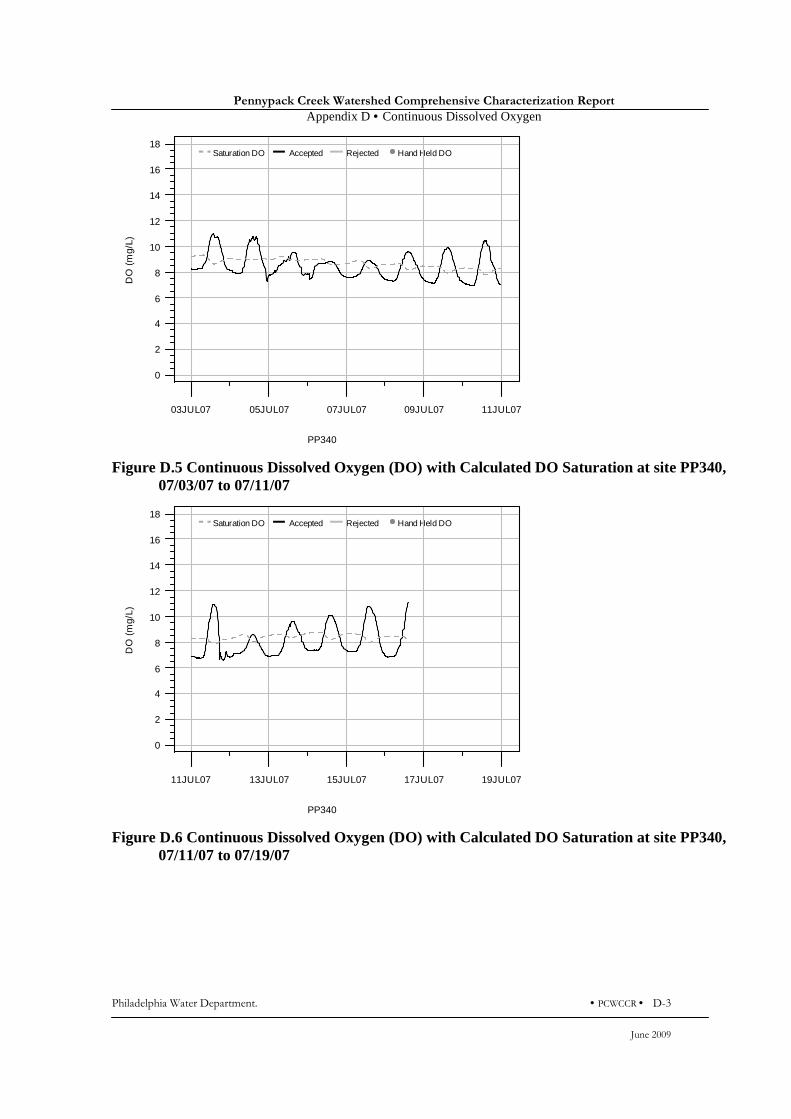
Figure D.5 Continuous Dissolved Oxygen (DO) with Calculated DO Saturation at site PP340,
07/03/07 to 07/11/07
Saturation DO Accepted Rejected Hand Held DO
PP340
DO
(m
g/L)
0
2
4
6
8
10
12
14
16
18
11JUL07 13JUL07 15JUL07 17JUL07 19JUL07
Figure D.6 Continuous Dissolved Oxygen (DO) with Calculated DO Saturation at site PP340,
07/11/07 to 07/19/07

Pennypack Creek Watershed Comprehensive Characterization Report
Appendix D • Continuous Dissolved Oxygen
D-4 • PCWCCR • Philadelphia Water Department.
June 2009
Saturation DO Accepted Rejected Hand Held DO
PP340
DO
(m
g/L)
0
2
4
6
8
10
12
14
16
18
08AUG07 10AUG07 12AUG07 14AUG07 16AUG07
Figure D.7 Continuous Dissolved Oxygen (DO) with Calculated DO Saturation at site PP340,
08/08/07 to 08/16/07
Saturation DO Accepted Rejected Hand Held DO
PP340
DO
(m
g/L)
0
2
4
6
8
10
12
14
16
18
16AUG07 18AUG07 20AUG07 22AUG07 24AUG07
Figure D.8 Continuous Dissolved Oxygen (DO) with Calculated DO Saturation at site PP340,
08/16/07 to 08/24/07

Pennypack Creek Watershed Comprehensive Characterization Report
Appendix D • Continuous Dissolved Oxygen
Philadelphia Water Department. • PCWCCR • D-5
June 2009
Saturation DO Accepted Rejected Hand Held DO
PP340
DO
(m
g/L)
0
2
4
6
8
10
12
14
16
18
24AUG07 26AUG07 28AUG07 30AUG07 01SEP07
Figure D.9 Continuous Dissolved Oxygen (DO) with Calculated DO Saturation at site PP340,
08/24/07 to 09/01/07
Saturation DO Accepted Rejected Hand Held DO
PP340
DO
(m
g/L)
0
2
4
6
8
10
12
14
16
18
01SEP07 03SEP07 05SEP07 07SEP07 09SEP07
Figure D.10 Continuous Dissolved Oxygen (DO) with Calculated DO Saturation at site PP340,
09/01/07 to 09/09/07
Pennypack Creek Watershed Comprehensive Characterization Report
Appendix D • Continuous Dissolved Oxygen
D-6 • PCWCCR • Philadelphia Water Department.
June 2009
Saturation DO Accepted Rejected Hand Held DO
PP340
DO
(m
g/L)
0
2
4
6
8
10
12
14
16
18
04SEP07 06SEP07 08SEP07 10SEP07 12SEP07
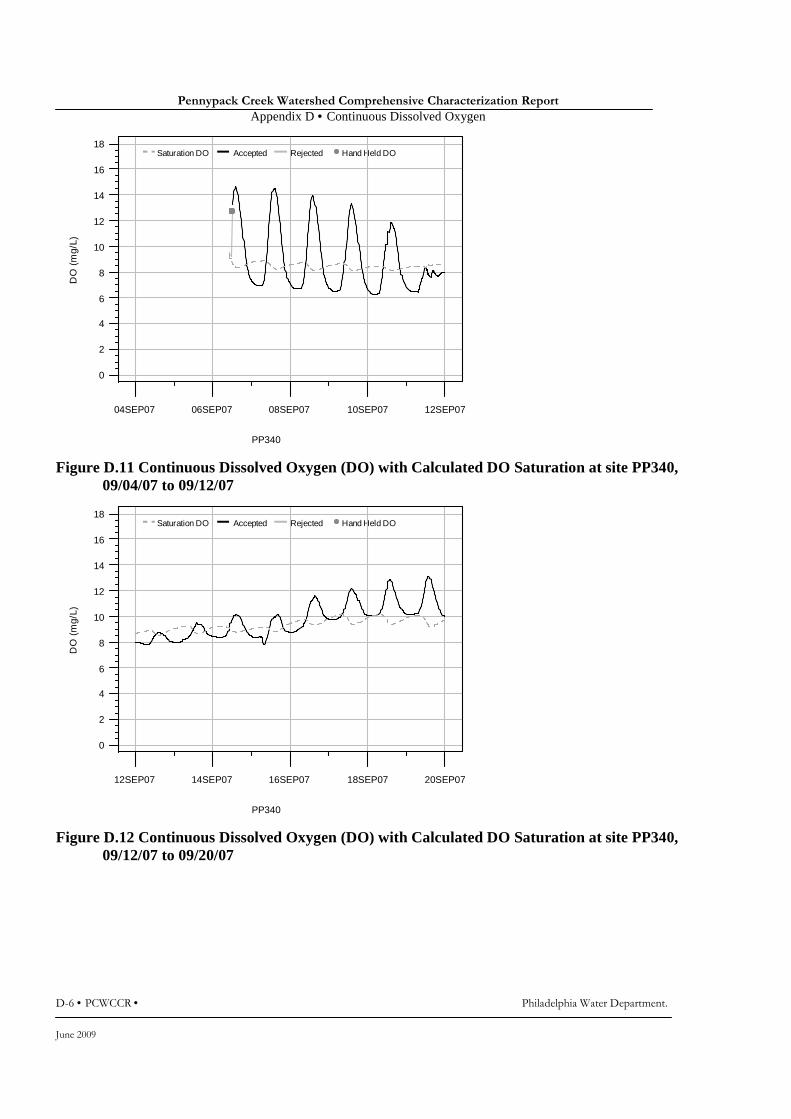
Figure D.11 Continuous Dissolved Oxygen (DO) with Calculated DO Saturation at site PP340,
09/04/07 to 09/12/07
Saturation DO Accepted Rejected Hand Held DO
PP340
DO
(m
g/L)
0
2
4
6
8
10
12
14
16
18
12SEP07 14SEP07 16SEP07 18SEP07 20SEP07
Figure D.12 Continuous Dissolved Oxygen (DO) with Calculated DO Saturation at site PP340,
09/12/07 to 09/20/07

Pennypack Creek Watershed Comprehensive Characterization Report
Appendix D • Continuous Dissolved Oxygen
Philadelphia Water Department. • PCWCCR • D-7
June 2009
Saturation DO Accepted Rejected Hand Held DO
PP340
DO
(m
g/L)
0
2
4
6
8
10
12
14
16
18
20SEP07 22SEP07 24SEP07 26SEP07 28SEP07
Figure D.13 Continuous Dissolved Oxygen (DO) with Calculated DO Saturation at site PP340,
09/20/07 to 09/28/07
Saturation DO Accepted Rejected Hand Held DO
PP340
DO
(m
g/L)
0
2
4
6
8
10
12
14
16
18
28SEP07 30SEP07 02OCT07 04OCT07 06OCT07
Figure D.14 Continuous Dissolved Oxygen (DO) with Calculated DO Saturation at site PP340,
09/28/07 to 10/06/07
Pennypack Creek Watershed Comprehensive Characterization Report
Appendix D • Continuous Dissolved Oxygen
D-8 • PCWCCR • Philadelphia Water Department.
June 2009
Saturation DO Accepted Rejected Hand Held DO
PP340
DO
(m
g/L)
0
2
4
6
8
10
12
14
16
18
28SEP07 30SEP07 02OCT07 04OCT07 06OCT07
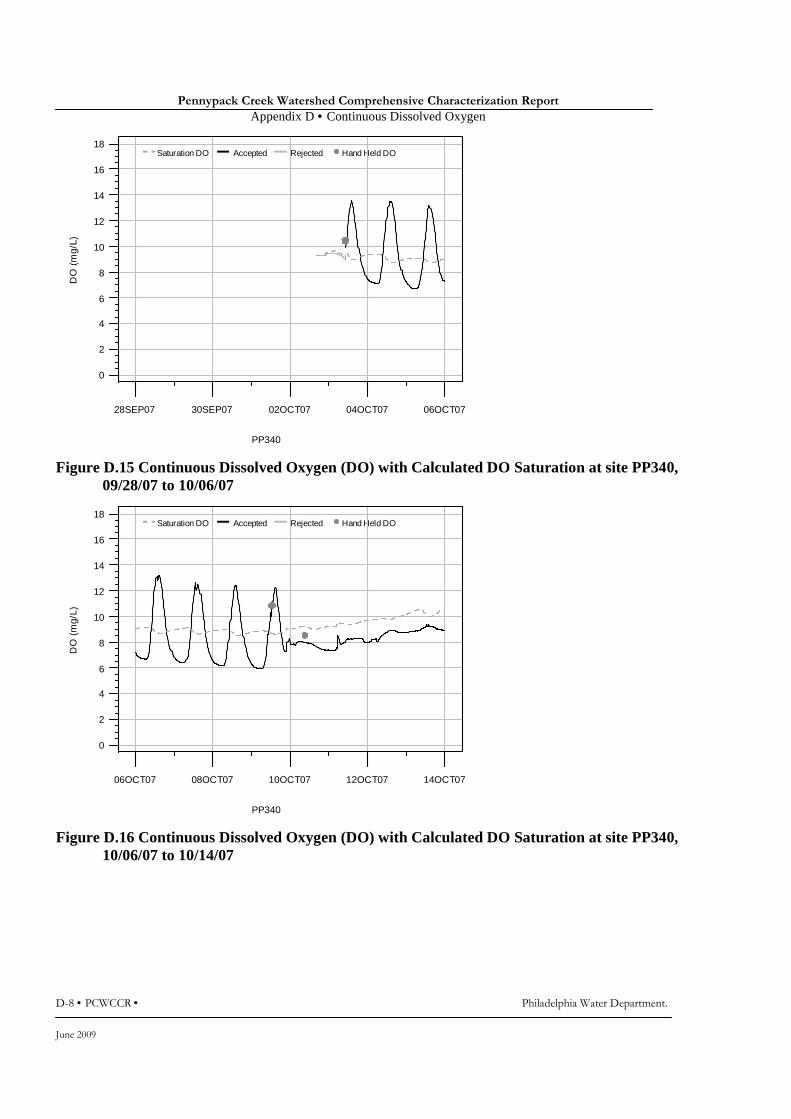
Figure D.15 Continuous Dissolved Oxygen (DO) with Calculated DO Saturation at site PP340,
09/28/07 to 10/06/07
Saturation DO Accepted Rejected Hand Held DO
PP340
DO
(m
g/L)
0
2
4
6
8
10
12
14
16
18
06OCT07 08OCT07 10OCT07 12OCT07 14OCT07
Figure D.16 Continuous Dissolved Oxygen (DO) with Calculated DO Saturation at site PP340,
10/06/07 to 10/14/07

Pennypack Creek Watershed Comprehensive Characterization Report
Appendix D • Continuous Dissolved Oxygen
Philadelphia Water Department. • PCWCCR • D-9
June 2009
Saturation DO Accepted Rejected Hand Held DO
PP340
DO
(m
g/L)
0
2
4
6
8
10
12
14
16
18
14OCT07 16OCT07 18OCT07 20OCT07 22OCT07
Figure D.17 Continuous Dissolved Oxygen (DO) with Calculated DO Saturation at site PP340,
10/14/07 to 10/22/07
Saturation DO Accepted Rejected Hand Held DO
PP340
DO
(m
g/L)
0
2
4
6
8
10
12
14
16
18
22OCT07 24OCT07 26OCT07 28OCT07 30OCT07
Figure D.18 Continuous Dissolved Oxygen (DO) with Calculated DO Saturation at site PP340,
10/22/07 to 10/30/07

Pennypack Creek Watershed Comprehensive Characterization Report
Appendix D • Continuous Dissolved Oxygen
D-10 • PCWCCR • Philadelphia Water Department.
June 2009
Saturation DO Accepted Rejected Hand Held DO
PP340
DO
(m
g/L)
0
2
4
6
8
10
12
14
16
18
21OCT07 23OCT07 25OCT07 27OCT07 29OCT07
Figure D.19 Continuous Dissolved Oxygen (DO) with Calculated DO Saturation at site PP340,
10/21/07 to 10/29/07
Saturation DO Accepted Rejected Hand Held DO
PP340
DO
(m
g/L)
0
2
4
6
8
10
12
14
16
18
29OCT07 31OCT07 02NOV07 04NOV07 06NOV07
Figure D.20 Continuous Dissolved Oxygen (DO) with Calculated DO Saturation at site PP340,
10/29/07 to 11/06/07

Pennypack Creek Watershed Comprehensive Characterization Report
Appendix D • Continuous Dissolved Oxygen
Philadelphia Water Department. • PCWCCR • D-11
June 2009
Saturation DO Accepted Rejected Hand Held DO
PP340
DO
(m
g/L)
0
2
4
6
8
10
12
14
16
18
06NOV07 08NOV07 10NOV07 12NOV07 14NOV07
Figure D.21 Continuous Dissolved Oxygen (DO) with Calculated DO Saturation at site PP340,
11/06/07 to 11/14/07
Saturation DO Accepted Rejected Hand Held DO
PP340
DO
(m
g/L)
0
2
4
6
8
10
12
14
16
18
14NOV07 16NOV07 18NOV07 20NOV07 22NOV07
Figure D.22 Continuous Dissolved Oxygen (DO) with Calculated DO Saturation at site PP340,
11/14/07 to 11/22/07
Pennypack Creek Watershed Comprehensive Characterization Report
Appendix D • Continuous Dissolved Oxygen
D-12 • PCWCCR • Philadelphia Water Department.
June 2009
Saturation DO Accepted Rejected Hand Held DO
PP340
DO
(m
g/L)
0
2
4
6
8
10
12
14
16
18
10NOV07 12NOV07 14NOV07 16NOV07 18NOV07
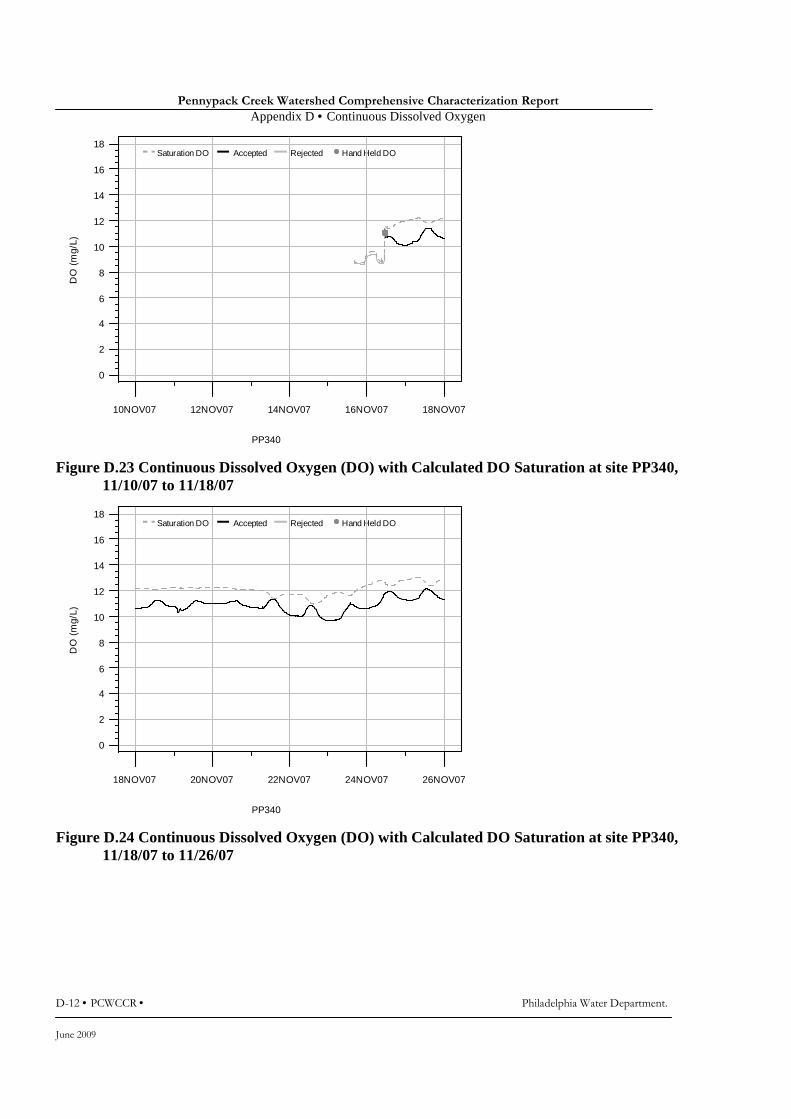
Figure D.23 Continuous Dissolved Oxygen (DO) with Calculated DO Saturation at site PP340,
11/10/07 to 11/18/07
Saturation DO Accepted Rejected Hand Held DO
PP340
DO
(m
g/L)
0
2
4
6
8
10
12
14
16
18
18NOV07 20NOV07 22NOV07 24NOV07 26NOV07
Figure D.24 Continuous Dissolved Oxygen (DO) with Calculated DO Saturation at site PP340,
11/18/07 to 11/26/07
Pennypack Creek Watershed Comprehensive Characterization Report
Appendix D • Continuous Dissolved Oxygen
Philadelphia Water Department. • PCWCCR • D-13
June 2009
Saturation DO Accepted Rejected Hand Held DO
PP340
DO
(m
g/L)
0
2
4
6
8
10
12
14
16
18
26NOV07 28NOV07 30NOV07 02DEC07 04DEC07
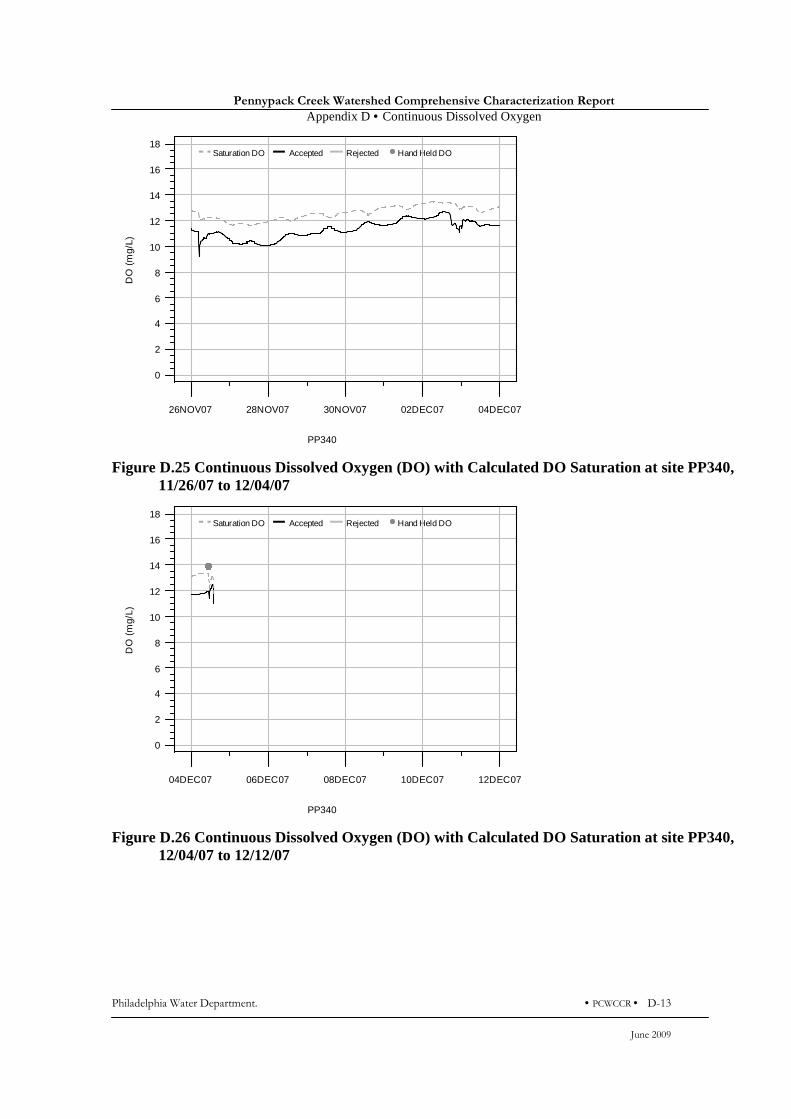
Figure D.25 Continuous Dissolved Oxygen (DO) with Calculated DO Saturation at site PP340,
11/26/07 to 12/04/07
Saturation DO Accepted Rejected Hand Held DO
PP340
DO
(m
g/L)
0
2
4
6
8
10
12
14
16
18
04DEC07 06DEC07 08DEC07 10DEC07 12DEC07
Figure D.26 Continuous Dissolved Oxygen (DO) with Calculated DO Saturation at site PP340,
12/04/07 to 12/12/07

Pennypack Creek Watershed Comprehensive Characterization Report
Appendix D • Continuous Dissolved Oxygen
D-14 • PCWCCR • Philadelphia Water Department.
June 2009
Saturation DO Accepted Rejected Hand Held DO
PP985
DO
(m
g/L)
0
2
4
6
8
10
12
14
16
18
20MAY07 22MAY07 24MAY07 26MAY07 28MAY07
Figure D.27 Continuous Dissolved Oxygen (DO) with Calculated DO Saturation at site PP985,
05/20/07 to 05/28/07
Saturation DO Accepted Rejected Hand Held DO
PP985
DO
(m
g/L)
0
2
4
6
8
10
12
14
16
18
28MAY07 30MAY07 01JUN07 03JUN07 05JUN07
Figure D.28 Continuous Dissolved Oxygen (DO) with Calculated DO Saturation at site PP985,
05/28/07 to 06/05/07

Pennypack Creek Watershed Comprehensive Characterization Report
Appendix D • Continuous Dissolved Oxygen
Philadelphia Water Department. • PCWCCR • D-15
June 2009
Saturation DO Accepted Rejected Hand Held DO
PP985
DO
(m
g/L)
0
2
4
6
8
10
12
14
16
18
05JUN07 07JUN07 09JUN07 11JUN07 13JUN07
Figure D.29 Continuous Dissolved Oxygen (DO) with Calculated DO Saturation at site PP985,
06/05/07 to 06/13/07
Saturation DO Accepted Rejected Hand Held DO
PP985
DO
(m
g/L)
0
2
4
6
8
10
12
14
16
18
13JUN07 15JUN07 17JUN07 19JUN07 21JUN07
Figure D.30 Continuous Dissolved Oxygen (DO) with Calculated DO Saturation at site PP985,
06/13/07 to 06/21/07

Pennypack Creek Watershed Comprehensive Characterization Report
Appendix D • Continuous Dissolved Oxygen
D-16 • PCWCCR • Philadelphia Water Department.
June 2009
Saturation DO Accepted Rejected Hand Held DO
PP985
DO
(m
g/L)
0
2
4
6
8
10
12
14
16
18
17JUN07 19JUN07 21JUN07 23JUN07 25JUN07
Figure D.31 Continuous Dissolved Oxygen (DO) with Calculated DO Saturation at site PP985,
06/17/07 to 06/25/07
Saturation DO Accepted Rejected Hand Held DO
PP985
DO
(m
g/L)
0
2
4
6
8
10
12
14
16
18
25JUN07 27JUN07 29JUN07 01JUL07 03JUL07
Figure D.32 Continuous Dissolved Oxygen (DO) with Calculated DO Saturation at site PP985,
06/25/07 to 07/03/07
Pennypack Creek Watershed Comprehensive Characterization Report
Appendix D • Continuous Dissolved Oxygen
Philadelphia Water Department. • PCWCCR • D-17
June 2009
Saturation DO Accepted Rejected Hand Held DO
PP985
DO
(m
g/L)
0
2
4
6
8
10
12
14
16
18
03JUL07 05JUL07 07JUL07 09JUL07 11JUL07
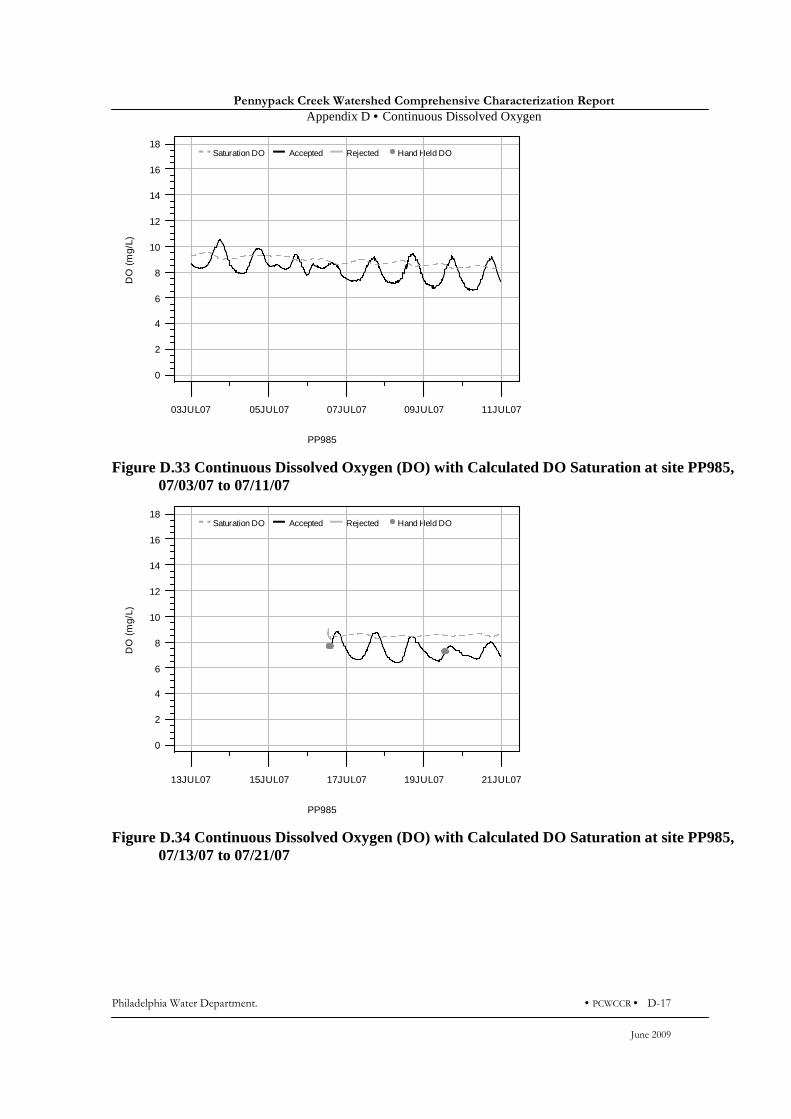
Figure D.33 Continuous Dissolved Oxygen (DO) with Calculated DO Saturation at site PP985,
07/03/07 to 07/11/07
Saturation DO Accepted Rejected Hand Held DO
PP985
DO
(m
g/L)
0
2
4
6
8
10
12
14
16
18
13JUL07 15JUL07 17JUL07 19JUL07 21JUL07
Figure D.34 Continuous Dissolved Oxygen (DO) with Calculated DO Saturation at site PP985,
07/13/07 to 07/21/07
Pennypack Creek Watershed Comprehensive Characterization Report
Appendix D • Continuous Dissolved Oxygen
D-18 • PCWCCR • Philadelphia Water Department.
June 2009
Saturation DO Accepted Rejected Hand Held DO
PP985
DO
(m
g/L)
0
2
4
6
8
10
12
14
16
18
21JUL07 23JUL07 25JUL07 27JUL07 29JUL07
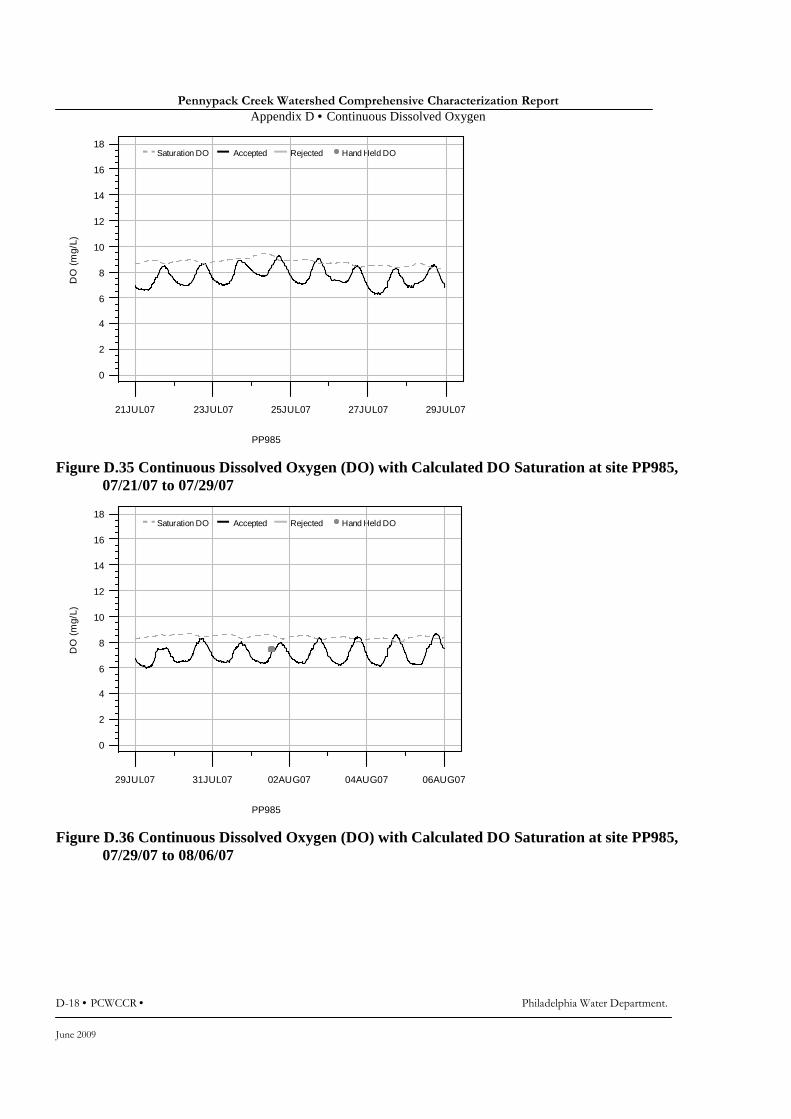
Figure D.35 Continuous Dissolved Oxygen (DO) with Calculated DO Saturation at site PP985,
07/21/07 to 07/29/07
Saturation DO Accepted Rejected Hand Held DO
PP985
DO
(m
g/L)
0
2
4
6
8
10
12
14
16
18
29JUL07 31JUL07 02AUG07 04AUG07 06AUG07
Figure D.36 Continuous Dissolved Oxygen (DO) with Calculated DO Saturation at site PP985,
07/29/07 to 08/06/07

Pennypack Creek Watershed Comprehensive Characterization Report
Appendix D • Continuous Dissolved Oxygen
Philadelphia Water Department. • PCWCCR • D-19
June 2009
Saturation DO Accepted Rejected Hand Held DO
PP985
DO
(m
g/L)
0
2
4
6
8
10
12
14
16
18
06AUG07 08AUG07 10AUG07 12AUG07 14AUG07
Figure D.37 Continuous Dissolved Oxygen (DO) with Calculated DO Saturation at site PP985,
08/06/07 to 08/14/07
Saturation DO Accepted Rejected Hand Held DO
PP985
DO
(m
g/L)
0
2
4
6
8
10
12
14
16
18
08AUG07 10AUG07 12AUG07 14AUG07 16AUG07
Figure D.38 Continuous Dissolved Oxygen (DO) with Calculated DO Saturation at site PP985,
08/08/07 to 08/16/07
Pennypack Creek Watershed Comprehensive Characterization Report
Appendix D • Continuous Dissolved Oxygen
D-20 • PCWCCR • Philadelphia Water Department.
June 2009
Saturation DO Accepted Rejected Hand Held DO
PP985
DO
(m
g/L)
0
2
4
6
8
10
12
14
16
18
16AUG07 18AUG07 20AUG07 22AUG07 24AUG07
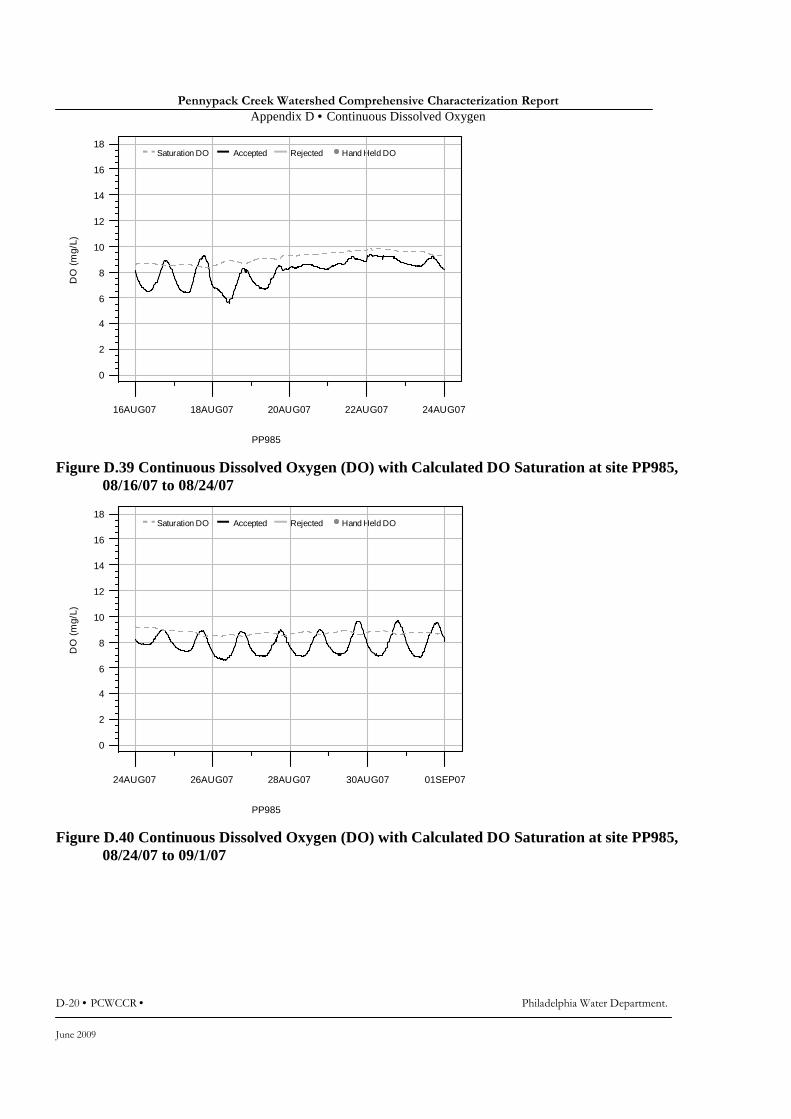
Figure D.39 Continuous Dissolved Oxygen (DO) with Calculated DO Saturation at site PP985,
08/16/07 to 08/24/07
Saturation DO Accepted Rejected Hand Held DO
PP985
DO
(m
g/L)
0
2
4
6
8
10
12
14
16
18
24AUG07 26AUG07 28AUG07 30AUG07 01SEP07
Figure D.40 Continuous Dissolved Oxygen (DO) with Calculated DO Saturation at site PP985,
08/24/07 to 09/1/07

Pennypack Creek Watershed Comprehensive Characterization Report
Appendix D • Continuous Dissolved Oxygen
Philadelphia Water Department. • PCWCCR • D-21
June 2009
Saturation DO Accepted Rejected Hand Held DO
PP985
DO
(m
g/L)
0
2
4
6
8
10
12
14
16
18
01SEP07 03SEP07 05SEP07 07SEP07 09SEP07
Figure D.41 Continuous Dissolved Oxygen (DO) with Calculated DO Saturation at site PP985,
09/01/07 to 09/09/07
Saturation DO Accepted Rejected Hand Held DO
PP985
DO
(m
g/L)
0
2
4
6
8
10
12
14
16
18
04SEP07 06SEP07 08SEP07 10SEP07 12SEP07
Figure D.42 Continuous Dissolved Oxygen (DO) with Calculated DO Saturation at site PP985,
09/04/07 to 09/12/07

Pennypack Creek Watershed Comprehensive Characterization Report
Appendix D • Continuous Dissolved Oxygen
D-22 • PCWCCR • Philadelphia Water Department.
June 2009
Saturation DO Accepted Rejected Hand Held DO
PP985
DO
(m
g/L)
0
2
4
6
8
10
12
14
16
18
12SEP07 14SEP07 16SEP07 18SEP07 20SEP07
Figure D.43 Continuous Dissolved Oxygen (DO) with Calculated DO Saturation at site PP985,
09/12/07 to 09/20/07
Saturation DO Accepted Rejected Hand Held DO
PP985
DO
(m
g/L)
0
2
4
6
8
10
12
14
16
18
20SEP07 22SEP07 24SEP07 26SEP07 28SEP07
Figure D.44 Continuous Dissolved Oxygen (DO) with Calculated DO Saturation at site PP985,
09/20/07 to 09/28/07
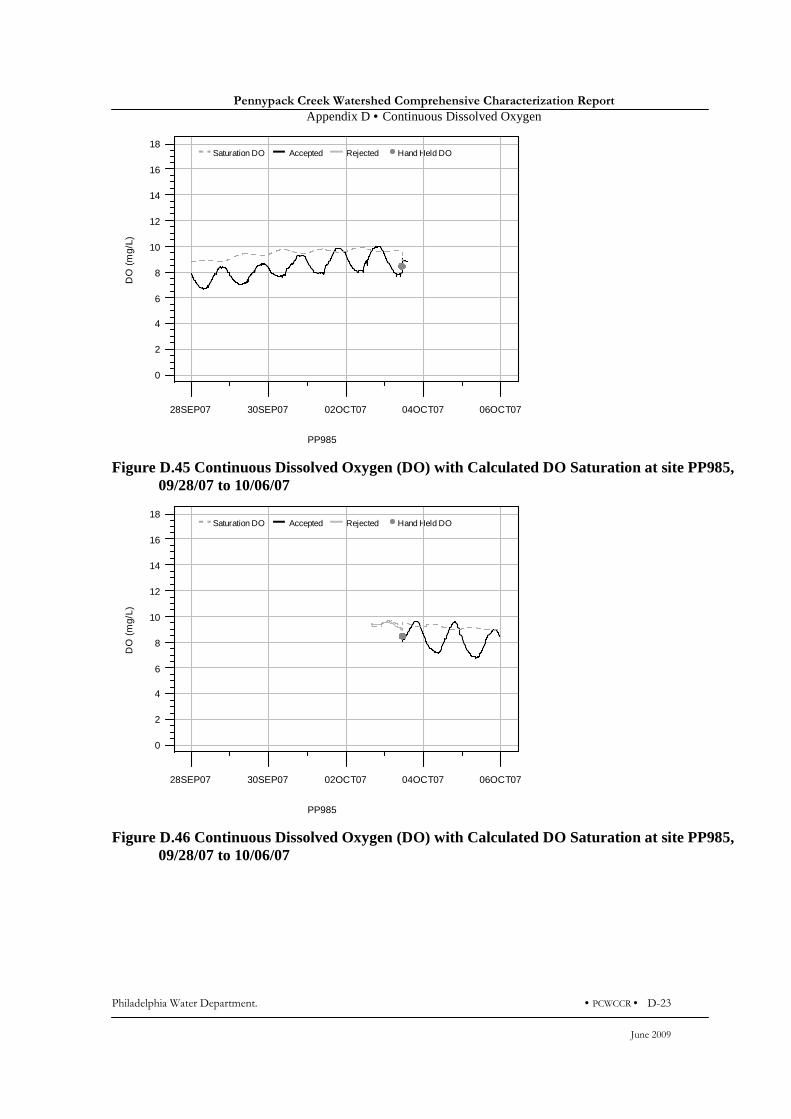
Pennypack Creek Watershed Comprehensive Characterization Report
Appendix D • Continuous Dissolved Oxygen
Philadelphia Water Department. • PCWCCR • D-23
June 2009
Saturation DO Accepted Rejected Hand Held DO
PP985
DO
(m
g/L)
0
2
4
6
8
10
12
14
16
18
28SEP07 30SEP07 02OCT07 04OCT07 06OCT07
Figure D.45 Continuous Dissolved Oxygen (DO) with Calculated DO Saturation at site PP985,
09/28/07 to 10/06/07
Saturation DO Accepted Rejected Hand Held DO
PP985
DO
(m
g/L)
0
2
4
6
8
10
12
14
16
18
28SEP07 30SEP07 02OCT07 04OCT07 06OCT07
Figure D.46 Continuous Dissolved Oxygen (DO) with Calculated DO Saturation at site PP985,
09/28/07 to 10/06/07

Pennypack Creek Watershed Comprehensive Characterization Report
Appendix D • Continuous Dissolved Oxygen
D-24 • PCWCCR • Philadelphia Water Department.
June 2009
Saturation DO Accepted Rejected Hand Held DO
PP985
DO
(m
g/L)
0
2
4
6
8
10
12
14
16
18
06OCT07 08OCT07 10OCT07 12OCT07 14OCT07
Figure D.47 Continuous Dissolved Oxygen (DO) with Calculated DO Saturation at site PP985,
10/06/07 to 10/14/07
Saturation DO Accepted Rejected Hand Held DO
PP985
DO
(m
g/L)
0
2
4
6
8
10
12
14
16
18
14OCT07 16OCT07 18OCT07 20OCT07 22OCT07
Figure D.48 Continuous Dissolved Oxygen (DO) with Calculated DO Saturation at site PP985,
10/14/07 to 10/22/07
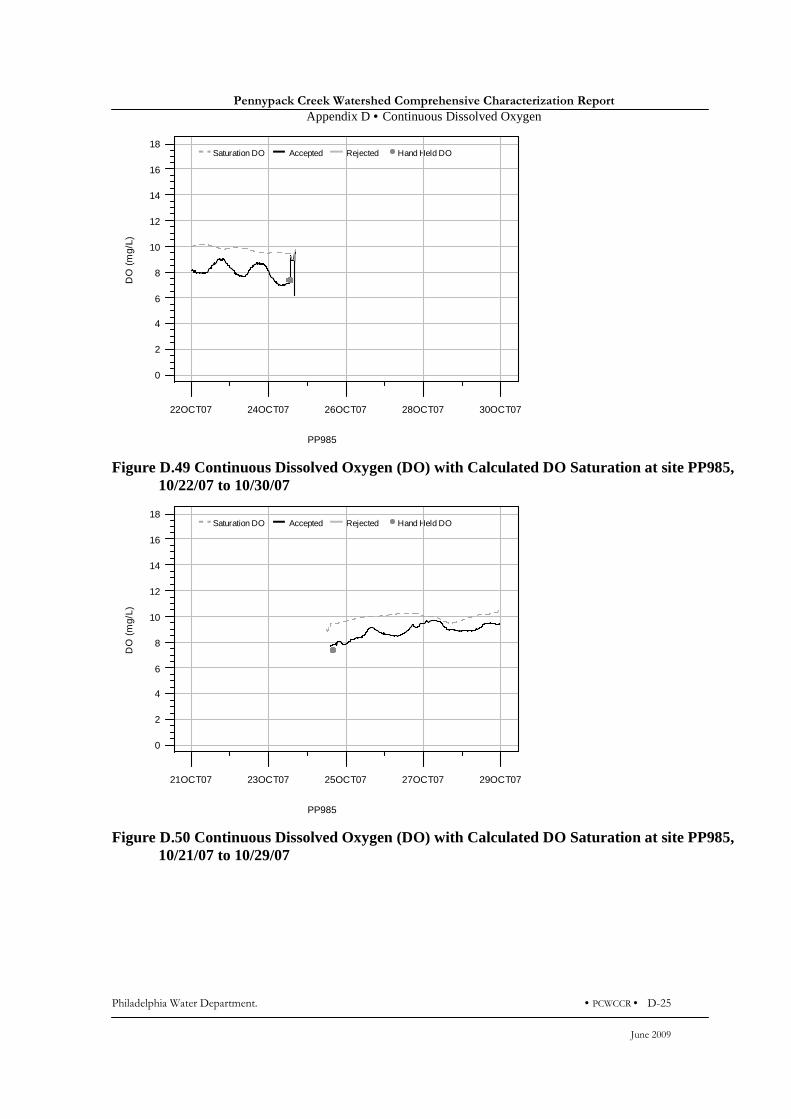
Pennypack Creek Watershed Comprehensive Characterization Report
Appendix D • Continuous Dissolved Oxygen
Philadelphia Water Department. • PCWCCR • D-25
June 2009
Saturation DO Accepted Rejected Hand Held DO
PP985
DO
(m
g/L)
0
2
4
6
8
10
12
14
16
18
22OCT07 24OCT07 26OCT07 28OCT07 30OCT07
Figure D.49 Continuous Dissolved Oxygen (DO) with Calculated DO Saturation at site PP985,
10/22/07 to 10/30/07
Saturation DO Accepted Rejected Hand Held DO
PP985
DO
(m
g/L)
0
2
4
6
8
10
12
14
16
18
21OCT07 23OCT07 25OCT07 27OCT07 29OCT07
Figure D.50 Continuous Dissolved Oxygen (DO) with Calculated DO Saturation at site PP985,
10/21/07 to 10/29/07
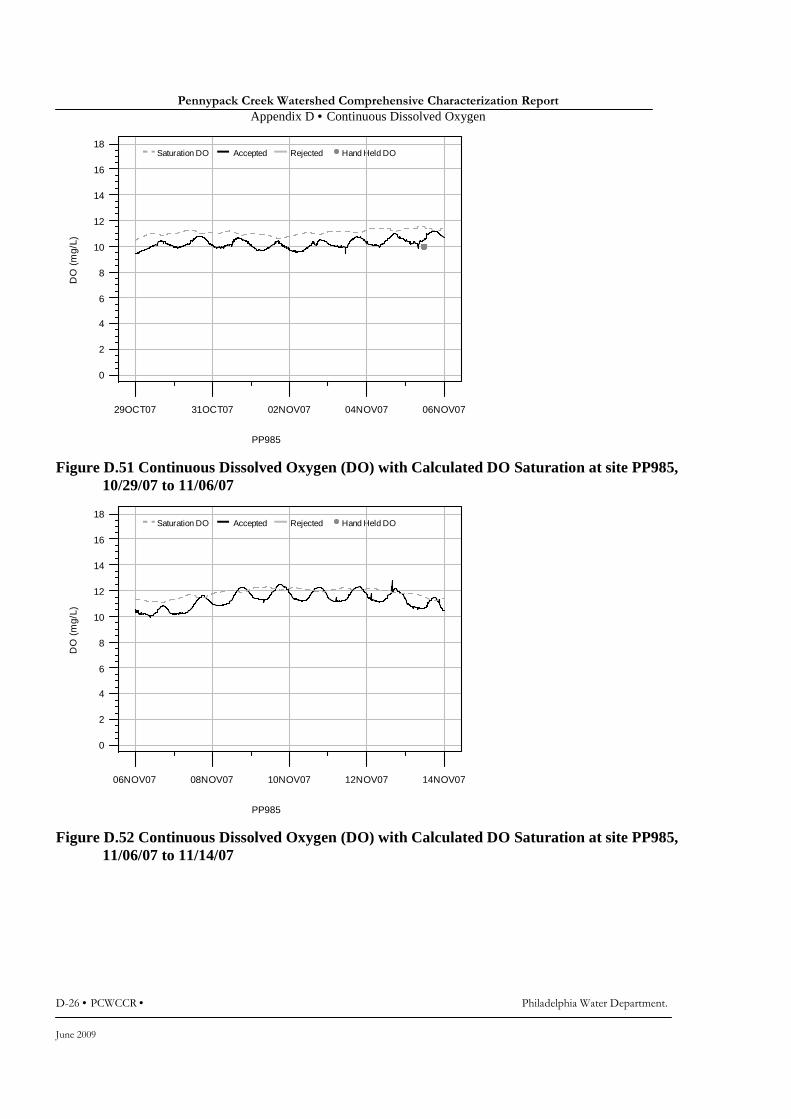
Pennypack Creek Watershed Comprehensive Characterization Report
Appendix D • Continuous Dissolved Oxygen
D-26 • PCWCCR • Philadelphia Water Department.
June 2009
Saturation DO Accepted Rejected Hand Held DO
PP985
DO
(m
g/L)
0
2
4
6
8
10
12
14
16
18
29OCT07 31OCT07 02NOV07 04NOV07 06NOV07
Figure D.51 Continuous Dissolved Oxygen (DO) with Calculated DO Saturation at site PP985,
10/29/07 to 11/06/07
Saturation DO Accepted Rejected Hand Held DO
PP985
DO
(m
g/L)
0
2
4
6
8
10
12
14
16
18
06NOV07 08NOV07 10NOV07 12NOV07 14NOV07
Figure D.52 Continuous Dissolved Oxygen (DO) with Calculated DO Saturation at site PP985,
11/06/07 to 11/14/07

Pennypack Creek Watershed Comprehensive Characterization Report
Appendix D • Continuous Dissolved Oxygen
Philadelphia Water Department. • PCWCCR • D-27
June 2009
Saturation DO Accepted Rejected Hand Held DO
PP985
DO
(m
g/L)
0
2
4
6
8
10
12
14
16
18
14NOV07 16NOV07 18NOV07 20NOV07 22NOV07
Figure D.53 Continuous Dissolved Oxygen (DO) with Calculated DO Saturation at site PP985,
11/14/07 to 11/22/07
Saturation DO Accepted Rejected Hand Held DO
PP985
DO
(m
g/L)
0
2
4
6
8
10
12
14
16
18
10NOV07 12NOV07 14NOV07 16NOV07 18NOV07
Figure D.54 Continuous Dissolved Oxygen (DO) with Calculated DO Saturation at site PP985,
11/10/07 to 11/18/07

Pennypack Creek Watershed Comprehensive Characterization Report
Appendix D • Continuous Dissolved Oxygen
D-28 • PCWCCR • Philadelphia Water Department.
June 2009
Saturation DO Accepted Rejected Hand Held DO
PP985
DO
(m
g/L)
0
2
4
6
8
10
12
14
16
18
18NOV07 20NOV07 22NOV07 24NOV07 26NOV07
Figure D.55 Continuous Dissolved Oxygen (DO) with Calculated DO Saturation at site PP985,
11/18/07 to 11/26/07
Saturation DO Accepted Rejected Hand Held DO
PP985
DO
(m
g/L)
0
2
4
6
8
10
12
14
16
18
26NOV07 28NOV07 30NOV07 02DEC07 04DEC07
Figure D.56 Continuous Dissolved Oxygen (DO) with Calculated DO Saturation at site PP985,
11/26/07 to 12/04/07

Pennypack Creek Watershed Comprehensive Characterization Report
Appendix D • Continuous Dissolved Oxygen
Philadelphia Water Department. • PCWCCR • D-29
June 2009
Saturation DO Accepted Rejected Hand Held DO
PP985
DO
(m
g/L)
0
2
4
6
8
10
12
14
16
18
04DEC07 06DEC07 08DEC07 10DEC07 12DEC07
Figure D.57 Continuous Dissolved Oxygen (DO) with Calculated DO Saturation at site PP985,
12/04/07 to 12/12/07
Saturation DO Accepted Rejected Hand Held DO
PP1680
DO
(m
g/L)
0
2
4
6
8
10
12
14
16
18
30JUN07 02JUL07 04JUL07 06JUL07 08JUL07
Figure D.58 Continuous Dissolved Oxygen (DO) with Calculated DO Saturation at site
PP1680, 06/30/07 to 07/08/07

Pennypack Creek Watershed Comprehensive Characterization Report
Appendix D • Continuous Dissolved Oxygen
D-30 • PCWCCR • Philadelphia Water Department.
June 2009
Saturation DO Accepted Rejected Hand Held DO
PP1680
DO
(m
g/L)
0
2
4
6
8
10
12
14
16
18
08JUL07 10JUL07 12JUL07 14JUL07 16JUL07
Figure D.59 Continuous Dissolved Oxygen (DO) with Calculated DO Saturation at site
PP1680, 07/08/07 to 07/16/07
Saturation DO Accepted Rejected Hand Held DO
PP1680
DO
(m
g/L)
0
2
4
6
8
10
12
14
16
18
16JUL07 18JUL07 20JUL07 22JUL07 24JUL07
Figure D.60 Continuous Dissolved Oxygen (DO) with Calculated DO Saturation at site
PP1680, 07/16/07 to 07/24/07
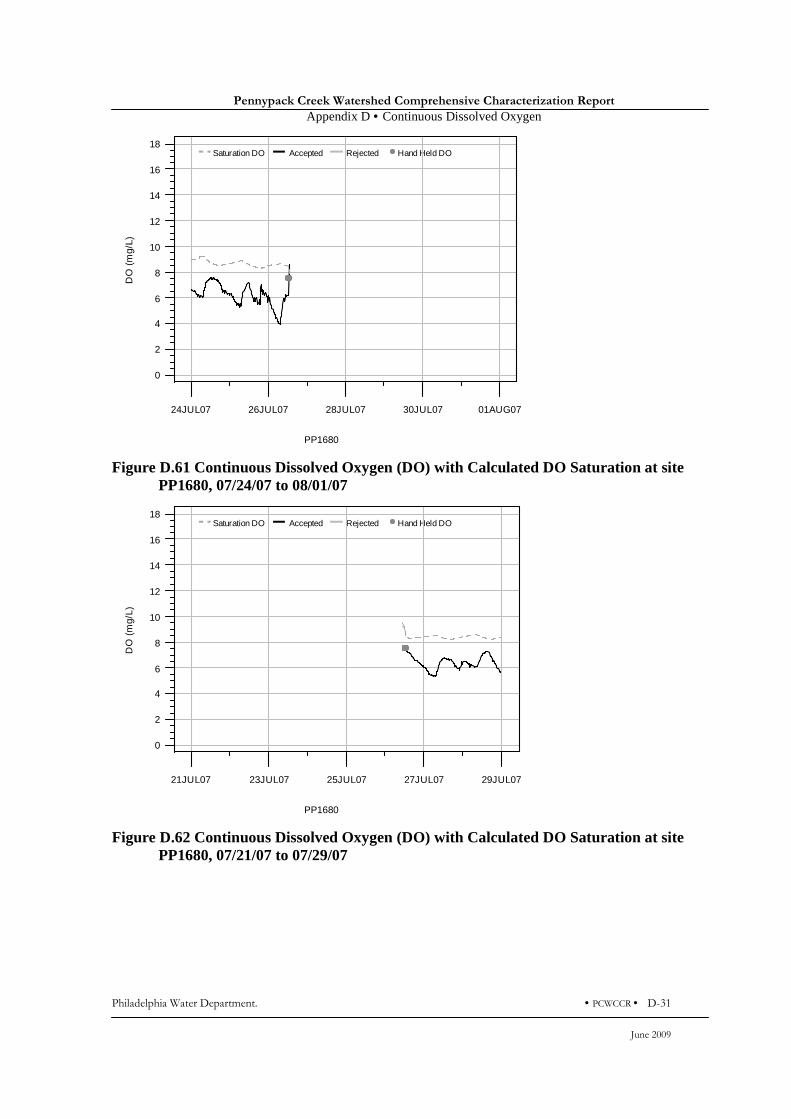
Pennypack Creek Watershed Comprehensive Characterization Report
Appendix D • Continuous Dissolved Oxygen
Philadelphia Water Department. • PCWCCR • D-31
June 2009
Saturation DO Accepted Rejected Hand Held DO
PP1680
DO
(m
g/L)
0
2
4
6
8
10
12
14
16
18
24JUL07 26JUL07 28JUL07 30JUL07 01AUG07
Figure D.61 Continuous Dissolved Oxygen (DO) with Calculated DO Saturation at site
PP1680, 07/24/07 to 08/01/07
Saturation DO Accepted Rejected Hand Held DO
PP1680
DO
(m
g/L)
0
2
4
6
8
10
12
14
16
18
21JUL07 23JUL07 25JUL07 27JUL07 29JUL07
Figure D.62 Continuous Dissolved Oxygen (DO) with Calculated DO Saturation at site
PP1680, 07/21/07 to 07/29/07

Pennypack Creek Watershed Comprehensive Characterization Report
Appendix D • Continuous Dissolved Oxygen
D-32 • PCWCCR • Philadelphia Water Department.
June 2009
Saturation DO Accepted Rejected Hand Held DO
PP1680
DO
(m
g/L)
0
2
4
6
8
10
12
14
16
18
29JUL07 31JUL07 02AUG07 04AUG07 06AUG07
Figure D.63 Continuous Dissolved Oxygen (DO) with Calculated DO Saturation at site
PP1680, 07/29/07 to 08/06/07
Saturation DO Accepted Rejected Hand Held DO
PP1680
DO
(m
g/L)
0
2
4
6
8
10
12
14
16
18
06AUG07 08AUG07 10AUG07 12AUG07 14AUG07
Figure D.64 Continuous Dissolved Oxygen (DO) with Calculated DO Saturation at site
PP1680, 08/06/07 to 08/14/07
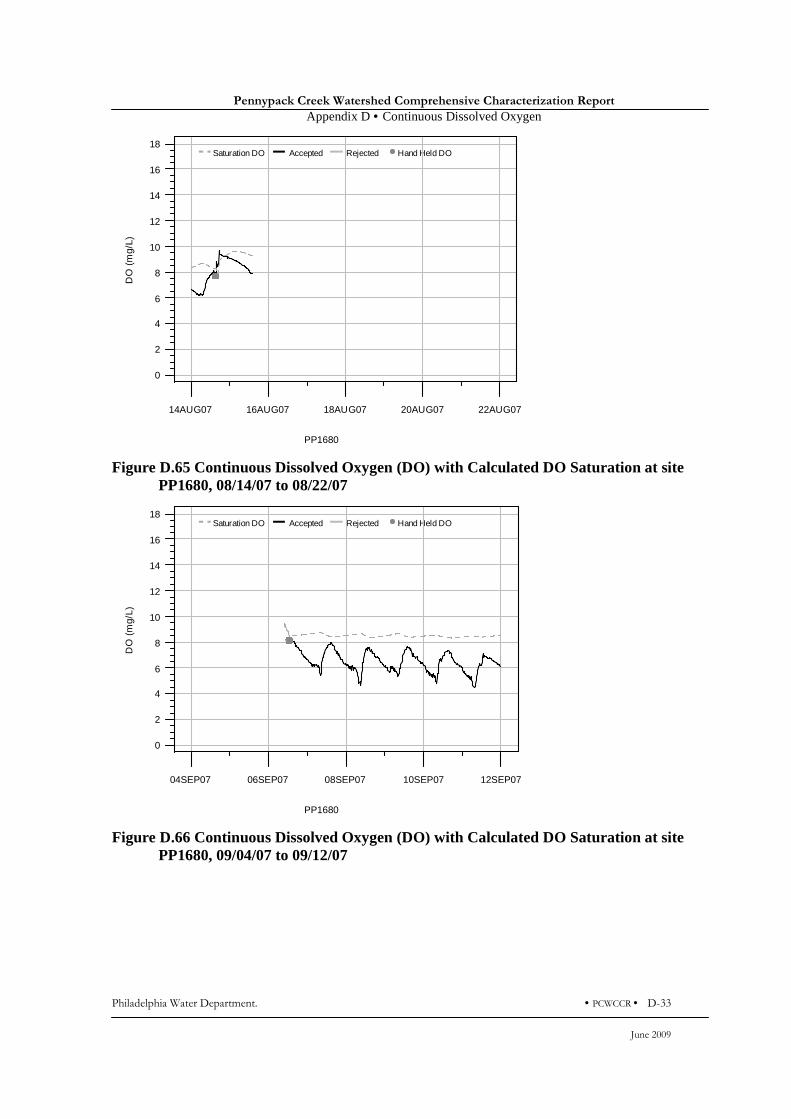
Pennypack Creek Watershed Comprehensive Characterization Report
Appendix D • Continuous Dissolved Oxygen
Philadelphia Water Department. • PCWCCR • D-33
June 2009
Saturation DO Accepted Rejected Hand Held DO
PP1680
DO
(m
g/L)
0
2
4
6
8
10
12
14
16
18
14AUG07 16AUG07 18AUG07 20AUG07 22AUG07
Figure D.65 Continuous Dissolved Oxygen (DO) with Calculated DO Saturation at site
PP1680, 08/14/07 to 08/22/07
Saturation DO Accepted Rejected Hand Held DO
PP1680
DO
(m
g/L)
0
2
4
6
8
10
12
14
16
18
04SEP07 06SEP07 08SEP07 10SEP07 12SEP07
Figure D.66 Continuous Dissolved Oxygen (DO) with Calculated DO Saturation at site
PP1680, 09/04/07 to 09/12/07
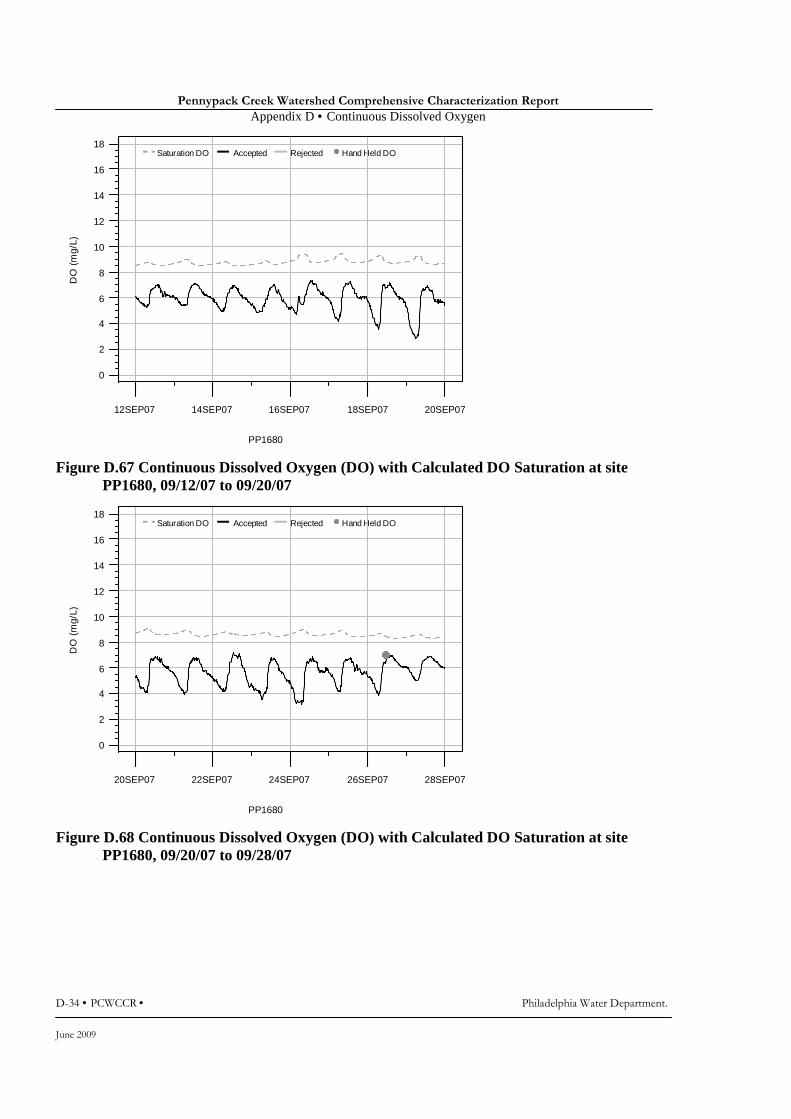
Pennypack Creek Watershed Comprehensive Characterization Report
Appendix D • Continuous Dissolved Oxygen
D-34 • PCWCCR • Philadelphia Water Department.
June 2009
Saturation DO Accepted Rejected Hand Held DO
PP1680
DO
(m
g/L)
0
2
4
6
8
10
12
14
16
18
12SEP07 14SEP07 16SEP07 18SEP07 20SEP07
Figure D.67 Continuous Dissolved Oxygen (DO) with Calculated DO Saturation at site
PP1680, 09/12/07 to 09/20/07
Saturation DO Accepted Rejected Hand Held DO
PP1680
DO
(m
g/L)
0
2
4
6
8
10
12
14
16
18
20SEP07 22SEP07 24SEP07 26SEP07 28SEP07
Figure D.68 Continuous Dissolved Oxygen (DO) with Calculated DO Saturation at site
PP1680, 09/20/07 to 09/28/07
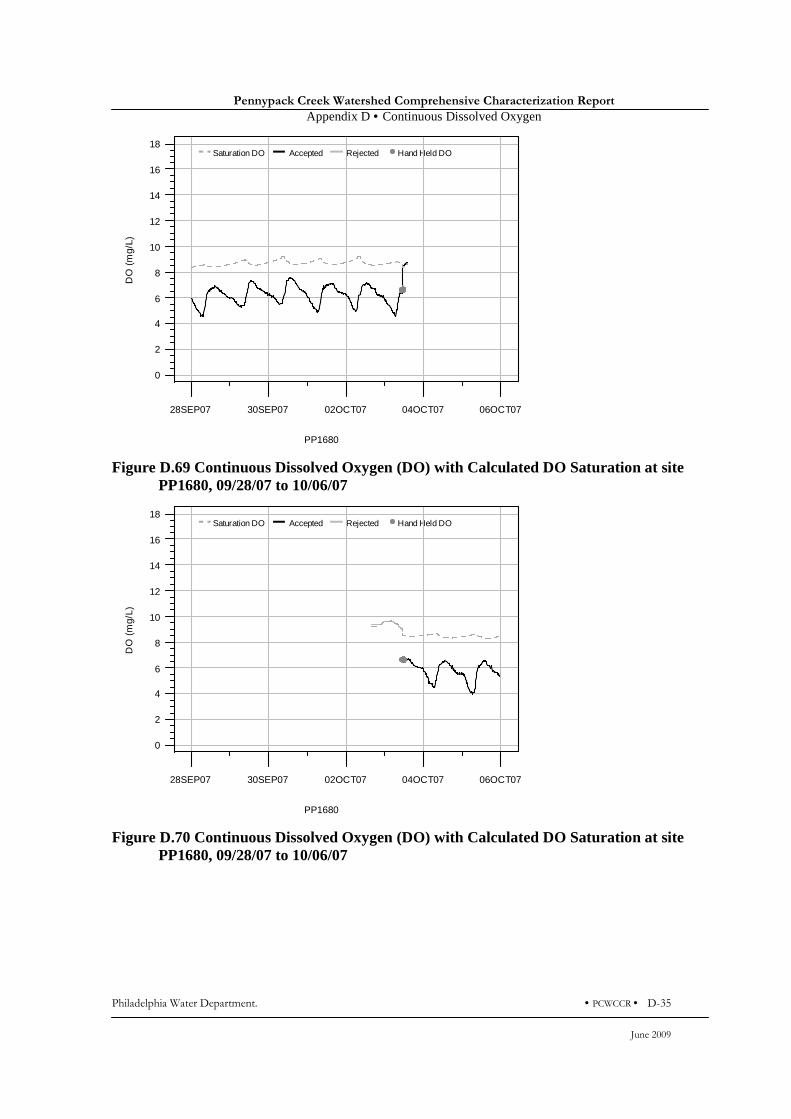
Pennypack Creek Watershed Comprehensive Characterization Report
Appendix D • Continuous Dissolved Oxygen
Philadelphia Water Department. • PCWCCR • D-35
June 2009
Saturation DO Accepted Rejected Hand Held DO
PP1680
DO
(m
g/L)
0
2
4
6
8
10
12
14
16
18
28SEP07 30SEP07 02OCT07 04OCT07 06OCT07
Figure D.69 Continuous Dissolved Oxygen (DO) with Calculated DO Saturation at site
PP1680, 09/28/07 to 10/06/07
Saturation DO Accepted Rejected Hand Held DO
PP1680
DO
(m
g/L)
0
2
4
6
8
10
12
14
16
18
28SEP07 30SEP07 02OCT07 04OCT07 06OCT07
Figure D.70 Continuous Dissolved Oxygen (DO) with Calculated DO Saturation at site
PP1680, 09/28/07 to 10/06/07
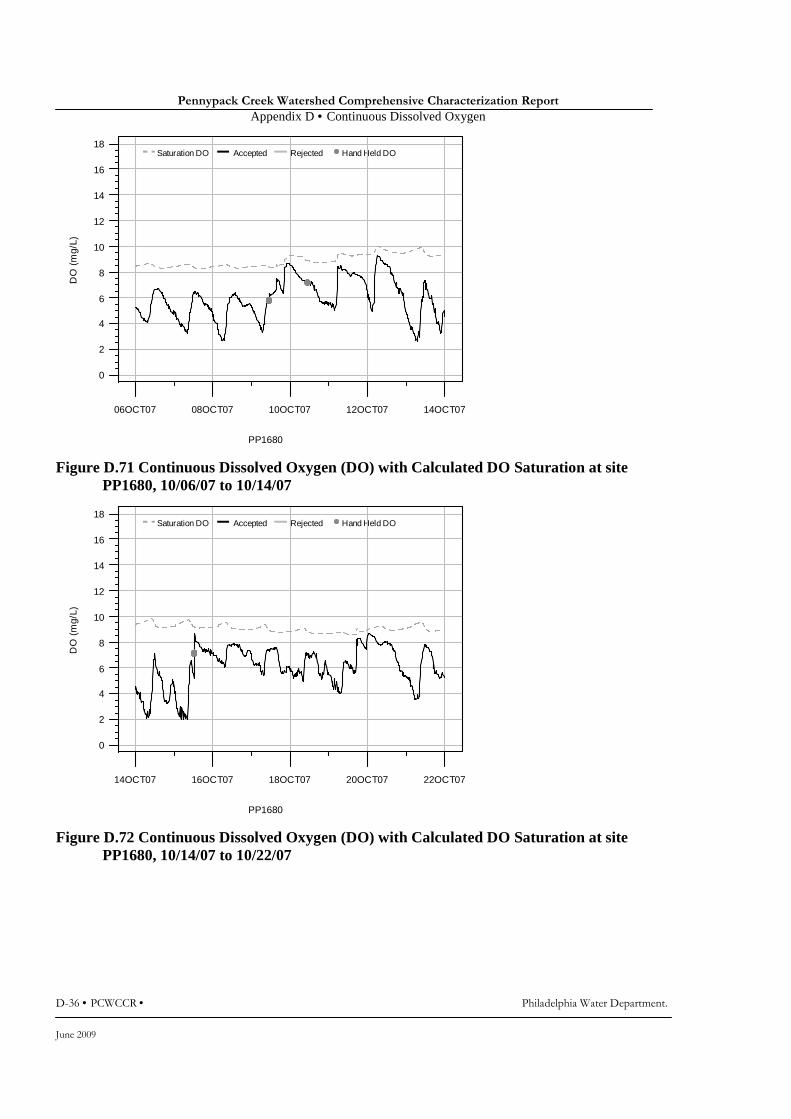
Pennypack Creek Watershed Comprehensive Characterization Report
Appendix D • Continuous Dissolved Oxygen
D-36 • PCWCCR • Philadelphia Water Department.
June 2009
Saturation DO Accepted Rejected Hand Held DO
PP1680
DO
(m
g/L)
0
2
4
6
8
10
12
14
16
18
06OCT07 08OCT07 10OCT07 12OCT07 14OCT07
Figure D.71 Continuous Dissolved Oxygen (DO) with Calculated DO Saturation at site
PP1680, 10/06/07 to 10/14/07
Saturation DO Accepted Rejected Hand Held DO
PP1680
DO
(m
g/L)
0
2
4
6
8
10
12
14
16
18
14OCT07 16OCT07 18OCT07 20OCT07 22OCT07
Figure D.72 Continuous Dissolved Oxygen (DO) with Calculated DO Saturation at site
PP1680, 10/14/07 to 10/22/07
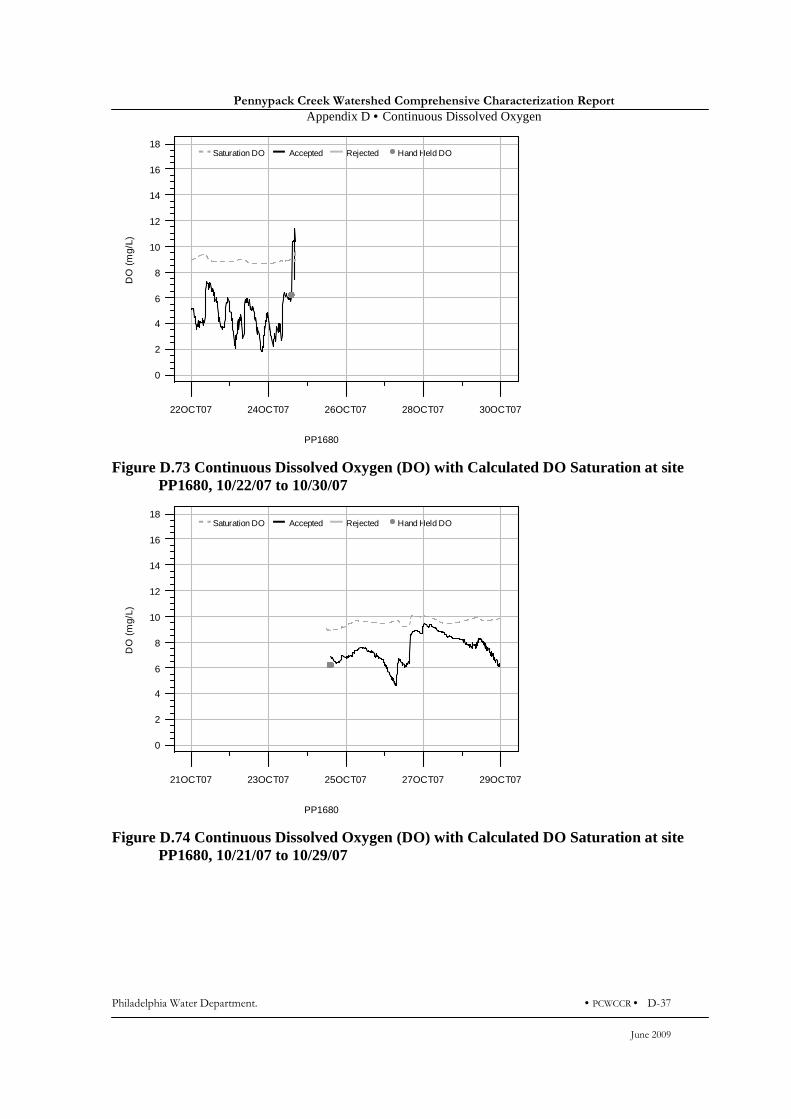
Pennypack Creek Watershed Comprehensive Characterization Report
Appendix D • Continuous Dissolved Oxygen
Philadelphia Water Department. • PCWCCR • D-37
June 2009
Saturation DO Accepted Rejected Hand Held DO
PP1680
DO
(m
g/L)
0
2
4
6
8
10
12
14
16
18
22OCT07 24OCT07 26OCT07 28OCT07 30OCT07
Figure D.73 Continuous Dissolved Oxygen (DO) with Calculated DO Saturation at site
PP1680, 10/22/07 to 10/30/07
Saturation DO Accepted Rejected Hand Held DO
PP1680
DO
(m
g/L)
0
2
4
6
8
10
12
14
16
18
21OCT07 23OCT07 25OCT07 27OCT07 29OCT07
Figure D.74 Continuous Dissolved Oxygen (DO) with Calculated DO Saturation at site
PP1680, 10/21/07 to 10/29/07

Pennypack Creek Watershed Comprehensive Characterization Report
Appendix D • Continuous Dissolved Oxygen
D-38 • PCWCCR • Philadelphia Water Department.
June 2009
Saturation DO Accepted Rejected Hand Held DO
PP1680
DO
(m
g/L)
0
2
4
6
8
10
12
14
16
18
29OCT07 31OCT07 02NOV07 04NOV07 06NOV07
Figure D.75 Continuous Dissolved Oxygen (DO) with Calculated DO Saturation at site
PP1680, 10/29/07 to 11/06/07
Saturation DO Accepted Rejected Hand Held DO
PP1680
DO
(m
g/L)
0
2
4
6
8
10
12
14
16
18
06NOV07 08NOV07 10NOV07 12NOV07 14NOV07
Figure D.76 Continuous Dissolved Oxygen (DO) with Calculated DO Saturation at site
PP1680, 11/06/07 to 11/14/07

Pennypack Creek Watershed Comprehensive Characterization Report
Appendix D • Continuous Dissolved Oxygen
Philadelphia Water Department. • PCWCCR • D-39
June 2009
Saturation DO Accepted Rejected Hand Held DO
PP1680
DO
(m
g/L)
0
2
4
6
8
10
12
14
16
18
14NOV07 16NOV07 18NOV07 20NOV07 22NOV07
Figure D.77 Continuous Dissolved Oxygen (DO) with Calculated DO Saturation at site
PP1680, 11/14/07 to 11/22/07
Saturation DO Accepted Rejected Hand Held DO
PP1680
DO
(m
g/L)
0
2
4
6
8
10
12
14
16
18
10NOV07 12NOV07 14NOV07 16NOV07 18NOV07
Figure D.78 Continuous Dissolved Oxygen (DO) with Calculated DO Saturation at site
PP1680, 11/10/07 to 11/18/07
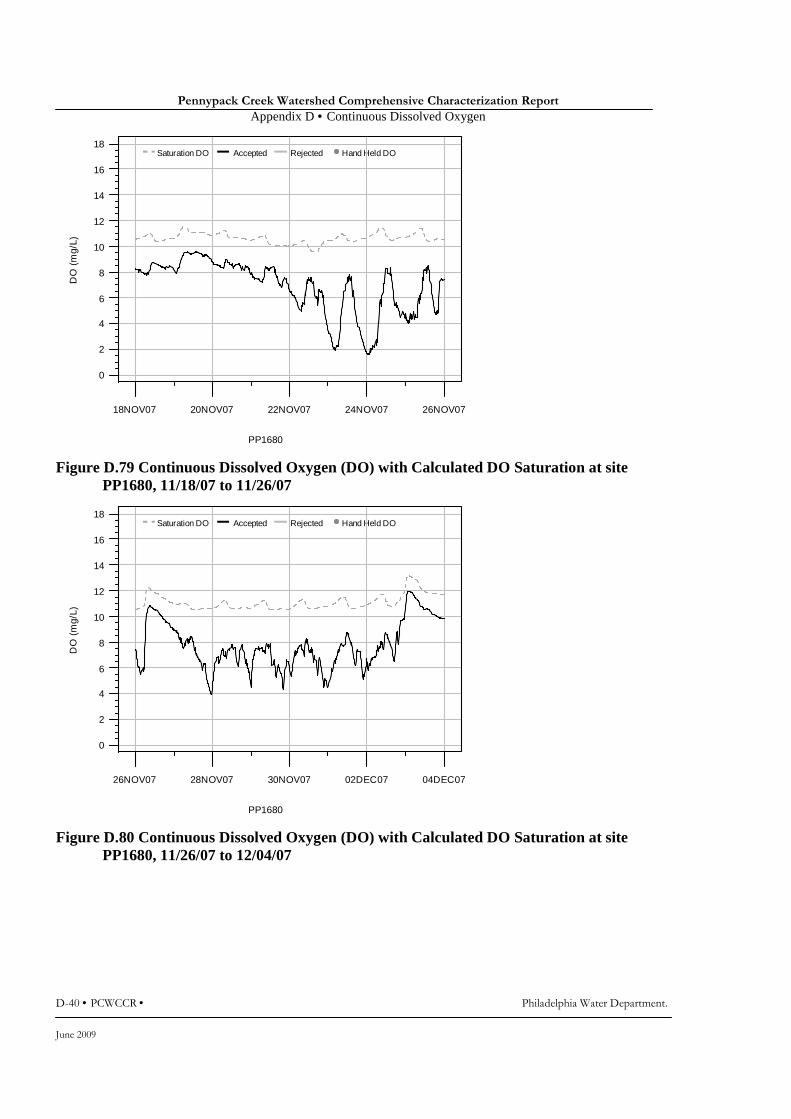
Pennypack Creek Watershed Comprehensive Characterization Report
Appendix D • Continuous Dissolved Oxygen
D-40 • PCWCCR • Philadelphia Water Department.
June 2009
Saturation DO Accepted Rejected Hand Held DO
PP1680
DO
(m
g/L)
0
2
4
6
8
10
12
14
16
18
18NOV07 20NOV07 22NOV07 24NOV07 26NOV07
Figure D.79 Continuous Dissolved Oxygen (DO) with Calculated DO Saturation at site
PP1680, 11/18/07 to 11/26/07
Saturation DO Accepted Rejected Hand Held DO
PP1680
DO
(m
g/L)
0
2
4
6
8
10
12
14
16
18
26NOV07 28NOV07 30NOV07 02DEC07 04DEC07
Figure D.80 Continuous Dissolved Oxygen (DO) with Calculated DO Saturation at site
PP1680, 11/26/07 to 12/04/07
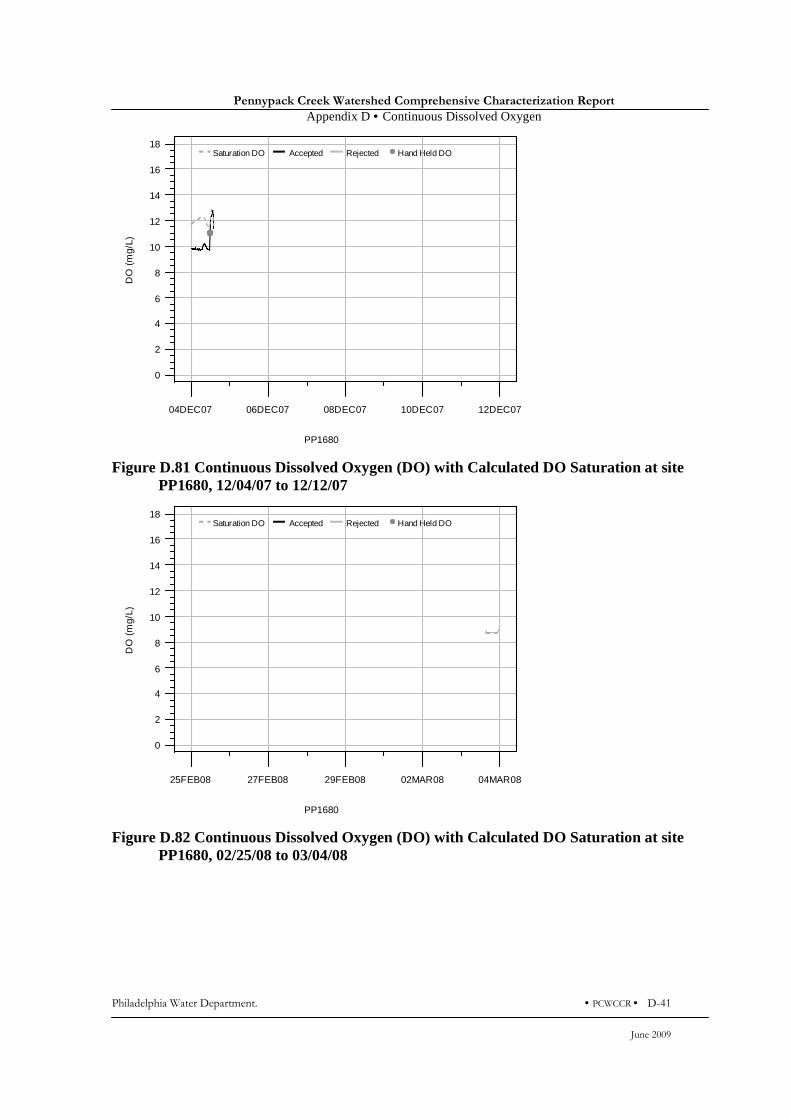
Pennypack Creek Watershed Comprehensive Characterization Report
Appendix D • Continuous Dissolved Oxygen
Philadelphia Water Department. • PCWCCR • D-41
June 2009
Saturation DO Accepted Rejected Hand Held DO
PP1680
DO
(m
g/L)
0
2
4
6
8
10
12
14
16
18
04DEC07 06DEC07 08DEC07 10DEC07 12DEC07
Figure D.81 Continuous Dissolved Oxygen (DO) with Calculated DO Saturation at site
PP1680, 12/04/07 to 12/12/07
Saturation DO Accepted Rejected Hand Held DO
PP1680
DO
(m
g/L)
0
2
4
6
8
10
12
14
16
18
25FEB08 27FEB08 29FEB08 02MAR08 04MAR08
Figure D.82 Continuous Dissolved Oxygen (DO) with Calculated DO Saturation at site
PP1680, 02/25/08 to 03/04/08

Pennypack Creek Watershed Comprehensive Characterization Report
Appendix D • Continuous Dissolved Oxygen
D-42 • PCWCCR • Philadelphia Water Department.
June 2009
Saturation DO Accepted Rejected Hand Held DO
PP1680
DO
(m
g/L)
0
2
4
6
8
10
12
14
16
18
04MAR08 06MAR08 08MAR08 10MAR08 12MAR08
Figure D.83 Continuous Dissolved Oxygen (DO) with Calculated DO Saturation at site
PP1680, 03/04/08 to 03/12/08
Saturation DO Accepted Rejected Hand Held DO
PP1680
DO
(m
g/L)
0
2
4
6
8
10
12
14
16
18
12MAR08 14MAR08 16MAR08 18MAR08 20MAR08
Figure D.84 Continuous Dissolved Oxygen (DO) with Calculated DO Saturation at site
PP1680, 03/12/08 to 03/20/08

Pennypack Creek Watershed Comprehensive Characterization Report
Appendix D • Continuous Dissolved Oxygen
Philadelphia Water Department. • PCWCCR • D-43
June 2009
Saturation DO Accepted Rejected Hand Held DO
PP1680
DO
(m
g/L)
0
2
4
6
8
10
12
14
16
18
25MAR08 27MAR08 29MAR08 31MAR08 02APR08
Figure D.85 Continuous Dissolved Oxygen (DO) with Calculated DO Saturation at site
PP1680, 03/25/08 to 04/02/08
Saturation DO Accepted Rejected Hand Held DO
PP1680
DO
(m
g/L)
0
2
4
6
8
10
12
14
16
18
02APR08 04APR08 06APR08 08APR08 10APR08
Figure D.86 Continuous Dissolved Oxygen (DO) with Calculated DO Saturation at site
PP1680, 04/02/08 to 04/10/08

Pennypack Creek Watershed Comprehensive Characterization Report
Appendix D • Continuous Dissolved Oxygen
D-44 • PCWCCR • Philadelphia Water Department.
June 2009
Saturation DO Accepted Rejected Hand Held DO
PP1680
DO
(m
g/L)
0
2
4
6
8
10
12
14
16
18
04APR08 06APR08 08APR08 10APR08 12APR08
Figure D.87 Continuous Dissolved Oxygen (DO) with Calculated DO Saturation at site
PP1680, 04/04/08 to 04/12/08
Saturation DO Accepted Rejected Hand Held DO
PP1680
DO
(m
g/L)
0
2
4
6
8
10
12
14
16
18
12APR08 14APR08 16APR08 18APR08 20APR08
Figure D.88 Continuous Dissolved Oxygen (DO) with Calculated DO Saturation at site
PP1680, 04/12/08 to 04/20/08
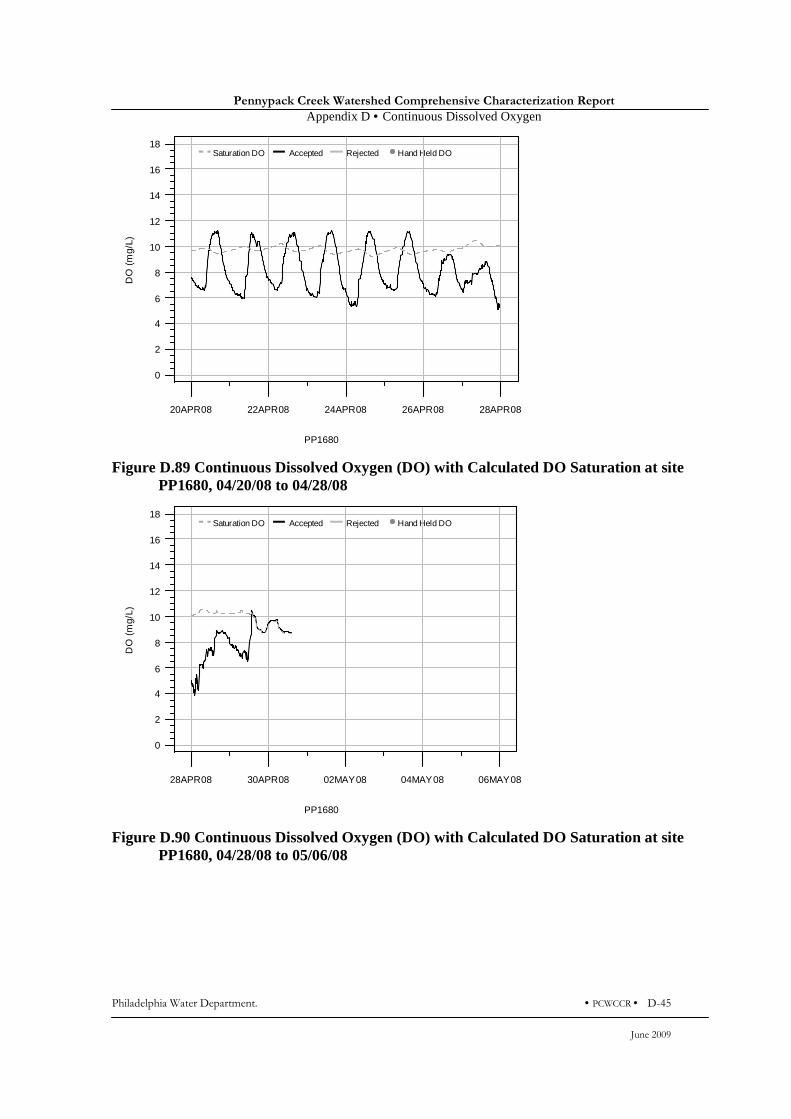
Pennypack Creek Watershed Comprehensive Characterization Report
Appendix D • Continuous Dissolved Oxygen
Philadelphia Water Department. • PCWCCR • D-45
June 2009
Saturation DO Accepted Rejected Hand Held DO
PP1680
DO
(m
g/L)
0
2
4
6
8
10
12
14
16
18
20APR08 22APR08 24APR08 26APR08 28APR08
Figure D.89 Continuous Dissolved Oxygen (DO) with Calculated DO Saturation at site
PP1680, 04/20/08 to 04/28/08
Saturation DO Accepted Rejected Hand Held DO
PP1680
DO
(m
g/L)
0
2
4
6
8
10
12
14
16
18
28APR08 30APR08 02MAY08 04MAY08 06MAY08
Figure D.90 Continuous Dissolved Oxygen (DO) with Calculated DO Saturation at site
PP1680, 04/28/08 to 05/06/08
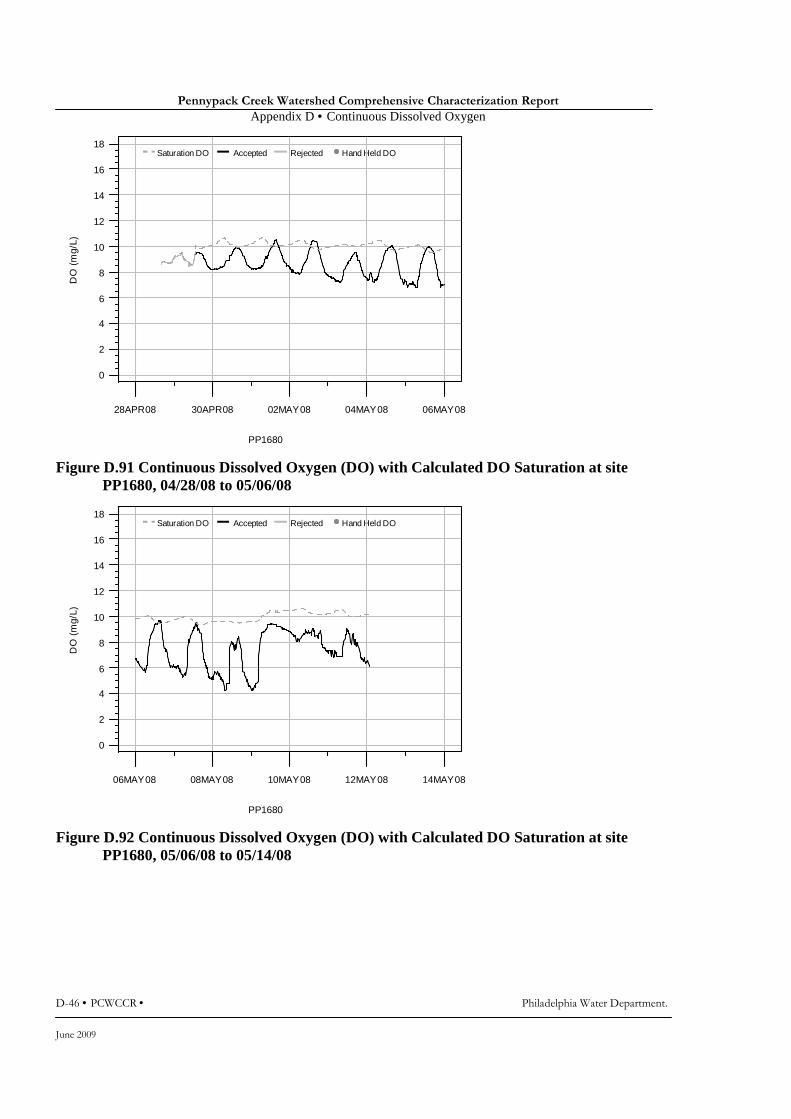
Pennypack Creek Watershed Comprehensive Characterization Report
Appendix D • Continuous Dissolved Oxygen
D-46 • PCWCCR • Philadelphia Water Department.
June 2009
Saturation DO Accepted Rejected Hand Held DO
PP1680
DO
(m
g/L)
0
2
4
6
8
10
12
14
16
18
28APR08 30APR08 02MAY08 04MAY08 06MAY08
Figure D.91 Continuous Dissolved Oxygen (DO) with Calculated DO Saturation at site
PP1680, 04/28/08 to 05/06/08
Saturation DO Accepted Rejected Hand Held DO
PP1680
DO
(m
g/L)
0
2
4
6
8
10
12
14
16
18
06MAY08 08MAY08 10MAY08 12MAY08 14MAY08
Figure D.92 Continuous Dissolved Oxygen (DO) with Calculated DO Saturation at site
PP1680, 05/06/08 to 05/14/08

Pennypack Creek Watershed Comprehensive Characterization Report
Appendix D • Continuous Dissolved Oxygen
Philadelphia Water Department. • PCWCCR • D-47
June 2009
Saturation DO Accepted Rejected Hand Held DO
PP1680
DO
(m
g/L)
0
2
4
6
8
10
12
14
16
18
09MAY08 11MAY08 13MAY08 15MAY08 17MAY08
Figure D.93 Continuous Dissolved Oxygen (DO) with Calculated DO Saturation at site
PP1680, 05/09/08 to 05/17/08
Saturation DO Accepted Rejected Hand Held DO
PP1680
DO
(m
g/L)
0
2
4
6
8
10
12
14
16
18
17MAY08 19MAY08 21MAY08 23MAY08 25MAY08
Figure D.94 Continuous Dissolved Oxygen (DO) with Calculated DO Saturation at site
PP1680, 05/17/08 to 05/25/08
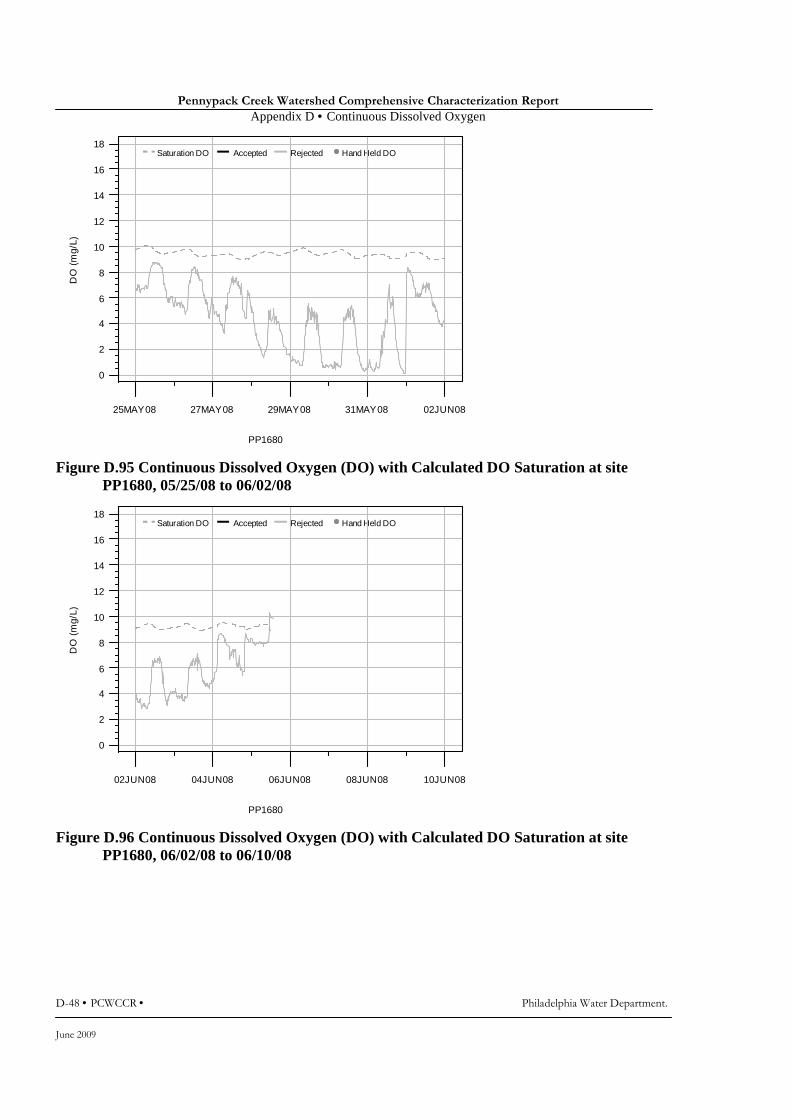
Pennypack Creek Watershed Comprehensive Characterization Report
Appendix D • Continuous Dissolved Oxygen
D-48 • PCWCCR • Philadelphia Water Department.
June 2009
Saturation DO Accepted Rejected Hand Held DO
PP1680
DO
(m
g/L)
0
2
4
6
8
10
12
14
16
18
25MAY08 27MAY08 29MAY08 31MAY08 02JUN08
Figure D.95 Continuous Dissolved Oxygen (DO) with Calculated DO Saturation at site
PP1680, 05/25/08 to 06/02/08
Saturation DO Accepted Rejected Hand Held DO
PP1680
DO
(m
g/L)
0
2
4
6
8
10
12
14
16
18
02JUN08 04JUN08 06JUN08 08JUN08 10JUN08
Figure D.96 Continuous Dissolved Oxygen (DO) with Calculated DO Saturation at site
PP1680, 06/02/08 to 06/10/08
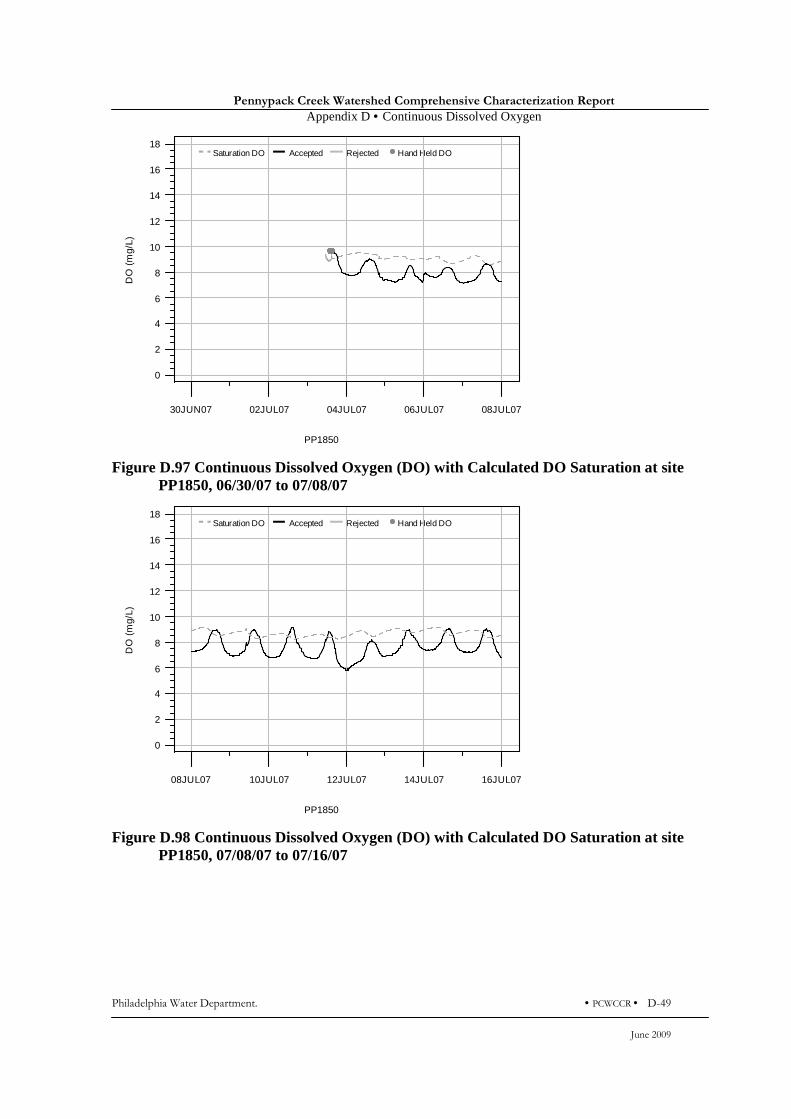
Pennypack Creek Watershed Comprehensive Characterization Report
Appendix D • Continuous Dissolved Oxygen
Philadelphia Water Department. • PCWCCR • D-49
June 2009
Saturation DO Accepted Rejected Hand Held DO
PP1850
DO
(m
g/L)
0
2
4
6
8
10
12
14
16
18
30JUN07 02JUL07 04JUL07 06JUL07 08JUL07
Figure D.97 Continuous Dissolved Oxygen (DO) with Calculated DO Saturation at site
PP1850, 06/30/07 to 07/08/07
Saturation DO Accepted Rejected Hand Held DO
PP1850
DO
(m
g/L)
0
2
4
6
8
10
12
14
16
18
08JUL07 10JUL07 12JUL07 14JUL07 16JUL07
Figure D.98 Continuous Dissolved Oxygen (DO) with Calculated DO Saturation at site
PP1850, 07/08/07 to 07/16/07

Pennypack Creek Watershed Comprehensive Characterization Report
Appendix D • Continuous Dissolved Oxygen
D-50 • PCWCCR • Philadelphia Water Department.
June 2009
Saturation DO Accepted Rejected Hand Held DO
PP1850
DO
(m
g/L)
0
2
4
6
8
10
12
14
16
18
16JUL07 18JUL07 20JUL07 22JUL07 24JUL07
Figure D.99 Continuous Dissolved Oxygen (DO) with Calculated DO Saturation at site
PP1850, 07/16/07 to 07/24/07
Saturation DO Accepted Rejected Hand Held DO
PP1850
DO
(m
g/L)
0
2
4
6
8
10
12
14
16
18
24JUL07 26JUL07 28JUL07 30JUL07 01AUG07
Figure D.100 Continuous Dissolved Oxygen (DO) with Calculated DO Saturation at site
PP1850, 07/24/07 to 08/01/07

Pennypack Creek Watershed Comprehensive Characterization Report
Appendix D • Continuous Dissolved Oxygen
Philadelphia Water Department. • PCWCCR • D-51
June 2009
Saturation DO Accepted Rejected Hand Held DO
PP1850
DO
(m
g/L)
0
2
4
6
8
10
12
14
16
18
21JUL07 23JUL07 25JUL07 27JUL07 29JUL07
Figure D.101 Continuous Dissolved Oxygen (DO) with Calculated DO Saturation at site
PP1850, 07/21/07 to 07/29/07
Saturation DO Accepted Rejected Hand Held DO
PP1850
DO
(m
g/L)
0
2
4
6
8
10
12
14
16
18
29JUL07 31JUL07 02AUG07 04AUG07 06AUG07
Figure D.102 Continuous Dissolved Oxygen (DO) with Calculated DO Saturation at site
PP1850, 07/29/07 to 08/06/07
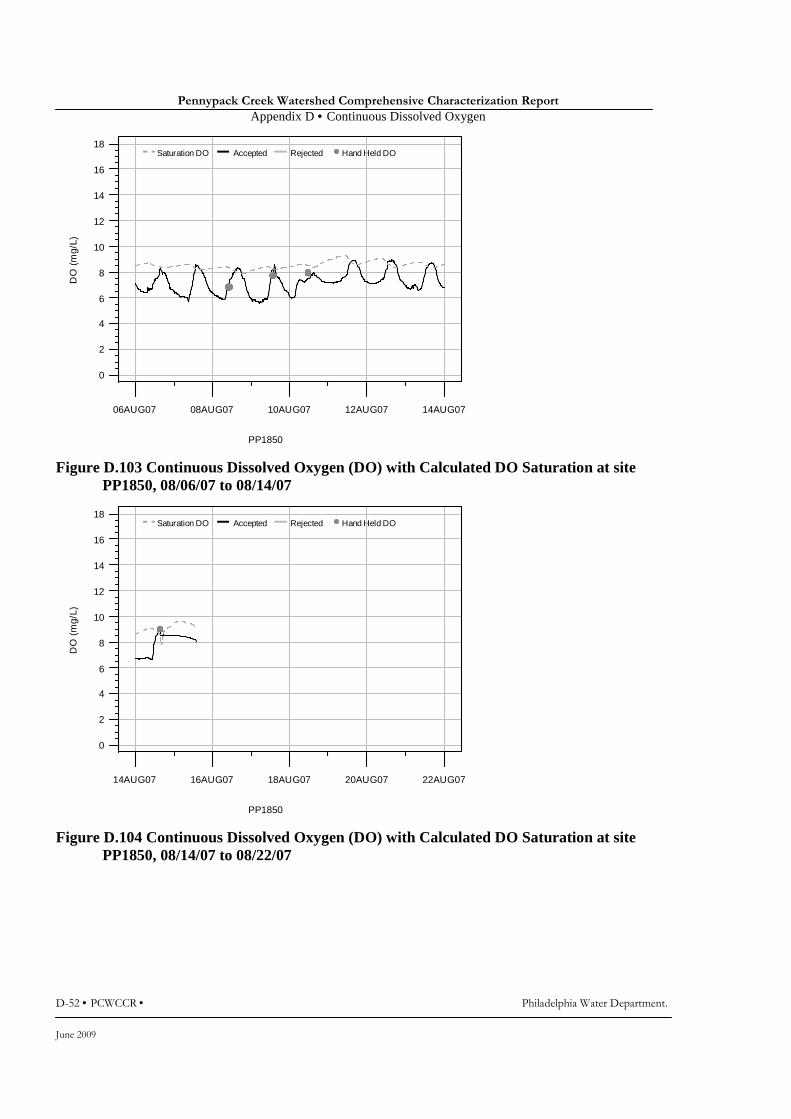
Pennypack Creek Watershed Comprehensive Characterization Report
Appendix D • Continuous Dissolved Oxygen
D-52 • PCWCCR • Philadelphia Water Department.
June 2009
Saturation DO Accepted Rejected Hand Held DO
PP1850
DO
(m
g/L)
0
2
4
6
8
10
12
14
16
18
06AUG07 08AUG07 10AUG07 12AUG07 14AUG07
Figure D.103 Continuous Dissolved Oxygen (DO) with Calculated DO Saturation at site
PP1850, 08/06/07 to 08/14/07
Saturation DO Accepted Rejected Hand Held DO
PP1850
DO
(m
g/L)
0
2
4
6
8
10
12
14
16
18
14AUG07 16AUG07 18AUG07 20AUG07 22AUG07
Figure D.104 Continuous Dissolved Oxygen (DO) with Calculated DO Saturation at site
PP1850, 08/14/07 to 08/22/07

Pennypack Creek Watershed Comprehensive Characterization Report
Appendix D • Continuous Dissolved Oxygen
Philadelphia Water Department. • PCWCCR • D-53
June 2009
Saturation DO Accepted Rejected Hand Held DO
PP1850
DO
(m
g/L)
0
2
4
6
8
10
12
14
16
18
11AUG07 13AUG07 15AUG07 17AUG07 19AUG07
Figure D.105 Continuous Dissolved Oxygen (DO) with Calculated DO Saturation at site
PP1850, 08/11/07 to 08/19/07
Saturation DO Accepted Rejected Hand Held DO
PP1850
DO
(m
g/L)
0
2
4
6
8
10
12
14
16
18
19AUG07 21AUG07 23AUG07 25AUG07 27AUG07
Figure D.106 Continuous Dissolved Oxygen (DO) with Calculated DO Saturation at site
PP1850, 08/19/07 to 08/27/07
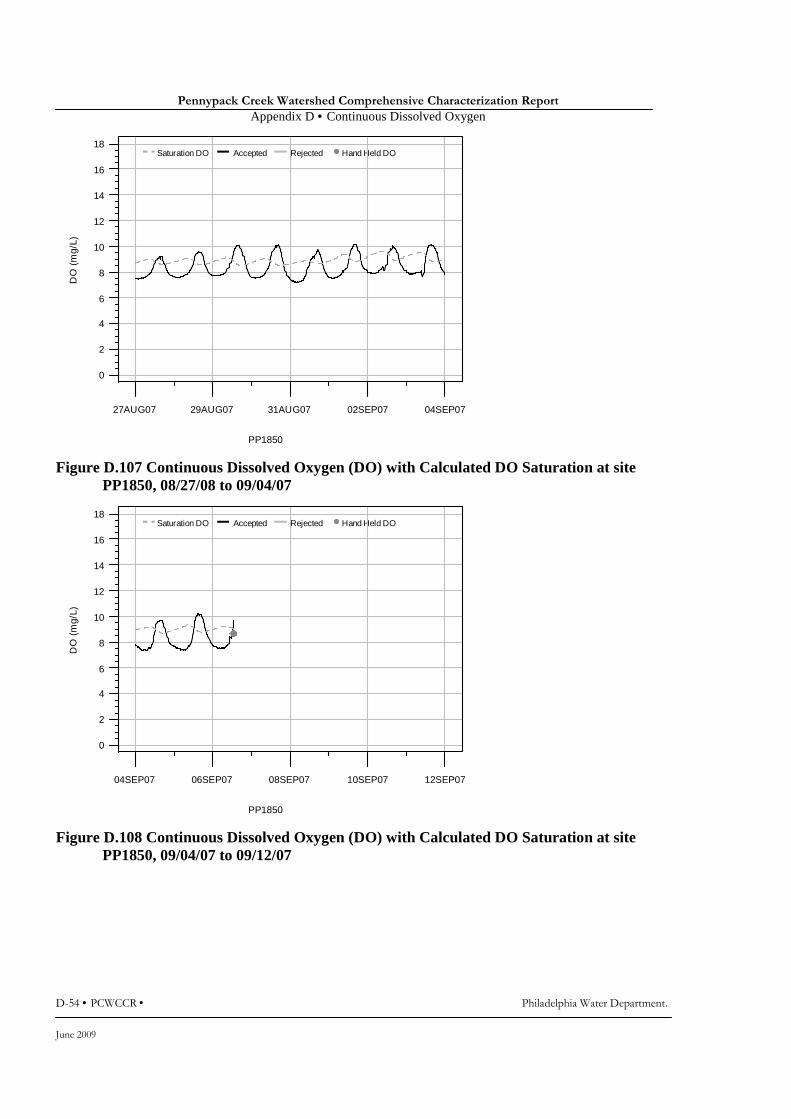
Pennypack Creek Watershed Comprehensive Characterization Report
Appendix D • Continuous Dissolved Oxygen
D-54 • PCWCCR • Philadelphia Water Department.
June 2009
Saturation DO Accepted Rejected Hand Held DO
PP1850
DO
(m
g/L)
0
2
4
6
8
10
12
14
16
18
27AUG07 29AUG07 31AUG07 02SEP07 04SEP07
Figure D.107 Continuous Dissolved Oxygen (DO) with Calculated DO Saturation at site
PP1850, 08/27/08 to 09/04/07
Saturation DO Accepted Rejected Hand Held DO
PP1850
DO
(m
g/L)
0
2
4
6
8
10
12
14
16
18
04SEP07 06SEP07 08SEP07 10SEP07 12SEP07
Figure D.108 Continuous Dissolved Oxygen (DO) with Calculated DO Saturation at site
PP1850, 09/04/07 to 09/12/07

Pennypack Creek Watershed Comprehensive Characterization Report
Appendix D • Continuous Dissolved Oxygen
Philadelphia Water Department. • PCWCCR • D-55
June 2009
Saturation DO Accepted Rejected Hand Held DO
PP1850
DO
(m
g/L)
0
2
4
6
8
10
12
14
16
18
04SEP07 06SEP07 08SEP07 10SEP07 12SEP07
Figure D.109 Continuous Dissolved Oxygen (DO) with Calculated DO Saturation at site
PP1850, 09/04/07 to 09/12/07
Saturation DO Accepted Rejected Hand Held DO
PP1850
DO
(m
g/L)
0
2
4
6
8
10
12
14
16
18
12SEP07 14SEP07 16SEP07 18SEP07 20SEP07
Figure D.110 Continuous Dissolved Oxygen (DO) with Calculated DO Saturation at site
PP1850, 09/12/07 to 09/20/07

Pennypack Creek Watershed Comprehensive Characterization Report
Appendix D • Continuous Dissolved Oxygen
D-56 • PCWCCR • Philadelphia Water Department.
June 2009
Saturation DO Accepted Rejected Hand Held DO
PP1850
DO
(m
g/L)
0
2
4
6
8
10
12
14
16
18
20SEP07 22SEP07 24SEP07 26SEP07 28SEP07
Figure D.111 Continuous Dissolved Oxygen (DO) with Calculated DO Saturation at site
PP1850, 09/20/07 to 09/28/07
Saturation DO Accepted Rejected Hand Held DO
PP1850
DO
(m
g/L)
0
2
4
6
8
10
12
14
16
18
28SEP07 30SEP07 02OCT07 04OCT07 06OCT07
Figure D.112 Continuous Dissolved Oxygen (DO) with Calculated DO Saturation at site
PP1850, 09/28/07 to 10/06/07
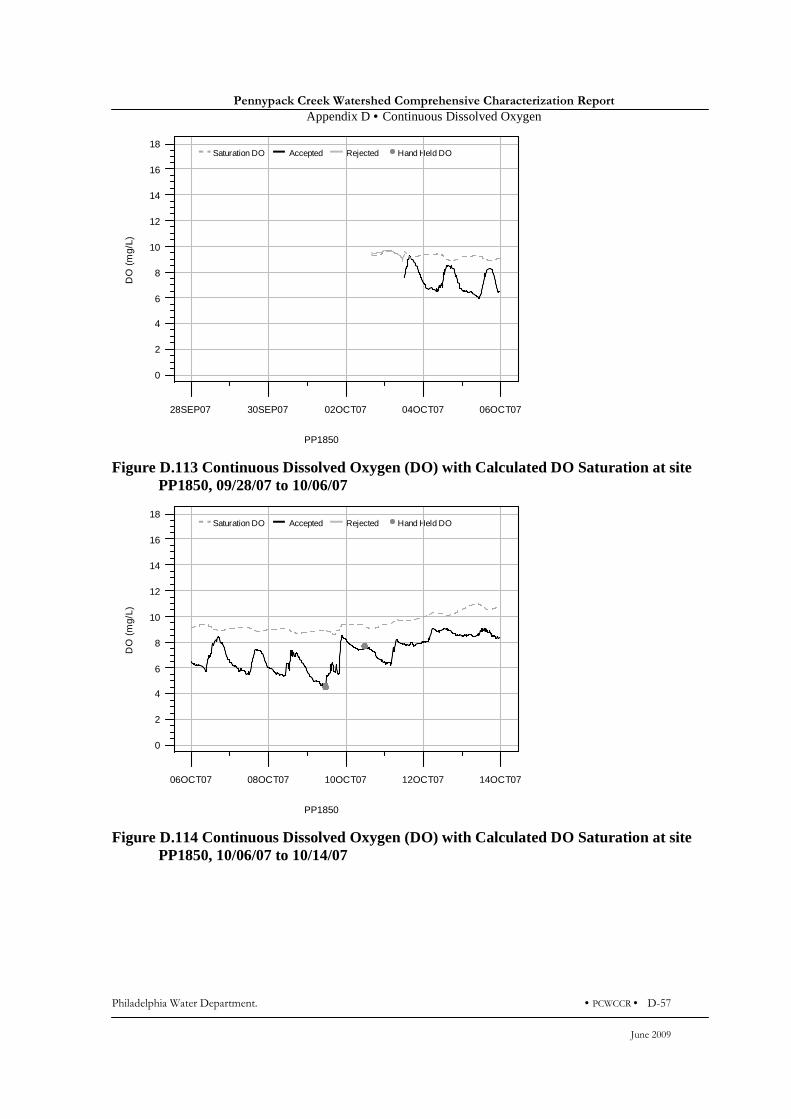
Pennypack Creek Watershed Comprehensive Characterization Report
Appendix D • Continuous Dissolved Oxygen
Philadelphia Water Department. • PCWCCR • D-57
June 2009
Saturation DO Accepted Rejected Hand Held DO
PP1850
DO
(m
g/L)
0
2
4
6
8
10
12
14
16
18
28SEP07 30SEP07 02OCT07 04OCT07 06OCT07
Figure D.113 Continuous Dissolved Oxygen (DO) with Calculated DO Saturation at site
PP1850, 09/28/07 to 10/06/07
Saturation DO Accepted Rejected Hand Held DO
PP1850
DO
(m
g/L)
0
2
4
6
8
10
12
14
16
18
06OCT07 08OCT07 10OCT07 12OCT07 14OCT07
Figure D.114 Continuous Dissolved Oxygen (DO) with Calculated DO Saturation at site
PP1850, 10/06/07 to 10/14/07

Pennypack Creek Watershed Comprehensive Characterization Report
Appendix D • Continuous Dissolved Oxygen
D-58 • PCWCCR • Philadelphia Water Department.
June 2009
Saturation DO Accepted Rejected Hand Held DO
PP1850
DO
(m
g/L)
0
2
4
6
8
10
12
14
16
18
14OCT07 16OCT07 18OCT07 20OCT07 22OCT07
Figure D.115 Continuous Dissolved Oxygen (DO) with Calculated DO Saturation at site
PP1850, 10/14/07 to 10/22/07
Saturation DO Accepted Rejected Hand Held DO
PP1850
DO
(m
g/L)
0
2
4
6
8
10
12
14
16
18
22OCT07 24OCT07 26OCT07 28OCT07 30OCT07
Figure D.116 Continuous Dissolved Oxygen (DO) with Calculated DO Saturation at site
PP1850, 10/22/07 to 10/30/07
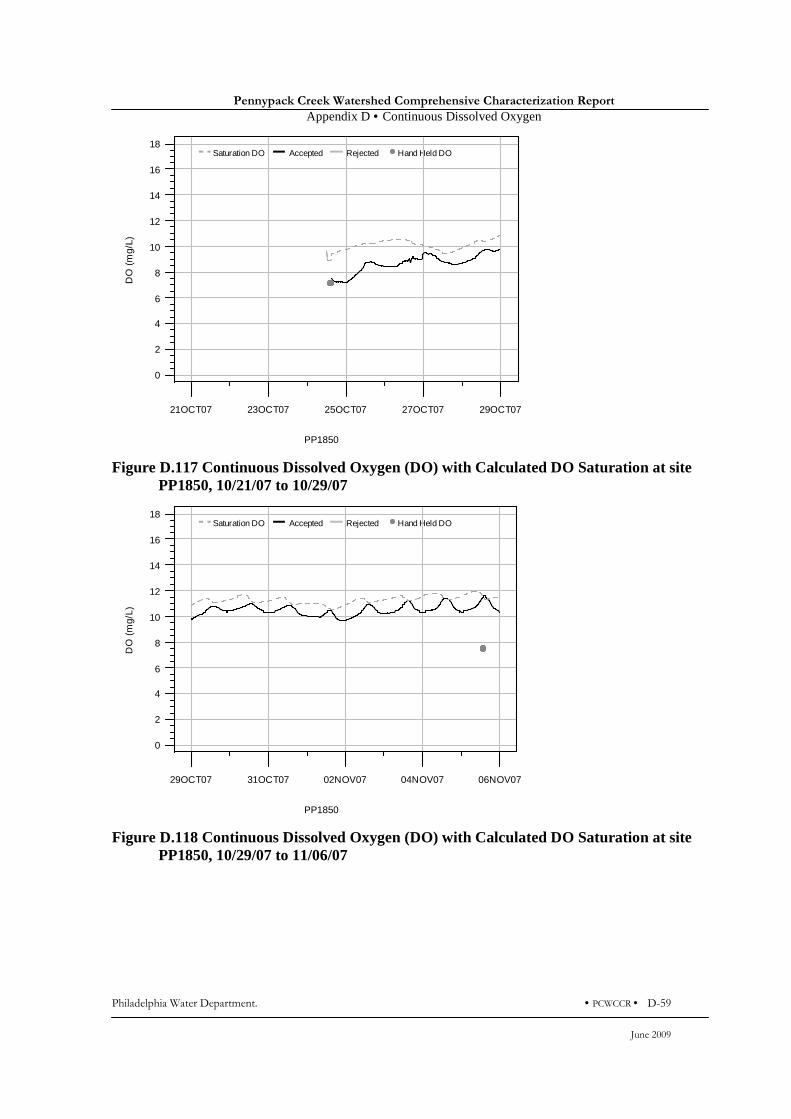
Pennypack Creek Watershed Comprehensive Characterization Report
Appendix D • Continuous Dissolved Oxygen
Philadelphia Water Department. • PCWCCR • D-59
June 2009
Saturation DO Accepted Rejected Hand Held DO
PP1850
DO
(m
g/L)
0
2
4
6
8
10
12
14
16
18
21OCT07 23OCT07 25OCT07 27OCT07 29OCT07
Figure D.117 Continuous Dissolved Oxygen (DO) with Calculated DO Saturation at site
PP1850, 10/21/07 to 10/29/07
Saturation DO Accepted Rejected Hand Held DO
PP1850
DO
(m
g/L)
0
2
4
6
8
10
12
14
16
18
29OCT07 31OCT07 02NOV07 04NOV07 06NOV07
Figure D.118 Continuous Dissolved Oxygen (DO) with Calculated DO Saturation at site
PP1850, 10/29/07 to 11/06/07
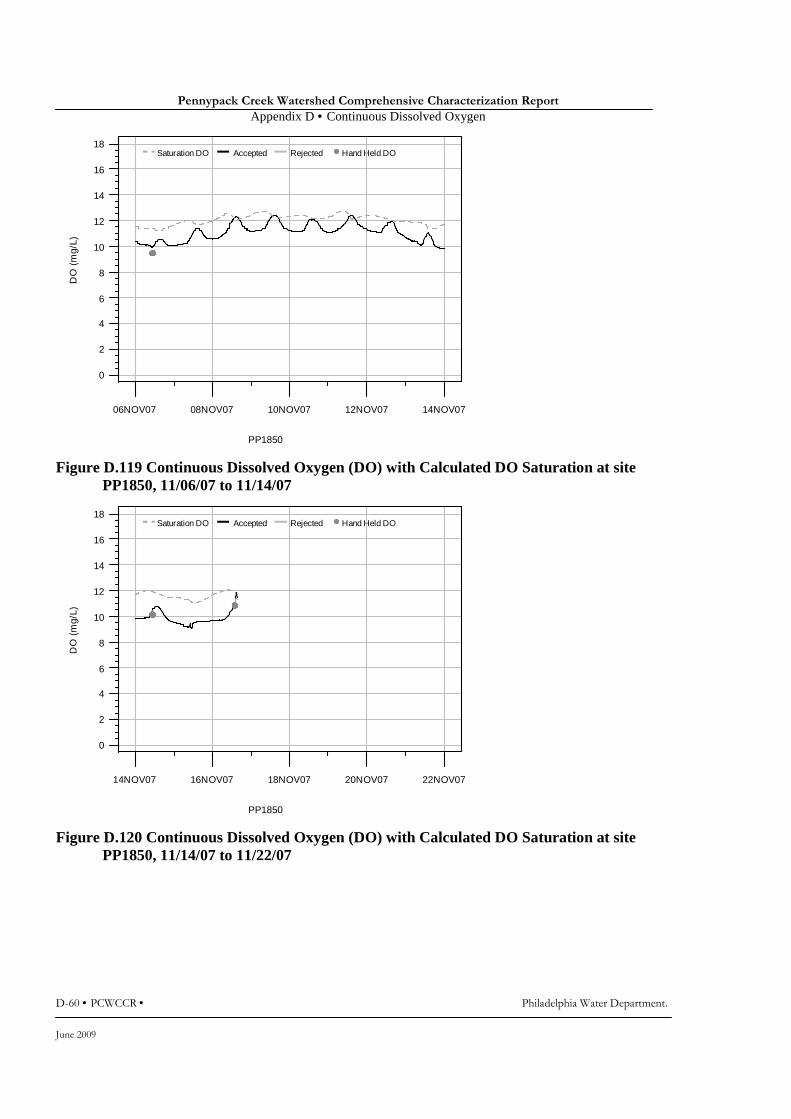
Pennypack Creek Watershed Comprehensive Characterization Report
Appendix D • Continuous Dissolved Oxygen
D-60 • PCWCCR • Philadelphia Water Department.
June 2009
Saturation DO Accepted Rejected Hand Held DO
PP1850
DO
(m
g/L)
0
2
4
6
8
10
12
14
16
18
06NOV07 08NOV07 10NOV07 12NOV07 14NOV07
Figure D.119 Continuous Dissolved Oxygen (DO) with Calculated DO Saturation at site
PP1850, 11/06/07 to 11/14/07
Saturation DO Accepted Rejected Hand Held DO
PP1850
DO
(m
g/L)
0
2
4
6
8
10
12
14
16
18
14NOV07 16NOV07 18NOV07 20NOV07 22NOV07
Figure D.120 Continuous Dissolved Oxygen (DO) with Calculated DO Saturation at site
PP1850, 11/14/07 to 11/22/07

Pennypack Creek Watershed Comprehensive Characterization Report
Appendix D • Continuous Dissolved Oxygen
Philadelphia Water Department. • PCWCCR • D-61
June 2009
Saturation DO Accepted Rejected Hand Held DO
PP1850
DO
(m
g/L)
0
2
4
6
8
10
12
14
16
18
10NOV07 12NOV07 14NOV07 16NOV07 18NOV07
Figure D.121 Continuous Dissolved Oxygen (DO) with Calculated DO Saturation at site
PP1850, 11/10/07 to 11/18/07
Saturation DO Accepted Rejected Hand Held DO
PP1850
DO
(m
g/L)
0
2
4
6
8
10
12
14
16
18
18NOV07 20NOV07 22NOV07 24NOV07 26NOV07
Figure D.122 Continuous Dissolved Oxygen (DO) with Calculated DO Saturation at site
PP1850, 11/18/07 to 11/26/07

Pennypack Creek Watershed Comprehensive Characterization Report
Appendix D • Continuous Dissolved Oxygen
D-62 • PCWCCR • Philadelphia Water Department.
June 2009
Saturation DO Accepted Rejected Hand Held DO
PP1850
DO
(m
g/L)
0
2
4
6
8
10
12
14
16
18
26NOV07 28NOV07 30NOV07 02DEC07 04DEC07
Figure D.123 Continuous Dissolved Oxygen (DO) with Calculated DO Saturation at site
PP1850, 11/26/07 to 12/04/07
Saturation DO Accepted Rejected Hand Held DO
PP1850
DO
(m
g/L)
0
2
4
6
8
10
12
14
16
18
04DEC07 06DEC07 08DEC07 10DEC07 12DEC07
Figure D.124 Continuous Dissolved Oxygen (DO) with Calculated DO Saturation at site
PP1850, 12/04/07 to 12/12/07

Pennypack Creek Watershed Comprehensive Characterization Report
Appendix D • Continuous Dissolved Oxygen
Philadelphia Water Department. • PCWCCR • D-63
June 2009
Saturation DO Accepted Rejected Hand Held DO
PP1850
DO
(m
g/L)
0
2
4
6
8
10
12
14
16
18
25FEB08 27FEB08 29FEB08 02MAR08 04MAR08
Figure D.125 Continuous Dissolved Oxygen (DO) with Calculated DO Saturation at site
PP1850, 02/25/08 to 03/04/08
Saturation DO Accepted Rejected Hand Held DO
PP1850
DO
(m
g/L)
0
2
4
6
8
10
12
14
16
18
04MAR08 06MAR08 08MAR08 10MAR08 12MAR08
Figure D.126 Continuous Dissolved Oxygen (DO) with Calculated DO Saturation at site
PP1850, 03/04/08 to 03/12/08

Pennypack Creek Watershed Comprehensive Characterization Report
Appendix D • Continuous Dissolved Oxygen
D-64 • PCWCCR • Philadelphia Water Department.
June 2009
Saturation DO Accepted Rejected Hand Held DO
PP1850
DO
(m
g/L)
0
2
4
6
8
10
12
14
16
18
12MAR08 14MAR08 16MAR08 18MAR08 20MAR08
Figure D.127 Continuous Dissolved Oxygen (DO) with Calculated DO Saturation at site
PP1850, 03/12/08 to 03/20/08
Saturation DO Accepted Rejected Hand Held DO
PP1850
DO
(m
g/L)
0
2
4
6
8
10
12
14
16
18
25MAR08 27MAR08 29MAR08 31MAR08 02APR08
Figure D.128 Continuous Dissolved Oxygen (DO) with Calculated DO Saturation at site
PP1850, 03/25/08 to 04/02/08
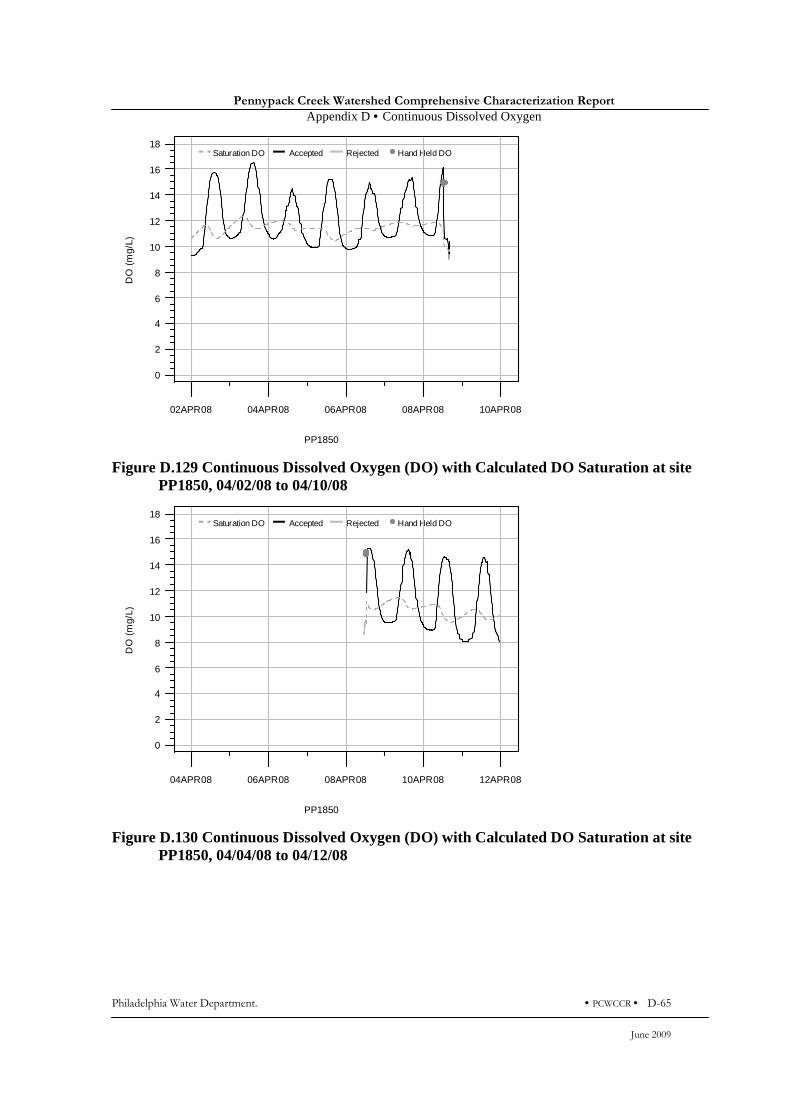
Pennypack Creek Watershed Comprehensive Characterization Report
Appendix D • Continuous Dissolved Oxygen
Philadelphia Water Department. • PCWCCR • D-65
June 2009
Saturation DO Accepted Rejected Hand Held DO
PP1850
DO
(m
g/L)
0
2
4
6
8
10
12
14
16
18
02APR08 04APR08 06APR08 08APR08 10APR08
Figure D.129 Continuous Dissolved Oxygen (DO) with Calculated DO Saturation at site
PP1850, 04/02/08 to 04/10/08
Saturation DO Accepted Rejected Hand Held DO
PP1850
DO
(m
g/L)
0
2
4
6
8
10
12
14
16
18
04APR08 06APR08 08APR08 10APR08 12APR08
Figure D.130 Continuous Dissolved Oxygen (DO) with Calculated DO Saturation at site
PP1850, 04/04/08 to 04/12/08

Pennypack Creek Watershed Comprehensive Characterization Report
Appendix D • Continuous Dissolved Oxygen
D-66 • PCWCCR • Philadelphia Water Department.
June 2009
Saturation DO Accepted Rejected Hand Held DO
PP1850
DO
(m
g/L)
0
2
4
6
8
10
12
14
16
18
12APR08 14APR08 16APR08 18APR08 20APR08
Figure D.131 Continuous Dissolved Oxygen (DO) with Calculated DO Saturation at site
PP1850, 04/12/08 to 04/20/08
Saturation DO Accepted Rejected Hand Held DO
PP1850
DO
(m
g/L)
0
2
4
6
8
10
12
14
16
18
20APR08 22APR08 24APR08 26APR08 28APR08
Figure D.132 Continuous Dissolved Oxygen (DO) with Calculated DO Saturation at site
PP1850, 04/20/08 to 04/28/08
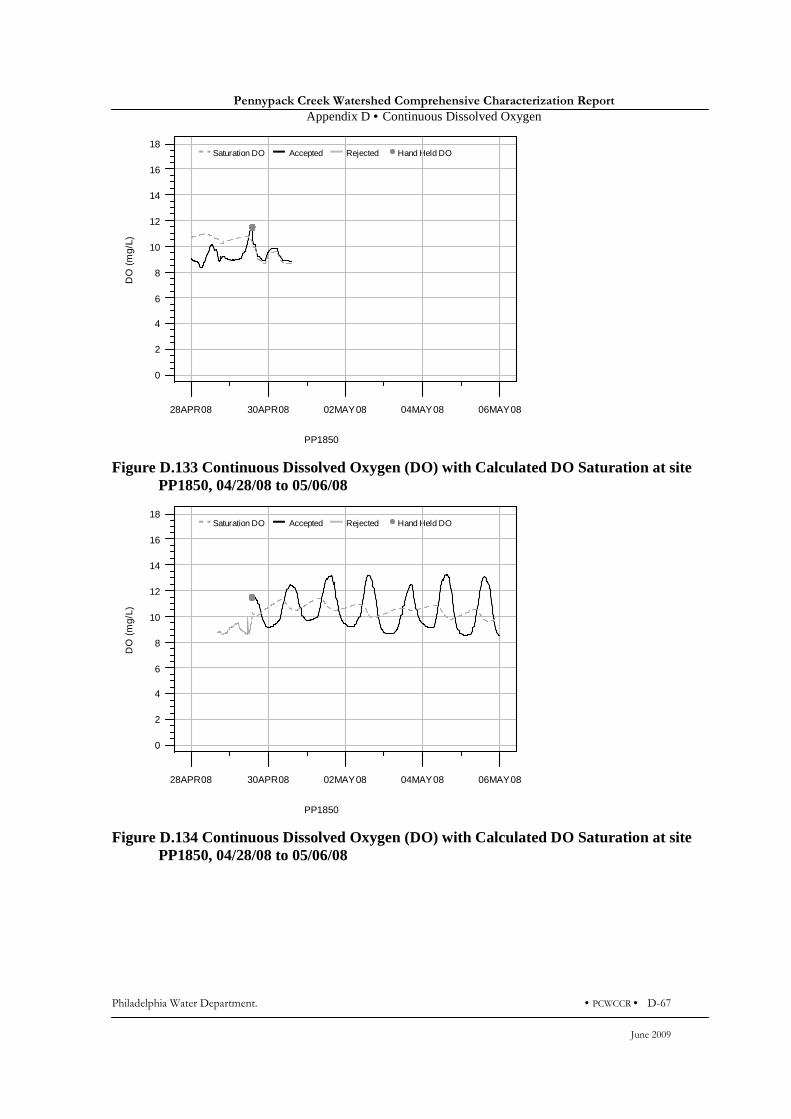
Pennypack Creek Watershed Comprehensive Characterization Report
Appendix D • Continuous Dissolved Oxygen
Philadelphia Water Department. • PCWCCR • D-67
June 2009
Saturation DO Accepted Rejected Hand Held DO
PP1850
DO
(m
g/L)
0
2
4
6
8
10
12
14
16
18
28APR08 30APR08 02MAY08 04MAY08 06MAY08
Figure D.133 Continuous Dissolved Oxygen (DO) with Calculated DO Saturation at site
PP1850, 04/28/08 to 05/06/08
Saturation DO Accepted Rejected Hand Held DO
PP1850
DO
(m
g/L)
0
2
4
6
8
10
12
14
16
18
28APR08 30APR08 02MAY08 04MAY08 06MAY08
Figure D.134 Continuous Dissolved Oxygen (DO) with Calculated DO Saturation at site
PP1850, 04/28/08 to 05/06/08
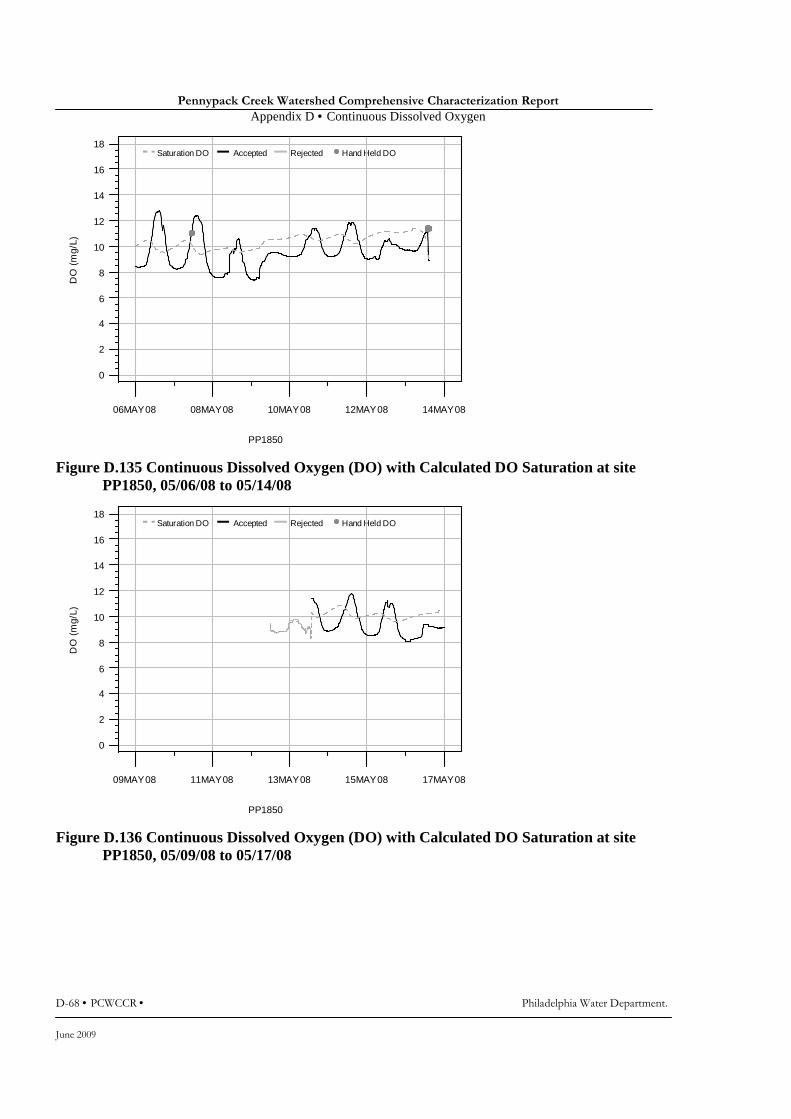
Pennypack Creek Watershed Comprehensive Characterization Report
Appendix D • Continuous Dissolved Oxygen
D-68 • PCWCCR • Philadelphia Water Department.
June 2009
Saturation DO Accepted Rejected Hand Held DO
PP1850
DO
(m
g/L)
0
2
4
6
8
10
12
14
16
18
06MAY08 08MAY08 10MAY08 12MAY08 14MAY08
Figure D.135 Continuous Dissolved Oxygen (DO) with Calculated DO Saturation at site
PP1850, 05/06/08 to 05/14/08
Saturation DO Accepted Rejected Hand Held DO
PP1850
DO
(m
g/L)
0
2
4
6
8
10
12
14
16
18
09MAY08 11MAY08 13MAY08 15MAY08 17MAY08
Figure D.136 Continuous Dissolved Oxygen (DO) with Calculated DO Saturation at site
PP1850, 05/09/08 to 05/17/08
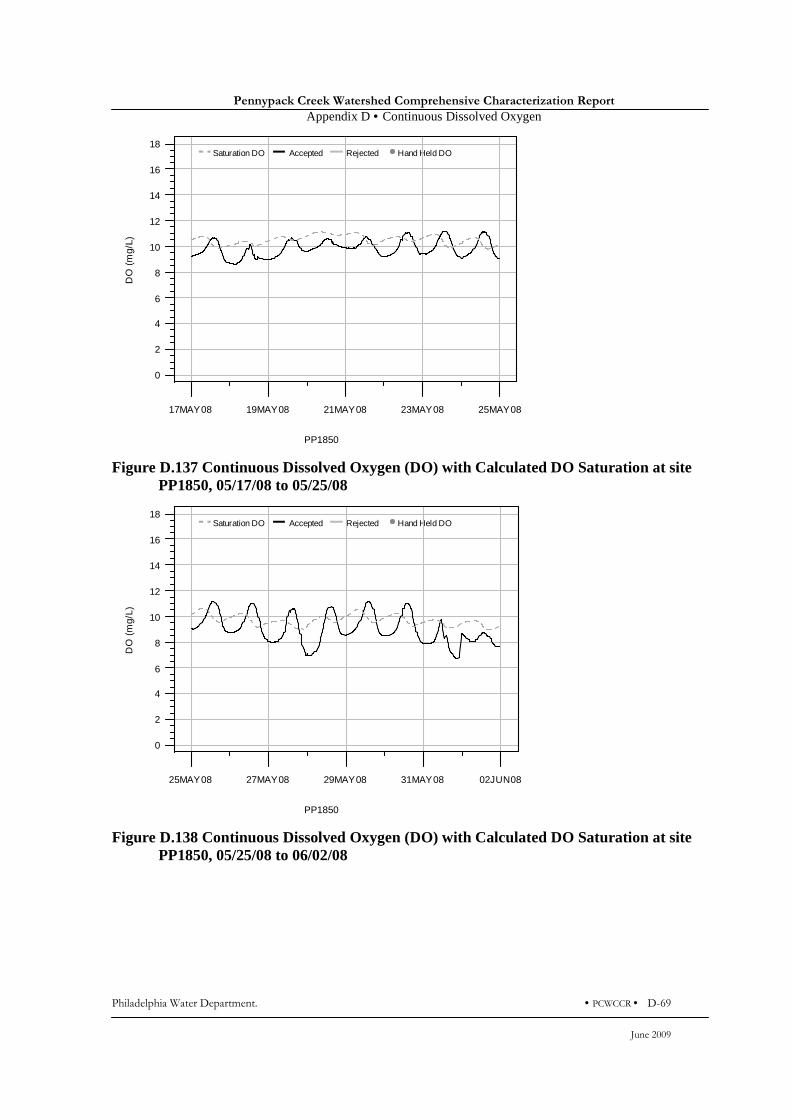
Pennypack Creek Watershed Comprehensive Characterization Report
Appendix D • Continuous Dissolved Oxygen
Philadelphia Water Department. • PCWCCR • D-69
June 2009
Saturation DO Accepted Rejected Hand Held DO
PP1850
DO
(m
g/L)
0
2
4
6
8
10
12
14
16
18
17MAY08 19MAY08 21MAY08 23MAY08 25MAY08
Figure D.137 Continuous Dissolved Oxygen (DO) with Calculated DO Saturation at site
PP1850, 05/17/08 to 05/25/08
Saturation DO Accepted Rejected Hand Held DO
PP1850
DO
(m
g/L)
0
2
4
6
8
10
12
14
16
18
25MAY08 27MAY08 29MAY08 31MAY08 02JUN08
Figure D.138 Continuous Dissolved Oxygen (DO) with Calculated DO Saturation at site
PP1850, 05/25/08 to 06/02/08

Pennypack Creek Watershed Comprehensive Characterization Report
Appendix D • Continuous Dissolved Oxygen
D-70 • PCWCCR • Philadelphia Water Department.
June 2009
Saturation DO Accepted Rejected Hand Held DO
PP1850
DO
(m
g/L)
0
2
4
6
8
10
12
14
16
18
02JUN08 04JUN08 06JUN08 08JUN08 10JUN08
Figure D.139 Continuous Dissolved Oxygen (DO) with Calculated DO Saturation at site
PP1850, 06/02/08 to 06/10/08
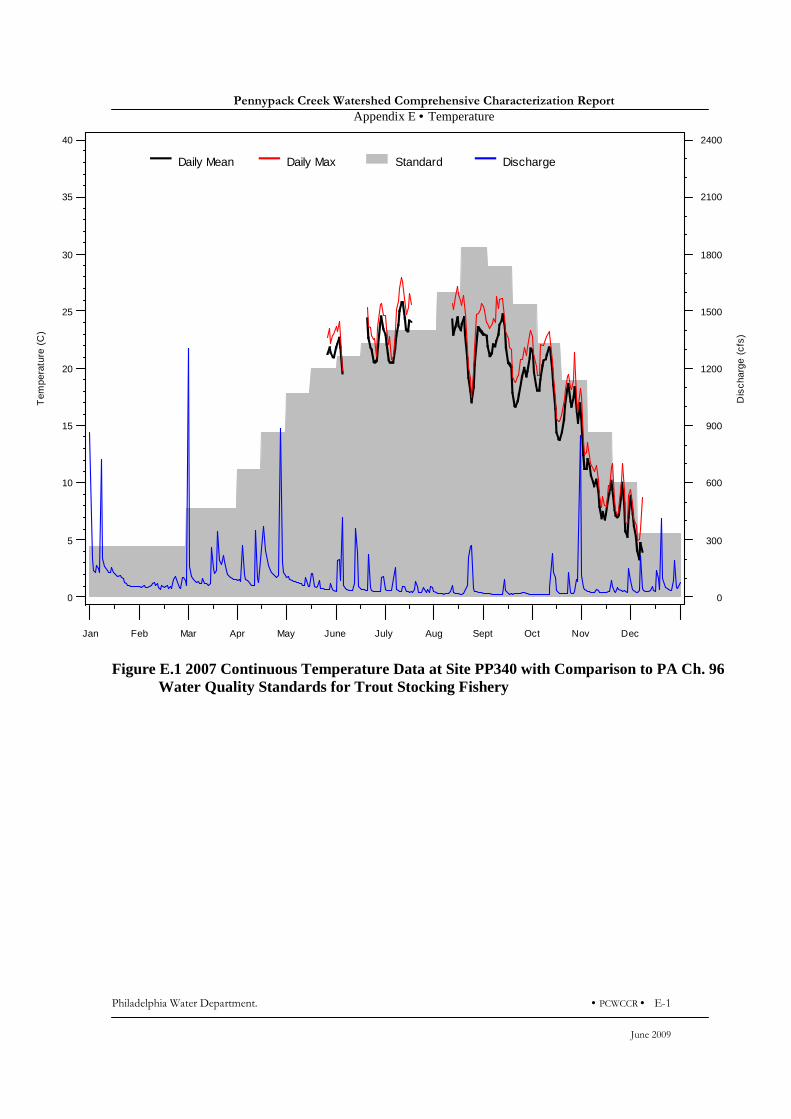
Pennypack Creek Watershed Comprehensive Characterization Report
Appendix E • Temperature
Philadelphia Water Department. • PCWCCR • E-1
June 2009
Figure E.1 2007 Continuous Temperature Data at Site PP340 with Comparison to PA Ch. 96
Water Quality Standards for Trout Stocking Fishery
Daily Mean Daily Max Standard Discharge
Tem
pera
ture
(C
)
0
5
10
15
20
25
30
35
40
Jan Feb Mar Apr May June July Aug Sept Oct Nov Dec
Dis
char
ge (
cfs)
0
300
600
900
1200
1500
1800
2100
2400
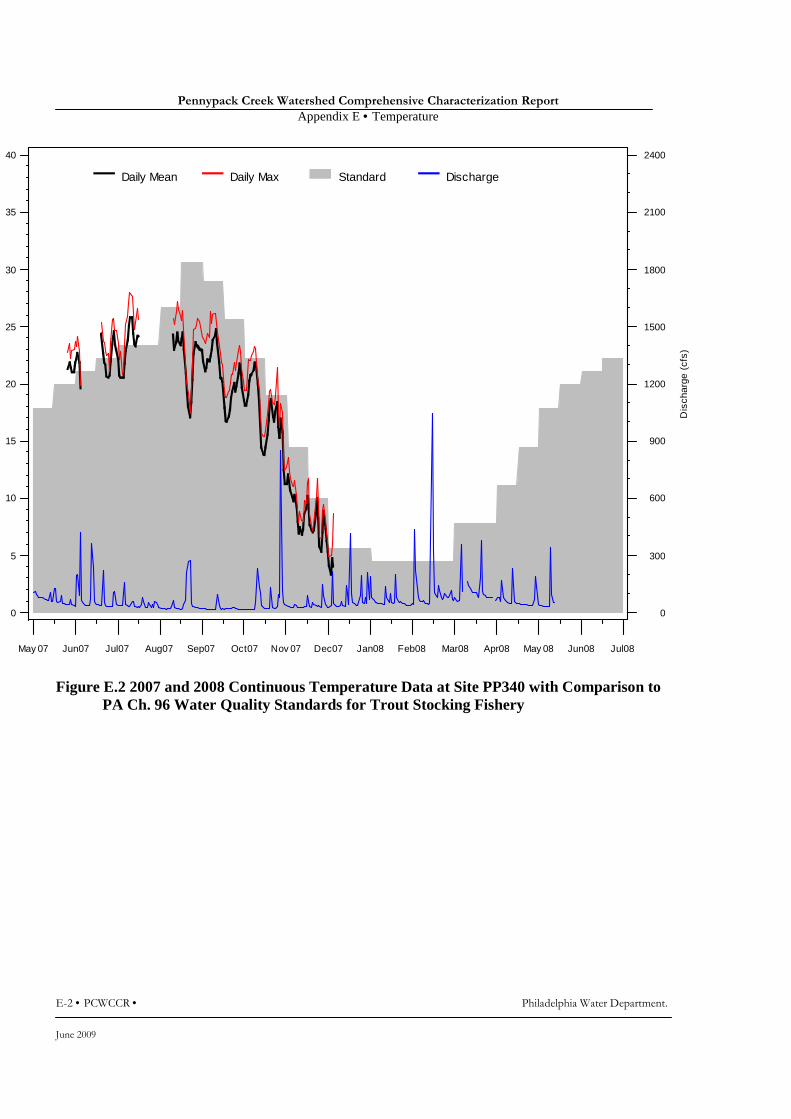
Pennypack Creek Watershed Comprehensive Characterization Report
Appendix E • Temperature
E-2 • PCWCCR • Philadelphia Water Department.
June 2009
Figure E.2 2007 and 2008 Continuous Temperature Data at Site PP340 with Comparison to
PA Ch. 96 Water Quality Standards for Trout Stocking Fishery
Daily Mean Daily Max Standard Discharge
0
5
10
15
20
25
30
35
40
May 07 Jun07 Jul07 Aug07 Sep07 Oct07 Nov 07 Dec07 Jan08 Feb08 Mar08 Apr08 May 08 Jun08 Jul08
Dis
char
ge (
cfs)
0
300
600
900
1200
1500
1800
2100
2400
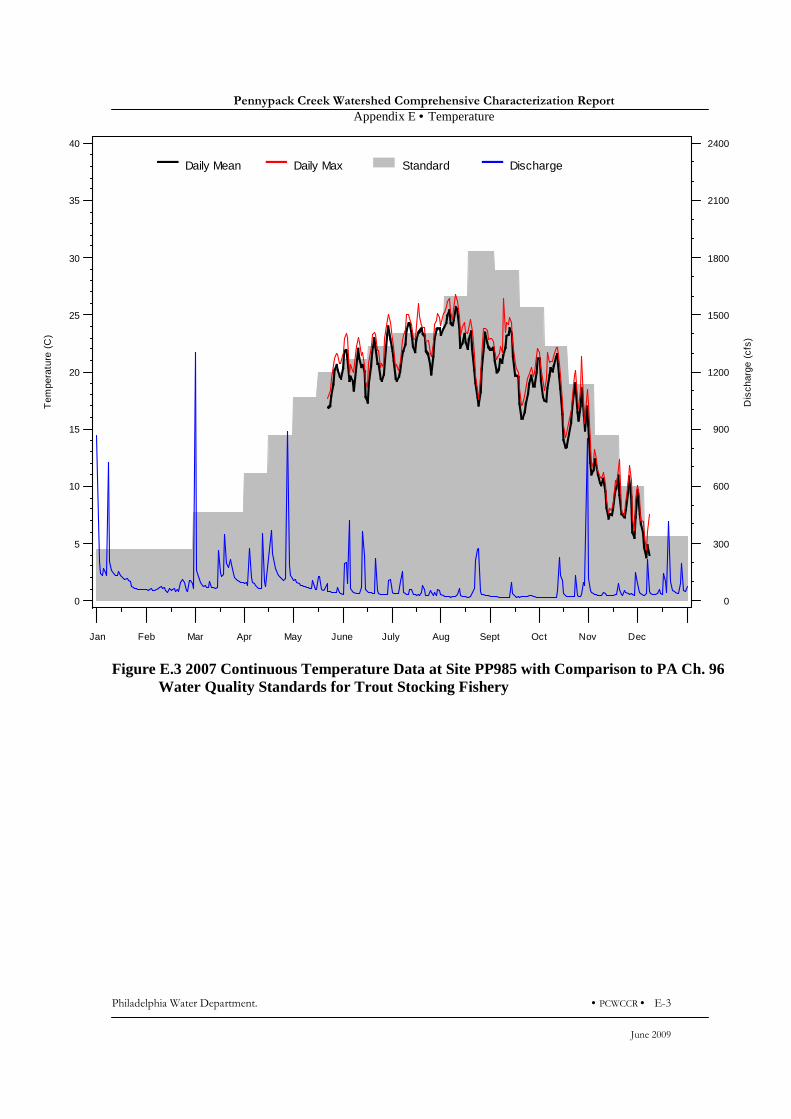
Pennypack Creek Watershed Comprehensive Characterization Report
Appendix E • Temperature
Philadelphia Water Department. • PCWCCR • E-3
June 2009
Figure E.3 2007 Continuous Temperature Data at Site PP985 with Comparison to PA Ch. 96
Water Quality Standards for Trout Stocking Fishery
Daily Mean Daily Max Standard Discharge
Tem
pera
ture
(C
)
0
5
10
15
20
25
30
35
40
Jan Feb Mar Apr May June July Aug Sept Oct Nov Dec
Dis
char
ge (
cfs)
0
300
600
900
1200
1500
1800
2100
2400
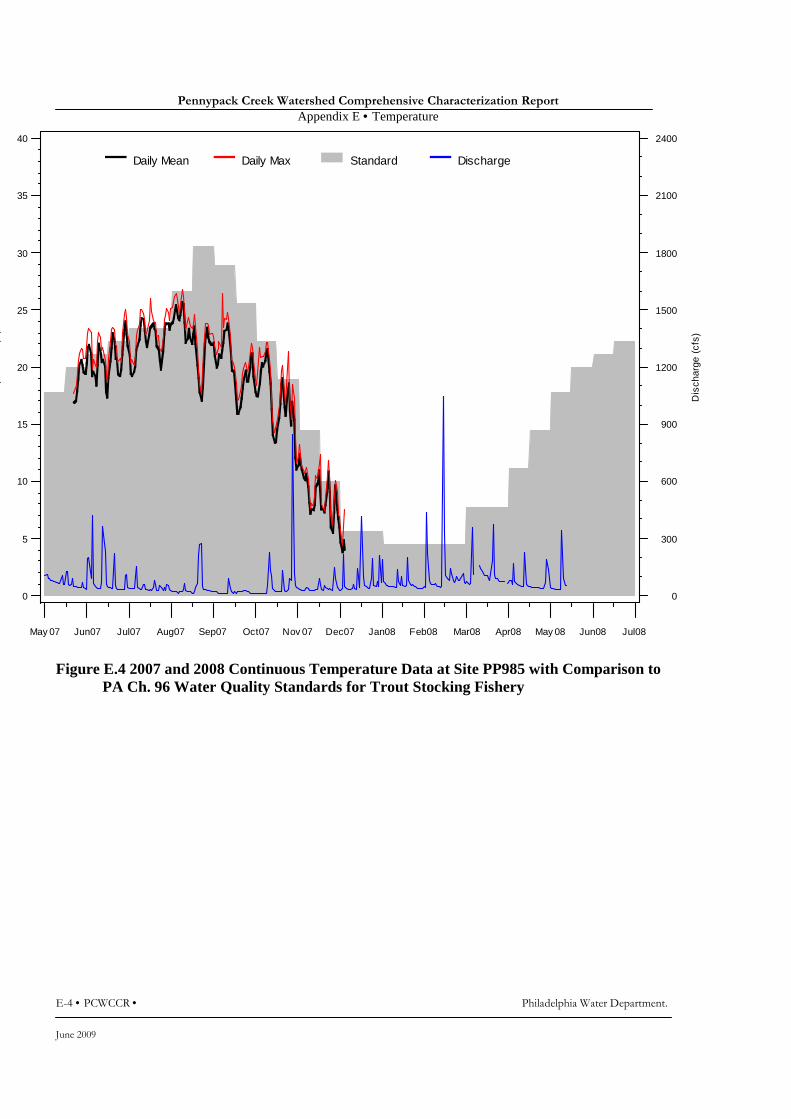
Pennypack Creek Watershed Comprehensive Characterization Report
Appendix E • Temperature
E-4 • PCWCCR • Philadelphia Water Department.
June 2009
Figure E.4 2007 and 2008 Continuous Temperature Data at Site PP985 with Comparison to
PA Ch. 96 Water Quality Standards for Trout Stocking Fishery
Daily Mean Daily Max Standard Discharge
Tem
pera
ture
(C
)
0
5
10
15
20
25
30
35
40
May 07 Jun07 Jul07 Aug07 Sep07 Oct07 Nov 07 Dec07 Jan08 Feb08 Mar08 Apr08 May 08 Jun08 Jul08
Dis
char
ge (
cfs)
0
300
600
900
1200
1500
1800
2100
2400
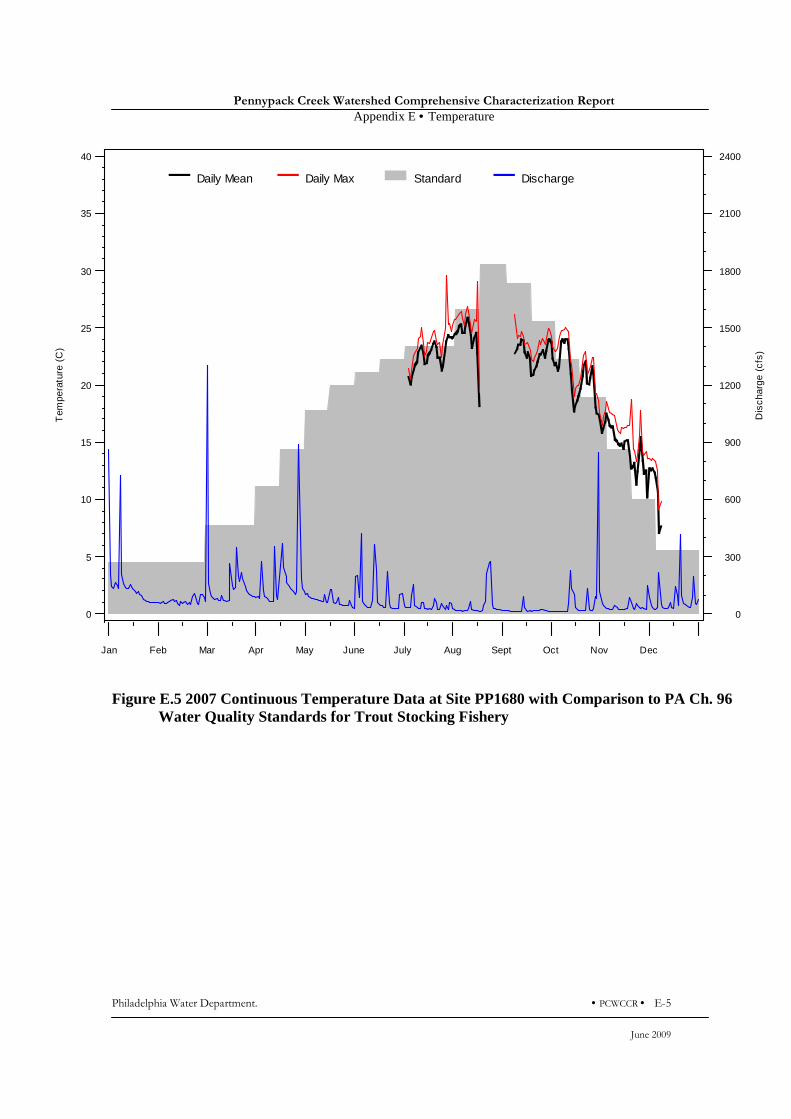
Pennypack Creek Watershed Comprehensive Characterization Report
Appendix E • Temperature
Philadelphia Water Department. • PCWCCR • E-5
June 2009
Figure E.5 2007 Continuous Temperature Data at Site PP1680 with Comparison to PA Ch. 96
Water Quality Standards for Trout Stocking Fishery
Daily Mean Daily Max Standard Discharge
Tem
pera
ture
(C
)
0
5
10
15
20
25
30
35
40
Jan Feb Mar Apr May June July Aug Sept Oct Nov Dec
Dis
char
ge (
cfs)
0
300
600
900
1200
1500
1800
2100
2400
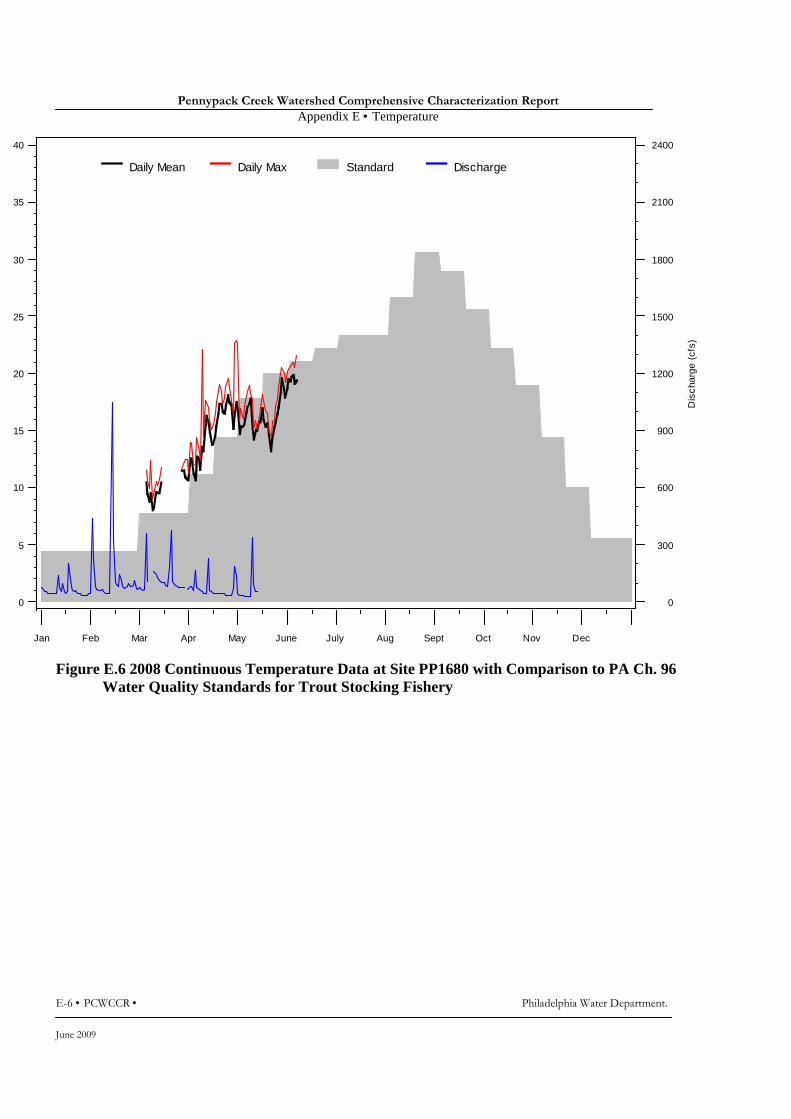
Pennypack Creek Watershed Comprehensive Characterization Report
Appendix E • Temperature
E-6 • PCWCCR • Philadelphia Water Department.
June 2009
Figure E.6 2008 Continuous Temperature Data at Site PP1680 with Comparison to PA Ch. 96
Water Quality Standards for Trout Stocking Fishery
Daily Mean Daily Max Standard Discharge
0
5
10
15
20
25
30
35
40
Jan Feb Mar Apr May June July Aug Sept Oct Nov Dec
Dis
char
ge (
cfs)
0
300
600
900
1200
1500
1800
2100
2400
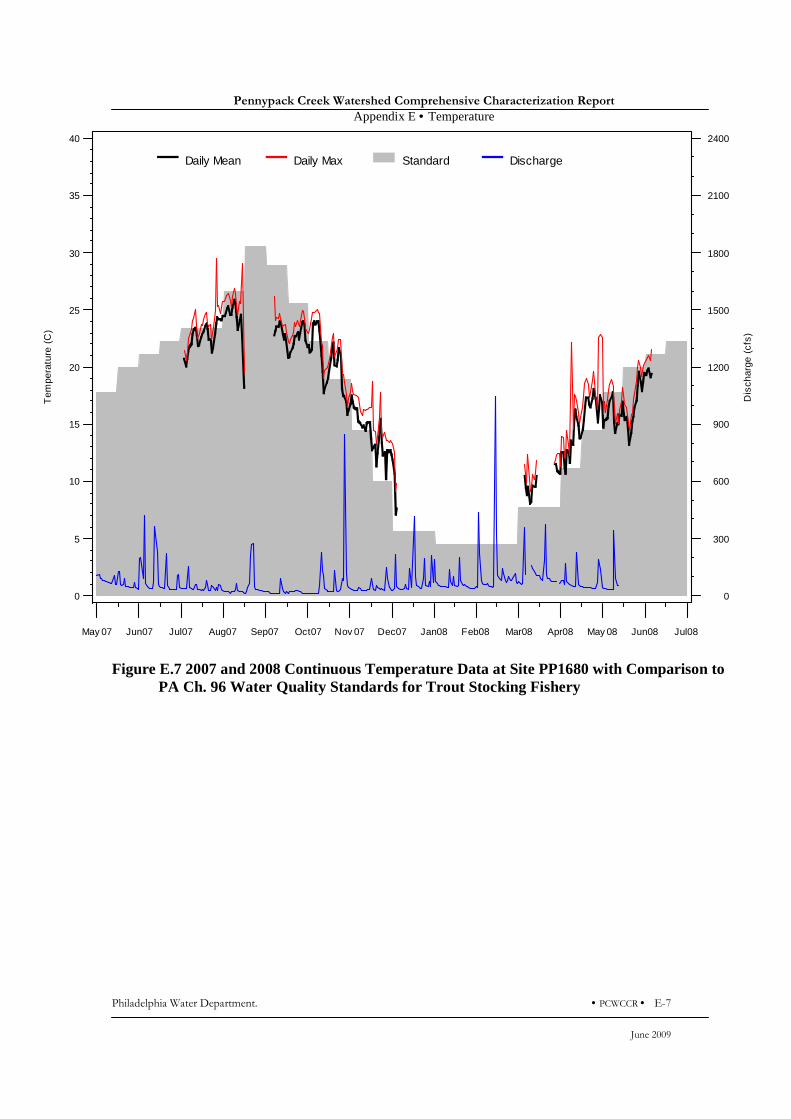
Pennypack Creek Watershed Comprehensive Characterization Report
Appendix E • Temperature
Philadelphia Water Department. • PCWCCR • E-7
June 2009
Figure E.7 2007 and 2008 Continuous Temperature Data at Site PP1680 with Comparison to
PA Ch. 96 Water Quality Standards for Trout Stocking Fishery
Daily Mean Daily Max Standard Discharge
Tem
pera
ture
(C
)
0
5
10
15
20
25
30
35
40
May 07 Jun07 Jul07 Aug07 Sep07 Oct07 Nov 07 Dec07 Jan08 Feb08 Mar08 Apr08 May 08 Jun08 Jul08
Dis
char
ge (
cfs)
0
300
600
900
1200
1500
1800
2100
2400
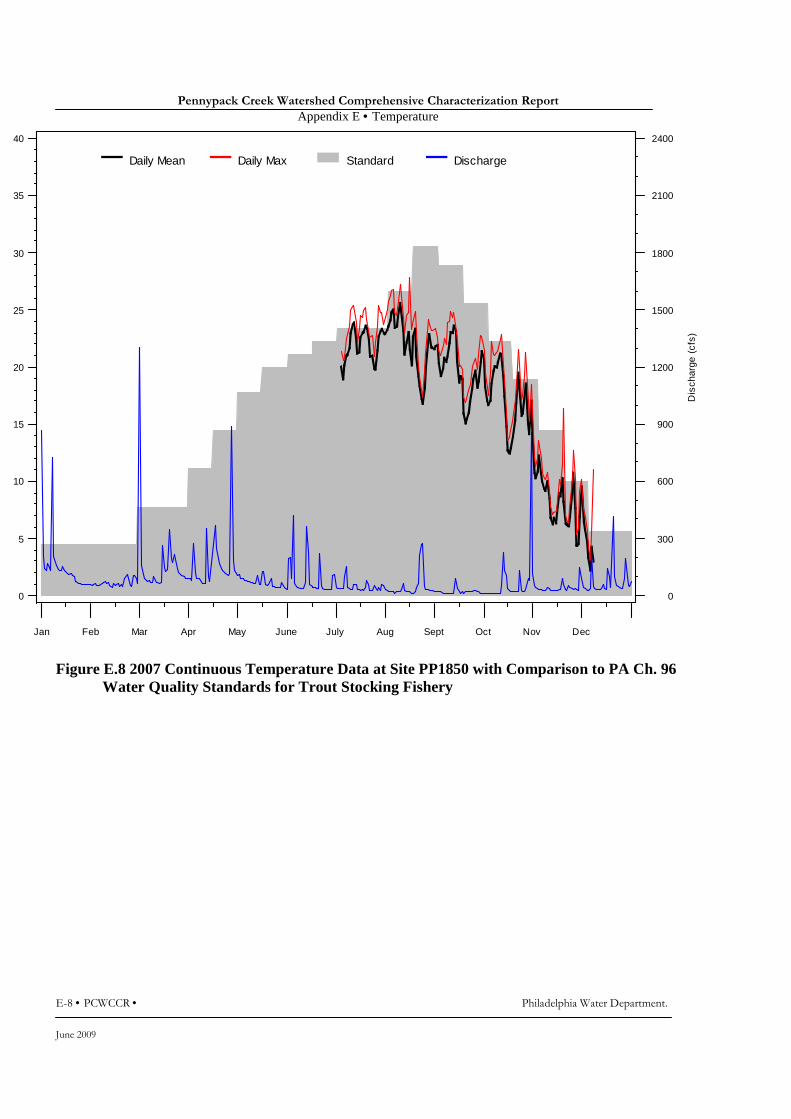
Pennypack Creek Watershed Comprehensive Characterization Report
Appendix E • Temperature
E-8 • PCWCCR • Philadelphia Water Department.
June 2009
Figure E.8 2007 Continuous Temperature Data at Site PP1850 with Comparison to PA Ch. 96
Water Quality Standards for Trout Stocking Fishery
Daily Mean Daily Max Standard Discharge
0
5
10
15
20
25
30
35
40
Jan Feb Mar Apr May June July Aug Sept Oct Nov Dec
Dis
char
ge (
cfs)
0
300
600
900
1200
1500
1800
2100
2400

Pennypack Creek Watershed Comprehensive Characterization Report
Appendix E • Temperature
Philadelphia Water Department. • PCWCCR • E-9
June 2009
Figure E.9 2008 Continuous Temperature Data at Site PP1850 with Comparison to PA Ch. 96
Water Quality Standards for Trout Stocking Fishery
Daily Mean Daily Max Standard Discharge
Tem
pera
ture
(C
)
0
5
10
15
20
25
30
35
40
Jan Feb Mar Apr May June July Aug Sept Oct Nov Dec
Dis
char
ge (
cfs)
0
300
600
900
1200
1500
1800
2100
2400

Pennypack Creek Watershed Comprehensive Characterization Report
Appendix E • Temperature
E-10 • PCWCCR • Philadelphia Water Department.
June 2009
Figure E.10 2007 and 2008 Continuous Temperature Data at Site PP1850 with Comparison to
PA Ch. 96 Water Quality Standards for Trout Stocking Fishery
Daily Mean Daily Max Standard Discharge
0
5
10
15
20
25
30
35
40
May 07 Jun07 Jul07 Aug07 Sep07 Oct07 Nov 07 Dec07 Jan08 Feb08 Mar08 Apr08 May 08 Jun08 Jul08
Dis
char
ge (
cfs)
0
300
600
900
1200
1500
1800
2100
2400
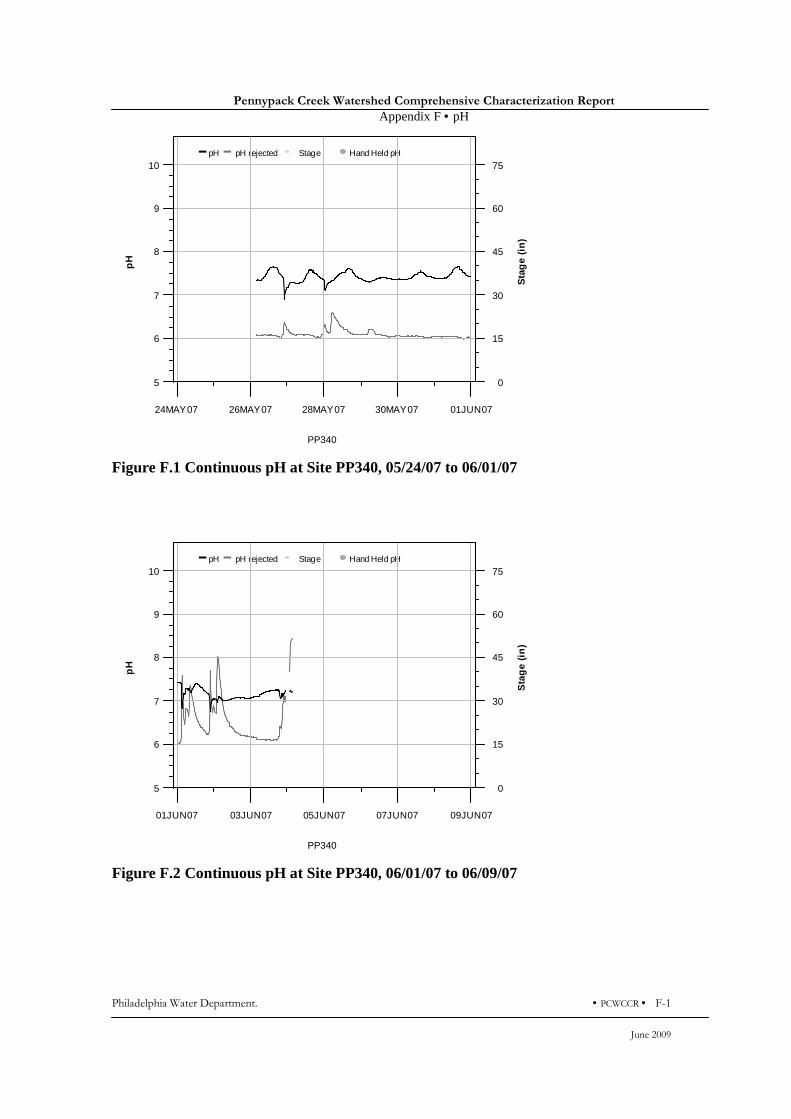
Pennypack Creek Watershed Comprehensive Characterization Report
Appendix F • pH
Philadelphia Water Department. • PCWCCR • F-1
June 2009
pH pH rejected Stage Hand Held pH
PP340
pH
5
6
7
8
9
10
24MAY07 26MAY07 28MAY07 30MAY07 01JUN07
Sta
ge
(in
)
0
15
30
45
60
75
Figure F.1 Continuous pH at Site PP340, 05/24/07 to 06/01/07
pH pH rejected Stage Hand Held pH
PP340
pH
5
6
7
8
9
10
01JUN07 03JUN07 05JUN07 07JUN07 09JUN07
Sta
ge
(in
)
0
15
30
45
60
75
Figure F.2 Continuous pH at Site PP340, 06/01/07 to 06/09/07
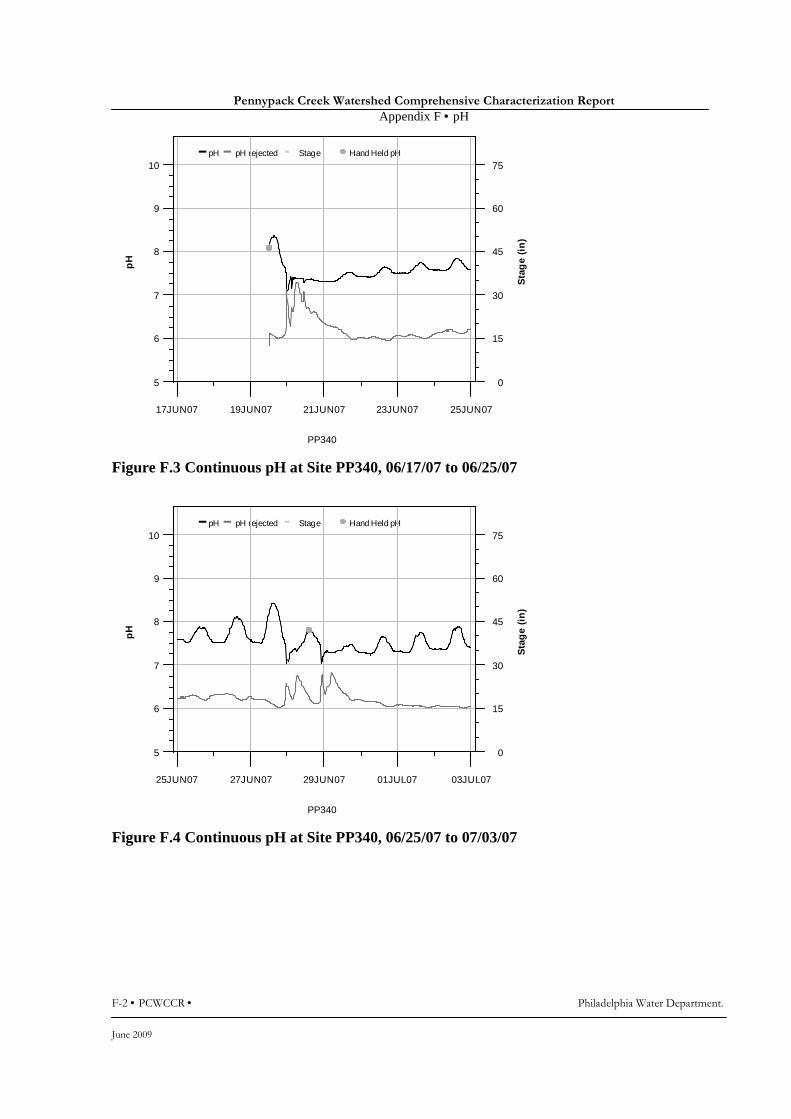
Pennypack Creek Watershed Comprehensive Characterization Report
Appendix F • pH
F-2 • PCWCCR • Philadelphia Water Department.
June 2009
pH pH rejected Stage Hand Held pH
PP340
pH
5
6
7
8
9
10
17JUN07 19JUN07 21JUN07 23JUN07 25JUN07
Sta
ge
(in
)
0
15
30
45
60
75
Figure F.3 Continuous pH at Site PP340, 06/17/07 to 06/25/07
pH pH rejected Stage Hand Held pH
PP340
pH
5
6
7
8
9
10
25JUN07 27JUN07 29JUN07 01JUL07 03JUL07
Sta
ge
(in
)
0
15
30
45
60
75
Figure F.4 Continuous pH at Site PP340, 06/25/07 to 07/03/07
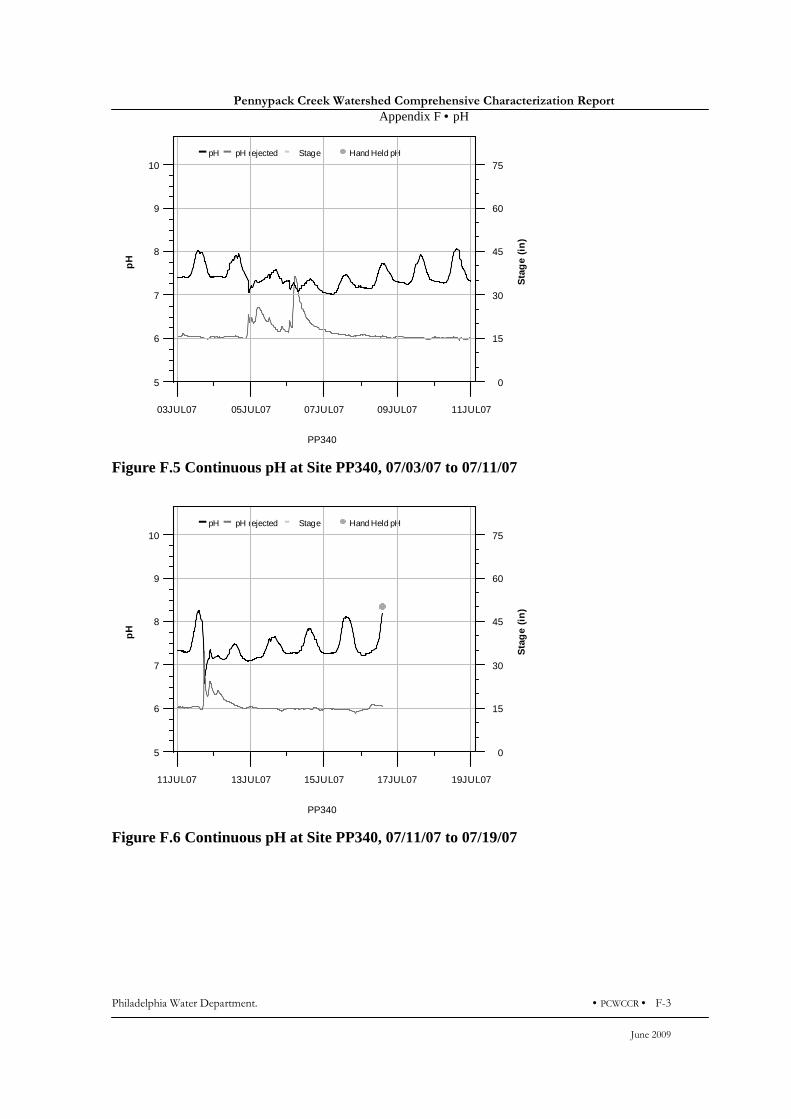
Pennypack Creek Watershed Comprehensive Characterization Report
Appendix F • pH
Philadelphia Water Department. • PCWCCR • F-3
June 2009
pH pH rejected Stage Hand Held pH
PP340
pH
5
6
7
8
9
10
03JUL07 05JUL07 07JUL07 09JUL07 11JUL07
Sta
ge
(in
)
0
15
30
45
60
75
Figure F.5 Continuous pH at Site PP340, 07/03/07 to 07/11/07
pH pH rejected Stage Hand Held pH
PP340
pH
5
6
7
8
9
10
11JUL07 13JUL07 15JUL07 17JUL07 19JUL07
Sta
ge
(in
)
0
15
30
45
60
75
Figure F.6 Continuous pH at Site PP340, 07/11/07 to 07/19/07
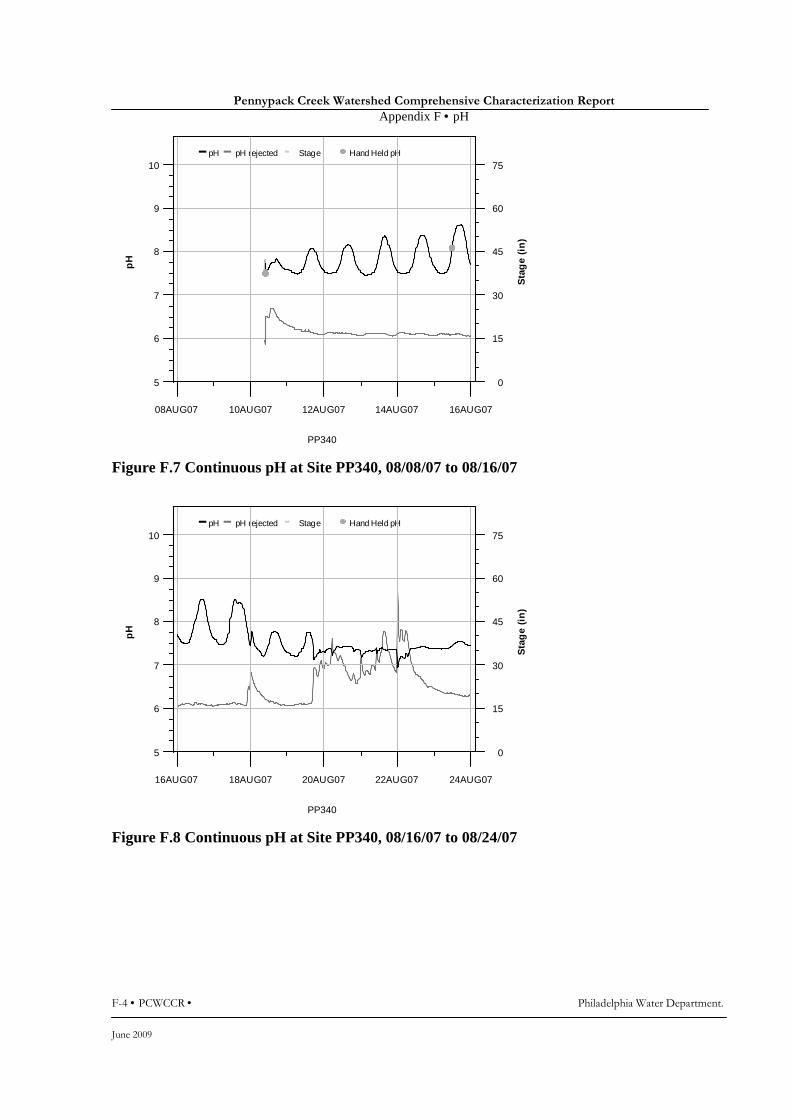
Pennypack Creek Watershed Comprehensive Characterization Report
Appendix F • pH
F-4 • PCWCCR • Philadelphia Water Department.
June 2009
pH pH rejected Stage Hand Held pH
PP340
pH
5
6
7
8
9
10
08AUG07 10AUG07 12AUG07 14AUG07 16AUG07
Sta
ge
(in
)
0
15
30
45
60
75
Figure F.7 Continuous pH at Site PP340, 08/08/07 to 08/16/07
pH pH rejected Stage Hand Held pH
PP340
pH
5
6
7
8
9
10
16AUG07 18AUG07 20AUG07 22AUG07 24AUG07
Sta
ge
(in
)
0
15
30
45
60
75
Figure F.8 Continuous pH at Site PP340, 08/16/07 to 08/24/07
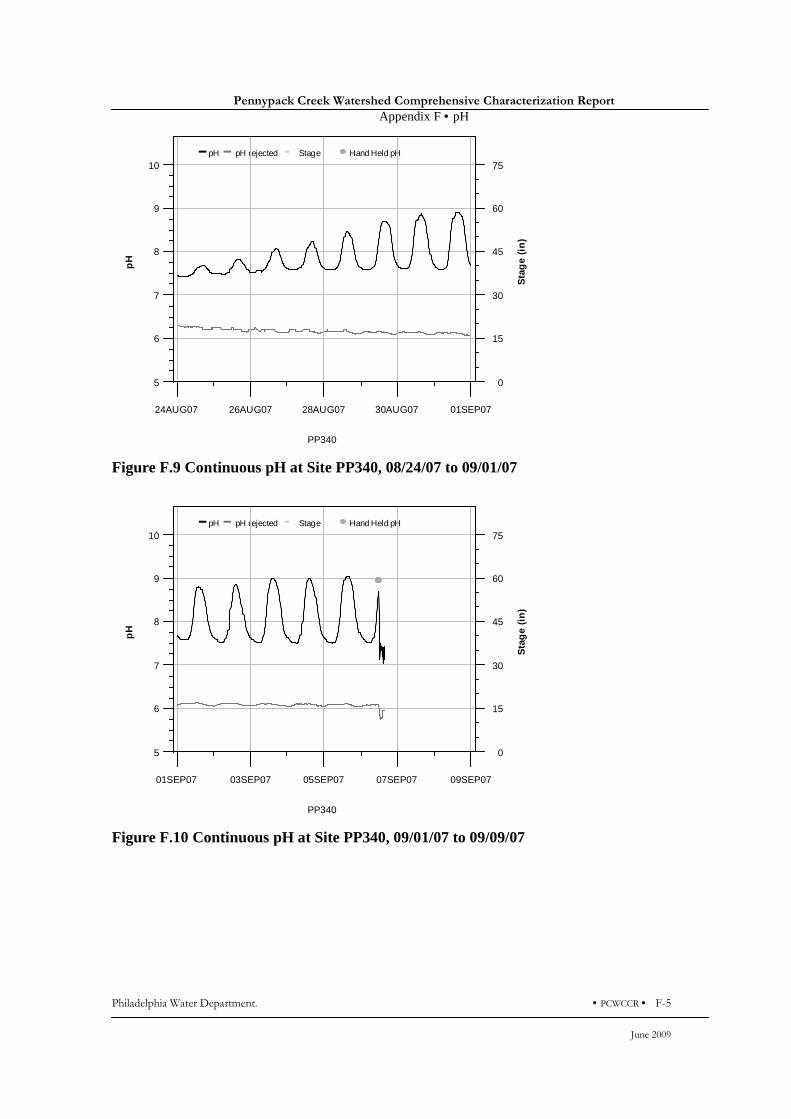
Pennypack Creek Watershed Comprehensive Characterization Report
Appendix F • pH
Philadelphia Water Department. • PCWCCR • F-5
June 2009
pH pH rejected Stage Hand Held pH
PP340
pH
5
6
7
8
9
10
24AUG07 26AUG07 28AUG07 30AUG07 01SEP07
Sta
ge
(in
)
0
15
30
45
60
75
Figure F.9 Continuous pH at Site PP340, 08/24/07 to 09/01/07
pH pH rejected Stage Hand Held pH
PP340
pH
5
6
7
8
9
10
01SEP07 03SEP07 05SEP07 07SEP07 09SEP07
Sta
ge
(in
)
0
15
30
45
60
75
Figure F.10 Continuous pH at Site PP340, 09/01/07 to 09/09/07
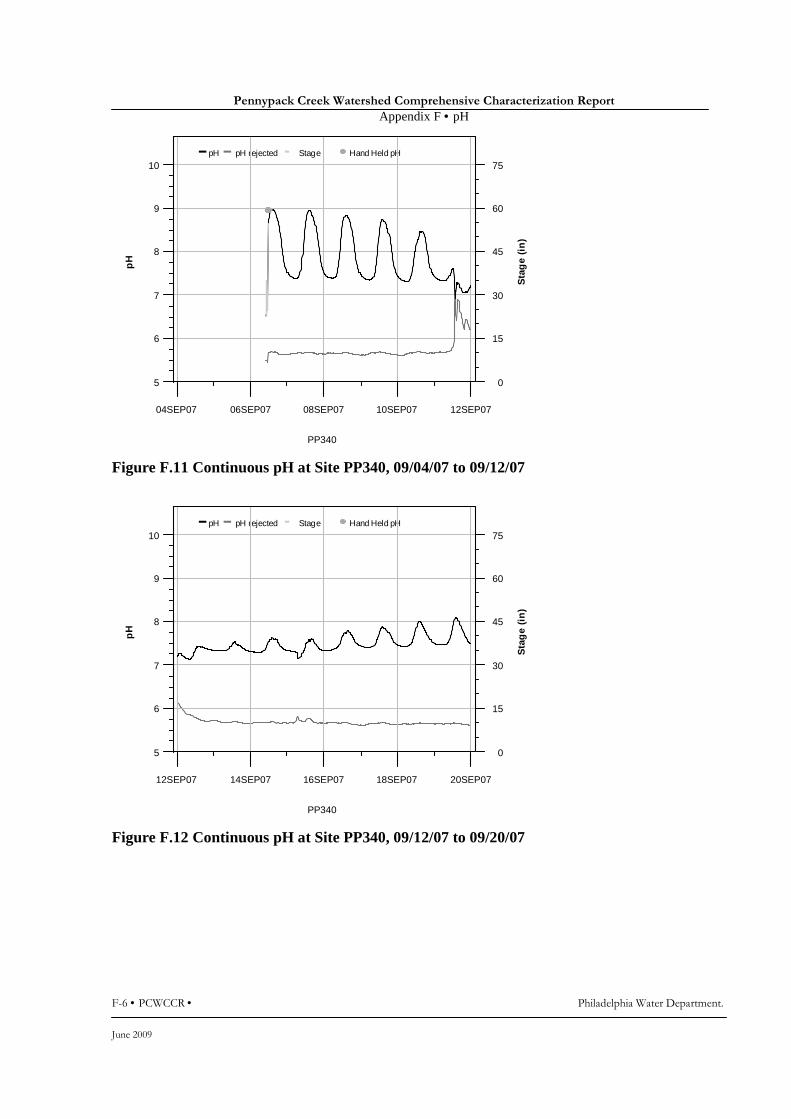
Pennypack Creek Watershed Comprehensive Characterization Report
Appendix F • pH
F-6 • PCWCCR • Philadelphia Water Department.
June 2009
pH pH rejected Stage Hand Held pH
PP340
pH
5
6
7
8
9
10
04SEP07 06SEP07 08SEP07 10SEP07 12SEP07
Sta
ge
(in
)
0
15
30
45
60
75
Figure F.11 Continuous pH at Site PP340, 09/04/07 to 09/12/07
pH pH rejected Stage Hand Held pH
PP340
pH
5
6
7
8
9
10
12SEP07 14SEP07 16SEP07 18SEP07 20SEP07
Sta
ge
(in
)
0
15
30
45
60
75
Figure F.12 Continuous pH at Site PP340, 09/12/07 to 09/20/07
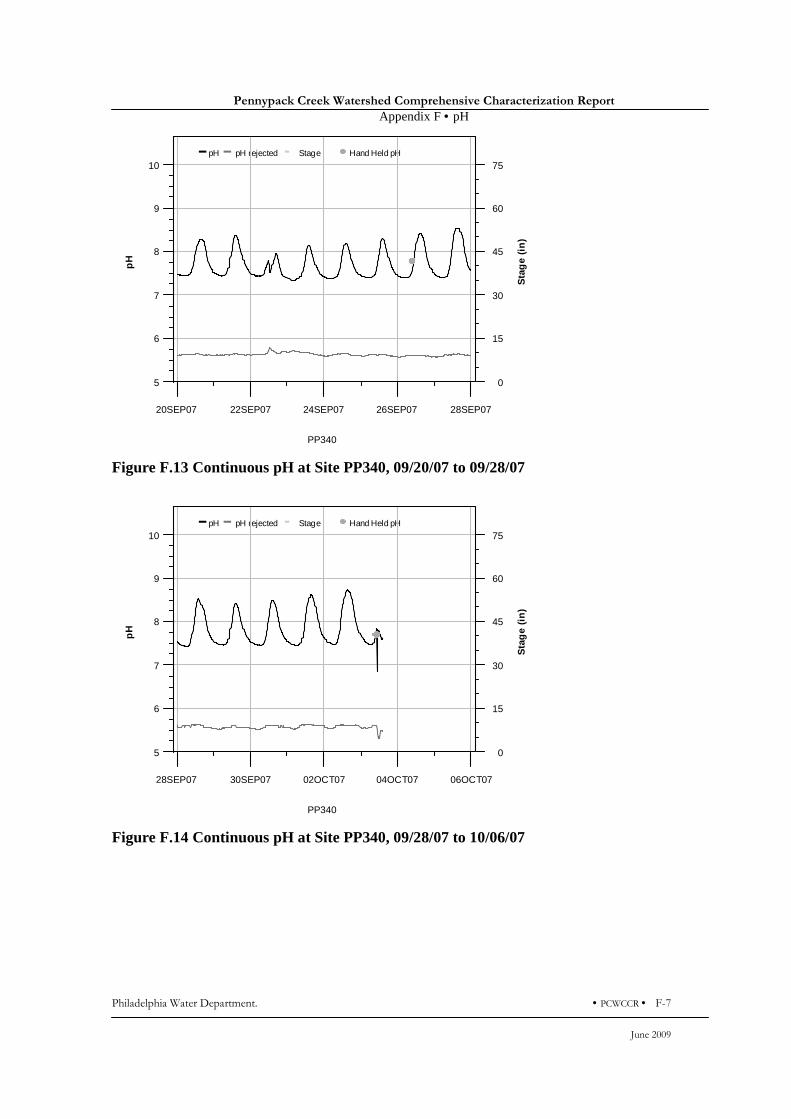
Pennypack Creek Watershed Comprehensive Characterization Report
Appendix F • pH
Philadelphia Water Department. • PCWCCR • F-7
June 2009
pH pH rejected Stage Hand Held pH
PP340
pH
5
6
7
8
9
10
20SEP07 22SEP07 24SEP07 26SEP07 28SEP07
Sta
ge
(in
)
0
15
30
45
60
75
Figure F.13 Continuous pH at Site PP340, 09/20/07 to 09/28/07
pH pH rejected Stage Hand Held pH
PP340
pH
5
6
7
8
9
10
28SEP07 30SEP07 02OCT07 04OCT07 06OCT07
Sta
ge
(in
)
0
15
30
45
60
75
Figure F.14 Continuous pH at Site PP340, 09/28/07 to 10/06/07
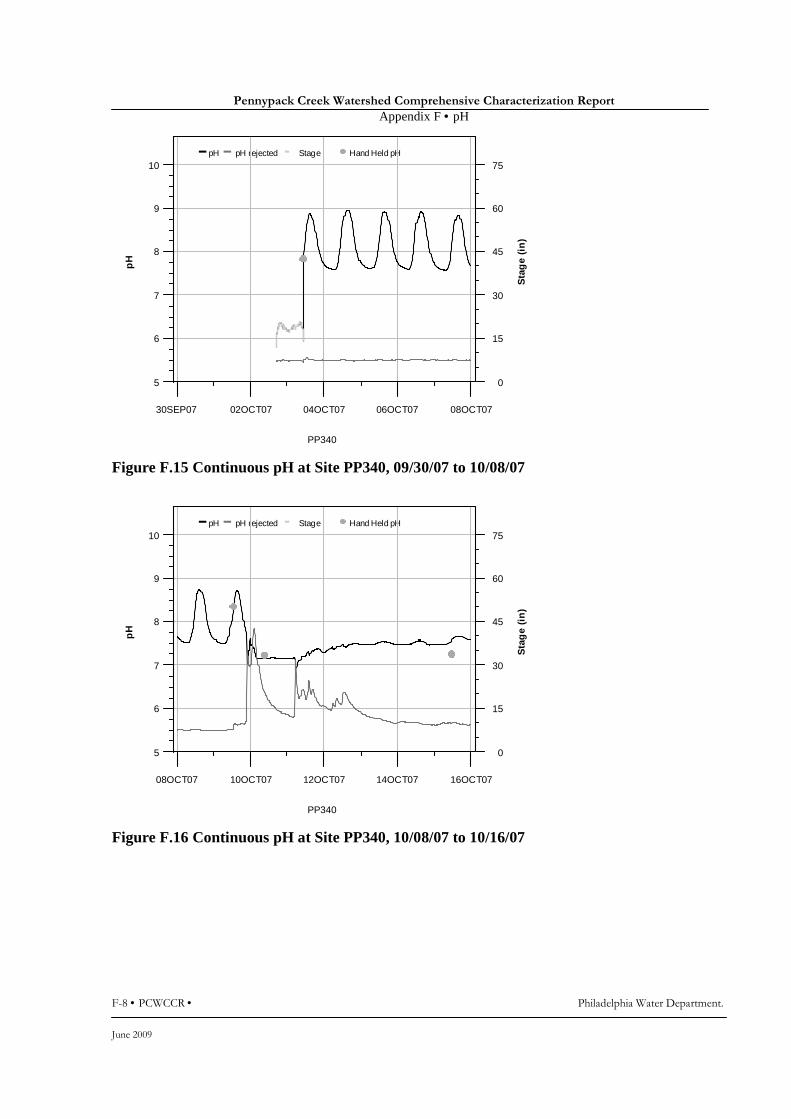
Pennypack Creek Watershed Comprehensive Characterization Report
Appendix F • pH
F-8 • PCWCCR • Philadelphia Water Department.
June 2009
pH pH rejected Stage Hand Held pH
PP340
pH
5
6
7
8
9
10
30SEP07 02OCT07 04OCT07 06OCT07 08OCT07
Sta
ge
(in
)
0
15
30
45
60
75
Figure F.15 Continuous pH at Site PP340, 09/30/07 to 10/08/07
pH pH rejected Stage Hand Held pH
PP340
pH
5
6
7
8
9
10
08OCT07 10OCT07 12OCT07 14OCT07 16OCT07
Sta
ge
(in
)
0
15
30
45
60
75
Figure F.16 Continuous pH at Site PP340, 10/08/07 to 10/16/07
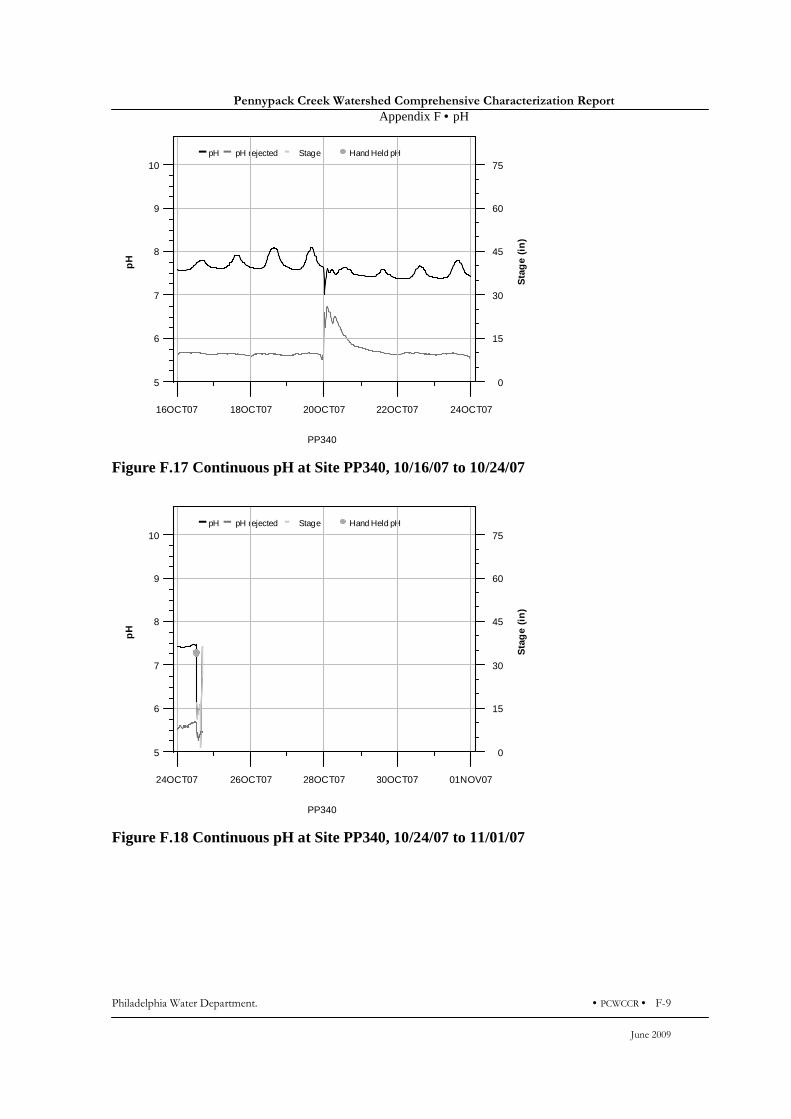
Pennypack Creek Watershed Comprehensive Characterization Report
Appendix F • pH
Philadelphia Water Department. • PCWCCR • F-9
June 2009
pH pH rejected Stage Hand Held pH
PP340
pH
5
6
7
8
9
10
16OCT07 18OCT07 20OCT07 22OCT07 24OCT07
Sta
ge
(in
)
0
15
30
45
60
75
Figure F.17 Continuous pH at Site PP340, 10/16/07 to 10/24/07
pH pH rejected Stage Hand Held pH
PP340
pH
5
6
7
8
9
10
24OCT07 26OCT07 28OCT07 30OCT07 01NOV07
Sta
ge
(in
)
0
15
30
45
60
75
Figure F.18 Continuous pH at Site PP340, 10/24/07 to 11/01/07
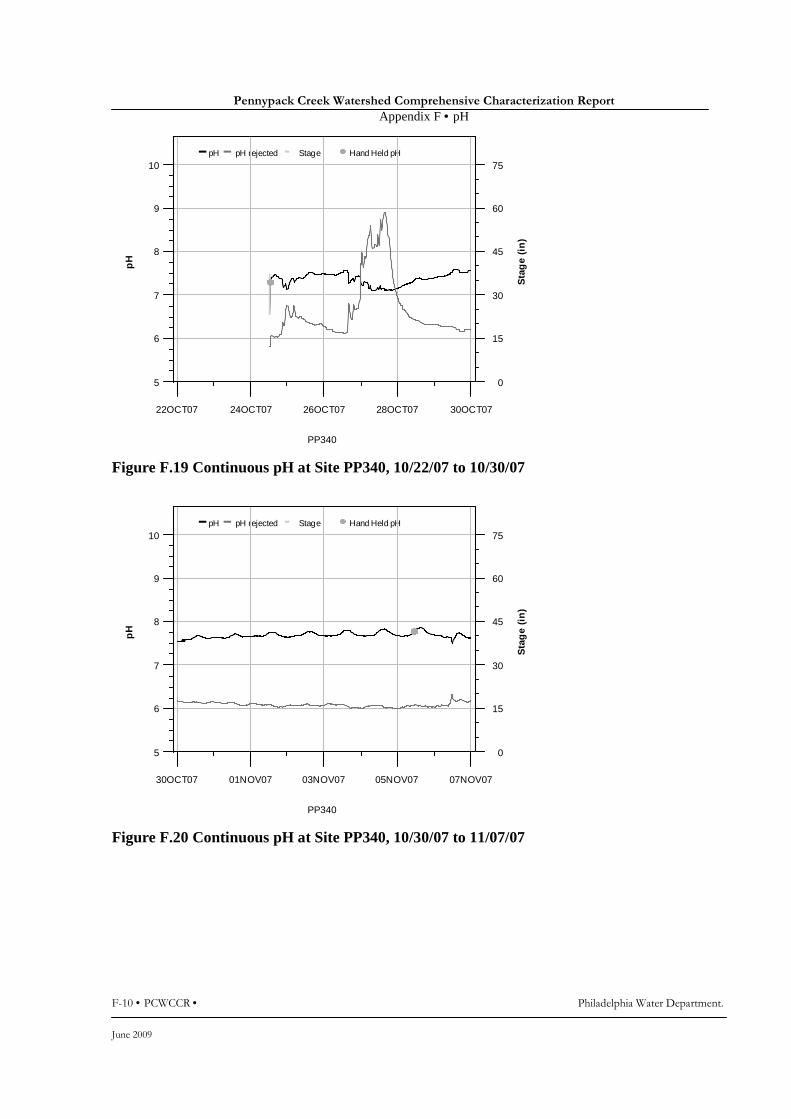
Pennypack Creek Watershed Comprehensive Characterization Report
Appendix F • pH
F-10 • PCWCCR • Philadelphia Water Department.
June 2009
pH pH rejected Stage Hand Held pH
PP340
pH
5
6
7
8
9
10
22OCT07 24OCT07 26OCT07 28OCT07 30OCT07
Sta
ge
(in
)
0
15
30
45
60
75
Figure F.19 Continuous pH at Site PP340, 10/22/07 to 10/30/07
pH pH rejected Stage Hand Held pH
PP340
pH
5
6
7
8
9
10
30OCT07 01NOV07 03NOV07 05NOV07 07NOV07
Sta
ge
(in
)
0
15
30
45
60
75
Figure F.20 Continuous pH at Site PP340, 10/30/07 to 11/07/07
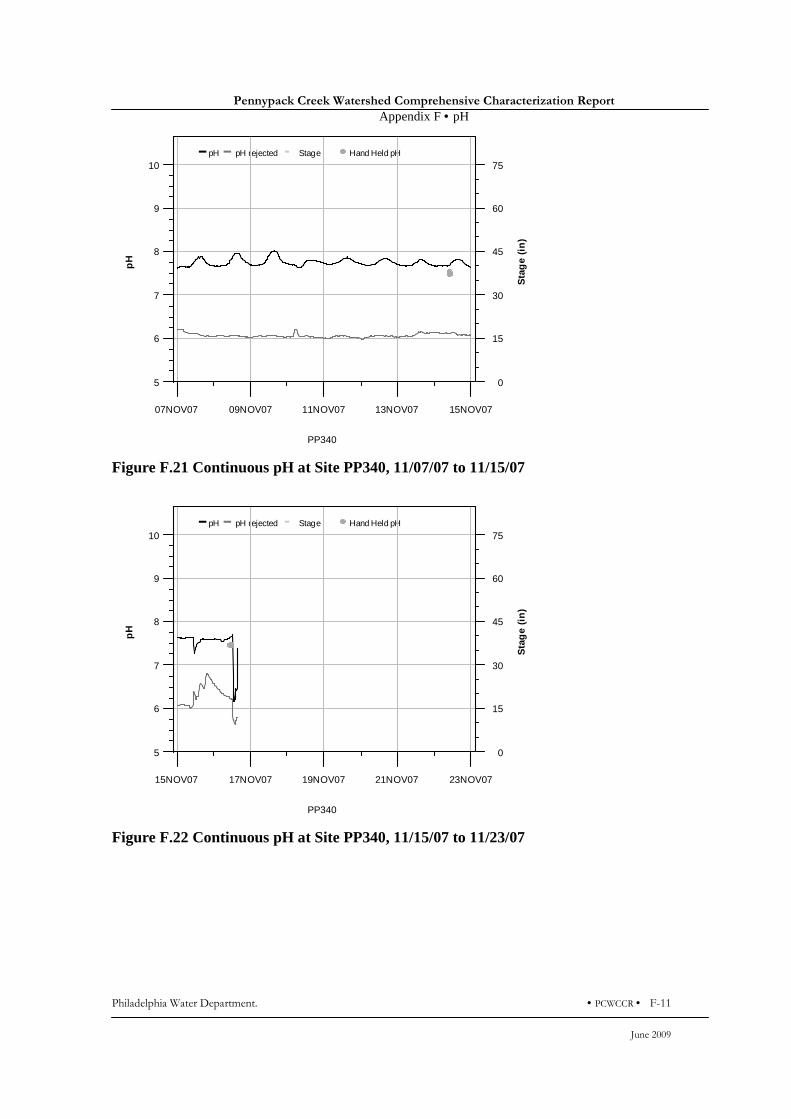
Pennypack Creek Watershed Comprehensive Characterization Report
Appendix F • pH
Philadelphia Water Department. • PCWCCR • F-11
June 2009
pH pH rejected Stage Hand Held pH
PP340
pH
5
6
7
8
9
10
07NOV07 09NOV07 11NOV07 13NOV07 15NOV07
Sta
ge
(in
)
0
15
30
45
60
75
Figure F.21 Continuous pH at Site PP340, 11/07/07 to 11/15/07
pH pH rejected Stage Hand Held pH
PP340
pH
5
6
7
8
9
10
15NOV07 17NOV07 19NOV07 21NOV07 23NOV07
Sta
ge
(in
)
0
15
30
45
60
75
Figure F.22 Continuous pH at Site PP340, 11/15/07 to 11/23/07
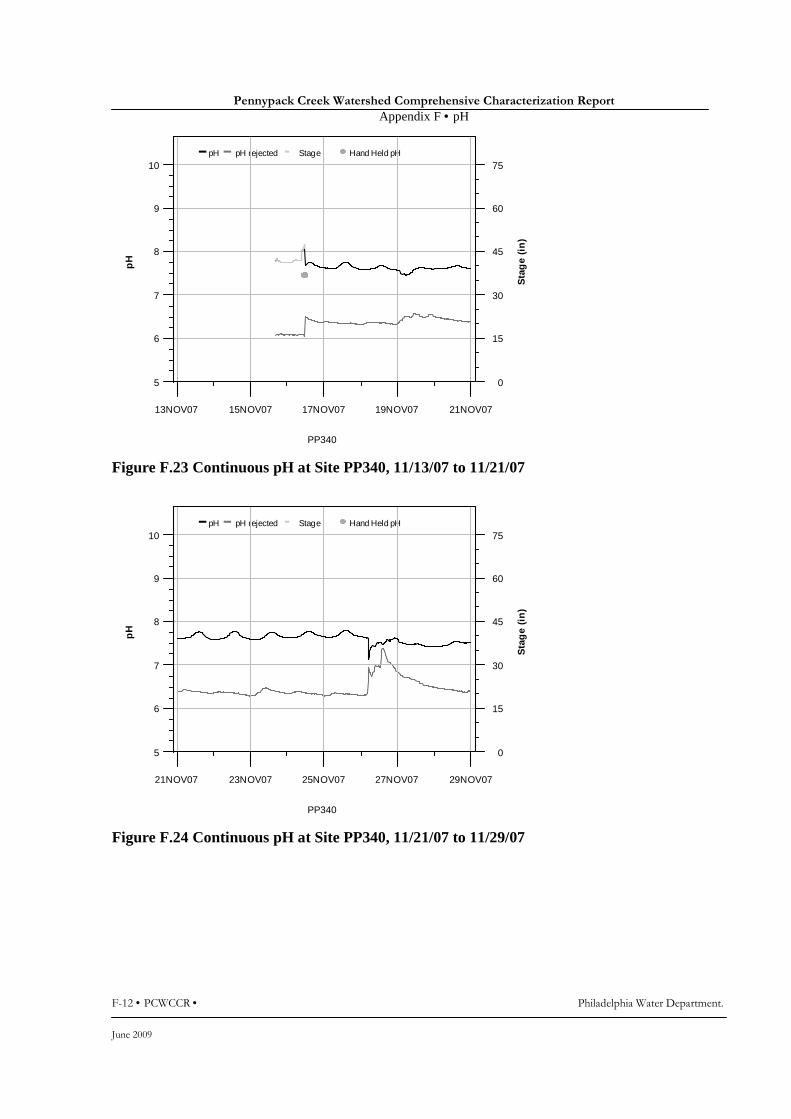
Pennypack Creek Watershed Comprehensive Characterization Report
Appendix F • pH
F-12 • PCWCCR • Philadelphia Water Department.
June 2009
pH pH rejected Stage Hand Held pH
PP340
pH
5
6
7
8
9
10
13NOV07 15NOV07 17NOV07 19NOV07 21NOV07
Sta
ge
(in
)
0
15
30
45
60
75
Figure F.23 Continuous pH at Site PP340, 11/13/07 to 11/21/07
pH pH rejected Stage Hand Held pH
PP340
pH
5
6
7
8
9
10
21NOV07 23NOV07 25NOV07 27NOV07 29NOV07
Sta
ge
(in
)
0
15
30
45
60
75
Figure F.24 Continuous pH at Site PP340, 11/21/07 to 11/29/07
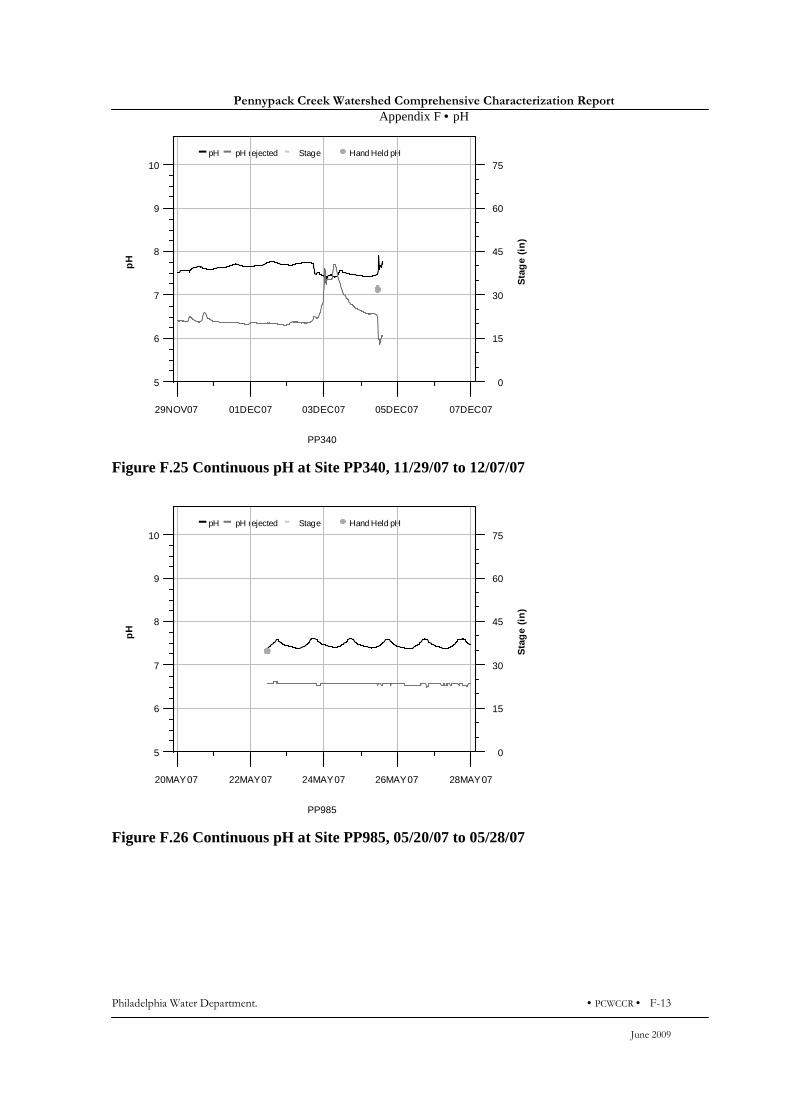
Pennypack Creek Watershed Comprehensive Characterization Report
Appendix F • pH
Philadelphia Water Department. • PCWCCR • F-13
June 2009
pH pH rejected Stage Hand Held pH
PP340
pH
5
6
7
8
9
10
29NOV07 01DEC07 03DEC07 05DEC07 07DEC07
Sta
ge
(in
)
0
15
30
45
60
75
Figure F.25 Continuous pH at Site PP340, 11/29/07 to 12/07/07
pH pH rejected Stage Hand Held pH
PP985
pH
5
6
7
8
9
10
20MAY07 22MAY07 24MAY07 26MAY07 28MAY07
Sta
ge
(in
)
0
15
30
45
60
75
Figure F.26 Continuous pH at Site PP985, 05/20/07 to 05/28/07
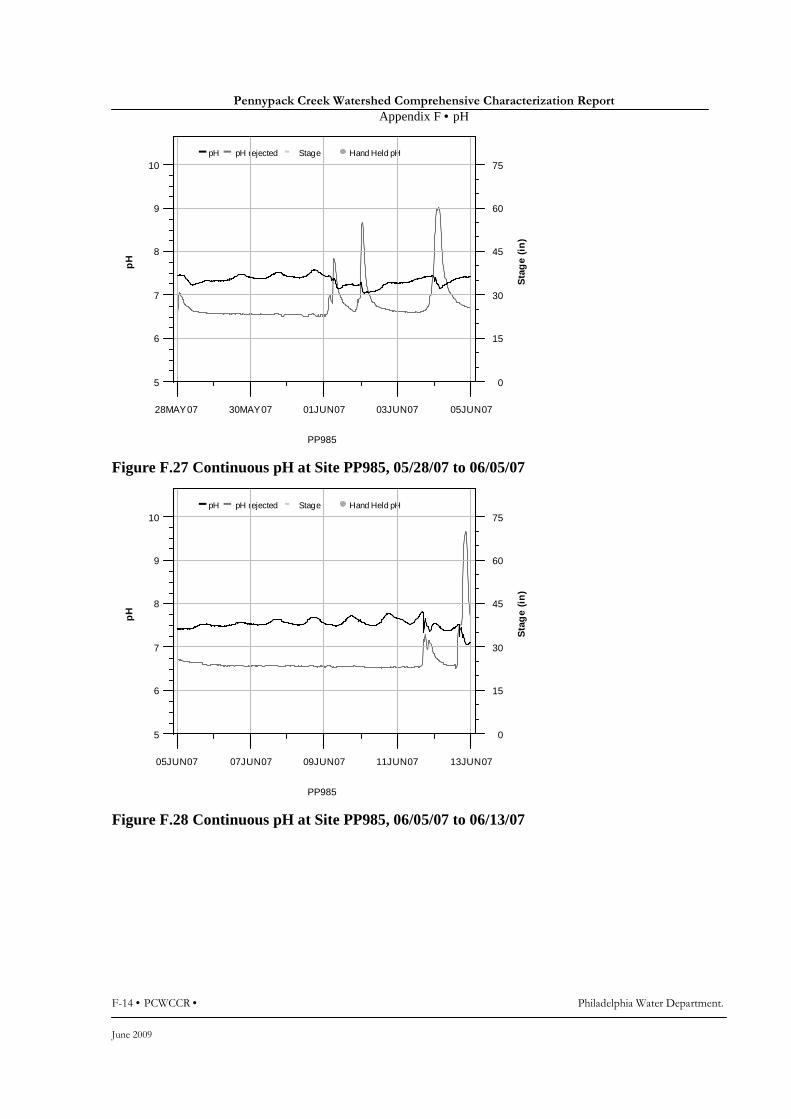
Pennypack Creek Watershed Comprehensive Characterization Report
Appendix F • pH
F-14 • PCWCCR • Philadelphia Water Department.
June 2009
pH pH rejected Stage Hand Held pH
PP985
pH
5
6
7
8
9
10
28MAY07 30MAY07 01JUN07 03JUN07 05JUN07
Sta
ge
(in
)
0
15
30
45
60
75
Figure F.27 Continuous pH at Site PP985, 05/28/07 to 06/05/07
pH pH rejected Stage Hand Held pH
PP985
pH
5
6
7
8
9
10
05JUN07 07JUN07 09JUN07 11JUN07 13JUN07
Sta
ge
(in
)
0
15
30
45
60
75
Figure F.28 Continuous pH at Site PP985, 06/05/07 to 06/13/07

Pennypack Creek Watershed Comprehensive Characterization Report
Appendix F • pH
Philadelphia Water Department. • PCWCCR • F-15
June 2009
pH pH rejected Stage Hand Held pH
PP985
pH
5
6
7
8
9
10
13JUN07 15JUN07 17JUN07 19JUN07 21JUN07
Sta
ge
(in
)
0
15
30
45
60
75
Figure F.29 Continuous pH at Site PP985, 06/13/07 to 06/21/07
pH pH rejected Stage Hand Held pH
PP985
pH
5
6
7
8
9
10
14JUN07 16JUN07 18JUN07 20JUN07 22JUN07
Sta
ge
(in
)
0
15
30
45
60
75
Figure F.30 Continuous pH at Site PP985, 06/14/07 to 06/22/07
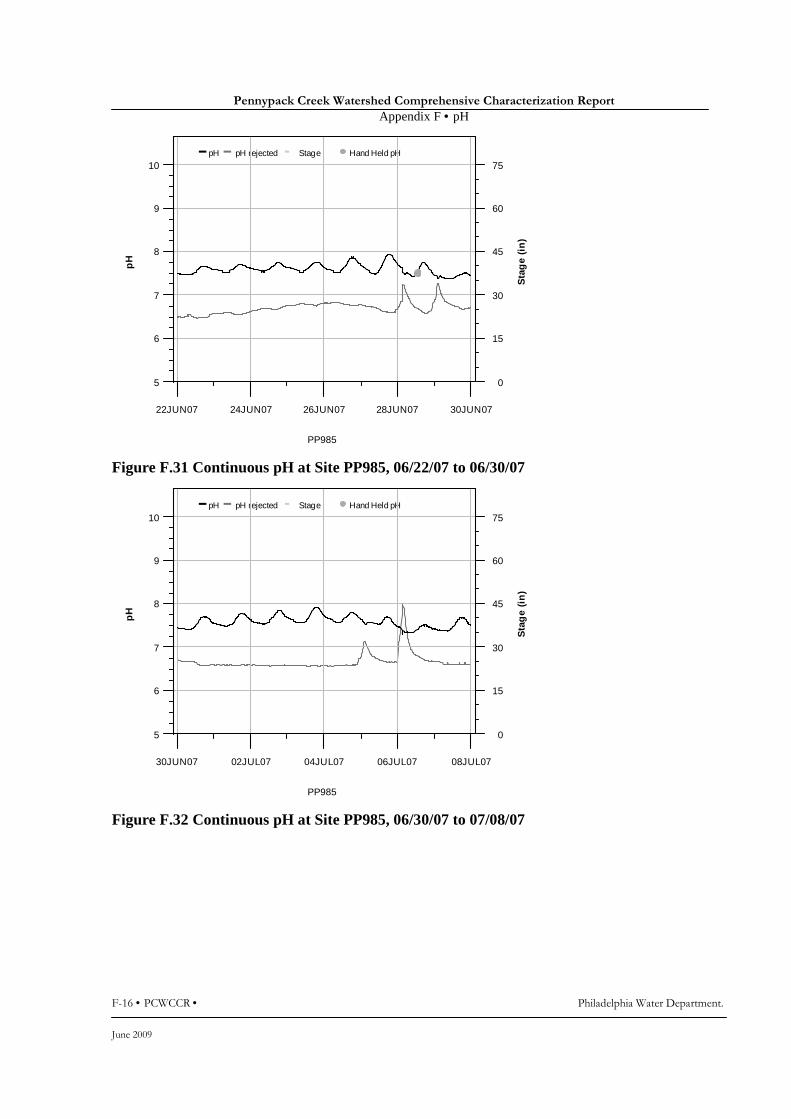
Pennypack Creek Watershed Comprehensive Characterization Report
Appendix F • pH
F-16 • PCWCCR • Philadelphia Water Department.
June 2009
pH pH rejected Stage Hand Held pH
PP985
pH
5
6
7
8
9
10
22JUN07 24JUN07 26JUN07 28JUN07 30JUN07
Sta
ge
(in
)
0
15
30
45
60
75
Figure F.31 Continuous pH at Site PP985, 06/22/07 to 06/30/07
pH pH rejected Stage Hand Held pH
PP985
pH
5
6
7
8
9
10
30JUN07 02JUL07 04JUL07 06JUL07 08JUL07
Sta
ge
(in
)
0
15
30
45
60
75
Figure F.32 Continuous pH at Site PP985, 06/30/07 to 07/08/07

Pennypack Creek Watershed Comprehensive Characterization Report
Appendix F • pH
Philadelphia Water Department. • PCWCCR • F-17
June 2009
pH pH rejected Stage Hand Held pH
PP985
pH
5
6
7
8
9
10
08JUL07 10JUL07 12JUL07 14JUL07 16JUL07
Sta
ge
(in
)
0
15
30
45
60
75
Figure F.33 Continuous pH at Site PP985, 07/08/07 to 07/16/07
pH pH rejected Stage Hand Held pH
PP985
pH
5
6
7
8
9
10
16JUL07 18JUL07 20JUL07 22JUL07 24JUL07
Sta
ge
(in
)
0
15
30
45
60
75
Figure F.34 Continuous pH at Site PP985, 07/16/07 to 07/24/07
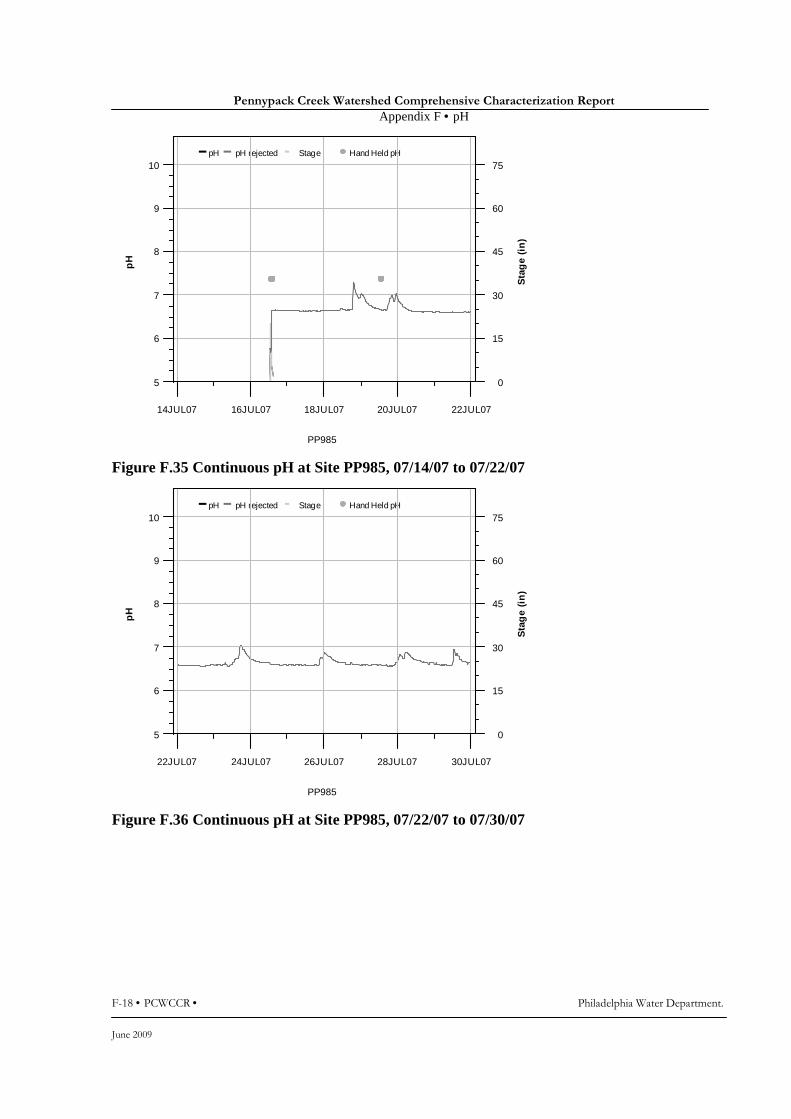
Pennypack Creek Watershed Comprehensive Characterization Report
Appendix F • pH
F-18 • PCWCCR • Philadelphia Water Department.
June 2009
pH pH rejected Stage Hand Held pH
PP985
pH
5
6
7
8
9
10
14JUL07 16JUL07 18JUL07 20JUL07 22JUL07
Sta
ge
(in
)
0
15
30
45
60
75
Figure F.35 Continuous pH at Site PP985, 07/14/07 to 07/22/07
pH pH rejected Stage Hand Held pH
PP985
pH
5
6
7
8
9
10
22JUL07 24JUL07 26JUL07 28JUL07 30JUL07
Sta
ge
(in
)
0
15
30
45
60
75
Figure F.36 Continuous pH at Site PP985, 07/22/07 to 07/30/07
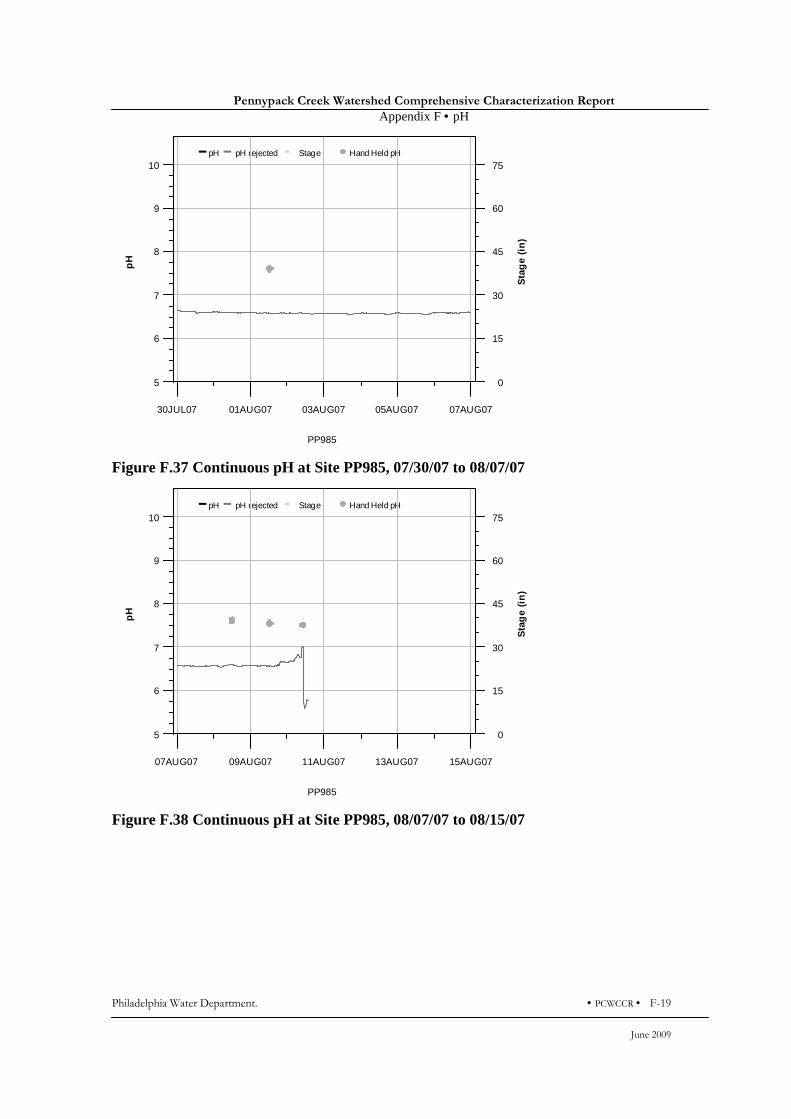
Pennypack Creek Watershed Comprehensive Characterization Report
Appendix F • pH
Philadelphia Water Department. • PCWCCR • F-19
June 2009
pH pH rejected Stage Hand Held pH
PP985
pH
5
6
7
8
9
10
30JUL07 01AUG07 03AUG07 05AUG07 07AUG07
Sta
ge
(in
)
0
15
30
45
60
75
Figure F.37 Continuous pH at Site PP985, 07/30/07 to 08/07/07
pH pH rejected Stage Hand Held pH
PP985
pH
5
6
7
8
9
10
07AUG07 09AUG07 11AUG07 13AUG07 15AUG07
Sta
ge
(in
)
0
15
30
45
60
75
Figure F.38 Continuous pH at Site PP985, 08/07/07 to 08/15/07

Pennypack Creek Watershed Comprehensive Characterization Report
Appendix F • pH
F-20 • PCWCCR • Philadelphia Water Department.
June 2009
pH pH rejected Stage Hand Held pH
PP985
pH
5
6
7
8
9
10
08AUG07 10AUG07 12AUG07 14AUG07 16AUG07
Sta
ge
(in
)
0
15
30
45
60
75
Figure F.39 Continuous pH at Site PP985, 08/08/07 to 08/16/07
pH pH rejected Stage Hand Held pH
PP985
pH
5
6
7
8
9
10
16AUG07 18AUG07 20AUG07 22AUG07 24AUG07
Sta
ge
(in
)
0
15
30
45
60
75
Figure F.40 Continuous pH at Site PP985, 08/16/07 to 08/24/07

Pennypack Creek Watershed Comprehensive Characterization Report
Appendix F • pH
Philadelphia Water Department. • PCWCCR • F-21
June 2009
pH pH rejected Stage Hand Held pH
PP985
pH
5
6
7
8
9
10
24AUG07 26AUG07 28AUG07 30AUG07 01SEP07
Sta
ge
(in
)
0
15
30
45
60
75
Figure F.41 Continuous pH at Site PP985, 08/24/07 to 09/01/07
pH pH rejected Stage Hand Held pH
PP985
pH
5
6
7
8
9
10
01SEP07 03SEP07 05SEP07 07SEP07 09SEP07
Sta
ge
(in
)
0
15
30
45
60
75
Figure F.42 Continuous pH at Site PP985, 09/01/07 to 09/09/07

Pennypack Creek Watershed Comprehensive Characterization Report
Appendix F • pH
F-22 • PCWCCR • Philadelphia Water Department.
June 2009
pH pH rejected Stage Hand Held pH
PP985
pH
5
6
7
8
9
10
04SEP07 06SEP07 08SEP07 10SEP07 12SEP07
Sta
ge
(in
)
0
15
30
45
60
75
Figure F.43 Continuous pH at Site PP985, 09/04/07 to 09/12/07
pH pH rejected Stage Hand Held pH
PP985
pH
5
6
7
8
9
10
12SEP07 14SEP07 16SEP07 18SEP07 20SEP07
Sta
ge
(in
)
0
15
30
45
60
75
Figure F.44 Continuous pH at Site PP985, 09/12/07 to 09/20/07

Pennypack Creek Watershed Comprehensive Characterization Report
Appendix F • pH
Philadelphia Water Department. • PCWCCR • F-23
June 2009
pH pH rejected Stage Hand Held pH
PP985
pH
5
6
7
8
9
10
20SEP07 22SEP07 24SEP07 26SEP07 28SEP07
Sta
ge
(in
)
0
15
30
45
60
75
Figure F.45 Continuous pH at Site PP985, 09/20/07 to 09/28/07
pH pH rejected Stage Hand Held pH
PP985
pH
5
6
7
8
9
10
28SEP07 30SEP07 02OCT07 04OCT07 06OCT07
Sta
ge
(in
)
0
15
30
45
60
75
Figure F.46 Continuous pH at Site PP985, 09/28/07 to 10/06/07

Pennypack Creek Watershed Comprehensive Characterization Report
Appendix F • pH
F-24 • PCWCCR • Philadelphia Water Department.
June 2009
pH pH rejected Stage Hand Held pH
PP985
pH
5
6
7
8
9
10
30SEP07 02OCT07 04OCT07 06OCT07 08OCT07
Sta
ge
(in
)
0
15
30
45
60
75
Figure F.47 Continuous pH at Site PP985, 09/30/07 to 10/08/07
pH pH rejected Stage Hand Held pH
PP985
pH
5
6
7
8
9
10
08OCT07 10OCT07 12OCT07 14OCT07 16OCT07
Sta
ge
(in
)
0
15
30
45
60
75
Figure F.48 Continuous pH at Site PP985, 10/08/07 to 10/16/07

Pennypack Creek Watershed Comprehensive Characterization Report
Appendix F • pH
Philadelphia Water Department. • PCWCCR • F-25
June 2009
pH pH rejected Stage Hand Held pH
PP985
pH
5
6
7
8
9
10
16OCT07 18OCT07 20OCT07 22OCT07 24OCT07
Sta
ge
(in
)
0
15
30
45
60
75
Figure F.49 Continuous pH at Site PP985, 10/16/07 to 10/24/07
pH pH rejected Stage Hand Held pH
PP985
pH
5
6
7
8
9
10
24OCT07 26OCT07 28OCT07 30OCT07 01NOV07
Sta
ge
(in
)
0
15
30
45
60
75
Figure F.50 Continuous pH at Site PP985, 10/24/07 to 11/01/07

Pennypack Creek Watershed Comprehensive Characterization Report
Appendix F • pH
F-26 • PCWCCR • Philadelphia Water Department.
June 2009
pH pH rejected Stage Hand Held pH
PP985
pH
5
6
7
8
9
10
22OCT07 24OCT07 26OCT07 28OCT07 30OCT07
Sta
ge
(in
)
0
15
30
45
60
75
Figure F.51 Continuous pH at Site PP985, 10/22/07 to 10/30/07
pH pH rejected Stage Hand Held pH
PP985
pH
5
6
7
8
9
10
30OCT07 01NOV07 03NOV07 05NOV07 07NOV07
Sta
ge
(in
)
0
15
30
45
60
75
Figure F.52 Continuous pH at Site PP985, 10/30/07 to 11/07/07
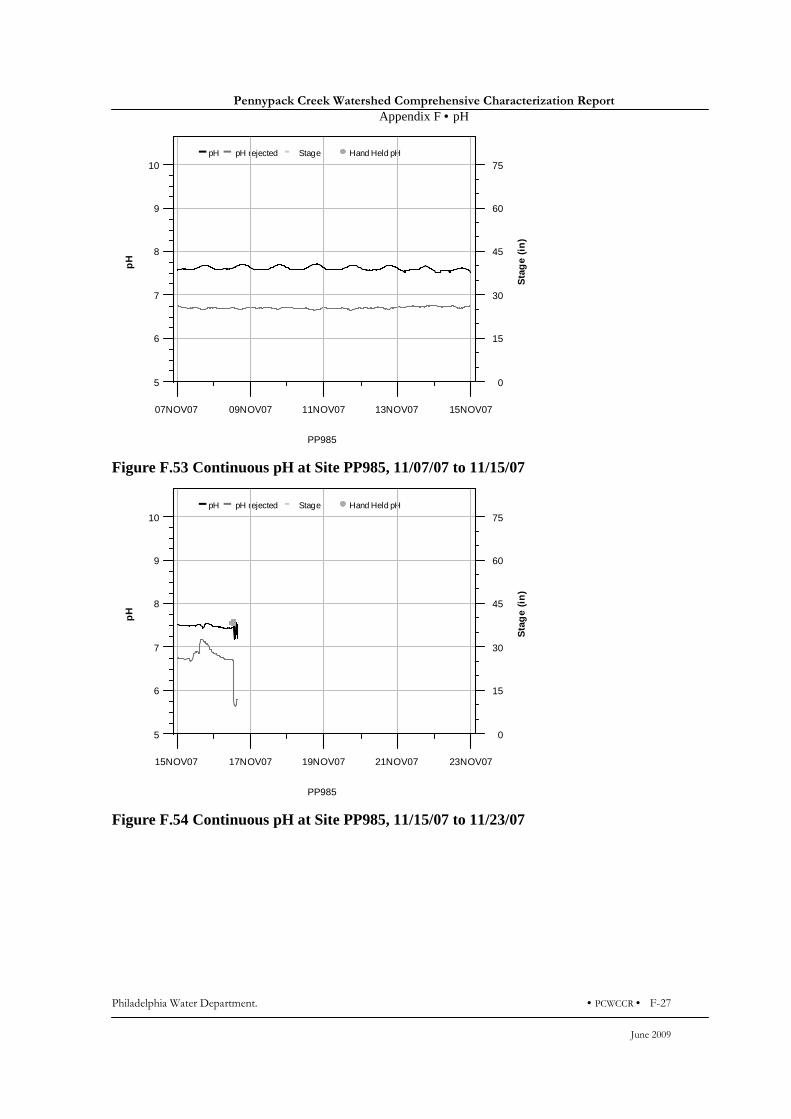
Pennypack Creek Watershed Comprehensive Characterization Report
Appendix F • pH
Philadelphia Water Department. • PCWCCR • F-27
June 2009
pH pH rejected Stage Hand Held pH
PP985
pH
5
6
7
8
9
10
07NOV07 09NOV07 11NOV07 13NOV07 15NOV07
Sta
ge
(in
)
0
15
30
45
60
75
Figure F.53 Continuous pH at Site PP985, 11/07/07 to 11/15/07
pH pH rejected Stage Hand Held pH
PP985
pH
5
6
7
8
9
10
15NOV07 17NOV07 19NOV07 21NOV07 23NOV07
Sta
ge
(in
)
0
15
30
45
60
75
Figure F.54 Continuous pH at Site PP985, 11/15/07 to 11/23/07

Pennypack Creek Watershed Comprehensive Characterization Report
Appendix F • pH
F-28 • PCWCCR • Philadelphia Water Department.
June 2009
pH pH rejected Stage Hand Held pH
PP985
pH
5
6
7
8
9
10
13NOV07 15NOV07 17NOV07 19NOV07 21NOV07
Sta
ge
(in
)
0
15
30
45
60
75
Figure F.55 Continuous pH at Site PP985, 11/13/07 to 11/21/07
pH pH rejected Stage Hand Held pH
PP985
pH
5
6
7
8
9
10
21NOV07 23NOV07 25NOV07 27NOV07 29NOV07
Sta
ge
(in
)
0
15
30
45
60
75
Figure F.56 Continuous pH at Site PP985, 11/21/07 to 11/29/07

Pennypack Creek Watershed Comprehensive Characterization Report
Appendix F • pH
Philadelphia Water Department. • PCWCCR • F-29
June 2009
pH pH rejected Stage Hand Held pH
PP985
pH
5
6
7
8
9
10
29NOV07 01DEC07 03DEC07 05DEC07 07DEC07
Sta
ge
(in
)
0
15
30
45
60
75
Figure F.57 Continuous pH at Site PP985, 11/29/07 to 12/07/07
pH pH rejected Stage Hand Held pH
PP1680
pH
5
6
7
8
9
10
01JUL07 03JUL07 05JUL07 07JUL07 09JUL07
Sta
ge
(in
)
0
15
30
45
60
75
Figure F.58 Continuous pH at Site PP1680, 07/01/07 to 07/09/07

Pennypack Creek Watershed Comprehensive Characterization Report
Appendix F • pH
F-30 • PCWCCR • Philadelphia Water Department.
June 2009
pH pH rejected Stage Hand Held pH
PP1680
pH
5
6
7
8
9
10
09JUL07 11JUL07 13JUL07 15JUL07 17JUL07
Sta
ge
(in
)
0
15
30
45
60
75
Figure F.59 Continuous pH at Site PP1680, 07/09/07 to 07/17/07
pH pH rejected Stage Hand Held pH
PP1680
pH
5
6
7
8
9
10
17JUL07 19JUL07 21JUL07 23JUL07 25JUL07
Sta
ge
(in
)
0
15
30
45
60
75
Figure F.60 Continuous pH at Site PP1680, 07/17/07 to 07/25/07
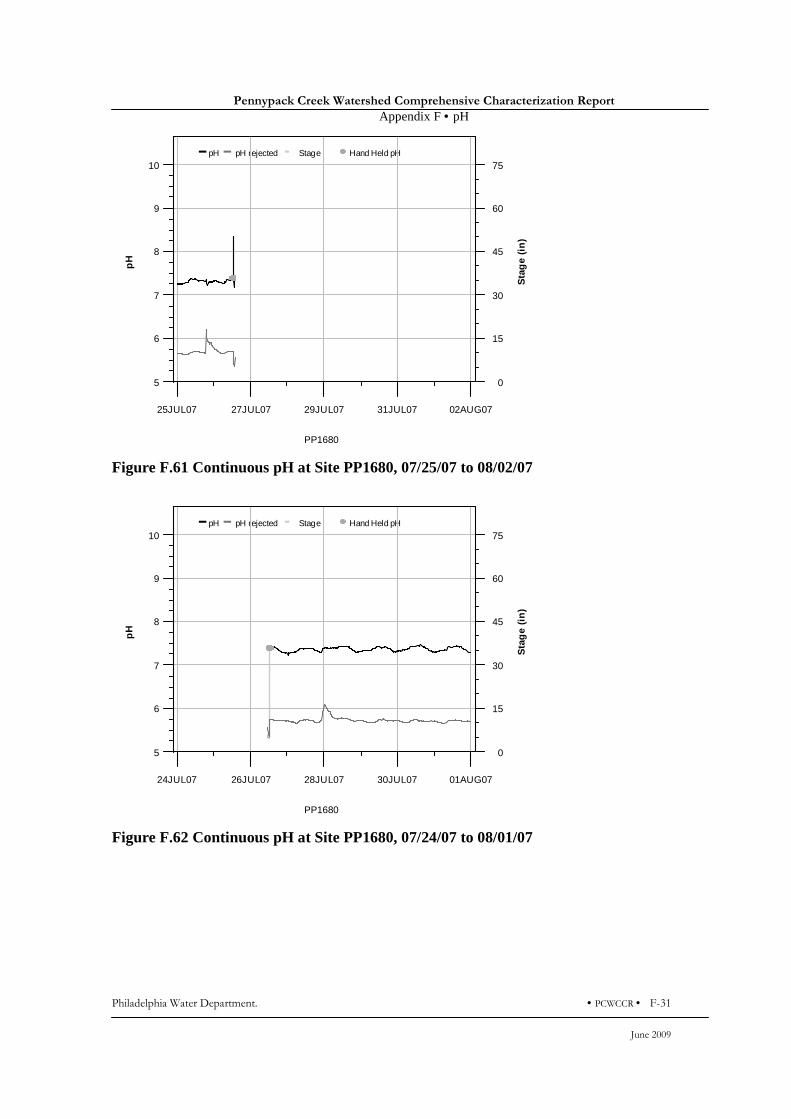
Pennypack Creek Watershed Comprehensive Characterization Report
Appendix F • pH
Philadelphia Water Department. • PCWCCR • F-31
June 2009
pH pH rejected Stage Hand Held pH
PP1680
pH
5
6
7
8
9
10
25JUL07 27JUL07 29JUL07 31JUL07 02AUG07
Sta
ge
(in
)
0
15
30
45
60
75
Figure F.61 Continuous pH at Site PP1680, 07/25/07 to 08/02/07
pH pH rejected Stage Hand Held pH
PP1680
pH
5
6
7
8
9
10
24JUL07 26JUL07 28JUL07 30JUL07 01AUG07
Sta
ge
(in
)
0
15
30
45
60
75
Figure F.62 Continuous pH at Site PP1680, 07/24/07 to 08/01/07
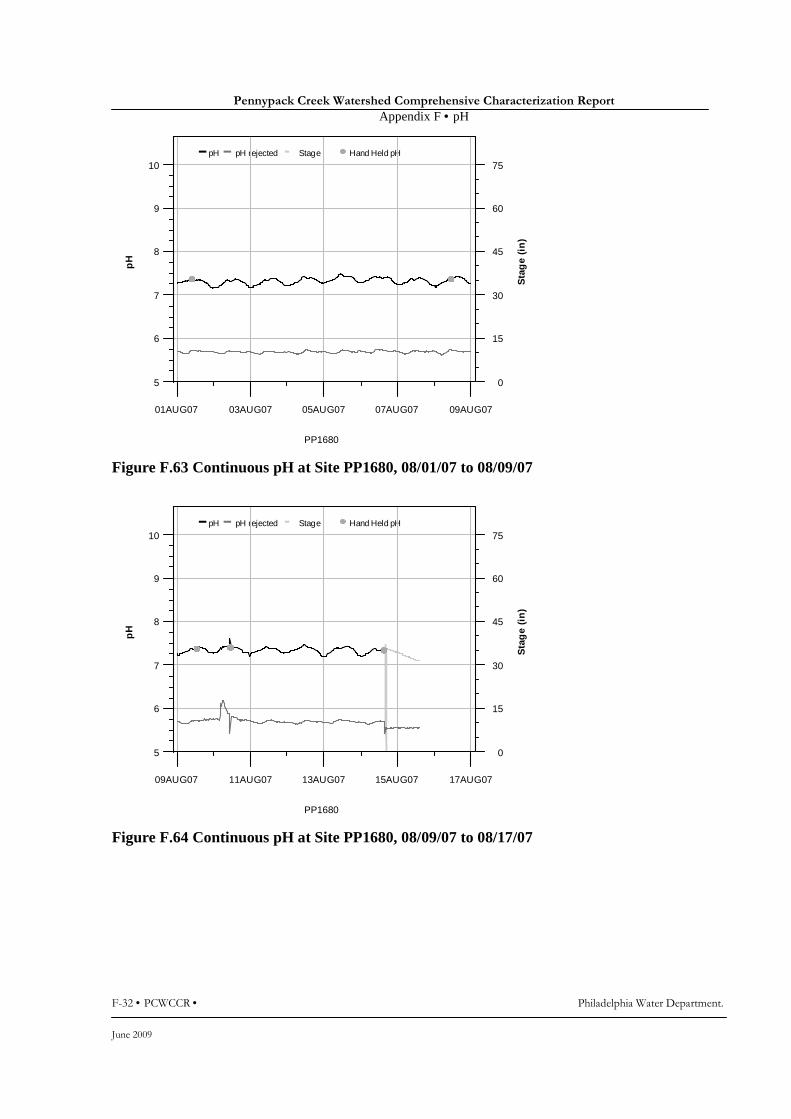
Pennypack Creek Watershed Comprehensive Characterization Report
Appendix F • pH
F-32 • PCWCCR • Philadelphia Water Department.
June 2009
pH pH rejected Stage Hand Held pH
PP1680
pH
5
6
7
8
9
10
01AUG07 03AUG07 05AUG07 07AUG07 09AUG07
Sta
ge
(in
)
0
15
30
45
60
75
Figure F.63 Continuous pH at Site PP1680, 08/01/07 to 08/09/07
pH pH rejected Stage Hand Held pH
PP1680
pH
5
6
7
8
9
10
09AUG07 11AUG07 13AUG07 15AUG07 17AUG07
Sta
ge
(in
)
0
15
30
45
60
75
Figure F.64 Continuous pH at Site PP1680, 08/09/07 to 08/17/07
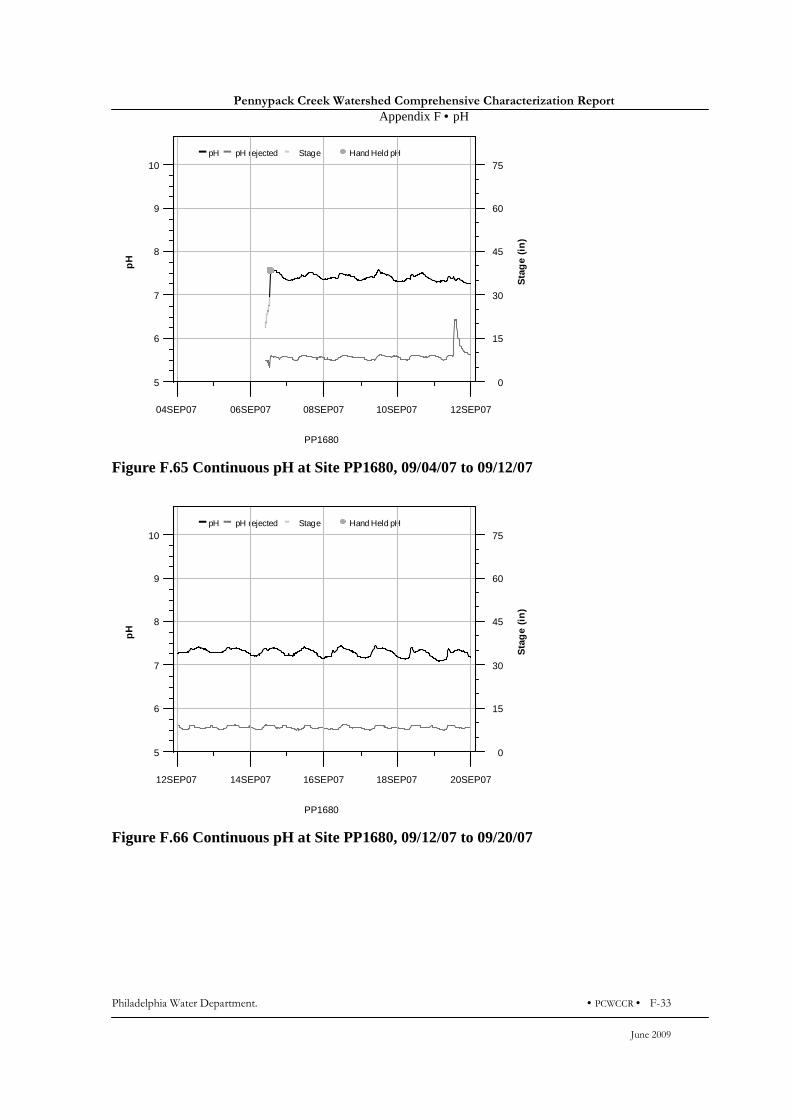
Pennypack Creek Watershed Comprehensive Characterization Report
Appendix F • pH
Philadelphia Water Department. • PCWCCR • F-33
June 2009
pH pH rejected Stage Hand Held pH
PP1680
pH
5
6
7
8
9
10
04SEP07 06SEP07 08SEP07 10SEP07 12SEP07
Sta
ge
(in
)
0
15
30
45
60
75
Figure F.65 Continuous pH at Site PP1680, 09/04/07 to 09/12/07
pH pH rejected Stage Hand Held pH
PP1680
pH
5
6
7
8
9
10
12SEP07 14SEP07 16SEP07 18SEP07 20SEP07
Sta
ge
(in
)
0
15
30
45
60
75
Figure F.66 Continuous pH at Site PP1680, 09/12/07 to 09/20/07
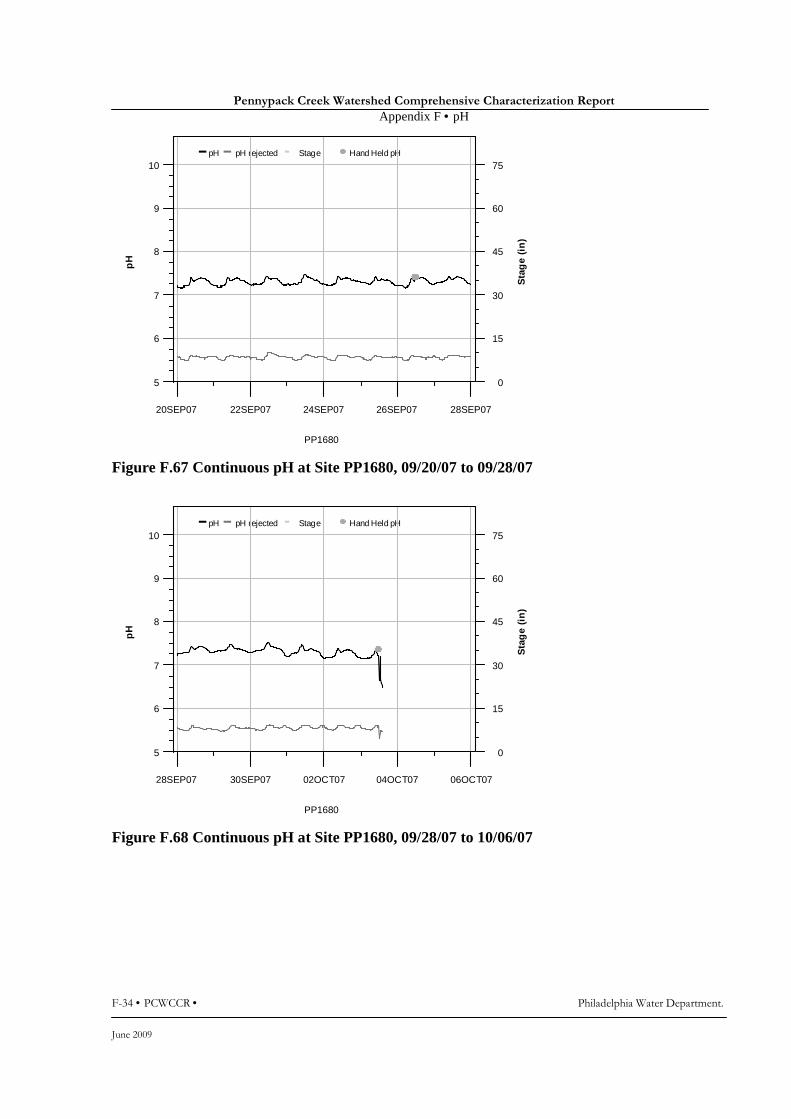
Pennypack Creek Watershed Comprehensive Characterization Report
Appendix F • pH
F-34 • PCWCCR • Philadelphia Water Department.
June 2009
pH pH rejected Stage Hand Held pH
PP1680
pH
5
6
7
8
9
10
20SEP07 22SEP07 24SEP07 26SEP07 28SEP07
Sta
ge
(in
)
0
15
30
45
60
75
Figure F.67 Continuous pH at Site PP1680, 09/20/07 to 09/28/07
pH pH rejected Stage Hand Held pH
PP1680
pH
5
6
7
8
9
10
28SEP07 30SEP07 02OCT07 04OCT07 06OCT07
Sta
ge
(in
)
0
15
30
45
60
75
Figure F.68 Continuous pH at Site PP1680, 09/28/07 to 10/06/07
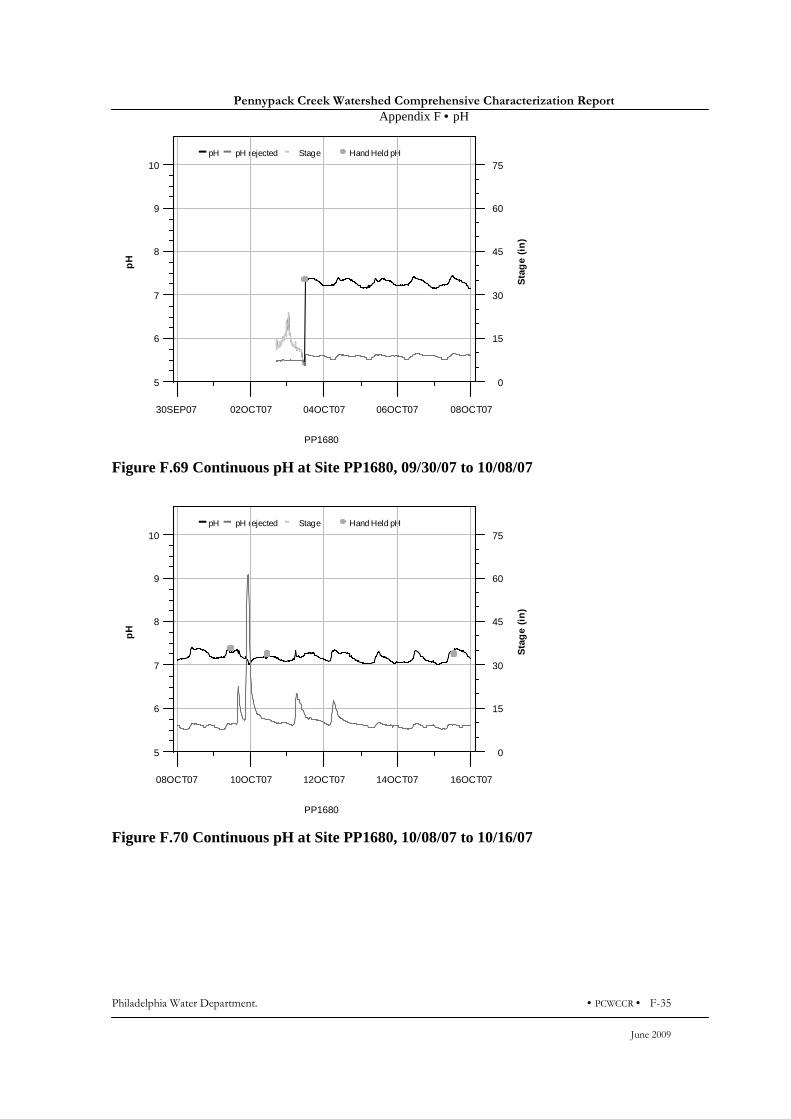
Pennypack Creek Watershed Comprehensive Characterization Report
Appendix F • pH
Philadelphia Water Department. • PCWCCR • F-35
June 2009
pH pH rejected Stage Hand Held pH
PP1680
pH
5
6
7
8
9
10
30SEP07 02OCT07 04OCT07 06OCT07 08OCT07
Sta
ge
(in
)
0
15
30
45
60
75
Figure F.69 Continuous pH at Site PP1680, 09/30/07 to 10/08/07
pH pH rejected Stage Hand Held pH
PP1680
pH
5
6
7
8
9
10
08OCT07 10OCT07 12OCT07 14OCT07 16OCT07
Sta
ge
(in
)
0
15
30
45
60
75
Figure F.70 Continuous pH at Site PP1680, 10/08/07 to 10/16/07
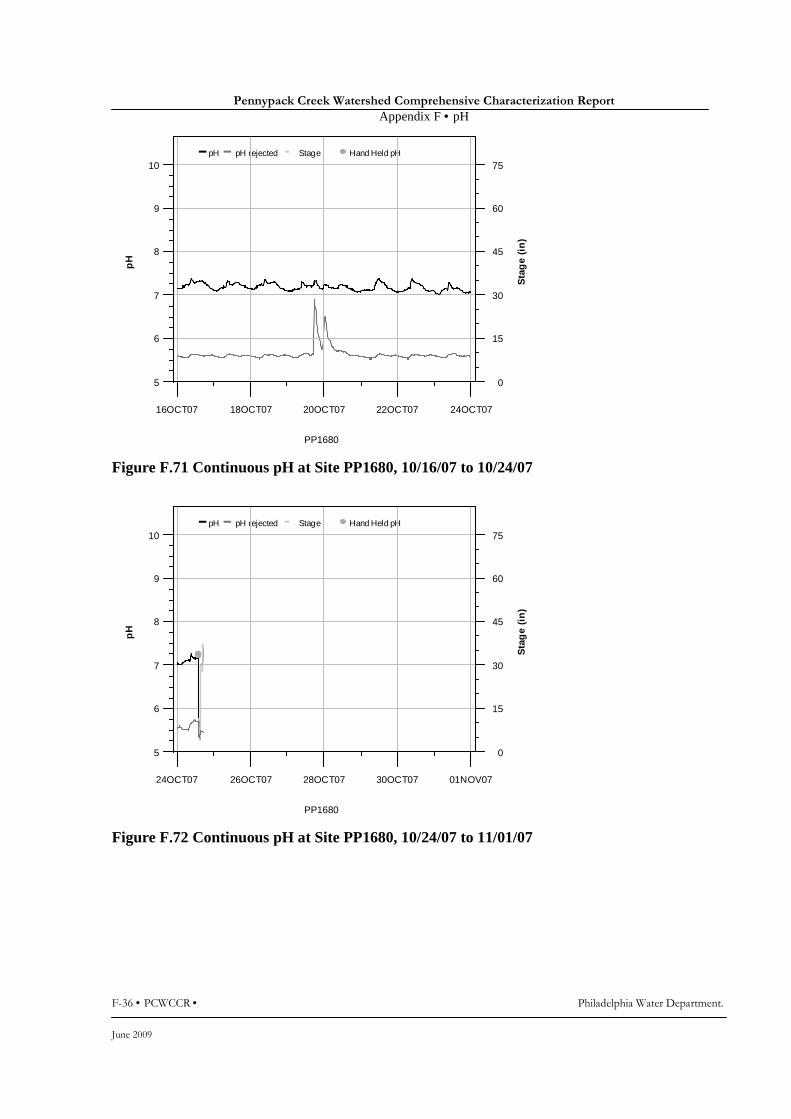
Pennypack Creek Watershed Comprehensive Characterization Report
Appendix F • pH
F-36 • PCWCCR • Philadelphia Water Department.
June 2009
pH pH rejected Stage Hand Held pH
PP1680
pH
5
6
7
8
9
10
16OCT07 18OCT07 20OCT07 22OCT07 24OCT07
Sta
ge
(in
)
0
15
30
45
60
75
Figure F.71 Continuous pH at Site PP1680, 10/16/07 to 10/24/07
pH pH rejected Stage Hand Held pH
PP1680
pH
5
6
7
8
9
10
24OCT07 26OCT07 28OCT07 30OCT07 01NOV07
Sta
ge
(in
)
0
15
30
45
60
75
Figure F.72 Continuous pH at Site PP1680, 10/24/07 to 11/01/07
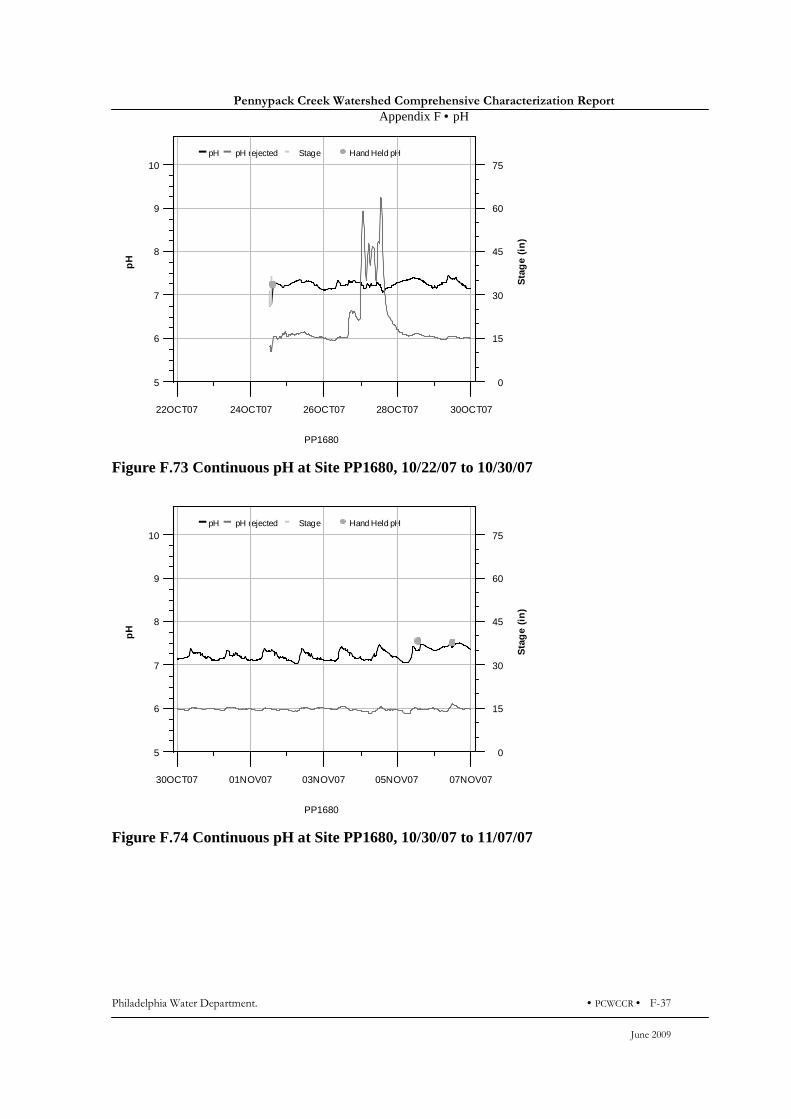
Pennypack Creek Watershed Comprehensive Characterization Report
Appendix F • pH
Philadelphia Water Department. • PCWCCR • F-37
June 2009
pH pH rejected Stage Hand Held pH
PP1680
pH
5
6
7
8
9
10
22OCT07 24OCT07 26OCT07 28OCT07 30OCT07
Sta
ge
(in
)
0
15
30
45
60
75
Figure F.73 Continuous pH at Site PP1680, 10/22/07 to 10/30/07
pH pH rejected Stage Hand Held pH
PP1680
pH
5
6
7
8
9
10
30OCT07 01NOV07 03NOV07 05NOV07 07NOV07
Sta
ge
(in
)
0
15
30
45
60
75
Figure F.74 Continuous pH at Site PP1680, 10/30/07 to 11/07/07

Pennypack Creek Watershed Comprehensive Characterization Report
Appendix F • pH
F-38 • PCWCCR • Philadelphia Water Department.
June 2009
pH pH rejected Stage Hand Held pH
PP1680
pH
5
6
7
8
9
10
07NOV07 09NOV07 11NOV07 13NOV07 15NOV07
Sta
ge
(in
)
0
15
30
45
60
75
Figure F.75 Continuous pH at Site PP1680, 11/07/07 to 11/15/07
pH pH rejected Stage Hand Held pH
PP1680
pH
5
6
7
8
9
10
15NOV07 17NOV07 19NOV07 21NOV07 23NOV07
Sta
ge
(in
)
0
15
30
45
60
75
Figure F.76 Continuous pH at Site PP1680, 11/15/07 to 11/23/07

Pennypack Creek Watershed Comprehensive Characterization Report
Appendix F • pH
Philadelphia Water Department. • PCWCCR • F-39
June 2009
pH pH rejected Stage Hand Held pH
PP1680
pH
5
6
7
8
9
10
13NOV07 15NOV07 17NOV07 19NOV07 21NOV07
Sta
ge
(in
)
0
15
30
45
60
75
Figure F.77 Continuous pH at Site PP1680, 11/13/07 to 11/21/07
pH pH rejected Stage Hand Held pH
PP1680
pH
5
6
7
8
9
10
21NOV07 23NOV07 25NOV07 27NOV07 29NOV07
Sta
ge
(in
)
0
15
30
45
60
75
Figure F.78 Continuous pH at Site PP1680, 11/21/07 to 11/29/07

Pennypack Creek Watershed Comprehensive Characterization Report
Appendix F • pH
F-40 • PCWCCR • Philadelphia Water Department.
June 2009
pH pH rejected Stage Hand Held pH
PP1680
pH
5
6
7
8
9
10
29NOV07 01DEC07 03DEC07 05DEC07 07DEC07
Sta
ge
(in
)
0
15
30
45
60
75
Figure F.79 Continuous pH at Site PP1680, 11/29/07 to 12/07/07
pH pH rejected Stage Hand Held pH
PP1680
pH
5
6
7
8
9
10
01MAR08 03MAR08 05MAR08 07MAR08 09MAR08
Sta
ge
(in
)
0
15
30
45
60
75
Figure F.80 Continuous pH at Site PP1680, 03/01/08 to 03/09/08
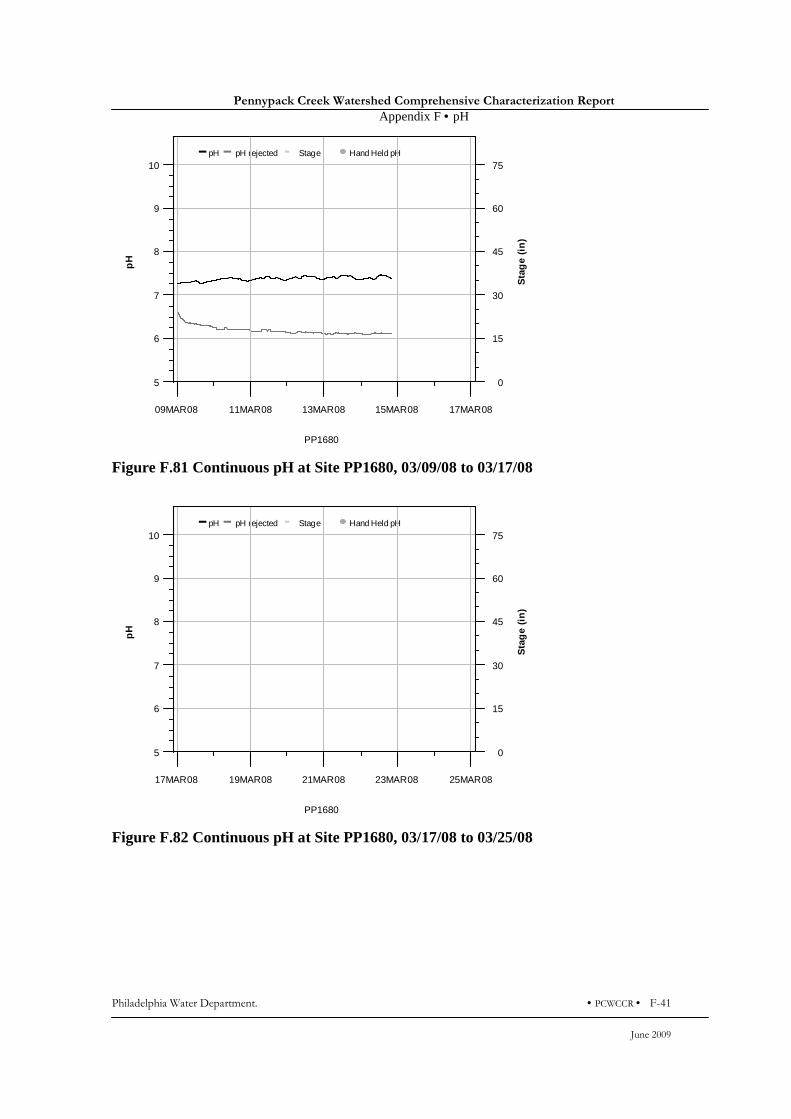
Pennypack Creek Watershed Comprehensive Characterization Report
Appendix F • pH
Philadelphia Water Department. • PCWCCR • F-41
June 2009
pH pH rejected Stage Hand Held pH
PP1680
pH
5
6
7
8
9
10
09MAR08 11MAR08 13MAR08 15MAR08 17MAR08
Sta
ge
(in
)
0
15
30
45
60
75
Figure F.81 Continuous pH at Site PP1680, 03/09/08 to 03/17/08
pH pH rejected Stage Hand Held pH
PP1680
pH
5
6
7
8
9
10
17MAR08 19MAR08 21MAR08 23MAR08 25MAR08
Sta
ge
(in
)
0
15
30
45
60
75
Figure F.82 Continuous pH at Site PP1680, 03/17/08 to 03/25/08

Pennypack Creek Watershed Comprehensive Characterization Report
Appendix F • pH
F-42 • PCWCCR • Philadelphia Water Department.
June 2009
pH pH rejected Stage Hand Held pH
PP1680
pH
5
6
7
8
9
10
23MAR08 25MAR08 27MAR08 29MAR08 31MAR08
Sta
ge
(in
)
0
15
30
45
60
75
Figure F.83 Continuous pH at Site PP1680, 03/23/08 to 03/31/08
pH pH rejected Stage Hand Held pH
PP1680
pH
5
6
7
8
9
10
31MAR08 02APR08 04APR08 06APR08 08APR08
Sta
ge
(in
)
0
15
30
45
60
75
Figure F.84 Continuous pH at Site PP1680, 03/31/08 to 04/08/08

Pennypack Creek Watershed Comprehensive Characterization Report
Appendix F • pH
Philadelphia Water Department. • PCWCCR • F-43
June 2009
pH pH rejected Stage Hand Held pH
PP1680
pH
5
6
7
8
9
10
08APR08 10APR08 12APR08 14APR08 16APR08
Sta
ge
(in
)
0
15
30
45
60
75
Figure F.85 Continuous pH at Site PP1680, 04/08/08 to 04/16/08
pH pH rejected Stage Hand Held pH
PP1680
pH
5
6
7
8
9
10
06APR08 08APR08 10APR08 12APR08 14APR08
Sta
ge
(in
)
0
15
30
45
60
75
Figure F.86 Continuous pH at Site PP1680, 04/06/08 to 04/14/08
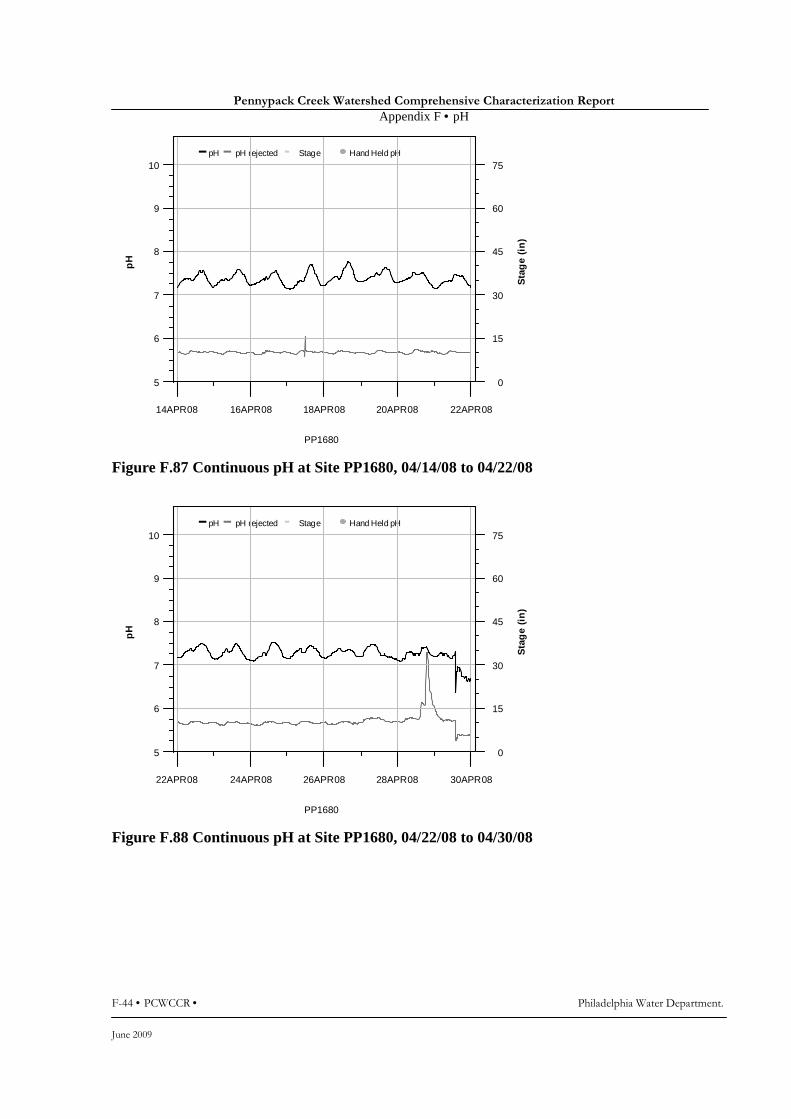
Pennypack Creek Watershed Comprehensive Characterization Report
Appendix F • pH
F-44 • PCWCCR • Philadelphia Water Department.
June 2009
pH pH rejected Stage Hand Held pH
PP1680
pH
5
6
7
8
9
10
14APR08 16APR08 18APR08 20APR08 22APR08
Sta
ge
(in
)
0
15
30
45
60
75
Figure F.87 Continuous pH at Site PP1680, 04/14/08 to 04/22/08
pH pH rejected Stage Hand Held pH
PP1680
pH
5
6
7
8
9
10
22APR08 24APR08 26APR08 28APR08 30APR08
Sta
ge
(in
)
0
15
30
45
60
75
Figure F.88 Continuous pH at Site PP1680, 04/22/08 to 04/30/08
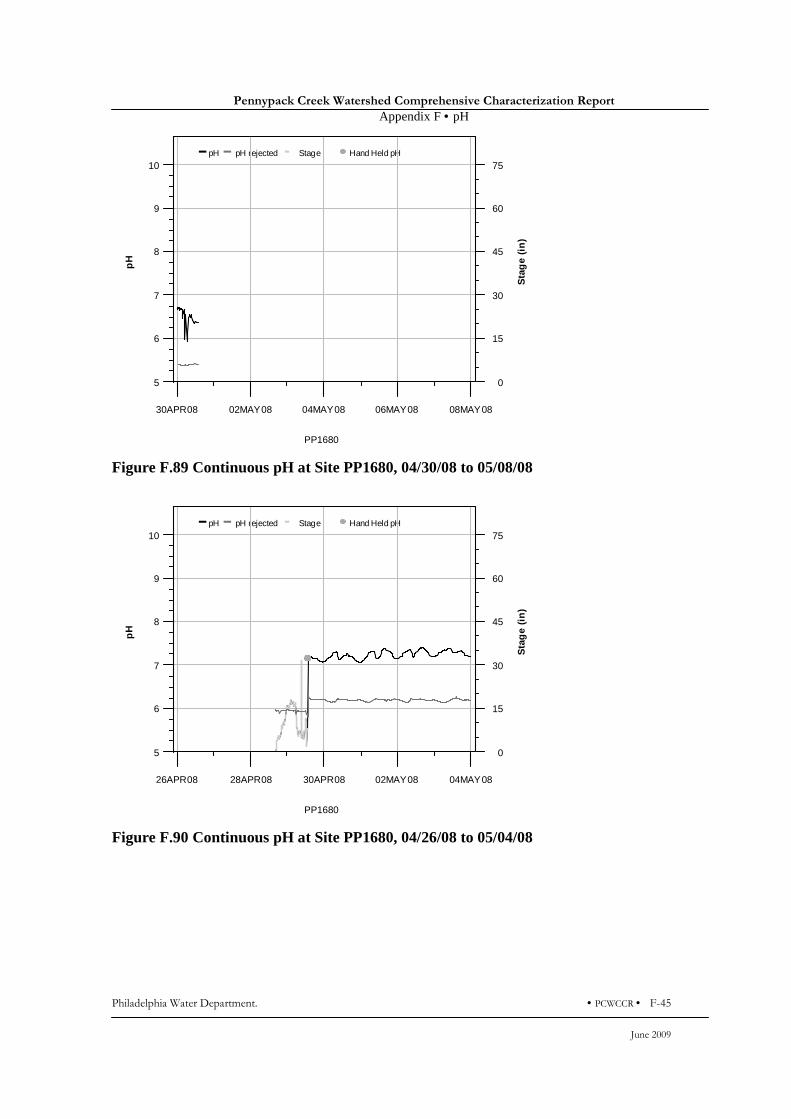
Pennypack Creek Watershed Comprehensive Characterization Report
Appendix F • pH
Philadelphia Water Department. • PCWCCR • F-45
June 2009
pH pH rejected Stage Hand Held pH
PP1680
pH
5
6
7
8
9
10
30APR08 02MAY08 04MAY08 06MAY08 08MAY08
Sta
ge
(in
)
0
15
30
45
60
75
Figure F.89 Continuous pH at Site PP1680, 04/30/08 to 05/08/08
pH pH rejected Stage Hand Held pH
PP1680
pH
5
6
7
8
9
10
26APR08 28APR08 30APR08 02MAY08 04MAY08
Sta
ge
(in
)
0
15
30
45
60
75
Figure F.90 Continuous pH at Site PP1680, 04/26/08 to 05/04/08
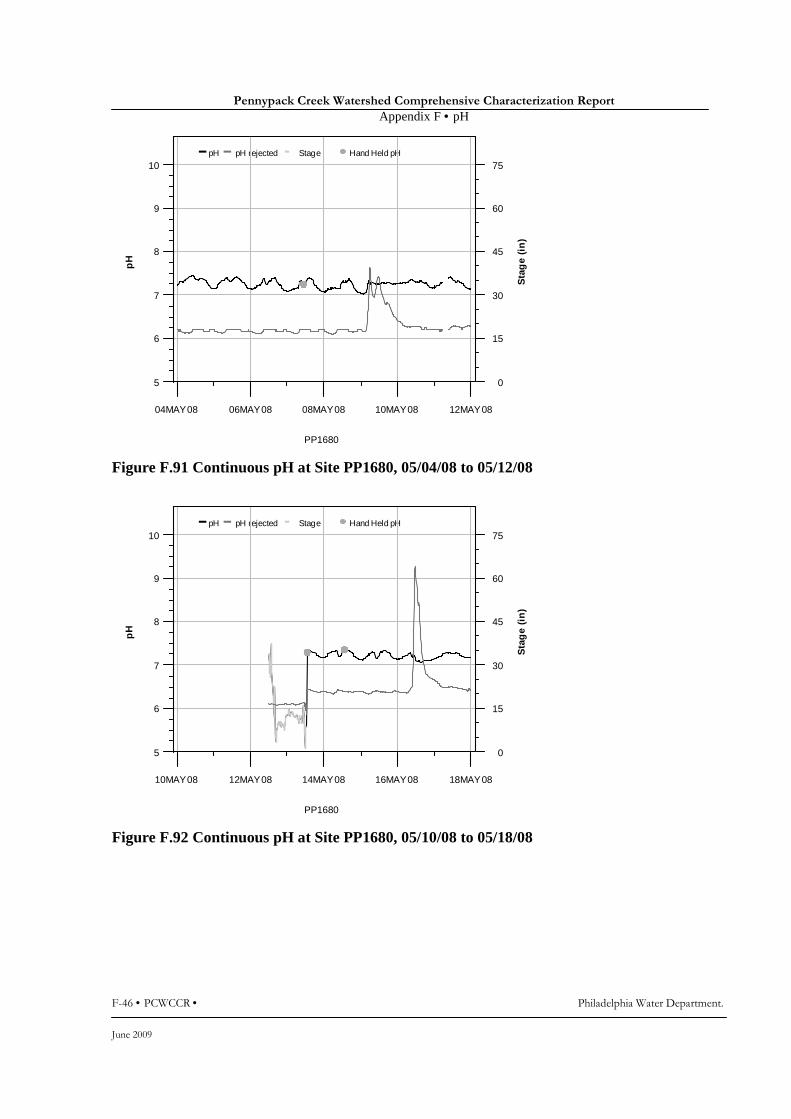
Pennypack Creek Watershed Comprehensive Characterization Report
Appendix F • pH
F-46 • PCWCCR • Philadelphia Water Department.
June 2009
pH pH rejected Stage Hand Held pH
PP1680
pH
5
6
7
8
9
10
04MAY08 06MAY08 08MAY08 10MAY08 12MAY08
Sta
ge
(in
)
0
15
30
45
60
75
Figure F.91 Continuous pH at Site PP1680, 05/04/08 to 05/12/08
pH pH rejected Stage Hand Held pH
PP1680
pH
5
6
7
8
9
10
10MAY08 12MAY08 14MAY08 16MAY08 18MAY08
Sta
ge
(in
)
0
15
30
45
60
75
Figure F.92 Continuous pH at Site PP1680, 05/10/08 to 05/18/08
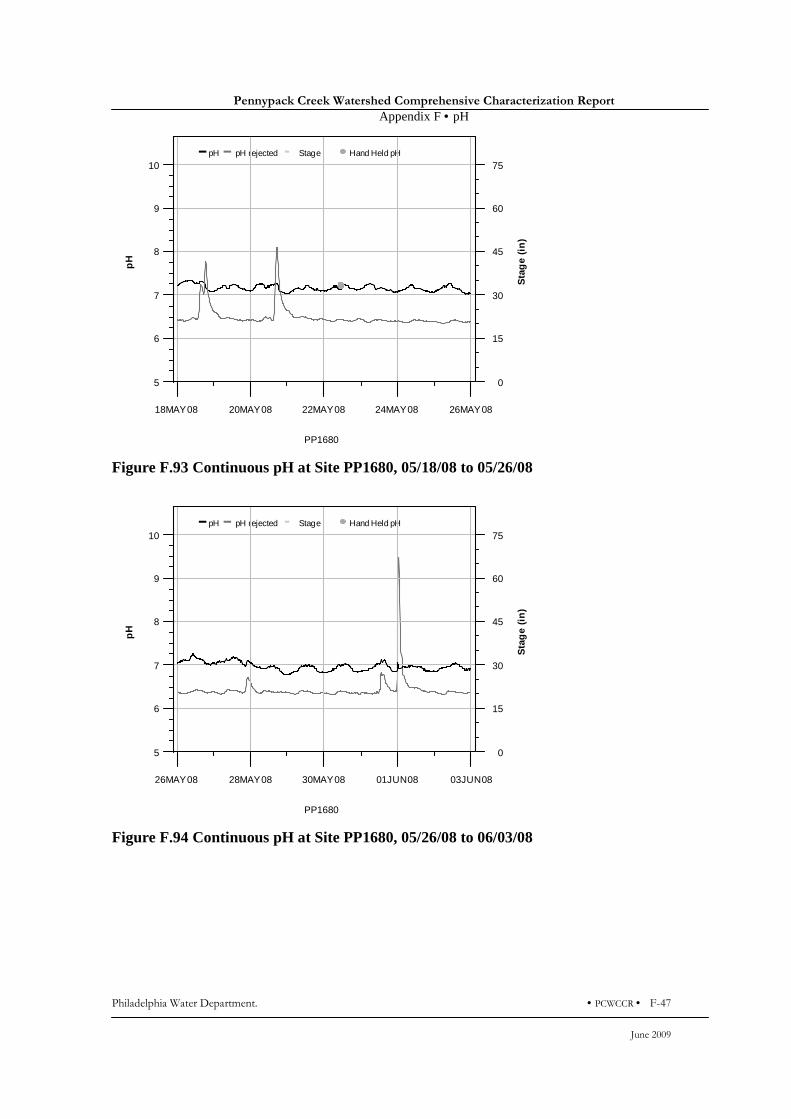
Pennypack Creek Watershed Comprehensive Characterization Report
Appendix F • pH
Philadelphia Water Department. • PCWCCR • F-47
June 2009
pH pH rejected Stage Hand Held pH
PP1680
pH
5
6
7
8
9
10
18MAY08 20MAY08 22MAY08 24MAY08 26MAY08
Sta
ge
(in
)
0
15
30
45
60
75
Figure F.93 Continuous pH at Site PP1680, 05/18/08 to 05/26/08
pH pH rejected Stage Hand Held pH
PP1680
pH
5
6
7
8
9
10
26MAY08 28MAY08 30MAY08 01JUN08 03JUN08
Sta
ge
(in
)
0
15
30
45
60
75
Figure F.94 Continuous pH at Site PP1680, 05/26/08 to 06/03/08

Pennypack Creek Watershed Comprehensive Characterization Report
Appendix F • pH
F-48 • PCWCCR • Philadelphia Water Department.
June 2009
pH pH rejected Stage Hand Held pH
PP1680
pH
5
6
7
8
9
10
03JUN08 05JUN08 07JUN08 09JUN08 11JUN08
Sta
ge
(in
)
0
15
30
45
60
75
Figure F.95 Continuous pH at Site PP1680, 06/03/08 to 06/11/08
pH pH rejected Stage Hand Held pH
PP1850
pH
5
6
7
8
9
10
01JUL07 03JUL07 05JUL07 07JUL07 09JUL07
Sta
ge
(in
)
0
15
30
45
60
75
Figure F.96 Continuous pH at Site PP1850, 07/01/07 to 07/09/07

Pennypack Creek Watershed Comprehensive Characterization Report
Appendix F • pH
Philadelphia Water Department. • PCWCCR • F-49
June 2009
pH pH rejected Stage Hand Held pH
PP1850
pH
5
6
7
8
9
10
09JUL07 11JUL07 13JUL07 15JUL07 17JUL07
Sta
ge
(in
)
0
15
30
45
60
75
Figure F.97 Continuous pH at Site PP1850, 07/09/07 to 07/17/07
pH pH rejected Stage Hand Held pH
PP1850
pH
5
6
7
8
9
10
17JUL07 19JUL07 21JUL07 23JUL07 25JUL07
Sta
ge
(in
)
0
15
30
45
60
75
Figure F.98 Continuous pH at Site PP1850, 07/17/07 to 07/25/07
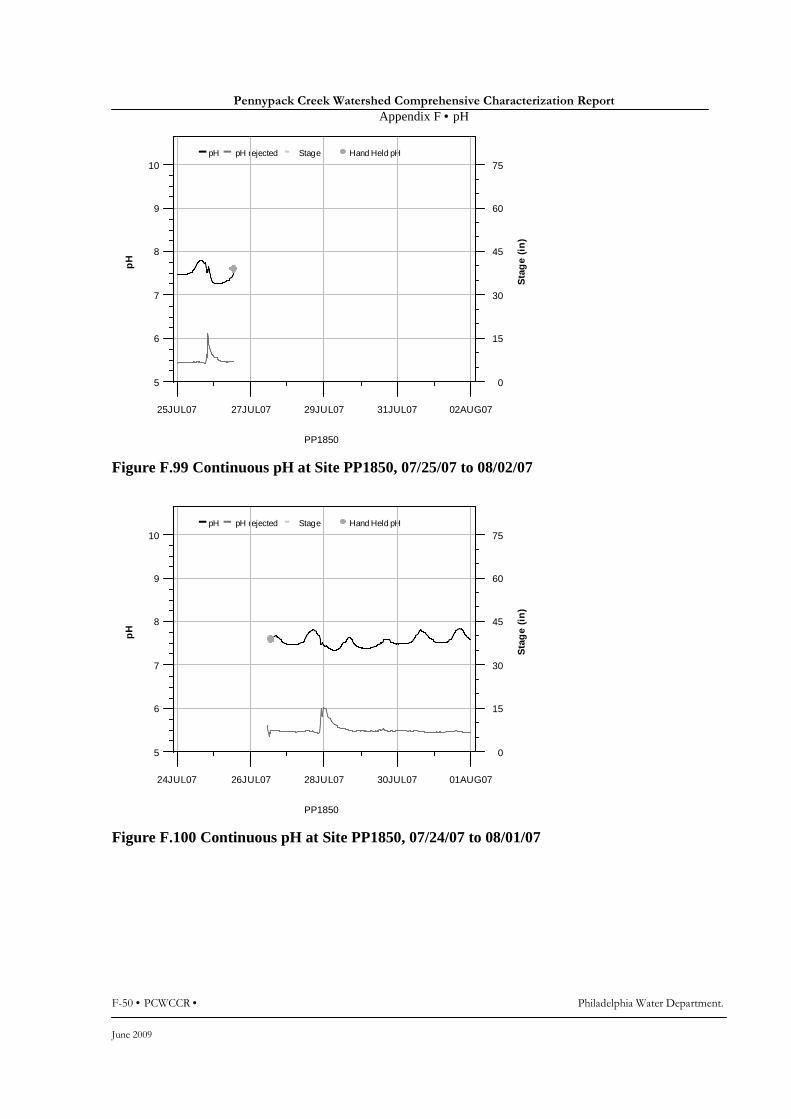
Pennypack Creek Watershed Comprehensive Characterization Report
Appendix F • pH
F-50 • PCWCCR • Philadelphia Water Department.
June 2009
pH pH rejected Stage Hand Held pH
PP1850
pH
5
6
7
8
9
10
25JUL07 27JUL07 29JUL07 31JUL07 02AUG07
Sta
ge
(in
)
0
15
30
45
60
75
Figure F.99 Continuous pH at Site PP1850, 07/25/07 to 08/02/07
pH pH rejected Stage Hand Held pH
PP1850
pH
5
6
7
8
9
10
24JUL07 26JUL07 28JUL07 30JUL07 01AUG07
Sta
ge
(in
)
0
15
30
45
60
75
Figure F.100 Continuous pH at Site PP1850, 07/24/07 to 08/01/07
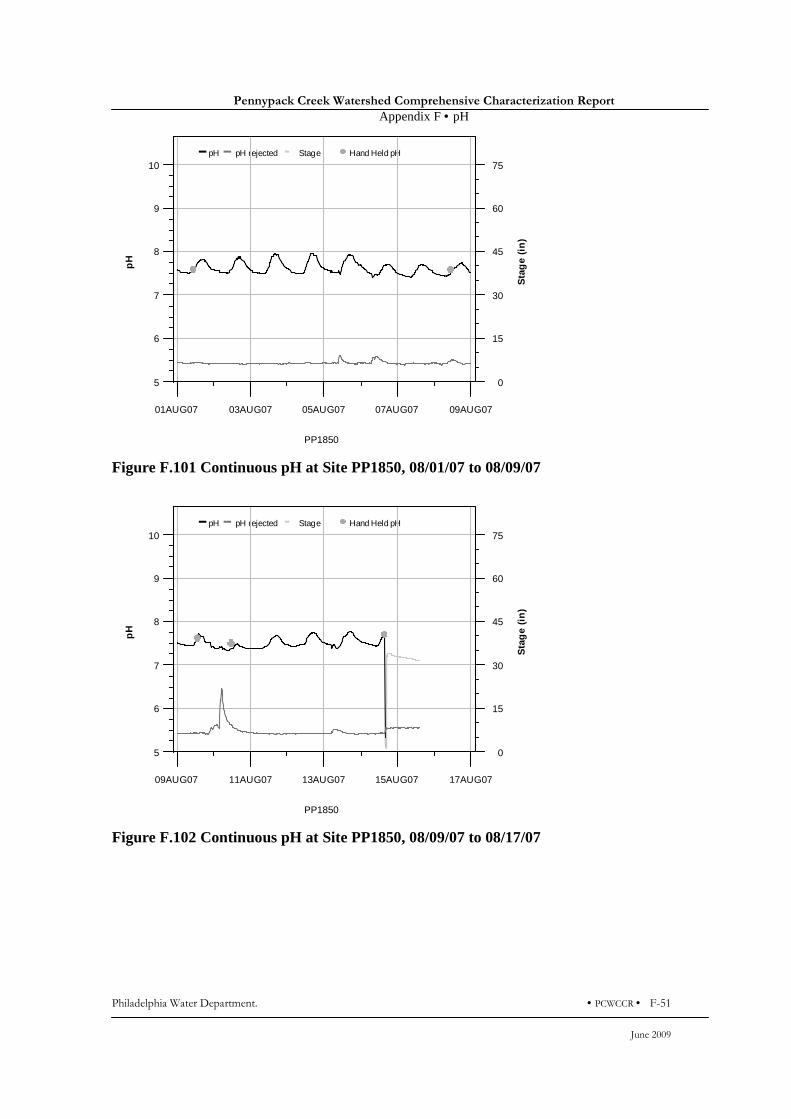
Pennypack Creek Watershed Comprehensive Characterization Report
Appendix F • pH
Philadelphia Water Department. • PCWCCR • F-51
June 2009
pH pH rejected Stage Hand Held pH
PP1850
pH
5
6
7
8
9
10
01AUG07 03AUG07 05AUG07 07AUG07 09AUG07
Sta
ge
(in
)
0
15
30
45
60
75
Figure F.101 Continuous pH at Site PP1850, 08/01/07 to 08/09/07
pH pH rejected Stage Hand Held pH
PP1850
pH
5
6
7
8
9
10
09AUG07 11AUG07 13AUG07 15AUG07 17AUG07
Sta
ge
(in
)
0
15
30
45
60
75
Figure F.102 Continuous pH at Site PP1850, 08/09/07 to 08/17/07
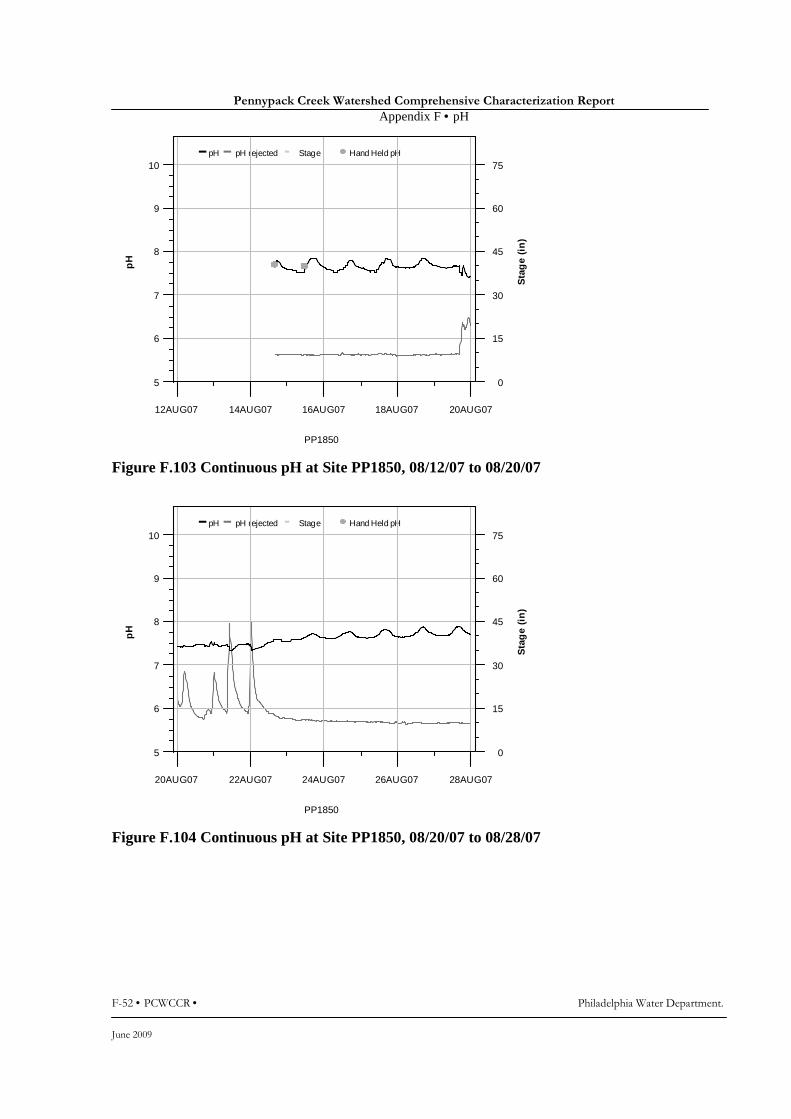
Pennypack Creek Watershed Comprehensive Characterization Report
Appendix F • pH
F-52 • PCWCCR • Philadelphia Water Department.
June 2009
pH pH rejected Stage Hand Held pH
PP1850
pH
5
6
7
8
9
10
12AUG07 14AUG07 16AUG07 18AUG07 20AUG07
Sta
ge
(in
)
0
15
30
45
60
75
Figure F.103 Continuous pH at Site PP1850, 08/12/07 to 08/20/07
pH pH rejected Stage Hand Held pH
PP1850
pH
5
6
7
8
9
10
20AUG07 22AUG07 24AUG07 26AUG07 28AUG07
Sta
ge
(in
)
0
15
30
45
60
75
Figure F.104 Continuous pH at Site PP1850, 08/20/07 to 08/28/07
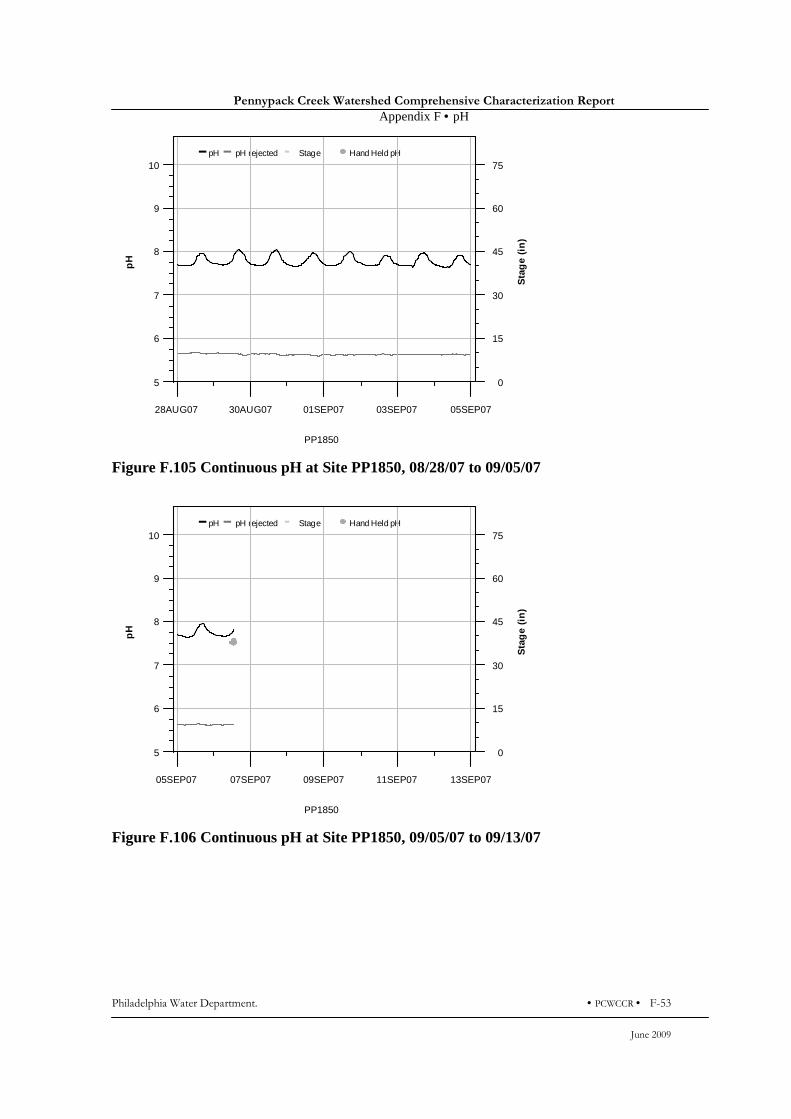
Pennypack Creek Watershed Comprehensive Characterization Report
Appendix F • pH
Philadelphia Water Department. • PCWCCR • F-53
June 2009
pH pH rejected Stage Hand Held pH
PP1850
pH
5
6
7
8
9
10
28AUG07 30AUG07 01SEP07 03SEP07 05SEP07
Sta
ge
(in
)
0
15
30
45
60
75
Figure F.105 Continuous pH at Site PP1850, 08/28/07 to 09/05/07
pH pH rejected Stage Hand Held pH
PP1850
pH
5
6
7
8
9
10
05SEP07 07SEP07 09SEP07 11SEP07 13SEP07
Sta
ge
(in
)
0
15
30
45
60
75
Figure F.106 Continuous pH at Site PP1850, 09/05/07 to 09/13/07
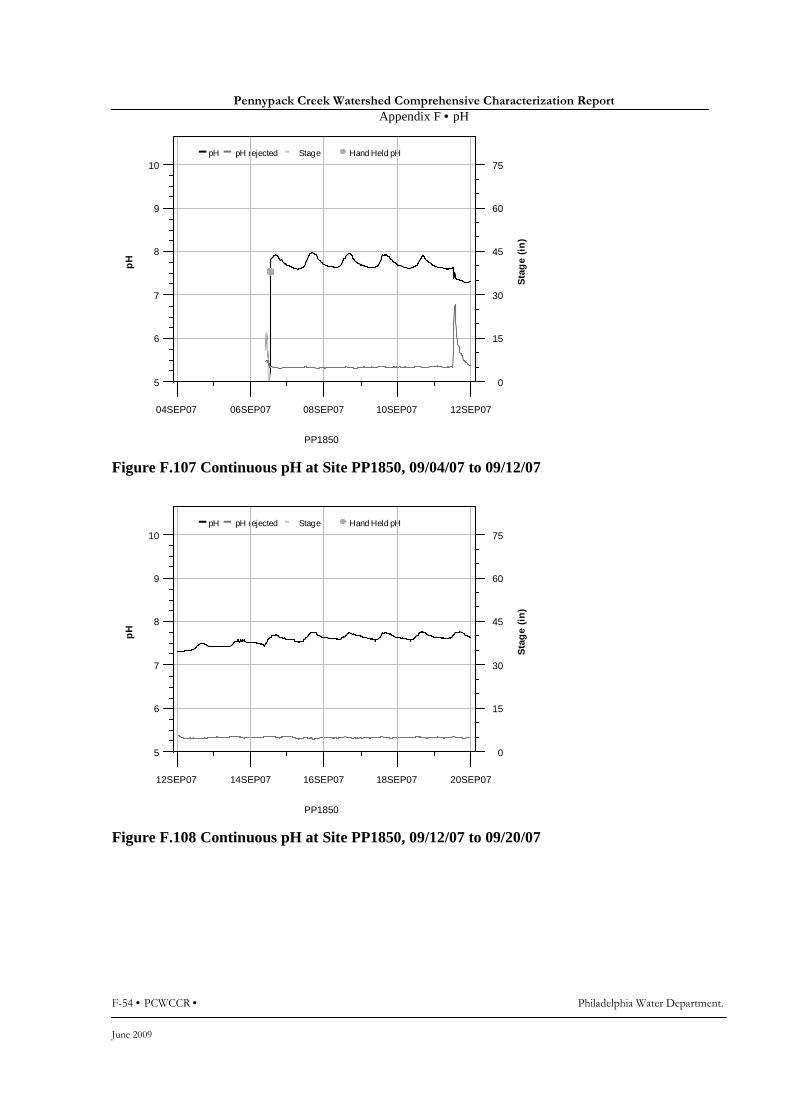
Pennypack Creek Watershed Comprehensive Characterization Report
Appendix F • pH
F-54 • PCWCCR • Philadelphia Water Department.
June 2009
pH pH rejected Stage Hand Held pH
PP1850
pH
5
6
7
8
9
10
04SEP07 06SEP07 08SEP07 10SEP07 12SEP07
Sta
ge
(in
)
0
15
30
45
60
75
Figure F.107 Continuous pH at Site PP1850, 09/04/07 to 09/12/07
pH pH rejected Stage Hand Held pH
PP1850
pH
5
6
7
8
9
10
12SEP07 14SEP07 16SEP07 18SEP07 20SEP07
Sta
ge
(in
)
0
15
30
45
60
75
Figure F.108 Continuous pH at Site PP1850, 09/12/07 to 09/20/07

Pennypack Creek Watershed Comprehensive Characterization Report
Appendix F • pH
Philadelphia Water Department. • PCWCCR • F-55
June 2009
pH pH rejected Stage Hand Held pH
PP1850
pH
5
6
7
8
9
10
20SEP07 22SEP07 24SEP07 26SEP07 28SEP07
Sta
ge
(in
)
0
15
30
45
60
75
Figure F.109 Continuous pH at Site PP1850, 09/20/07 to 09/28/07
pH pH rejected Stage Hand Held pH
PP1850
pH
5
6
7
8
9
10
28SEP07 30SEP07 02OCT07 04OCT07 06OCT07
Sta
ge
(in
)
0
15
30
45
60
75
Figure F.110 Continuous pH at Site PP1850, 09/28/07 to 10/06/07
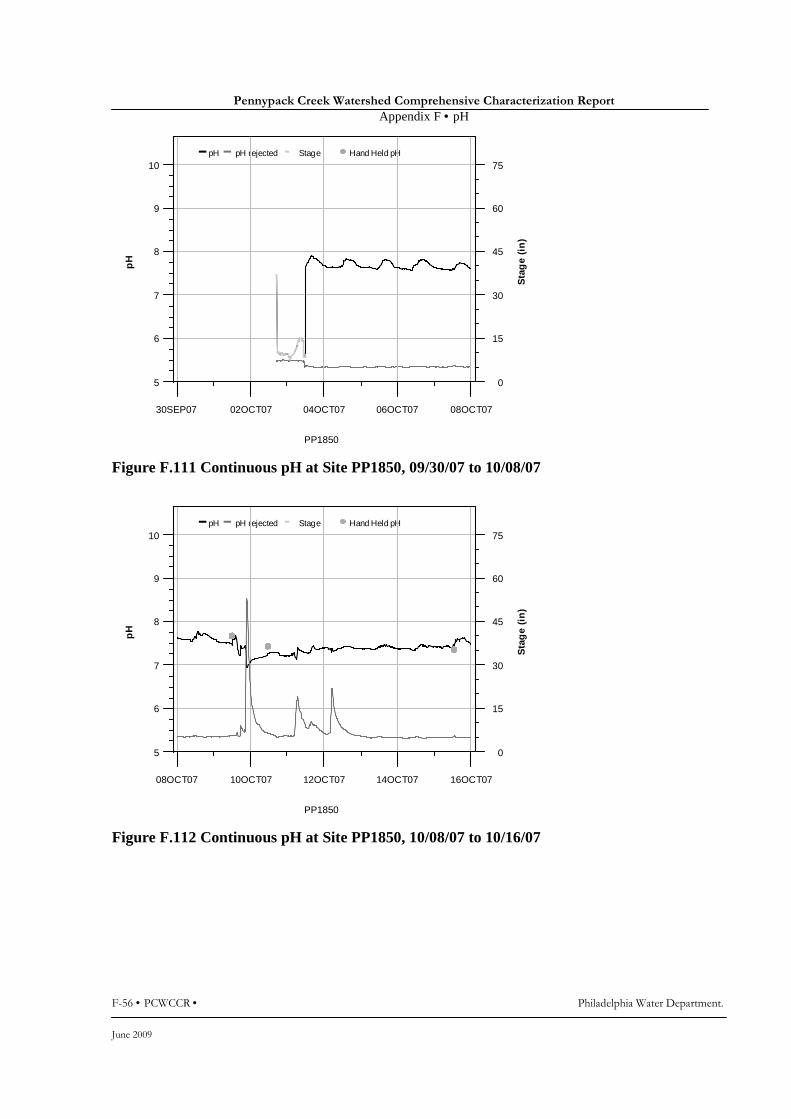
Pennypack Creek Watershed Comprehensive Characterization Report
Appendix F • pH
F-56 • PCWCCR • Philadelphia Water Department.
June 2009
pH pH rejected Stage Hand Held pH
PP1850
pH
5
6
7
8
9
10
30SEP07 02OCT07 04OCT07 06OCT07 08OCT07
Sta
ge
(in
)
0
15
30
45
60
75
Figure F.111 Continuous pH at Site PP1850, 09/30/07 to 10/08/07
pH pH rejected Stage Hand Held pH
PP1850
pH
5
6
7
8
9
10
08OCT07 10OCT07 12OCT07 14OCT07 16OCT07
Sta
ge
(in
)
0
15
30
45
60
75
Figure F.112 Continuous pH at Site PP1850, 10/08/07 to 10/16/07

Pennypack Creek Watershed Comprehensive Characterization Report
Appendix F • pH
Philadelphia Water Department. • PCWCCR • F-57
June 2009
pH pH rejected Stage Hand Held pH
PP1850
pH
5
6
7
8
9
10
16OCT07 18OCT07 20OCT07 22OCT07 24OCT07
Sta
ge
(in
)
0
15
30
45
60
75
Figure F.113 Continuous pH at Site PP1850, 10/16/07 to 10/24/07
pH pH rejected Stage Hand Held pH
PP1850
pH
5
6
7
8
9
10
24OCT07 26OCT07 28OCT07 30OCT07 01NOV07
Sta
ge
(in
)
0
15
30
45
60
75
Figure F.114 Continuous pH at Site PP1850, 10/24/07 to 11/01/07
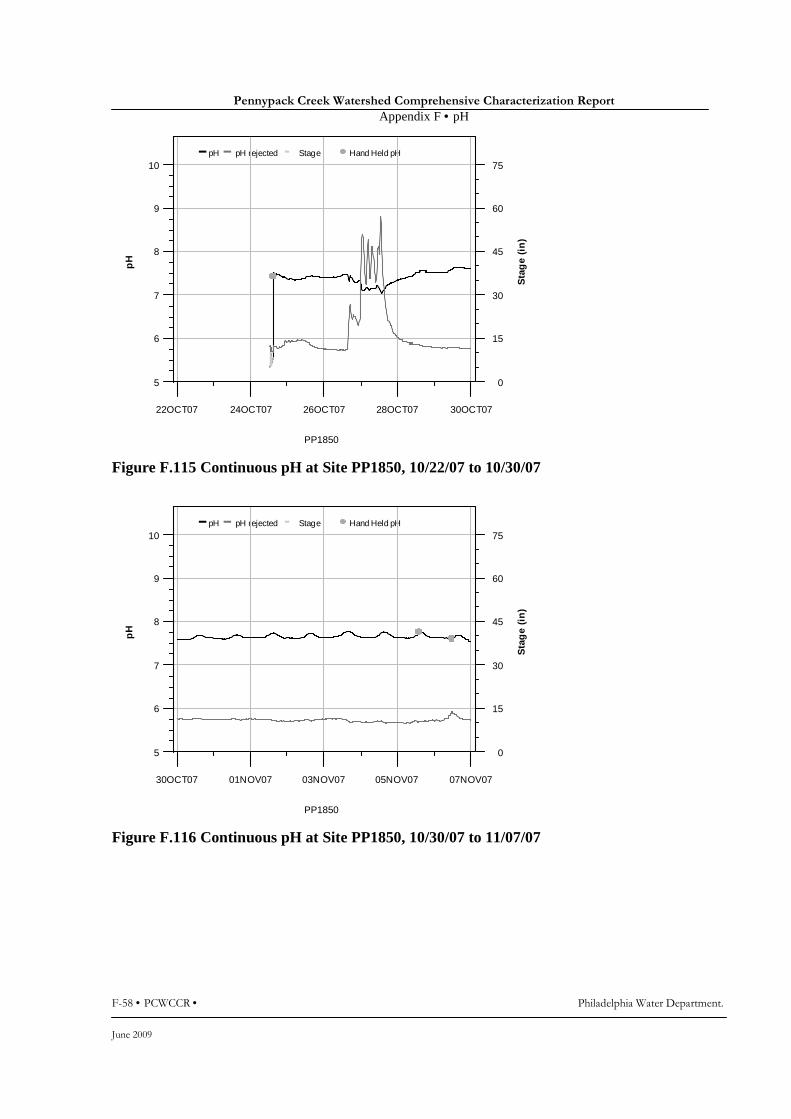
Pennypack Creek Watershed Comprehensive Characterization Report
Appendix F • pH
F-58 • PCWCCR • Philadelphia Water Department.
June 2009
pH pH rejected Stage Hand Held pH
PP1850
pH
5
6
7
8
9
10
22OCT07 24OCT07 26OCT07 28OCT07 30OCT07
Sta
ge
(in
)
0
15
30
45
60
75
Figure F.115 Continuous pH at Site PP1850, 10/22/07 to 10/30/07
pH pH rejected Stage Hand Held pH
PP1850
pH
5
6
7
8
9
10
30OCT07 01NOV07 03NOV07 05NOV07 07NOV07
Sta
ge
(in
)
0
15
30
45
60
75
Figure F.116 Continuous pH at Site PP1850, 10/30/07 to 11/07/07
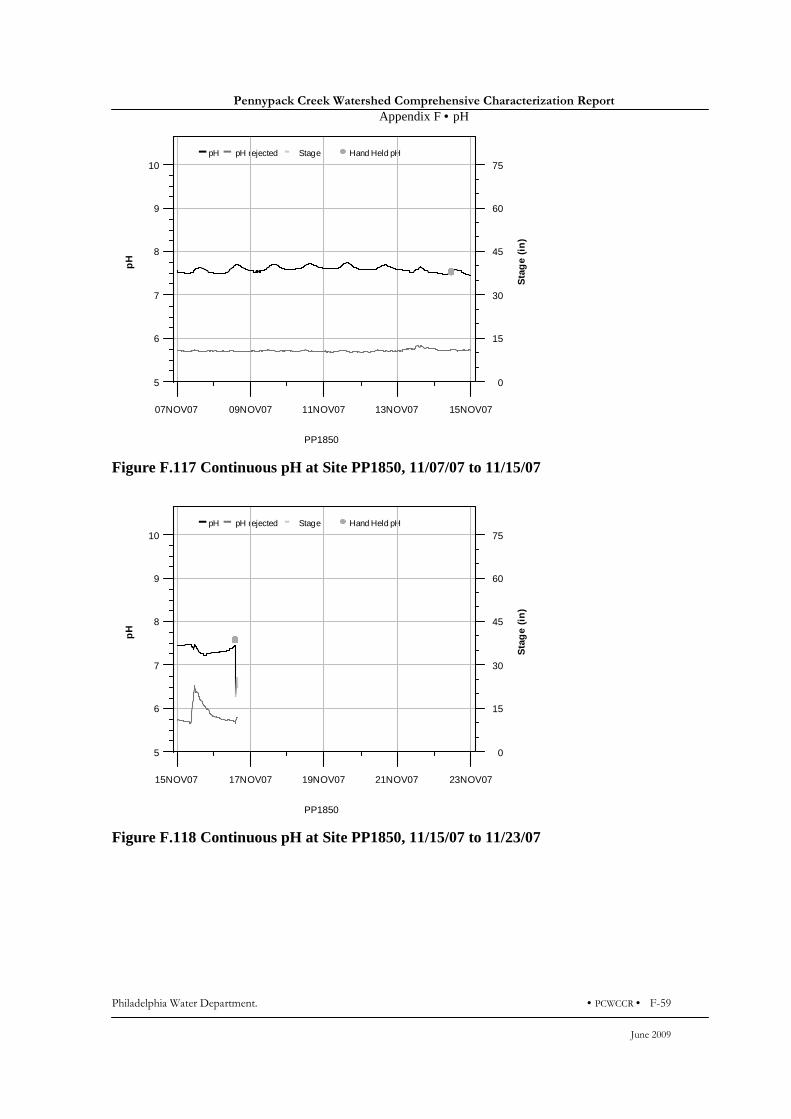
Pennypack Creek Watershed Comprehensive Characterization Report
Appendix F • pH
Philadelphia Water Department. • PCWCCR • F-59
June 2009
pH pH rejected Stage Hand Held pH
PP1850
pH
5
6
7
8
9
10
07NOV07 09NOV07 11NOV07 13NOV07 15NOV07
Sta
ge
(in
)
0
15
30
45
60
75
Figure F.117 Continuous pH at Site PP1850, 11/07/07 to 11/15/07
pH pH rejected Stage Hand Held pH
PP1850
pH
5
6
7
8
9
10
15NOV07 17NOV07 19NOV07 21NOV07 23NOV07
Sta
ge
(in
)
0
15
30
45
60
75
Figure F.118 Continuous pH at Site PP1850, 11/15/07 to 11/23/07
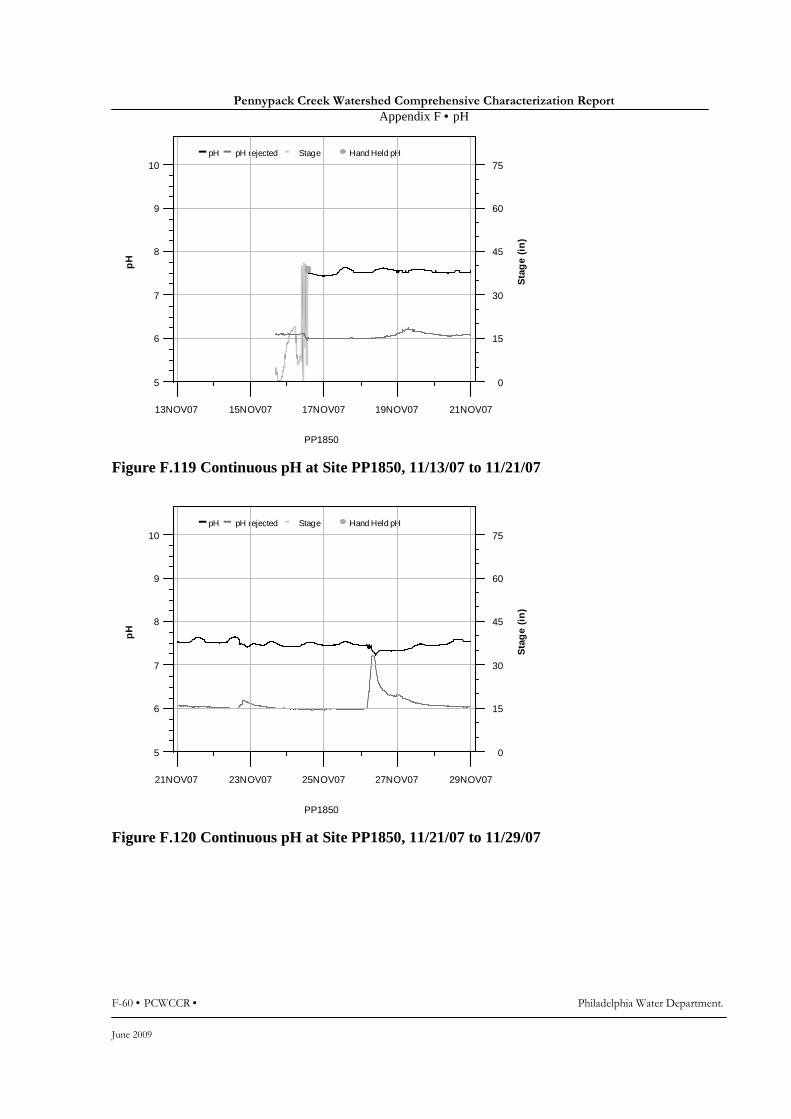
Pennypack Creek Watershed Comprehensive Characterization Report
Appendix F • pH
F-60 • PCWCCR • Philadelphia Water Department.
June 2009
pH pH rejected Stage Hand Held pH
PP1850
pH
5
6
7
8
9
10
13NOV07 15NOV07 17NOV07 19NOV07 21NOV07
Sta
ge
(in
)
0
15
30
45
60
75
Figure F.119 Continuous pH at Site PP1850, 11/13/07 to 11/21/07
pH pH rejected Stage Hand Held pH
PP1850
pH
5
6
7
8
9
10
21NOV07 23NOV07 25NOV07 27NOV07 29NOV07
Sta
ge
(in
)
0
15
30
45
60
75
Figure F.120 Continuous pH at Site PP1850, 11/21/07 to 11/29/07
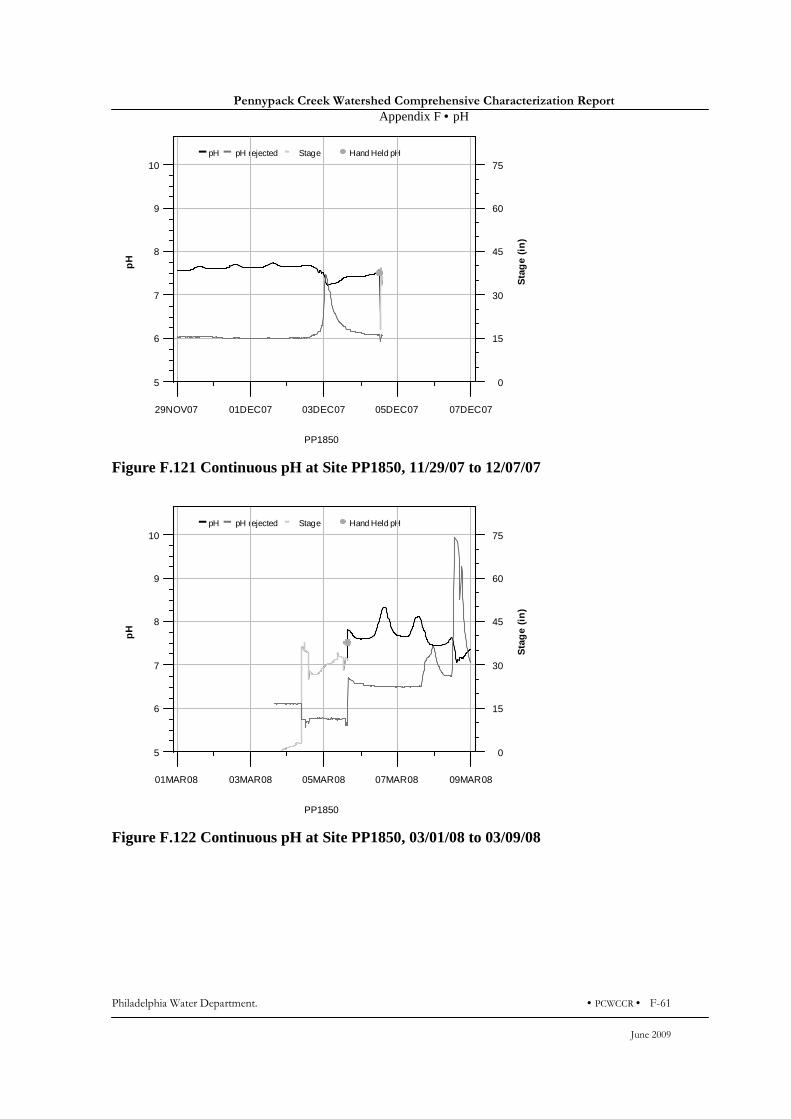
Pennypack Creek Watershed Comprehensive Characterization Report
Appendix F • pH
Philadelphia Water Department. • PCWCCR • F-61
June 2009
pH pH rejected Stage Hand Held pH
PP1850
pH
5
6
7
8
9
10
29NOV07 01DEC07 03DEC07 05DEC07 07DEC07
Sta
ge
(in
)
0
15
30
45
60
75
Figure F.121 Continuous pH at Site PP1850, 11/29/07 to 12/07/07
pH pH rejected Stage Hand Held pH
PP1850
pH
5
6
7
8
9
10
01MAR08 03MAR08 05MAR08 07MAR08 09MAR08
Sta
ge
(in
)
0
15
30
45
60
75
Figure F.122 Continuous pH at Site PP1850, 03/01/08 to 03/09/08
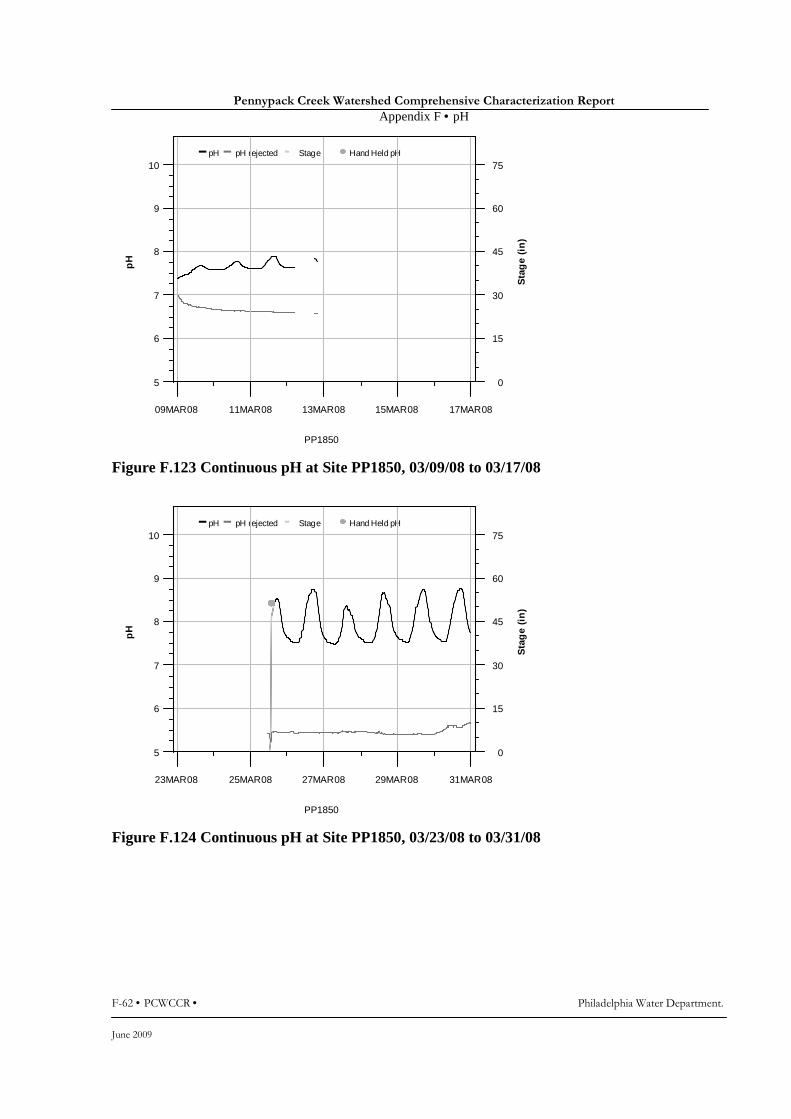
Pennypack Creek Watershed Comprehensive Characterization Report
Appendix F • pH
F-62 • PCWCCR • Philadelphia Water Department.
June 2009
pH pH rejected Stage Hand Held pH
PP1850
pH
5
6
7
8
9
10
09MAR08 11MAR08 13MAR08 15MAR08 17MAR08
Sta
ge
(in
)
0
15
30
45
60
75
Figure F.123 Continuous pH at Site PP1850, 03/09/08 to 03/17/08
pH pH rejected Stage Hand Held pH
PP1850
pH
5
6
7
8
9
10
23MAR08 25MAR08 27MAR08 29MAR08 31MAR08
Sta
ge
(in
)
0
15
30
45
60
75
Figure F.124 Continuous pH at Site PP1850, 03/23/08 to 03/31/08
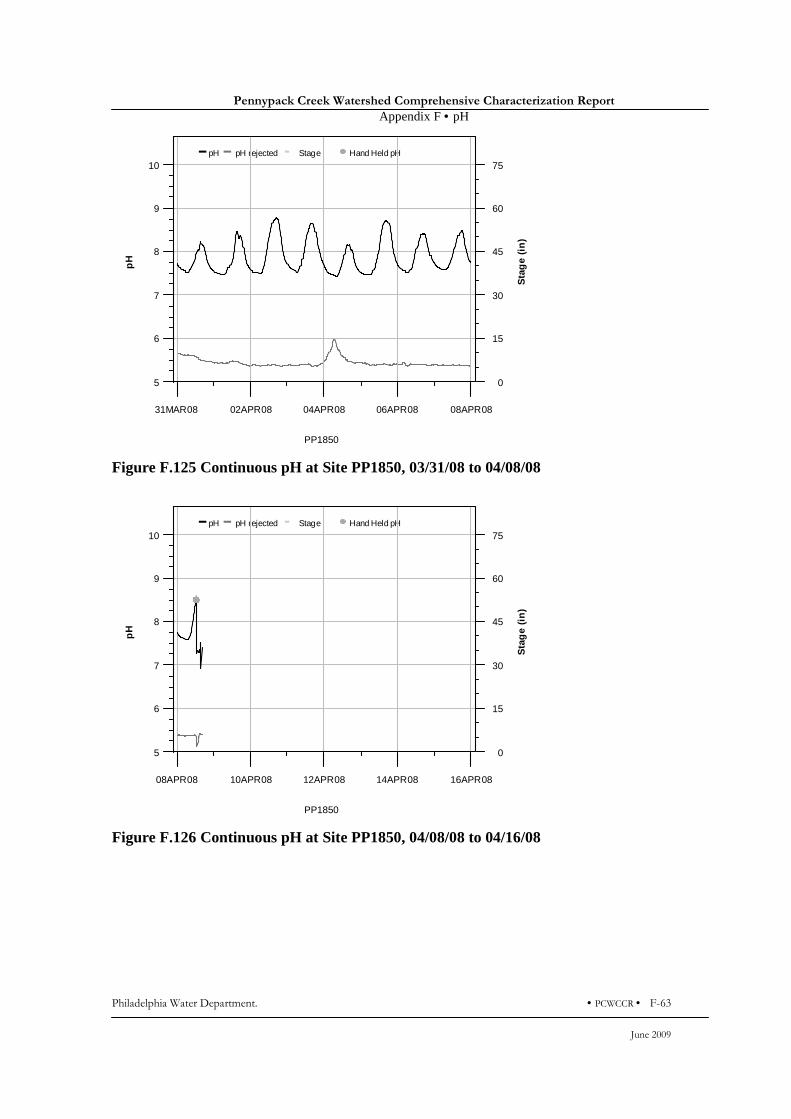
Pennypack Creek Watershed Comprehensive Characterization Report
Appendix F • pH
Philadelphia Water Department. • PCWCCR • F-63
June 2009
pH pH rejected Stage Hand Held pH
PP1850
pH
5
6
7
8
9
10
31MAR08 02APR08 04APR08 06APR08 08APR08
Sta
ge
(in
)
0
15
30
45
60
75
Figure F.125 Continuous pH at Site PP1850, 03/31/08 to 04/08/08
pH pH rejected Stage Hand Held pH
PP1850
pH
5
6
7
8
9
10
08APR08 10APR08 12APR08 14APR08 16APR08
Sta
ge
(in
)
0
15
30
45
60
75
Figure F.126 Continuous pH at Site PP1850, 04/08/08 to 04/16/08

Pennypack Creek Watershed Comprehensive Characterization Report
Appendix F • pH
F-64 • PCWCCR • Philadelphia Water Department.
June 2009
pH pH rejected Stage Hand Held pH
PP1850
pH
5
6
7
8
9
10
06APR08 08APR08 10APR08 12APR08 14APR08
Sta
ge
(in
)
0
15
30
45
60
75
Figure F.127 Continuous pH at Site PP1850, 04/06/08 to 04/14/08
pH pH rejected Stage Hand Held pH
PP1850
pH
5
6
7
8
9
10
14APR08 16APR08 18APR08 20APR08 22APR08
Sta
ge
(in
)
0
15
30
45
60
75
Figure F.128 Continuous pH at Site PP1850, 04/14/08 to 04/22/08

Pennypack Creek Watershed Comprehensive Characterization Report
Appendix F • pH
Philadelphia Water Department. • PCWCCR • F-65
June 2009
pH pH rejected Stage Hand Held pH
PP1850
pH
5
6
7
8
9
10
22APR08 24APR08 26APR08 28APR08 30APR08
Sta
ge
(in
)
0
15
30
45
60
75
Figure F.129 Continuous pH at Site PP1850, 04/22/08 to 04/30/08
pH pH rejected Stage Hand Held pH
PP1850
pH
5
6
7
8
9
10
30APR08 02MAY08 04MAY08 06MAY08 08MAY08
Sta
ge
(in
)
0
15
30
45
60
75
Figure F.130 Continuous pH at Site PP1850, 04/30/08 to 05/08/08

Pennypack Creek Watershed Comprehensive Characterization Report
Appendix F • pH
F-66 • PCWCCR • Philadelphia Water Department.
June 2009
pH pH rejected Stage Hand Held pH
PP1850
pH
5
6
7
8
9
10
26APR08 28APR08 30APR08 02MAY08 04MAY08
Sta
ge
(in
)
0
15
30
45
60
75
Figure F.131 Continuous pH at Site PP1850, 04/26/08 to 05/04/08
pH pH rejected Stage Hand Held pH
PP1850
pH
5
6
7
8
9
10
04MAY08 06MAY08 08MAY08 10MAY08 12MAY08
Sta
ge
(in
)
0
15
30
45
60
75
Figure F.132 Continuous pH at Site PP1850, 05/04/08 to 05/12/08
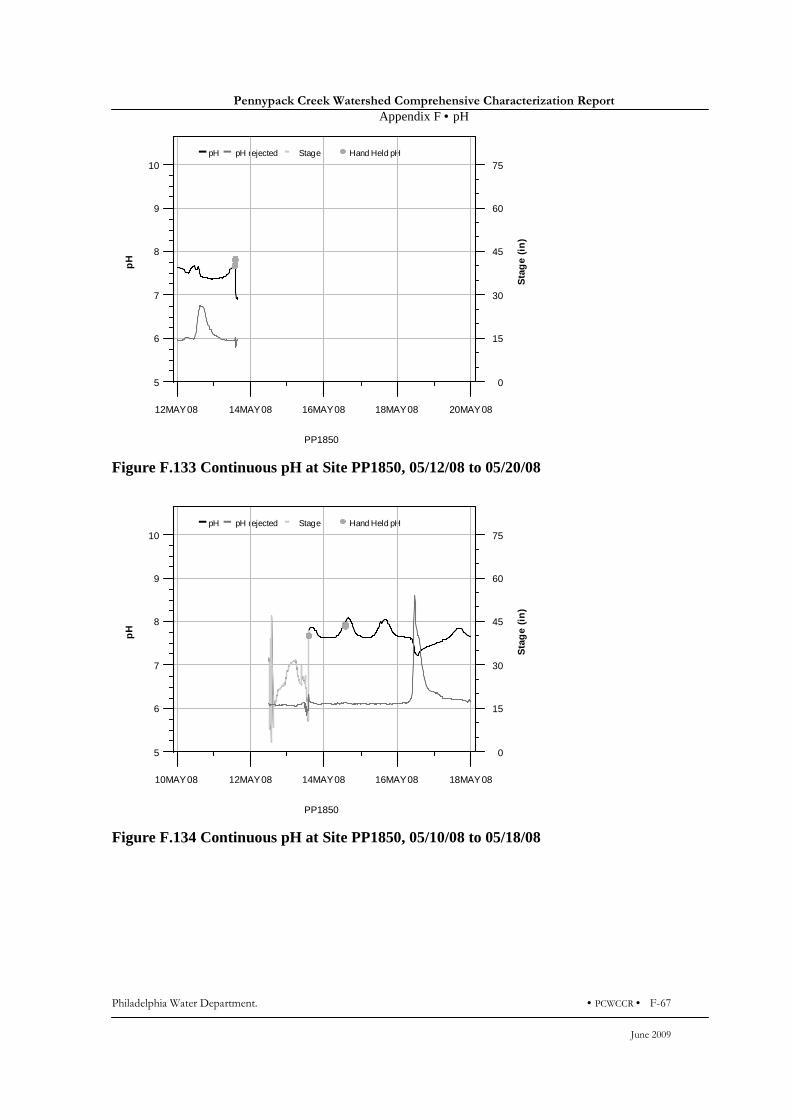
Pennypack Creek Watershed Comprehensive Characterization Report
Appendix F • pH
Philadelphia Water Department. • PCWCCR • F-67
June 2009
pH pH rejected Stage Hand Held pH
PP1850
pH
5
6
7
8
9
10
12MAY08 14MAY08 16MAY08 18MAY08 20MAY08
Sta
ge
(in
)
0
15
30
45
60
75
Figure F.133 Continuous pH at Site PP1850, 05/12/08 to 05/20/08
pH pH rejected Stage Hand Held pH
PP1850
pH
5
6
7
8
9
10
10MAY08 12MAY08 14MAY08 16MAY08 18MAY08
Sta
ge
(in
)
0
15
30
45
60
75
Figure F.134 Continuous pH at Site PP1850, 05/10/08 to 05/18/08

Pennypack Creek Watershed Comprehensive Characterization Report
Appendix F • pH
F-68 • PCWCCR • Philadelphia Water Department.
June 2009
pH pH rejected Stage Hand Held pH
PP1850
pH
5
6
7
8
9
10
18MAY08 20MAY08 22MAY08 24MAY08 26MAY08
Sta
ge
(in
)
0
15
30
45
60
75
Figure F.135 Continuous pH at Site PP1850, 05/18/08 to 05/26/08
pH pH rejected Stage Hand Held pH
PP1850
pH
5
6
7
8
9
10
26MAY08 28MAY08 30MAY08 01JUN08 03JUN08
Sta
ge
(in
)
0
15
30
45
60
75
Figure F.136 Continuous pH at Site PP1850, 05/26/08 to 06/03/08

Pennypack Creek Watershed Comprehensive Characterization Report
Appendix F • pH
Philadelphia Water Department. • PCWCCR • F-69
June 2009
pH pH rejected Stage Hand Held pH
PP1850
pH
5
6
7
8
9
10
03JUN08 05JUN08 07JUN08 09JUN08 11JUN08
Sta
ge
(in
)
0
15
30
45
60
75
Figure F.137 Continuous pH at Site PP1850, 06/03/08 to 06/11/08
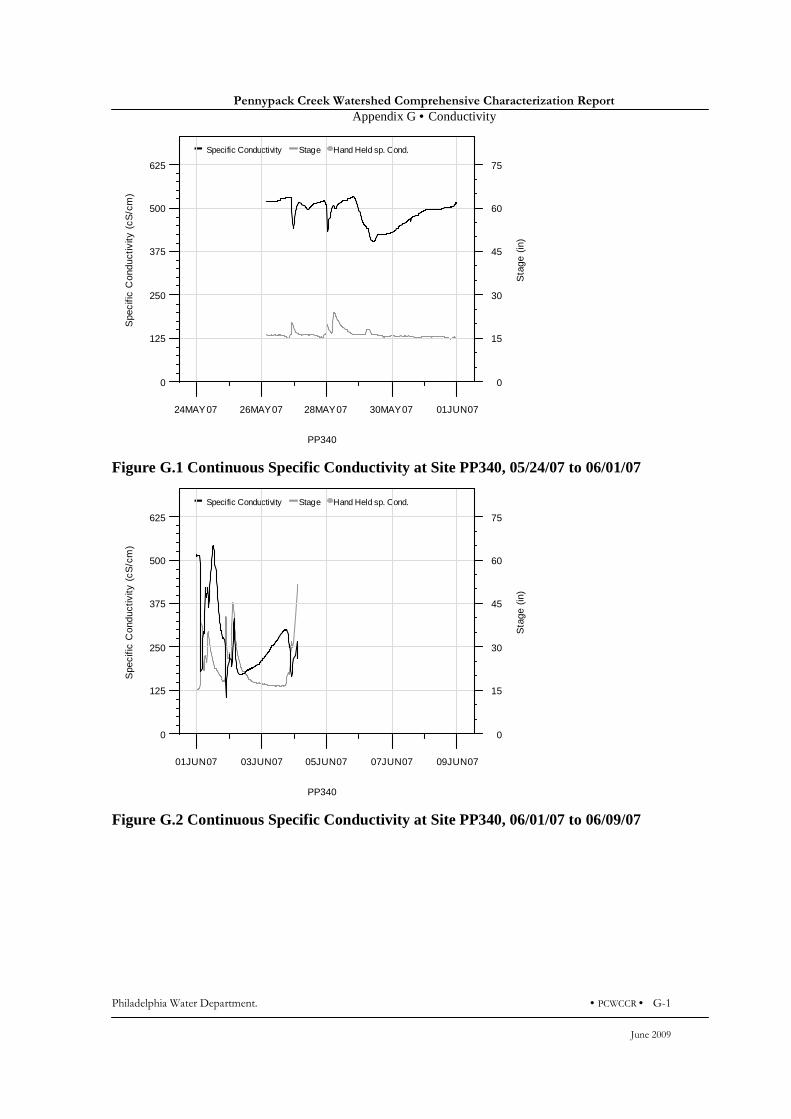
Pennypack Creek Watershed Comprehensive Characterization Report
Appendix G • Conductivity
Philadelphia Water Department. • PCWCCR • G-1
June 2009
Specific Conductivity Stage Hand Held sp. Cond.
PP340
Spe
cific
Con
duct
ivity
(cS
/cm
)
0
125
250
375
500
625
24MAY07 26MAY07 28MAY07 30MAY07 01JUN07
Sta
ge (
in)
0
15
30
45
60
75
Figure G.1 Continuous Specific Conductivity at Site PP340, 05/24/07 to 06/01/07
Specific Conductivity Stage Hand Held sp. Cond.
PP340
Spe
cific
Con
duct
ivity
(cS
/cm
)
0
125
250
375
500
625
01JUN07 03JUN07 05JUN07 07JUN07 09JUN07
Sta
ge (
in)
0
15
30
45
60
75
Figure G.2 Continuous Specific Conductivity at Site PP340, 06/01/07 to 06/09/07
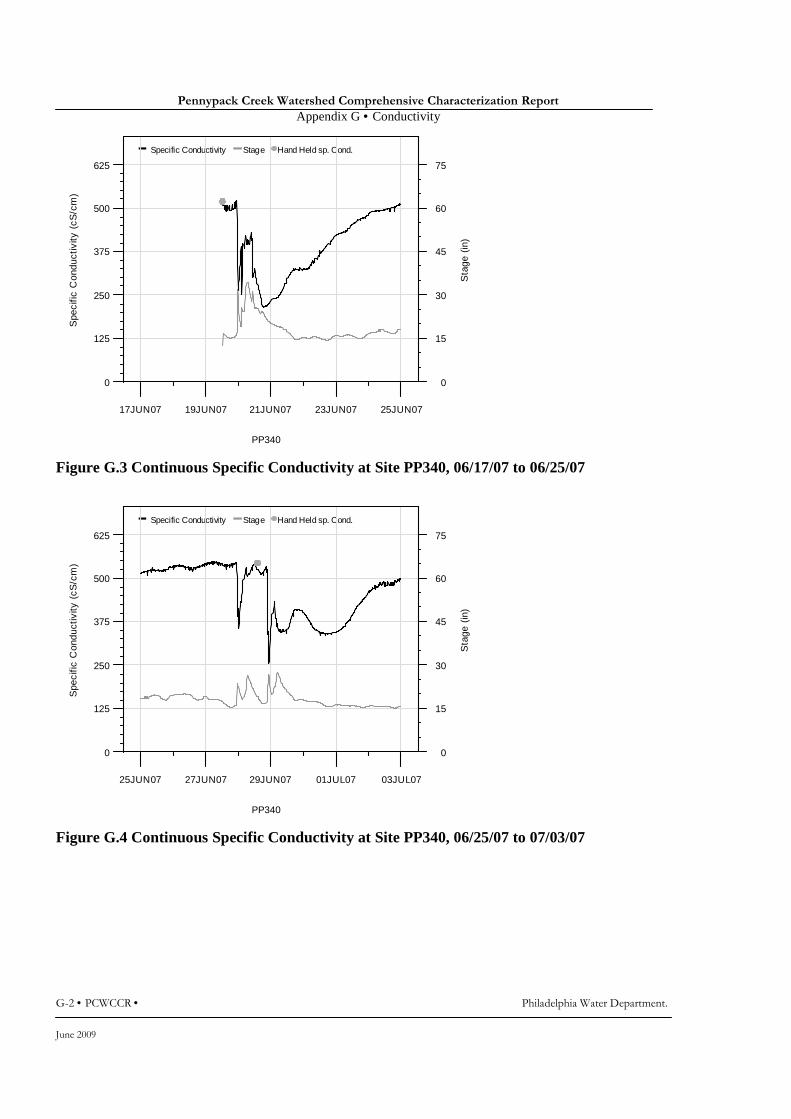
Pennypack Creek Watershed Comprehensive Characterization Report
Appendix G • Conductivity
G-2 • PCWCCR • Philadelphia Water Department.
June 2009
Specific Conductivity Stage Hand Held sp. Cond.
PP340
Spe
cific
Con
duct
ivity
(cS
/cm
)
0
125
250
375
500
625
17JUN07 19JUN07 21JUN07 23JUN07 25JUN07
Sta
ge (
in)
0
15
30
45
60
75
Figure G.3 Continuous Specific Conductivity at Site PP340, 06/17/07 to 06/25/07
Specific Conductivity Stage Hand Held sp. Cond.
PP340
Spe
cific
Con
duct
ivity
(cS
/cm
)
0
125
250
375
500
625
25JUN07 27JUN07 29JUN07 01JUL07 03JUL07
Sta
ge (
in)
0
15
30
45
60
75
Figure G.4 Continuous Specific Conductivity at Site PP340, 06/25/07 to 07/03/07

Pennypack Creek Watershed Comprehensive Characterization Report
Appendix G • Conductivity
Philadelphia Water Department. • PCWCCR • G-3
June 2009
Specific Conductivity Stage Hand Held sp. Cond.
PP340
Spe
cific
Con
duct
ivity
(cS
/cm
)
0
125
250
375
500
625
03JUL07 05JUL07 07JUL07 09JUL07 11JUL07
Sta
ge (
in)
0
15
30
45
60
75
Figure G.5 Continuous Specific Conductivity at Site PP340, 07/03/07 to 07/11/07
Specific Conductivity Stage Hand Held sp. Cond.
PP340
Spe
cific
Con
duct
ivity
(cS
/cm
)
0
125
250
375
500
625
11JUL07 13JUL07 15JUL07 17JUL07 19JUL07
Sta
ge (
in)
0
15
30
45
60
75
Figure G.6 Continuous Specific Conductivity at Site PP340, 07/11/07 to 07/19/07

Pennypack Creek Watershed Comprehensive Characterization Report
Appendix G • Conductivity
G-4 • PCWCCR • Philadelphia Water Department.
June 2009
Specific Conductivity Stage Hand Held sp. Cond.
PP340
Spe
cific
Con
duct
ivity
(cS
/cm
)
0
400
800
1200
1600
2000
08AUG07 10AUG07 12AUG07 14AUG07 16AUG07
Sta
ge (
in)
0
10
20
30
40
50
Figure G.7 Continuous Specific Conductivity at Site PP340, 08/08/07 to 08/16/07
Specific Conductivity Stage Hand Held sp. Cond.
PP340
Spe
cific
Con
duct
ivity
(cS
/cm
)
0
400
800
1200
1600
2000
16AUG07 18AUG07 20AUG07 22AUG07 24AUG07
Sta
ge (
in)
0
10
20
30
40
50
Figure G.8 Continuous Specific Conductivity at Site PP340, 08/16/07 to 08/24/07

Pennypack Creek Watershed Comprehensive Characterization Report
Appendix G • Conductivity
Philadelphia Water Department. • PCWCCR • G-5
June 2009
Specific Conductivity Stage Hand Held sp. Cond.
PP340
Spe
cific
Con
duct
ivity
(cS
/cm
)
0
400
800
1200
1600
2000
24AUG07 26AUG07 28AUG07 30AUG07 01SEP07
Sta
ge (
in)
0
10
20
30
40
50
Figure G.9 Continuous Specific Conductivity at Site PP340, 08/24/07 to 09/1/07
Specific Conductivity Stage Hand Held sp. Cond.
PP340
Spe
cific
Con
duct
ivity
(cS
/cm
)
0
400
800
1200
1600
2000
01SEP07 03SEP07 05SEP07 07SEP07 09SEP07
Sta
ge (
in)
0
10
20
30
40
50
Figure G.10 Continuous Specific Conductivity at Site PP340, 09/01/07 to 09/09/07
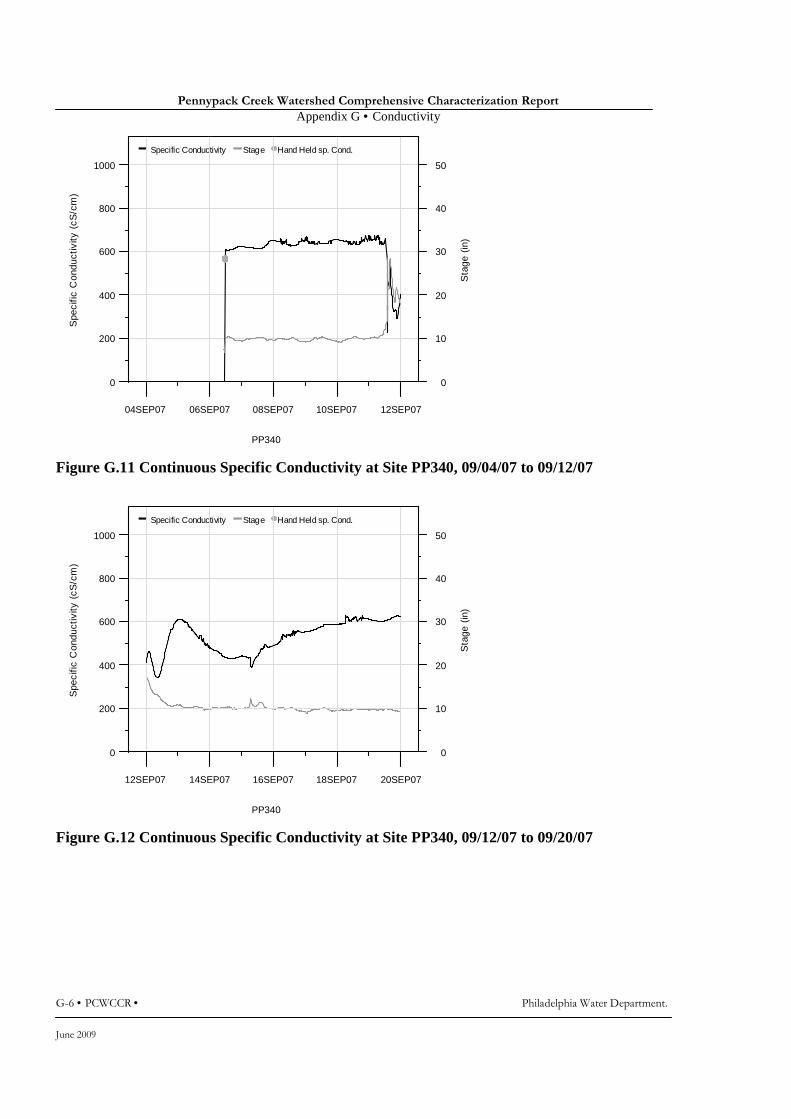
Pennypack Creek Watershed Comprehensive Characterization Report
Appendix G • Conductivity
G-6 • PCWCCR • Philadelphia Water Department.
June 2009
Specific Conductivity Stage Hand Held sp. Cond.
PP340
Spe
cific
Con
duct
ivity
(cS
/cm
)
0
200
400
600
800
1000
04SEP07 06SEP07 08SEP07 10SEP07 12SEP07
Sta
ge (
in)
0
10
20
30
40
50
Figure G.11 Continuous Specific Conductivity at Site PP340, 09/04/07 to 09/12/07
Specific Conductivity Stage Hand Held sp. Cond.
PP340
Spe
cific
Con
duct
ivity
(cS
/cm
)
0
200
400
600
800
1000
12SEP07 14SEP07 16SEP07 18SEP07 20SEP07
Sta
ge (
in)
0
10
20
30
40
50
Figure G.12 Continuous Specific Conductivity at Site PP340, 09/12/07 to 09/20/07

Pennypack Creek Watershed Comprehensive Characterization Report
Appendix G • Conductivity
Philadelphia Water Department. • PCWCCR • G-7
June 2009
Specific Conductivity Stage Hand Held sp. Cond.
PP340
Spe
cific
Con
duct
ivity
(cS
/cm
)
0
200
400
600
800
1000
20SEP07 22SEP07 24SEP07 26SEP07 28SEP07
Sta
ge (
in)
0
10
20
30
40
50
Figure G.13 Continuous Specific Conductivity at Site PP340, 09/20/07 to 09/28/07
Specific Conductivity Stage Hand Held sp. Cond.
PP340
Spe
cific
Con
duct
ivity
(cS
/cm
)
0
200
400
600
800
1000
28SEP07 30SEP07 02OCT07 04OCT07 06OCT07
Sta
ge (
in)
0
10
20
30
40
50
Figure G.14 Continuous Specific Conductivity at Site PP340, 09/28/07 to 10/06/07
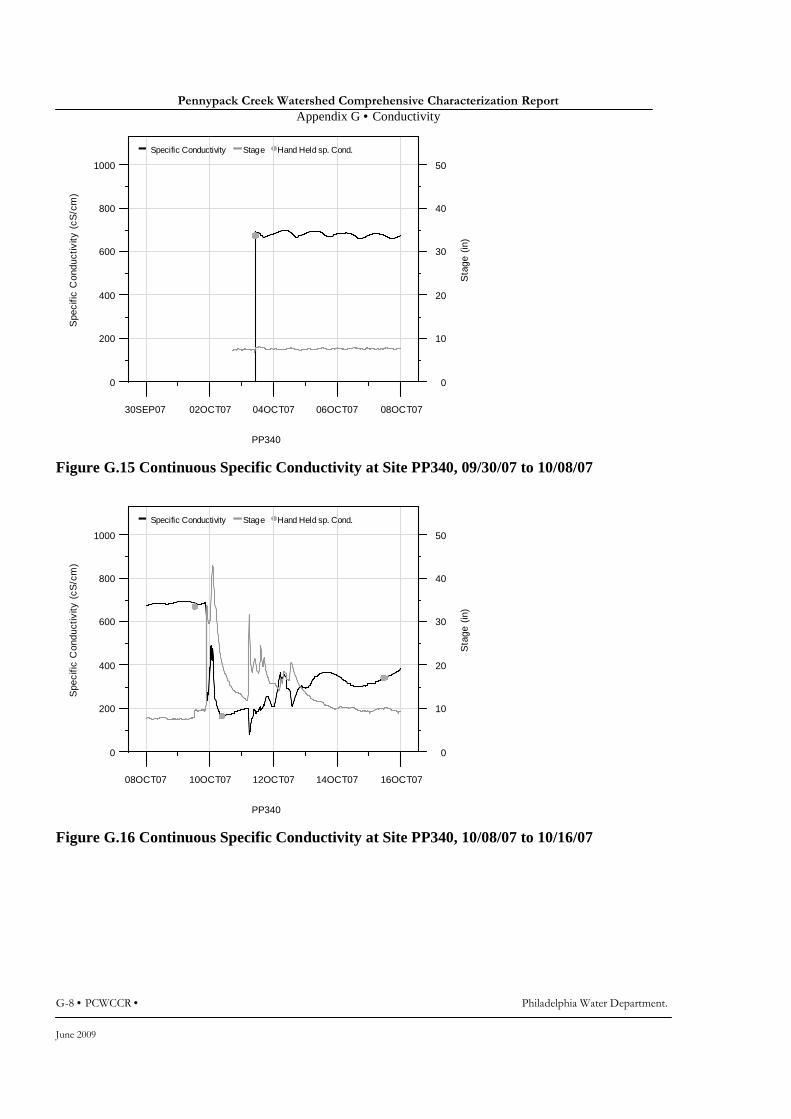
Pennypack Creek Watershed Comprehensive Characterization Report
Appendix G • Conductivity
G-8 • PCWCCR • Philadelphia Water Department.
June 2009
Specific Conductivity Stage Hand Held sp. Cond.
PP340
Spe
cific
Con
duct
ivity
(cS
/cm
)
0
200
400
600
800
1000
30SEP07 02OCT07 04OCT07 06OCT07 08OCT07
Sta
ge (
in)
0
10
20
30
40
50
Figure G.15 Continuous Specific Conductivity at Site PP340, 09/30/07 to 10/08/07
Specific Conductivity Stage Hand Held sp. Cond.
PP340
Spe
cific
Con
duct
ivity
(cS
/cm
)
0
200
400
600
800
1000
08OCT07 10OCT07 12OCT07 14OCT07 16OCT07
Sta
ge (
in)
0
10
20
30
40
50
Figure G.16 Continuous Specific Conductivity at Site PP340, 10/08/07 to 10/16/07
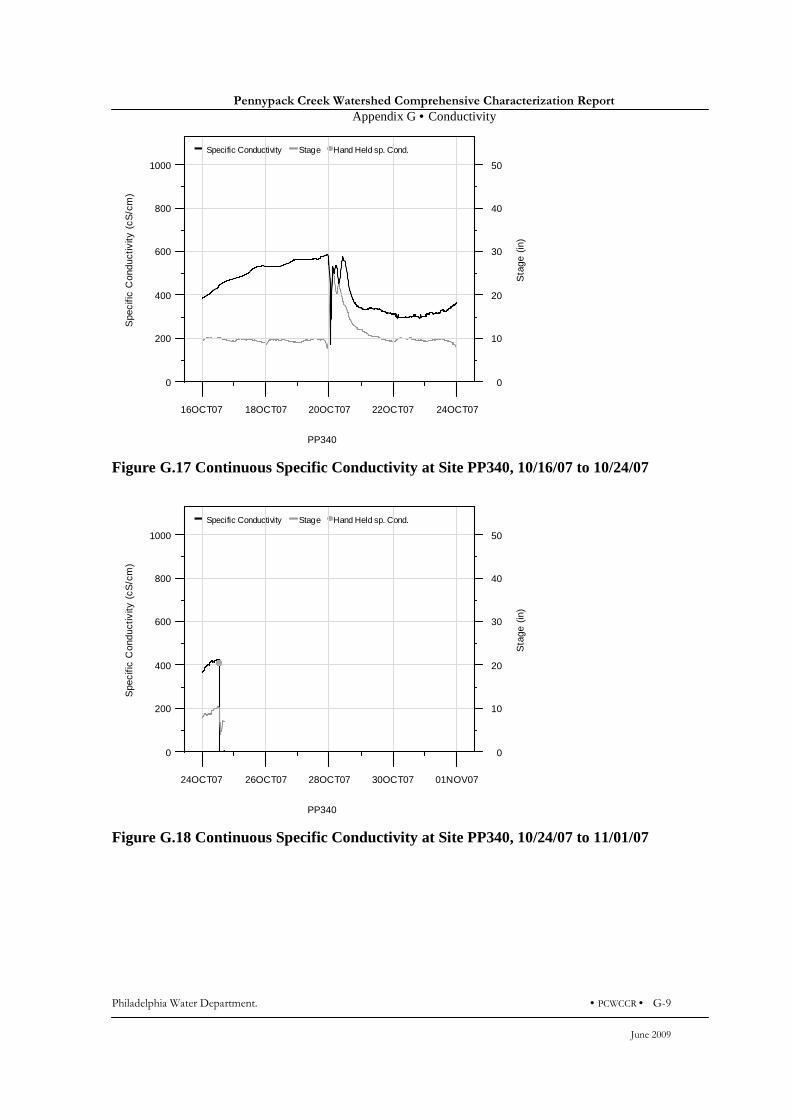
Pennypack Creek Watershed Comprehensive Characterization Report
Appendix G • Conductivity
Philadelphia Water Department. • PCWCCR • G-9
June 2009
Specific Conductivity Stage Hand Held sp. Cond.
PP340
Spe
cific
Con
duct
ivity
(cS
/cm
)
0
200
400
600
800
1000
16OCT07 18OCT07 20OCT07 22OCT07 24OCT07
Sta
ge (
in)
0
10
20
30
40
50
Figure G.17 Continuous Specific Conductivity at Site PP340, 10/16/07 to 10/24/07
Specific Conductivity Stage Hand Held sp. Cond.
PP340
Spe
cific
Con
duct
ivity
(cS
/cm
)
0
200
400
600
800
1000
24OCT07 26OCT07 28OCT07 30OCT07 01NOV07
Sta
ge (
in)
0
10
20
30
40
50
Figure G.18 Continuous Specific Conductivity at Site PP340, 10/24/07 to 11/01/07

Pennypack Creek Watershed Comprehensive Characterization Report
Appendix G • Conductivity
G-10 • PCWCCR • Philadelphia Water Department.
June 2009
Specific Conductivity Stage Hand Held sp. Cond.
PP340
Spe
cific
Con
duct
ivity
(cS
/cm
)
0
125
250
375
500
625
22OCT07 24OCT07 26OCT07 28OCT07 30OCT07
Sta
ge (
in)
0
15
30
45
60
75
Figure G.19 Continuous Specific Conductivity at Site PP340, 10/22/07 to 10/30/07
Specific Conductivity Stage Hand Held sp. Cond.
PP340
Spe
cific
Con
duct
ivity
(cS
/cm
)
0
125
250
375
500
625
30OCT07 01NOV07 03NOV07 05NOV07 07NOV07
Sta
ge (
in)
0
15
30
45
60
75
Figure G.20 Continuous Specific Conductivity at Site PP340, 10/30/07 to 11/07/07

Pennypack Creek Watershed Comprehensive Characterization Report
Appendix G • Conductivity
Philadelphia Water Department. • PCWCCR • G-11
June 2009
Specific Conductivity Stage Hand Held sp. Cond.
PP340
Spe
cific
Con
duct
ivity
(cS
/cm
)
0
125
250
375
500
625
07NOV07 09NOV07 11NOV07 13NOV07 15NOV07
Sta
ge (
in)
0
15
30
45
60
75
Figure G.21 Continuous Specific Conductivity at Site PP340, 11/07/07 to 11/15/07
Specific Conductivity Stage Hand Held sp. Cond.
PP340
Spe
cific
Con
duct
ivity
(cS
/cm
)
0
125
250
375
500
625
15NOV07 17NOV07 19NOV07 21NOV07 23NOV07
Sta
ge (
in)
0
15
30
45
60
75
Figure G.22 Continuous Specific Conductivity at Site PP340, 11/15/07 to 11/23/07

Pennypack Creek Watershed Comprehensive Characterization Report
Appendix G • Conductivity
G-12 • PCWCCR • Philadelphia Water Department.
June 2009
Specific Conductivity Stage Hand Held sp. Cond.
PP340
Spe
cific
Con
duct
ivity
(cS
/cm
)
0
200
400
600
800
1000
13NOV07 15NOV07 17NOV07 19NOV07 21NOV07
Sta
ge (
in)
0
10
20
30
40
50
Figure G.23 Continuous Specific Conductivity at Site PP340, 11/13/07 to 11/21/07
Specific Conductivity Stage Hand Held sp. Cond.
PP340
Spe
cific
Con
duct
ivity
(cS
/cm
)
0
200
400
600
800
1000
21NOV07 23NOV07 25NOV07 27NOV07 29NOV07
Sta
ge (
in)
0
10
20
30
40
50
Figure G.24 Continuous Specific Conductivity at Site PP340, 11/21/07 to 11/29/07

Pennypack Creek Watershed Comprehensive Characterization Report
Appendix G • Conductivity
Philadelphia Water Department. • PCWCCR • G-13
June 2009
Specific Conductivity Stage Hand Held sp. Cond.
PP340
Spe
cific
Con
duct
ivity
(cS
/cm
)
0
200
400
600
800
1000
29NOV07 01DEC07 03DEC07 05DEC07 07DEC07
Sta
ge (
in)
0
10
20
30
40
50
Figure G.25 Continuous Specific Conductivity at Site PP340, 11/29/07 to 12/07/07
Specific Conductivity Stage Hand Held sp. Cond.
PP985
Spe
cific
Con
duct
ivity
(cS
/cm
)
0
200
400
600
800
1000
20MAY07 22MAY07 24MAY07 26MAY07 28MAY07
Sta
ge (
in)
0
15
30
45
60
75
Figure G.26 Continuous Specific Conductivity at Site PP985, 05/20/07 to 05/28/07

Pennypack Creek Watershed Comprehensive Characterization Report
Appendix G • Conductivity
G-14 • PCWCCR • Philadelphia Water Department.
June 2009
Specific Conductivity Stage Hand Held sp. Cond.
PP985
Spe
cific
Con
duct
ivity
(cS
/cm
)
0
200
400
600
800
1000
28MAY07 30MAY07 01JUN07 03JUN07 05JUN07
Sta
ge (
in)
0
15
30
45
60
75
Figure G.27 Continuous Specific Conductivity at Site PP985, 05/28/07 to 06/05/07
Specific Conductivity Stage Hand Held sp. Cond.
PP985
Spe
cific
Con
duct
ivity
(cS
/cm
)
0
200
400
600
800
1000
05JUN07 07JUN07 09JUN07 11JUN07 13JUN07
Sta
ge (
in)
0
15
30
45
60
75
Figure G.28 Continuous Specific Conductivity at Site PP985, 06/05/07 to 06/13/07

Pennypack Creek Watershed Comprehensive Characterization Report
Appendix G • Conductivity
Philadelphia Water Department. • PCWCCR • G-15
June 2009
Specific Conductivity Stage Hand Held sp. Cond.
PP985
Spe
cific
Con
duct
ivity
(cS
/cm
)
0
200
400
600
800
1000
13JUN07 15JUN07 17JUN07 19JUN07 21JUN07
Sta
ge (
in)
0
15
30
45
60
75
Figure G.29 Continuous Specific Conductivity at Site PP985, 06/13/07 to 06/21/07
Specific Conductivity Stage Hand Held sp. Cond.
PP985
Spe
cific
Con
duct
ivity
(cS
/cm
)
0
125
250
375
500
625
14JUN07 16JUN07 18JUN07 20JUN07 22JUN07
Sta
ge (
in)
0
10
20
30
40
50
Figure G.30 Continuous Specific Conductivity at Site PP985, 06/14/07 to 06/22/07

Pennypack Creek Watershed Comprehensive Characterization Report
Appendix G • Conductivity
G-16 • PCWCCR • Philadelphia Water Department.
June 2009
Specific Conductivity Stage Hand Held sp. Cond.
PP985
Spe
cific
Con
duct
ivity
(cS
/cm
)
0
125
250
375
500
625
22JUN07 24JUN07 26JUN07 28JUN07 30JUN07
Sta
ge (
in)
0
10
20
30
40
50
Figure G.31 Continuous Specific Conductivity at Site PP985, 06/22/07 to 06/30/07
Specific Conductivity Stage Hand Held sp. Cond.
PP985
Spe
cific
Con
duct
ivity
(cS
/cm
)
0
125
250
375
500
625
30JUN07 02JUL07 04JUL07 06JUL07 08JUL07
Sta
ge (
in)
0
10
20
30
40
50
Figure G.32 Continuous Specific Conductivity at Site PP985, 06/30/07 to 07/08/07

Pennypack Creek Watershed Comprehensive Characterization Report
Appendix G • Conductivity
Philadelphia Water Department. • PCWCCR • G-17
June 2009
Specific Conductivity Stage Hand Held sp. Cond.
PP985
Spe
cific
Con
duct
ivity
(cS
/cm
)
0
125
250
375
500
625
08JUL07 10JUL07 12JUL07 14JUL07 16JUL07
Sta
ge (
in)
0
10
20
30
40
50
Figure G.33 Continuous Specific Conductivity at Site PP985, 07/08/07 to 07/16/07
Specific Conductivity Stage Hand Held sp. Cond.
PP985
Spe
cific
Con
duct
ivity
(cS
/cm
)
0
125
250
375
500
625
16JUL07 18JUL07 20JUL07 22JUL07 24JUL07
Sta
ge (
in)
0
10
20
30
40
50
Figure G.34 Continuous Specific Conductivity at Site PP985, 07/16/07 to 07/24/07

Pennypack Creek Watershed Comprehensive Characterization Report
Appendix G • Conductivity
G-18 • PCWCCR • Philadelphia Water Department.
June 2009
Specific Conductivity Stage Hand Held sp. Cond.
PP985
Spe
cific
Con
duct
ivity
(cS
/cm
)
0
200
400
600
800
1000
14JUL07 16JUL07 18JUL07 20JUL07 22JUL07
Sta
ge (
in)
0
10
20
30
40
50
Figure G.35 Continuous Specific Conductivity at Site PP985, 07/14/07 to 07/22/07
Specific Conductivity Stage Hand Held sp. Cond.
PP985
Spe
cific
Con
duct
ivity
(cS
/cm
)
0
200
400
600
800
1000
22JUL07 24JUL07 26JUL07 28JUL07 30JUL07
Sta
ge (
in)
0
10
20
30
40
50
Figure G.36 Continuous Specific Conductivity at Site PP985, 07/22/07 to 07/30/07
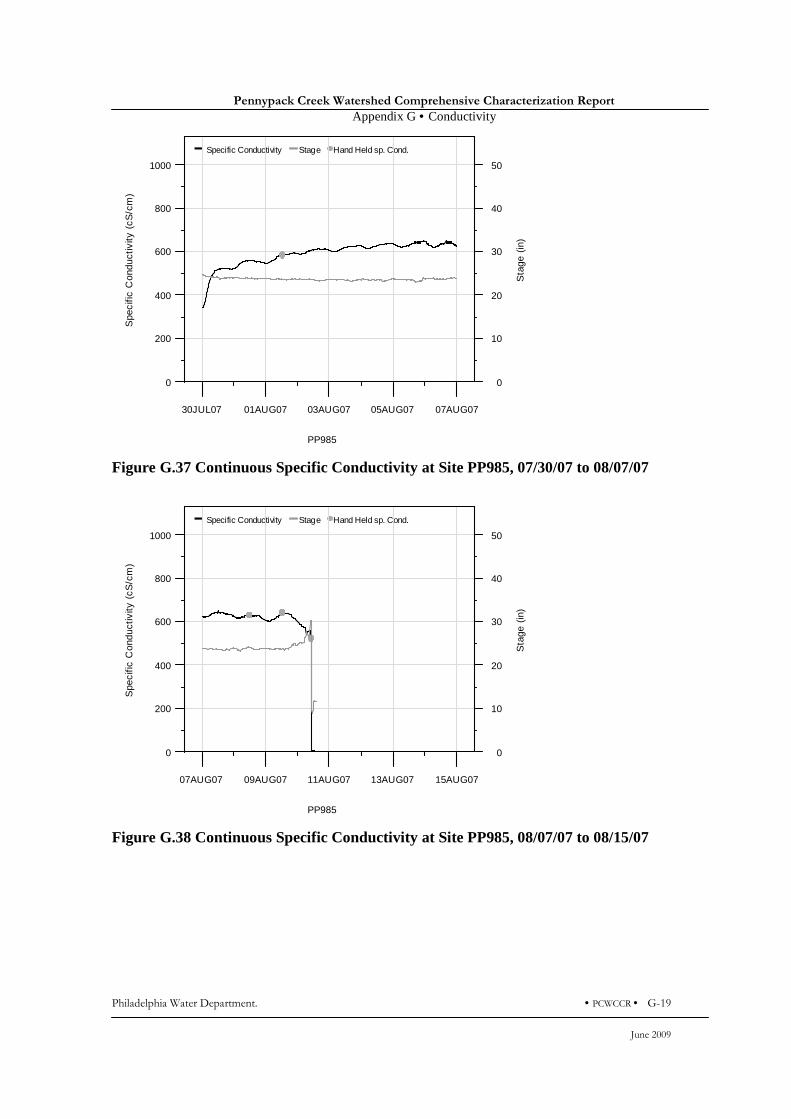
Pennypack Creek Watershed Comprehensive Characterization Report
Appendix G • Conductivity
Philadelphia Water Department. • PCWCCR • G-19
June 2009
Specific Conductivity Stage Hand Held sp. Cond.
PP985
Spe
cific
Con
duct
ivity
(cS
/cm
)
0
200
400
600
800
1000
30JUL07 01AUG07 03AUG07 05AUG07 07AUG07
Sta
ge (
in)
0
10
20
30
40
50
Figure G.37 Continuous Specific Conductivity at Site PP985, 07/30/07 to 08/07/07
Specific Conductivity Stage Hand Held sp. Cond.
PP985
Spe
cific
Con
duct
ivity
(cS
/cm
)
0
200
400
600
800
1000
07AUG07 09AUG07 11AUG07 13AUG07 15AUG07
Sta
ge (
in)
0
10
20
30
40
50
Figure G.38 Continuous Specific Conductivity at Site PP985, 08/07/07 to 08/15/07
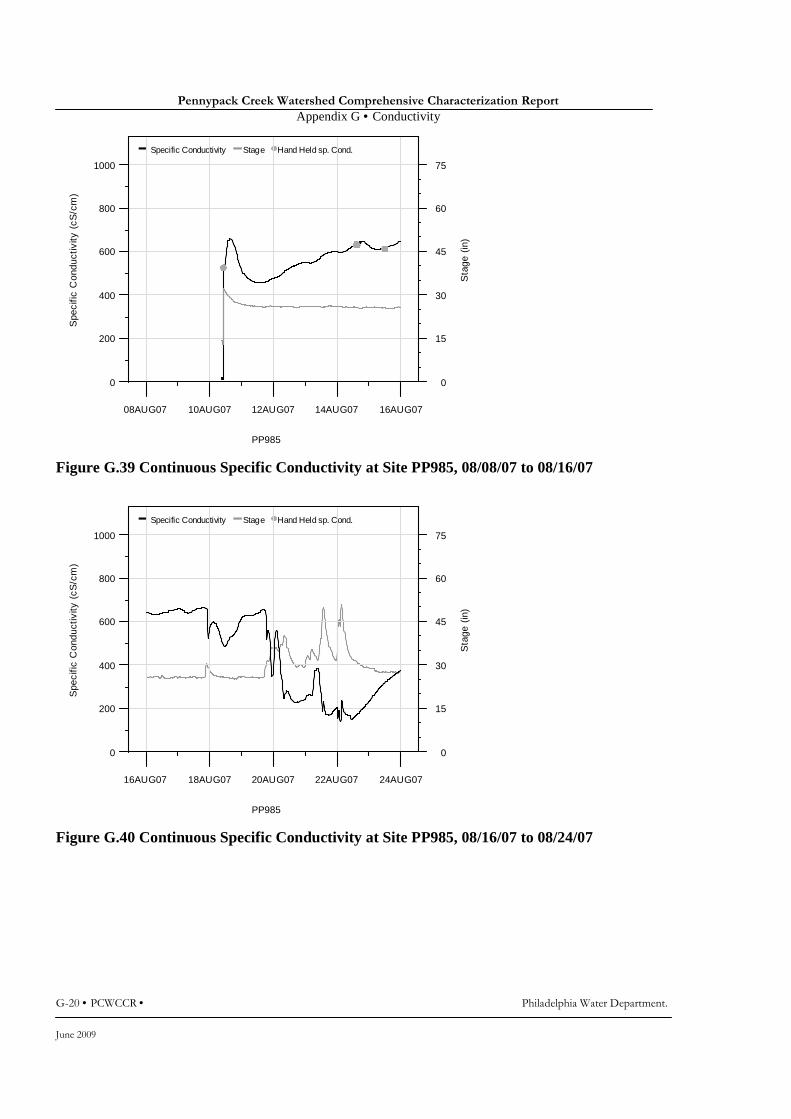
Pennypack Creek Watershed Comprehensive Characterization Report
Appendix G • Conductivity
G-20 • PCWCCR • Philadelphia Water Department.
June 2009
Specific Conductivity Stage Hand Held sp. Cond.
PP985
Spe
cific
Con
duct
ivity
(cS
/cm
)
0
200
400
600
800
1000
08AUG07 10AUG07 12AUG07 14AUG07 16AUG07
Sta
ge (
in)
0
15
30
45
60
75
Figure G.39 Continuous Specific Conductivity at Site PP985, 08/08/07 to 08/16/07
Specific Conductivity Stage Hand Held sp. Cond.
PP985
Spe
cific
Con
duct
ivity
(cS
/cm
)
0
200
400
600
800
1000
16AUG07 18AUG07 20AUG07 22AUG07 24AUG07
Sta
ge (
in)
0
15
30
45
60
75
Figure G.40 Continuous Specific Conductivity at Site PP985, 08/16/07 to 08/24/07
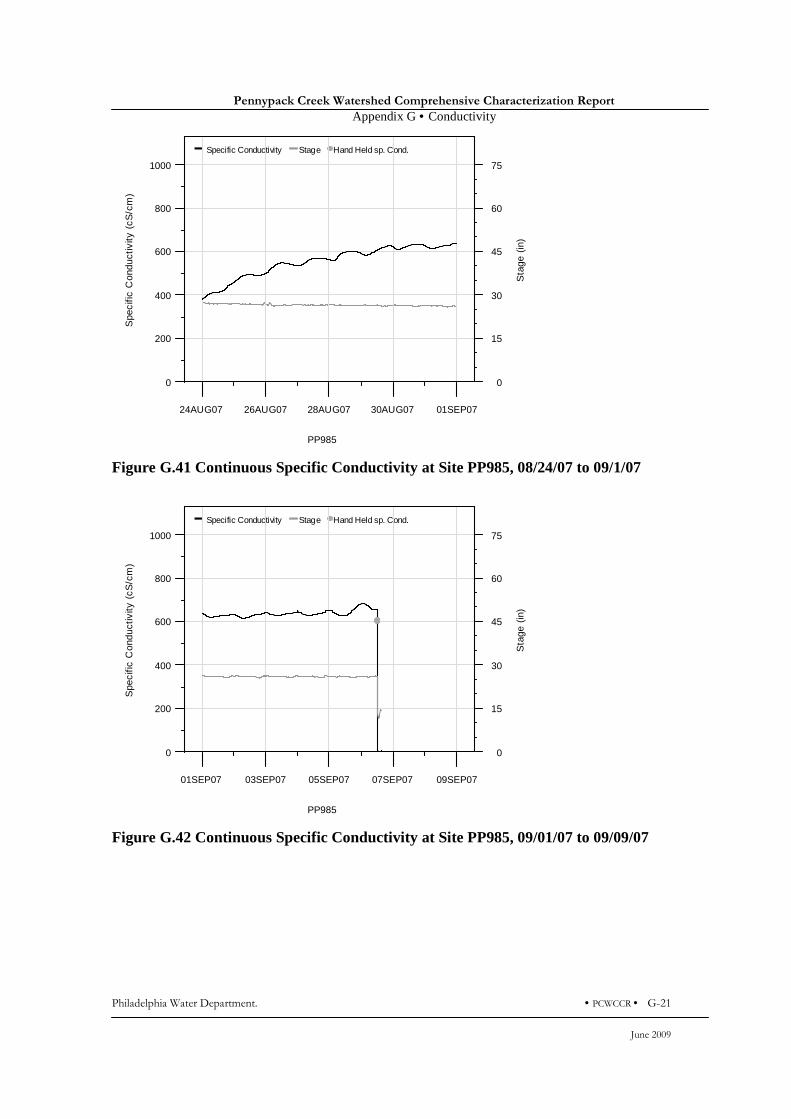
Pennypack Creek Watershed Comprehensive Characterization Report
Appendix G • Conductivity
Philadelphia Water Department. • PCWCCR • G-21
June 2009
Specific Conductivity Stage Hand Held sp. Cond.
PP985
Spe
cific
Con
duct
ivity
(cS
/cm
)
0
200
400
600
800
1000
24AUG07 26AUG07 28AUG07 30AUG07 01SEP07
Sta
ge (
in)
0
15
30
45
60
75
Figure G.41 Continuous Specific Conductivity at Site PP985, 08/24/07 to 09/1/07
Specific Conductivity Stage Hand Held sp. Cond.
PP985
Spe
cific
Con
duct
ivity
(cS
/cm
)
0
200
400
600
800
1000
01SEP07 03SEP07 05SEP07 07SEP07 09SEP07
Sta
ge (
in)
0
15
30
45
60
75
Figure G.42 Continuous Specific Conductivity at Site PP985, 09/01/07 to 09/09/07
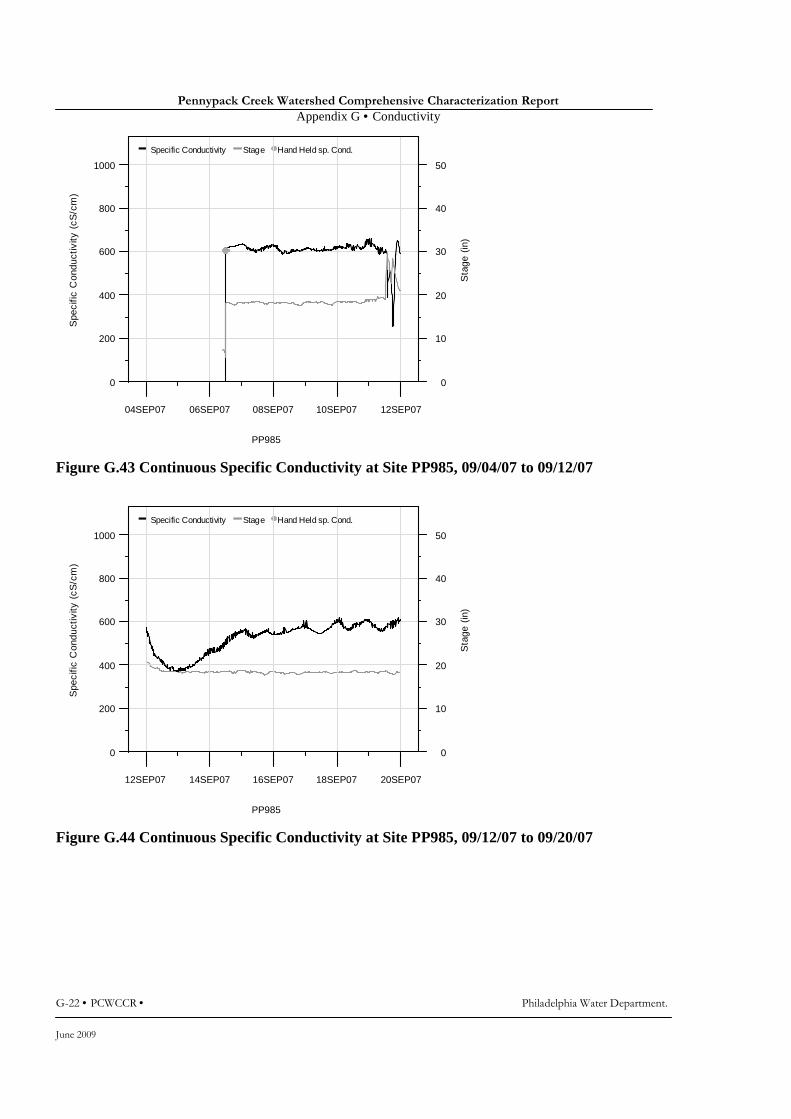
Pennypack Creek Watershed Comprehensive Characterization Report
Appendix G • Conductivity
G-22 • PCWCCR • Philadelphia Water Department.
June 2009
Specific Conductivity Stage Hand Held sp. Cond.
PP985
Spe
cific
Con
duct
ivity
(cS
/cm
)
0
200
400
600
800
1000
04SEP07 06SEP07 08SEP07 10SEP07 12SEP07
Sta
ge (
in)
0
10
20
30
40
50
Figure G.43 Continuous Specific Conductivity at Site PP985, 09/04/07 to 09/12/07
Specific Conductivity Stage Hand Held sp. Cond.
PP985
Spe
cific
Con
duct
ivity
(cS
/cm
)
0
200
400
600
800
1000
12SEP07 14SEP07 16SEP07 18SEP07 20SEP07
Sta
ge (
in)
0
10
20
30
40
50
Figure G.44 Continuous Specific Conductivity at Site PP985, 09/12/07 to 09/20/07
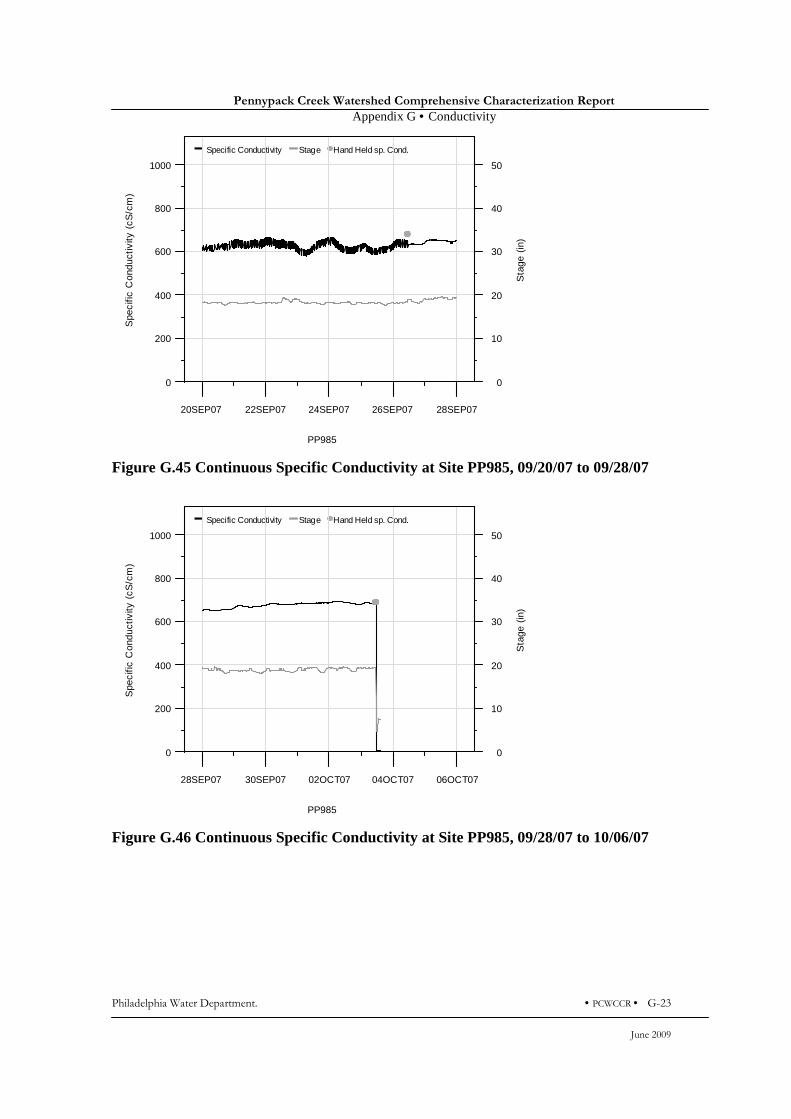
Pennypack Creek Watershed Comprehensive Characterization Report
Appendix G • Conductivity
Philadelphia Water Department. • PCWCCR • G-23
June 2009
Specific Conductivity Stage Hand Held sp. Cond.
PP985
Spe
cific
Con
duct
ivity
(cS
/cm
)
0
200
400
600
800
1000
20SEP07 22SEP07 24SEP07 26SEP07 28SEP07
Sta
ge (
in)
0
10
20
30
40
50
Figure G.45 Continuous Specific Conductivity at Site PP985, 09/20/07 to 09/28/07
Specific Conductivity Stage Hand Held sp. Cond.
PP985
Spe
cific
Con
duct
ivity
(cS
/cm
)
0
200
400
600
800
1000
28SEP07 30SEP07 02OCT07 04OCT07 06OCT07
Sta
ge (
in)
0
10
20
30
40
50
Figure G.46 Continuous Specific Conductivity at Site PP985, 09/28/07 to 10/06/07

Pennypack Creek Watershed Comprehensive Characterization Report
Appendix G • Conductivity
G-24 • PCWCCR • Philadelphia Water Department.
June 2009
Specific Conductivity Stage Hand Held sp. Cond.
PP985
Spe
cific
Con
duct
ivity
(cS
/cm
)
0
200
400
600
800
1000
30SEP07 02OCT07 04OCT07 06OCT07 08OCT07
Sta
ge (
in)
0
10
20
30
40
50
Figure G.47 Continuous Specific Conductivity at Site PP985, 09/30/07 to 10/08/07
Specific Conductivity Stage Hand Held sp. Cond.
PP985
Spe
cific
Con
duct
ivity
(cS
/cm
)
0
200
400
600
800
1000
08OCT07 10OCT07 12OCT07 14OCT07 16OCT07
Sta
ge (
in)
0
10
20
30
40
50
Figure G.48 Continuous Specific Conductivity at Site PP985, 10/08/07 to 10/16/07

Pennypack Creek Watershed Comprehensive Characterization Report
Appendix G • Conductivity
Philadelphia Water Department. • PCWCCR • G-25
June 2009
Specific Conductivity Stage Hand Held sp. Cond.
PP985
Spe
cific
Con
duct
ivity
(cS
/cm
)
0
200
400
600
800
1000
16OCT07 18OCT07 20OCT07 22OCT07 24OCT07
Sta
ge (
in)
0
10
20
30
40
50
Figure G.49 Continuous Specific Conductivity at Site PP985, 10/16/07 to 10/24/07
Specific Conductivity Stage Hand Held sp. Cond.
PP985
Spe
cific
Con
duct
ivity
(cS
/cm
)
0
200
400
600
800
1000
24OCT07 26OCT07 28OCT07 30OCT07 01NOV07
Sta
ge (
in)
0
10
20
30
40
50
Figure G.50 Continuous Specific Conductivity at Site PP985, 10/24/07 to 11/01/07
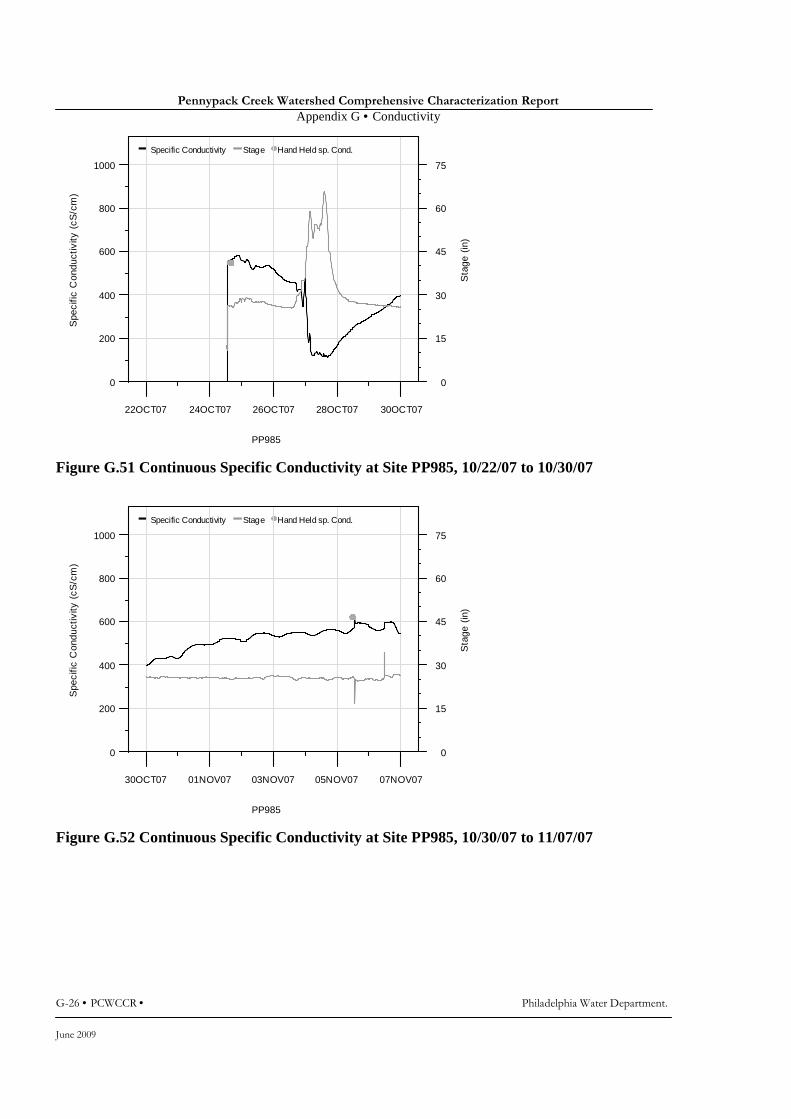
Pennypack Creek Watershed Comprehensive Characterization Report
Appendix G • Conductivity
G-26 • PCWCCR • Philadelphia Water Department.
June 2009
Specific Conductivity Stage Hand Held sp. Cond.
PP985
Spe
cific
Con
duct
ivity
(cS
/cm
)
0
200
400
600
800
1000
22OCT07 24OCT07 26OCT07 28OCT07 30OCT07
Sta
ge (
in)
0
15
30
45
60
75
Figure G.51 Continuous Specific Conductivity at Site PP985, 10/22/07 to 10/30/07
Specific Conductivity Stage Hand Held sp. Cond.
PP985
Spe
cific
Con
duct
ivity
(cS
/cm
)
0
200
400
600
800
1000
30OCT07 01NOV07 03NOV07 05NOV07 07NOV07
Sta
ge (
in)
0
15
30
45
60
75
Figure G.52 Continuous Specific Conductivity at Site PP985, 10/30/07 to 11/07/07
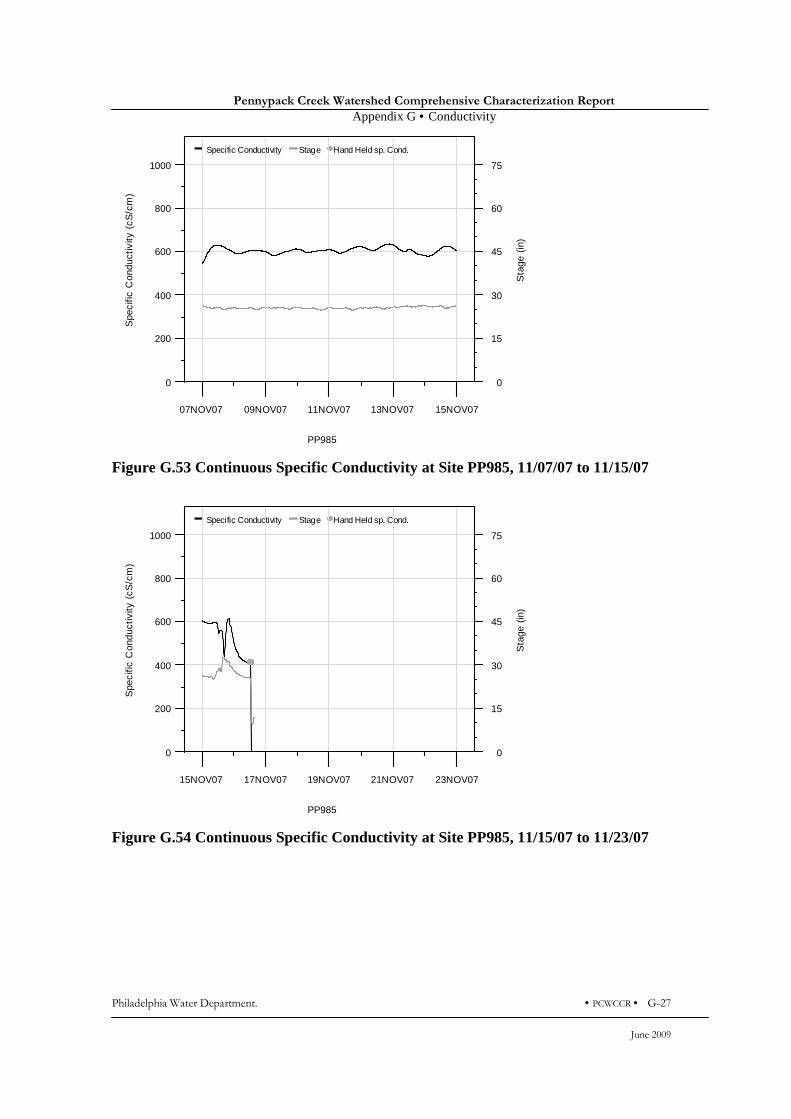
Pennypack Creek Watershed Comprehensive Characterization Report
Appendix G • Conductivity
Philadelphia Water Department. • PCWCCR • G-27
June 2009
Specific Conductivity Stage Hand Held sp. Cond.
PP985
Spe
cific
Con
duct
ivity
(cS
/cm
)
0
200
400
600
800
1000
07NOV07 09NOV07 11NOV07 13NOV07 15NOV07
Sta
ge (
in)
0
15
30
45
60
75
Figure G.53 Continuous Specific Conductivity at Site PP985, 11/07/07 to 11/15/07
Specific Conductivity Stage Hand Held sp. Cond.
PP985
Spe
cific
Con
duct
ivity
(cS
/cm
)
0
200
400
600
800
1000
15NOV07 17NOV07 19NOV07 21NOV07 23NOV07
Sta
ge (
in)
0
15
30
45
60
75
Figure G.54 Continuous Specific Conductivity at Site PP985, 11/15/07 to 11/23/07
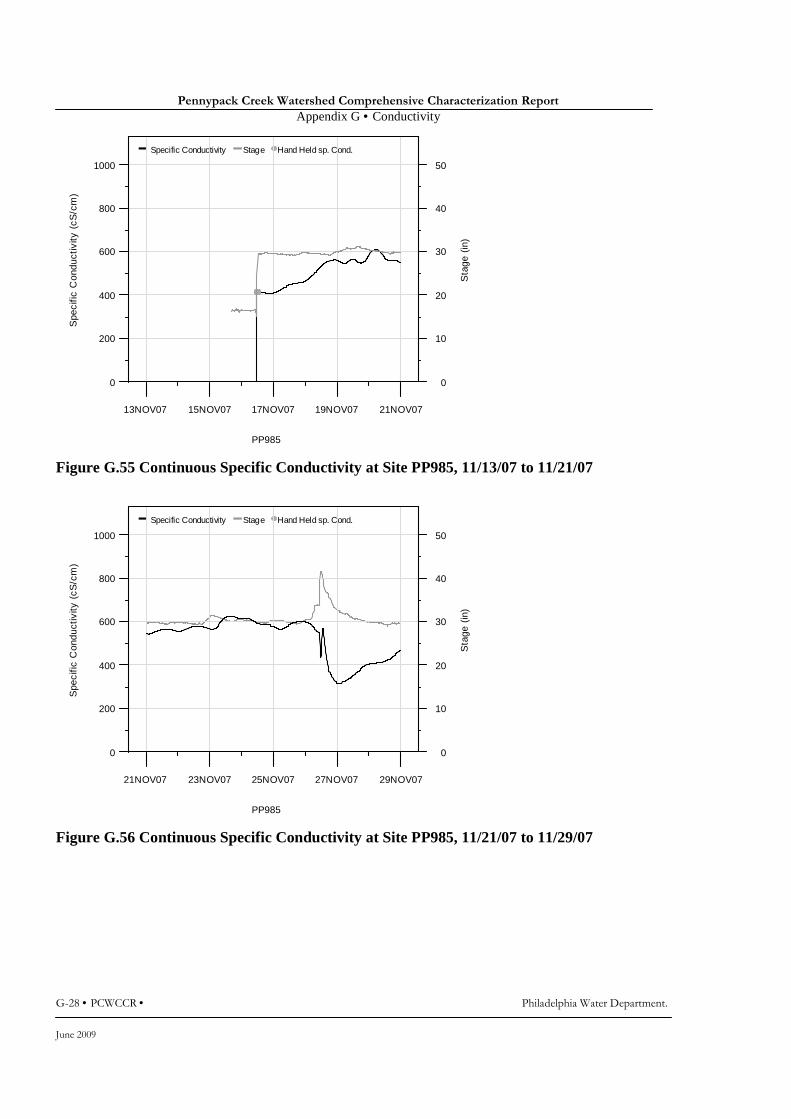
Pennypack Creek Watershed Comprehensive Characterization Report
Appendix G • Conductivity
G-28 • PCWCCR • Philadelphia Water Department.
June 2009
Specific Conductivity Stage Hand Held sp. Cond.
PP985
Spe
cific
Con
duct
ivity
(cS
/cm
)
0
200
400
600
800
1000
13NOV07 15NOV07 17NOV07 19NOV07 21NOV07
Sta
ge (
in)
0
10
20
30
40
50
Figure G.55 Continuous Specific Conductivity at Site PP985, 11/13/07 to 11/21/07
Specific Conductivity Stage Hand Held sp. Cond.
PP985
Spe
cific
Con
duct
ivity
(cS
/cm
)
0
200
400
600
800
1000
21NOV07 23NOV07 25NOV07 27NOV07 29NOV07
Sta
ge (
in)
0
10
20
30
40
50
Figure G.56 Continuous Specific Conductivity at Site PP985, 11/21/07 to 11/29/07
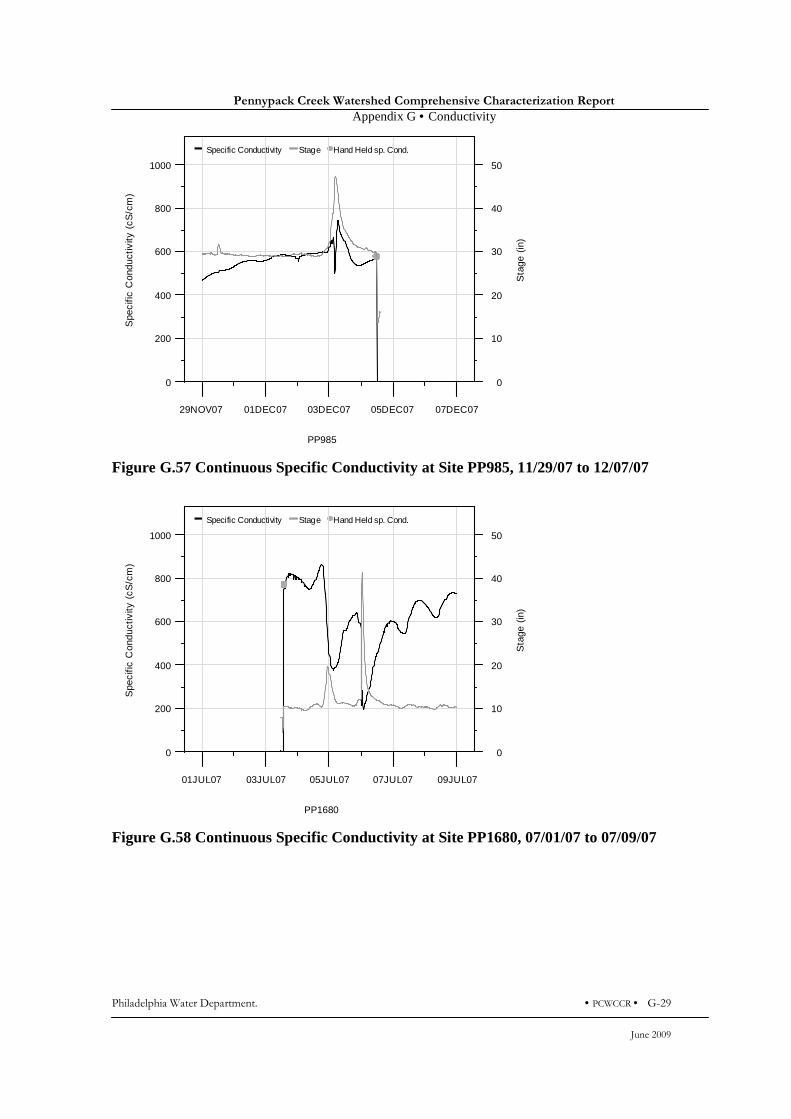
Pennypack Creek Watershed Comprehensive Characterization Report
Appendix G • Conductivity
Philadelphia Water Department. • PCWCCR • G-29
June 2009
Specific Conductivity Stage Hand Held sp. Cond.
PP985
Spe
cific
Con
duct
ivity
(cS
/cm
)
0
200
400
600
800
1000
29NOV07 01DEC07 03DEC07 05DEC07 07DEC07
Sta
ge (
in)
0
10
20
30
40
50
Figure G.57 Continuous Specific Conductivity at Site PP985, 11/29/07 to 12/07/07
Specific Conductivity Stage Hand Held sp. Cond.
PP1680
Spe
cific
Con
duct
ivity
(cS
/cm
)
0
200
400
600
800
1000
01JUL07 03JUL07 05JUL07 07JUL07 09JUL07
Sta
ge (
in)
0
10
20
30
40
50
Figure G.58 Continuous Specific Conductivity at Site PP1680, 07/01/07 to 07/09/07

Pennypack Creek Watershed Comprehensive Characterization Report
Appendix G • Conductivity
G-30 • PCWCCR • Philadelphia Water Department.
June 2009
Specific Conductivity Stage Hand Held sp. Cond.
PP1680
Spe
cific
Con
duct
ivity
(cS
/cm
)
0
200
400
600
800
1000
09JUL07 11JUL07 13JUL07 15JUL07 17JUL07
Sta
ge (
in)
0
10
20
30
40
50
Figure G.59 Continuous Specific Conductivity at Site PP1680, 07/09/07 to 07/17/07
Specific Conductivity Stage Hand Held sp. Cond.
PP1680
Spe
cific
Con
duct
ivity
(cS
/cm
)
0
200
400
600
800
1000
17JUL07 19JUL07 21JUL07 23JUL07 25JUL07
Sta
ge (
in)
0
10
20
30
40
50
Figure G.60 Continuous Specific Conductivity at Site PP1680, 07/17/07 to 07/25/07
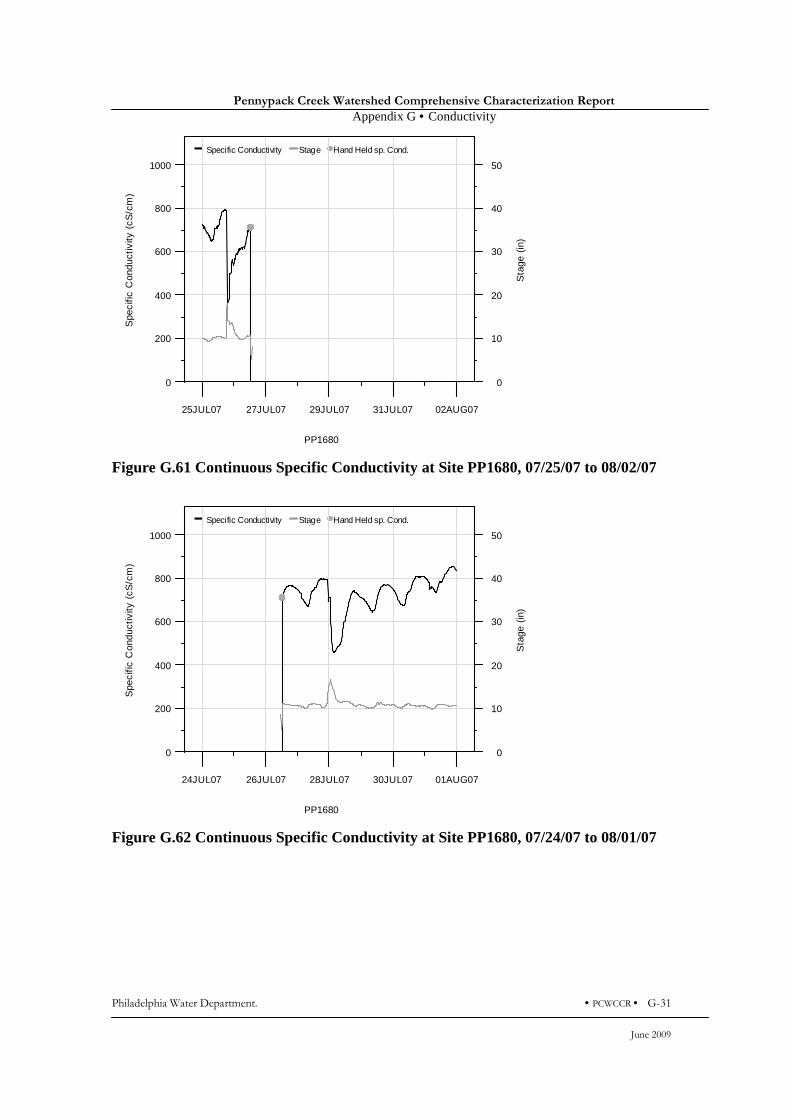
Pennypack Creek Watershed Comprehensive Characterization Report
Appendix G • Conductivity
Philadelphia Water Department. • PCWCCR • G-31
June 2009
Specific Conductivity Stage Hand Held sp. Cond.
PP1680
Spe
cific
Con
duct
ivity
(cS
/cm
)
0
200
400
600
800
1000
25JUL07 27JUL07 29JUL07 31JUL07 02AUG07
Sta
ge (
in)
0
10
20
30
40
50
Figure G.61 Continuous Specific Conductivity at Site PP1680, 07/25/07 to 08/02/07
Specific Conductivity Stage Hand Held sp. Cond.
PP1680
Spe
cific
Con
duct
ivity
(cS
/cm
)
0
200
400
600
800
1000
24JUL07 26JUL07 28JUL07 30JUL07 01AUG07
Sta
ge (
in)
0
10
20
30
40
50
Figure G.62 Continuous Specific Conductivity at Site PP1680, 07/24/07 to 08/01/07
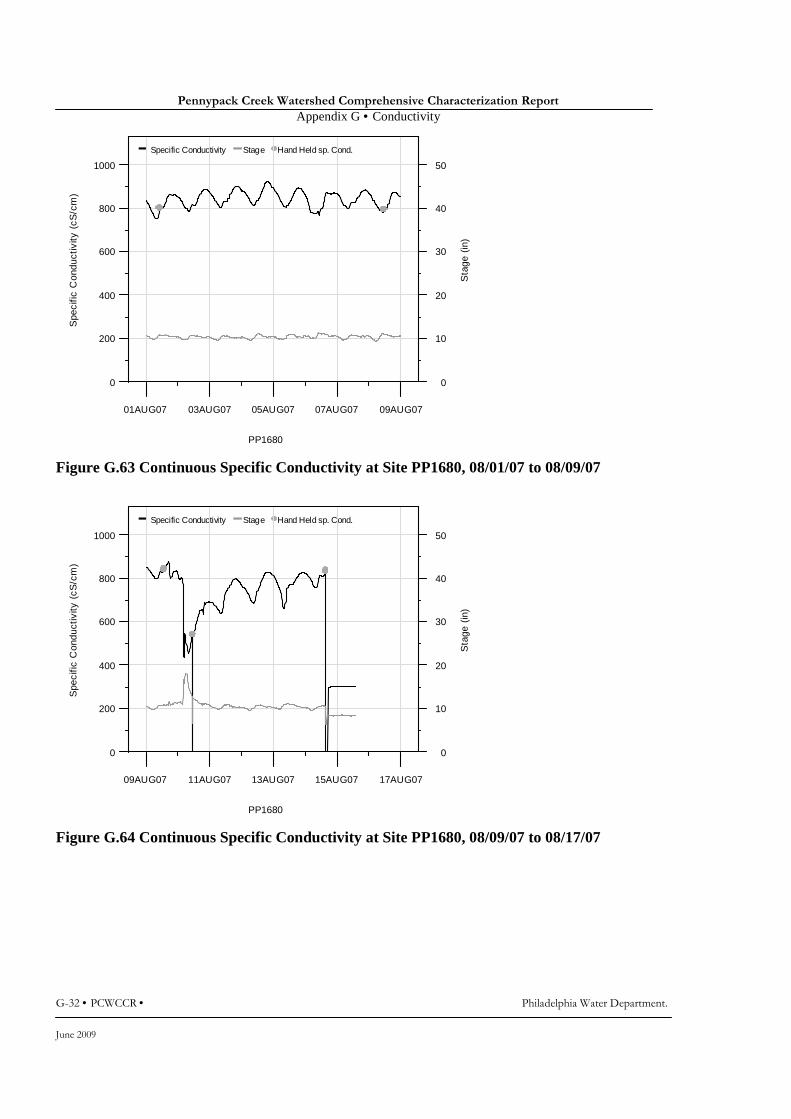
Pennypack Creek Watershed Comprehensive Characterization Report
Appendix G • Conductivity
G-32 • PCWCCR • Philadelphia Water Department.
June 2009
Specific Conductivity Stage Hand Held sp. Cond.
PP1680
Spe
cific
Con
duct
ivity
(cS
/cm
)
0
200
400
600
800
1000
01AUG07 03AUG07 05AUG07 07AUG07 09AUG07
Sta
ge (
in)
0
10
20
30
40
50
Figure G.63 Continuous Specific Conductivity at Site PP1680, 08/01/07 to 08/09/07
Specific Conductivity Stage Hand Held sp. Cond.
PP1680
Spe
cific
Con
duct
ivity
(cS
/cm
)
0
200
400
600
800
1000
09AUG07 11AUG07 13AUG07 15AUG07 17AUG07
Sta
ge (
in)
0
10
20
30
40
50
Figure G.64 Continuous Specific Conductivity at Site PP1680, 08/09/07 to 08/17/07
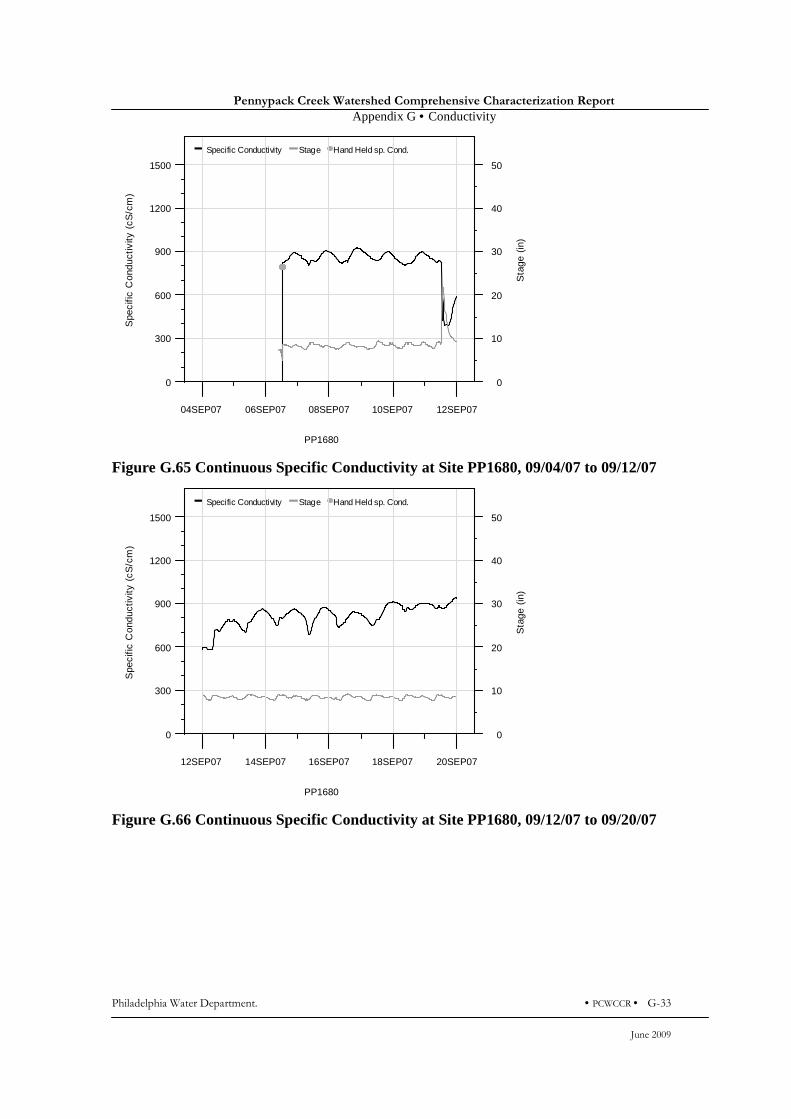
Pennypack Creek Watershed Comprehensive Characterization Report
Appendix G • Conductivity
Philadelphia Water Department. • PCWCCR • G-33
June 2009
Specific Conductivity Stage Hand Held sp. Cond.
PP1680
Spe
cific
Con
duct
ivity
(cS
/cm
)
0
300
600
900
1200
1500
04SEP07 06SEP07 08SEP07 10SEP07 12SEP07
Sta
ge (
in)
0
10
20
30
40
50
Figure G.65 Continuous Specific Conductivity at Site PP1680, 09/04/07 to 09/12/07
Specific Conductivity Stage Hand Held sp. Cond.
PP1680
Spe
cific
Con
duct
ivity
(cS
/cm
)
0
300
600
900
1200
1500
12SEP07 14SEP07 16SEP07 18SEP07 20SEP07
Sta
ge (
in)
0
10
20
30
40
50
Figure G.66 Continuous Specific Conductivity at Site PP1680, 09/12/07 to 09/20/07

Pennypack Creek Watershed Comprehensive Characterization Report
Appendix G • Conductivity
G-34 • PCWCCR • Philadelphia Water Department.
June 2009
Specific Conductivity Stage Hand Held sp. Cond.
PP1680
Spe
cific
Con
duct
ivity
(cS
/cm
)
0
300
600
900
1200
1500
20SEP07 22SEP07 24SEP07 26SEP07 28SEP07
Sta
ge (
in)
0
10
20
30
40
50
Figure G.67 Continuous Specific Conductivity at Site PP1680, 09/20/07 to 09/28/07
Specific Conductivity Stage Hand Held sp. Cond.
PP1680
Spe
cific
Con
duct
ivity
(cS
/cm
)
0
300
600
900
1200
1500
28SEP07 30SEP07 02OCT07 04OCT07 06OCT07
Sta
ge (
in)
0
10
20
30
40
50
Figure G.68 Continuous Specific Conductivity at Site PP1680, 09/28/07 to 10/06/07
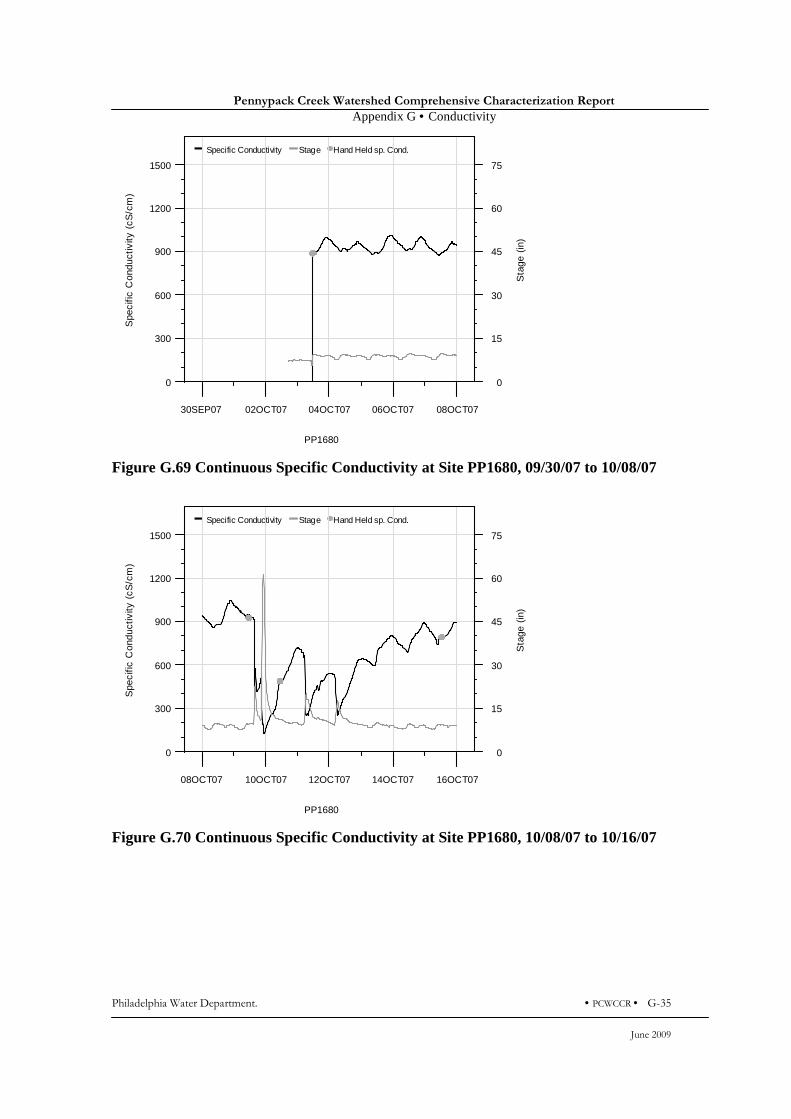
Pennypack Creek Watershed Comprehensive Characterization Report
Appendix G • Conductivity
Philadelphia Water Department. • PCWCCR • G-35
June 2009
Specific Conductivity Stage Hand Held sp. Cond.
PP1680
Spe
cific
Con
duct
ivity
(cS
/cm
)
0
300
600
900
1200
1500
30SEP07 02OCT07 04OCT07 06OCT07 08OCT07
Sta
ge (
in)
0
15
30
45
60
75
Figure G.69 Continuous Specific Conductivity at Site PP1680, 09/30/07 to 10/08/07
Specific Conductivity Stage Hand Held sp. Cond.
PP1680
Spe
cific
Con
duct
ivity
(cS
/cm
)
0
300
600
900
1200
1500
08OCT07 10OCT07 12OCT07 14OCT07 16OCT07
Sta
ge (
in)
0
15
30
45
60
75
Figure G.70 Continuous Specific Conductivity at Site PP1680, 10/08/07 to 10/16/07
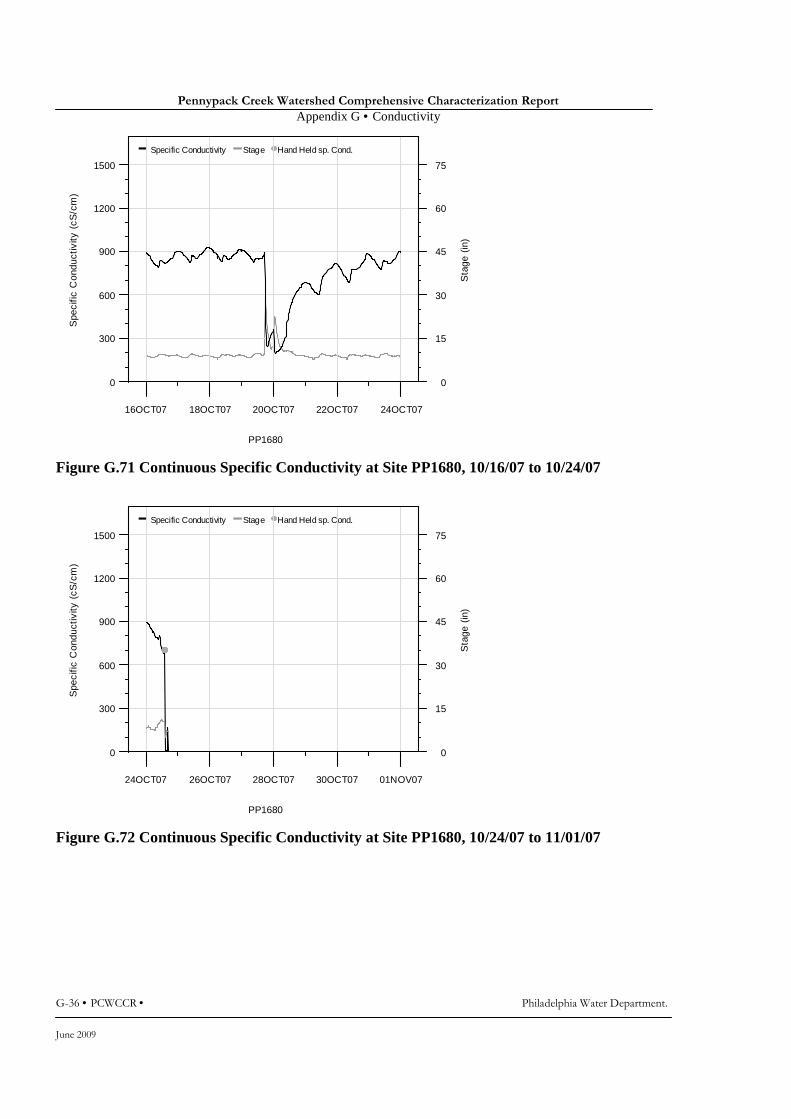
Pennypack Creek Watershed Comprehensive Characterization Report
Appendix G • Conductivity
G-36 • PCWCCR • Philadelphia Water Department.
June 2009
Specific Conductivity Stage Hand Held sp. Cond.
PP1680
Spe
cific
Con
duct
ivity
(cS
/cm
)
0
300
600
900
1200
1500
16OCT07 18OCT07 20OCT07 22OCT07 24OCT07
Sta
ge (
in)
0
15
30
45
60
75
Figure G.71 Continuous Specific Conductivity at Site PP1680, 10/16/07 to 10/24/07
Specific Conductivity Stage Hand Held sp. Cond.
PP1680
Spe
cific
Con
duct
ivity
(cS
/cm
)
0
300
600
900
1200
1500
24OCT07 26OCT07 28OCT07 30OCT07 01NOV07
Sta
ge (
in)
0
15
30
45
60
75
Figure G.72 Continuous Specific Conductivity at Site PP1680, 10/24/07 to 11/01/07
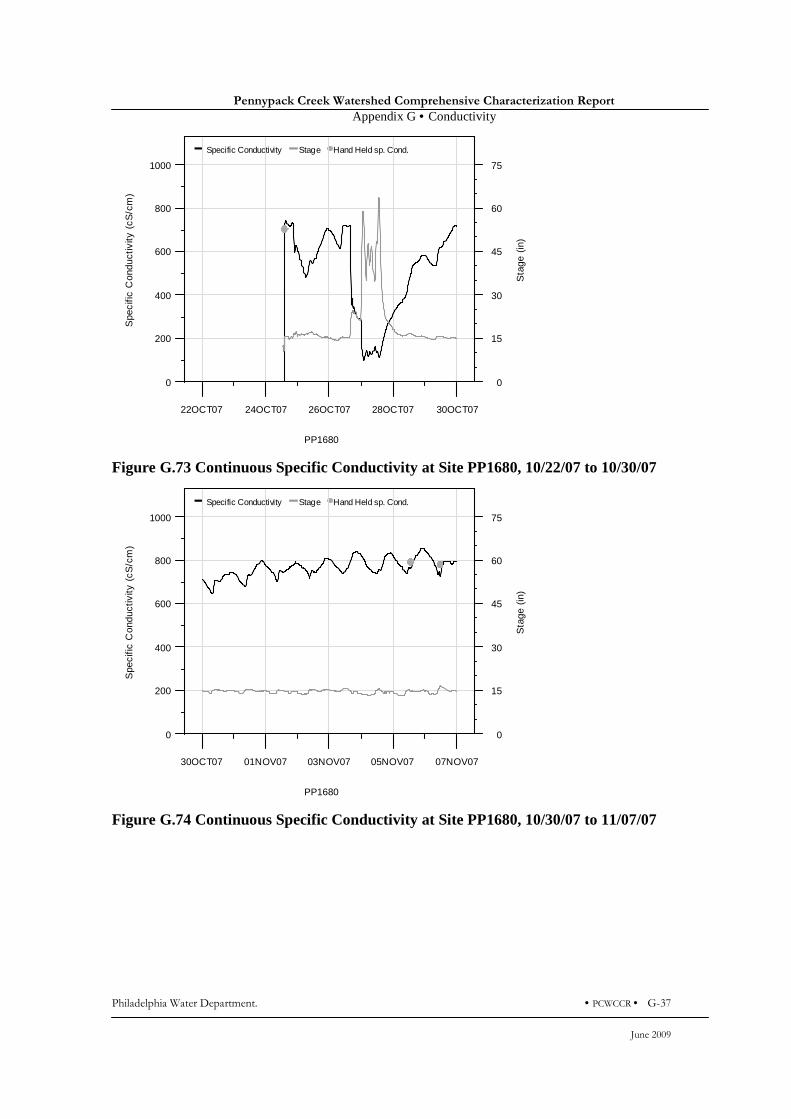
Pennypack Creek Watershed Comprehensive Characterization Report
Appendix G • Conductivity
Philadelphia Water Department. • PCWCCR • G-37
June 2009
Specific Conductivity Stage Hand Held sp. Cond.
PP1680
Spe
cific
Con
duct
ivity
(cS
/cm
)
0
200
400
600
800
1000
22OCT07 24OCT07 26OCT07 28OCT07 30OCT07
Sta
ge (
in)
0
15
30
45
60
75
Figure G.73 Continuous Specific Conductivity at Site PP1680, 10/22/07 to 10/30/07
Specific Conductivity Stage Hand Held sp. Cond.
PP1680
Spe
cific
Con
duct
ivity
(cS
/cm
)
0
200
400
600
800
1000
30OCT07 01NOV07 03NOV07 05NOV07 07NOV07
Sta
ge (
in)
0
15
30
45
60
75
Figure G.74 Continuous Specific Conductivity at Site PP1680, 10/30/07 to 11/07/07
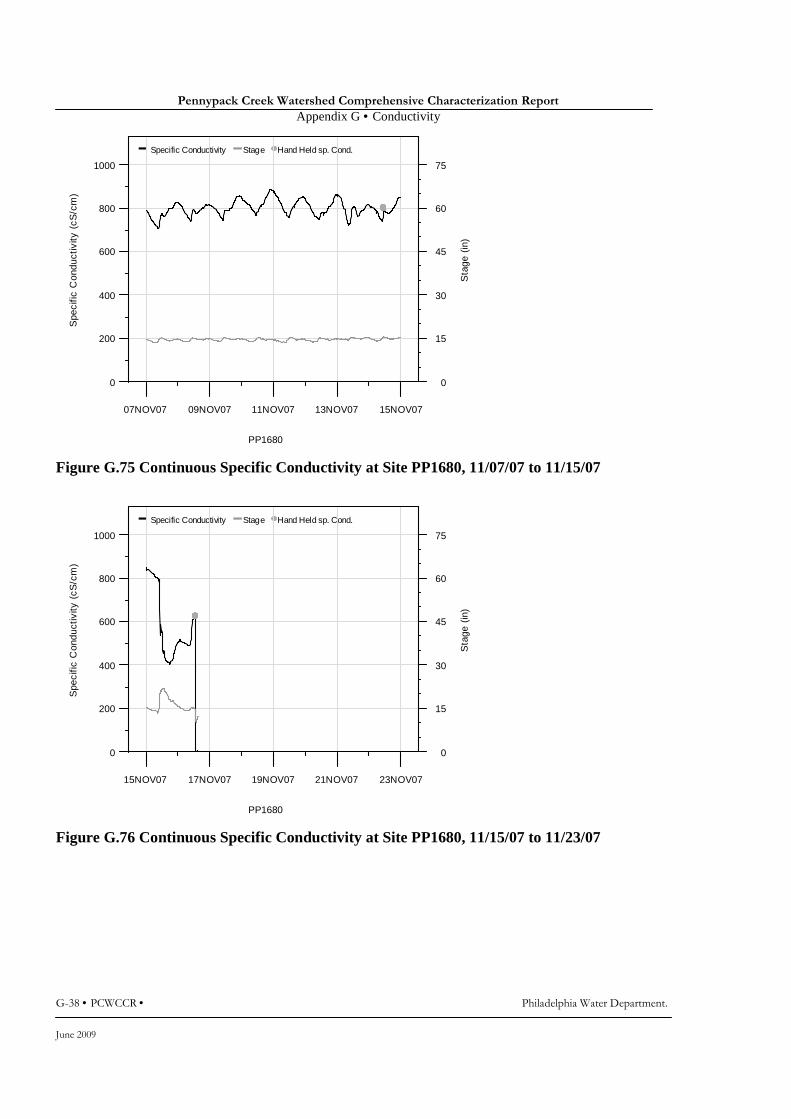
Pennypack Creek Watershed Comprehensive Characterization Report
Appendix G • Conductivity
G-38 • PCWCCR • Philadelphia Water Department.
June 2009
Specific Conductivity Stage Hand Held sp. Cond.
PP1680
Spe
cific
Con
duct
ivity
(cS
/cm
)
0
200
400
600
800
1000
07NOV07 09NOV07 11NOV07 13NOV07 15NOV07
Sta
ge (
in)
0
15
30
45
60
75
Figure G.75 Continuous Specific Conductivity at Site PP1680, 11/07/07 to 11/15/07
Specific Conductivity Stage Hand Held sp. Cond.
PP1680
Spe
cific
Con
duct
ivity
(cS
/cm
)
0
200
400
600
800
1000
15NOV07 17NOV07 19NOV07 21NOV07 23NOV07
Sta
ge (
in)
0
15
30
45
60
75
Figure G.76 Continuous Specific Conductivity at Site PP1680, 11/15/07 to 11/23/07
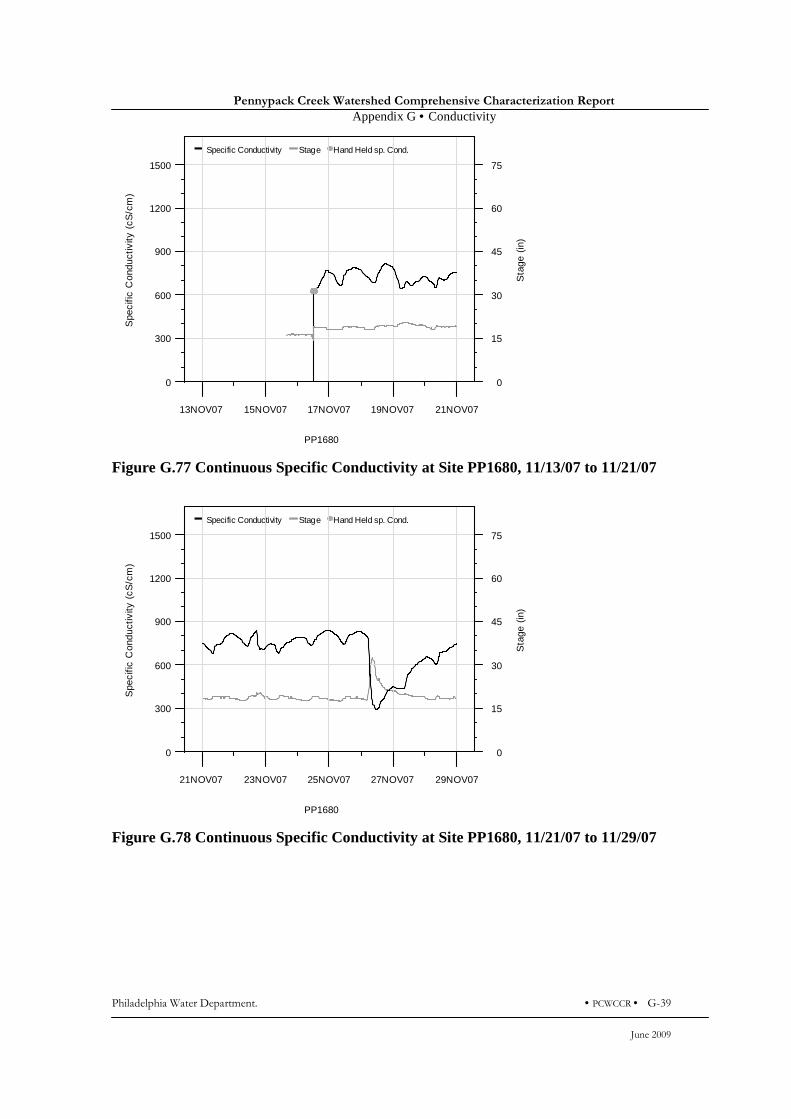
Pennypack Creek Watershed Comprehensive Characterization Report
Appendix G • Conductivity
Philadelphia Water Department. • PCWCCR • G-39
June 2009
Specific Conductivity Stage Hand Held sp. Cond.
PP1680
Spe
cific
Con
duct
ivity
(cS
/cm
)
0
300
600
900
1200
1500
13NOV07 15NOV07 17NOV07 19NOV07 21NOV07
Sta
ge (
in)
0
15
30
45
60
75
Figure G.77 Continuous Specific Conductivity at Site PP1680, 11/13/07 to 11/21/07
Specific Conductivity Stage Hand Held sp. Cond.
PP1680
Spe
cific
Con
duct
ivity
(cS
/cm
)
0
300
600
900
1200
1500
21NOV07 23NOV07 25NOV07 27NOV07 29NOV07
Sta
ge (
in)
0
15
30
45
60
75
Figure G.78 Continuous Specific Conductivity at Site PP1680, 11/21/07 to 11/29/07
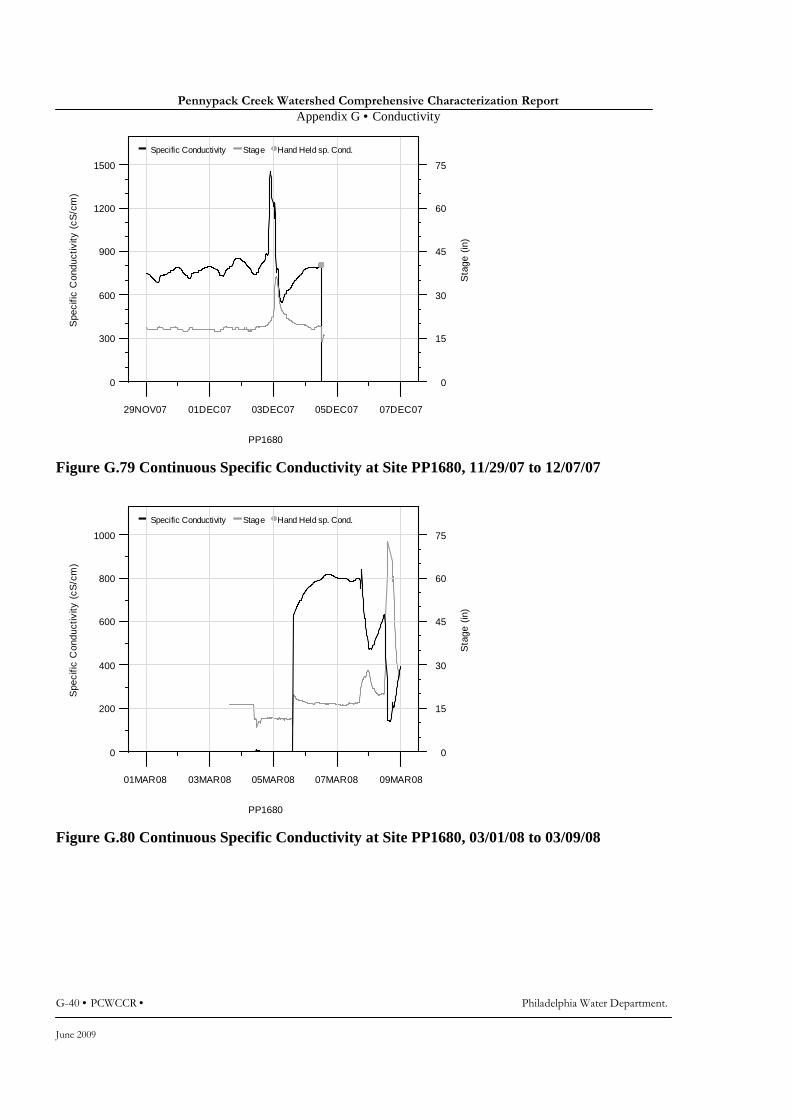
Pennypack Creek Watershed Comprehensive Characterization Report
Appendix G • Conductivity
G-40 • PCWCCR • Philadelphia Water Department.
June 2009
Specific Conductivity Stage Hand Held sp. Cond.
PP1680
Spe
cific
Con
duct
ivity
(cS
/cm
)
0
300
600
900
1200
1500
29NOV07 01DEC07 03DEC07 05DEC07 07DEC07
Sta
ge (
in)
0
15
30
45
60
75
Figure G.79 Continuous Specific Conductivity at Site PP1680, 11/29/07 to 12/07/07
Specific Conductivity Stage Hand Held sp. Cond.
PP1680
Spe
cific
Con
duct
ivity
(cS
/cm
)
0
200
400
600
800
1000
01MAR08 03MAR08 05MAR08 07MAR08 09MAR08
Sta
ge (
in)
0
15
30
45
60
75
Figure G.80 Continuous Specific Conductivity at Site PP1680, 03/01/08 to 03/09/08
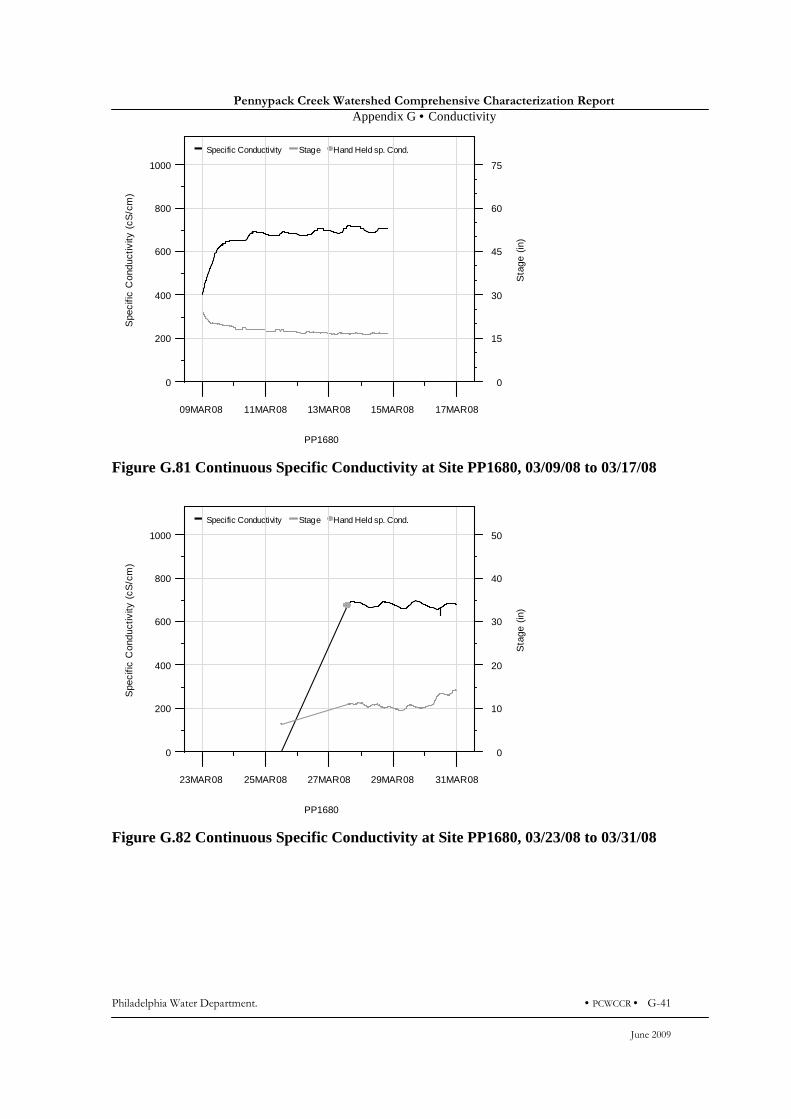
Pennypack Creek Watershed Comprehensive Characterization Report
Appendix G • Conductivity
Philadelphia Water Department. • PCWCCR • G-41
June 2009
Specific Conductivity Stage Hand Held sp. Cond.
PP1680
Spe
cific
Con
duct
ivity
(cS
/cm
)
0
200
400
600
800
1000
09MAR08 11MAR08 13MAR08 15MAR08 17MAR08
Sta
ge (
in)
0
15
30
45
60
75
Figure G.81 Continuous Specific Conductivity at Site PP1680, 03/09/08 to 03/17/08
Specific Conductivity Stage Hand Held sp. Cond.
PP1680
Spe
cific
Con
duct
ivity
(cS
/cm
)
0
200
400
600
800
1000
23MAR08 25MAR08 27MAR08 29MAR08 31MAR08
Sta
ge (
in)
0
10
20
30
40
50
Figure G.82 Continuous Specific Conductivity at Site PP1680, 03/23/08 to 03/31/08

Pennypack Creek Watershed Comprehensive Characterization Report
Appendix G • Conductivity
G-42 • PCWCCR • Philadelphia Water Department.
June 2009
Specific Conductivity Stage Hand Held sp. Cond.
PP1680
Spe
cific
Con
duct
ivity
(cS
/cm
)
0
200
400
600
800
1000
31MAR08 02APR08 04APR08 06APR08 08APR08
Sta
ge (
in)
0
10
20
30
40
50
Figure G.83 Continuous Specific Conductivity at Site PP1680, 03/31/08 to 04/08/08
Specific Conductivity Stage Hand Held sp. Cond.
PP1680
Spe
cific
Con
duct
ivity
(cS
/cm
)
0
200
400
600
800
1000
08APR08 10APR08 12APR08 14APR08 16APR08
Sta
ge (
in)
0
10
20
30
40
50
Figure G.84 Continuous Specific Conductivity at Site PP1680, 04/08/08 to 04/16/08
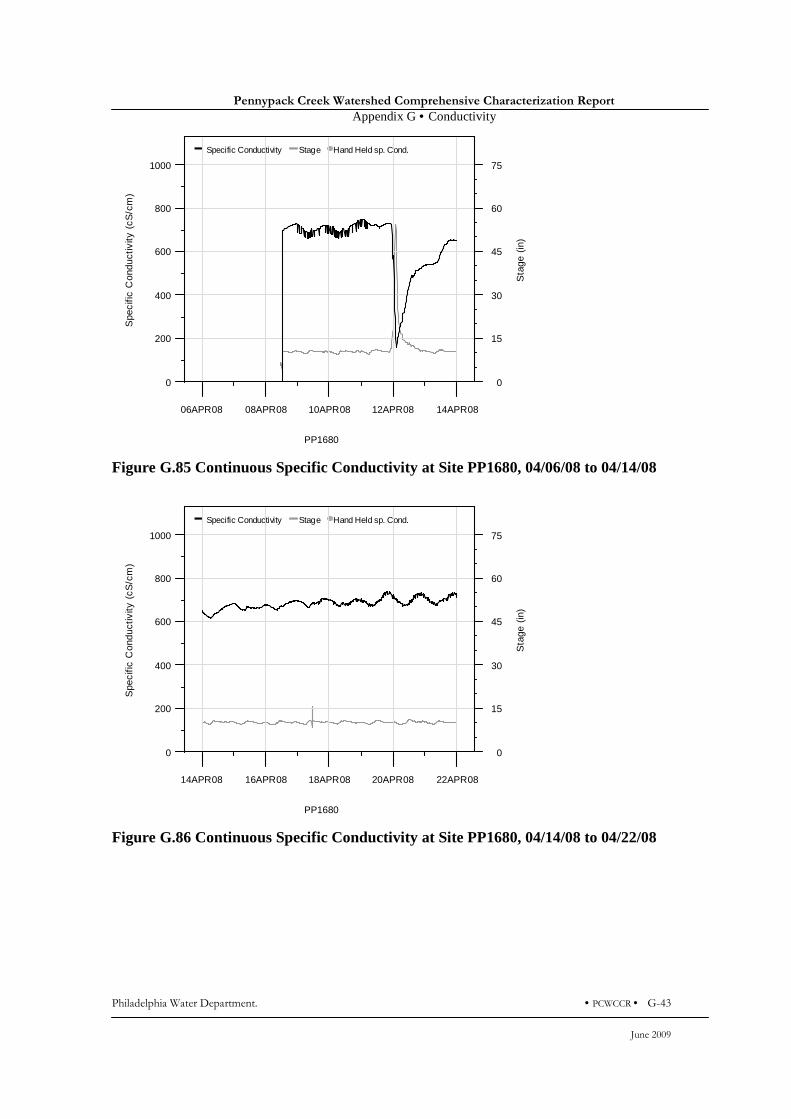
Pennypack Creek Watershed Comprehensive Characterization Report
Appendix G • Conductivity
Philadelphia Water Department. • PCWCCR • G-43
June 2009
Specific Conductivity Stage Hand Held sp. Cond.
PP1680
Spe
cific
Con
duct
ivity
(cS
/cm
)
0
200
400
600
800
1000
06APR08 08APR08 10APR08 12APR08 14APR08
Sta
ge (
in)
0
15
30
45
60
75
Figure G.85 Continuous Specific Conductivity at Site PP1680, 04/06/08 to 04/14/08
Specific Conductivity Stage Hand Held sp. Cond.
PP1680
Spe
cific
Con
duct
ivity
(cS
/cm
)
0
200
400
600
800
1000
14APR08 16APR08 18APR08 20APR08 22APR08
Sta
ge (
in)
0
15
30
45
60
75
Figure G.86 Continuous Specific Conductivity at Site PP1680, 04/14/08 to 04/22/08

Pennypack Creek Watershed Comprehensive Characterization Report
Appendix G • Conductivity
G-44 • PCWCCR • Philadelphia Water Department.
June 2009
Specific Conductivity Stage Hand Held sp. Cond.
PP1680
Spe
cific
Con
duct
ivity
(cS
/cm
)
0
200
400
600
800
1000
22APR08 24APR08 26APR08 28APR08 30APR08
Sta
ge (
in)
0
15
30
45
60
75
Figure G.87 Continuous Specific Conductivity at Site PP1680, 04/22/08 to 04/30/08
Specific Conductivity Stage Hand Held sp. Cond.
PP1680
Spe
cific
Con
duct
ivity
(cS
/cm
)
0
200
400
600
800
1000
30APR08 02MAY08 04MAY08 06MAY08 08MAY08
Sta
ge (
in)
0
15
30
45
60
75
Figure G.88 Continuous Specific Conductivity at Site PP1680, 04/30/08 to 05/08/08
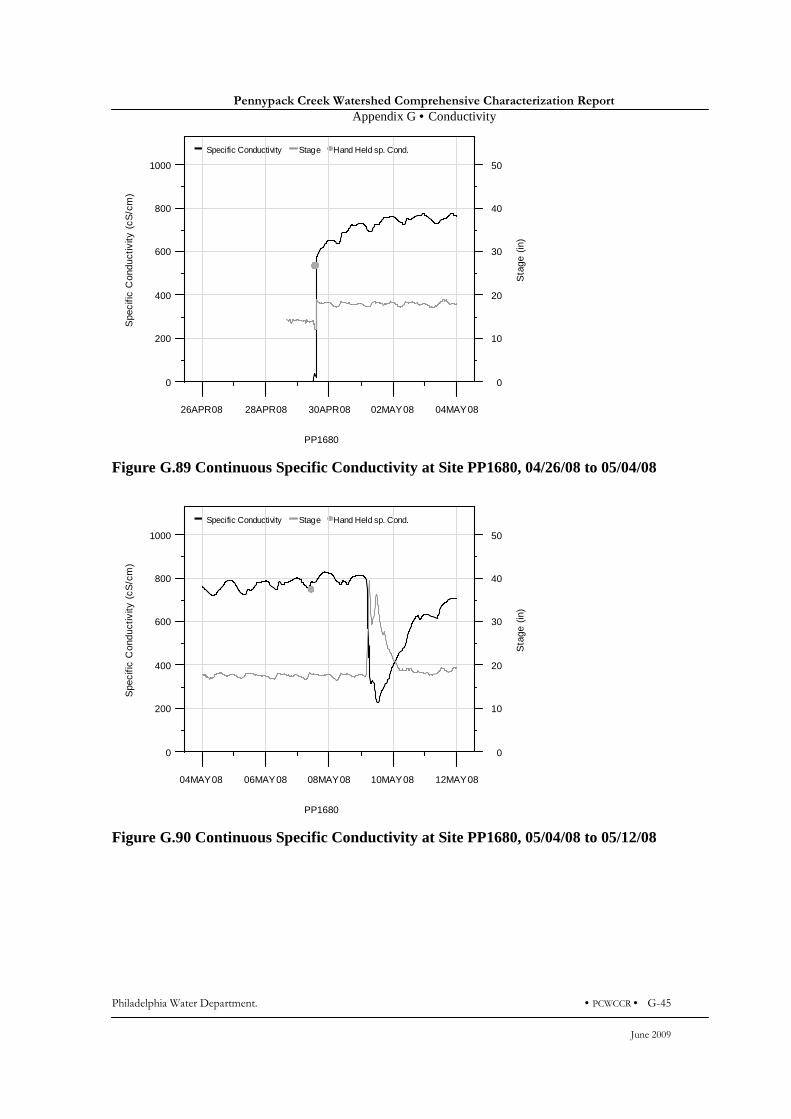
Pennypack Creek Watershed Comprehensive Characterization Report
Appendix G • Conductivity
Philadelphia Water Department. • PCWCCR • G-45
June 2009
Specific Conductivity Stage Hand Held sp. Cond.
PP1680
Spe
cific
Con
duct
ivity
(cS
/cm
)
0
200
400
600
800
1000
26APR08 28APR08 30APR08 02MAY08 04MAY08
Sta
ge (
in)
0
10
20
30
40
50
Figure G.89 Continuous Specific Conductivity at Site PP1680, 04/26/08 to 05/04/08
Specific Conductivity Stage Hand Held sp. Cond.
PP1680
Spe
cific
Con
duct
ivity
(cS
/cm
)
0
200
400
600
800
1000
04MAY08 06MAY08 08MAY08 10MAY08 12MAY08
Sta
ge (
in)
0
10
20
30
40
50
Figure G.90 Continuous Specific Conductivity at Site PP1680, 05/04/08 to 05/12/08

Pennypack Creek Watershed Comprehensive Characterization Report
Appendix G • Conductivity
G-46 • PCWCCR • Philadelphia Water Department.
June 2009
Specific Conductivity Stage Hand Held sp. Cond.
PP1680
Spe
cific
Con
duct
ivity
(cS
/cm
)
0
200
400
600
800
1000
10MAY08 12MAY08 14MAY08 16MAY08 18MAY08
Sta
ge (
in)
0
15
30
45
60
75
Figure G.91 Continuous Specific Conductivity at Site PP1680, 05/10/08 to 05/18/08
Specific Conductivity Stage Hand Held sp. Cond.
PP1680
Spe
cific
Con
duct
ivity
(cS
/cm
)
0
200
400
600
800
1000
18MAY08 20MAY08 22MAY08 24MAY08 26MAY08
Sta
ge (
in)
0
15
30
45
60
75
Figure G.92 Continuous Specific Conductivity at Site PP1680, 05/18/08 to 05/26/08
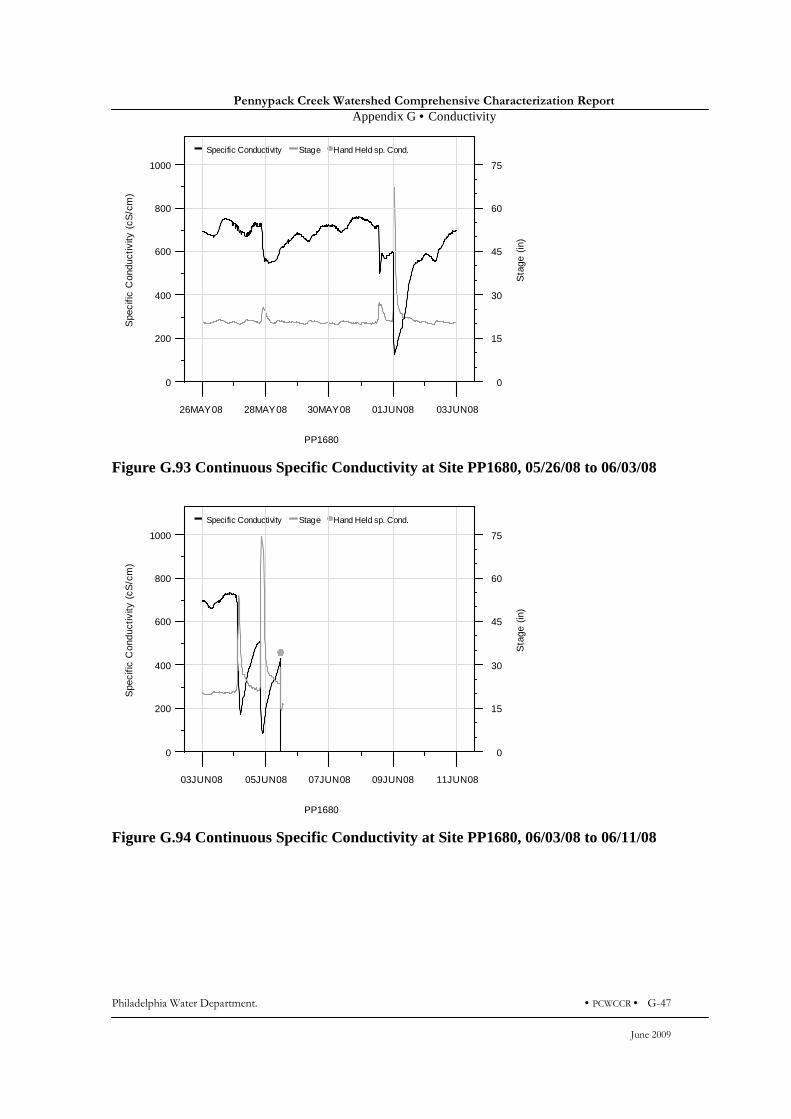
Pennypack Creek Watershed Comprehensive Characterization Report
Appendix G • Conductivity
Philadelphia Water Department. • PCWCCR • G-47
June 2009
Specific Conductivity Stage Hand Held sp. Cond.
PP1680
Spe
cific
Con
duct
ivity
(cS
/cm
)
0
200
400
600
800
1000
26MAY08 28MAY08 30MAY08 01JUN08 03JUN08
Sta
ge (
in)
0
15
30
45
60
75
Figure G.93 Continuous Specific Conductivity at Site PP1680, 05/26/08 to 06/03/08
Specific Conductivity Stage Hand Held sp. Cond.
PP1680
Spe
cific
Con
duct
ivity
(cS
/cm
)
0
200
400
600
800
1000
03JUN08 05JUN08 07JUN08 09JUN08 11JUN08
Sta
ge (
in)
0
15
30
45
60
75
Figure G.94 Continuous Specific Conductivity at Site PP1680, 06/03/08 to 06/11/08
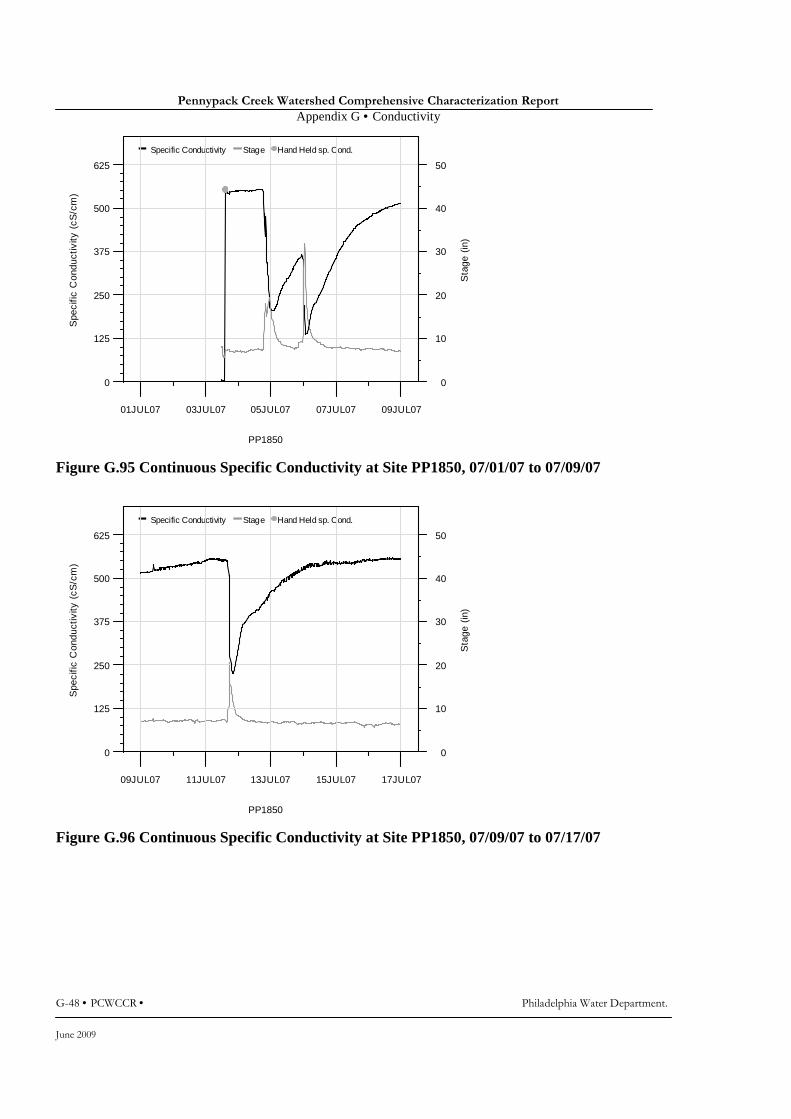
Pennypack Creek Watershed Comprehensive Characterization Report
Appendix G • Conductivity
G-48 • PCWCCR • Philadelphia Water Department.
June 2009
Specific Conductivity Stage Hand Held sp. Cond.
PP1850
Spe
cific
Con
duct
ivity
(cS
/cm
)
0
125
250
375
500
625
01JUL07 03JUL07 05JUL07 07JUL07 09JUL07
Sta
ge (
in)
0
10
20
30
40
50
Figure G.95 Continuous Specific Conductivity at Site PP1850, 07/01/07 to 07/09/07
Specific Conductivity Stage Hand Held sp. Cond.
PP1850
Spe
cific
Con
duct
ivity
(cS
/cm
)
0
125
250
375
500
625
09JUL07 11JUL07 13JUL07 15JUL07 17JUL07
Sta
ge (
in)
0
10
20
30
40
50
Figure G.96 Continuous Specific Conductivity at Site PP1850, 07/09/07 to 07/17/07

Pennypack Creek Watershed Comprehensive Characterization Report
Appendix G • Conductivity
Philadelphia Water Department. • PCWCCR • G-49
June 2009
Specific Conductivity Stage Hand Held sp. Cond.
PP1850
Spe
cific
Con
duct
ivity
(cS
/cm
)
0
125
250
375
500
625
17JUL07 19JUL07 21JUL07 23JUL07 25JUL07
Sta
ge (
in)
0
10
20
30
40
50
Figure G.97 Continuous Specific Conductivity at Site PP1850, 07/17/07 to 07/25/07
Specific Conductivity Stage Hand Held sp. Cond.
PP1850
Spe
cific
Con
duct
ivity
(cS
/cm
)
0
125
250
375
500
625
25JUL07 27JUL07 29JUL07 31JUL07 02AUG07
Sta
ge (
in)
0
10
20
30
40
50
Figure G.98 Continuous Specific Conductivity at Site PP1850, 07/25/07 to 08/02/07

Pennypack Creek Watershed Comprehensive Characterization Report
Appendix G • Conductivity
G-50 • PCWCCR • Philadelphia Water Department.
June 2009
Specific Conductivity Stage Hand Held sp. Cond.
PP1850
Spe
cific
Con
duct
ivity
(cS
/cm
)
0
125
250
375
500
625
24JUL07 26JUL07 28JUL07 30JUL07 01AUG07
Sta
ge (
in)
0
10
20
30
40
50
Figure G.99 Continuous Specific Conductivity at Site PP1850, 07/24/07 to 08/01/07
Specific Conductivity Stage Hand Held sp. Cond.
PP1850
Spe
cific
Con
duct
ivity
(cS
/cm
)
0
125
250
375
500
625
01AUG07 03AUG07 05AUG07 07AUG07 09AUG07
Sta
ge (
in)
0
10
20
30
40
50
Figure G.100 Continuous Specific Conductivity at Site PP1850, 08/01/07 to 08/09/07
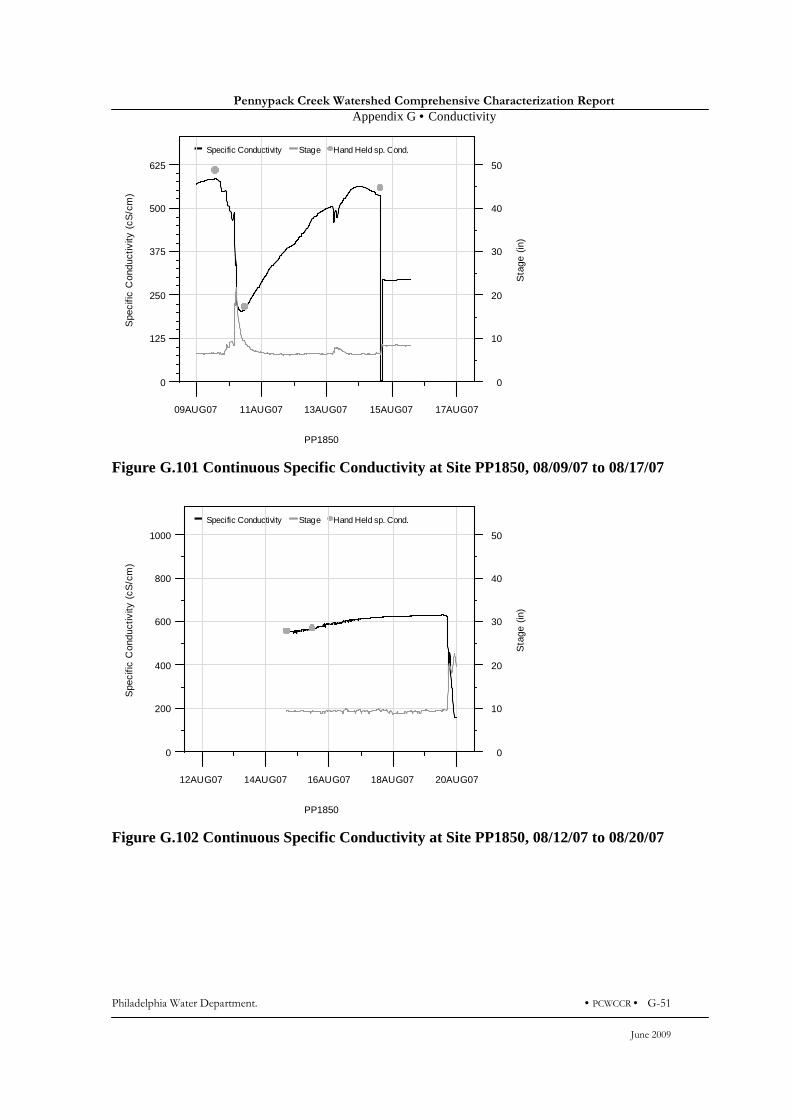
Pennypack Creek Watershed Comprehensive Characterization Report
Appendix G • Conductivity
Philadelphia Water Department. • PCWCCR • G-51
June 2009
Specific Conductivity Stage Hand Held sp. Cond.
PP1850
Spe
cific
Con
duct
ivity
(cS
/cm
)
0
125
250
375
500
625
09AUG07 11AUG07 13AUG07 15AUG07 17AUG07
Sta
ge (
in)
0
10
20
30
40
50
Figure G.101 Continuous Specific Conductivity at Site PP1850, 08/09/07 to 08/17/07
Specific Conductivity Stage Hand Held sp. Cond.
PP1850
Spe
cific
Con
duct
ivity
(cS
/cm
)
0
200
400
600
800
1000
12AUG07 14AUG07 16AUG07 18AUG07 20AUG07
Sta
ge (
in)
0
10
20
30
40
50
Figure G.102 Continuous Specific Conductivity at Site PP1850, 08/12/07 to 08/20/07
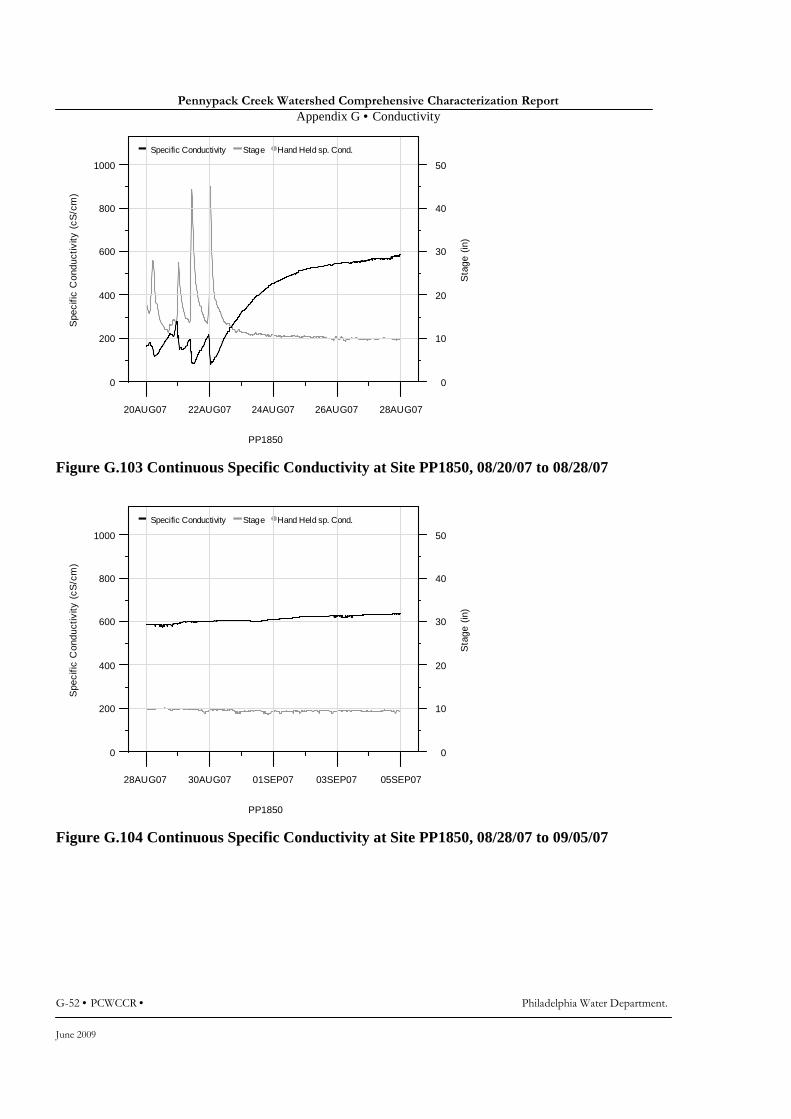
Pennypack Creek Watershed Comprehensive Characterization Report
Appendix G • Conductivity
G-52 • PCWCCR • Philadelphia Water Department.
June 2009
Specific Conductivity Stage Hand Held sp. Cond.
PP1850
Spe
cific
Con
duct
ivity
(cS
/cm
)
0
200
400
600
800
1000
20AUG07 22AUG07 24AUG07 26AUG07 28AUG07
Sta
ge (
in)
0
10
20
30
40
50
Figure G.103 Continuous Specific Conductivity at Site PP1850, 08/20/07 to 08/28/07
Specific Conductivity Stage Hand Held sp. Cond.
PP1850
Spe
cific
Con
duct
ivity
(cS
/cm
)
0
200
400
600
800
1000
28AUG07 30AUG07 01SEP07 03SEP07 05SEP07
Sta
ge (
in)
0
10
20
30
40
50
Figure G.104 Continuous Specific Conductivity at Site PP1850, 08/28/07 to 09/05/07
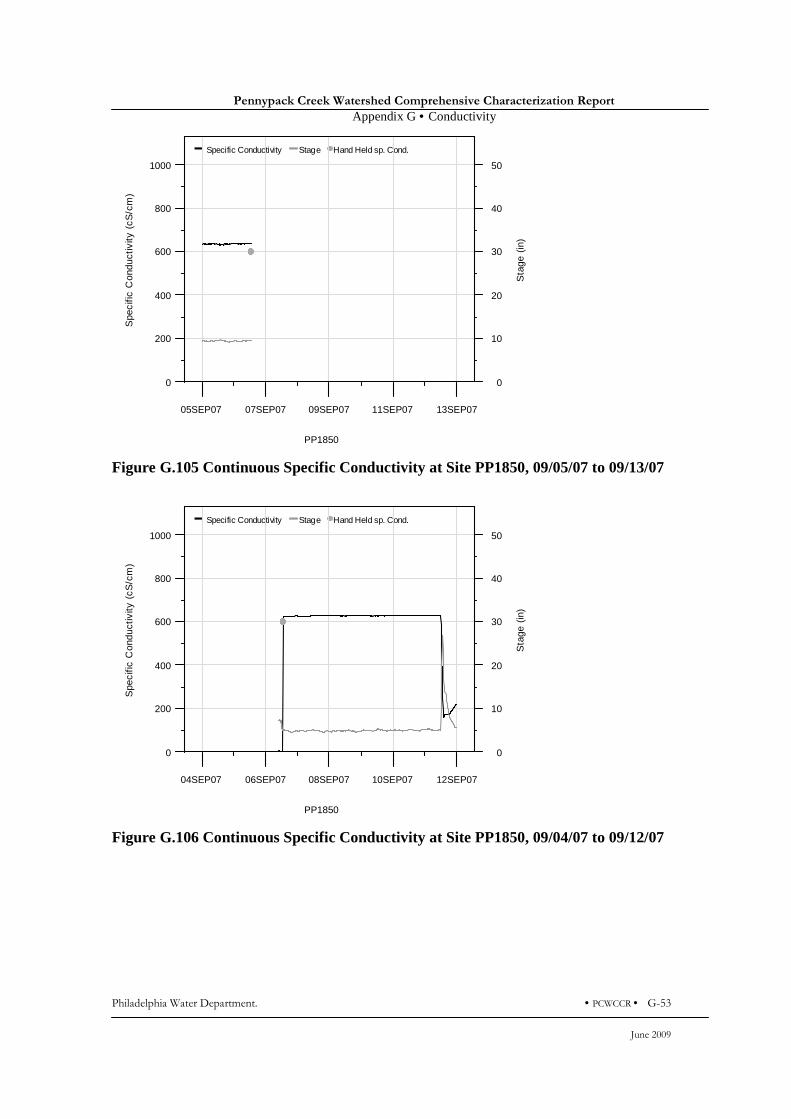
Pennypack Creek Watershed Comprehensive Characterization Report
Appendix G • Conductivity
Philadelphia Water Department. • PCWCCR • G-53
June 2009
Specific Conductivity Stage Hand Held sp. Cond.
PP1850
Spe
cific
Con
duct
ivity
(cS
/cm
)
0
200
400
600
800
1000
05SEP07 07SEP07 09SEP07 11SEP07 13SEP07
Sta
ge (
in)
0
10
20
30
40
50
Figure G.105 Continuous Specific Conductivity at Site PP1850, 09/05/07 to 09/13/07
Specific Conductivity Stage Hand Held sp. Cond.
PP1850
Spe
cific
Con
duct
ivity
(cS
/cm
)
0
200
400
600
800
1000
04SEP07 06SEP07 08SEP07 10SEP07 12SEP07
Sta
ge (
in)
0
10
20
30
40
50
Figure G.106 Continuous Specific Conductivity at Site PP1850, 09/04/07 to 09/12/07
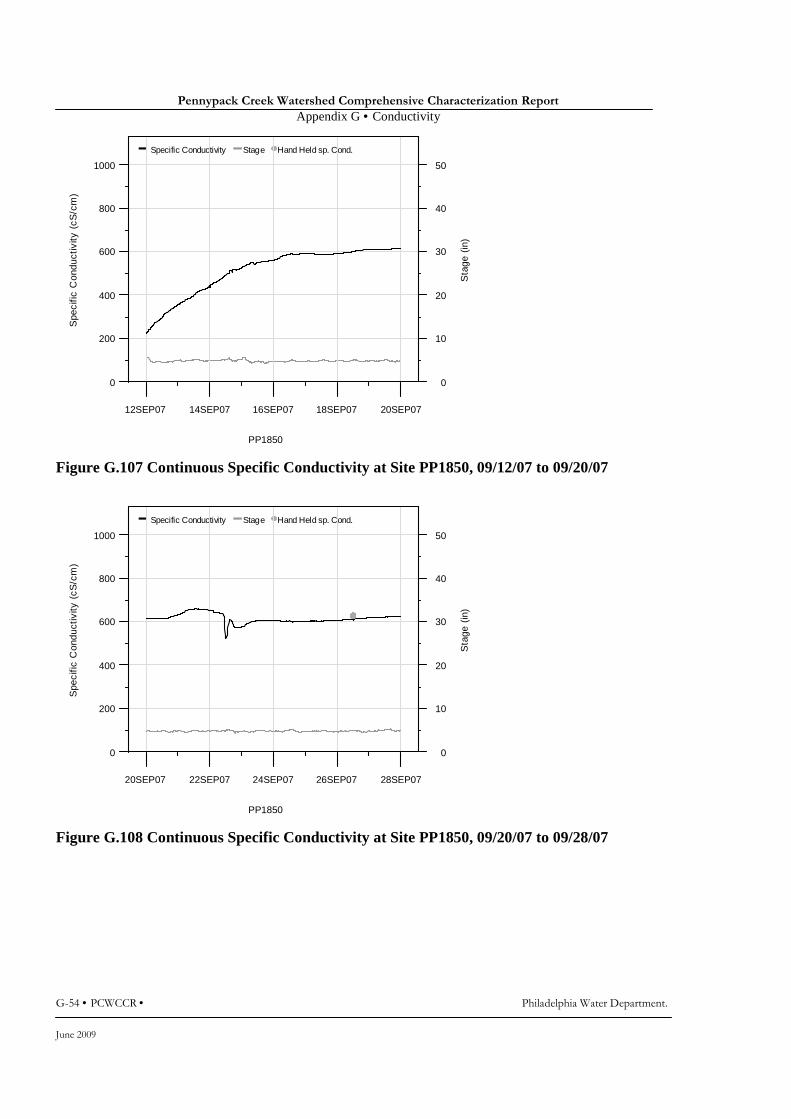
Pennypack Creek Watershed Comprehensive Characterization Report
Appendix G • Conductivity
G-54 • PCWCCR • Philadelphia Water Department.
June 2009
Specific Conductivity Stage Hand Held sp. Cond.
PP1850
Spe
cific
Con
duct
ivity
(cS
/cm
)
0
200
400
600
800
1000
12SEP07 14SEP07 16SEP07 18SEP07 20SEP07
Sta
ge (
in)
0
10
20
30
40
50
Figure G.107 Continuous Specific Conductivity at Site PP1850, 09/12/07 to 09/20/07
Specific Conductivity Stage Hand Held sp. Cond.
PP1850
Spe
cific
Con
duct
ivity
(cS
/cm
)
0
200
400
600
800
1000
20SEP07 22SEP07 24SEP07 26SEP07 28SEP07
Sta
ge (
in)
0
10
20
30
40
50
Figure G.108 Continuous Specific Conductivity at Site PP1850, 09/20/07 to 09/28/07
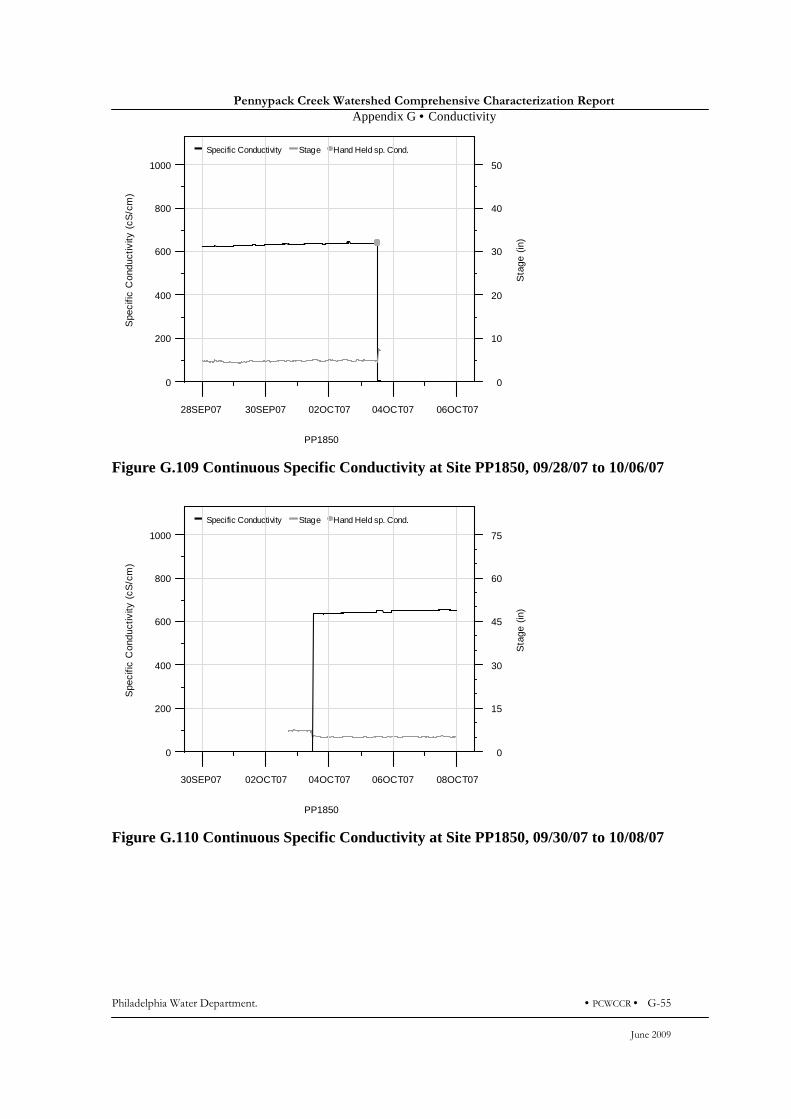
Pennypack Creek Watershed Comprehensive Characterization Report
Appendix G • Conductivity
Philadelphia Water Department. • PCWCCR • G-55
June 2009
Specific Conductivity Stage Hand Held sp. Cond.
PP1850
Spe
cific
Con
duct
ivity
(cS
/cm
)
0
200
400
600
800
1000
28SEP07 30SEP07 02OCT07 04OCT07 06OCT07
Sta
ge (
in)
0
10
20
30
40
50
Figure G.109 Continuous Specific Conductivity at Site PP1850, 09/28/07 to 10/06/07
Specific Conductivity Stage Hand Held sp. Cond.
PP1850
Spe
cific
Con
duct
ivity
(cS
/cm
)
0
200
400
600
800
1000
30SEP07 02OCT07 04OCT07 06OCT07 08OCT07
Sta
ge (
in)
0
15
30
45
60
75
Figure G.110 Continuous Specific Conductivity at Site PP1850, 09/30/07 to 10/08/07

Pennypack Creek Watershed Comprehensive Characterization Report
Appendix G • Conductivity
G-56 • PCWCCR • Philadelphia Water Department.
June 2009
Specific Conductivity Stage Hand Held sp. Cond.
PP1850
Spe
cific
Con
duct
ivity
(cS
/cm
)
0
200
400
600
800
1000
08OCT07 10OCT07 12OCT07 14OCT07 16OCT07
Sta
ge (
in)
0
15
30
45
60
75
Figure G.111 Continuous Specific Conductivity at Site PP1850, 10/08/07 to 10/16/07
Specific Conductivity Stage Hand Held sp. Cond.
PP1850
Spe
cific
Con
duct
ivity
(cS
/cm
)
0
200
400
600
800
1000
16OCT07 18OCT07 20OCT07 22OCT07 24OCT07
Sta
ge (
in)
0
15
30
45
60
75
Figure G.112 Continuous Specific Conductivity at Site PP1850, 10/16/07 to 10/24/07
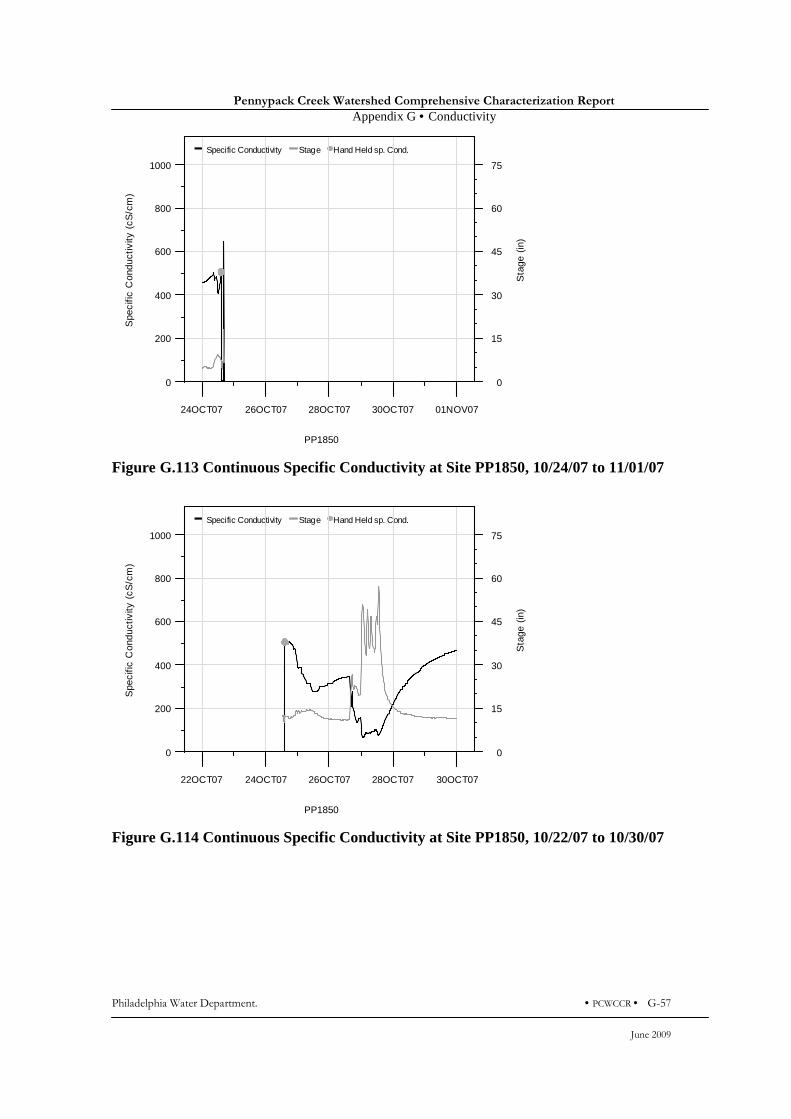
Pennypack Creek Watershed Comprehensive Characterization Report
Appendix G • Conductivity
Philadelphia Water Department. • PCWCCR • G-57
June 2009
Specific Conductivity Stage Hand Held sp. Cond.
PP1850
Spe
cific
Con
duct
ivity
(cS
/cm
)
0
200
400
600
800
1000
24OCT07 26OCT07 28OCT07 30OCT07 01NOV07
Sta
ge (
in)
0
15
30
45
60
75
Figure G.113 Continuous Specific Conductivity at Site PP1850, 10/24/07 to 11/01/07
Specific Conductivity Stage Hand Held sp. Cond.
PP1850
Spe
cific
Con
duct
ivity
(cS
/cm
)
0
200
400
600
800
1000
22OCT07 24OCT07 26OCT07 28OCT07 30OCT07
Sta
ge (
in)
0
15
30
45
60
75
Figure G.114 Continuous Specific Conductivity at Site PP1850, 10/22/07 to 10/30/07

Pennypack Creek Watershed Comprehensive Characterization Report
Appendix G • Conductivity
G-58 • PCWCCR • Philadelphia Water Department.
June 2009
Specific Conductivity Stage Hand Held sp. Cond.
PP1850
Spe
cific
Con
duct
ivity
(cS
/cm
)
0
200
400
600
800
1000
30OCT07 01NOV07 03NOV07 05NOV07 07NOV07
Sta
ge (
in)
0
15
30
45
60
75
Figure G.115 Continuous Specific Conductivity at Site PP1850, 10/30/07 to 11/07/07
Specific Conductivity Stage Hand Held sp. Cond.
PP1850
Spe
cific
Con
duct
ivity
(cS
/cm
)
0
200
400
600
800
1000
07NOV07 09NOV07 11NOV07 13NOV07 15NOV07
Sta
ge (
in)
0
15
30
45
60
75
Figure G.116 Continuous Specific Conductivity at Site PP1850, 11/07/07 to 11/15/07
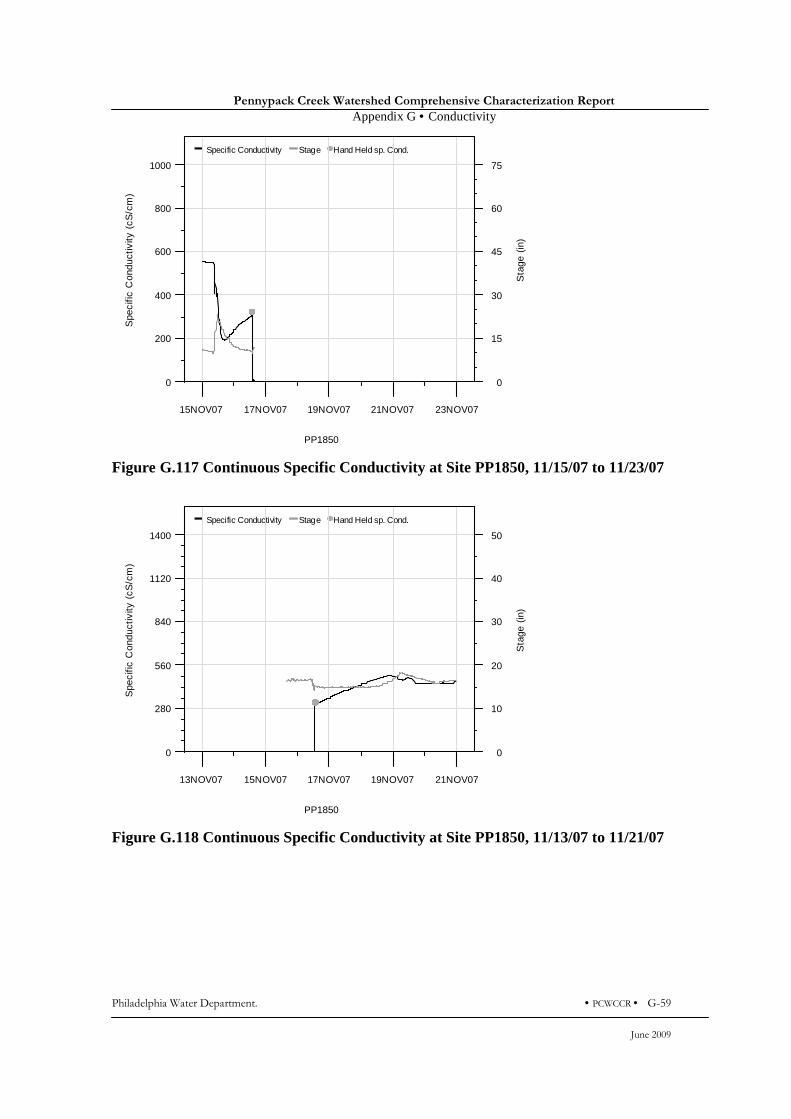
Pennypack Creek Watershed Comprehensive Characterization Report
Appendix G • Conductivity
Philadelphia Water Department. • PCWCCR • G-59
June 2009
Specific Conductivity Stage Hand Held sp. Cond.
PP1850
Spe
cific
Con
duct
ivity
(cS
/cm
)
0
200
400
600
800
1000
15NOV07 17NOV07 19NOV07 21NOV07 23NOV07
Sta
ge (
in)
0
15
30
45
60
75
Figure G.117 Continuous Specific Conductivity at Site PP1850, 11/15/07 to 11/23/07
Specific Conductivity Stage Hand Held sp. Cond.
PP1850
Spe
cific
Con
duct
ivity
(cS
/cm
)
0
280
560
840
1120
1400
13NOV07 15NOV07 17NOV07 19NOV07 21NOV07
Sta
ge (
in)
0
10
20
30
40
50
Figure G.118 Continuous Specific Conductivity at Site PP1850, 11/13/07 to 11/21/07
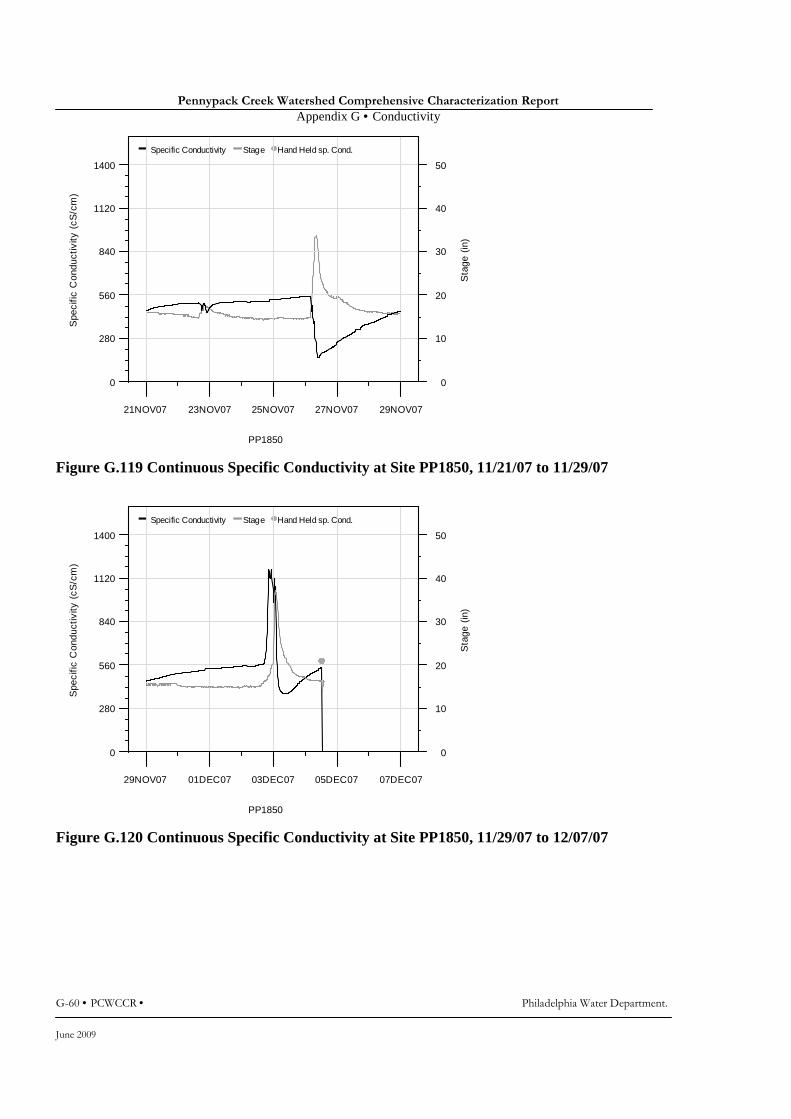
Pennypack Creek Watershed Comprehensive Characterization Report
Appendix G • Conductivity
G-60 • PCWCCR • Philadelphia Water Department.
June 2009
Specific Conductivity Stage Hand Held sp. Cond.
PP1850
Spe
cific
Con
duct
ivity
(cS
/cm
)
0
280
560
840
1120
1400
21NOV07 23NOV07 25NOV07 27NOV07 29NOV07
Sta
ge (
in)
0
10
20
30
40
50
Figure G.119 Continuous Specific Conductivity at Site PP1850, 11/21/07 to 11/29/07
Specific Conductivity Stage Hand Held sp. Cond.
PP1850
Spe
cific
Con
duct
ivity
(cS
/cm
)
0
280
560
840
1120
1400
29NOV07 01DEC07 03DEC07 05DEC07 07DEC07
Sta
ge (
in)
0
10
20
30
40
50
Figure G.120 Continuous Specific Conductivity at Site PP1850, 11/29/07 to 12/07/07
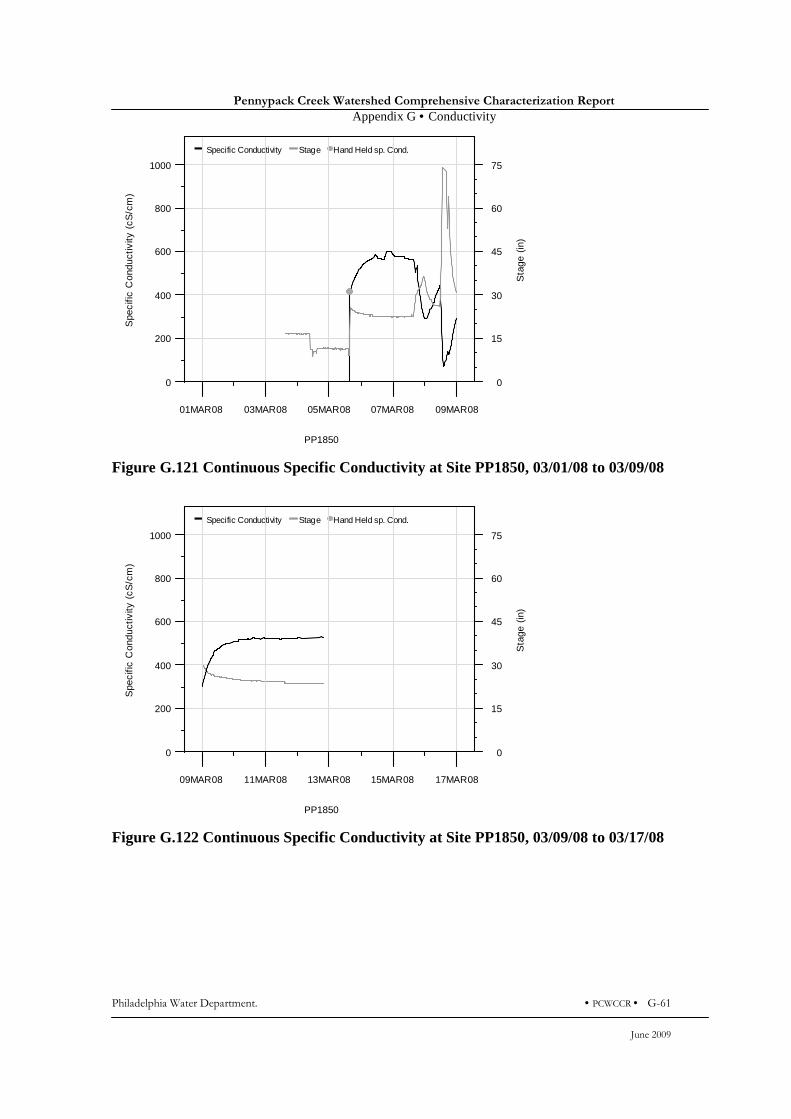
Pennypack Creek Watershed Comprehensive Characterization Report
Appendix G • Conductivity
Philadelphia Water Department. • PCWCCR • G-61
June 2009
Specific Conductivity Stage Hand Held sp. Cond.
PP1850
Spe
cific
Con
duct
ivity
(cS
/cm
)
0
200
400
600
800
1000
01MAR08 03MAR08 05MAR08 07MAR08 09MAR08
Sta
ge (
in)
0
15
30
45
60
75
Figure G.121 Continuous Specific Conductivity at Site PP1850, 03/01/08 to 03/09/08
Specific Conductivity Stage Hand Held sp. Cond.
PP1850
Spe
cific
Con
duct
ivity
(cS
/cm
)
0
200
400
600
800
1000
09MAR08 11MAR08 13MAR08 15MAR08 17MAR08
Sta
ge (
in)
0
15
30
45
60
75
Figure G.122 Continuous Specific Conductivity at Site PP1850, 03/09/08 to 03/17/08
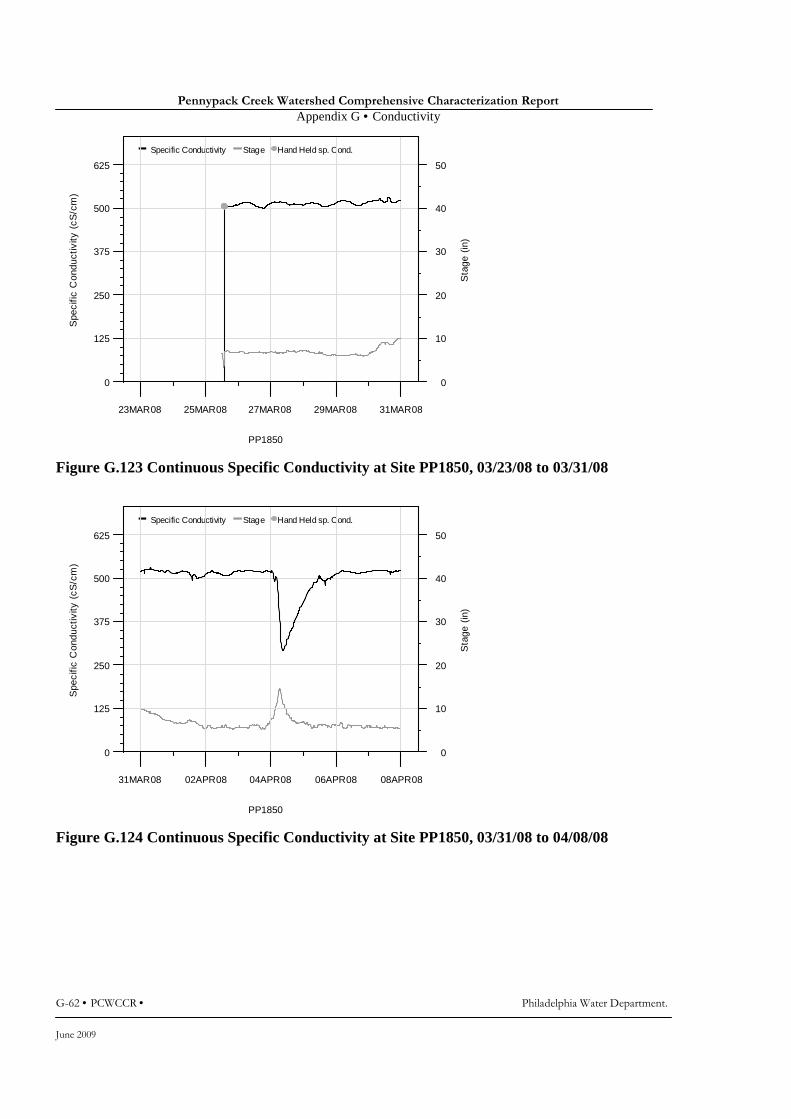
Pennypack Creek Watershed Comprehensive Characterization Report
Appendix G • Conductivity
G-62 • PCWCCR • Philadelphia Water Department.
June 2009
Specific Conductivity Stage Hand Held sp. Cond.
PP1850
Spe
cific
Con
duct
ivity
(cS
/cm
)
0
125
250
375
500
625
23MAR08 25MAR08 27MAR08 29MAR08 31MAR08
Sta
ge (
in)
0
10
20
30
40
50
Figure G.123 Continuous Specific Conductivity at Site PP1850, 03/23/08 to 03/31/08
Specific Conductivity Stage Hand Held sp. Cond.
PP1850
Spe
cific
Con
duct
ivity
(cS
/cm
)
0
125
250
375
500
625
31MAR08 02APR08 04APR08 06APR08 08APR08
Sta
ge (
in)
0
10
20
30
40
50
Figure G.124 Continuous Specific Conductivity at Site PP1850, 03/31/08 to 04/08/08
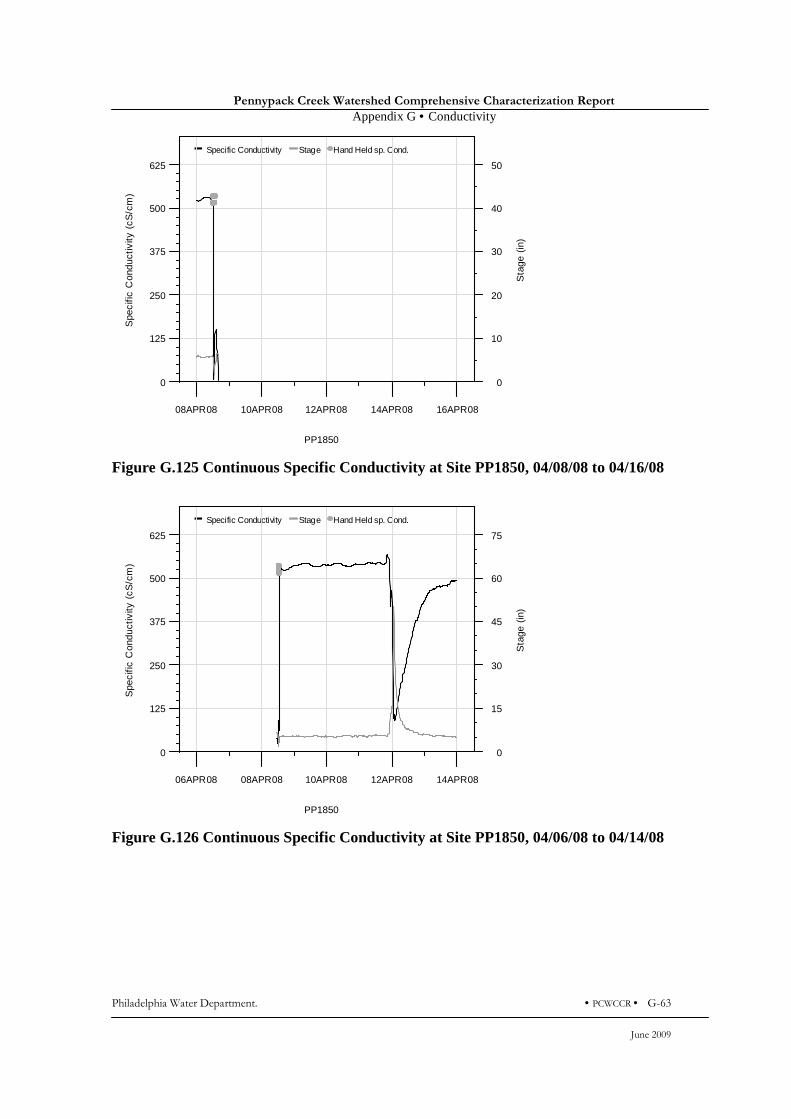
Pennypack Creek Watershed Comprehensive Characterization Report
Appendix G • Conductivity
Philadelphia Water Department. • PCWCCR • G-63
June 2009
Specific Conductivity Stage Hand Held sp. Cond.
PP1850
Spe
cific
Con
duct
ivity
(cS
/cm
)
0
125
250
375
500
625
08APR08 10APR08 12APR08 14APR08 16APR08
Sta
ge (
in)
0
10
20
30
40
50
Figure G.125 Continuous Specific Conductivity at Site PP1850, 04/08/08 to 04/16/08
Specific Conductivity Stage Hand Held sp. Cond.
PP1850
Spe
cific
Con
duct
ivity
(cS
/cm
)
0
125
250
375
500
625
06APR08 08APR08 10APR08 12APR08 14APR08
Sta
ge (
in)
0
15
30
45
60
75
Figure G.126 Continuous Specific Conductivity at Site PP1850, 04/06/08 to 04/14/08
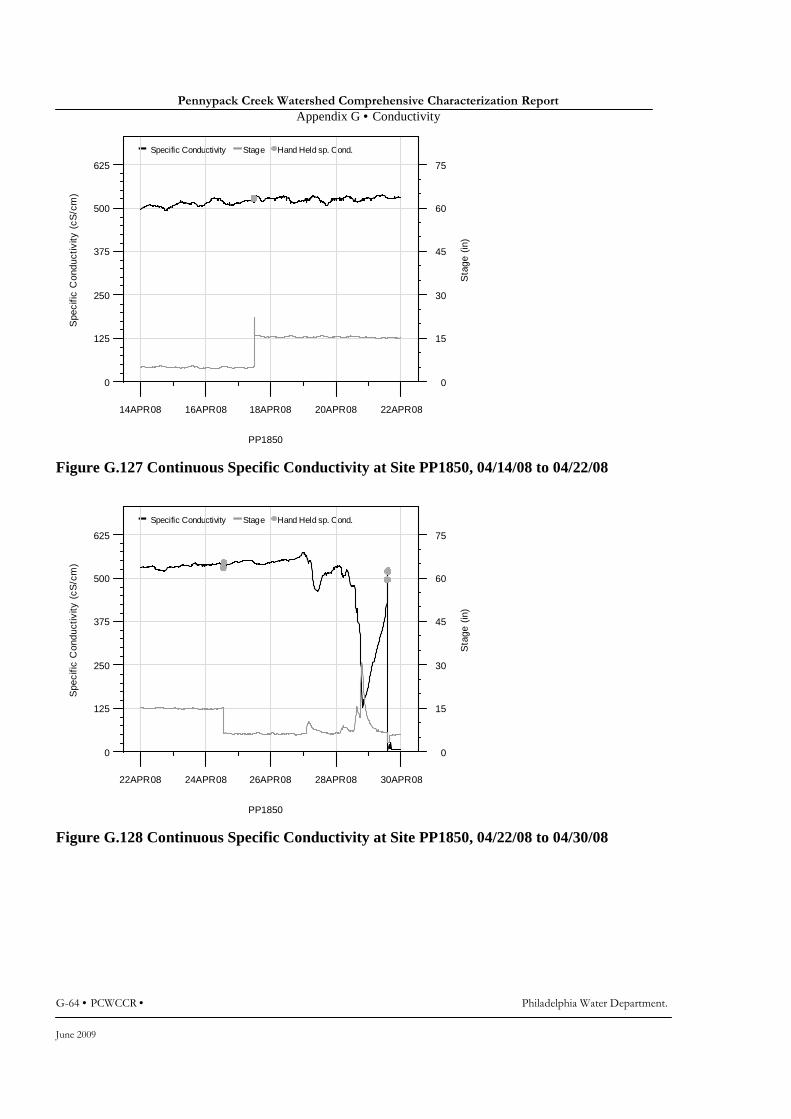
Pennypack Creek Watershed Comprehensive Characterization Report
Appendix G • Conductivity
G-64 • PCWCCR • Philadelphia Water Department.
June 2009
Specific Conductivity Stage Hand Held sp. Cond.
PP1850
Spe
cific
Con
duct
ivity
(cS
/cm
)
0
125
250
375
500
625
14APR08 16APR08 18APR08 20APR08 22APR08
Sta
ge (
in)
0
15
30
45
60
75
Figure G.127 Continuous Specific Conductivity at Site PP1850, 04/14/08 to 04/22/08
Specific Conductivity Stage Hand Held sp. Cond.
PP1850
Spe
cific
Con
duct
ivity
(cS
/cm
)
0
125
250
375
500
625
22APR08 24APR08 26APR08 28APR08 30APR08
Sta
ge (
in)
0
15
30
45
60
75
Figure G.128 Continuous Specific Conductivity at Site PP1850, 04/22/08 to 04/30/08
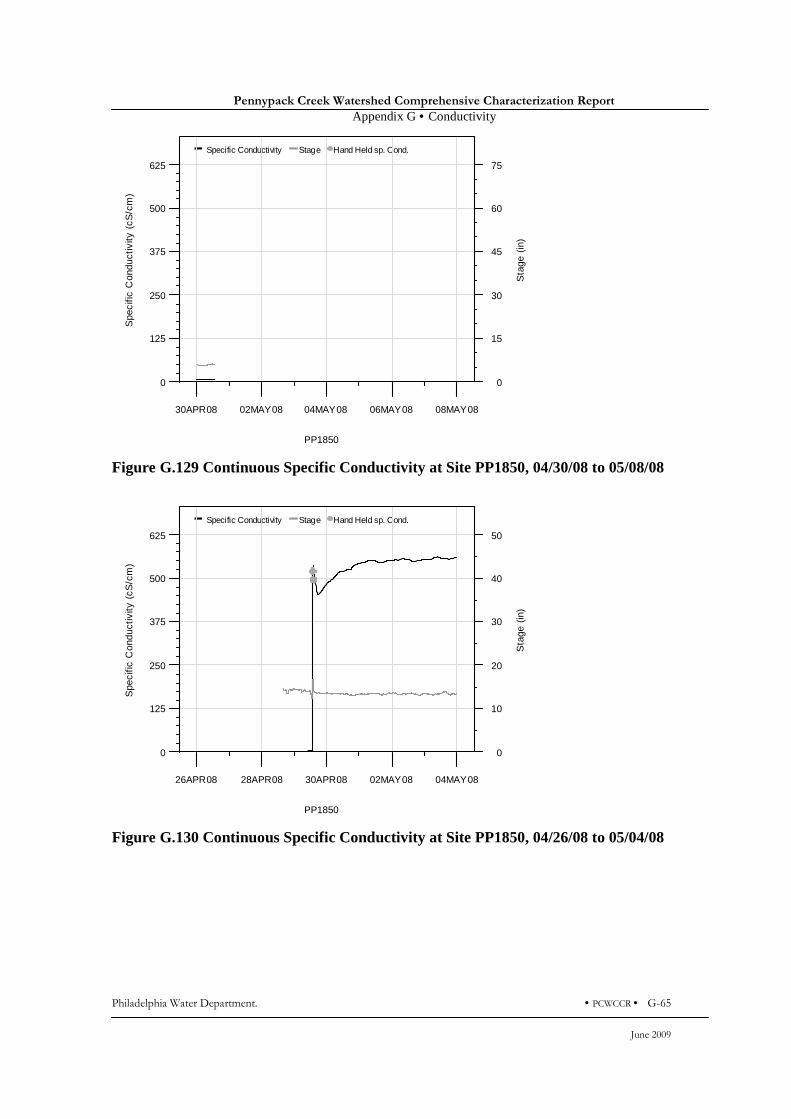
Pennypack Creek Watershed Comprehensive Characterization Report
Appendix G • Conductivity
Philadelphia Water Department. • PCWCCR • G-65
June 2009
Specific Conductivity Stage Hand Held sp. Cond.
PP1850
Spe
cific
Con
duct
ivity
(cS
/cm
)
0
125
250
375
500
625
30APR08 02MAY08 04MAY08 06MAY08 08MAY08
Sta
ge (
in)
0
15
30
45
60
75
Figure G.129 Continuous Specific Conductivity at Site PP1850, 04/30/08 to 05/08/08
Specific Conductivity Stage Hand Held sp. Cond.
PP1850
Spe
cific
Con
duct
ivity
(cS
/cm
)
0
125
250
375
500
625
26APR08 28APR08 30APR08 02MAY08 04MAY08
Sta
ge (
in)
0
10
20
30
40
50
Figure G.130 Continuous Specific Conductivity at Site PP1850, 04/26/08 to 05/04/08
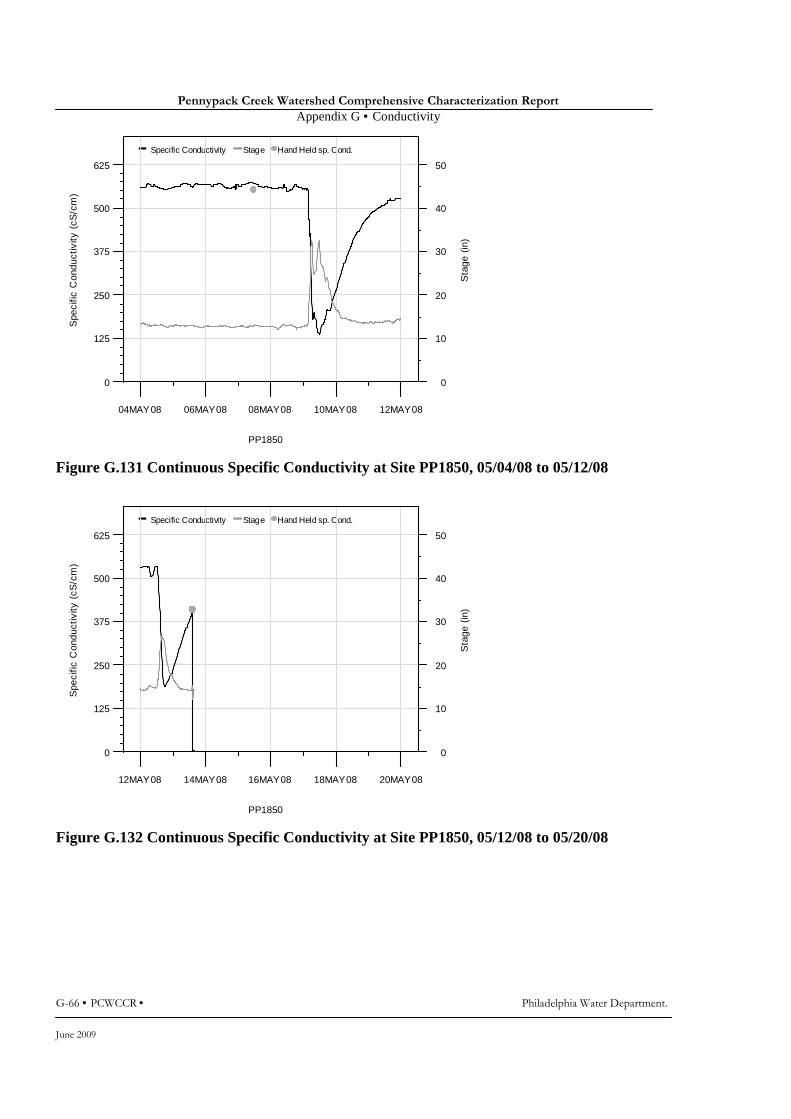
Pennypack Creek Watershed Comprehensive Characterization Report
Appendix G • Conductivity
G-66 • PCWCCR • Philadelphia Water Department.
June 2009
Specific Conductivity Stage Hand Held sp. Cond.
PP1850
Spe
cific
Con
duct
ivity
(cS
/cm
)
0
125
250
375
500
625
04MAY08 06MAY08 08MAY08 10MAY08 12MAY08
Sta
ge (
in)
0
10
20
30
40
50
Figure G.131 Continuous Specific Conductivity at Site PP1850, 05/04/08 to 05/12/08
Specific Conductivity Stage Hand Held sp. Cond.
PP1850
Spe
cific
Con
duct
ivity
(cS
/cm
)
0
125
250
375
500
625
12MAY08 14MAY08 16MAY08 18MAY08 20MAY08
Sta
ge (
in)
0
10
20
30
40
50
Figure G.132 Continuous Specific Conductivity at Site PP1850, 05/12/08 to 05/20/08

Pennypack Creek Watershed Comprehensive Characterization Report
Appendix G • Conductivity
Philadelphia Water Department. • PCWCCR • G-67
June 2009
Specific Conductivity Stage Hand Held sp. Cond.
PP1850
Spe
cific
Con
duct
ivity
(cS
/cm
)
0
125
250
375
500
625
10MAY08 12MAY08 14MAY08 16MAY08 18MAY08
Sta
ge (
in)
0
15
30
45
60
75
Figure G.133 Continuous Specific Conductivity at Site PP1850, 05/10/08 to 05/18/08
Specific Conductivity Stage Hand Held sp. Cond.
PP1850
Spe
cific
Con
duct
ivity
(cS
/cm
)
0
125
250
375
500
625
18MAY08 20MAY08 22MAY08 24MAY08 26MAY08
Sta
ge (
in)
0
15
30
45
60
75
Figure G.134 Continuous Specific Conductivity at Site PP1850, 05/18/08 to 05/26/08

Pennypack Creek Watershed Comprehensive Characterization Report
Appendix G • Conductivity
G-68 • PCWCCR • Philadelphia Water Department.
June 2009
Specific Conductivity Stage Hand Held sp. Cond.
PP1850
Spe
cific
Con
duct
ivity
(cS
/cm
)
0
125
250
375
500
625
26MAY08 28MAY08 30MAY08 01JUN08 03JUN08
Sta
ge (
in)
0
15
30
45
60
75
Figure G.135 Continuous Specific Conductivity at Site PP1850, 05/26/08 to 06/03/08
Specific Conductivity Stage Hand Held sp. Cond.
PP1850
Spe
cific
Con
duct
ivity
(cS
/cm
)
0
125
250
375
500
625
03JUN08 05JUN08 07JUN08 09JUN08 11JUN08
Sta
ge (
in)
0
15
30
45
60
75
Figure G.136 Continuous Specific Conductivity at Site PP1850, 06/03/08 to 06/11/08
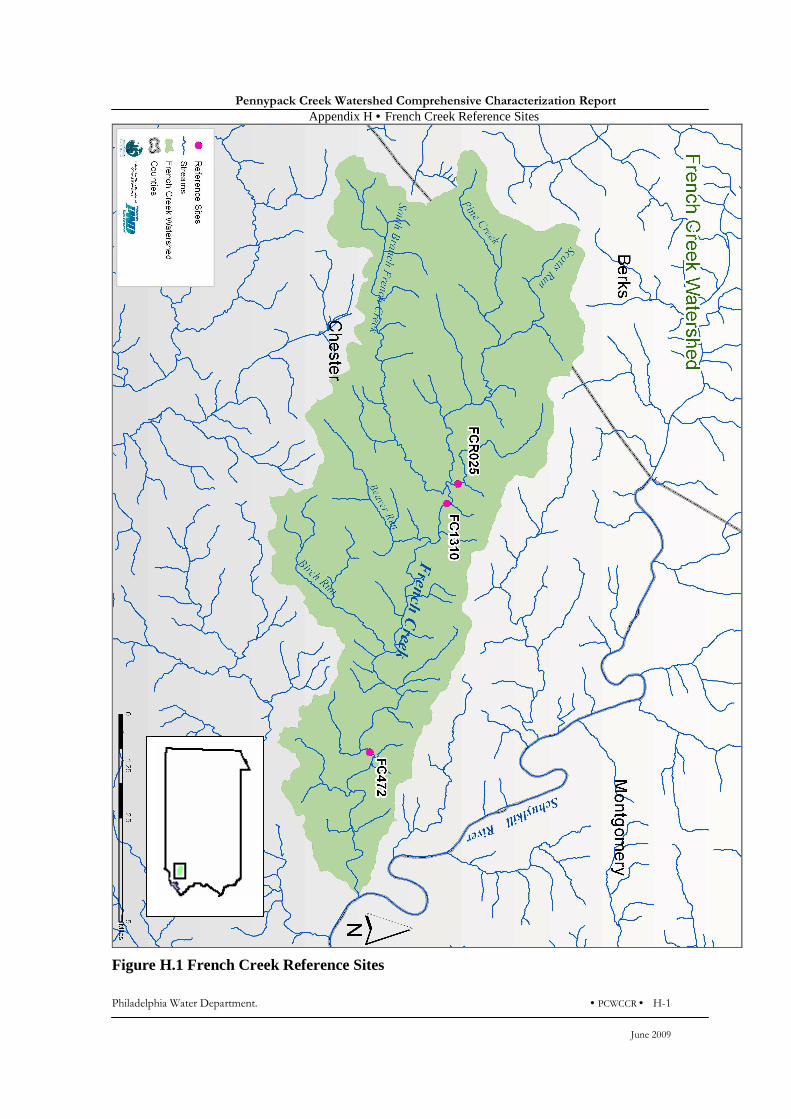
Pennypack Creek Watershed Comprehensive Characterization Report
Appendix H • French Creek Reference Sites
Philadelphia Water Department. • PCWCCR • H-1
June 2009
Figure H.1 French Creek Reference Sites

Pennypack Creek Watershed Comprehensive Characterization Report
Appendix I • Macroinvertebrate Metrics
Philadelphia Water Department. • PCWCCR • I-1
June 2009
Table I.1 List of Unique Taxa found within Pennypack Creek Watershed, 2007 Order Family Genus Taxon HBI Tolerance
³Coleoptera Ameletidae Ameletus 0 Intolerant ²Ephemeroptera Heptageniidae Epeorus 0 Intolerant ³Ephemeroptera Ameletidae Ameletus 0 Intolerant
²Plecoptera Perlidae Acroneuria 0 Intolerant Trichoptera Glossosomatidae Glossosoma 0 Intolerant ¹Trichoptera Philopotamidae Dolophilodes 0 Intolerant
²Ephemeroptera Ephemerellidae Ephemerella 1 Intolerant ²Ephemeroptera Ephemerellidae Drunella 1 Intolerant
²Plecoptera Taeniopterygidae Oemopteryx 1 Intolerant ²Plecoptera Peltoperlidae Tallaperla 1 Intolerant ²Trichoptera Brachycentridae Brachycentrus 1 Intolerant ²Trichoptera Rhyacophilidae Rhyacophila 1 Intolerant ³Coleoptera Elmidae Ancyronyx 2 Intolerant Coleoptera Elmidae Promoresia 2 Intolerant Coleoptera Elmidae Macronychus 2 Intolerant
²Diptera Simuliidae Prosimulium 2 Intolerant ²Ephemeroptera Ephemerellidae no tails 2 Intolerant ³Ephemeroptera Ephemerellidae Attenella 2 Intolerant
²Plecoptera Nemouridae Ostrocerca 2 Intolerant ²Plecoptera Nemouridae n/a no tail, gillls 2 Intolerant
Diptera Tipulidae Antocha 3 Intolerant ²Ephemeroptera Isonychidae Isonychia 3 Intolerant ²Ephemeroptera Heptageniidae Stenonema 3 Intolerant ²Ephemeroptera Heptageniidae n/a 3 Intolerant
¹Plecoptera Nemouridae Amphinemura 3 Intolerant ²Trichoptera Uenoidae Neophylax 3 Intolerant
³Bivalvia Corbiculidae Corbicula 4 Moderately
Tolerant
²Coleoptera Psephenidae Psephenus 4 Moderately
Tolerant
¹Coleoptera Elmidae Optioservus 4 Moderately
Tolerant
Diptera Tipulidae Tipula 4 Moderately
Tolerant
²Megaloptera Corydalidae Corydalus 4 Moderately
Tolerant
Trichoptera Philoptamidae Chimarra 4 Moderately
Tolerant
Coleoptera Elmidae Stenelmis 5 Moderately
Tolerant
²Diptera Empididae Clinocera 5 Moderately
Tolerant
Trichoptera Hydropsychidae Hydropsyche 5 Moderately
Tolerant
³Amphipoda Gammaridae Gammarus 6 Moderately
Tolerant
³Amphipoda Crangonyctidae Cragonyx 6 Moderately
Tolerant
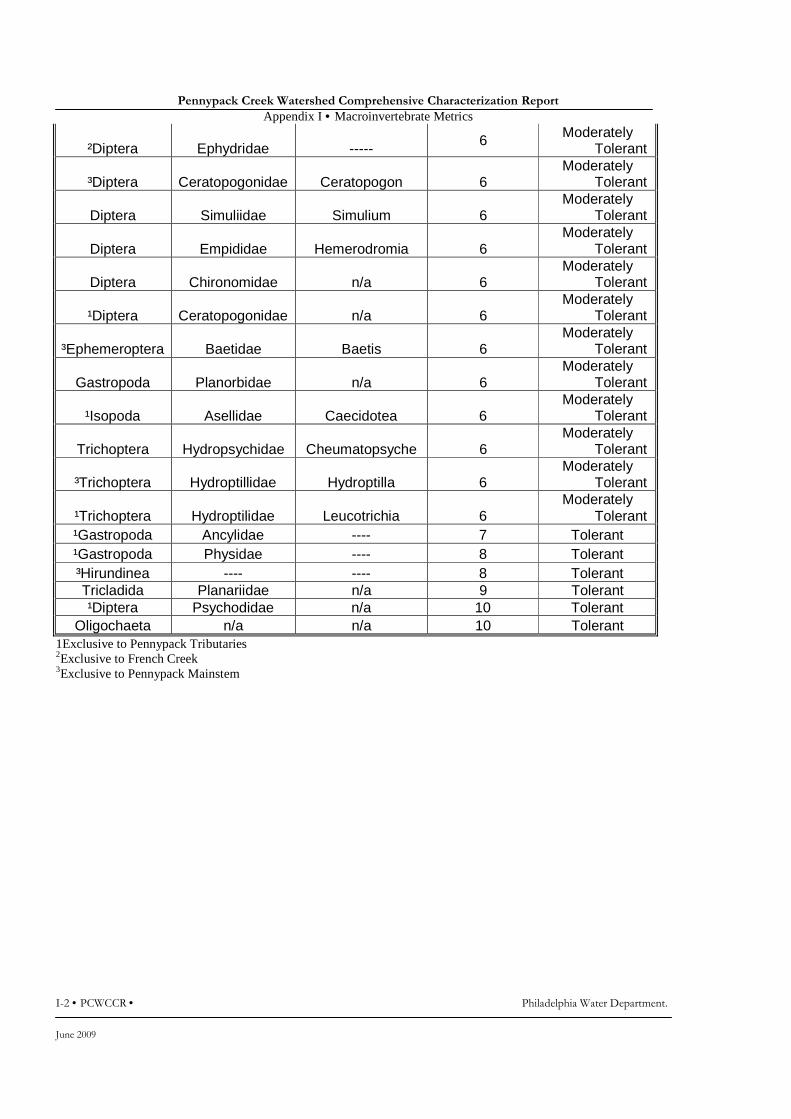
Pennypack Creek Watershed Comprehensive Characterization Report
Appendix I • Macroinvertebrate Metrics
I-2 • PCWCCR • Philadelphia Water Department.
June 2009
²Diptera Ephydridae ----- 6 Moderately Tolerant
³Diptera Ceratopogonidae Ceratopogon 6 Moderately
Tolerant
Diptera Simuliidae Simulium 6 Moderately
Tolerant
Diptera Empididae Hemerodromia 6 Moderately
Tolerant
Diptera Chironomidae n/a 6 Moderately
Tolerant
¹Diptera Ceratopogonidae n/a 6 Moderately
Tolerant
³Ephemeroptera Baetidae Baetis 6 Moderately
Tolerant
Gastropoda Planorbidae n/a 6 Moderately
Tolerant
¹Isopoda Asellidae Caecidotea 6 Moderately
Tolerant
Trichoptera Hydropsychidae Cheumatopsyche 6 Moderately
Tolerant
³Trichoptera Hydroptillidae Hydroptilla 6 Moderately
Tolerant
¹Trichoptera Hydroptilidae Leucotrichia 6 Moderately
Tolerant ¹Gastropoda Ancylidae ---- 7 Tolerant ¹Gastropoda Physidae ---- 8 Tolerant ³Hirundinea ---- ---- 8 Tolerant Tricladida Planariidae n/a 9 Tolerant ¹Diptera Psychodidae n/a 10 Tolerant
Oligochaeta n/a n/a 10 Tolerant 1Exclusive to Pennypack Tributaries 2Exclusive to French Creek 3Exclusive to Pennypack Mainstem
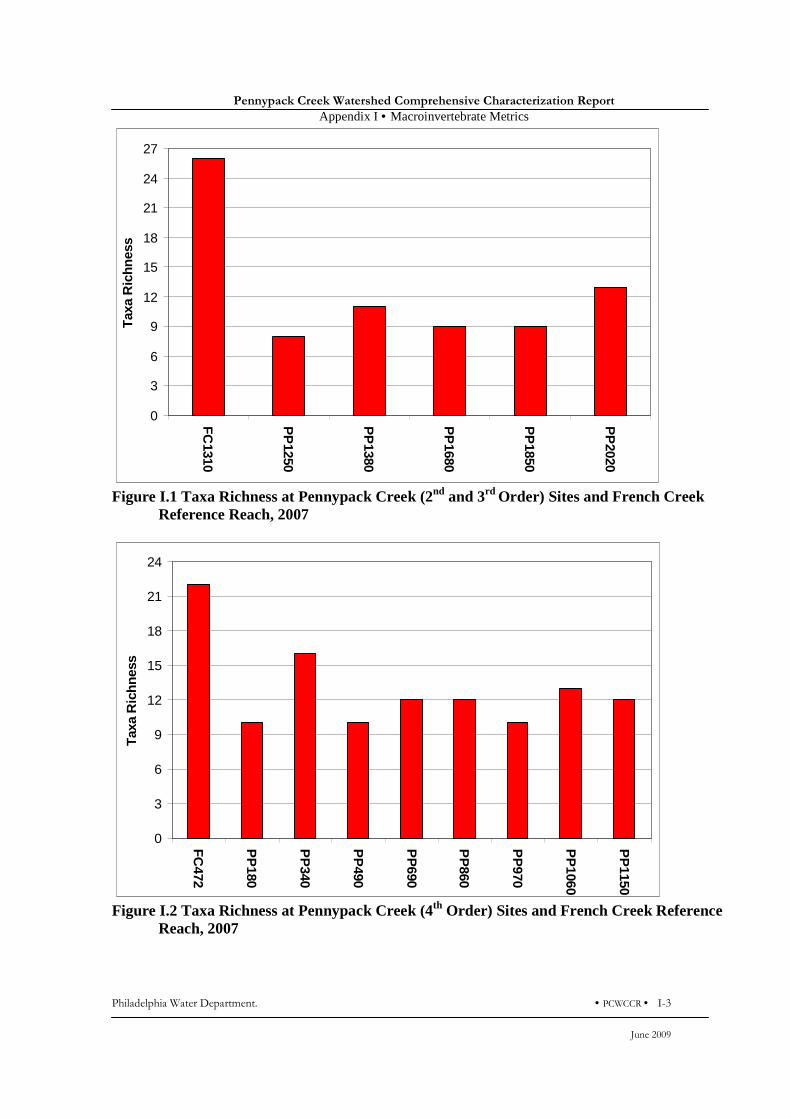
Pennypack Creek Watershed Comprehensive Characterization Report
Appendix I • Macroinvertebrate Metrics
Philadelphia Water Department. • PCWCCR • I-3
June 2009
0
3
6
9
12
15
18
21
24
27
FC
1310
PP
1250
PP
1380
PP
1680
PP
1850
PP
2020
Tax
a R
ichn
ess
Figure I.1 Taxa Richness at Pennypack Creek (2nd and 3rd Order) Sites and French Creek
Reference Reach, 2007
0
3
6
9
12
15
18
21
24
FC
472
PP
180
PP
340
PP
490
PP
690
PP
860
PP
970
PP
1060
PP
1150
Tax
a R
ich
nes
s
Figure I.2 Taxa Richness at Pennypack Creek (4th Order) Sites and French Creek Reference
Reach, 2007
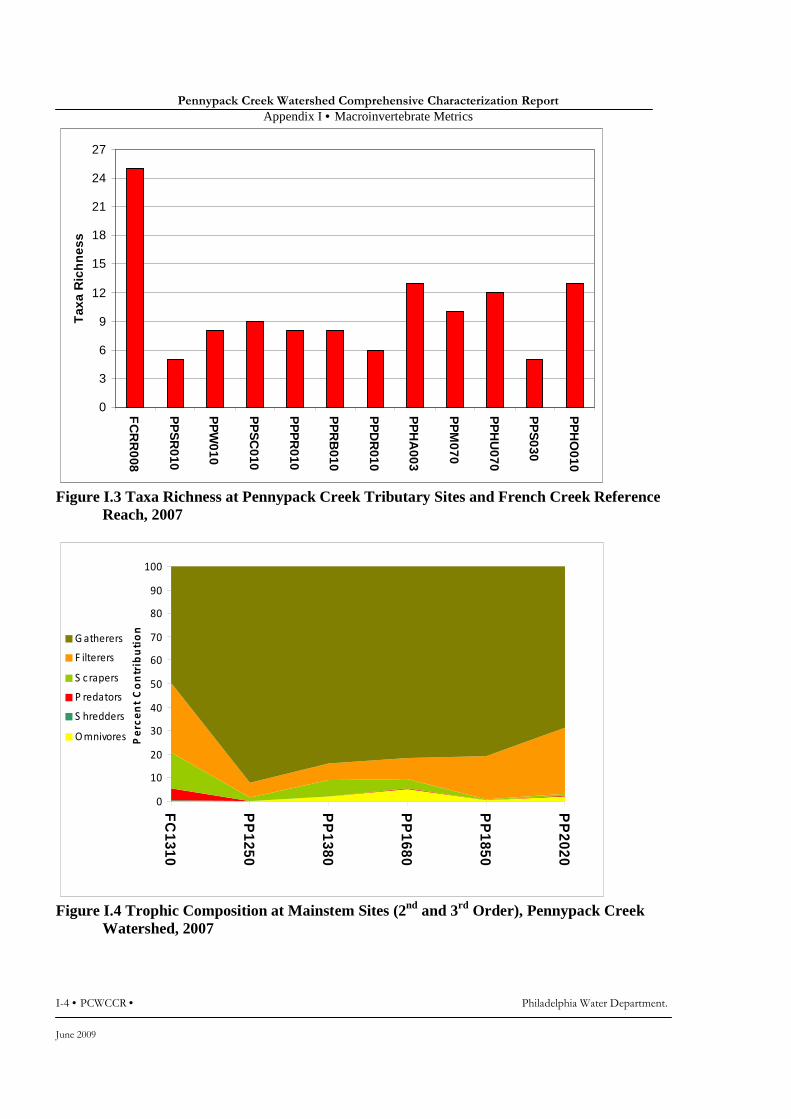
Pennypack Creek Watershed Comprehensive Characterization Report
Appendix I • Macroinvertebrate Metrics
I-4 • PCWCCR • Philadelphia Water Department.
June 2009
0
3
6
9
12
15
18
21
24
27
FC
RR
008
PP
SR
010
PP
W010
PP
SC
010
PP
PR
010
PP
RB
010
PP
DR
010
PP
HA
003
PP
M070
PP
HU
070
PP
S030
PP
HO
010
Tax
a R
ich
nes
s
Figure I.3 Taxa Richness at Pennypack Creek Tributary Sites and French Creek Reference
Reach, 2007
0
10
20
30
40
50
60
70
80
90
100
FC
1310
PP
1250
PP
1380
PP
1680
PP
1850
PP
2020
Pe
rc
en
t C
on
trib
uti
on
Gatherers
F ilterers
S c rapers
P redators
S hredders
Omnivores
Figure I.4 Trophic Composition at Mainstem Sites (2nd and 3rd Order), Pennypack Creek
Watershed, 2007

Pennypack Creek Watershed Comprehensive Characterization Report
Appendix I • Macroinvertebrate Metrics
Philadelphia Water Department. • PCWCCR • I-5
June 2009
0
10
20
30
40
50
60
70
80
90
100
FC
472
PP
180
PP
340
PP
490
PP
690
PP
860
PP
970
PP
1060
PP
1150
Per
cen
t C
on
trib
uti
on
Gatherers
Filterers
Scrapers
Omnivores
Shredders
Predators
Figure I.5 Trophic Composition at Mainstem Sites (4th Order), Pennypack Creek Watershed,
2007
0
10
20
30
40
50
60
70
80
90
100
FC
RR
008
PP
SR
010
PP
W010
PP
SC
010
PP
PR
010
PP
RB
010
PP
DR
010
PP
HA
003
PP
M070
PP
HU
070
PP
S030
PP
HO
010
Per
cen
t C
on
trib
uti
on
Gatherers
Filterers
Scrapers
Predators
Omnivores
Shredders
Figure I.6 Trophic Compositions H Tributary Sites (2nd and 3rd Order), Pennypack Creek
Watershed, 2007

Pennypack Creek Watershed Comprehensive Characterization Report
Appendix J • Trends in Macroinvertebrate Community Composition
Philadelphia Water Department. • PCWCCR • J-1
June 2009
0
1
2
3
4
5
6
7
8
9
10
1969 1970 1971 1972 1973 1974 1975 1976 1978 1980 2002 2007
HB
I
Pollution Tolerant Community
Facultative/ Moderately Tolerant Community
Pollution Sensitive Community
Figure J.1 HBI Values at Mainstem Site PP180, Pennypack Creek Watershed, 1969-1980,
2002, 2007
0
2
4
6
8
10
12
1969 1970 1971 1972 1973 1974 1975 1976 1978 1980 2002 2007
Tax
a R
ich
nes
s
Figure J.2 Taxa Richness at Mainstem Site PP180, Pennypack Creek Watershed, 1969-1980,
2002, 2007

Pennypack Creek Watershed Comprehensive Characterization Report
Appendix J • Trends in Macroinvertebrate Community Composition
J-2 • PCWCCR • Philadelphia Water Department.
June 2009
0% 10% 20% 30% 40% 50% 60% 70% 80% 90% 100%
1969
1970
1971
1972
1973
1974
1975
1976
1978
1980
2002
2007
Sam
ple
Yea
r
Percent Contribution
TOLERANT MODERATELY TOLERANT INTOLERANT
Figure J.3 Tolerance Distribution at Mainstem Site PP180, Pennypack Creek Watershed, 1969-1980, 2002, 2007
.
0% 10% 20% 30% 40% 50% 60% 70% 80% 90% 100%
1969
1970
1971
1972
1973
1974
1975
1976
1978
1980
2002
2007
Percent Contribution
Gatherers
Filterers
Scrapers
Predators
Omnivores
Parasites
Shredders
Figure J.4 Trophic Composition at Mainstem Site PP180, Pennypack Creek Watershed, 1969-
1980, 2002, 2007
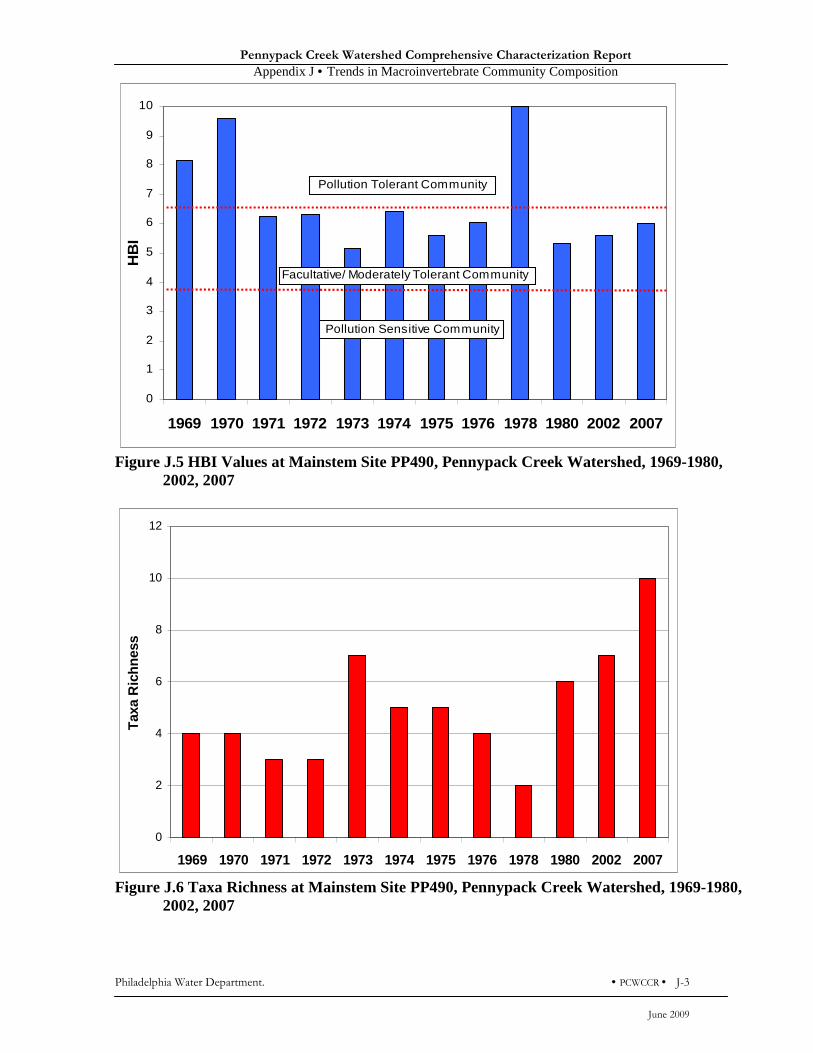
Pennypack Creek Watershed Comprehensive Characterization Report
Appendix J • Trends in Macroinvertebrate Community Composition
Philadelphia Water Department. • PCWCCR • J-3
June 2009
0
1
2
3
4
5
6
7
8
9
10
1969 1970 1971 1972 1973 1974 1975 1976 1978 1980 2002 2007
HB
I
Pollution Sensitive Community
Facultative/ Moderately Tolerant Community
Pollution Tolerant Community
Figure J.5 HBI Values at Mainstem Site PP490, Pennypack Creek Watershed, 1969-1980,
2002, 2007
0
2
4
6
8
10
12
1969 1970 1971 1972 1973 1974 1975 1976 1978 1980 2002 2007
Tax
a R
ich
nes
s
Figure J.6 Taxa Richness at Mainstem Site PP490, Pennypack Creek Watershed, 1969-1980,
2002, 2007
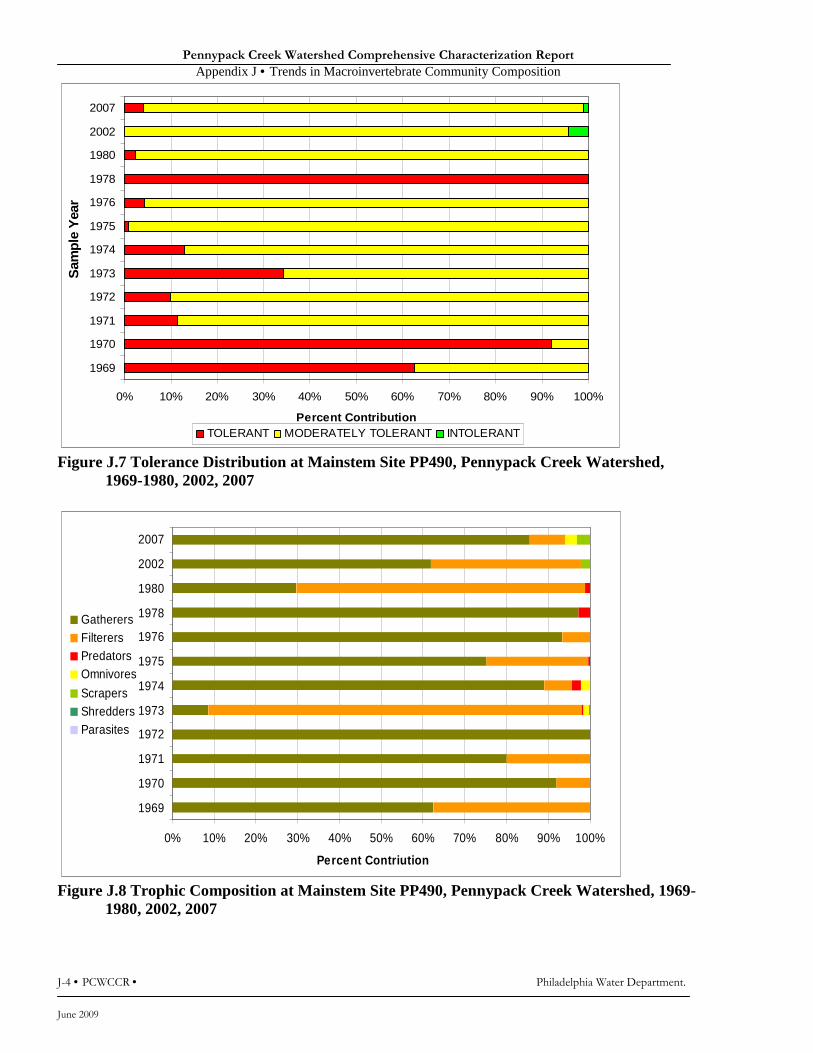
Pennypack Creek Watershed Comprehensive Characterization Report
Appendix J • Trends in Macroinvertebrate Community Composition
J-4 • PCWCCR • Philadelphia Water Department.
June 2009
0% 10% 20% 30% 40% 50% 60% 70% 80% 90% 100%
1969
1970
1971
1972
1973
1974
1975
1976
1978
1980
2002
2007
Sam
ple
Yea
r
Percent ContributionTOLERANT MODERATELY TOLERANT INTOLERANT
Figure J.7 Tolerance Distribution at Mainstem Site PP490, Pennypack Creek Watershed,
1969-1980, 2002, 2007
0% 10% 20% 30% 40% 50% 60% 70% 80% 90% 100%
1969
1970
1971
1972
1973
1974
1975
1976
1978
1980
2002
2007
Percent Contriution
GatherersFilterersPredatorsOmnivores
ScrapersShreddersParasites
Figure J.8 Trophic Composition at Mainstem Site PP490, Pennypack Creek Watershed, 1969-
1980, 2002, 2007

Pennypack Creek Watershed Comprehensive Characterization Report
Appendix J • Trends in Macroinvertebrate Community Composition
Philadelphia Water Department. • PCWCCR • J-5
June 2009
0
1
2
3
4
5
6
7
8
9
10
1969 1970 1971 1972 1973 1974 1975 1976 1978 1980 2002 2007
HB
I
Pollution Tolerant Community
Facultative/ Moderately Tolerant Community
Pollution Sensitive Community
FigureJ.9 HBI Values at Mainstem Site PP690, Pennypack Creek Watershed, 1969-1980,
2002, 2007
0
2
4
6
8
10
12
14
1969 1970 1971 1972 1973 1974 1975 1976 1978 1980 2002 2007
Tax
a R
ich
nes
s
Figure J.10 Taxa Richness at Mainstem Site PP690, Pennypack Creek Watershed, 1969-1980,
2002, 2007

Pennypack Creek Watershed Comprehensive Characterization Report
Appendix J • Trends in Macroinvertebrate Community Composition
J-6 • PCWCCR • Philadelphia Water Department.
June 2009
0% 10% 20% 30% 40% 50% 60% 70% 80% 90% 100%
1969
1970
1971
1972
1973
1974
1975
1976
1978
1980
2002
2007
Sam
ple
Yea
r
Percent ContributionTOLERANT MODERATELY TOLERANT INTOLERANT
Figure J.11 Tolerance Distribution at Mainstem Site PP690, Pennypack Creek Watershed,
1969-1980, 2002, 2007
0% 20% 40% 60% 80% 100%
1969
1970
1971
1972
1973
1974
1975
1976
1978
1980
2002
2007
Sam
ple
Dat
e
Percent Contribution
Gatherers
Filterers
Omnivores
Scrapers
Shredders
Predators
Parasites
Figure J.12 Trophic Composition at Mainstem Site PP690, Pennypack Creek Watershed,
1969-1980, 2002, 2007
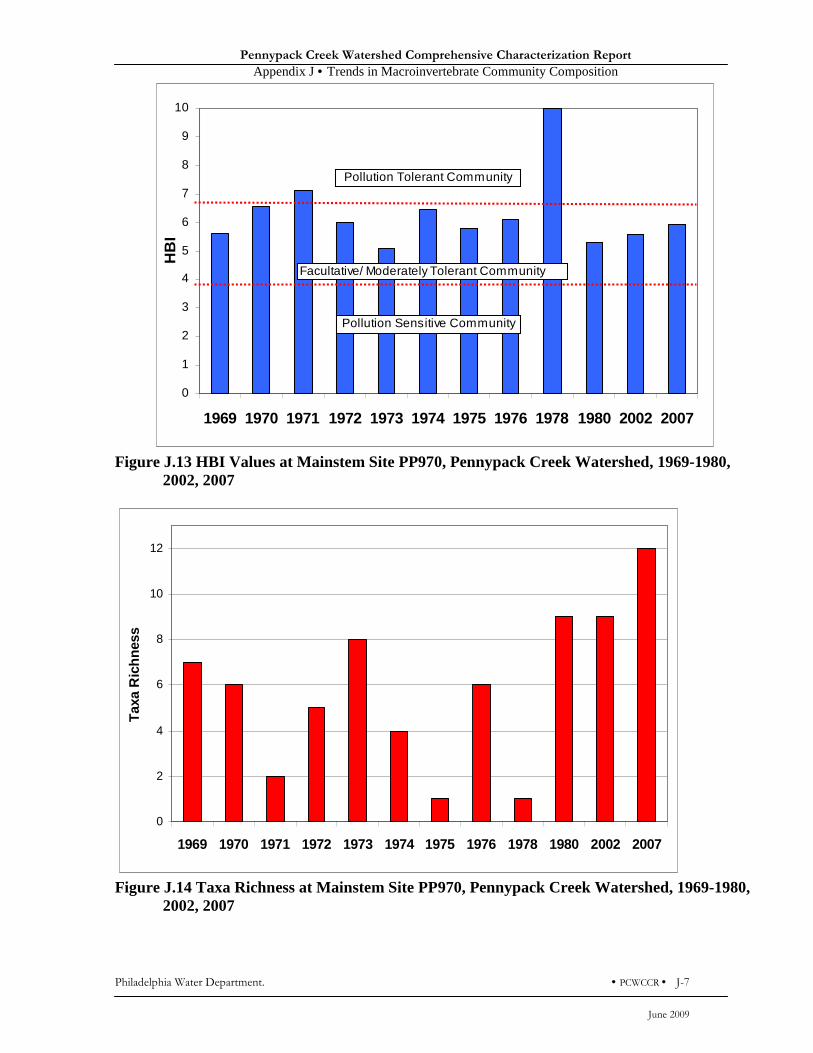
Pennypack Creek Watershed Comprehensive Characterization Report
Appendix J • Trends in Macroinvertebrate Community Composition
Philadelphia Water Department. • PCWCCR • J-7
June 2009
0
1
2
3
4
5
6
7
8
9
10
1969 1970 1971 1972 1973 1974 1975 1976 1978 1980 2002 2007
HB
IPollution Tolerant Community
Facultative/ Moderately Tolerant Community
Pollution Sensitive Community
Figure J.13 HBI Values at Mainstem Site PP970, Pennypack Creek Watershed, 1969-1980,
2002, 2007
0
2
4
6
8
10
12
1969 1970 1971 1972 1973 1974 1975 1976 1978 1980 2002 2007
Tax
a R
ich
nes
s
Figure J.14 Taxa Richness at Mainstem Site PP970, Pennypack Creek Watershed, 1969-1980,
2002, 2007

Pennypack Creek Watershed Comprehensive Characterization Report
Appendix J • Trends in Macroinvertebrate Community Composition
J-8 • PCWCCR • Philadelphia Water Department.
June 2009
0% 10% 20% 30% 40% 50% 60% 70% 80% 90% 100%
1969
1970
1971
1972
1973
1974
1975
1976
1978
1980
2002
2007
Sam
ple
Yea
r
Percent Contribution
TOLERANT MODERATELY TOLERANT INTOLERANT
Figure J.15 Tolerance Distribution at Mainstem Site PP970, Pennypack Creek Watershed, 1969-1980, 2002, 2007
0% 10% 20% 30% 40% 50% 60% 70% 80% 90% 100%
1969
1970
1971
1972
1973
1974
1975
1976
1978
1980
2002
2007
Percent Contribution
GatherersFilterersOmnivoresPredatorsScrapersShreddersParasites
Figure J.16 Trophic Composition at Mainstem Site PP970, Pennypack Creek Watershed,
1969-1980, 2002, 2007
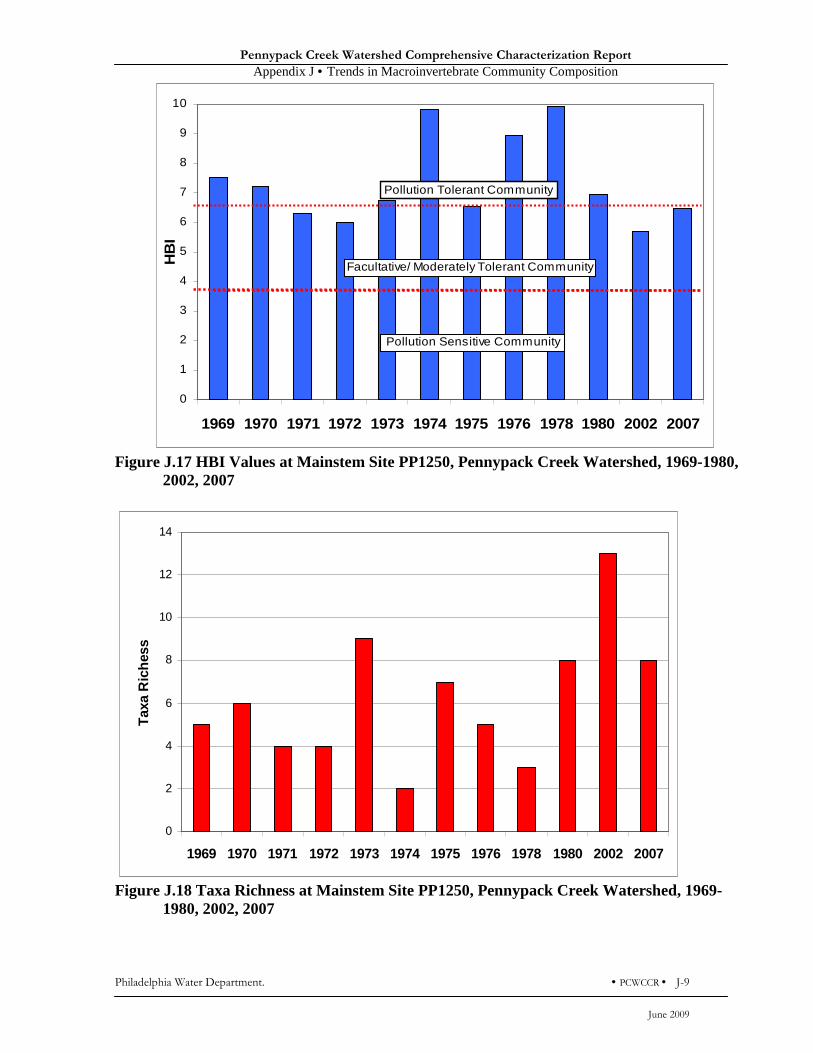
Pennypack Creek Watershed Comprehensive Characterization Report
Appendix J • Trends in Macroinvertebrate Community Composition
Philadelphia Water Department. • PCWCCR • J-9
June 2009
0
1
2
3
4
5
6
7
8
9
10
1969 1970 1971 1972 1973 1974 1975 1976 1978 1980 2002 2007
HB
IPollution Tolerant Community
Facultative/ Moderately Tolerant Community
Pollution Sensitive Community
Figure J.17 HBI Values at Mainstem Site PP1250, Pennypack Creek Watershed, 1969-1980,
2002, 2007
0
2
4
6
8
10
12
14
1969 1970 1971 1972 1973 1974 1975 1976 1978 1980 2002 2007
Tax
a R
ich
ess
Figure J.18 Taxa Richness at Mainstem Site PP1250, Pennypack Creek Watershed, 1969-
1980, 2002, 2007

Pennypack Creek Watershed Comprehensive Characterization Report
Appendix J • Trends in Macroinvertebrate Community Composition
J-10 • PCWCCR • Philadelphia Water Department.
June 2009
0% 10% 20% 30% 40% 50% 60% 70% 80% 90% 100%
1969
1970
1971
1972
1973
1974
1975
1976
1978
1980
2002
2007
Sam
ple
Yea
r
Percent Contribution
TOLERANT MODERATELY TOLERANT INTOLERANT
Figure J.19 Tolerance Distribution at Mainstem Site PP1250, Pennypack Creek Watershed, 1969-1980, 2002, 2007
0% 10% 20% 30% 40% 50% 60% 70% 80% 90% 100%
1969
1970
1971
1972
1973
1974
1975
1976
1978
1980
2002
2007
Percent Contribution
GatherersFilterersScrapersPredatorsShreddersOmnivoresParasites
Figure J.20 Trophic Composition at Mainstem Site PP1250, Pennypack Creek Watershed,
1969-1980, 2002, 2007

Pennypack Creek Watershed Comprehensive Characterization Report
Appendix J • Trends in Macroinvertebrate Community Composition
Philadelphia Water Department. • PCWCCR • J-11
June 2009
0
1
2
3
4
5
6
7
8
9
10
1969 1970 1971 1972 1973 1974 1975 1976 1978 1980 2002 2007
HB
I
Pollution Sensitive Community
Facultative/ Moderately Tolerant Community
Figure J.21 HBI Values at Mainstem Site PP2020, Pennypack Creek Watershed, 1969-1980,
2002, 2007
0
2
4
6
8
10
12
14
16
18
20
1969 1970 1971 1972 1973 1974 1975 1976 1978 1980 2002 2007
Tax
a R
ich
nes
s
Figure J.22 Taxa Richness at Mainstem Site PP2020, Pennypack Creek Watershed, 1969-
1980, 2002, 2007

Pennypack Creek Watershed Comprehensive Characterization Report
Appendix J • Trends in Macroinvertebrate Community Composition
J-12 • PCWCCR • Philadelphia Water Department.
June 2009
0% 10% 20% 30% 40% 50% 60% 70% 80% 90% 100%
1969
1970
1971
1972
1973
1974
1975
1976
1978
1980
2002
2007
Sam
ple
Yea
r
Percent Contribution
TOLERANT MODERATELY TOLERANT INTOLERANT
Figure J.23 Tolerance Distribution at Mainstem Site PP2020, Pennypack Creek Watershed, 1969-1980, 2002, 2007
0% 10% 20% 30% 40% 50% 60% 70% 80% 90% 100%
1969
1970
1971
1972
1973
1974
1975
1976
1978
1980
2002
2007
Percent Contribution
Gatherers
Filterers
ShreddersScrapers
Omnivores
Predators
Figure J.24 Trophic Composition at Mainstem Site PP2020, Pennypack Creek Watershed,
1969-1980, 2002, 2007

Pennypack Creek Watershed Comprehensive Characterization Report
Appendix K • Physical Habitat Principal Components Analysis (PCA) Loading Factors
Philadelphia Water Department. • PCWCCR • K-1
June 2009
Table K.1 Physical Habitat Principal Components Analysis (PCA) Loading Factors
Factor 1 Factor 2 Epifaunal
Substrate/Available Cover
-0.866892 0.333582
Pool Substrate Characterization
-0.865862 0.326668
Pool Variability -0.772155 0.448982
Sediment Deposition -0.778400 0.037373
Channel Flow Status -0.702196 0.496830
Channel Alteration -0.712079 -0.520279
Channel Sinuosity -0.777719 -0.291987
Left Bank Stability -0.631432 0.098667
Right Bank Stability -0.783241 0.024185 Left Bank Vegetative
Protection -0.673240 -0.194442
Right Bank Vegetative Protection
-0.730298 -0.467533
Riparian Vegetative Zone Width (Left)
-0.486717 -0.589842
Riparian Vegetative Zone Width (Right)
-0.558905 -0.626123
Embeddedness -0.871250 0.202929
Velocity/Depth Regime -0.794133 0.476467 Frequency of Riffles
(or bends) -0.629410 -0.359323

Pennypack Creek Watershed Comprehensive Characterization Report
Appendix L • HSI Model Variable Matrix
Philadelphia Water Department. • PCWCCR • L-1
June 2009
Table L.1 HSI Variable Matrix
HSI Model Variable Matrix
Var
iabl
e T
ype
Bla
ckno
se D
ace
Com
mon
shi
ner
Cre
ek C
hub
Long
nose
Dac
e
Red
brea
st S
unfis
h
Sm
allm
outh
Bas
s
Bro
wn
Tro
ut
Rai
nbow
Tro
ut
Total number of HSI variables 16* 9 20 6 10 13* 18 18
Avg. Temperature during growing season (May-Oct.) X X
Average Temperature in spawning season** X X X X
Maximum Temperature during warmest period of year x x
Maximum Temperature during embryo development x x
Maximum Temperature sustained for 1 week X X X
Maximum Temperatures within pools during spawning**
Maximum Midsummer Temperature within pools
Average Summer Temperature (Jul-Sep) X
Average temperature during spring (May-Jun)
tem
per
atu
re
X
Average Turbidity (JTU)*** X X X X X
Average yearly pH value X X
Least suitable pH value (instantaneous) X
pH range during summer growing season
pH fluctuation classification X
Levels of late summer nitrate-nitrogen (mg/l) x
Annual maximum or minimum pH x x
Minimum dissolved oxygen during late growing season x x
Minimum dissolved oxygen concentration X X X
Minimum dissolved oxygen conc. During spring
wat
er q
ual
ity
X
% instream cover during average summer flow X X X X
% instream cover during late growing season x
Instream cover classification
% shading of stream between 1000 and 1500 hrs. X X x x
% vegetative cover X x Average % vegetation along stream banks during summer
x x Avg. % rooted veg. and stable rocky ground cover along banks
x x
Availability of thermal refugia (winter) X
Stream gradient (m/km) X X X
Average velocity over spawning areas x x
Average stream velocity during average summer flow X X
Dominant substrate characterization X
Stream width X X X
Average thalweg depth during late growing season
gen
eral
str
eam
ch
arac
teri
stic
s
x

Pennypack Creek Watershed Comprehensive Characterization Report
Appendix L • HSI Model Variable Matrix
L-2 • PCWCCR • Philadelphia Water Department.
June 2009
*some variables used more than once, applied to different life stages **spawning season varies by species ***Turbidity relationships developed using Jackson Candle Units (JTU); cannot be converted to NTU values
Mode of stream depth during average summer flow
Water level fluctuations X
Average size of substrate in spawning areas x
Stream margin substrate characterization X
Average velocity along stream margins X X
Stream margin vegetation characterization X
% area consisting of two spawning gravel size classes x
% substrate used for winter and escape cover x x
Average annual peak flow x
Average annual base flow in summer or winter low-flow x x % average daily flow during the season of upstream migration
x
Substrate food production potential X
% riffles X
Dominant substrate type in riffles for food production x x
Riffle substrate characterization X X X X
% fines in riffles and spawning areas during avg. summer flows
x x
Average velocity in riffles X X X
Average depth of riffles X
Average maximum depth of riffles
riff
les
X
% pools X X X X X x x
Pool substrate characterization X X
% bottom of pool covered with vegetation, rocks, or debris
Pool classification X X x x
Average depth of pools X X
Average current velocity within pools during summer flow
Average current velocity within pools during spawning**
Average velocity at 0.6 depth in pools
po
ols
X X

Pennypack Creek Watershed Comprehensive Characterization Report
Appendix M • HSI Model Data
Philadelphia Water Department. • PCWCCR • M-1
June 2009
Table M.1 Blacknose Dace HSI Model HSI Variable PP490 SI PP690 SI PP970 SI PP1060 SI PP1680 SI PP2020 SI
Percent shaded 60 1.0 30 0.61 30 0.61 65 1.0 80 1.0 85 1.0
Percent pools 26.72 0.834 24.22 0.803 23.53 0.794 26.90 0.836 41.80 1.0 23.81 0.798 Stream gradient (m/km) 1.19 0.050 1.86 0.050 0.94 0.050 0.82 0.050 1.75 0.050 8.97 0.804 Stream Width (m) 19.15 0.150 15.74 0.150 13.71 0.291 16.19 0.150 9.35 0.754 4.12 1.0 Temperature (growing season) ( C) 20.54 1.0 20.34 1.0 20.34 1.0 20.34 1.0 19.48 0.82 18.88 1.0 Turbidity (growing season)** 8.54 1.0 6.38 1.0 6.38 1.0 6.38 1.0 5.26 1.0 5.34 1.0 Riffle substrate category D 0.60 D 0.60 D 0.60 D 0.60 D 0.60 D 0.60
Riffle Depth (cm) 13.02 1.0 17.68 1.0 14.94 1.0 17.37 1.0 16.76 1.0 16.75 1.0
Riffle Velocity (cm/s) 28.65 1.0 47.46 0.877 36.92 1.0 43.69 1.0 61.98 0.151 2.50 0 Temperature (spawning season) ( C) 22.46
1.0 21.16
1.0 21.16
1.0 21.16
1.0 19.48
1.0 18.30
1.0
Pool substrate category A 0.800 D
1.0 D
1.0 D
1.0 C
1.0 D
1.0
Pool velocity (cm/s) 6.49 1.0 13.41 1.0 29.57 1.0 18.29 1.0 6.71 1.0 3.93 1.0
Riffle substrate category (juvenile habitat) D 0.50 D 0.50 D 0.50 D 0.50 D 0.50 D 0.50 Riffle velocity (juvenile) (cm/s) 28.65 1.0 47.46 0.548 36.92 1.0 43.69 0.660 61.98 0.285 2.50 0.333 Stream margin substrate category (fry) D 0.30 D 0.30 D 0.30 C 0.40 D 0.30 A 1.0 Stream margin velocity (cm/s) 9.0 1.0 9.0 1.0 9.0 1.0 9.0 1.0 9.0 1.0 9.0 1.0 Food Cover Component 0.050 0.050 0.900 0.050 0.050 0.050 Water Qualtiy Component 1.0 1.0 1.0 1.0 0.877 1.0 Reproduction Component 0.940 0.912 0.940 0.940 0.151 0 Adult Component 0.894 1.0 1.0 1.0 1.0 1.0 Juvenile Component 0.707 0.524 0.707 0.574 0.285 0.333 Fry Component 0.300 0.300 0.300 0.400 0.300 1.0 HSI 0.300 0.300 0.300 0.400 0.151 0 HSS 0.440 0.470 0.630 0.400 0.350 0.660
Abundance 30 18 168 50 44 290 Biomass (g) 72.87 33.29 507.75 154.39 1737.93 568.73 Estimated surface area (m²) 1790.31 1567.93 1306.08 1781.89 1781.89 412.29 Estimated volume (m³) 719.71 558.18 356.56 727.01 892.73 94.0 Biomass/surface area 0.041 0.021 0.389 0.087 0.975 1.379 Biomass/volume 0.101 0.060 1.424 0.212 1.947 6.050
Correlations r value HSI:Abundance/SA 0.015 HSI:abundance -0.698 HSI:biomass/surface area -0.941 HSI:biomass/volume -0.922
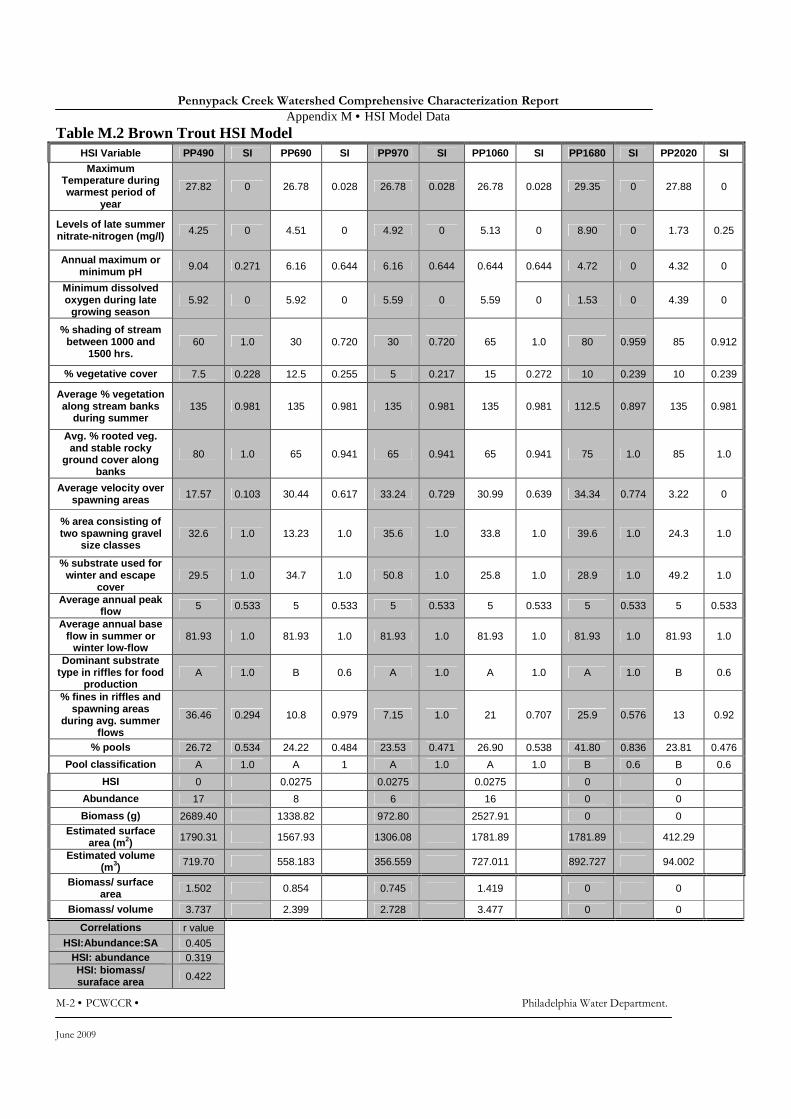
Pennypack Creek Watershed Comprehensive Characterization Report
Appendix M • HSI Model Data
M-2 • PCWCCR • Philadelphia Water Department.
June 2009
Table M.2 Brown Trout HSI Model HSI Variable PP490 SI PP690 SI PP970 SI PP1060 SI PP1680 SI PP2020 SI
Maximum Temperature during warmest period of
year
27.82 0 26.78 0.028 26.78 0.028 26.78 0.028 29.35 0 27.88 0
Levels of late summer nitrate-nitrogen (mg/l) 4.25 0 4.51 0 4.92 0 5.13 0 8.90 0 1.73 0.25
Annual maximum or minimum pH 9.04 0.271 6.16 0.644 6.16 0.644 0.644 0.644 4.72 0 4.32 0
Minimum dissolved oxygen during late
growing season 5.92 0 5.92 0 5.59 0 5.59 0 1.53 0 4.39 0
% shading of stream between 1000 and
1500 hrs. 60 1.0 30 0.720 30 0.720 65 1.0 80 0.959 85 0.912
% vegetative cover 7.5 0.228 12.5 0.255 5 0.217 15 0.272 10 0.239 10 0.239
Average % vegetation along stream banks
during summer 135 0.981 135 0.981 135 0.981 135 0.981 112.5 0.897 135 0.981
Avg. % rooted veg. and stable rocky
ground cover along banks
80 1.0 65 0.941 65 0.941 65 0.941 75 1.0 85 1.0
Average velocity over spawning areas 17.57 0.103 30.44 0.617 33.24 0.729 30.99 0.639 34.34 0.774 3.22 0
% area consisting of two spawning gravel
size classes 32.6 1.0 13.23 1.0 35.6 1.0 33.8 1.0 39.6 1.0 24.3 1.0
% substrate used for winter and escape
cover 29.5 1.0 34.7 1.0 50.8 1.0 25.8 1.0 28.9 1.0 49.2 1.0
Average annual peak flow 5 0.533 5 0.533 5 0.533 5 0.533 5 0.533 5 0.533
Average annual base flow in summer or
winter low-flow 81.93 1.0 81.93 1.0 81.93 1.0 81.93 1.0 81.93 1.0 81.93 1.0
Dominant substrate type in riffles for food
production A 1.0 B 0.6 A 1.0 A 1.0 A 1.0 B 0.6
% fines in riffles and spawning areas
during avg. summer flows
36.46 0.294 10.8 0.979 7.15 1.0 21 0.707 25.9 0.576 13 0.92
% pools 26.72 0.534 24.22 0.484 23.53 0.471 26.90 0.538 41.80 0.836 23.81 0.476
Pool classification A 1.0 A 1 A 1.0 A 1.0 B 0.6 B 0.6
HSI 0 0.0275 0.0275 0.0275 0 0
Abundance 17 8 6 16 0 0
Biomass (g) 2689.40 1338.82 972.80 2527.91 0 0 Estimated surface
area (m 2) 1790.31 1567.93 1306.08 1781.89 1781.89 412.29
Estimated volume (m3) 719.70 558.183 356.559 727.011 892.727 94.002
Biomass/ surface area 1.502 0.854 0.745 1.419 0 0
Biomass/ volume 3.737 2.399 2.728 3.477 0 0
Correlations r value HSI:Abundance:SA 0.405
HSI: abundance 0.319 HSI: biomass/ suraface area 0.422
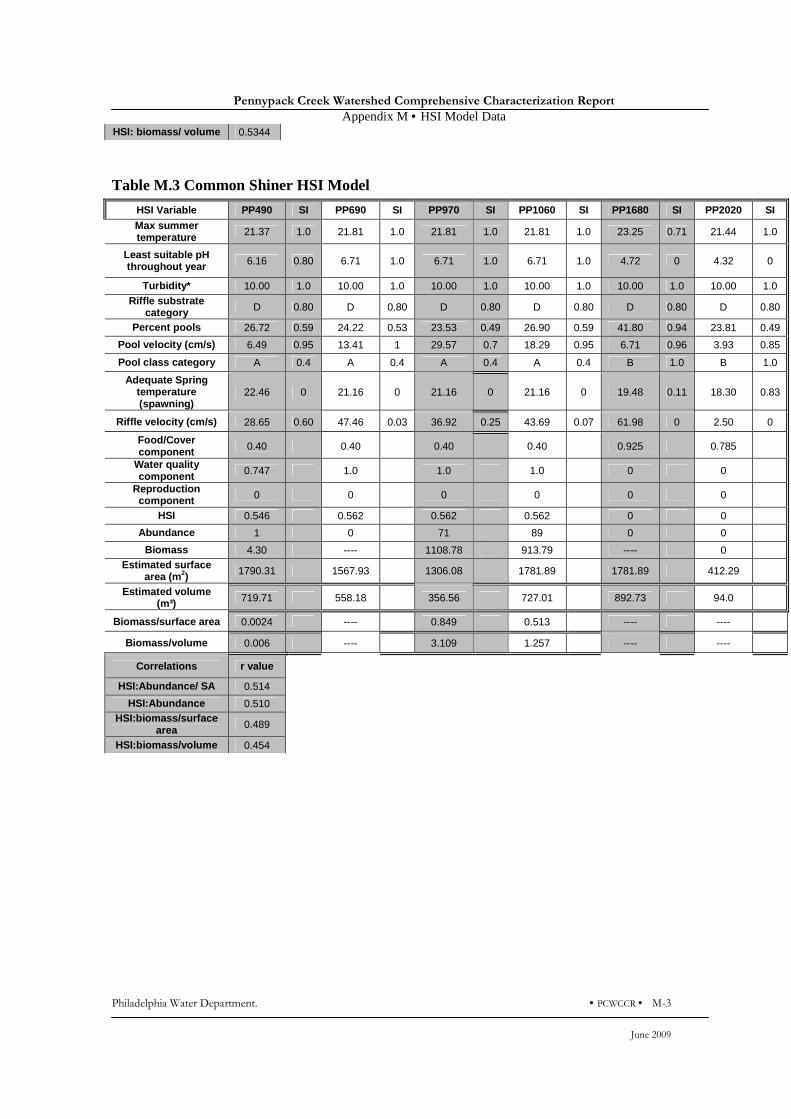
Pennypack Creek Watershed Comprehensive Characterization Report
Appendix M • HSI Model Data
Philadelphia Water Department. • PCWCCR • M-3
June 2009
HSI: biomass/ volume 0.5344
Table M.3 Common Shiner HSI Model
HSI Variable PP490 SI PP690 SI PP970 SI PP1060 SI PP1680 SI PP2020 SI
Max summer temperature 21.37 1.0 21.81 1.0 21.81 1.0 21.81 1.0 23.25 0.71 21.44 1.0
Least suitable pH throughout year 6.16 0.80 6.71 1.0 6.71 1.0 6.71 1.0 4.72 0 4.32 0
Turbidity* 10.00 1.0 10.00 1.0 10.00 1.0 10.00 1.0 10.00 1.0 10.00 1.0 Riffle substrate
category D 0.80 D 0.80 D 0.80 D 0.80 D 0.80 D 0.80
Percent pools 26.72 0.59 24.22 0.53 23.53 0.49 26.90 0.59 41.80 0.94 23.81 0.49
Pool velocity (cm/s) 6.49 0.95 13.41 1 29.57 0.7 18.29 0.95 6.71 0.96 3.93 0.85
Pool class category A 0.4 A 0.4 A 0.4 A 0.4 B 1.0 B 1.0
Adequate Spring temperature (spawning)
22.46 0 21.16 0 21.16 0 21.16 0 19.48 0.11 18.30 0.83
Riffle velocity (cm/s) 28.65 0.60 47.46 0.03 36.92 0.25 43.69 0.07 61.98 0 2.50 0
Food/Cover component 0.40 0.40 0.40 0.40 0.925 0.785
Water quality component 0.747 1.0 1.0 1.0 0 0
Reproduction component 0 0 0 0 0 0
HSI 0.546 0.562 0.562 0.562 0 0
Abundance 1 0 71 89 0 0
Biomass 4.30 ---- 1108.78 913.79 ---- 0 Estimated surface
area (m 2) 1790.31 1567.93 1306.08 1781.89 1781.89 412.29
Estimated volume (m³) 719.71 558.18 356.56 727.01 892.73 94.0
Biomass/surface area 0.0024 ---- 0.849 0.513 ---- ----
Biomass/volume 0.006 ---- 3.109 1.257 ---- ----
Correlations r value
HSI:Abundance/ SA 0.514
HSI:Abundance 0.510 HSI:biomass/surface
area 0.489
HSI:biomass/volume 0.454
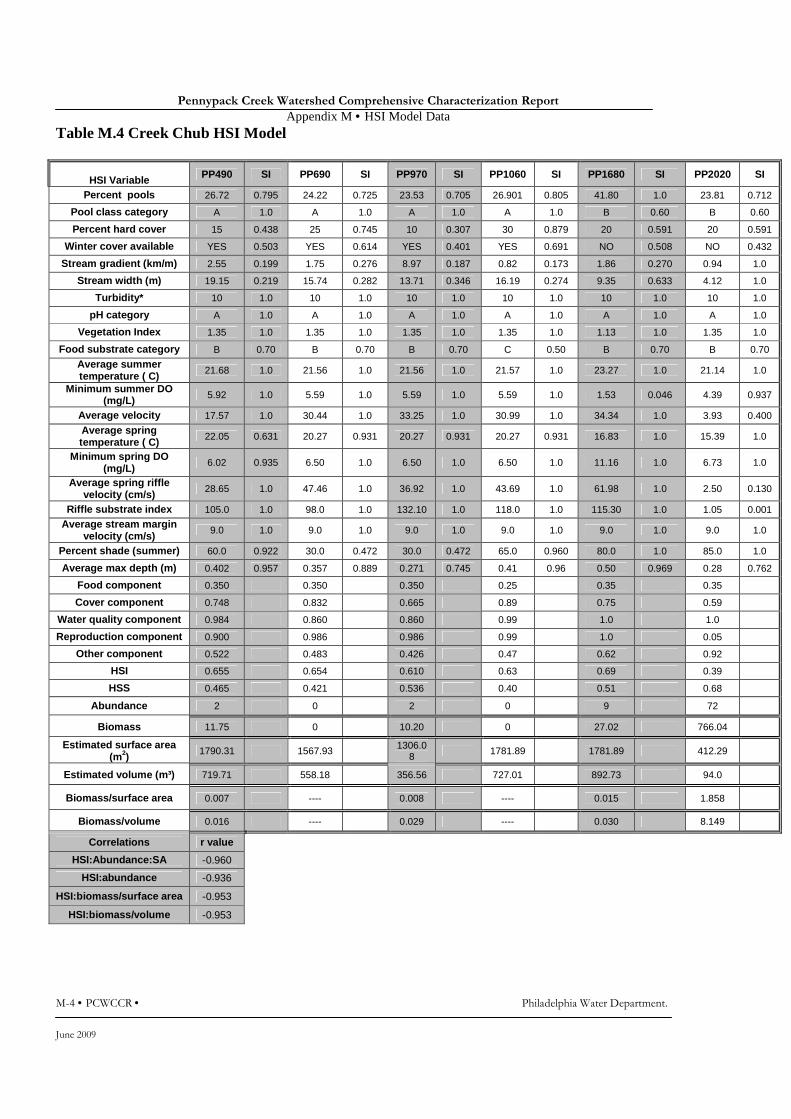
Pennypack Creek Watershed Comprehensive Characterization Report
Appendix M • HSI Model Data
M-4 • PCWCCR • Philadelphia Water Department.
June 2009
Table M.4 Creek Chub HSI Model
HSI Variable PP490 SI PP690 SI PP970 SI PP1060 SI PP1680 SI PP2020 SI
Percent pools 26.72 0.795 24.22 0.725 23.53 0.705 26.901 0.805 41.80 1.0 23.81 0.712
Pool class category A 1.0 A 1.0 A 1.0 A 1.0 B 0.60 B 0.60
Percent hard cover 15 0.438 25 0.745 10 0.307 30 0.879 20 0.591 20 0.591
Winter cover available YES 0.503 YES 0.614 YES 0.401 YES 0.691 NO 0.508 NO 0.432
Stream gradient (km/m) 2.55 0.199 1.75 0.276 8.97 0.187 0.82 0.173 1.86 0.270 0.94 1.0
Stream width (m) 19.15 0.219 15.74 0.282 13.71 0.346 16.19 0.274 9.35 0.633 4.12 1.0
Turbidity* 10 1.0 10 1.0 10 1.0 10 1.0 10 1.0 10 1.0
pH category A 1.0 A 1.0 A 1.0 A 1.0 A 1.0 A 1.0
Vegetation Index 1.35 1.0 1.35 1.0 1.35 1.0 1.35 1.0 1.13 1.0 1.35 1.0
Food substrate category B 0.70 B 0.70 B 0.70 C 0.50 B 0.70 B 0.70
Average summer temperature ( C) 21.68 1.0 21.56 1.0 21.56 1.0 21.57 1.0 23.27 1.0 21.14 1.0
Minimum summer DO (mg/L) 5.92 1.0 5.59 1.0 5.59 1.0 5.59 1.0 1.53 0.046 4.39 0.937
Average velocity 17.57 1.0 30.44 1.0 33.25 1.0 30.99 1.0 34.34 1.0 3.93 0.400
Average spring temperature ( C) 22.05 0.631 20.27 0.931 20.27 0.931 20.27 0.931 16.83 1.0 15.39 1.0
Minimum spring DO (mg/L) 6.02 0.935 6.50 1.0 6.50 1.0 6.50 1.0 11.16 1.0 6.73 1.0
Average spring riffle velocity (cm/s) 28.65 1.0 47.46 1.0 36.92 1.0 43.69 1.0 61.98 1.0 2.50 0.130
Riffle substrate index 105.0 1.0 98.0 1.0 132.10 1.0 118.0 1.0 115.30 1.0 1.05 0.001
Average stream margin velocity (cm/s) 9.0 1.0 9.0 1.0 9.0 1.0 9.0 1.0 9.0 1.0 9.0 1.0
Percent shade (summer) 60.0 0.922 30.0 0.472 30.0 0.472 65.0 0.960 80.0 1.0 85.0 1.0
Average max depth (m) 0.402 0.957 0.357 0.889 0.271 0.745 0.41 0.96 0.50 0.969 0.28 0.762
Food component 0.350 0.350 0.350 0.25 0.35 0.35
Cover component 0.748 0.832 0.665 0.89 0.75 0.59
Water quality component 0.984 0.860 0.860 0.99 1.0 1.0
Reproduction component 0.900 0.986 0.986 0.99 1.0 0.05
Other component 0.522 0.483 0.426 0.47 0.62 0.92
HSI 0.655 0.654 0.610 0.63 0.69 0.39
HSS 0.465 0.421 0.536 0.40 0.51 0.68
Abundance 2 0 2 0 9 72
Biomass 11.75 0 10.20 0 27.02 766.04
Estimated surface area (m2) 1790.31 1567.93 1306.0
8 1781.89 1781.89 412.29
Estimated volume (m³) 719.71 558.18 356.56 727.01 892.73 94.0
Biomass/surface area 0.007 ---- 0.008 ---- 0.015 1.858
Biomass/volume 0.016 ---- 0.029 ---- 0.030 8.149
Correlations r value
HSI:Abundance:SA -0.960
HSI:abundance -0.936
HSI:biomass/surface area -0.953
HSI:biomass/volume -0.953
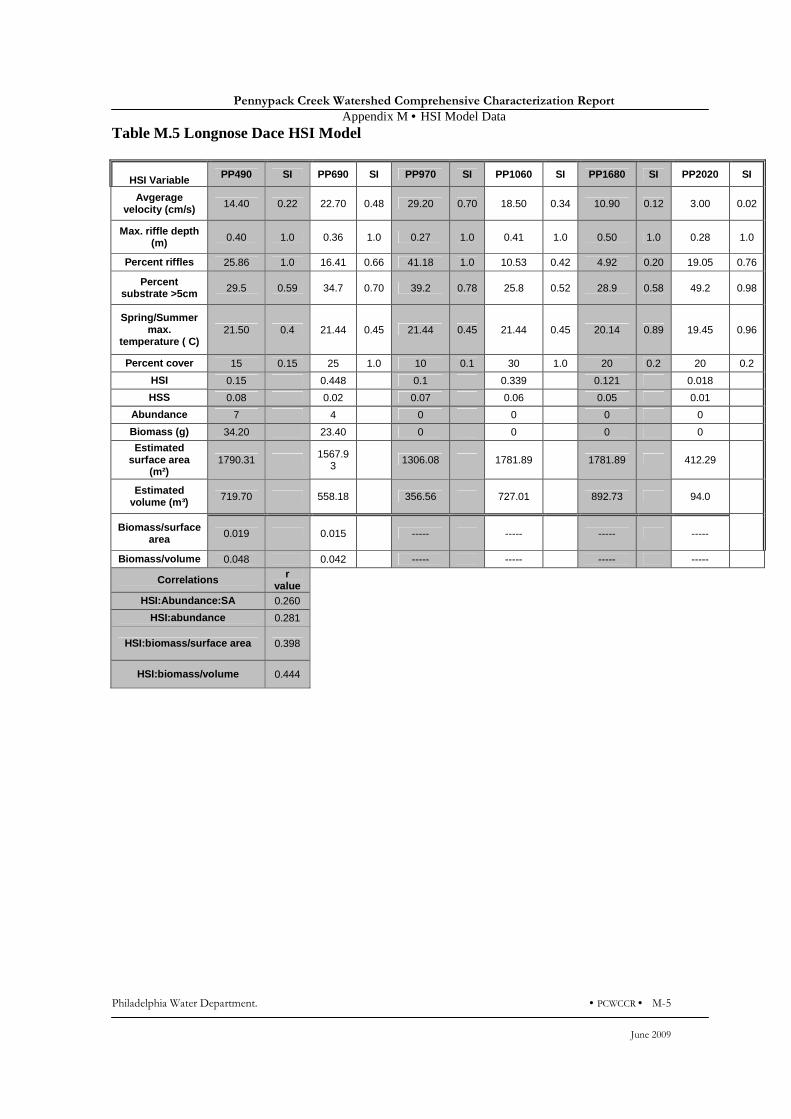
Pennypack Creek Watershed Comprehensive Characterization Report
Appendix M • HSI Model Data
Philadelphia Water Department. • PCWCCR • M-5
June 2009
Table M.5 Longnose Dace HSI Model
HSI Variable PP490 SI PP690 SI PP970 SI PP1060 SI PP1680 SI PP2020 SI
Avgerage velocity (cm/s) 14.40 0.22 22.70 0.48 29.20 0.70 18.50 0.34 10.90 0.12 3.00 0.02
Max. riffle depth (m) 0.40 1.0 0.36 1.0 0.27 1.0 0.41 1.0 0.50 1.0 0.28 1.0
Percent riffles 25.86 1.0 16.41 0.66 41.18 1.0 10.53 0.42 4.92 0.20 19.05 0.76
Percent substrate >5cm 29.5 0.59 34.7 0.70 39.2 0.78 25.8 0.52 28.9 0.58 49.2 0.98
Spring/Summer max.
temperature ( C) 21.50 0.4 21.44 0.45 21.44 0.45 21.44 0.45 20.14 0.89 19.45 0.96
Percent cover 15 0.15 25 1.0 10 0.1 30 1.0 20 0.2 20 0.2
HSI 0.15 0.448 0.1 0.339 0.121 0.018
HSS 0.08 0.02 0.07 0.06 0.05 0.01
Abundance 7 4 0 0 0 0
Biomass (g) 34.20 23.40 0 0 0 0
Estimated surface area
(m²) 1790.31 1567.9
3 1306.08 1781.89 1781.89 412.29
Estimated volume (m³) 719.70 558.18 356.56 727.01 892.73 94.0
Biomass/surface area 0.019 0.015 ----- ----- ----- -----
Biomass/volume 0.048 0.042 ----- ----- ----- -----
Correlations r value
HSI:Abundance:SA 0.260
HSI:abundance 0.281
HSI:biomass/surface area 0.398
HSI:biomass/volume 0.444
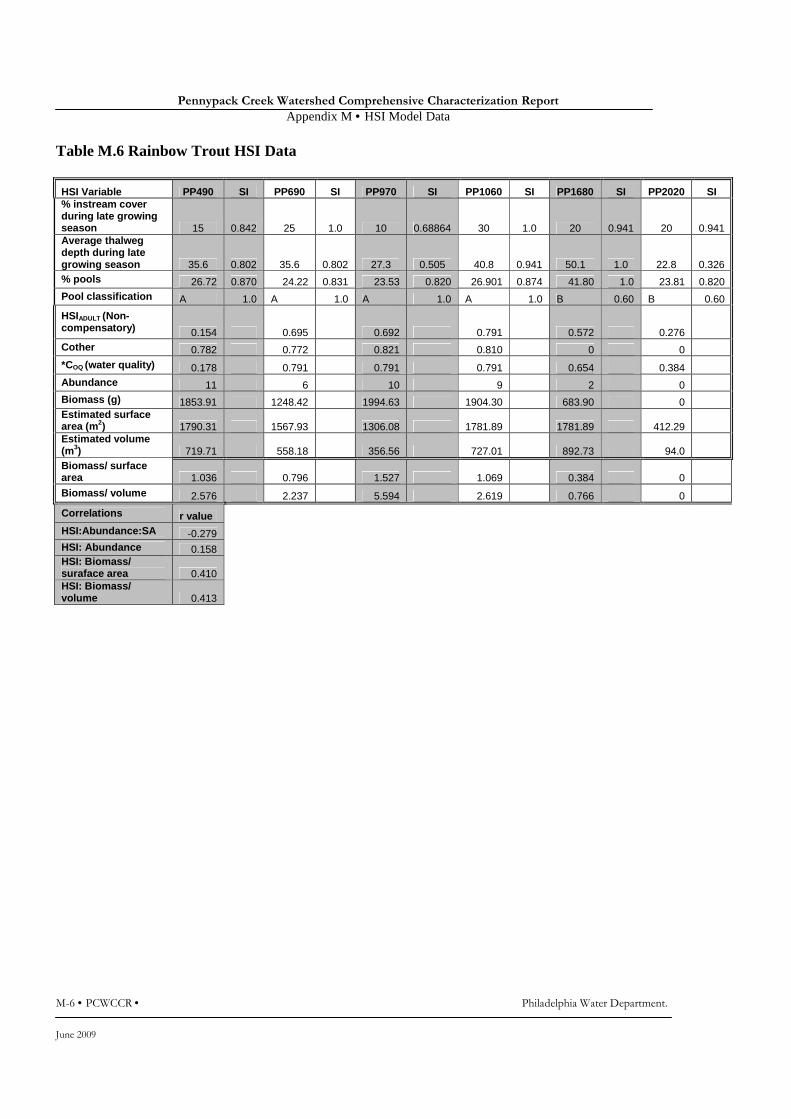
Pennypack Creek Watershed Comprehensive Characterization Report
Appendix M • HSI Model Data
M-6 • PCWCCR • Philadelphia Water Department.
June 2009
Table M.6 Rainbow Trout HSI Data
HSI Variable PP490 SI PP690 SI PP970 SI PP1060 SI PP1680 SI PP2020 SI % instream cover during late growing season 15 0.842 25 1.0 10 0.68864 30 1.0 20 0.941 20 0.941 Average thalweg depth during late growing season 35.6 0.802 35.6 0.802 27.3 0.505 40.8 0.941 50.1 1.0 22.8 0.326 % pools 26.72 0.870 24.22 0.831 23.53 0.820 26.901 0.874 41.80 1.0 23.81 0.820 Pool classification A 1.0 A 1.0 A 1.0 A 1.0 B 0.60 B 0.60
HSIADULT (Non-compensatory) 0.154 0.695 0.692 0.791 0.572 0.276 Cother 0.782 0.772 0.821 0.810 0 0 *COQ (water quality) 0.178 0.791 0.791 0.791 0.654 0.384 Abundance 11 6 10 9 2 0 Biomass (g) 1853.91 1248.42 1994.63 1904.30 683.90 0 Estimated surface area (m2) 1790.31 1567.93 1306.08 1781.89 1781.89 412.29 Estimated volume (m3) 719.71 558.18 356.56 727.01 892.73 94.0 Biomass/ surface area 1.036 0.796 1.527 1.069 0.384 0
Biomass/ volume 2.576 2.237 5.594 2.619 0.766 0
Correlations r value HSI:Abundance:SA -0.279 HSI: Abundance 0.158 HSI: Biomass/ suraface area 0.410 HSI: Biomass/ volume 0.413
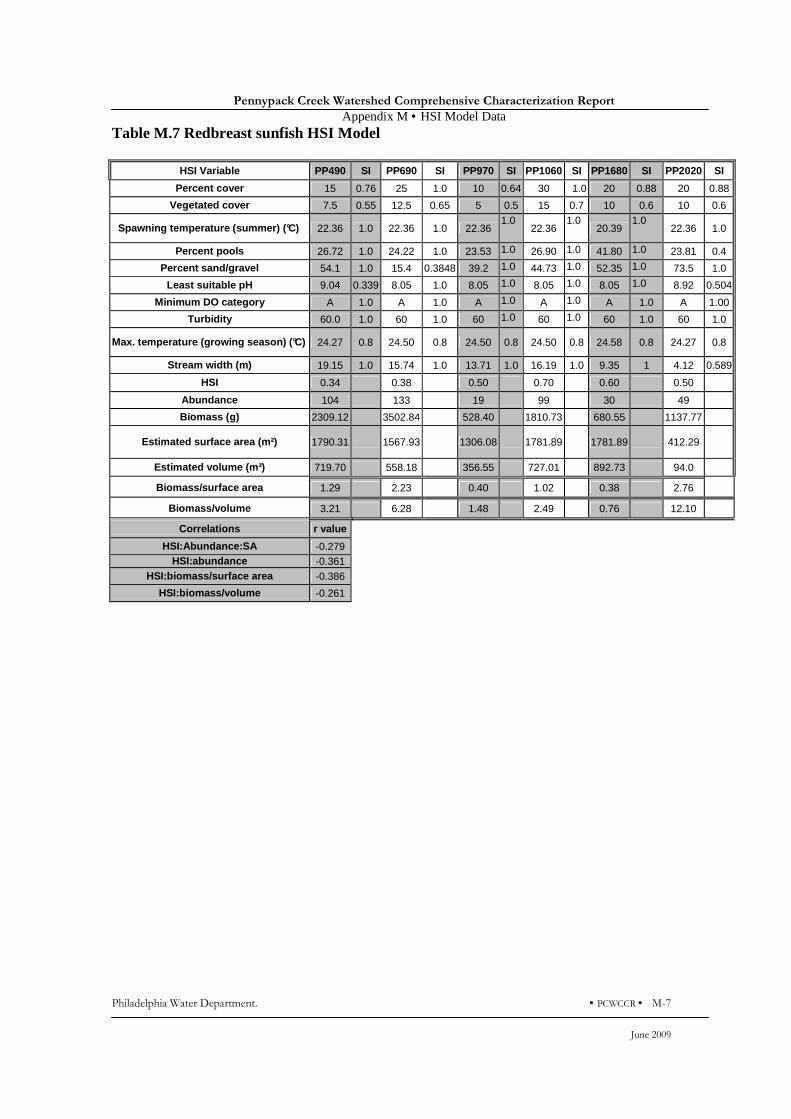
Pennypack Creek Watershed Comprehensive Characterization Report
Appendix M • HSI Model Data
Philadelphia Water Department. • PCWCCR • M-7
June 2009
Table M.7 Redbreast sunfish HSI Model
HSI Variable PP490 SI PP690 SI PP970 SI PP1060 SI PP1680 SI PP2020 SI
Percent cover 15 0.76 25 1.0 10 0.64 30 1.0 20 0.88 20 0.88
Vegetated cover 7.5 0.55 12.5 0.65 5 0.5 15 0.7 10 0.6 10 0.6
Spawning temperature (summer) (°C) 22.36 1.0 22.36 1.0 22.36 1.0
22.36 1.0
20.39 1.0
22.36 1.0
Percent pools 26.72 1.0 24.22 1.0 23.53 1.0 26.90 1.0 41.80 1.0 23.81 0.4
Percent sand/gravel 54.1 1.0 15.4 0.3848 39.2 1.0 44.73 1.0 52.35 1.0 73.5 1.0
Least suitable pH 9.04 0.339 8.05 1.0 8.05 1.0 8.05 1.0 8.05 1.0 8.92 0.504
Minimum DO category A 1.0 A 1.0 A 1.0 A 1.0 A 1.0 A 1.00
Turbidity 60.0 1.0 60 1.0 60 1.0 60 1.0 60 1.0 60 1.0
Max. temperature (growing season) (°C) 24.27 0.8 24.50 0.8 24.50 0.8 24.50 0.8 24.58 0.8 24.27 0.8
Stream width (m) 19.15 1.0 15.74 1.0 13.71 1.0 16.19 1.0 9.35 1 4.12 0.589
HSI 0.34 0.38 0.50 0.70 0.60 0.50
Abundance 104 133 19 99 30 49
Biomass (g) 2309.12 3502.84 528.40 1810.73 680.55 1137.77
Estimated surface area (m²) 1790.31 1567.93 1306.08 1781.89 1781.89 412.29
Estimated volume (m³) 719.70 558.18 356.55 727.01 892.73 94.0
Biomass/surface area 1.29 2.23 0.40 1.02 0.38 2.76
Biomass/volume 3.21 6.28 1.48 2.49 0.76 12.10
Correlations r value
HSI:Abundance:SA -0.279 HSI:abundance -0.361
HSI:biomass/surface area -0.386
HSI:biomass/volume -0.261

Pennypack Creek Watershed Comprehensive Characterization Report
Appendix M • HSI Model Data
M-8 • PCWCCR • Philadelphia Water Department.
June 2009
Table M.8 Smallmouth bass HSI Model
HSI Variable PP490 SI PP690 SI PP970 SI PP1060 SI PP1680 SI PP2020 SI
Substrate category A 0.2 C 1.0 C 1.0 C 1.0 B 0.3 C 1.0
Percent pools 26.72 0.48 24.22 0.43 23.53 0.41 26.90 0.49 41.80 0.72495 23.81 0.42
Average pool depth (m) 0.70 0.58 0.61 0.51 0.53 0.44 0.63 0.53 0.75 0.62 0.39 0.33
Percent cover 15 0.6 25 1.0 10 0.4 30 1.0 20 0.8 20 0.8
Average pH 7.63 0.99 7.53 0.99 7.53 0.99 7.53 0.99 7.27 0.94 7.64 0.99
Minimum DO (mg/L) 5.92 0.94 5.59 0.85 5.59 0.85 5.59 0.85 1.82 0 0.48 0.48
Turbidity* 10 1.0 10 1.0 10 1.0 10 1.0 10 1.0 10 1.0
Temperature (adult) (growing season) ( C) 20.54 0.88 23.34 1.0 23.34 0.97 23.34 0.97 19.50 0.83 18.88 0.79
Temperature (embryo) (spawning) 22.46 1.0 21.16 1.0 21.16 1.0 21.16 1.0 18.84 1.0 17.65 1.0
Temperature (fry) (growing season) ( C) 20.54 0.86 23.34 0.97 23.34 0.96 23.34 0.96 19.50 0.80 18.88 0.76
Temperature (juvenile) (growing season) ( C) 20.54 0.88 23.34 1.0 23.34 0.96 23.34 0.96 19.50 0.84 18.88 0.81
Water fluctuation category A 0.30 A 0.30 A 0.30 A 0.30 A 0.30 A 0.30
Stream gradient (km/m) 2.55 1.0 1.86 1.0 0.937 1.0 0.822 1.0 1.75 1.0 8.97 0.5
Food component 0.39 0.75 0.55 0.79 0.58 0.69
Cover Component 0.47 0.73 0.56 0.75 0.64 0.64
Water Quality Component 0.93 0.96 0.96 0.96 0.72 0.81
Reproduction Component 0.62 0.82 0.72 0.82 0.00 0.74
Other component 1.0 1.0 1.0 1.0 1.0 0.5
HSI 0.64 0.85 0.73 0.86 0 0.67
HSS 0.63 0.33 0.39 0.44 0.20 0.04
Abundance 5 7 5 8 0 0
Biomass (g) 508.90 541.30 837.08 1341.54 0 0
Estimated surface area (m 2) 1790.31 1567.93 1306.08 1781.89 1781.89 412.29
Estimated volume (m³) 719.70 558.18 356.56 727.01 892.73 94.00
Biomass/surface area 0.28 0.35 0.64 0.75 0 0
Biomass/volume 0.71 0.97 2.35 1.85 0 0
Correlations r value
HSI:Abundance:SA 0.748
HSI:abundance 0.74
HSI:biomass/surface area 0.65
HSI:biomass/volume 0.60

Pennypack Creek Watershed Comprehensive Characterization Report
Appendix N • Existing Dams
Philadelphia Water Department. • PCWCCR • N-1
June 2009
Figure N.1 Upstream View of Roosevelt Boulevard Dam
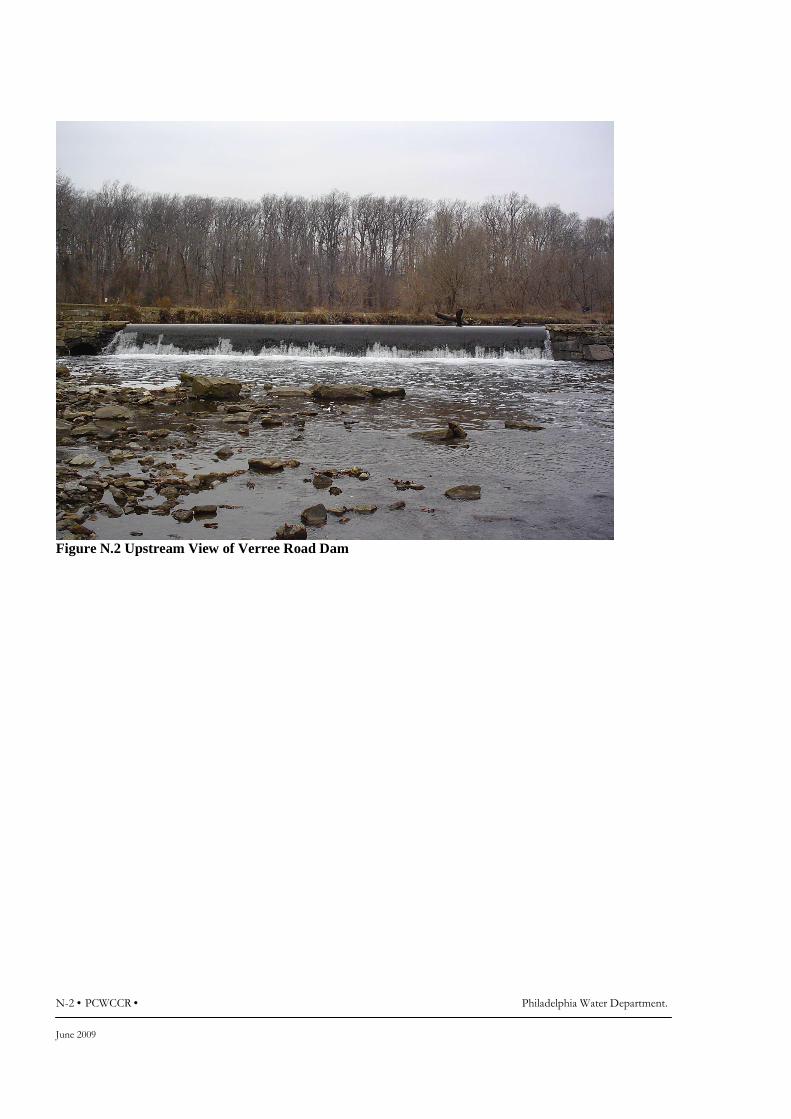
N-2 • PCWCCR • Philadelphia Water Department.
June 2009
Figure N.2 Upstream View of Verree Road Dam
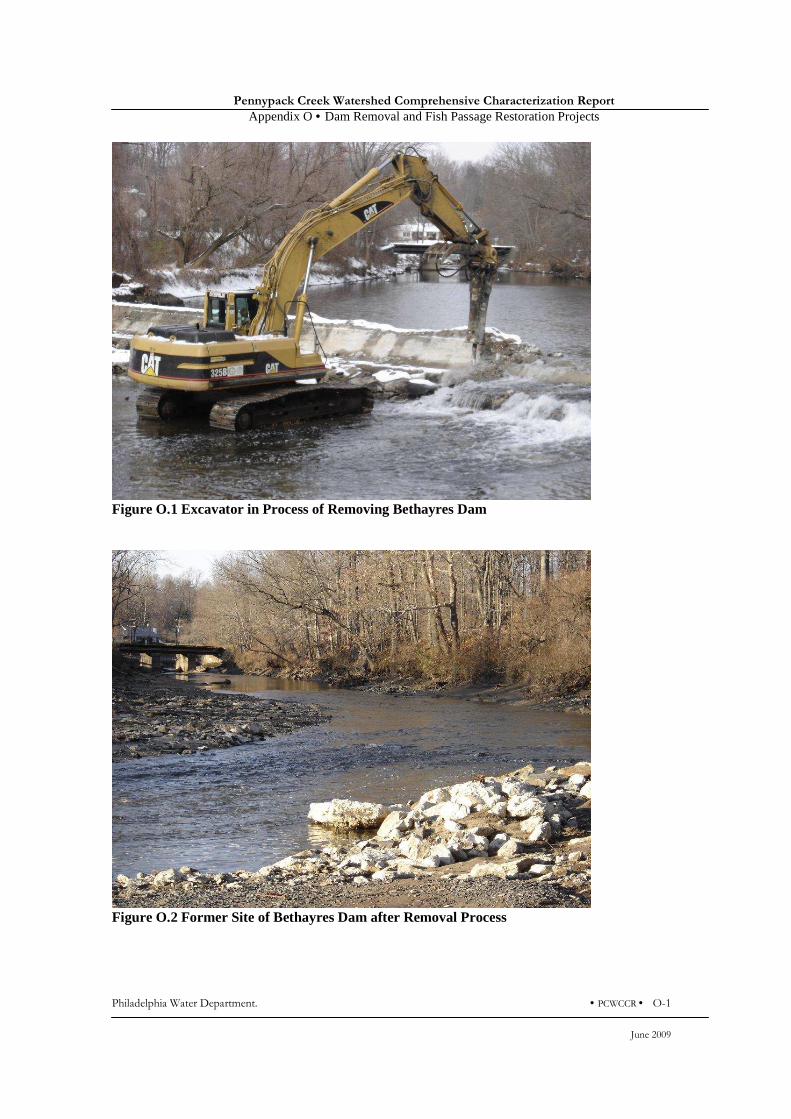
Pennypack Creek Watershed Comprehensive Characterization Report
Appendix O • Dam Removal and Fish Passage Restoration Projects
Philadelphia Water Department. • PCWCCR • O-1
June 2009
Figure O.1 Excavator in Process of Removing Bethayres Dam
Figure O.2 Former Site of Bethayres Dam after Removal Process

Pennypack Creek Watershed Comprehensive Characterization Report
Appendix O • Dam Removal and Fish Passage Restoration Projects
O-2 • PCWCCR • Philadelphia Water Department.
June 2009
Figure O.3 PWD Contractor in Process of Removing Frankford Avenue Dam
Figure O.4 Former Site of Frankford Avenue Dam after Removal Process
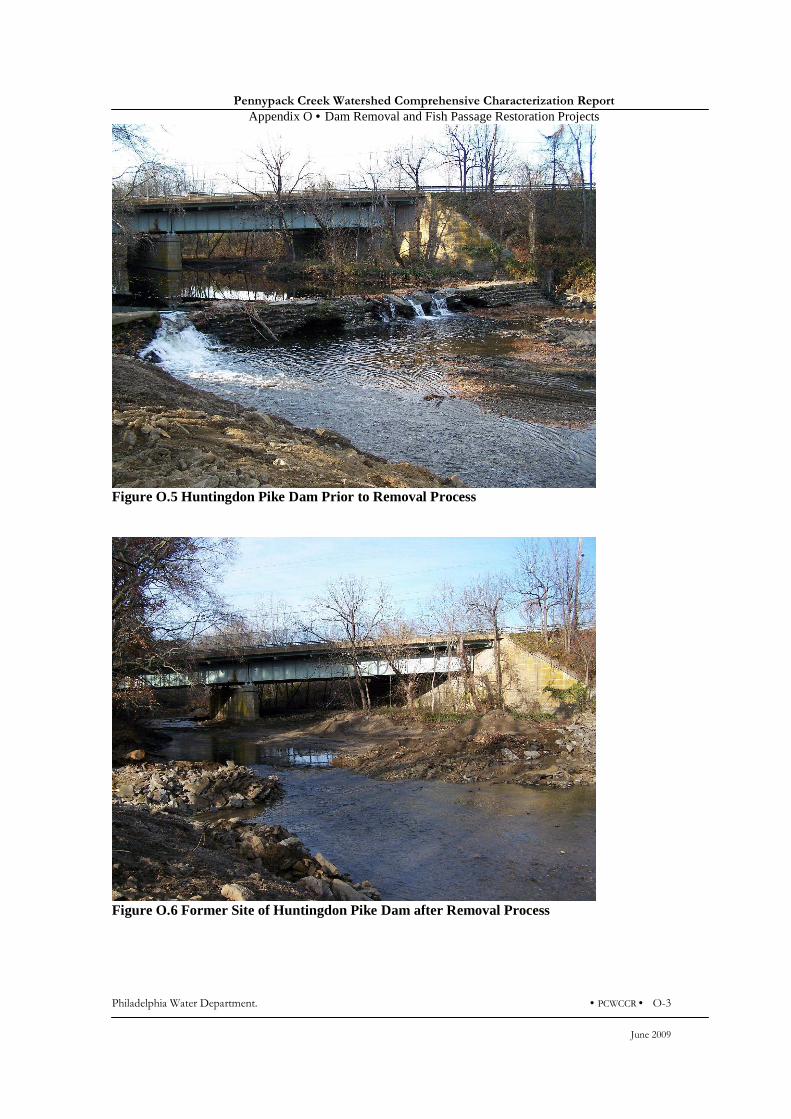
Pennypack Creek Watershed Comprehensive Characterization Report
Appendix O • Dam Removal and Fish Passage Restoration Projects
Philadelphia Water Department. • PCWCCR • O-3
June 2009
Figure O.5 Huntingdon Pike Dam Prior to Removal Process
Figure O.6 Former Site of Huntingdon Pike Dam after Removal Process

Pennypack Creek Watershed Comprehensive Characterization Report
Appendix O • Dam Removal and Fish Passage Restoration Projects
O-4 • PCWCCR • Philadelphia Water Department.
June 2009
Figure O.7 PWD Contractor in Process of Removing Rhawn Street Dam
Figure O.8 Former Site of Rhawn Street Dam after Removal Process
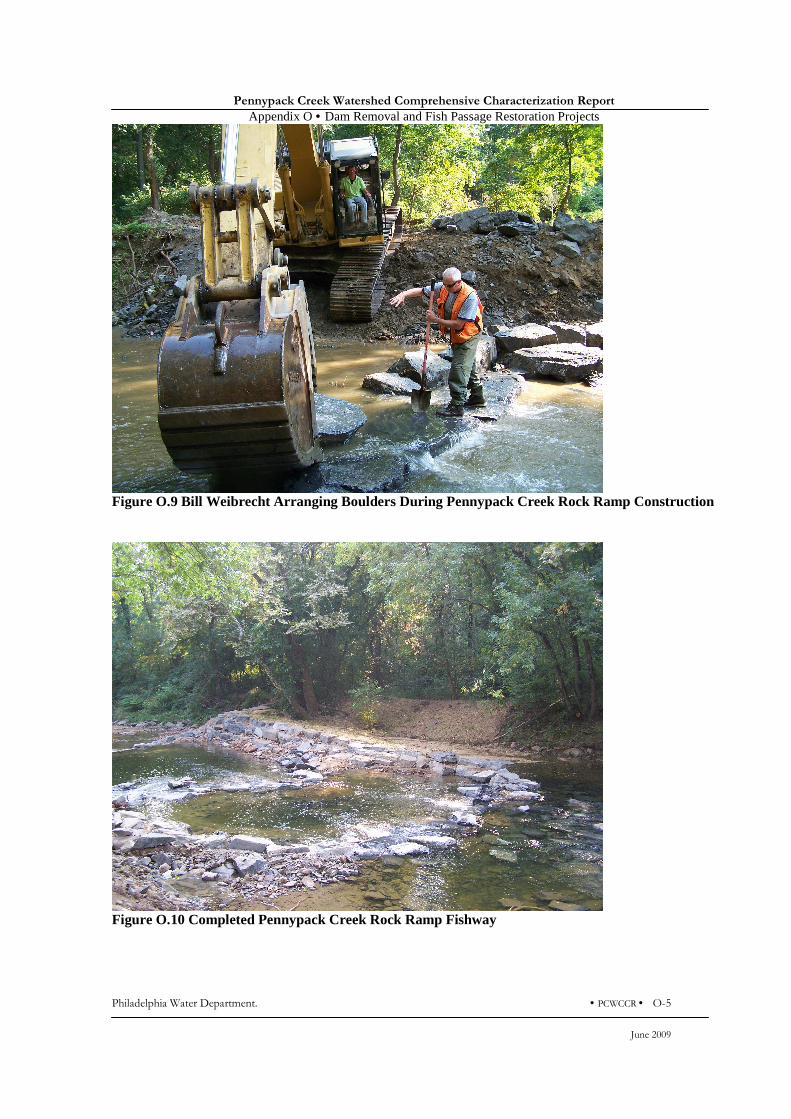
Pennypack Creek Watershed Comprehensive Characterization Report
Appendix O • Dam Removal and Fish Passage Restoration Projects
Philadelphia Water Department. • PCWCCR • O-5
June 2009
Figure O.9 Bill Weibrecht Arranging Boulders During Pennypack Creek Rock Ramp Construction
Figure O.10 Completed Pennypack Creek Rock Ramp Fishway

Pennypack Creek Watershed Comprehensive Characterization Report
Appendix P • References
Philadelphia Water Department. • WCWCCR • P-1
June 2009
REFERENCES: 1. Academy of Natural Sciences of Philadelphia. (1999a). Natural Lands Restoration Master Plan
Volume I General Observations. Prepared for Fairmount Park Commission. 137pp.
2. Academy of Natural Sciences of Philadelphia. (1999b). Natural Lands Restoration Master Plan Volume III Appendices. Prepared for Fairmount Park Commission. 291pp.
3. Academy of Natural Sciences of Philadelphia. (2000). Natural Lands Restoration Master Plan Volume II Chapter 5 Pennypack Park Master Plan. Prepared for Fairmount Park Commission. 198pp.
4. Aho, J. M., C. S. Anderson and J. W. Terrell. (1986). Habitat suitability index models and instream flow suitability curves: redbreast sunfish. U.S. Fish Wildl. Serv. Biol. Rep. 82(10.119). 23 pp.
5. Barbour, M. T., J. Gerritsen, B. D. Snyder and J. B. Stribling. (1999). Rapid Bioassessment
Protocols for Use in Streams and Wadeable Rivers: Periphyton, Benthic Macroinvertebrates, and Fish. EPA/841/B-99-002. Office of Water, U.S. Environmental Protection Agency, Washington, DC.
6. Bartholow, J.M. (1989). Stream temperature investigations: field and analytic methods. Instream flow information paper no. 13. Biological Report 89(17). U.S. Fish and Wildlife Service, Fort Collins, Co.
7. Biggs, B. J. F. (2000). Eutrophication of streams and rivers: dissolved nutrient-chlorophyll
relationships for benthic algae. Journal of the North American Benthological Society 19: 17-31. 8. Biggs, B. J. F. and M. E. Close. (1989). Periphyton biomass dynamics in a gravel bed river: the
relative effect of flow and nutrients. Freshwater Biology 22: 209-231.
9. Blakely, T. J., J. S. Harding, A. R. McIntosh and M. J. Winterbourn. (2006). Barriers to the recovery of aquatic insect communities in urban streams. Freshwater Biology 51: 1634-1645.
10. Bohonak, A. J. and D. G. Jenkins. (2003). Ecological and evolutionary significance of dispersal by freshwater invertebrates. Ecology Letters 6: 783-796.
11. Bond, N. R. and P. S. Lake. (2003). Local habitat restoration in streams: Constraints on the effectiveness of restoration for stream biota. Ecological Management & Restoration 4(3): 193-198.
12. Booth, D.B. (1990). Stream-Channel Incision Following Drainage-Basin Urbanization. Water
Resources Bulletin. 26(3): 407 – 417. 13. Borchardt, M. A. (1996). Nutrients. In R. J. Stevenson, M. L. Bothwell, and R. L. Lowe (Eds.),
Algal Ecology (pp. 183-227). San Diego: Academic Press.
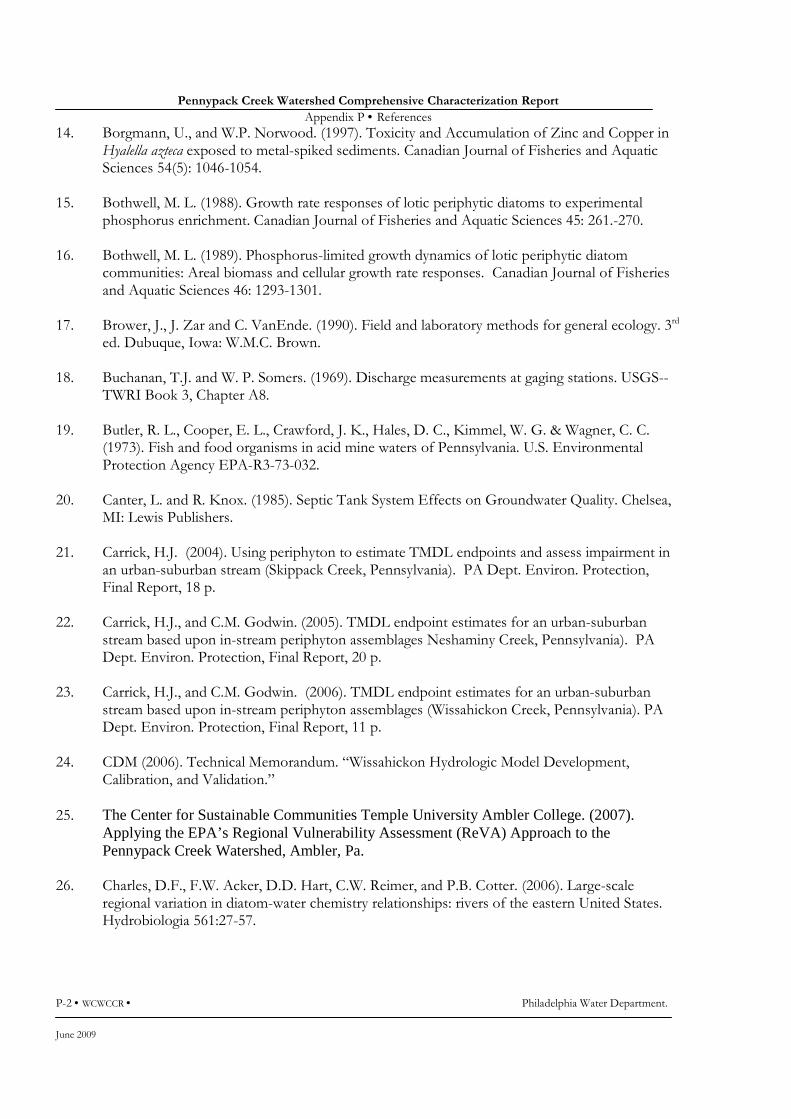
Pennypack Creek Watershed Comprehensive Characterization Report
Appendix P • References
P-2 • WCWCCR • Philadelphia Water Department.
June 2009
14. Borgmann, U., and W.P. Norwood. (1997). Toxicity and Accumulation of Zinc and Copper in Hyalella azteca exposed to metal-spiked sediments. Canadian Journal of Fisheries and Aquatic Sciences 54(5): 1046-1054.
15. Bothwell, M. L. (1988). Growth rate responses of lotic periphytic diatoms to experimental
phosphorus enrichment. Canadian Journal of Fisheries and Aquatic Sciences 45: 261.-270. 16. Bothwell, M. L. (1989). Phosphorus-limited growth dynamics of lotic periphytic diatom
communities: Areal biomass and cellular growth rate responses. Canadian Journal of Fisheries and Aquatic Sciences 46: 1293-1301.
17. Brower, J., J. Zar and C. VanEnde. (1990). Field and laboratory methods for general ecology. 3rd
ed. Dubuque, Iowa: W.M.C. Brown. 18. Buchanan, T.J. and W. P. Somers. (1969). Discharge measurements at gaging stations. USGS--
TWRI Book 3, Chapter A8. 19. Butler, R. L., Cooper, E. L., Crawford, J. K., Hales, D. C., Kimmel, W. G. & Wagner, C. C.
(1973). Fish and food organisms in acid mine waters of Pennsylvania. U.S. Environmental Protection Agency EPA-R3-73-032.
20. Canter, L. and R. Knox. (1985). Septic Tank System Effects on Groundwater Quality. Chelsea,
MI: Lewis Publishers. 21. Carrick, H.J. (2004). Using periphyton to estimate TMDL endpoints and assess impairment in
an urban-suburban stream (Skippack Creek, Pennsylvania). PA Dept. Environ. Protection, Final Report, 18 p.
22. Carrick, H.J., and C.M. Godwin. (2005). TMDL endpoint estimates for an urban-suburban
stream based upon in-stream periphyton assemblages Neshaminy Creek, Pennsylvania). PA Dept. Environ. Protection, Final Report, 20 p.
23. Carrick, H.J., and C.M. Godwin. (2006). TMDL endpoint estimates for an urban-suburban
stream based upon in-stream periphyton assemblages (Wissahickon Creek, Pennsylvania). PA Dept. Environ. Protection, Final Report, 11 p.
24. CDM (2006). Technical Memorandum. “Wissahickon Hydrologic Model Development,
Calibration, and Validation.” 25. The Center for Sustainable Communities Temple University Ambler College. (2007).
Applying the EPA’s Regional Vulnerability Assessment (ReVA) Approach to the Pennypack Creek Watershed, Ambler, Pa.
26. Charles, D.F., F.W. Acker, D.D. Hart, C.W. Reimer, and P.B. Cotter. (2006). Large-scale
regional variation in diatom-water chemistry relationships: rivers of the eastern United States. Hydrobiologia 561:27-57.

Pennypack Creek Watershed Comprehensive Characterization Report
Appendix P • References
Philadelphia Water Department. • WCWCCR • P-3
June 2009
27. Chetelat, J., F. R. Pick, A. Morin, and P. B. Hamilton. (1999). Periphyton biomass and community composition in rivers of different nutrient status. Canadian Journal of Fisheries and Aquatic Sciences 56: 560-569.
28. Clements, W.H., D.S. Cherry, and J. Cairns, Jr. (1988). The impact of heavy metals on
macroinvertebrate communities: a comparison of observational and experimental results. Can. J. Fish. Aquat. Sci. 45:2017-2025.
29. Crockett, Christopher (2000). The Impact of Storm Events on Giardia and Cryptosporidium
Occurrence. Not yet published. 30. Commonwealth of Pennsylvania Department of Environmental Protection. (2001a).
Pennsylvania Code Title 25. Environmental Protection. Chapter 16. Water Quality Toxics Management Strategy.
31. Commonwealth of Pennsylvania Department of Environmental Protection. (2001b).
Pennsylvania Code Title 25. Environmental Protection. Chapter 93. Water Quality Standards. 226p.
32. Commonwealth of Pennsylvania Department of Environmental Protection. (2001c). Pennsylvania Code Title 25. Environmental Protection. Chapter 96. Water Qulaity Standards Implementation.
33. Coughlin, R.E. and T.R. Hammer. (1973). “Environmental Study of the Wissahickon
Watershed within the City of Philadelphia.” A Report to the City of Philadelphia by the Regional Science Research Institute.
34. Cummins, K. W., M. A. Wilzbach, D. M. Gates, J. B. Perry and W. B. Taliaferro. (1989). Shredders and Riparian Vegetation. BioScience 39(1): 24-30.
35. Daniels, R., K. Riva-Murray, D. Halliwell, D. Vana-Miller and M. Bilger. (2002). An Index of
Biological Integrity for Northern Mid-Atlantic Slope Drainages. Transactions of American Fisheries Society. 131: 1044-1060.
36. Delaware Valley Regional Planning Commission. (2000) Land Use Data for Philadelphia, Bucks
and Montgomery Counties. Philadelphia, Pa. 37. Department of Environmental Protection. (1997). Pennsylvania’s Groundwater Quality
Monitoring Network: Ambient and Fixed Station Network (FSN) Monitoring Programs, 383-3200-009 / 6/97.
38. Department of Environmental Protection. (2005). Fact Sheet: Cryptosporidium and your
Water Supply. 39. Department of Environmental Protection. Drinking Water Treatment Technologies for
Groundwater Systems Under the Direct Influence of Surface Water. (http://www.dep.state.pa.us/dep/DEPUTATE/Watermgt/WSM/WSM_DWM/Technol/Trt_GUDI.htm)
Pennypack Creek Watershed Comprehensive Characterization Report
Appendix P • References
P-4 • WCWCCR • Philadelphia Water Department.
June 2009
40. Di Toro, D.M., H.E. Allen, H.L. Bergman, J.S. Meyer, P.R. Paquin and R.C. Santore. (2001). A Biotic Ligand Model of the Acute Toxicity of Metals. I. Technical Basis, Environmental Toxicology and Chemistry. 20: 2383-2396.
41. Dodds, W. K., V. H. Smith, and B. Zander. (1997). Developing nutrient targets to control
benthic chlorophyll levels in streams: a case study of the Clark Fork River. Water Research 31: 1738-1750.
42. Dodds, W. K., J. R. Jones, and E. B. Welch. (1998). Suggested classification of stream trophic
state: distributions of temperate stream types by chlorophyll, total nitrogen, and phosphorus. Water Research 32: 1455-1462.
43. Dodds, W. K., V. H. Smith, and K. Lohman. (2002a). Nitrogen and phosphorus relationships
to benthic algal biomass in temperate streams. Canadian Journal of Fisheries and Aquatic Sciences 59: 865-874.
44. Dodds, W. K., A. J. Lopez, W. B. Bowden, S. Gregory, N. B. Grimm, S. K. Hamilton, A. E.
Hershey, E. Marti, W. H. McDowell, J. L. Meyer, D. Morrall, P. J. Mulholland, B. J. Peterson, J. L. Tank, H. M. Valett, J. R. Webster, and W. Wollheim. (2002b). N uptake as a function of concentration in streams. Journal of the North American Benthological Society 21: 206-220.
45. Duncan, S. W. and D. W. Blinn. (1989). Importance of physical variables on the seasonal
dynamics of epilithic algae in a highly shaded canyon stream. Journal of Phycology 25: 455-461. 46. Dutka , B.J. and K.K. Kwan. (1980). Bacterial Die-off and Stream Transport Studies. Water
Research 74: 909-915. 47. Eaton, A.D., L.S. Clesceri, E.W. Rice, and A.E. Greenberg (Eds). (2005). Standard methods for
the examination of water and wastewater (21st edition). Washington, D.C.: American Public Health Association.
48. Edwards, E. A., H. Li and C. B. Schreck. (1983a). Habitat suitability index models: Longnose dace. U.S. Dept. Int., Fish Wildl. Serv. FWS/OBS-82/10.33. 13 pp.
49. Edwards, E. A., G. Gebhart and O. E. Maughan. (1983b). Habitat suitability infomrmation: Smallmouth bass. U.S. Dept. Int., Fish Wildl. Serv. FWS/OBS-82/10.36. 47 pp.
50. Edwards, T.K., and G. D. Glysson. (1988). Field methods for measurement of fluvial sediment:
US Geological Survey Open-File Report 86-531, 118 p. 51. Environmental Laboratory. (1987). Corps of Engineers Wetlands Delineation Manual. U.S.
Army Corps of Engineers, Wetland Research Program, Vicksburg, MS. Technical Report Y-87–1.
52. Everett, A.C. and N. West. (1998). Periphyton Standing Crop and Diatom Assemblages in the
Wissahickon Watershed. PADEP Internal Report.
Pennypack Creek Watershed Comprehensive Characterization Report
Appendix P • References
Philadelphia Water Department. • WCWCCR • P-5
June 2009
53. Fairchild, G. W., J. W. Sherman, and F. W. Acker. (1989). The effects of nutrients (N, P, C) enrichment, grazing, and depth upon littoral periphyton of a softwater lake. Hydrobiologia 179: 69-83.
54. Fairchild, G. W. and J. W. Sherman. (1993). Algal periphyton response to acidity and nutrients
in softwater lakes: Lake comparison vs. nutrient enrichment approaches. Journal of the North American Benthological Society 12: 157-167.
55. Fairmount Park Commission. (2008). Park Parcel Boundaries and Recreational Trails Geospatial
Data. Philadelphia, Pa. 56. Faulkner, G., F. Horner, and W. Simonis. (1980). The regulation of the energy-dependent
phosphate uptake by the blue-green alga Anacystis nidulans. Planta 149: 138-143. 57. Federal Emergency Management Agency. (2001). 100 and 500 year floodplains of Philadelphia
County, PA. Geospatial Data. Washington, DC. 58. Federal Emergency Management Agency. (2005). 100 and 500 year floodplains of Montgomery
County, PA. Geospatial Data. Washington, DC. 59. Ferguson, R. I. (1986). River loads underestimated by rating curves. Water Resources Research.
22(1): 74-76. 60. Food Safety and Inspection Service. Parasites and Foodborne Illness.
(http://www.fsis.usda.gov/OA/pubs/parasite.htm) 61. Francouer, S. N. (2001). Meta-analysis of lotic nutrient amendment experiments: detecting and
quantifying subtle responses. Journal of the North American Benthological Society 20: 358-368.
62. Gerba, C.P. (1976). Effect of Sediments on the Survival of Escherichia coli in Marine Waters.
Appl. Environ. Microbiol. 32: 114. 63. Gerhardt, A. (1994). Short term toxicity of iron (Fe) and lead (Pb) to the mayfly Leptophlebia
marginata (L.) (Insecta) in relation to freshwater acidification. Hydrobiologia 284(2): 157-168. 64. Gernes, M. and J. Helgen. (2002). Indexes of Biological Integrity for Large Depressional
Wetlands. Minnesota Pollution Control Agency. St. Paul, MN. 65. Goldman, J. C. (1979). Temperature effects on steady-state growth, phosphorus uptake, and the
chemical composition of a marine phytoplankter. Microbial Ecology 5: 153-166. 66. Grimm, N. B. and S. G. Fisher. (1986). Nitrogen limitation in a Sonoran Desert stream. Journal
of the North American Benthological Society 5: 2-15. 67. Halliwell, D. B., R. W. Langdon, R. A., J. P. Kurtenbach, and R. A. Jacobson. (1999).
Classification of freshwater fish species of the northeastern United States for use in the development of IBIs. In T. P. Simon (Ed.) Assessing the sustainability and biological integrity of water resources using fish communities (pp. 301-337). Boca Raton, Florida: CRC Press.

Pennypack Creek Watershed Comprehensive Characterization Report
Appendix P • References
P-6 • WCWCCR • Philadelphia Water Department.
June 2009
68. Hammer, T.R. (1972). Stream Channel Enlargement Due to Urbanization. Water Resources
Research 8(6): 1530-1540. 69. Heritage Conservancy. (2002). Riparian Buffer Assessment of Southeastern Pennsylvania II.
Doylestown, PA. http://www.heritageconservancy.org/projects/riparian-buffer-se.php 70. Hill, W. R. and A. W. Knight. (1988a). Nutrient and light limitation of algae in two northern
California streams. Journal of Phycology 24: 125-132. 71. Hill, W.R. and A.W. Knight. (1988b). Concurrent grazing effects of two stream insects on
periphyton. Limnology and Oceanography. 33:15-26. 72. Horner, R. R., E. B. Welch, and R. B. Veenstra. (1983). Development of nuisance periphytic
algae in laboratory streams in relation to enrichment and velocity. In R. G. Wetzel (Ed.) Periphyton of Freshwater Ecosystems (pp. 121-134). The Hague: Dr. W. Junk Publishers.
73. Jenkins, R.E. and N.M. Burkhead. (1994). Freshwater fishes of Virginia. American Fisheries
Society (p. 1079). Bethesda, Maryland.
74. Jones, J. R., M. M. Smart, and J. N. Burroughs. (1984). Factors related to algal biomass in Missouri Ozark streams. Verh. Int. Ver. Limnol (International Association of Theoretical and Applied Limnology) 22: 1867-1875.
75. Karr, J. R. (1981). Assessment of biotic integrity using fish communities. Fisheries 66: 21-27. 76. Karr, J.R., K.D. Fausch, P.L. Angermeier, P.R. Yant, and J. Schlosser. (1986). Assessing
biological integrity in running waters: A method and its rationale. Special publication 5. Illinois Natural History Survey.
77. Kemp, M. J. and W. K. Dodds. (2002). The influence of ammonium, nitrate, and dissolved
oxygen concentrations on uptake, nitrification, and denitrification rates associated with prairie stream substrata. Limnology and Oceanography 47: 1380-1393.
78. Kelly M.G. and Whitton, B.A (1995). The trophic diatom index: A New Index for Monitoring
Eutrophication in Rivers. Journal of Applied Phycology 7:44, 433-444 79. Kelly, M.G., Adams, C., Graves, A.C., Jamieson, J., Krokowski, J., Lycett, E.B., Murray-Bligh,
J., Pritchard, S. & Wilkins, C. (2001). The Trophic Diatom Index: A User's Manual. Revised Edition. R&D Technical Report E2/TR2, Bristol: Environment Agency.
80. Kjeldsen, K. (1994). The relationship between phosphorus and peak biomass of benthic algae
in small lowland streams. Verh. Int. Ver. Limnol. Limnol (International Association of Theoretical and Applied Limnology) 25: 1530-1533.
81. Klausen, Cecilie, Nicolaisen, Mette H., Strobel, Bjarne W., Warnecke, Falk, Nielsen, Jeppe L. &
Jørgensen, Niels O.G. (2005). Abundance of actinobacteria and production of geosmin and 2-methylisoborneol in Danish streams and fish ponds. FEMS Microbiology Ecology 52(2): 265-278.
Pennypack Creek Watershed Comprehensive Characterization Report
Appendix P • References
Philadelphia Water Department. • WCWCCR • P-7
June 2009
82. Klein, M. (1984). Anti clockwise hysteresis in suspended sediment concentration during individual storms. Catena, 11, 251-257.
83. Kugel, J, Dalbey, D., Reese, A., Godshall, S., and McGovern, K. (2006, Winter). “Drowning
Office Park Rescued by Students During High Tide” The New Planner. http://www.planning.org/thenewplanner/nonmember/default1.htm
84. LaPoint, T.W., S.M.Melancan, and M.K. Morris. (1984). Relationships among Observed Metals
Concentrations, Criteria, and Benthic Community Structural Responses in 15 Streams. J. Water Pollut. Control Fed. 56:1030-1038.
85. Lohman, K., J. R. Jones, and C. Baysinger-Daniel. (1991). Experimental evidence for nitrogen
limitation in a northern Ozark stream. Journal of the North American Benthological Society 19: 14-23.
86. Lohman, K., J. R. Jones, and B. D. Perkins. (1992). Effects of nutrient enrichment and flood
frequency on periphyton biomass in northern Ozark streams. Canadian Journal of Fisheries and Aquatic Sciences 49: 1198-1205.
87. Lowe, R.L. (1974). Environmental requirements and pollution tolerance of freshwater diatoms:
Cincinnati, Ohio, U.S. Environmental Protection Agency, National Environmental Research Center, Office of Research and Development, EPA-670/4-74-005, 334 p.
88. Martens, Gary. (2005, May 27). CDM/OOW Memorandum. “Long Term Historical
Precipitation Analysis and Determination of a Recent Representative Short-term Period.” 89. McHarg, I. L.(1969). Design with Nature. American Museum of Natural History. 197pp.
90. McMahon, T. E. (1982). Habitat suitability index models: Creek chub. U.S.D.I. Fish and
Wildlife Service. FWS/OBS-82/10.4 23 pp. 91. Meenar, M. (2006). Pennypack Creek Watershed Study. Report submitted to the Federal
Emergency Management and William Penn Foundation. Ambler, PA. 92. Metcalf and Eddy, Inc. (1979). Wastewater Engineering: Treatment, Disposal, Reuse. New
York: McGraw-Hill. 93. Montgomery County Planning Commission. (2005). Water Resources Plan, Shaping Our Future: A
Comprehensive Plan for Montgomery County. Norristown, Pa.
94. Montgomery County Planning Commission. (2008). Conservation Land, Golf Courses and Parks Geospatial Data. Norristown Pa
95. Morel, F.M.M. and J.G. Hering. (1993). Principles and Applications of Aquatic Chemistry. New York: John Wiley and Sons.
96. Morin, A. and A. Cattaneo. (1992). Factors affecting sampling variability of freshwater
periphyton and the power of periphyton studies. Canadian Journal of Fisheries and Aquatic Sciences 49: 1695-1703.

Pennypack Creek Watershed Comprehensive Characterization Report
Appendix P • References
P-8 • WCWCCR • Philadelphia Water Department.
June 2009
97. Neilsen, Robert D. and A.T. Hjelmfelt, Jr. (1998). Hydrologic Soil Group Assignment. 98. Odum, H. T. (1956). Primary production in flowing waters. Limnology and Oceanography 1:
102-117. 99. Ohio EPA. (1987). Biological criteria for the protection of aquatic life: volumes I-III. Ohio
Environmental Protection Agency, Columbus, Ohio. 100. Ongley, E. (1996). Sediment measures. In J. Bartram and R. Ballance (Eds.) Chapter 13 Water
Quality Monitoring - A Practical Guide to the Design and Implementation of Freshwater Quality Studies and Monitoring Programmes. Published on behalf of United Nations Environment Programme and the World Health Organization [UNEP/WHO].
101. PA Safe Drinking Water Act (1971). PA Code, Chapter 109. From
http://www.pacode.com/secure/data/025/chapter109/subchapAtoc.html 102. Paquin, P., R. Santore and R. Mathew. (2005). Biotic Ligand Model (BLM) Version 2.1.2 User’s
Guide and Reference Manual. Hydroqual Inc. 103. Pennsylvania Department of Conservation and Natural Resources. (2008). Surface Geology
Geospatial Data. Harrisburg, Pa. 104. Pennsylvania Department of Environmental Protection. (1998). Strategy for Assessing
Pennsylvania’s Unassessed Surface Waters. Harrisburg, Pa. 105. Pennsylvania Department of Environmental Protection. (2004). 2004 Pennsylvania Integrated
Water Quality Monitoring and Assessment Report. Clean Water Act Section 305(b) Report and 303(d) List. Harrisburg, Pa.
106. Pennsylvania Department of Environmental Protection. (2006). Instream Comprehensive
Evaluation Surveys. Harrisburg, Pa. 57pp.
107. Pennsylvania Department of Environmental Protection. (2007a). A Benthic Index of Biotic Integrity for Wadeable Freestone Streams in Pennsylvania. Harrisburg, Pa. 157pp.
108. Pennsylvania Department of Environmental Protection. (2007b). Public Participation Comment/Response Document for the 2007 Assessment and Listing Methodology. Harrisburg, Pa. 17pp.
109. Pennsylvania Department of Environmental Protection. (2007c). Chemistry Statistical
Assessments. Harrisburg, Pa. 17pp. 110. Pennsylvania Department of Environmental Protection. (2008). 2008 Pennsylvania Integrated
Water Quality Monitoring and Assessment Report. Clean Water Act Section 305(b) Report and 303(d) List. Harrisburg, Pa.
111. Pennsylvania Department of Environmental Protection. (2008). Act 537 Sewage Facilities Plans
in Philadelphia, Bucks, and Montgomery Counties. Geospatial Data. Harrisburg, Pa.
Pennypack Creek Watershed Comprehensive Characterization Report
Appendix P • References
Philadelphia Water Department. • WCWCCR • P-9
June 2009
112. Pennypack Watershed Partnership. (2005). Pennypack Creek Watershed Rivers
Conservation Plan Volume I. Lansdale, Pa.
113. Peterson, C. G. and N. B. Grimm. (1992). Temporal variation in enrichment effects during periphyton succession in a nitrogen-limited desert stream ecosystem. Journal of the North American Benthological Society 11: 20-36.
114. Petersen, I., J. H. Winterbottom, S. Orton, N. Friberg, A. G. Hildrew, D. C. Spiers and W. S. C. Gurney. (1999). Emergence and lateral dispersal of adult Plecoptera and Trichoptera from Broadstone Stream, U.K. Freshwater Biology 42: 401-416.
115. Pettyjohn, W.A., and R. Henning. (1979). Preliminary estimate of ground-water recharge rates,
related streamflow and water quality in Ohio: Ohio State University Water Resources Center Project Completion Report Number 552. 323 p.
116. Philadelphia Water Department (1998). Internal PWD Memorandum. “Summary of Dye Tracer Studies to Determine Wissahickon Creek Influence on Queen Lane WTP Intake: BLS Perspective.”
117. Philadelphia Water Department. (2003). Baseline Assessment of Pennypack Creek Watershed (2002-2003). 135pp.
118. Philadelphia Water Department. (2004). Tookany-Tacony/Frankford Watershed
Comprehensive Characterization Report.
119. Philadelphia Water Department. (2005a). “Defective Lateral Connections Status Report” (Covering Period from January 1, 2005 to March 31, 2005),” City of Philadelphia.
120. Philadelphia Water Department. (2005b). Pennypack Creek Watershed River Conservation Plan. Prepared by F.X. Browne, Inc. Lansdale, Pa.
121. Philadelphia Water Department Office of Watersheds. (2006). Monoshone Creek Project
Implementation and Water Quality Assessment 1999-2006. 122. Pitt, R., Alex Maestre, Renee Morguecho, Ted Brown, Tom Schueler, Karen Cappiella, Paul
Sturm, & Chris Swann. (2004). Research Progress Report: Findings from the National Stormwater Quality Database (NSQD). University of Alabama, Tuscaloosa, Alabama & Center for Watershed Protection, Ellicott City, Maryland.
123. Pizzuto, J. E., W. C. Hession and M. McBride. (2000). Comparing gravel-bed rivers in paired urban and rural catchments of southeastern Pennsylvania. Geology 28(1): 79-82.
124. Plafkin, J. L., M. T. Barbour, K. D. Porter, S. K. Gross, and R. M. Hughes. (1989). Rapid
Bioassessment Protocols for Use in Streams and Rivers: Benthic Macroinvertebrates and Fish. EPA/440/4-89-001. Office of Water, U.S. Environmental Protection Agency, Washington, DC.
Pennypack Creek Watershed Comprehensive Characterization Report
Appendix P • References
P-10 • WCWCCR • Philadelphia Water Department.
June 2009
125. Potapova, M.G., D.F. Charles, K.C. Ponader, and D.M. Winter. (2004). Quantifying species indicator values for trophic diatom indices: a comparison of approaches. Hydrobiologia 517: 25-41.
126. Pringle, C. M. (1987). Effects of water and substratum nutrient supplies on lotic periphyton
growth: An integrated bioassay. Canadian Journal of Fisheries and Aquatic Sciences 44: 619-629.
127. Radziul, J.V., D.D. Blair, P.R. Cairo, J.T. Coyle and M.M. Pence. (1975). Effects of Non-Point
Discharge on Urban Stream Quality. Proceedings of the American Water Resources Association. 20:201-210.
128. Raleigh, R. F., T. Hickman, R. C. Solomon and P. C. Nelson. (1984). Habitat suitability information: Rainbow trout. U.S. Fish Wildl. Serv. FWS/OBS-82/10.60. 64 pp.
129. Raleigh, R. F., L. D. Zuckerman and P. C. Nelson. (1986). Habitat suitability index models and
instream flow suitability curves: Brown trout, revised. U.S. Fish Wildl. Serv. Biol. Rep. 82(10.124). 65 pp. [First printed as: FWS/OBS-82/10.71, September 1984].
130. Redfield, A. C. (1958). The biological control of chemical factors in the environment.
American Scientist 46: 205-222. 131. Reese, S.O. (1998). Summary of Groundwater Quality Monitoring Data (1985 - 1997) from
Pennsylvania’s Ambient and Fixed Station Network (FSN) Monitoring Program: Selected Groundwater Basins in Southwestern, Southcentral and Southeastern Pennsylvania. PADEP Document No.: 3800-BK-DEP2246, http://www.dep.state.pa.us.
132. Regional Science Research Institute. (1973). “Analysis and Findings.” Environmental Study of the Wissahickon Watershed within the City of Philadelphia.
133. Reynolds, C. S. (1988). Potamoplankton: paradigms, paradoxes, and prognoses. In R.E. Round (Ed.) Algae and the aquatic environment (pp. 285-311). Bristol: Biopress, Ltd.
134. Rhee, G. Y. and I. J. Gotham. (1981a). The effect of environmental factors on phytoplankton
growth: Temperature and the interactions of temperature with nutrient limitation. Limnology and Oceanography 26: 635-648.
135. Rhee, G. Y. and I. J. Gotham. (1981b). The effect of environmental factors on phytoplankton
growth: Light and the interactions of light with nitrate limitation. Limnology and Oceanography 26: 649-659.
136. Rosemarin, A. S. (1982). Phosphorus nutrition of two potentially competing filamentous algae,
Cladophora glomerata (L.) Kutz and Stigeoclonium tenue (Agardh) Kutz. From Lake Ontario. Journal of Great Lakes Research 8: 66-72.
137. Rosen, J.S., Sobrinho, J.A.H., Campbell, J., and Hargy, T. (2006, July 20). 2001-2006 Protozoa
Data Analysis for Philadelphia Water Department. Report Prepared for the Philadelphia Water Department by Clancy Environmental Consultants, Inc.
Pennypack Creek Watershed Comprehensive Characterization Report
Appendix P • References
Philadelphia Water Department. • WCWCCR • P-11
June 2009
138. Rosgen, Dave. (1996). Applied River Morphology. Colorado: Wildland Hydrology. 139. Roth, E., R. Olsen, P. Snow, and R. Sumner. (1996). Oregon Freshwater Wetland
Assessment Methodology 2nd edition. Oregon Division of State Lands. Salem, OR. 140. Rott, E., Hofmann, G., Pall, K., Pfister, P. & Pipp, E. (1997). Indication lists for buildup algae
in Austrian running waters. Part 1: Saprobielle indication. 73pp. Federal Ministry for Land and Forestry.
141. Runde, J.M. and Hellenthal, R.A. (2000). Behavioral Responses of Hydropsyche sparna
(Tricoptera:Hydropsychidae) and Related Species to Deposited Bedload Sediment. Environmental Entomology, 29(4):704-709.
142. Schueler, T. R.. (1995). The importance of imperviousness: Watershed Protection Techniques.
v. 1, p. 100–111. 143. Schrader, KK and W. T. Blevins. (1993). Geosmin-producing species of Streptomyces and
Lyngbya from aquaculture ponds Canadian Journal of Microbiology/Revue Canadienne de Microbiologie [CAN. J. MICROBIOL./REV. CAN. MICROBIOL] 39(9): 834-840.
144. Sloto R. (2004). Geohydrology of the French Creek basin and simulated effects of drought and ground-water withdrawals, Chester County, Pennsylvania. USGS Dept. of the Interior, New Cumberland, PA. Water Resources Investigation Report: 03-4263.
145. Sloto R. (2005). Water Budgets for Selected Watersheds in the Delaware River Basin, eastern Pennsylvania
and western New Jersey. USGS Scientific Investigation Report 2005-5113, p 15-19.
146. Sloto, R. and M. Y. Crouse. (1996). HYSEP: A Computer Program for Streamflow Hydrograph Separation and Analysis. United States Geological Survey (USGS) WRIR: 96-4040, http://pa.water.usgs.gov/reports/wrir96-4040.pdf.
147. Smullen, J. T., A. L. Shallcross and K. A. Cave. (1999). “Updating the U.S. Nationwide Urban Runoff Quality Database.” Water Science and Technology 39(12): 9-16.
148. Stark, K. (1993, April 13). “Creeks mix in the foul with the fish”. Philadelphia Inquirer.
149. Steffy, L. Y. and S. S. Kilham. (2006). Effects of urbanization and land use on fish communities
in Valley Creek watershed, Chester County, Pennsylvania. Urban Ecosyst DOI 10.1007/s11252-006-7901-5.
150. Stevenson, R. J. and Y. Pan. (1999). Assessing environmental conditions in rivers and streams
with diatoms. The Diatoms: Applications for the Environmental and Earth Sciences. pp. 11-40.
151. Stoddard, J.L., D.P. Larsen, C.P. Hawkins, R.K. Johnson, and R.H. Norris. (2006). Setting expectations for the ecological condition of streams: the concept of reference condition. Ecological Applications 16(4): 1267-1276.
152. STV Inc. (2002). Interim Report and Alternatives Rhawn Street and Livezy dam Modifications. Prepared for Fairmount Park Commission. 12pp.

Pennypack Creek Watershed Comprehensive Characterization Report
Appendix P • References
P-12 • WCWCCR • Philadelphia Water Department.
June 2009
153. Sutcliff, D.W., and T.R. Carrick. (1973). Studies on Mountain Streams in the English lake
District. I. pH, Calcium, and the Distribution of Invertebrates in the River Duddon. Freshwater Biol. 3: 437-462
154. Tellus Institute. (2004). Development of a Water Budget for the Wissahickon Creek Watershed,
Southeastern Pennsylvania. AwwaRF project 2853 Decision Support System for Sustainable Water Supply Planning, p 16-24.
155. Temple University Center for Sustainable Communities. (2006). Pennypack Creek Watershed Study, Ambler, Pa.
156. Temple University Ambler College Center for Sustainable Communities. (2007). Applying the EPA’s Regional Vulnerability Assessment (ReVA) Approach to the Pennypack Creek Watershed, Amber, Pa.
157. Trial, J.G., C.S. Wade, J.G. Stanley, and P.C. Nelson. (1983a). Habitat Suitability Information:
Common Shiner. U.S. Dept. Int., Fish Wildlife Serv. FWS/OBS-82/10.40. 22pp. 158. Trial, J.G., C.S. Wade, J.G. Stanley, and P.C. Nelson. (1983b). Habitat Suitability Information:
Fallfish. U.S. Dept. Int., Fish Wildlife Serv. FWS/OBS-82/10.48. 15pp.
159. Trial, J. G., J. G. Stanley, M. Batcheller, G. Gebhart, O. E. Maughan, and P. C. Nelson. (1983c). Habitat suitability information: Blacknose dace. U.S. Dept. Int., Fish Wildl. Serv. FWS/OBS-82/10.41. 28 pp.
160. Triska, F. J., V. C. Kennedy, R. J. Avanzino, and B. N. Reilly. (1983). Effect of simulated
canopy cover on regulation of nitrate uptake and primary production by natural periphyton communities. Pages 129-159 in Dynamics of lotic ecosystems (T. D. Fontaine and S. M. Bartell, eds.), Ann Arbor Scientific Publisher, Ann Arbor, MI.
161. United States Census Bureau. (2000). County, Municipality and Block Level Population
Geospatial Data. Washington, DC. 162. United States Department of Agriculture Natural Resources Conservation Service. (2008). Soil
Survey, Soil Hydrologic Group, and Soil Texture Geospatial Data. Washington, DC.
163. United States Environmental Protection Agency [EPA]. Drinking Water Priority Rulemaking: Microbial and Disinfection Byproduct Rules. (http://www.epa.gov/ogwdw/mdbp/mdbp.html)
164. United States Environmental Protection Agency. (1998). Pennypack Creek Total Maximum Daily
Load (TMDL), Region III, Philadelphia, Pa.
165. United States Environmental Protection Agency. (2000). Ambient Water Quality Criteria Recommendations: Rivers and Streams in Nutrient Ecoregion IX. EPA 822-B-00-019. Office of Water, U.S. Environmental Protection Agency, Washington D.C.
Pennypack Creek Watershed Comprehensive Characterization Report
Appendix P • References
Philadelphia Water Department. • WCWCCR • P-13
June 2009
166. United States Environmental Protection Agency. (2002). Data Review for Wissahickon Creek, Pennsylvania, U.S. Environmental Protection Agency Region 3, Philadelphia, PA.
167. United States Environmental Protection Agency. (2002, January 14). National Primary Drinking Water Regulations: Long Term 1 Enhanced Surface Water Treatment Rule. Federal Register 67(9): 1811-1844. Retrieved from http://www.epa.gov/safewater/mdbp/lt1eswtr.html
168. United States Environmental Protection Agency. (2003a). Modeling Report for Wissahickon Creek, Pennsylvania Siltation TMDL Development, U.S. EPA Region 3, Philadelphia, PA, pp 13-16.
169. United States Environmental Protection Agency. (2003b). Total Maximum Daily Load For Sediment and Nutrients Wissahickon Creek Watershed.
170. United States Environmental Protection Agency. (2003c). Modeling Report for Wissahickon Creek, Pennsylvania Nutrient TMDL Development.
171. United States Environmental Protection Agency (USEPA). (2004). Local Limits Development Guidance Appendices. EPA Document No.: 833R04002B, http://www.epa.gov/npdes/pubs/final_local_limits_appendices.pdf.
172. United States Environmental Protection Agency (2006, January 5). National Primary Drinking
Water Regulations: Long Term 2 Enhanced Surface Water Treatment Rule. Federal Register, Volume 71, Number 3, pp. 653-786. Retrieved from http://www.epa.gov/safewater/disinfection/lt2/regulations.html
173. United States Environmental Protection Agency (USEPA). (2006). Data Quality Assessment:
Statistical Methods for Practitioners (EPA QA/G-9S). EPA Document No.: EPA/240/B-06/003, http://www.epa.gov/quality/qs-docs/g9s-final.pdf.
174. URS Corp. (2006). Fish Passage Alternatives Analysis On Pennypack Creek At Verree Road Dam And Roosevelt Boulevard Dam Philadelphia, Pennsylvania. Prepared for Fairmount Park Commission. 34pp.
175. Van Donsel, D.J., E. D. Geldreich and N.A. Clarke. (1967). "Seasonal Variations in Survival of Indicator Bacteria in Soil and their Contribution to Stormwater Pollution." Applied Microbiology 15: 1362-1370.
176. Van Donk, E. and S. S. Kilham. (1990). Temperature effects on silicon- and phosphorus-limited growth and competitive interactions among three diatoms. Journal of Phycology 26: 40-50.
177. Vannote, R.L., G.W. Minshall, K.W. Cummins, J. R. Sedell, and C. E. Cushing. (1980). The
River Continuum Concept. Can. J. Fish. Aquat. Sci. 37: 130-137. 178. Van Sickle, J., and R. L. Beschta. (1983). Supply-based models of suspended sediment transport
in streams. Water Resources Research 19: 768-778.
Pennypack Creek Watershed Comprehensive Characterization Report
Appendix P • References
P-14 • WCWCCR • Philadelphia Water Department.
June 2009
179. Voshell, Jr., J. R. (2002). A Guide to Common Freshwater Invertebrates of North America. Blacksburg, Virginia: The McDonald & Woodward Publishing Company.
180. Warnick, S.L., and H.L. Bell. (1969). The Acute Toxicity of some Heavy Metals to different Species of Aquatic Insects. J. Water Pollut. Control Fed. 41: 280-284.
181. Welch, E. B., J. M. Jacoby, R. R. Horner, and M. R. Seeley. (1988). Nuisance biomass levels of
periphytic algae in streams. Hydrobiologia 157: 161-168. 182. Wetzel, R. G. (2001). Limnology: Lake and River Ecosystems, 3rd Edition. Academic Press,
San Diego, 1006 pg. 183. Winterbourn, M. J. (1990). Interactions among nutrients, algae, and invertebrates in a New
Zealand mountain stream. Freshwater Biology 23: 463-474. 184. Wurtz, C. B. and B.G. Nicholas. (1965). A Biological Survey of the Wissahickon Creek.
Proceedings of the Pennsylvania Academy of Science Vol. XXXIX: 82-88. 185. Wynne, D. and G.-Y. Rhee. (1986). Effects of light intensity and quality on the relative N and P
requirement (the optimum N:P ratio) of marine phytoplanktonic algae. Journal of Plankton Research 8: 91-108.
186. Wynne, D. and G.-Y. Rhee. (1988). Changes in alkaline phosphotase activity and phosphate
uptake in P-limited phytoplankton, induced by light intensity and spectral quality. Hydrobiologia 160: 173-178.