Embed Size (px)
Citation preview

A World of Solutions
Material Recycling Facility Contract Development Phase I Report
Prepared for: City of Ann Arbor Prepared by: CB&I Environmental & Infrastructure, Inc. and Moore & Associates October, 2016
& Associates MOORE

A World of Solutions
Limitations
The findings of this report and assessment are based on the professional judgment of CB&I, based in part on the information directly or indirectly provided by third parties as specified in this report. CB&I does not warrant the accuracy or completeness of this information.
CB&I performed services, obtained findings, and developed opinions and conclusions in accordance with generally and currently accepted professional practices and standards governing recognized firms in the area engaged in similar work.
CB&I makes no legal conclusions or any representation concerning the legal significance of the findings of this report. CB&I has no contractual liability to any third party for the information or opinions in this report.

i Ann Arbor MRF - Phase I Report October, 2016
TABLE OF CONTENTS
SECTION PAGE 1.0 INTRODUCTION .......................................................................................................... 1 Methodology and Data Sources ................................................................................... 2 2.0 BACKGROUND ........................................................................................................... 3 City of Ann Arbor MRF ................................................................................................. 3 National MRF Overview ............................................................................................. 10 3.0 RECYCLABLE COMMODITY MARKETS ................................................................. 14 Historical MRF Revenues ........................................................................................... 14 Current Status and Future Market Trends .................................................................. 15 Mixed Paper ......................................................................................................... 15 Old Newspaper (ONP) .......................................................................................... 16 Old Corrugated Cardboard (OCC) ........................................................................ 16 Glass .................................................................................................................... 17 Metals................................................................................................................... 18 Plastics ................................................................................................................. 18 Summary .............................................................................................................. 19 4.0 MRF REVENUES ....................................................................................................... 21 Revenue Share and Tipping Fees (General Concepts) .............................................. 21 Revenue Share and Tipping Fees (City Contract) ...................................................... 23 Analysis (City Revenue Share) ............................................................................. 25 Transport to End Market Costs (Outbound Tonnage) ........................................... 25 Acquisition Costs (Inbound Tonnage) ................................................................... 25 Living Wage Adjustment ....................................................................................... 29 Summary .............................................................................................................. 29 Revenue Share and Tipping Fees (Other Contracts) .................................................. 30 Solid Waste Authority of Palm Beach County ....................................................... 31 Unified Government of Athens-Clarke County ...................................................... 31 City of Chicago ..................................................................................................... 32 Solid Waste Agency of Lake County ..................................................................... 33 Solid Waste Agency of Northern Cook County ..................................................... 33 Atlantic County Utilities Authority .......................................................................... 34 Cape May County Municipal Utilities Authority ...................................................... 34 Morris County Utilities Authority ............................................................................ 36 City of Milwaukee/Waukesha County ................................................................... 37 Summary .............................................................................................................. 39 MRF Revenues - Recommendations .......................................................................... 41
ii Ann Arbor MRF - Phase I Report October, 2016
TABLE OF CONTENTS (CONTINUED)
SECTION PAGE 5.0 MRF OPERATIONS AND MAINTENANCE ............................................................... 43 Current Condition of MRF........................................................................................... 43 City Inspection Reports ........................................................................................ 43 MDEQ Inspection Reports .................................................................................... 43 CP Manufacturing - Equipment Audits .................................................................. 44 Contractual Maintenance Responsibilities in MRF Contracts ...................................... 45 General Responsibilities of Contractor.................................................................. 46 Safety of Persons and Property ............................................................................ 46 Repair and Maintenance Costs ............................................................................ 46 Litter ..................................................................................................................... 49 Storage of Materials ............................................................................................. 50 Operations and Maintenance Plan ........................................................................ 51 Facility Conditions at End of Contract ................................................................... 51 Enforcement ............................................................................................................... 52 Permitting ................................................................................................................... 52 Assignment ................................................................................................................ 52 6.0 FACILITY THROUGHPUT ANALYSIS ...................................................................... 54 Observed Facility Storage Conditions ........................................................................ 59 Facility Throughput - Recommendations .................................................................... 62 7.0 ALTERNATIVE BUSINESS MODELS ....................................................................... 63 Private Ownership/Private Operation ......................................................................... 63 Public Ownership/Public Operation ............................................................................ 63 Public Ownership/Private Operation ........................................................................... 65 Recommendations ..................................................................................................... 66

iii Ann Arbor MRF - Phase I Report October, 2016
TABLE OF CONTENTS (CONTINUED)
TABLES PAGE Table 1 Inbound MRF Tonnages ..................................................................................... 4 Table 2 Inbound MRF Tonnages by Material Type.......................................................... 5 Table 3 Inbound MRF Tonnages by Source .................................................................... 7 Table 4 Composition of Processed Recyclables ............................................................. 9 Table 5 Summary MRF Statistics .................................................................................. 10 Table 6 Single-Stream MRF Throughput Data (MI/IN/OH) ............................................ 13 Table 7 Historical Per Ton Commodity Revenues ......................................................... 14 Table 8 Sample Index Model ........................................................................................ 22 Table 9 Example Model Analysis of City’s Revenue Share ........................................... 27 Table 10 Summary of Other Contracts Researched ........................................................ 30 Table 11 Revenue Share and Tipping Fee Provisions (Other Contracts) ........................ 40 Table 12 Capital Repair and Maintenance Costs (Contract Provisions) .......................... 47 Table 13 City of Ann Arbor - MRF Capital Reserve Fund ................................................ 48 Table 14 Summary Cost Data (Publicly-Operated MRFs) ............................................... 64 FIGURES PAGE Figure 1 City of Ann Arbor MRF and Transfer Station ...................................................... 3 Figure 2 Comparative Residential Recyclable Material Composition .............................. 10 Figure 3 Distribution of MRFs (Michigan/Indiana/Ohio) .................................................. 12 Figure 4 Changing Composition of Recyclable Material Stream ..................................... 19 Figure 5 Example Model Analysis of City’s Revenue Share ........................................... 28 Figure 6 Hourly Distribution ............................................................................................ 55 Figure 7 Confined Space Access in Pushwall ................................................................ 56 Figure 8 Discontinuity in Pushwall .................................................................................. 56 Figure 9 Tipping Floor Storage Requirements vs. Daily Throughput .............................. 58 Figure 10 Frequency Distribution of Daily Throughput Levels, By Year ............................ 59 Figure 11 Recyclable Material Outside the Building ......................................................... 60 Figure 12 Recyclable Material Outside the Building or Exceeding Stockpiles ................... 61 Figure 13 Litter Outside MRF Building ............................................................................. 62 APPENDICES Appendix A Ann Arbor MRF: Analysis of Historical Commodity Revenues Appendix B Ann Arbor MRF: Tipping Floor and Throughput Analysis Appendix C MRF Operators: Interview Summaries

1 Ann Arbor MRF - Phase I Report October, 2016
1.0 INTRODUCTION
CB&I Environmental and Infrastructure, Inc. (CB&I) and Moore & Associates (MAR) were retained by the City of Ann Arbor in March, 2016 to evaluate the City’s existing business model with respect to the City’s Material Recovery Facility (MRF) and transfer station. The facility was operated by a private vendor under a contract executed in November, 19931. The initial contract was amended ten times (including the addition of single-stream recycling capability), resulting in a 217-page contract document. Recognizing that there have been changes to the recycling market over time, the goal of this study is to evaluate alternative business models and develop a more streamlined contract that reflects current industry best practices and standards. The study commenced prior to the City terminating the contract with its operator and relies upon data and observations compiled prior to July, 2016.
The specific areas of interest to the City for this evaluation include the following:
Research and analysis of other single-stream processing contracts.
Analysis of municipal revenue share agreements.
Equitable methods for handling the volatility of recycling material prices.
Long-term demand and markets for recyclable materials.
Industry standards for responsible parties (e.g., owner, operator) for upkeep of buildings and equipment.
Industry standards for responsible parties for regulatory authorities and government agencies.
Evaluation of ownership and operation alternatives for the MRF/transfer station.
Evaluation of the tipping floor handling capacity of the City’s MRF.
The report is organized into the following chapters:
Chapter 2: Background information on the historical operations of the City’s MRF and industry statistics on other MRFs.
Chapter 3: Analysis of historical commodity trends and discussion of future markets.
Chapter 4: Analysis of revenue sharing options for MRF contracts.
Chapter 5: Analysis of maintenance and permitting responsibilities.
Chapter 6: Analysis of tipping floor handling capacity at the City’s MRF.
Chapter 7: Evaluation of ownership and operation alternatives.
1 The contract was terminated by the City in July, 2016. This study does not consider interim measures undertaken by the City subsequent to that date.

2 Ann Arbor MRF - Phase I Report October, 2016
Methodology and Data Sources
In performing its evaluation of the City’s MRF, the consultant team performed the following activities:
Met with City staff to review institutional factors that led to the development of the City’s recycling program and MRF, obtain historical data on tonnages processed, discuss MRF performance (financial and operational), and review the overall goals of the City for the MRF and future contract.
Performed a site tour of the MRF to observe operations.
Compiled and analyzed historical data on inbound loads of recyclables received by the MRF.
Compiled and analyzed historical data on outbound loads of recyclables processed by the MRF.
Obtained a national-level database of MRF facilities and analyzed facility data based on size, owner/operator arrangement, and other parameters, to provide context for the City’s MRF.
Reviewed the City’s contract for operation of the MRF.
Researched and analyzed other contracts for operation of single-stream MRFs, or for processing of single-stream recyclables at MRFs. Contracts were reviewed to identify revenue share provisions and maintenance/permitting responsibilities of owners and operators.
Researched and analyzed published historical commodity pricing data for comparison with commodity sales from the City’s MRF.
Reviewed 16 months of contractor invoices for the City’s MRF.
Performed interviews of industry participants to obtain perspectives on MRF operations.
Compiled and analyzed historical data on hourly arrival times for recyclables delivered to the City’s MRF.
Obtained drawings of the City’s MRF and prepared an evaluation of tipping floor handling capacity based on the hourly arrival of recyclables.
Reviewed City inspection reports at the MRF.

3 Ann Arbor MRF - Phase I Report October, 2016
2.0 BACKGROUND
City of Ann Arbor MRF
The City’s MRF and transfer station commenced operations in 1995. The recycling facility was originally developed as a dual-stream MRF, meaning that separate lines were used to sort containers and paper. In 2010, the MRF was converted to a single-stream recycling facility, meaning that containers and paper are processed over the same line. Single-stream recycling also refers to the collection of recyclables, in which households can use a single container to set out recyclables on collection day. Because of its convenience to residents, single-stream collection has grown throughout the U.S., and the City’s MRF was modified to adapt to that trend. The transfer station is used to consolidate waste delivered by collection vehicles (and intended for disposal) into larger semi-truck loads for transport to a landfill; the transfer station also handles non-recyclable residue materials from the MRF.
The MRF and transfer station are located adjacent to each other (refer to Figure 1). The MRF is approximately 37,700 square feet in size. The City’s compost facility is located to the southeast of the MRF and transfer station.
FIGURE 1. CITY OF ANN ARBOR MRF AND TRANSFER STATION

4 Ann Arbor MRF - Phase I Report October, 2016
Table 1 summarizes daily and annual tons of inbound recyclables received at the MRF for the period 2013-2015 and the first month of 20162. Incoming recyclables increased by 75 percent from 2013 to 2015 due to higher levels of third-party (i.e., non-City) tonnages sourced by the contracted operator. Approximately 98 percent of the incoming material is received during the normal workweek (Monday - Friday), although some material is received on Saturdays and, rarely, on Sundays.
TABLE 1. INBOUND MRF TONNAGES
2013 2014 2015 2016 (Jan)
Tons (All Days) Total (tpy) 43,668 61,915 76,803 5,122
Average (tpd) 158 231 282 244 Max (tpd) 289 435 466 304 Min (tpd) 4 3 6 127 Tons (Monday-Friday)
Total (tpy) 42,895 60,386 75,184 4,917 Average (tpd) 168 237 294 246 Max (tpd) 289 435 466 304 Min (tpd) 106 45 40 127 Tons (Saturday)
Total (tpy) 690 1,496 1,588 205 Average (tpd) 53 150 113 205 Max (tpd) 118 265 281 205 Min (tpd) 4 3 6 205 Tons (Sunday)
Total (tpy) 83 32 30 0 Average (tpd) 9 11 15 0 Max (tpd) 17 12 20 0 Min (tpd) 4 9 10 0 Source: 1. City inbound scale report. Notes: 1. tpy = tons per year; tpd = tons per day.
A common benchmark in the industry is the amount of recyclables handled per day (and expressed as tons per day, or tpd). Since the vast majority of recyclables are delivered during the normal workweek, the most relevant metric is the daily throughout for Monday - Friday. Average daily throughput increased from 168 tpd in 2013 to 294 tpd in 2015. The facility has received as much as 466 tons in a single day, which occurred in 2015.
2 This was the time period of inbound scale records obtained from the City.

5 Ann Arbor MRF - Phase I Report October, 2016
Table 2 shows a breakdown of the types of material delivered to the facility. Although primarily a single stream facility, the MRF also receives source-separated recyclables. The incoming material categories are based on the codes used in the inbound tonnage report. The classification of materials as residential or commercial was performed by CB&I and is an approximate estimate. In 2015, approximately 90 percent of the incoming material was estimated to be residential and 10 percent commercial.
TABLE 2. INBOUND MRF TONNAGES BY MATERIAL TYPE
Residential Material 2013 2014 2015 2016 (Jan) Single Stream 29,885.85 49,680.32 60,157.09 4,066.66 Transfer-Single Stream 68.37 219.01 6,179.90 640.52 Commingled 120.87 116.77 132.35 20.50 Newspaper #8 281.70 153.60 195.26 25.61 Aseptic 103.18 117.96 89.43 2.81 Glass-Mixed 6.80 0.00 0.00 0.00 PET 0.02 1.26 2.67 0.16 PET Baled 2.70 1.56 0.00 0.00 HDPE-Natural 9.24 1.71 1.29 0.05 HDPE-Mixed 0.20 0.45 0.18 0.08 HDPE-Colored 2.31 0.00 0.19 0.00 Plastic-3-7 Grades 282.77 18.80 0.00 0.00 Plastic-Mixed 2,618.28 2,940.48 2,013.82 2.36 Plastic-Rigid 0.00 0.00 9.40 0.00 Subtotal - Residential 33,382.29 53,251.92 68,781.57 4,758.75 % Residential (Estimated) 76.4% 86.0% 89.6% 92.9% Commercial Material
Commercial Single Stream 97.30 0.00 0.00 0.00 OCC - Dirty 7,027.19 6,243.75 5,892.01 213.06 OCC -Pre Sorted 2,788.03 2,107.56 1,969.53 137.42 Sorted Office Waste 361.76 306.42 159.60 12.49 Ferrous Metals 11.14 0.00 0.00 0.00 Steel Shredding 0.00 5.31 0.00 0.00 Subtotal - Commercial 10,285.42 8,663.04 8,021.14 362.97 % Commercial (Estimated) 23.6% 14.0% 10.4% 7.1% Total 43,667.70 61,914.96 76,802.71 5,121.72 % Delivered as Single Stream 69.1% 80.8% 86.5% 92.3% Source: 1. City inbound scale report. Notes: 1. Classification of material as residential or commercial is approximate.

6 Ann Arbor MRF - Phase I Report October, 2016
Table 3 summarizes historical deliveries of incoming recyclables by source of material. The tonnage delivered by the City has remained relatively stable, amounting to approximately 15,000 tons per year. In 2015, the City accounted for approximately 20 percent of the total material received at the MRF. In 2013, when third-party tonnage was significantly lower, the City accounted for 34 percent of incoming tonnage.
Tonnages from Recycle Ann Arbor (drop-off facility and special collections) have generally ranged from 300 to 400 tons per year, and amounted to 0.5 percent of the total MRF tonnage in 2015.
Local universities provided approximately 2.5 percent of the MRF’s tonnage in 2015. Between 2013 and 2015, recyclable tonnages from these universities was relatively stable, but in late 2015 and continuing into 2016, the University of Michigan began to divert tonnage to another MRF. Based on discussions with City staff, the material was sent to the Western Washtenaw Recycling Authority’s MRF because the University received more favorable pricing terms.
Most of the growth in MRF tonnage between 2013 and 2015 stems from recyclable tonnages received from other cities, notably the City of Lansing and the City of Toledo (in Ohio). In 2015, tonnage from Toledo amounted to 29 percent of total MRF tonnage, and the tonnage from all outside cities amounted to 38 percent of MRF tonnage.
ReCommunity, the previously contracted operator of the MRF, also delivered increasing quantities of recyclables from other ReCommunity sites in Michigan. Principally, these materials came from the company’s location in Saginaw, and smaller amounts from the company’s location in Roseville (based on data in the inbound tonnage scale report). In 2015, the tonnage delivered from other ReCommunity locations amounted to just under 10 percent of the total handled at the MRF.
Recyclables were also delivered by large private haulers (including Advanced, Republic and Waste Management) and small private haulers. Large hauler tonnage increased steadily between 2013 and 2015 and accounted for approximately 23 percent of total MRF throughput in 2015. Tonnage from smaller haulers decreased between 2013 and 2015 and accounted for just over 3 percent of total MRF tonnage in 2015. Based on the inbound scale report, this hauler tonnage originates from both the Ann Arbor area as well as the Detroit area.
Recyclables were also sourced from other commercial businesses, and the tonnage from these commercial entities amounted to 3.5 percent of total MRF throughput in 2015. The material was obtained from as many as 25 businesses during the period 2013-2015, although not from all of them each year. One business accounted for approximately 60-75 percent of commercial establishment tons between 2013 and 2015.

7 Ann Arbor MRF - Phase I Report October, 2016
TABLE 3. INBOUND MRF TONNAGES BY SOURCE
Source of Material 2013 2014 2015 2016 (Jan) 2015 (%)
City Of Ann Arbor Subtotal 14,252 14,724 14,714 1,169 19.2%
Recycle Ann Arbor Drop Off / Special Collections 414 331 373 27 0.5% Local Universities University Of Michigan 2,426 2,435 1,699 23 2.2% Washtenaw Community College 78 80 81 8 0.1% Eastern Michigan University 195 187 175 13 0.2% Subtotal 2,698 2,702 1,955 44 2.5% Other Cities City Of Lansing 608 4,111 6,177 565 8.0% City Of Taylor 12 0 0 0 0.0% City Of Toledo 2,374 16,360 22,301 961 29.0% City Of Ypsilanti 826 846 370 0 0.5% County of Lenawee 218 237 306 31 0.4% RRRASOC 0 448 373 9 0.5% Subtotal 4,038 22,002 29,527 1,566 38.4% Other ReCommunity Sites Subtotal 68 238 7,553 641 9.8% Large Haulers Subtotal 14,078 15,769 17,527 1,373 22.8% Small Haulers Subtotal 3,775 2,191 2,491 261 3.2% Other Recyclers/Commercial Subtotal 3,927 3,790 2,651 40 3.5% Walk-in Subtotal 418 167 12 1 0.0% Total
43,668 61,915 76,803 5,122 100.0%
Source: 1. City inbound scale report. Notes: 1. Large Haulers: Advanced Disposal, Republic Services, Waste Management. 2. Small Haulers: 1-800-Got-Junk, Alchin’s Disposal, Canton Waste, Duncan Disposal Systems,
Emmons Service, Granger Recycling Center, Modern Waste Systems, Northwest Refuse, Stevens Disposal & Recycling.

8 Ann Arbor MRF - Phase I Report October, 2016
Table 4 summarizes outbound tonnages of processed recyclables by commodity (based on the City’s outbound scale report). Data is summarized for 2015 and the first quarter of 2016 (January - March)3.
The commodity tonnages shown for total outbound materials represent both residential and commercial recyclables. A separate estimate of the composition of residential recyclables is also provided. The residential estimate was calculated by excluding the Sorted Office Waste and Metal for Shredding categories, and by subtracting the amount of inbound corrugated that is received in generally a source separated state (and assumed to originate from commercial generators of corrugated4). Estimates of residue remaining after the recyclables are processed are also shown5.
Comparing the data in Table 1 with Table 4 indicates that total inbound shipments of 76,803 tons in 2015 exceeded outbound shipments of processed recyclables and residue, which amounted to 70,949 tons in 2015. This may be due to processed material being held in inventory at the MRF and awaiting shipment to end markets.
The data in Table 4 also suggest that more paper was recovered as a mixed paper grade versus a newspaper grade in the first quarter 2016. For residential materials, recovered mixed paper was 14 percent of outbound tonnage in Q1-2016 versus an average of 6.5 percent in 2015. Newspaper, in contrast, was 33.6 percent of outbound tonnage in Q1-2016 versus 38.7 percent in 2015. As is discussed in Chapter 2 of this report, there has been a trend among MRFs toward producing more mixed paper versus newspaper.
3 The City’s outbound scale report included data for 2012 through March, 2016. However, glass shipments were generally excluded from the report. As a result, contractor invoices were reviewed for 2015 and the first quarter of 2016 to obtain data on glass tonnages.
4 Tonnages for inbound, source-separated corrugated were obtained from the City’s inbound scale report (2015) and contractor invoices (January - March, 2016).
5 Residue rates were estimated based on a review of contractor invoices.

9 Ann Arbor MRF - Phase I Report October, 2016
TABLE 4. COMPOSITION OF PROCESSED RECYCLABLES
Material
Total Outbound Materials Estimated Residential Materials 2015
(tons) (%) 2016-Q1
(tons) (%) 2015
(tons) (%) 2016-Q1
(tons) (%)
Mixed Paper 3,983 5.6% 2,073 12.7% 3,983 6.5% 2,073 14.0%
Newspaper 23,673 33.4% 4,985 30.6% 23,673 38.7% 4,985 33.6%
Corrugated 15,709 22.1% 3,370 20.7% 7,835 12.8% 2,233 15.1%
Sorted Office Waste 272 0.4% 75 0.5% 0 0.0% 0 0.0%
Aseptic Packaging 79 0.1% 20 0.1% 79 0.1% 20 0.1%
Aluminum 176 0.2% 28 0.2% 176 0.3% 28 0.2%
Ferrous 1,401 2.0% 342 2.1% 1,401 2.3% 342 2.3%
Glass 12,355 17.4% 2,853 17.5% 12,355 20.2% 2,853 19.2%
Polyethylene 2,128 3.0% 387 2.4% 2,128 3.5% 387 2.6%
HDPE Colored 525 0.7% 115 0.7% 525 0.9% 115 0.8%
HDPE Natural 601 0.8% 128 0.8% 601 1.0% 128 0.9%
Plastics #3-#7 253 0.4% 151 0.9% 253 0.4% 151 1.0%
Plastics Mixed 925 1.3% 0 0.0% 925 1.5% 0 0.0%
Plastics Rigid 387 0.5% 46 0.3% 387 0.6% 46 0.3%
Metal for Shredding 559 0.8% 114 0.7% 0 0.0% 0 0.0%
Residue 7,924 11.2% 1,617 9.9% 6,829 11.2% 1,471 9.9%
Total 70,949 100% 16,302 100% 61,149 100% 14,831 100.0% Sources: 1. City outbound scale report (for most material tonnages) 2. Residue rates estimated based on contractor invoices. Notes: 1. Glass tonnages were obtained from contractor invoices because glass was generally not reported in the
City outbound scale report. 2. Composition of residential material is estimated based on excluding Sorted Office Waste and Metal for
Shredding, and subtracting inbound tonnages of corrugated that are received as source-separated.
Figure 2 shows a comparison of the estimated residential recyclable material composition at the City’s MRF versus U.S. average composition data. In general, the compositions are similar, with some relative differences in the amounts of paper (newspaper and mixed paper), glass and residue.
Newspaper and mixed paper are a greater proportion of the processed recyclables at the City’s MRF -- 46 percent versus 40 percent for the U.S. average.
Glass is a higher proportion of the processed recyclables at the City’s MRF -- 20 percent versus 15 percent for the U.S. average. Glass is a challenging commodity to process at single-stream MRFs and to market.
Residue rates at the City’s MRF, at 11 percent, are lower than the U.S. average of 15 percent. This is a good outcome, as contamination in single stream recyclables has been a growing challenge for MRF operators.

10 Ann Arbor MRF - Phase I Report October, 2016
FIGURE 2. COMPARATIVE RESIDENTIAL RECYCLABLE MATERIAL COMPOSITION
National MRF Overview
To obtain further background and perspective on the City’s MRF, a national database of MRF facilities compiled by Governmental Advisory Associates (GAA) was researched and analyzed. According to the GAA database, there are approximately 508 MRFs in the United States, including dual-stream MRFs, single-stream MRFs, mixed-waste MRFs, and hybrids. Of the 508 total facilities, 327 are characterized as single-stream facilities. Summary statistics on the single-stream facilities are presented in Table 5.
TABLE 5. SUMMARY MRF STATISTICS
Owner/Operator # Facilities Average Throughput
(tons per year) Average Building Size
(square feet)
Public/Public 41 21,077 44,190
Public/Private 40 44,548 44,706
Private/Private 246 70,441 72,434
Total/Average 327 61,056 64,580
Source: 1. Governmental Advisory Associates, Inc. 2016-2017 Database on Material Recovery Facilities
and Mixed Waste Processing Facilities in the U.S. Notes: 1. Of the 327 single-stream facilities surveyed by GAA, 318 provided throughput data and 253
provided building size data.
ONP/Mixed40%
OCC15%
PET/HDPE5%
Metals4%
Glass15%
Other6%
Residue15%
U.S. Average MRF
ONP/Mixed46%
OCC13%
PET/HDPE5%
Metals3%
Glass20%
Other2%
Residue11%
City of Ann Arbor MRF
Sources:1. U.S. Average: William Moore & Peter Engle, White Paper: Demystifying MSW Recovery Rates, June, 2016.2. City of Ann Arbor: City outbound scale report and contractor invoices.Notes:1. ONP = newspaper, OCC = corrugated.2. Other includes plastics #3-7, rigid plastics and aseptic paper.

11 Ann Arbor MRF - Phase I Report October, 2016
The following points summarize the statistics from Table 5:
The majority (75 percent) of single-stream MRFs are owned and operated by private companies, with the remainder being publicly-owned and operated (13 percent) or publicly-owned and privately-operated (12 percent).
In terms of throughput, the publicly-owned and operated facilities are smaller, processing on average about 21,000 tons per year of recyclables. Publicly-owned and privately-operated facilities handle more tonnage, approximately 45,000 tons per year. Privately-owned and operated facilities are the largest in terms of throughput, handling 70,000 tons per year on average.
In terms of building size, publicly-owned MRFs average approximately 44,000 square feet, and are comparable whether publicly-operated or privately-operated. Privately-owned MRFs are larger, averaging approximately 72,000 square feet in size.
For comparison and as noted before, the City’s MRF is publicly-owned and privately-operated. The MRF building is approximately 37,700 square feet in size, somewhat smaller than the average for publicly-owned MRFs. The City’s MRF processed approximately 44,000 tons in 2013, and 77,000 tons in 2015, and so by throughput the City’s MRF handles more tonnage than the average publicly-owned MRF.
Figure 3 shows the distribution of MRFs in the three-state region comprising Michigan, Indiana and Ohio. As noted previously, a significant amount of the recyclables processed at the City’s MRF originated from Toledo, Ohio, and so recyclables are sometimes transported across state lines for processing. Some of the facilities shown on the map may be serving as transload sites instead of actively process materials. For instance, as was noted previously, ReCommunity was transporting recyclables from Saginaw to be processed at the City’s MRF.

12 Ann Arbor MRF - Phase I Report October, 2016
FIGURE 3. DISTRIBUTION OF MRFs (MICHIGAN/INDIANA/OHIO)
MichiganM1 Ann ArborM2 Western WashtenawM3 Recommunity HuronM4 RRRASOCM5 Royal OakM6 SOCCRAM7 Recommunity RosevilleM8 Kent CountyM9 WestshoreM10 Republic (Muskegon)M11 MichianaM12 Recycle America (Saginaw)M13 Recommunity (Saginaw) M14 Isabella CountyM15 American WasteM16 Emmet CountyM17 Alpena County
OhioO1 Bowling Green Recycle CenterO2 Werlor WasteO3 Hancock CountyO4 Wyandot CountyO5 Van Wet CountyO6 Auglaize CountyO7 Shelby CountyO8 Logan CountyO9 Union County RecyclersO10 Rumpke (Columbus)O11 Lorain CountyO12 KimbleO13 Waste Management (Akron)O14 Rumpke (St. Bernard)O15 Adams-Brown CountyO16 Athens-Hocking
IndianaI1 Waste AwayI2 Republic (Ft. Wayne)I3 City of HammondI4 East Central RecyclingI5 Republic (Indianapolis)I6 Wabash ValleyI7 Republic (Bloomington)I8 Tri-StateI9 Perry CountyI10 QRS Recycling
Detroit
Lansing
Grand Rapids
Ann Arbor
ToledoCleveland
Cincinnati
Columbus
AkronFt. Wayne
50 miles
SCALE
M3
M11
M9
M5
M2
M15
M8
M4
O16
O15
O2O1
O9
O11
I10
I4
I1
I5
I8
M1
O14
O10
O13O12
I2
I3
I6
I7
I9
O3O4O5
O6
O7O8
M6
M7
M10M13
M14
M16
M17
M12
Single Stream
Other MRF

13 Ann Arbor MRF - Phase I Report October, 2016
Summary throughput data for the single-stream MRFs shown in Figure 3 are presented in Table 6. During the period 2013-2015, the City’s MRF processed tonnage at or above the average for other MRFs located in the three-state region, and was one of the largest single-stream MRFs (by throughput) in the State of Michigan.
TABLE 6. SINGLE-STREAM MRF THROUGHPUT DATA (MI/IN/OH)
Facility Map Key State Owner (Operator, if Different Entity)
Throughput (tons per year)
Ann Arbor M1 MI Ann Arbor (ReCommunity) 44,000 - 77,000
Western Washtenaw M2 MI Western Washtenaw Recycling Authority 6,600
ReCommunity-Huron M3 MI ReCommunity 71,500
RRRASOC M4 MI RRRASOC (ReCommunity) 60,000
SOCCRA M6 MI SOCCRA 18,000
Kent County M8 MI Kent County 37,180
Westshore M9 MI Westshore Transfer and Recycling 24,000
Michiana M11 MI Michiana Disposal and Recycling 9,200
American Waste M15 MI American Waste 20,250
Waste Away I1 IN Waste Away Inc. 63,960
Republic (Ft. Wayne) I2 IN Republic Services 47,133
East Central Recycling I4 IN Best Way Disposal - East Central Recycling 11,750
Republic (Indianapolis) I5 IN Republic Services 17,000
Tri-State I8 IN Tri-State Resource Recovery 13,383
QRS Recycling I10 IN Riverside Recycling 132,000
Bowling Green Rec. Ctr. O1 OH Bowling Green Recycling Center, Inc. 3,000
Werlor Waste O2 OH Werlor, Inc. 8,000
Union County Recyclers O9 OH Union County Recycling 5,500
Rumpke (Columbus) O10 OH Rumpke Waste Collection & Recycling Syst. 65,000
Lorain County O11 OH Republic Services 65,000
Kimble O12 OH Kimble Transfer and Recycling 60,000
Waste Mgt. (Akron) O13 OH Waste Management 84,090
Rumpke (St. Bernard) O14 OH Rumpke Waste Collection & Recycling Syst. 188,285
Adams-Brown County O15 OH Adams-Brown Community Action Partnerships 1,144
Athens-Hocking O16 OH Athens-Hocking Recycling Center, Inc. (NFP) 4,139
Average 43,725
Source: 1. Governmental Advisory Associates, Inc. 2016-2017 Database on Material Recovery Facilities and Mixed
Waste Processing Facilities in the U.S. (except for Ann Arbor and SOCCRA). Notes: 1. As of the date of this report, Waste Management is temporarily transloading recyclables from the Ann Arbor
MRF to its MRF in Akron, Ohio. ReCommunity formerly operated the facility. 2. RRRASOC = Resource Recovery and Recycling Authority of Southwest Oakland County. 3. SOCCRA = Southeastern Oakland County Resource Recovery Authority. Converting to single-stream. 4. Athens-Hocking Recycling Center, Inc. is a not-for-profit organization.

14 Ann Arbor MRF - Phase I Report October, 2016
3.0 RECYCLABLE COMMODITY MARKETS
This chapter examines the revenue stream for MRFs, which is primarily obtained through the sale of processed recyclables. We begin the analysis by reviewing historical commodity revenues from the prior operating agreement, then provide analysis and commentary on markets going forward.
Historical MRF Revenues
The economics of recycling have always been subject to fluctuations in the market prices for materials. In recent years, the revenues from commodities processed through the City’s MRF have been negatively impacted by market trends, as has the entire recycling industry. Table 7 summarizes the average selling price per ton of the principal recyclables recovered by the MRF, based on transaction data contained in the City’s outbound scale report.
For some commodities, such as newspaper and corrugated, the overall trend was generally downward between 2012 and the first quarter of 2016. For other commodities, such as aluminum and HDPE, selling prices increased between 2012 and 2014, but then declined thereafter. For nearly all the commodities, prices were lower in the first quarter of 2016 versus 2012, with ferrous and PETE experiencing the largest declines.
TABLE 7. HISTORICAL PER TON COMMODITY REVENUES
Average Price Per ton Change 2012-2016 Material 2012 2013 2014 2015 2016-Q1
Aluminum $1,358 $960 $1,576 $1,412 $1,160 -15% Asceptic $96 $74 $69 $60 $65 -32% Ferrous $237 $220 $233 $112 $61 -74% Glass $4 $4 NA $1.50 $1.50 -63% HDPE-Colored $509 $447 $600 $477 $413 -19% HPDE-Natural $657 $723 $953 $624 $568 -13% PETE $440 $394 $355 $230 $154 -65% Plastics (#3-#7) $59 $32 $62 $45 $62 4% Mixed Paper $67 $65 $55 $50 $58 -14% Newspaper $88 $73 $67 $63 $62 -30% Corrugated $103 $105 $96 $86 $83 -19% Sorted Office Waste $163 $120 $132 $136 $115 -29% Source: 1. City outbound scale report. Notes: 1. Average price per ton based on gross sales proceeds. Newspaper, mixed paper, corrugated,
and glass incurred transportation costs to markets, not reflected in the above prices. 2. NA = data not available.

15 Ann Arbor MRF - Phase I Report October, 2016
To further evaluate historical commodity pricing, the per ton revenues on recyclables from the City’s MRF were compared against Midwest regional market prices tracked by RISI (fiber materials) and Secondary Fiber/Materials Pricing (fiber materials and containers). The detailed analysis is contained in Appendix A. In general, the selling prices received for the commodities processed through the City’s MRF are in line with regional market prices during the timeframe 2012 to 2016 (first quarter).
Current Status and Future Market Trends
This section identifies the factors that impact market performance for recyclable commodities and summarize current conditions. Market trends and the future of recycling markets for recovered commodities are challenging to predict, as they depend on manufacturing demand for recycled materials and are influenced by overall economic conditions. However, a number of observations are made from the substantial amount of historical data on recycling markets and the composition of recovered materials relative to consumer behaviors.
In general, the composition of the recovered materials stream is in flux due to many factors, including:
The increase in use of digital versus hard copy communications;
The decline in printed newspaper readership;
More products and packaging made using plastic;
Light-weighting of products and containers;
Redesign of packaging; and
An increase in online shopping with direct home delivery.
These changes, in addition to market factors specific to particular recyclable commodities, create challenges in the marketplace for defining and predicting the value of recyclable materials for both a city and a processing operator, as is being experienced by MRFs nationwide.
The following sections identify a number of the market trends and drivers for the principal recyclable commodities recovered from the Ann Arbor MRF.
Mixed Paper
The U.S. Mixed Paper market is highly dependent on export demand. A large percentage of Mixed Paper collected in the U.S. is exported to China. There are limited domestic mills using large quantities of Mixed Paper/Residential Mixed Paper (RMP, which is now the predominant subgrade of Mixed Paper). One of the newest, large users of Mixed Paper is the Pratt mill in Valparaiso, Indiana, in reasonably close proximity to Ann Arbor. Having a regional, Midwest outlet for Mixed Paper is a benefit for MRFs in the region. Pratt was historically a market for RMP from Ann Arbor; Pratt also sources RMP from Waste Management’s Akron MRF.
While current and recent past conditions in the Mixed Paper market are good, there is potential for there to be a supply glut in the grade in the future. Based on Moore &

16 Ann Arbor MRF - Phase I Report October, 2016
Associates (MAR) ongoing work in the Mixed Paper market and other industry sources6, more cities are producing RMP versus ONP from their MRFs and the supply of the grade overall is growing steadily. Demand for Mixed Paper in both the export and domestic markets is limited and is not expected to grow much going forward, thereby leading to the possibility of an over-supply of Mixed Paper in the market.
MAR expects there will be times in the market when supply gluts will occur and prices will fall sharply, including possibly times when even movement of the grade will be difficult. The Mixed Paper market has historically experienced these conditions from time to time; for example, in the first quarter of 2009 there was a market collapse and Mixed Paper backed up and couldn’t be sold. It is important for a MRF to be set up to produce the highest quality Mixed Paper as possible to insure good material movement.
Noting the cautions above, the general Mixed Paper market over the five to ten year time frame looks reasonably well balanced over the full pricing cycle. A key factor for the Mixed Paper market is the OCC market (see discussion on this grade below). When OCC pricing is up, Mixed Paper prices are generally up.
Old Newspaper (ONP)
The only major source of ONP is newspapers. Because of the decline in the readership of printed newspapers, both the supply of and demand for this grade have been steadily decreasing over the last 15 years. However, because of the constrained and declining supply, and some incremental increase in demand, the ONP market should remain in reasonable balance and even experience good strength at times going forward7.
On the demand side, in addition to use in newspapers/newsprint mills, there is growing global demand for ONP in boxboard (‘gray cardboard boxes’, as compared to brown corrugated boxes which use almost exclusively OCC) where it is about 20 percent of the fiber recipe. Recovered ONP also has a series of other small uses, including molded fiber products (egg cartons, other packaging/cushioning), cellulose insulation, and ceiling tiles. Many of these uses (except boxboard) require very high quality ONP, which few residential recycling programs are currently producing based on MAR’s work in the ONP market and for ONP consumers. Producing high quality ONP will insure a strong market for a city’s ONP, and it may command a premium price going forward.
Old Corrugated Cardboard (OCC)
OCC is expected to be one of the strongest priced paper commodities over the next five to ten years. The demand for OCC is being fueled by both domestic and export mills using OCC to produce recycled fiber based containerboard, which is made into corrugated boxes. Good examples of increased regional demand in close proximity to Michigan are the Pratt Industries (Valparaiso, Indiana) and Alsip Minimill (Chicago area) mills, which were both started up over the last year. Notable about the Pratt mill is that they use limited quantities of OCC, much preferring RMP.
6 Resource Recycling, Negotiating the Single Stream, April 2015. 7 During the period for which detailed invoices were reviewed (January 2015 through March
2016), after adjusting for transportation costs ONP was priced at a $1.85 per ton premium compared to mixed paper.

17 Ann Arbor MRF - Phase I Report October, 2016
The U.S. corrugated box demand is healthy for a variety of reasons, one major one being direct to home shipments of goods purchased on-line. This is good for OCC demand, and it is also an opportunity for cities to push for increased recovery from households.
Glass
Glass recycling in single stream collection is challenging across the U.S., primarily because of increased program and MRF operating costs and contamination to other recyclable commodities. However, because of the significant weight of glass, it is not yet clear what the differential might be for programs with and without glass when evaluated on a per-ton processing cost basis. The larger impact may be the lack of good revenue outlets for the material. It is possible going forward that some MRF operators may propose two different processing costs, one with glass in the program and one with glass excluded from the program.
The following points summarize the issues associated with glass recycling in single stream programs:
Glass is a large fraction of the recyclables stream, by weight.
Glass is a costly item to process at a single stream MRF because of equipment wear and safety issues.
Glass can downgrade the quality of other recyclables produced in a single stream MRF due to contamination of the other streams by broken glass.
Glass markets for residential three-mix color are quite poor, even if the glass from a single stream MRF can be utilized as a commodity. In many instances, glass results in a cost, rather than sales revenue. Segregating glass by color to improve its commodity value requires a significant capital investment at the MRF, and the revenues from color sorted glass may not cover the costs of that investment8.
Much of the glass from single stream MRFs is not utilized for its material commodity value in the production of new glass containers. Glass is instead often used as alternate daily cover or as fill material. With intensive capital investment and further processing, glass is used in fiberglass manufacturing or for production of sandblast media.
Some communities are establishing alternate collection approaches for glass recycling, moving glass from commingled curbside collection to drop-off based options.
Removing glass from a program that has a long operating history can be difficult, particularly from a resident viewpoint for several reasons, including the implementation of a major behavioral change; the decrease in convenience if alternate collection (e.g., drop-off) is encouraged rather than curbside recycling; and the perception that the recycling program is being downgraded.
8 Waste 360, More Takeaways from the 2016 Waste360 Recycling Summit, September 23, 2016. At this industry conference, a representative of Owens-Illinois, a manufacturer of glass containers, indicated that the price of virgin cullet is so low that it’s hard to recycle glass and make money.

18 Ann Arbor MRF - Phase I Report October, 2016
Metals
Metals in the recycling stream include ferrous metals and aluminum. While ferrous metals are the most recycled material domestically and globally, market changes in recent years, including reduced global demand and higher quality expectations, have resulted in significant declines in export volumes9. Based on export data reported by the Institute for Scrap Recycling Industries, Inc. (ISRI), ferrous exports peaked in 2011 and have shown year to year drops since10. The greatest decline has been noted in exports to China, due to increased local supply, greater environmental regulation, and reduced scrap demand. In addition to declining volume, the value of exported metal scrap has also dropped due to weaker demand11. In the U.S., ferrous scrap consumption has been steady from 2010 to 2014.
Scrap aluminum has a large market base due to its light weight, durability, and perpetual recyclability. Aluminum demand worldwide has increased significantly, with aluminum exports nearly tripling from 2004 to 2014. Domestically, of the aluminum consumed in the U.S., approximately one-third is produced from old aluminum scrap such as used beverage containers and obsolete products12, driven by the energy savings resulting from the use of recovered versus virgin aluminum. Domestic and global demand for aluminum scrap is expected to continue in the future.
Plastics
Plastic bottle recycling grew substantially from 2003 to 2013, with tons recycled doubling and recycling rates growing from 20 percent to 31 percent13. While export has been common for many plastics, export markets have been in decline as a result of increased global supply and higher quality demands for mixed resins. Further challenging plastic recycling is the relation to oil prices; when oil prices are low, more virgin plastic is produced. This is resulting in a growing over-supply of recovered plastics with insufficient demand for the lower quality product (when compared to higher quality obtained from use of virgin material)14.
Additional challenges to the recycling of recovered plastics are resulting from the continued lightweighting of plastic containers. This results in lighter bales, and the recovered ton of plastic consumes more volume, increasing transportation costs to markets. There is also a trend towards more diversity in plastics and mixed resins, which are replacing traditional plastics such as HDPE and PET in some applications15. As a result, traditional HDPE and PET plastics, when produced as a clean material stream at a MRF, are seeing increased revenue after a sustained drop16.
9 Resource Recycling, Double-digit Decreases in Exports of Some Materials, March 28, 2016. 10 Institute of Scrap Recycling Industries (ISRI), The ISRI Scrap Yearbook 2015, undated. 11 ISRI, Recycling Economics and Markets: Scrap Recycling Industry Trends and Outlook,
presented at Carolina Recycling Association 2014 Annual Conference, April 1, 2014. 12 ISRI, The ISRI Scrap Yearbook 2015, undated. 13 ISRI, The ISRI Scrap Yearbook 2015, undated. 14 Waste 360, Industry Experts Speak on Paper and Plastic Recycling Trends, Challenges and
Opportunities, May 31, 2016. 15 Resource Recycling, Negotiating the Single Stream, April 2015. 16 Waste 360, Industry Experts Speak on Paper and Plastic Recycling Trends, Challenges and
Opportunities, May 31, 2016.

19 Ann Arbor MRF - Phase I Report October, 2016
Summary
Some of the trends in recyclable materials noted above were reiterated at the recent Waste360 Recycling Summit held in September, 201617. Figure 4 shows composition estimates of the material handled by typical MRFs for 2010 and 2015, as well as projections of how the composition may change by 2020. Note that compositions are shown as a percentage of total incoming MRF material.
FIGURE 4. CHANGING COMPOSITION OF RECYCLABLE MATERIAL STREAM
Some of the overall trends noted at the conference are as follows:
Newspaper has been a declining fraction of MRF tonnage, decreasing from 54 percent of total material in 2010 to 37 percent in 2015, with a further projected decline to 23 percent in 2020.
Corrugated (OCC) has been a growing portion of the material stream processed at MRFs, increasing from 11 percent of total material in 2010 to 21 percent in 2015, with a further projected increase to 25 percent in 2020.
17 Waste 360, More Takeaways from the 2016 Waste360 Recycling Summit, September 23, 2016.
8% 15% 11% 23%
27%
27%30%
29%
11%
21% 13%
25%
54%
37%
46%
23%
Typical MRF (2010) Typical MRF (2015) Ann Arbor (2015) Typical MRF (2020)0%
20%
40%
60%
80%
100%
Perc
ent o
f Com
posi
tion
Residue Containers Corrugated (OCC) Newspaper
Sources:1. Typical MRF: Waste 360, More Takeaways from the Waste360 Recycling Summit, September 23, 2016.2. Ann Arbor MRF: adapted from Figure 2.

20 Ann Arbor MRF - Phase I Report October, 2016
Residue increased from 8 percent in 2010 to 15 percent in 2015, with a further increase to 23 percent projected for 2020. The increase in residue was attributed to a number of factors, including “wish-cycling,” in which people with good intentions throw more non-recoverable items into their recycling carts because they think or want the items to be recycled, as well as an increase in mixed plastic materials that are difficult to process and recycle.
Overall, there has been a light-weighting of the recyclable material stream due to the increased quantities of plastics and OCC and lower quantities of newspaper. One industry participant indicated that the lower average density of incoming recyclables means that a MRF previously rated at 30 tons-per-hour processing capacity would now be effectively a 25 ton-per-hour facility.

21 Ann Arbor MRF - Phase I Report October, 2016
4.0 MRF REVENUES
This section reviews revenue share provisions in MRF contracts, beginning with an overview of general concepts. The report then analyzes elements of the revenue share contained in the City’s prior operating agreement18. For comparison, revenue share provisions in other MRF operating contracts are then discussed. Although this chapter focuses on revenues, operating expenses are also discussed because MRF operating costs are often incorporated into the revenue share agreement.
Revenue Share and Tipping Fees (General Concepts)
Before addressing the revenue share provisions of the City’s MRF operating agreement and comparing with other MRF contracts, it is useful to discuss some general parameters of such contracts.
Generally, there are two types of MRF contracts entered into by units of government:
A government entity that owns a MRF may contract with a private company to operate the MRF and (usually) market the processed recyclable.
A government entity that does not own a MRF may contract with a privately-owned and operated MRF to process and market the community’s recyclables.
The owner/operator of a MRF seeks to cover the costs of processing recyclables (e.g., labor, utilities, supplies such as baling wire, equipment maintenance, etc.), capital costs (e.g., the investment in the MRF building and processing equipment), administrative costs and, if a private operator, a profit. In the City’s case, the building and process equipment have already been paid for, so capital costs are removed from the equation, though on-going investment will be required to repair and/or replace equipment.
One option to cover these costs would be to charge the customers of the MRF a tipping fee. This would be similar to other types of solid waste facilities such as transfer stations and landfills.
However, MRFs earn revenues from the sale of processed recyclables, which can be used to defray some or all of the operating costs and, if commodity markets are good, more than cover those costs. The revenues from the sale of processed recyclables are typically incorporated into MRF agreements through a revenue sharing provision. So, for example, a revenue share agreement might state that the contractor and unit of government will share in the average commodity revenue (expressed in dollars per ton) above a certain threshold price (also called a “trigger” price). To continue the example, the trigger price might be established in the contract as $75/ton, and the contractor might earn 20 percent of the average commodity revenue above $75/ton and the unit of government the other 80 percent. The trigger price (in this example, $75/ton) is typically related to the cost to process the recyclable material.
18 CB&I and MAR understand that some of the provisions of the City’s operating agreement are in dispute. Our analysis makes certain assumptions with respect to contract provisions, but does not represent a final or legal interpretation of the operating agreement.

22 Ann Arbor MRF - Phase I Report October, 2016
The trigger price and the percentage of revenue shared with the unit of local government are interconnected and ultimately subject to the bidding and/or negotiation of the MRF contract. Generally, one would expect a larger revenue share to the unit of government if the trigger price is higher. With the decline in commodity markets, private MRF operators have indicated a preference for covering their operating costs (and, for privately-owned MRFs, their capital costs) and for sharing commodity risk with the unit of government, thereby placing greater emphasis on the trigger price. Local units of government also want to manage their exposure to commodity markets.
There are other variables that can be incorporated into the revenue share agreement:
The average commodity revenue can be based on the actual revenues received from the sale of the processed recyclables (termed an “actual sales” model). Alternatively, average commodity value can be based on market pricing data published by RISI or Secondary Materials Pricing (referred to as an “index” or “market basket” model). In the latter instance, the composition of the recyclables is periodically assessed by performing a sorting study of a sample of recyclables from the unit of government, to which the published market values are applied to compute a weighted average value of the single-stream recyclables. The market values are updated monthly, the composition estimates less frequently. A sample of an index model is provided in Table 8:
TABLE 8. SAMPLE INDEX MODEL
Commodity Market Value ($/ton) Composition Wtd. Avg. Value ($/ton)
Newspaper #8 $50.00 40.15% $20.08
OCC #11 $65.00 10.96% $7.12
Mixed Paper #2 $45.00 6.94% $3.12
Three-Mix Glass ($18.59) 18.84% ($3.50)
Tin $25.00 2.09% $0.52
Aluminum $1,100.00 1.03% $11.33
PET $180.00 2.73% $4.91
HDPE Natural $580.00 0.98% $5.68
HDPE Colored $440.00 0.90% $3.96
Tubs and Lids $50.00 0.09% $0.05
Large Rigid Plastic $50.00 0.57% $0.29
Mixed Plastic Film ($51.04) 0.17% ($0.09)
Residue ($51.04) 14.54% ($7.42)
Total 100.00% $46.05
For these index models, actual sales data may be used for certain materials if the commodities are not tracked by the published market prices. Actual disposal cost data would also be used to factor residue disposal costs into the calculation of the weighted average value per ton of the single-stream material. However, residue is sometimes excluded from the index composition if residue is handled under a

23 Ann Arbor MRF - Phase I Report October, 2016
separate provision of the contract. Index models are frequently used when a local government contracts with a privately-owned MRF for processing capacity.
Depending on how the cost of MRF residue is handled under the contract, the index model can include or exclude residue as a material in the calculation of average commodity revenue. Including residue, for which there is an associated cost instead of revenue, would result in a lower average per-ton commodity revenue.
The revenue share model might state that the unit of government shares in average commodity revenue above the threshold price, but does not pay a fee if the average commodity revenue is below the threshold price. These types of contracts are referred to as “zero floor” agreements and offer advantages to units of local government, but are subject to the bidding and/or negotiation of the MRF contract.
Finally, there are hybrid contracts that may incorporate both a tipping fee and a revenue share provision. This was the case for the City’s operating agreement and has been employed in other MRF contracts, as is discussed in the next two sections of this chapter.
Revenue Share and Tipping Fees (City Contract)
To understand and describe the revenue share and tipping fee provisions in the City’s operating agreement, the consultant team reviewed both the contract and contractor invoices submitted to the City. It is our understanding that some of the contractual provisions are in dispute (by the City and contractor), and therefore our analysis makes certain assumptions with respect to contract interpretation -- the analysis provided below does not represent a final or legal interpretation of the operating agreement. The City’s MRF operating agreement is a hybrid model that incorporates both a tipping fee and a revenue share provision:
The City pays a tipping fee of $22.43/ton19 for the City’s single-stream recyclables delivered to the MRF20. This tipping fee escalates annually based on a fixed escalation rate of 3.5 percent; however, the escalator is applied to the $54.00/ton trigger price (described below) and added to the prior year’s tipping fee. So, the tipping fee increases by $1.89/ton each year ($1.89 = 0.035 x $54.00/ton).
For City delivered recyclables, the City receives 80 percent of the net revenue above a $54.00/ton trigger price. The trigger price does not escalate. The City receives a 90 percent share of the net revenue above $70.00/ton. For all other delivered recyclables (i.e., third-party tonnage), the City receives 30 percent of the net revenue above $54.00/ton.
19 This rate is for Fiscal Year 2016 beginning July 1, 2015. 20 The consultant team reviewed invoices from January, 2015 to April, 2016. The City has delivered
single-stream materials and cardboard-rich loads to the MRF. Prior to December, 2015, the tipping fee was assessed only on the single-stream tons. Beginning in December, 2015, the tipping fee was assessed on both the single-stream and cardboard-rich loads brought to the MRF.

24 Ann Arbor MRF - Phase I Report October, 2016
Net revenue is defined as actual proceeds from the sale of recyclables, less transportation costs (if any) to ship materials to end-user markets, less acquisition costs of the contractor in securing third-party tonnage into the MRF. (Acquisition costs are defined as direct costs of the contractor or its affiliates associated with the acquisition price of any recyclable materials, and may include transportation costs and other costs; however, this report does not include interpretation of the contract, and neither CB&I nor MAR takes a position on the correct interpretation of the contract. Discussion of revenue in this report is based on what historical invoices show was done in the past.)
The contract states:
When Net Revenue per Ton for a month drops below the Trigger Price for Revenue Sharing, the difference between the Trigger Price for Revenue Sharing and the Net Revenue Per ton for that month shall be added to the Recyclables Tip Fee for that month. For example, if the monthly Net Revenue is $45.00, the Tip Fee for that month would be $20.09 ($54.00 - $45.00 + $11.09)21.
Presumably, the shortage would be applied to the City’s single-stream tonnage because that is the incoming material stream that the tip fee is paid on22. In practice, based on a review of the contractor invoices, the contractor also assessed a shortfall payment on third-party tons. (Again, this report does not include interpretation of the contract, and neither CB&I nor MAR takes a position on the correct interpretation of the contract. Discussion of revenue in this report is based on what historical invoices show was done in the past.) For invoices between January and November, 2015, the shortfall was multiplied by 30 percent, the percentage revenue share for net revenue above the trigger price. For invoices from December, 2015 to April, 201623, the contractor assessed 100 percent of the shortfall.
The City receives a credit on invoices from the contractor amounting to $4.00/ton for all inbound tonnage; this represents the contractor’s contribution to the Capitalize Renewal and Replacement Fund for the MRF24. The credit is applied to both City tonnage and third-party tonnage. (This topic is discussed further in Chapter 4 of the report).
The contractor also invoices the City for the difference in labor costs resulting from the City’s living wage ordinance25.
21 Amendment #8 to the operating contract, December 16, 2009. The $11.09/ton was the tipping fee in place as of the fiscal year of the amendment. For Fiscal Year 2016, the tipping fee of $22.43/ton would be used instead in the example, resulting in a Tip Fee of $31.43/ton.
22 The operating agreement would therefore not be termed a “zero-floor” contract as discussed in the previous section.
23 The consultant team reviewed invoices for the period January, 2015 to April, 2016. The net revenue per ton was greater than the trigger price in some but not all months during that period.
24 The City maintains this fund and also contributes $2.00/ton to the fund on City tonnage. 25 The living wage ordinance was adopted by the City years after the initial MRF operating contract
was executed; as a result, Amendment #5 to the operating agreement was negotiated and approved on December 1, 2005.

25 Ann Arbor MRF - Phase I Report October, 2016
Analysis (City Revenue Share)
Based on our review of the operating agreement and contractor invoices, the consultant team offers the following observations. Transport to End Market Costs (Outbound Tonnage) The definition of net revenue includes a deduction from gross commodity sales for transportation costs to end markets. As discussed previously in this chapter (and in Appendix A), transportation costs were incurred for some (but not all) loads of newspaper, mixed paper and cardboard, as well as glass. Although these transportation costs were a deduction against gross selling price, the benchmark comparison against published market prices (RISI and Secondary Fibers/Material Pricing) indicated that the City received comparable or favorable pricing relative to the regional market prices. Allowing transportation costs to be included in the calculation of net revenues provides an incentive for the operator to secure favorable pricing, and provides flexibility to utilize multiple end markets. Our review of other MRF operating agreements indicates that this is also a typical contract provision. Acquisition Costs (Inbound Tonnage)
The definition of net revenues also includes a deduction for acquisition costs associated with third-party tonnage. (The contract defines “acquisition costs” incurred by the contractor for third-party users of the City’s MRF for inbound recyclables, but this report does not take a position on the interpretation or application of that definition; it reports only on what was done in practice26.) Only one of the other MRF operating agreements we reviewed (Cape May County Municipal Utilities Authority) included the concept of acquisition costs for third-party tonnage; that agreement expressly allowed the material to be accepted only if the average commodity value (net of the acquisition costs) exceeded $85.00 per ton and was sufficient to cover all Authority and contractor costs (meaning the Authority would not be negatively impacted by the acquisition costs). The Cape May agreement is discussed in a subsequent section.
The City’s operating agreement allows for third-party tonnage to be brought to the facility, and Amendment #8 to the contract further states:
Contractor agrees to cause to be directed to the MRF/TS, and not to any other MRF controlled by the Contractor or its affiliates or subcontractors, all other delivered recyclables that the Contractor or its affiliates or subcontractors processes that are sourced from locations west of a line drawn north and south from the border shared by Wayne and Washtenaw Counties, south of I-96 and north of the Ohio border, excluding all of Oakland County.
As was discussed in Chapter 2, the throughput processed by the City’s MRF increased from approximately 44,000 tons in 2013 to approximately 77,000 tons in 2015. The majority
26 “Acquisition costs” are direct costs of the contractor or its affiliates associated with the acquisition price of recyclable materials, and might include transportation expenses or “other” allowances such as purchases of pre-sorted recyclables such as cardboard. A review of the contractor invoices for January, 2015 to April, 2016, however, indicated that most of the acquisition costs were identified as freight or trucking expenses.

26 Ann Arbor MRF - Phase I Report October, 2016
of that growth was due to third-party tonnage brought in from the City of Toledo, the City of Lansing, and the operator’s MRF in Saginaw, all which lie outside the service area noted in Amendment #8.
The average acquisition cost invoiced by the contractor per incoming third-party ton during the period January, 2015 to April, 2016 was $15.95/ton (it is our understanding the City has disputed the inclusion of costs to transport third-party tons to the MRF in the revenue share calculation). Because of the number of variables involved in the computation of the City’s revenue share, a model was constructed to estimate the revenue to the City under different conditions. The model includes the following scenarios and assumptions:
Scenario 1: Incoming MRF tonnage = 44,000 tons per year, no acquisition cost for 3rd party tonnage
Scenario 2: Incoming MRF tonnage = 44,000 tons per year, acquisition cost for 3rd party tonnage at $15.95/ton
Scenario 3: Incoming MRF tonnage = 77,000 tons per year, acquisition cost for 3rd party tonnage at $15.95/ton
Scenario 4: Incoming MRF tonnage = 77,000 tons per year, no acquisition cost for 3rd party tonnage
A fifth scenario (Scenario 1A) was also developed using the same assumptions as Scenario 1, but only counting the revenue share on the City’s tonnage. This scenario was added to further evaluate the impact of third-party tonnage on revenue share, excluding acquisition costs.
All of the scenarios also included the following common assumptions:
All inbound tons are processed and sold during the year (no processed recyclables held in inventory at year end).
Transport costs to ship certain recyclables to end markets were deducted from gross selling price in computing net revenue. These transportation costs averaged $8.00/ton per outbound, sold ton during the period January, 2015 to April, 2016.
It should be noted that the model was developed to illustrate the general structure of the revenue share provisions of the operating contract, and not to model the actual financial performance of the MRF in any prior year or predict its performance in any future year. The parameters used in the model, such as average acquisition cost per ton, are based on actual historical invoice data. However, this report does not take a position on whether the historical invoice data reflects an accurate interpretation of the contract.
An example model run is presented in Table 9, assuming a gross selling price of $75.00/ton and deducting acquisition costs based on the assumptions for each scenario.

27 Ann Arbor MRF - Phase I Report October, 2016
TABLE 9. EXAMPLE MODEL ANALYSIS OF CITY’S REVENUE SHARE
Parameter Scenario 1 Scenario 2 Scenario 3 Scenario 4 Tonnages Delivered to MRF
Incoming City (tons) 15,000 15,000 15,000 15,000 Incoming 3rd Party (tons) 29,000 29,000 62,000 62,000 Total 44,000 44,000 77,000 77,000 Tons Recovered and Sold (Net of Residue) 39,160 39,160 68,530 68,530
Gross Revenue $2,937,000 $2,937,000 $5,139,750 $5,139,750 Less, Transport Costs on Sold Tons ($313,280) ($313,280) ($548,240) ($548,240) Less, Acquisition Costs on 3rd Party Tons $0 ($462,550) ($988,900) $0 Net Revenue $2,623,720 $2,161,170 $3,602,610 $4,591,510
Net Revenue ($/ton) $67.00 $55.19 $52.57 $67.00 Trigger Price ($/ton) $54.00 $54.00 $54.00 $54.00 Applicable to Revenue Share $13.00 $1.19 ($1.43) $13.00
Revenue Share ($/ton)
City Tons (80% above $54.00/ton) $10.40 $0.95 $0.00 $10.40 City Tons (90% above $70.00/ton) $0.00 $0.00 $0.00 $0.00 City Tons (100% below $54.00/ton) $0.00 $0.00 ($1.43) $0.00 3rd Party Tons (30% above $54.00/ton) $3.90 $0.36 $0.00 $3.90 3rd Party Tons (30% below $54.00/ton) $0.00 $0.00 ($0.43) $0.00
Total Revenue to City
City Tons $138,840 $12,690 ($19,093) $138,840 3rd Party Tons $100,659 $9,200 ($23,675) $215,202 Total $239,499 $21,890 ($42,768) $354,042
Assumptions:
Gross Selling Price (per sold ton) $75.00 $75.00 $75.00 $75.00 End Market Transport Cost (per sold ton) $8.00 $8.00 $8.00 $8.00 Acquisition Cost (per 3rd party ton) $0.00 $15.95 $15.95 $0.00 Residue Rate: 11.0% 11.0% 11.0% 11.0%
A sensitivity analysis was also performed by running the model for different levels of gross selling price. The sensitivity analysis is summarized in Figure 5. Comparing the revenue lines for Scenario 1 and Scenario 1A (which assume no acquisition costs for third-party tonnage and annual MRF tonnage of 44,000 tons per year), it is apparent that the majority (around 60 percent) of the City’s total revenue share is derived from the City’s tonnage. However, there is a benefit to accepting third-party tonnage because it increases the total amount of revenue. Since the operator was responsible for sourcing this outside material, the lower percentage revenue share on the third-party tonnage (30 percent vs. 80-90 percent on City tonnage) is reasonable, given that it was mutually negotiated by the City and contractor, and because it provides an incentive for the contractor to source the material.

28 Ann Arbor MRF - Phase I Report October, 2016
FIGURE 5. EXAMPLE MODEL ANALYSIS OF CITY’S REVENUE SHARE
Scenarios 2 and 3 show the impact of acquisition costs for third-party tonnage. The City’s revenue share is maximized (even at lower tonnages of 44,000 tpy vs. 77,000 tons per year) if, as under Scenarios 1 and 4, there are no acquisition costs for third-party tonnage. Thus, the City does not earn extra revenue at the higher tonnage level of 77,000 tons per year until gross selling prices reach approximately $110.00/ton, unless acquisition costs are not charged.
Comparing Scenario 2 with Scenario 3, if similar acquisition costs ($15.95/ton) are assessed on lower third-party tonnage (Scenario 2) and higher third-party tonnage (Scenario 3), the City’s revenue share is higher at the lower tonnage level (44,000 tpy) for gross selling prices up to approximately $82.00/ton. Further, if there is no zero-floor provision on the third-party revenue share, the City would incur greater costs at the higher tonnage level (77,000 tpy) if gross selling prices are $76.00/ton or lower (at that price level, the net revenue to the City becomes negative). Above $82.00/ton, the City would receive greater revenues by sourcing more third party material. If the City’s primary objective is to control its risk exposure, the upside benefits of sourcing third party tonnage with an acquisition cost including freight or trucking (and when commodity prices are higher) may not compensate for the downside risks if commodity prices are lower.
Inspection of Figure 3 and Table 6 indicates that the Ann Arbor MRF is one of the closest single-stream MRFs to the City of Toledo operating at higher throughput levels. Although two MRFs in Ohio are located closer or a comparable distance from Toledo (O1 and O2 on Figure 3), they are smaller facilities that may not be capable of handling that city’s tonnage. The ReCommunity MRF in Roseville, Michigan is the only larger throughput single-stream MRF located within a comparable distance to the City of Ann Arbor’s MRF -- all other
$60 $65 $70 $75 $80 $85 $90 $95 $100 $105 $110
Gross Revenue ($/ton)
($1,000)
($500)
$0
$500
$1,000
$1,500
Thou
sand
sR
even
ue S
hare
to C
ity
Scenario 1: (44,000 tpy, No Acquisition Costs)Scenario 1A: (Subtotal Revenue on City Tons Only)Scenario 2: (44,000 tpy, Acquisition Costs = $15.95/ton)Scenario 3: (77,000 tpy, Acquisition Costs = $15.95/ton)Scenario 4: (77,000 tpy, No Acquisition Costs)

29 Ann Arbor MRF - Phase I Report October, 2016
competing MRFs that handle similar tonnages are located further away from Toledo. As was noted previously, the City’s contract is unique (relative to the other contracts we reviewed) in that acquisition costs are deducted from gross revenue in computing the net revenue for revenue sharing. Given the relative proximity of the Ann Arbor’s MRF to the City of Toledo, it is not clear why a transportation allowance was required to source that tonnage. Again, this report does not take a position as to whether the deduction of transportation costs is a correct interpretation of the contract.
Living Wage Adjustment
Amendment #5 to the operating agreement was approved in December, 2005, and implemented a living wage adjustment. Under this amendment, the City agreed to pay the incremental cost of the higher wages stemming from the living wage ordinance, weighed by the proportion of City-delivered recyclables to total recyclables received at the MRF.
Based on a review of the contractor invoices, from January, 2015 to November, 2015, the living wage increment was applied to contractor employees and amounted to $5.41/ton per ton of City recyclables. From December, 2015 to April, 2016, the living wage increment was applied both to the contractor’s employees and temporary employees, which amounted to $13.47/ton of City recyclables.
Summary
Assuming that net revenues are $54.00/ton and therefore there is no revenue share (positive or negative to the City), the cost to process a ton of City recyclables under the operating agreement is $79.84 to $87.90/ton, as shown below:
City tip fee = $22.43/ton
Material revenues applied to operating costs = $54.00/ton
Credit, contractor contribution to capital fund = (4.00/ton)
City contribution to capital fund = $2.00/ton
Living wage adjustment = $5.41 - $13.47/ton
Total = $79.84 - $87.90/ton
This is a total cost, not an out-of-pocket cost because the net material sales of $54.00/ton are covering a portion of the total cost. The out-of-pocket cost would amount to $25.84 to $33.90/ton.

30 Ann Arbor MRF - Phase I Report October, 2016
Revenue Share and Tipping Fees (Other Contracts)
To evaluate industry practice and market conditions with respect to tipping fees and revenue share provisions, a number of contracts for other jurisdictions in the U.S. were researched. These contracts included:
Contracts for private-operation of publicly-owned MRFs (marketing of processed recyclables performed by public-owner). This type of arrangement is relatively rare in the industry and a single contract was reviewed.
Contracts for private-operation and materials marketing for publicly-owned MRFs. This type of arrangement is similar to Ann Arbor’s agreement. Four such agreements were reviewed.
Contracts for processing and marketing of recyclables at privately-owned MRFs. Three such agreements were reviewed.
The primary parameters (e.g., contracting entity, date of contract, annual tonnage) of these contracts are summarized in Table 10. The tipping fee and revenue share provisions of the contracts are discussed below.
TABLE 10. SUMMARY OF OTHER CONTRACTS RESEARCHED
Contracting Entity
Contractor
Services Provided
Date of Contract
Annual Tonnage
Solid Waste Authority of Palm Beach County (FL) FCR (ReCommunity) Operation of MRF. Authority markets
recyclables. 2009 100,000
Athens-Clarke County (GA) RRSI (ReCommunity) Operation of MRF and marketing of
recyclables. 2011 20,540
City of Chicago (IL) Resource Management Processing and marketing of recyclables at privately-owned MRF. 2013 NA
Solid Waste Agency of Lake County (IL) Waste Management Processing and marketing of
recyclables at privately-owned MRF. 2016 40,000
Solid Waste Agency of Northern Cook Co. (IL) Groot Industries Processing and marketing of
recyclables at privately-owned MRF. 2015 50,000
Atlantic County Utilities Authority (NJ)
Hudson Baylor (ReCommunity)
Operation of MRF and marketing of recyclables. 2010 45,000
Morris County Municipal Utilities Authority (NJ) FCR (ReCommunity) Processing and marketing of
recyclables at privately-owned MRF. 2016 15,000
Cape May County Muni. Utilities Authority (NJ)
Hudson Baylor (ReCommunity)
Operation of MRF and marketing of recyclables. 2012 30,000
City of Milwaukee/ Waukesha County RRS (ReCommunity) Operation of MRF and marketing of
recyclables. 2014 47,500
Source: 1. For processing agreements with privately-owned MRFs, the annual tonnage represents the tonnage delivered by the
unit of government as specified in the contract or as reported on the jurisdiction’s website. The MRF may handle additional tonnage.
2. For agreements to operate a publicly-owned MRF, the annual tonnage represents the total throughput of the MRF, as reported in the GAA database.
Notes: 1. NA = Not Available. 2. The Solid Waste Authority of Palm Beach County’s MRF is a dual-stream facility. 3. The City of Milwaukee MRF was jointly-developed with Waukesha County. 4. Date is the year of the most recent contract amendment, if applicable.

31 Ann Arbor MRF - Phase I Report October, 2016
Solid Waste Authority of Palm Beach County The Authority contracts with ReCommunity to operate the Authority’s MRF. The Authority is somewhat unique in that it markets the processed materials, instead of relying on the contract operator to perform that service. The 2009 contract for operations is an amended and restated agreement that replaced an initial agreement signed in 1997; the 2009 agreement was negotiated following the construction of improvements (completed by the Authority) at MRF. The term of the restated contract was for 4 years, with one 5-yar extension at the sole discretion of the Authority.
The MRF is dual-stream and receives three primary incoming recyclable streams: residential fiber, residential commingled containers, and commercial fiber. A different processing fee is paid to the operator for each incoming material stream: in FY2016, these fees were budgeted at $27.33/ton for residential fiber, $79.69/ton for containers, and $39.72/ton for commercial fiber. Based on budgeted tonnage of 101,992 tons for all three material streams, the average operating fee paid to the contractor amounted to $47.77/ton27. The operating fee escalates annually based on a weighted average of several price indexes
The Authority owns a landfill and the contractor is responsible for hauling MRF residue to the landfill but is not charged for disposal.
The facility generally does not accept third-party tonnage, but upon mutual agreement of the Authority and operator, clean loads of paper materials may be received for baling. The operator is paid a fee of $21.00/ton to bale the material.
For FY2016, the Authority budgeted $101.76/ton for the sale of processed recyclables, which the Authority retains entirely.
Unified Government of Athens-Clarke County
Athens-Clarke County initially contracted with ReCommunity in 1994 to construct and operate a MRF on a County-owned site. The site was leased to the operator, who retained ownership of the building and equipment.
The initial contract was subsequently amended in 2011 to add single-stream processing capabilities. The County also exercised an option in the original contract to purchase the MRF; the consideration paid by the County was contractor’s cost to retrofit the facility for single-stream processing ($1,500,000). The contractor was retained to operate the facility.
The term of the contract following the 2011 amendment was established at 10 years. The County can optionally extend the contract for additional 5-year periods, provided that 1-year advanced notice is provided to the contractor and further provided that the components of the net service fee for each renewal period are mutually agreed upon by the County and contractor.
The contractor is paid a processing fee (also called a tip fee in the contract) that is tiered based on the average value of the County’s recyclables. For average commodity values of less than $69.00/ton, the processing fee is $63.00/ton. For higher commodity values, the
27 Solid Waste Authority of Palm Beach County, Fiscal Year 2016 Adopted Budget.

32 Ann Arbor MRF - Phase I Report October, 2016
processing fee decreases, with the lowest processing fee of $56.00/ton paid if commodity values are greater than $130.00/ton. The tiered processing fees escalate annually based on 75 percent of the CPI.
The average commodity value is computed using actual commodity sale prices for the month and a fixed composition estimate the County’s recyclables including residue (similar to the example in Table 8). The composition mix can be modified with mutual consent of the County and contractor. The sales prices are gross proceeds less any transportation costs to end markets; unlike Ann Arbor’s contract, there is no deduction for acquisition costs for inbound recyclables.
The revenue share is likewise tied to average commodity value. The County receives 80 percent of average commodity value. There is no threshold commodity value that must be attained before the revenue share is triggered.
In contrast, the City of Ann Arbor’s agreement had a lower tip fee of $22.43/ton, but a threshold average commodity price of $54.00 per ton before the 80 percent revenue share was triggered. This illustrates the concept mentioned previously -- the higher the processing fee, the more generous the revenue share.
The Athens-Clarke agreement allows the contractor to bring in third-party tonnage, for which the County is paid a merchant use fee. The merchant fee ranges from $10-$13 per third-party ton and is tiered based on average commodity values, but the County earns a minimum of $10 per ton. The contract also states that the contractor will not charge the County processing fees or any other charges for third-party recyclables delivered to the facility.
City of Chicago
The City entered into a contract with Resource Management in 2013 to process recyclables from the City’s blue-cart recycling program. Resource Management owns two single-stream MRFs in the Chicago region. The contract is for a 5-year term.
Under this contract, the City retains all commodity revenues in excess of processing costs. Average revenue per ton of single-stream recyclables is computed using monthly index pricing for commodity values (similar to Table 8) and a composition mix that is fixed for the five-year term of the contract. Residue is not included in the composition mix, and so the contract must include residue disposal costs in its processing fee. Published index pricing for the commodities is updated monthly.
One nuance to this contract is that Resource Management was able to specify a fractional multiplier for each commodity to reflect the company’s experience in selling that material versus the published index price. In other words, if the company historically sold cardboard at a price that was 5 percent lower versus the index price, the multiplier would be 0.95.
Processing costs are $61.00/ton for recyclables delivered to the MRF. If the contractor picks up recyclables at City designated facilities, the processing fee includes transload and transport costs to the MRF and ranges from $77.35/ton to $80.50/ton. The processing fee is fixed for the term of the contract.
This is a zero-floor contract in that if material revenues do not exceed the processing fee, the City does not pay the shortfall.

33 Ann Arbor MRF - Phase I Report October, 2016
Solid Waste Agency of Lake County
The Solid Waste Agency of Lake County is a consortium of municipalities that contracts for processing and marketing of recyclables with Waste Management, which owns a single-stream MRF in the County. Under this voluntary program, 38 of the member communities of the Agency participate in the program. The contract was initially signed in 2008 for a 3-year term, with two 2-year extensions allowed upon mutual agreement of both parties. A 2012 amendment to the initial contract changed the duration of the extension periods to 3-years. As amended, the agreement is scheduled to terminate at the end of 2016.
The revenue share provision of the contract is an index model (refer to Table 8), with the commodity values based on published market prices (RISI and Secondary Materials Pricing) and, for certain materials, actual selling prices. Prices are adjusted monthly. The composition mix is based on periodic sorting studies of the recyclables delivered by the Agency’s members and includes residue costs as a component.
The trigger price for the revenue share is $65.00/ton, which is fixed and does not escalate annually. However, the trigger price has increased over time as the initial contract has been extended. In 2008, when the contract was first executed, the trigger price was $50.00/ton. That value held until 2014, when it increased to the current $65.00/ton.
The member communities and SWALCO receive a fixed per-ton rebate under the revenue share, which is tiered based on average commodity values above $65.00/ton. The first tier (for commodity values between $65.00/ton and $69.99/ton) provides a rebate of $5.50/ton, which increases to $38.00/ton when average commodity values are $130.00/ton or greater.
Monthly average commodity values, based on the index model, have fluctuated over time, ranging from $98.09/ton in 2008 to $126.67/ton in 2011 to $76.21/ton in 2014 to $46.05/ton in 2015. The contractor can terminate the agreement (with 90-days notice) if the average commodity value drops below $50.00/ton for any month, but this hasn’t happened despite the commodity value declining to $46.05/ton in December, 2015.
The Agency receives a bonus of $5.00/ton for each ton over 42,000 tons per year that is delivered by the Agency’s members. The Agency is not required to deliver a minimum tonnage, however the contract provides that the rebate will be reduced by $0.50/ton if tonnage deliveries in a given year decline by 5 percent from tonnage deliveries in the prior year. The full value of the rebate can be restored if tonnages increase in subsequent years.
This is a zero-floor contract in that if material revenues do not exceed the processing fee, the City does not pay the shortfall.
Solid Waste Agency of Northern Cook County
The Solid Waste Agency of Norther Cook County is a consortium of municipalities that owns a transfer station and contracts with Groot Industries to operate the facility. As a component of the transfer station agreement, Groot provides processing services for single-stream recyclables at a nearby company-owned MRF. Participation in the recycling element is voluntary for the member communities of the Agency, and 11 of the communities currently participate. Because the recycling program is a component of a long-term transfer station operating agreement, the 16-year term is longer than most other MRF agreements.

34 Ann Arbor MRF - Phase I Report October, 2016
The recycling program has an index model for the revenue share (refer to Table 8). Commodity values are based on published market prices (RISI and Secondary Materials Pricing). The composition mix includes a residue component. The trigger price is $75.00/ton, which escalates annually based on the Consumer Price Index. The Agency receives 50 percent of revenues when average commodity values exceed the trigger price.
This is a zero-floor contract in that if material revenues do not exceed the processing fee, the City does not pay the shortfall.
Atlantic County Utilities Authority
The Atlantic County Utilities Authority contracts with ReCommunity for the operation and maintenance of the Authority’s MRF, and marketing of the processed recyclables. Through an amendment to the contract, single-stream processing was added to the facility. The building is owned by the Authority, while the single-stream processing equipment was designed and installed by the contractor and is owned by the contractor. The contract has a 10-year term with one 5-year extension at the election of the contractor. The contractor has the right to remove its equipment at the end of the contract.
Under this agreement, ACUA commits to deliver all the recyclable materials under its control to the MRF28. Compensation to the ACUA and the contractor is primarily handled through the revenue share agreement. The revenue share is an index model (refer to Table 8) but commodity prices are based on actual sales from the MRF (not published market prices). For purposes of determining net revenue, transport costs to end markets are deducted but there is no deduction for acquisition costs like in the Ann Arbor contract.
The composition mix of ACUA-delivered recyclables is determined by sorting study. Residue is not included in the composition mix because ACUA owns a landfill and disposes of process residue from its recyclables at no charge (up to limits specified in the contract). In the absence of other markets, processed mixed glass is beneficially reused at the ACUA landfill.
The trigger price for revenue share is $75.00/ton. ACUA receives 50 percent of average commodity revenues between $75.01/ton and $100.00/ton, and 80 percent of average commodity revenue in excess of $100.00 per ton. The trigger price does not escalate.
The contractor is allowed to bring third-party recyclables to the MRF. ACUA receives a payment of $5.00/ton for third-party recyclables, which does not escalate.
This is a zero-floor contract in that if material revenues do not exceed the processing fee, the City does not pay the shortfall.
Cape May County Municipal Utilities Authority
The Cape May County Municipal Utilities Authority contracts with ReCommunity for the operation of the Authority’s MRF and marketing of processed recyclables. The agreement was originally entered into in December, 2009, when the facility was operated as a dual-stream MRF. In August, 2012, the contract was amended to add single-stream capabilities,
28 The contract references a 30,000 ton guarantee, but no further details are provided in the agreement.

35 Ann Arbor MRF - Phase I Report October, 2016
including a processing line rated at 20 tons per hour. The amendment added 7 years to the original term of the agreement (12 years combined total).
The cost of the single-stream upgrades were shared by the contractor ($3,083,200) and the Authority ($582,000). The contract stipulates that the contractor’s cost for installing the equipment is recovered through the revenue sharing provisions of the contract. During the term of the contract, ownership of the building and equipment was transferred to the contractor through a lease agreement. At the end of the contract, ownership of the MRF and improvements reverts back to the Authority.
The Authority is charged a flat monthly fee of $500.00 as a service fee. The service fee escalates annually based on CPI, not to exceed 3 percent.
The revenue share (under the amended contract) provides that the contractor retains the first $75.00/ton of average commodity revenue. The Authority shares 50 percent of average commodity revenues between $75.00/ton and $100.00/ton, and 80 percent of average commodity revenues over $100.00/ton. Since the contractor owns the single-stream equipment and MRF improvements through the end of the contract term, the $75.00/ton includes cost-recovery of the equipment and improvements. The variable cost portion of the $75.00/ton trigger price, established in the contract at $45.00/ton, escalates annually at the Consumer Price Index, not to exceed 3 percent. The contract states that the Authority will not reimburse the contractor if average commodity revenue is less than the $75.00/ton trigger, and so this is a zero-floor contract.
Average commodity revenue is based on actual sales of materials from the MRF, and does not include residue. Commodity revenues are net of transport costs to end markets.
The Authority transports process residue and disposes of it at its landfill, up to a specified limit, at no charge to the contractor (the contractor must pay for residue above the limit). Mixed glass which cannot be marketed economically is used at the landfill for landfill cover.
The Authority commits to deliver 28,000 tons per year of recyclables to the MRF (a provision in the initial contract). If there is a shortfall on this tonnage guarantee, and if material revenues fall below $2,100,000 for the year, the Authority pays a fee of $20.00/ton for each ton below 28,000 tons.
The contractor is allowed to bring in third-party single-stream recyclables from outside the County, if approved by the Authority. An audit of the third-party material must be performed, and if residue in the sample amounts to more than 7 ½ percent by weight, the contractor must pay an excess residue fee to the Authority.
The contractor must advise the Authority of any fees the contractor pays to the generator of the recyclables in order to source the material (the contract apparently contemplated some type of revenue share or purchase of material from the generator). The contract stipulates that, after deducting these acquisition costs and any excess residue fees, the net revenue must be at least $85.00/ton and sufficient to cover all expenses of the Authority and contractor.
If those conditions were met, the contractor would retain the first $60.00/ton of net revenues as reimbursement for its processing expenses. This presumably would include the $45.00/ton in variable operating costs, as well as some allocation of the $3,083,200 in

36 Ann Arbor MRF - Phase I Report October, 2016
equipment costs paid by the contractor (although some of those capital costs were also paid through the revenue share with the Authority).
The Authority receives the next $25.00/ton as reimbursement for hauling and disposal of residue from the third-party tonnage (subject to the 7 ½ percent cap on residue), accepting mixed glass, scale and administrative costs, and wear and tear on the MRF.
The contractor and Authority split any net commodity revenue above $85.00/ton on a 50/50 basis.
A similar revenue share arrangement is also specified for third-party commercial recyclables, initially defined as source-separated OCC, except that the threshold net revenue (after acquisition costs are deducted) is set at $65.00/ton. The contractor retains the first $40.00/ton, the Authority gets the next $25.00/ton, and any revenues above $65.00/ton are shared 50/50 by the contractor and Authority. Any third-party commercial tonnage counts toward the Authority’s commitment to deliver 28,000 tons per year of single-stream recyclables.
The Authority’s agreement was therefore similar to the City of Ann Arbor’s contract in that acquisition costs to source third-party tonnage were deducted from the definition of net average commodity revenue. However, there are several important differences in the Authority’s agreement:
Revenues from third-party tonnage were treated separately from the revenues for Authority-delivered recyclables. In Ann Arbor’s case, revenues from the City’s single-stream recyclables were included with revenues from third-party recyclables, and then the acquisition costs were subtracted to obtain total net revenues. This provided less predictability and control to the City.
The threshold for revenue share on third-party tonnage in Ann Arbor’s contract was established at $54.00/ton, net of acquisition costs, after which the City received 30 percent. This is lower than the $85.00/ton threshold specified in the Authority’s agreement. However, the City paid the majority of the capital costs for the single-stream upgrade to its facility, whereas the contractor paid the majority of costs under the Authority’s agreement.
By establishing a minimum average commodity value of $85.00/ton for third-party single-stream materials (net of acquisition costs), and by stipulating that the $85.00/ton must cover both the contractor’s and Authority’s expenses, the Authority had downside protection with respect to the third-party tonnage.
Morris County Utilities Authority
The Morris County Utilities Authority contracts with ReCommunity for the processing and marketing of the Authority’s recyclables at a company-owned MRF. The contract was signed in January, 2016 (ReCommunity was also the Authority’s processor prior to the new agreement being signed). The contract is for an initial term of 3 years, with two 1-year extensions if mutually agreed upon by the parties.
The Authority must deliver all the recyclables it collects (or under its control) to the contractor. The Authority collects both single-stream and dual-stream materials. No recyclables may be delivered in bags, except for newspaper that is contained in kraft paper

37 Ann Arbor MRF - Phase I Report October, 2016
bags. The contractor may reject loads with greater than 10 percent contamination, or excessive snow or moisture content.
The contractor and Authority are compensated through a revenue-share agreement. The revenue share is based on an index model, with commodity values established based on actual sale prices (not published market prices) for the materials. Net revenues include a deduction for transport costs to end markets, but because the Authority delivers recyclables to a company-owned MRF, acquisition costs are not a factor.
The composition mix for the Authority’s recyclables is determined by audit (i.e., sorting study). The contractor pays for two annual audits of the Authority’s single-stream recyclables, and one of the fiber stream delivered under dual-stream collection. As the contract continues, the composition mix will be calculated as the rolling-average of the most four recent composition studies.
The threshold prices established for revenue share are $92.00/ton for single-stream recyclables and the dual-stream container mix, and $53.00/ton for the dual-stream fiber mix. These thresholds escalate annually (but never downward) by the greater of CPI or 2 percent.
For single-stream recyclables, the Authority receives 55 percent of average commodity revenues above the $92.00/ton threshold. For dual-stream containers, the Authority receives 50 percent of average commodity revenue above the $92.00/ton threshold. For dual-stream fiber, the Authority receives 65 percent of average commodity revenues above the $53.00/ton threshold.
The Authority pays any shortfall if average commodity revenues do not exceed the threshold, and so this is not a zero-floor contract. The agreement can be terminated by either party if the charge (i.e., shortfall payment) to the Authority is greater than $50.00/ton for three consecutive months. However, that option becomes available only after 20 months of operation.
Based on the minutes of the meeting at which the Authority approved the new contract, the $92.00/ton threshold price was an increase from $78.00/ton in the previous contract (which was also with ReCommunity). The minutes indicate only two vendors submitted proposals in response to the Authority’s RFP. Because of the poor market climate, the Authority wanted a 3-year agreement (with two 1-year extensions) instead of a straight five-year deal.
City of Milwaukee/Waukesha County
The City of Milwaukee and Waukesha County jointly developed a single-stream MRF. A contract to operate and maintain the MRF was signed with ReCommunity in 2014. The contract has a 10-year term, which can be extended for one 5-year renewal upon the sole discretion of the City and County. A separate contract to construct and operate a County transfer station was also signed by the County and ReCommunity. The MRF process line has a rated capacity of 35 tons per hour.
Under the MRF contract, the City and County agree to deliver the recyclables under their control to the MRF. The contractor may also accept third-party tonnage.
The City and County are charged a processing fee, initially established at $30.00/ton. The processing fee for third-party recyclables was initially established at $41.00/ton, and the

38 Ann Arbor MRF - Phase I Report October, 2016
contract stipulates that the third-party generator is responsible for paying the processing fee to ReCommunity. On a year-to-year basis, the processing fee for the City and County are based on a tiered schedule according to how much total tonnage (City, County and third-party) was accepted the prior year:
60,000 tons per year or more = $30.00/ton
57,000 tons per year = $31.95/ton
54,000 tons per year = $33.90/ton
51,000 tons per year = $35.85/ton
48,000 tons per year = $37.80/ton
42,500 tons per year or less = $39.75/ton
So, although the processing fee paid by the City and County was initially established at $30.00/ton, that amount could increase if in subsequent years the total tonnage (including third-party tonnage) falls below 60,000 tons per year. The tiered processing fees also escalate annually based on CPI.
In addition to the processing fee, the City and County pay actual disposal costs for residue in their recyclables. City and County loads may contain up to 20 percent contamination before they are considered non-conforming, and it appears that the City and County were allowing for significant amounts of contamination in their single-stream recyclables. Third-party customers are also responsible for paying residue disposal costs (in addition to the third-party processing fee). The contract specifies that no other processing costs shall be passed on to the City, County or third-party customers, unless mutually agreed upon in writing.
The revenue share is based on actual sales prices for commodities, using an index model (refer to Table 8). The composition of the City’s and County’s recyclables is determined through an audit (sorting study), performed at least one time per year and paid for by the contractor. Since the City and County both pay for residue disposal costs, residue is not included in the index.
The City and County receive 80 percent of net revenues from the sale of their commodities. Net revenues are described as gross selling price less any transport costs to end markets; acquisition costs are not included. Because the City and County also pay a processing fee, there is no trigger price in the revenue share. There is no provision in the contract for the City and County to pay additional amounts if the average commodity revenue does not meet a minimum threshold. This contract is a floor-contract, therefore, but not a zero-floor contract, because the City and County pay a process fee.
The contract encourages the contractor to accept and process third-party recyclables. Accept for one-time deliveries of recyclables, third-party customers must have a written contract that is approved by the City and County. However, until the MRF processes 60,000 tons in a given year, the third-party contracts are deemed approved, provided they meet certain minimum conditions specified in the operating agreement. In other words, the contractor does not need to obtain City and County approval on a specific contract if the MRF has not met the 60,000 ton per year tonnage goal. Third-party contracts cannot

39 Ann Arbor MRF - Phase I Report October, 2016
contain more favorable terms than provided to the City and County through the MRF operating agreement.
The City and County receive 2 ½ percent (each) of average commodity revenues on third-party recyclables. In addition, $1.00/ton is paid to each of the City and County on third-party tons as a host fee benefit.
The Contractor also pays a per ton education fee to the City and County for the tons of recyclables delivered by those entities. The education fee is tiered based on average commodity revenues, with a threshold price of $98.00/ton, for which the education fee is $0.67/ton. The education fee increases if average commodity revenue is greater than $98.00/ton; at the upper end of the tiered schedule, the education fee is $4.00/ton if average commodity revenue is greater than $160.00/ton.
Summary
Table 11 summarizes the revenue share and tipping fee provisions of the contracts previously discussed. Note that relevant and supporting details are provided in the narrative discussions of these contracts, so Table 11 should be read in conjunction with the contract summaries.
Recycling contracts are specialized agreements that are unique to the jurisdictions and contractors providing the services. Further, the contract that is ultimately negotiated by a jurisdiction depends on the market conditions prevailing at the time (especially with respect to commodity markets), as well as the number of MRFs and level of competition that exists in the market. However, based on the review of the City’s prior agreement and contracts for other jurisdictions, the following observations are made:
Processing fees (or tipping fees) for other contracts that contain such fees range from approximately $30.00-$63.00/ton. The City of Ann Arbor’s tip fee, at $22.43/ton, is below that range. Processing fees will be higher if recyclables are delivered to a company-owned MRF, since the processing fee would include recovery of capital expenses. We were not able to ascertain, however, the amount of any capital recovery charges or the amount of the contractor’s profit included in the processing fee. The City of Ann Arbor’s tip fee generally does not include any capital recovery because the City owns the facility and paid the majority of single-stream upgrade costs.
Trigger prices for revenue sharing are typical elements of contracts which do not include a processing fee. The trigger price reflects the contractor’s processing costs and, for privately-owned MRFs, will include capital recovery. The trigger price may also include a component for the contractor’s profit. Trigger prices range from $65.00 - $92.00/ton. For recyclables delivered by the jurisdiction, the revenue share generally ranges from 50 - 80 percent of the average commodity revenue above the trigger price. The City of Ann Arbor receives 80 percent of average commodity revenue above a trigger price of $54.00/ton, and 90 percent of average commodity revenue above $70.00/ton. Thus, the City’s revenue share has a lower trigger threshold, but again the City owns its MRF and paid the majority of costs for the single-stream upgrade.
Some of the contracts contain “zero floor” provisions, which means that the jurisdiction does not pay if average commodity revenues fall below the trigger

40 Ann Arbor MRF - Phase I Report October, 2016
price. A zero floor provision is very desirable for a community, but with the decline in commodity prices at the end of 2015 and into 2016, many private MRF operators are opposed to having a zero floor in the contract.
TABLE 11. REVENUE SHARE AND TIPPING FEE PROVISIONS (OTHER CONTRACTS)
Jurisdiction Tipping/Processing Fee Revenue Share (Jurisdiction’s Recyclables)
Revenue Share (Third-Party Recyclables)
Solid Waste Authority of Palm Beach County (FL) $47.77/ton (escalating)
Authority sells material and keeps revenues ($101.76/ton)
Limited to source-separated paper materials.
Unified Gov. of Athens-Clarke County (GA)
$56.00 - $63.00/ton (escalating). Tiered based on commodity values.
80% of revenue County receives $10.00-$13.00/ton based on commodity values.
City of Chicago (IL)
$61.00/ton if recyclables delivered to MRF. $77.35-$80.50/ton if recyclables picked up by contractor (non-escalating).
100% of revenue. Zero-floor contract. Not applicable
Solid Waste Agency of Lake County (IL) None
Tiered based on ACR. $5.50-$38.00/ton for ACR above $65.00/ton trigger (non-escalating). Zero floor contract.
Not applicable
Solid Waste Agency of Northern Cook County (IL) None
50% of ACR above $75.00/ton trigger (escalating). Zero floor contract.
Not applicable
Atlantic County Utilities Authority (NJ) None
50% for ACR between $75.00-$100.00/ton. 80% for ACR over $100.00/ton (non-escalating). Zero floor contract
$5.00/ton.
Cape May County Utilities Authority (NJ)
$500.00 per month flat fee (escalating)
50% for ACR between $75.00-$100.00/ton. 80% for ACR over $100.00/ton (escalating). Zero floor contract
Contractor receives first $60.00/ton of ACR. County receives next $25.00/ton of ACR. 50/50 split for ACR above $85.00/ton.
Morris County Utilities Authority (NJ) None
55% for ACR above $92.00/ton trigger (escalating). (County pays difference if ACR less than trigger).
Not applicable
City of Milwaukee/ Waukesha County (WI)
$30.00-$39.75/ton based on MRF throughput (escalating)
80% of revenue. Floor contract. Tiered education fee of $0.67-$4.00/ton based on ACR.
2.5% of ACR on third-party tonnage. $2.00/ton host fee on third-party tonnage.
City of Ann Arbor (MI) $22.43/ton (escalating)
80% for ACR over $54.00/ton. 90% for ACR over $70.00/ton (non-escalating).
30% for ACR over $54.00/ton.
Source: 1. Review of contract documents for each jurisdiction. Notes: 1. ACR = average commodity revenue per ton. ACR may be based on actual MRF sales of commodities or published
commodity prices. 2. Under revenue share column, escalating means the trigger price (threshold for commodity share) escalates annually. 3. In a zero floor contract, the jurisdiction does not pay the difference if ACR is less than the threshold trigger price.

41 Ann Arbor MRF - Phase I Report October, 2016
Revenue share for third-party recyclables is lower than for recyclables delivered by the jurisdiction. This reflects the fact that the third-party material is sourced by the contractor. In some cases (Athens-Clarke County, Atlantic County), the public-owner of the MRF receives a fixed per-ton payment on third-party tonnage. For other cases (City of Milwaukee, Cape May County, City of Ann Arbor), the jurisdiction receives a percentage of average commodity revenues above the trigger price, ranging from approximately 2.5 percent to 30 percent. The revenue share on third-party tonnage should at a minimum cover the depreciation costs of handling the additional tonnage. Most contracts are structured such that the jurisdiction does not pay any shortfall if average commodity revenues are less than the trigger price (although this is a disputed element of Ann Arbor’s agreement). The commodity risk of third-party recyclables is therefore borne by the contractor.
MRF Revenues - Recommendations
Based on the analysis in this chapter of various revenue provisions contained in contracts to operate MRFs and contracts to process recyclables, the following recommendations are made:
1. Actual commodity sales from the City’s MRF should be used in the calculation of net revenue for purposes of determining revenue share. Our analysis of historical commodity revenues from the MRF indicated that actual selling prices were generally in line with published regional market prices. Although published market prices allow for simpler contract administration, the City would lose the detailed information on the ultimate end market destinations for its recovered materials.
2. Contract pricing should specify a processing fee and revenue share on commodity revenues, or else a revenue share based on a threshold trigger price.
Our review of other contracts indicates that most operating agreements include a per ton processing fee with a percentage share on total commodity revenues. Most processing contracts (at privately-owned MRFs), on the other hand, specify a threshold trigger price and a percentage share on commodity revenues in excess of the trigger (the trigger price is effectively a processing fee). Either of these models is reasonable.
The City’s operating contract is somewhat unique in that it includes both a per ton processing fee and a revenue share with a trigger price. It is not clear what the intended purpose of this hybrid pricing structure was.
3. For third-party recyclables processed at the MRF, the City should not be liable for any shortfall if average commodity revenues do not exceed the processing cost or trigger price. Third-party tonnage may benefit the City through lower per ton processing fees. However, the City should not absorb the risk if average commodity revenues are lower than processing costs -- that risk should be borne by the generator of the recyclables or operator.

42 Ann Arbor MRF - Phase I Report October, 2016
4. For third-party material, acquisition costs should not be included in the
calculation of net revenues and revenue share. Under the previous operating agreement, acquisition costs could be deducted from net revenues in the calculation of the City’s revenue share, and the operator historically included transportation costs to bring third-party recyclables to the MRF as acquisition costs. As noted above, this report does not take a position on the correct interpretation of the applicable contract provisions. Only one of the other MRF operating agreements we reviewed included acquisition costs for third-party tonnage; that agreement provided other contractual protections to assure that the contracting entity was not negatively impacted by acquisition costs.

43 Ann Arbor MRF - Phase I Report October, 2016
5.0 MRF OPERATIONS AND MAINTENANCE
The purpose of this chapter is to review and evaluate the City’s former operating contract as well as other MRF agreements to identify industry standards with respect to operations and maintenance responsibilities. This chapter also discusses administrative aspects of MRF contracts, with the aim of identifying opportunities to streamline the City’s operating agreement.
Current Condition of MRF City Inspection Reports
The purpose of this study was to review contractual provisions to address the on-going maintenance of the City’s MRF. The consultant team did not perform a conditions review of the MRF building or process equipment.
We did, however, perform a site tour of the facility. In addition, we reviewed City inspection reports for the period January, 2015 to February, 2016. The City inspection reports note a number of operation and maintenance problems, including (but not limited to): damage to the MRF building (siding and doors); structural issues (e.g., loose railings and platform steps); damage to the scalehouse; tipping of recyclables outside the building; excessive glass storage, which encroached on the bus parking area and walking path/entrance to the MRF; litter on exterior of site; litter blocking walkways within the building; damaged or non-functional lighting; damaged or non-functional signs (both inside and outside the building); improper wiring; improper storage of gas tanks; blocked access to fire extinguishers and other safety equipment; covers removed from process line equipment; spills; and, during certain inspections, odors. Some of these issues may have been subsequently corrected for follow-up inspections.
During our site visit, we observed some of the issues noted on the City inspection reports, including litter on the site; stockpiled recyclables spilling outside the tipping floor; outdoor storage of baled recyclables; and the glass pile encroaching onto the adjacent driveway. In addition, we observed ponding of water in the northeast corner of the site, and two downspouts that had been damaged. Subsequent to this site visit, the City provided photos which indicated part of the push wall within the building had been damaged, as well as an access point to a confined space located within the push wall.
The above issues would not be consistent with best-operating practices.
MDEQ Inspection Reports
The consultant team also reviewed quarterly inspection reports from the Michigan Department of Environmental Quality (MDEQ) from October, 2013 to August, 2015. A total of 8 inspection reports were reviewed. Each of these inspection reports concluded as follows:
As a result of the inspection, staff determined that the above facility was in compliance with the operating procedures that were evaluated as shown in the attached inspection report.
Three of the inspection reports (10/18/2013, 2/13/2014, and 5/1/2014) noted the presence of litter on the site. From a regulatory standpoint, the deficiencies identified by the City have

44 Ann Arbor MRF - Phase I Report October, 2016
not resulted in any compliance issues with the MDEQ during the past two years, and in fact the MDEQ has found the MRF to be operating in compliance. The City provided an inspection report from January, 2005, however, which noted the following:
During the inspection of the Transfer Station and Material Recovery Facility the building was full beyond capacity with waste and cardboard. The waste and cardboard were being deposited outside of the building because there was no room within the building to manage the incoming waste and cardboard. All runoff water and leachate from the outside waste pile area was being discharged to a storm drain which in turn discharged to the waters of the state. Litter was also noted around the north side of the Transfer Station and Material Recovery Facility property and along the perimeter fence.
A letter of warning was issued to the City based on this inspection report, and a written response with corrective actions was required to be submitted to MDEQ.
CP Manufacturing - Equipment Audits The consultant team also reviewed two audits of the single-stream process equipment prepared by CP Manufacturing for the City. The most recent audit was prepared in July, 201529, and included an assessment of 23 major pieces of equipment (e.g., conveyors, screens, eddy current separator). The audit report found that for 18 of the pieces of equipment, one to three component items needed repair. Of the 188 total components evaluated for the 23 pieces of equipment, 26 were indicated as needing repair or maintenance, or approximately 14 percent. This audit concluded that the condition of the equipment is in good operating condition overall.
A more comprehensive audit was performed by CP Manufacturing in November, 201130, and included an assessment of 80 major pieces of equipment. The audit report found that for 71 of the pieces of equipment, one to seven component items needed repair. Of the 618 total components evaluated for the 80 pieces of equipment, 239 were indicated as needing repair or maintenance, or approximately 39 percent. The audit concluded:
Finally, from a maintenance & housekeeping perspective we had several issues as noted within the body of the report. As indicated in the supporting photographs, there are numerous areas within the MRF that require increased maintenance and improved overall housekeeping practices. The majority of these affected areas were not the result of excess spillage, but rather the neglect of the maintenance staff in providing sufficient housekeeping of the equipment.
The audit recommended a number of maintenance activities, including:
Cleaning of plastic film from screen shafts at least once per shift, and possibly two times per shift depending on the amount of plastic film in the inbound recyclables.
Removal of fiber, wire and other wrapped materials from the shafts on conveyors.
Daily monitoring of the rubber-belt conveyors to assure that the belts are running on their tracks.
29 CP Manufacturing, City of Ann Arbor MRF Audit, July 9, 2015. 30 CP Manufacturing, City of Ann Arbor MRF Audit, November 22, 2011.

45 Ann Arbor MRF - Phase I Report October, 2016
Monthly monitoring and tensioning of steel conveyor belts.
Periodic cleaning of conveyor pits (the report noted that it did not appear the pits had been cleaned in more than a year).
Cleaning of electrical cabinets.
Performing housecleaning during breaks.
Performing organized cleaning during periods of down time.
Cleaning of dust and debris to reduce potential fire hazards (the report noted that dust, dirt and debris was found throughout the system, which could be eliminated with a decent housekeeping program).
Weekly inspections of belly pans and removal of excess debris.
Further development of a structured Preventative Maintenance program to preserve and extend the wear life of the individual components, equipment and the overall MRF system.
It is not known if the recommendations were implemented by the contractor after the audit report was received. The recommended practices would help to address some of the issues noted by the City in their monthly inspection reports.
Recommendation:
It is recommended that the City perform an assessment of the physical conditions of the MRF site, building and process equipment. Such an assessment would indicate the nature and extent of any repairs required to the facility. It is also recommended that the site and building be cleaned to remove all litter and residue materials not intended for shipment to market, and to remove dust and debris that may have accumulated on or around the sorting equipment.
The purpose of this recommendation is to prepare the MRF to a state that is ready for the next contractor to begin operations, without having to undertake preliminary repairs. Potential operators will want to view the facility during the procurement process, and having a clean and repaired facility will both communicate the City’s expectations on how the facility is to be maintained, as well as reduce the contingencies that prospective operators might otherwise build into their proposals to cover any unrepaired components of the facility.
Contractual Maintenance Responsibilities in MRF Contracts
In the following sections of this chapter, the primary provisions relating to facility maintenance and the relative responsibilities of the contracting unit of government and the contracted operator in performing and paying for maintenance activities are discussed. Relevant portions from the City of Ann Arbor’s operating agreement are discussed, as well as a comparison of how such matters were addressed in other operating contracts with the aim of identifying whether the City’s agreement is consistent with industry standards.

46 Ann Arbor MRF - Phase I Report October, 2016
General Responsibilities of Contractor
The general responsibilities of the contractor in operating the City’s MRF are stated in Section 2.01 of the contract, which provides:
Contractor shall, at its sole cost and expense, provide all management, supervision, personnel, materials, equipment, services, and supplies (other than Recyclable Materials and Solid Waste after Acceptance) necessary to operate, maintain, and repair the MRF/TS and MRF/TS site in accordance with the terms and provisions of this Operating Contract.
Under Section 2.01, the City is responsible for maintaining the entrance and entrance roads on the City’s property up to the MRF/TS site.
This is a standard provision contained in other operating agreements. The intent is to state that the operator will provide all necessary resources to operate the MRF. It is common for the contracting jurisdiction to have responsibility for access roads to the facility and other public infrastructure.
Note that under the City’s agreement, both the City and contractor make contractual contributions to an Equipment Repair and Replacement Account (as discussed under Repair and Maintenance Costs below).
Safety of Persons and Property Section 2.02 of the City’s operating agreement states, in part: Contractor agrees that it will (a) take all steps necessary to prevent damage, injury
or loss by reason of or related to the operation and maintenance of the MRF/TS, to all persons and to any property on or adjacent to the MRF/TS Site or adjacent thereto, including but not necessarily limited to trees, shrubs, lawns, walks, pavements, roadways, equipment, structures, and utilities...
With respect to facility maintenance (and not safety generally), the purpose of this section is to assure that the contractor does not damage physical improvements to the MRF facility and any surrounding properties, including features such as landscaping.
Similar provisions are contained in other contracts.
Repair and Maintenance Costs
Section 2.10 of the City’s operating agreement establishes equipment repair and replacement accounts, which were subsequently combined into a single capital replacement account. Although the general responsibilities of the contractor (Section 2.01, discussed above) states that the contractor shall maintain and repair the MRF at its sole cost and expense, many MRF operating agreements contain a supplemental provision to address repair and maintenance costs, typically for larger cost items that exceed a specified threshold dollar value and which extend or enhance the useful life of the equipment or asset. The cost of these larger repairs or replacements may be paid by the owner of the MRF, the operator of the MRF, or shared by the owner and operator. Table 12 summarizes the owner and operator responsibilities for the contracts discussed previously in Chapter 4 (note that contracts for processing at company-owned MRFs are not included

47 Ann Arbor MRF - Phase I Report October, 2016
in Table 12 because in those instances, the private-owner is responsible for all maintenance costs).
TABLE 12. CAPITAL REPAIR AND MAINTENANCE COSTS (CONTRACT PROVISIONS)
Jurisdiction Capital Repair/Maintenance Provisions
Unified Gov. of Athens-Clarke County (GA)
County pays for all Capital Repair/Maintenance costs greater than $3,000. No set-aside fund.
Solid Waste Authority of Palm Beach County (FL)
Authority will pay for all Capital Repair/Maintenance costs greater than $5,000, but limited to two balers. No set-aside fund.
Atlantic County Utilities Authority (NJ)
Contractor is responsible for all equipment repair/maintenance costs; note contractor owns the single-stream process equipment under this contract.
Cape May County Municipal Utilities Authority (NJ)
Authority pays for all Capital Repair/Maintenance costs greater than $5,000, but not for single-stream equipment (which is owned by contractor). No set-aside fund.
City of Milwaukee/ Waukesha County (WI)
City pays for all Capital Repair/Maintenance costs greater than $2,500. Set-aside fund used. City and County contribute $4.00/ton on their tonnage, respectively. Contractor contributes $4.00/ton on City/County tonnage and $8.00/ton on third-party tonnage. Per ton amounts from City and County are tiered based on average commodity value.
City of Ann Arbor (MI)
City pays for all Capital Repair/Maintenance costs greater than $4,000. Set-aside fund used. City contributes $2.00/ton on City tonnage. Contractor contributes $4.00/ton on all tonnage, including third-party. Assuming City tonnage = 20% of total tonnage, total deposit to fund averages $4.40/ton.
Source: 1. Review of contract documents for each jurisdiction.
Based on the contractual information in Table 12, the owner of the MRF is typically responsible for capital repairs and maintenance costs above a certain threshold amount, which ranges from $2,500 to $5,000. The contractor is responsible for all equipment repair and maintenance costs under the Atlantic County Utilities Authority agreement; however, as discussed in Chapter 4, under that agreement the contractor owns the single-stream processing equipment. The Cape May County Municipal Utilities Authority contract is somewhat different; under that agreement, the Authority is responsible for all capital repair and maintenance costs except for the single-stream equipment, which was largely paid for and is owned (through the end of the contract term) by the contractors. When the owner pays for capital repair and maintenance costs, cost substantiation is required of the contractor.
Under the City’s operating agreement, both the City and contractor make monthly deposits to a capital reserve fund. The contractor is reimbursed for repair and maintenance costs from this fund. However, the City will not reimburse costs if the fund would incur a negative balance; in that circumstance, the contractor is still obligated to make the repairs and seek reimbursement when funds are available. Historical deposits and expenditures for the City’s capital reserve fund for the MRF are provided in Table 13. Expenditures were

48 Ann Arbor MRF - Phase I Report October, 2016
comparatively high in FY2014, FY2015, and the first three months of FY2016, resulting in near depletion of the fund balance. This suggests that the contributions to the fund may be insufficient.
TABLE 13. CITY OF ANN ARBOR - MRF CAPITAL RESERVE RUND
FY 2010 FY 2011 FY 2012 FY 2013 FY 2014 FY 2015 FY 2016
(Q1)
Beginning Balance $176,713 $97,432 $225,070 $342,515 $327,178 $108,995 $173,372
Fund Contributions
City Contribution $19,274 $22,618 $22,839 $21,571 $23,018 $27,809 $7,442
Contractor Contribution $72,979 $207,746 $206,279 $151,319 $168,585 $246,355 $70,450
Investment income $2,225 $1,324 $2,044 $2,119 $1,381 $0 $0
Subtotal $94,478 $231,688 $231,162 $175,009 $192,985 $274,163 $77,891
Fund Withdrawals
Replace/Repair Expenditures $173,760 $104,049 $113,717 $190,345 $411,168 $209,787 $223,725
Ending Balance $97,432 $225,070 $342,515 $327,178 $108,995 $173,372 $27,538
Source: 1. City financial records.
The City contributes $2.00/ton to the fund, based on City recyclable tonnages delivered to the MRF. The contractor contributed $4.00/ton on all recyclable tonnage, including City material and third-party material. If the City’s material is 20 percent of total tonnage handled at the MRF, this would equate to an average fund deposit of $4.40 per incoming ton.
As indicated in Table 12, the City of Milwaukee and Waukesha County intend to fund their capital reserve fund at the rate of $8.00/ton, a higher rate than used for City’s fund. That amount will be split evenly with the contracted operator on tonnage delivered by the City and County (i.e., the City and County will contribute $4.00/ton, and the operator a matching $4.00/ton). The contractor will also contribute $8.00/ton to the fund on third-party recyclables.
Repair and maintenance cost data was obtained for two other MRFs that are publicly-owned and operated. Kent County, Michigan owns and operates a single-stream MRF which handles approximately 30,000 tons per year of recyclables. According to a recent financial summary, the County is depositing $6.92/ton into its equipment replacement fund31. Again, this is a higher rate than is used for the City’s fund.
31 Kent County Department of Public Works, Looking to Our Future: Recycling & Education Center Service Fees, undated. The financial summary used 2015 data.

49 Ann Arbor MRF - Phase I Report October, 2016
Outagamie County, Wisconsin developed a single-stream MRF in conjunction with neighboring Brown and Winnebago counties. The facility processes approximately 90,000 tons per year of recyclables. For FY2015 and FY2016, the counties budgeted on average $8.40/ton for capital outlays (excluding certain long-term improvements such as a maintenance shop and dust control system) and repairs and maintenance.
These data suggest that the City may need to increase the funding rate for the MRF capital reserve fund. Historically, the City and contractor established the per ton funding based on a yearly forecast of future repair and replacement events. It would appear that actual repair and replacement costs have exceeded those forecasts.
Going forward, there are two options the City could consider for handling major repair and maintenance costs at the MRF. First, the City could make all such costs the responsibility of the operator, who would then build those costs into the processing fee or trigger price for revenue share. Such an arrangement would make the operating agreement easier to administer for the City. However, this could lead to the operator building in extra contingency into the operating cost, because they might not have familiarity with the City’s equipment.
The second option would be to continue as under the existing operating agreement and make contributions to the capital repair and replacement fund. The model adopted in the City of Milwaukee’s contract is reasonable in that both the City and operator contribute to the fund, providing for a sharing of costs.
Recommendation:
The City’s capital reserve fund has been drawn down and historically has been underfunded. It is recommended that the operating contract be modified to include a higher contribution rate of $8.00/ton. For City recyclables, the City’s contribution would be $4.00/ton and the contractor’s contribution would be $4.00/ton. For third-party recyclables, the contractor’s contribution would be $8.00/ton. It is also recommended that the contractor prepare a year-by-year forecast of anticipated repairs and replacement events to be paid for through the fund to assist in monitoring fund expenditures and balances.
Litter
Section 2.06 of the City’s operating agreement states in part:
The Contractor shall operate the MRF/TS in a manner which will limit the generation of litter to the greatest extent possible and shall take all steps necessary to collect and dispose of any litter generated by the MRF/TS or on the MRF/TS Site. Any fines levied against the MRF/TS operation for litter violations shall be promptly paid by Contractor.
Properly understood, this provision conveys a broad responsibility of the operator to limit the generation of litter in the first place, and to take all steps necessary to collect and dispose of litter. Some of the contracts were more specific concerning litter control, however, stating that litter shall be collected daily or more frequently if necessary.
In addition, several of the contracts included cleaning or housekeeping provisions. The Athens-Clarke agreement included a requirement for cleaning the exterior and interior of

50 Ann Arbor MRF - Phase I Report October, 2016
the building on an annual basis, and the Solid Waste Authority of Palm Beach County agreement required interior and exterior cleaning on a quarterly basis. Such provisions are not contained in the City of Ann Arbor’s operating agreement.
Recommendation:
It is recommended that the litter provisions in the City’s current operating agreement be amended to include housekeeping provisions as follows:
Litter and Housekeeping
The Contractor shall operate the MRF/TS in a manner which will limit the generation of litter to the greatest extent possible and shall take all steps necessary to collect and dispose of any litter generated by the MRF/TS or on the MRF/TS Site. Litter shall be collected at least daily or more frequently as necessary. Any fines levied against the MRF/TS operation for litter violations shall be promptly paid by Contractor.
The exterior of the MRF/TS shall be cleaned on an annual basis. The interior of the MRF/TS shall be cleaned on an annual basis to include the removal of dust from ceiling structures, equipment, walls, floors and light fixtures. Floors and pushwalls in the TS shall be cleaned as necessary to prevent buildup of residues that may contribute to odors.
Contractor and the County shall agree upon a limited tour route where visitors, accompanied by the County or Contractor personnel, are allowed to view the operation. Contractor shall make reasonable effort to keep the tour route free of litter during operations. The tour route, sorting platforms, floor areas beneath the sorting platforms, outside areas within the perimeter fence, drainage ways, and landscape areas shall be cleaned of all litter at the end of each operating day.
The City will clean and maintain the second-floor office area used for education meetings. Contractor will not be allowed to use the second-floor office area or bathroom facilities.
Storage of Materials
City inspection reports for the MRF indicated that, on certain inspection dates, incoming recyclable materials were being tipped outside the building because there was no room on the tipping floor. Baled recyclables were also observed on some of those dates, and were observed on the site tour conducted for this study.
There are no provisions in the City’s operating agreement, however, specifically addressing the storage of incoming or processed recyclables. Most of the other contracts reviewed included such provisions, and generally required handling of incoming recyclables on the tipping floor, unless approved by the contracting entity. The contracts typically required storage of processed recyclables within the building or, if outside, in covered containers or trailers, although some contracts allowed outdoor storage. Outdoor storage of materials, if not under cover or in containers or trailers, can lead to product degradation and therefore indoor storage is recommended.

51 Ann Arbor MRF - Phase I Report October, 2016
Recommendation:
It is recommended that a provision addressing the handling of incoming recyclables and storage of processed recyclables be added to the operating agreement.
Storage:
All incoming Recyclable Materials shall be unloaded within the MRF building, unless authorized by the City. All Recovered Materials shall be stored within the MRF building or in covered containers or trailers, unless authorized by the City.
Operations and Maintenance Plan
Section 2.07 of the operating agreement requires the contractor to deliver an Operation and Maintenance Manual to the City. The Operation and Maintenance Manual is defined to include drawings, diagrams, schematics, instructions, part lists, schedules, procedures, preventative maintenance checklists and other literature and/or protocols provided by equipment suppliers or subcontractors or developed by the Contractor. The stated goal of the manual is to provide guidance in and define minimum performance requirements for operating, maintaining and repairing all major equipment and other mechanical, electrical and instrumentation and control systems installed in the facility.
While useful and necessary information, the Operation and Maintenance Manual is focused on equipment, and does not address other aspects of MRF operations such as staffing, processing shifts, handling of materials, safety, marketing of materials, contingency plans, etc. While these operational factors may be addressed in contract provisions, an Operations and Maintenance Plan would provide more comprehensive and detailed information as to how the contractor will operate and manage the City’s facility. Most of the other contracts we reviewed included a requirement that the operator prepare an Operations and Maintenance Plan.
Recommendation:
It is recommended that the Operation and Maintenance Manual, as currently defined in the operating agreement, be changed to an Operation and Maintenance Plan that, in addition to information on process equipment, includes other information on how the facility will be operated by the contractor.
Facility Conditions at End of Contract
There are no provisions in the City’s operating agreement addressing facility conditions at the end of the contract term. Some of the other operating agreements we reviewed included the preparation of an evaluation report by the contracting jurisdiction to assess the condition of the facility and equipment prior to the contract expiring.
Recommendation:
It is recommended that the City consider adding a provision to the contract for an evaluation of facility conditions at the end of the contract term:

52 Ann Arbor MRF - Phase I Report October, 2016
Final Evaluation of Building and Equipment
No less than one hundred and twenty (120) days prior to the end of the Term, the City shall deliver a written report to the Contractor which evaluates the MRF/TS building and equipment in terms of overall condition, useful life remaining, and whether they have been maintained in accordance with the provisions of this Contract. The report will also set forth any Contractor action, including maintenance and repairs, that may be required to meet the obligations of this Contract. Within fifteen (15) days of delivery of the written report, the Contractor and the City shall mutually agree on the necessary repairs in accordance with the terms of this Contract. All repairs to the MRF/TS, facility site and/or equipment shall be completed by the Contractor a minimum of fifteen (15) days prior to the end of the Term.
At the end of the Term, the Contractor shall cooperate with the City to achieve a prompt and smooth transition of the MRF/TS to another entity, if applicable.
Enforcement Enforcement of the contract is a legal issue and beyond the scope of this study and our expertise. We note that two of the contracts we reviewed, in addition to default provisions, contained liquidated damage provisions. The liquidated damages addressed issues such as timely submission of monthly reports, litter control and site cleanliness, maintenance of equipment and other contractual requirements. Notice to the contractor of the deficiency, as well as time for the contractor to cure the deficiency were still required, but time periods were shorter than otherwise applicable under the default provisions. The City may wish to explore the need for liquidated damage provisions with its attorney.
Permitting The City’s operating agreement does not make reference to permits. Of the other contracts we reviewed, four had provisions related to permits. Three of the contracts assigned the responsibility for securing permits to the contractor, while the other stated (rather generally) that each party would secure the permits it was required to obtain.
Although the majority of contracts noted above assigned permitting responsibility to the contractor, in our experience there is no industry standard with respect to permitting. The City could retain responsibility for permitting or assign it to the contractor, depending on the City’s preference, and be consistent with industry practice.
Assignment Section 17.04 of the operating agreement states: This Contract shall be binding on Contractor and its successors and assigns.
Neither Party to the Operating Contract shall assign the Construction Contract, this Operating Contract, or any document or instrument executed in connection to them without the written consent of the other. Notwithstanding the foregoing, the City is permitted to assign these Contracts, and any related documents and instruments to the State of Michigan or an agency of the State of Michigan.

53 Ann Arbor MRF - Phase I Report October, 2016
This appears to be one of the stronger assignment clauses in the contracts we reviewed. One of the other contracts required consent for the contract to be assigned by the Contractor, but stated that such consent could not be unreasonably conditioned, withheld or delayed. Another of the contracts allowed the agreement to be assigned to a successor company after a merger or sale, or to an affiliate of the company, without the consent of the contracting unit of government.
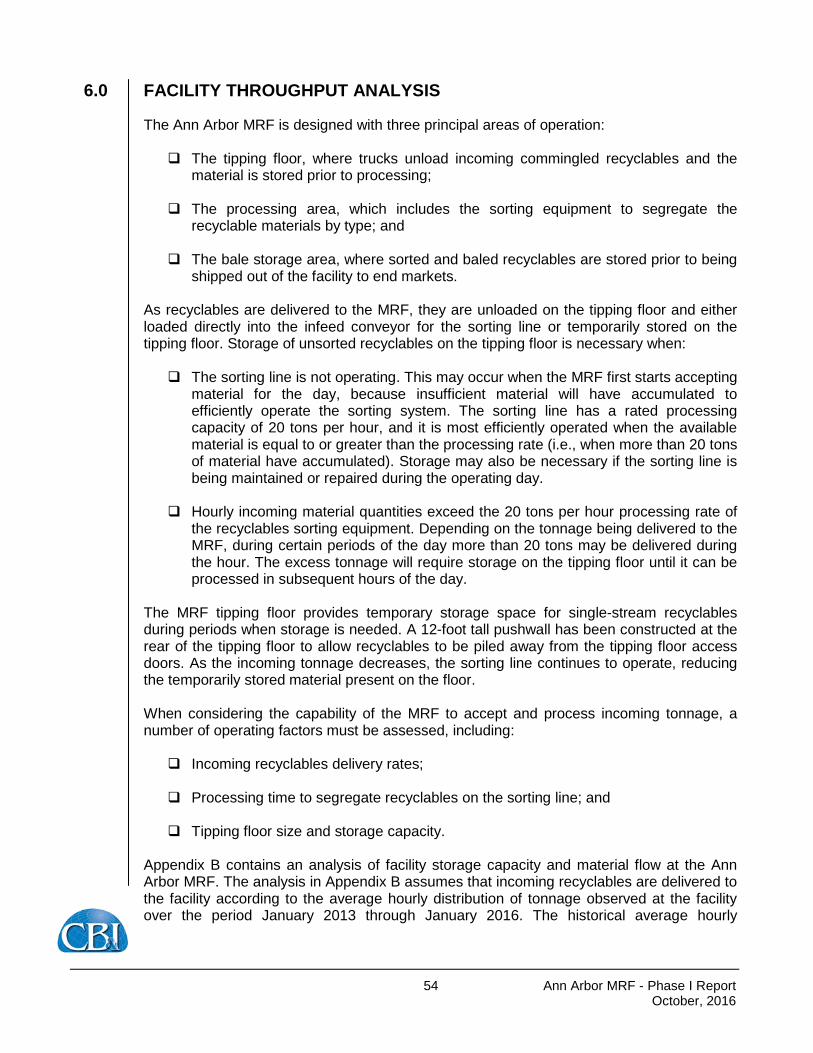
54 Ann Arbor MRF - Phase I Report October, 2016
6.0 FACILITY THROUGHPUT ANALYSIS
The Ann Arbor MRF is designed with three principal areas of operation: The tipping floor, where trucks unload incoming commingled recyclables and the
material is stored prior to processing;
The processing area, which includes the sorting equipment to segregate the recyclable materials by type; and
The bale storage area, where sorted and baled recyclables are stored prior to being shipped out of the facility to end markets.
As recyclables are delivered to the MRF, they are unloaded on the tipping floor and either loaded directly into the infeed conveyor for the sorting line or temporarily stored on the tipping floor. Storage of unsorted recyclables on the tipping floor is necessary when: The sorting line is not operating. This may occur when the MRF first starts accepting
material for the day, because insufficient material will have accumulated to efficiently operate the sorting system. The sorting line has a rated processing capacity of 20 tons per hour, and it is most efficiently operated when the available material is equal to or greater than the processing rate (i.e., when more than 20 tons of material have accumulated). Storage may also be necessary if the sorting line is being maintained or repaired during the operating day.
Hourly incoming material quantities exceed the 20 tons per hour processing rate of the recyclables sorting equipment. Depending on the tonnage being delivered to the MRF, during certain periods of the day more than 20 tons may be delivered during the hour. The excess tonnage will require storage on the tipping floor until it can be processed in subsequent hours of the day.
The MRF tipping floor provides temporary storage space for single-stream recyclables during periods when storage is needed. A 12-foot tall pushwall has been constructed at the rear of the tipping floor to allow recyclables to be piled away from the tipping floor access doors. As the incoming tonnage decreases, the sorting line continues to operate, reducing the temporarily stored material present on the floor. When considering the capability of the MRF to accept and process incoming tonnage, a number of operating factors must be assessed, including: Incoming recyclables delivery rates;
Processing time to segregate recyclables on the sorting line; and
Tipping floor size and storage capacity.
Appendix B contains an analysis of facility storage capacity and material flow at the Ann Arbor MRF. The analysis in Appendix B assumes that incoming recyclables are delivered to the facility according to the average hourly distribution of tonnage observed at the facility over the period January 2013 through January 2016. The historical average hourly

55 Ann Arbor MRF - Phase I Report October, 2016
distribution is depicted in Figure 6. Based on the historical operation of the facility, recyclables are largely delivered to the facility between 7:00 A.M. and 4:00 P.M.32, with peak deliveries occurring in the 12:00-1:00 P.M. hour. Figure 6 also shows that, on an hourly basis, more than 10 percent of total daily tons are received in each of the hours between 10:00 A.M. and 3:00 P.M., resulting in a consistent flow of incoming material through an extended portion of the operating day.
FIGURE 6. HOURLY DISTRIBUTION The analysis in Appendix B documents that the MRF tipping floor can store 1,555 cubic yards, or 127 tons, of recyclable materials awaiting processing. The designated stockpiles depicted in Figure 1 of Appendix B reflect sound operating practices by providing adequate space within the building for the unloading, handling, and storage of incoming materials. They also reflect that clear access to a confined space entry located along the pushwall is maintained (refer to Appendix B). The confined space entry is depicted in the photos in Figure 6 below. As shown in the photo on the left, during a February 23, 2016 inspection of the MRF the confined space was not covered, and an “OPEN” marking was spray-painted at the top of the pushwall presumably to ensure the space was not blocked by stored materials. The photo on the right in Figure 7 shows the appearance of the confined space entry on July 20, 2016, at which time the opening was covered with steel plating and labeled with a warning sign.
32 A small amount of tonnage (1% or less of total tons) has historically been delivered in the 6:00 A.M., 4:00 P.M., and 5:00 P.M. hours at the MRF.
12:0
0 A
M
1:00
AM
2:00
AM
3:00
AM
4:00
AM
5:00
AM
6:00
AM
7:00
AM
8:00
AM
9:00
AM
10:0
0 A
M
11:0
0 A
M
12:0
0 P
M
1:00
PM
2:00
PM
3:00
PM
4:00
PM
5:00
PM
6:00
PM
7:00
PM
8:00
PM
9:00
PM
10:0
0 P
M
11:0
0 P
M
0%
5%
10%
15%
Per
cent
of D
aily
Ton
s R
ecei
ved

56 Ann Arbor MRF - Phase I Report October, 2016
FIGURE 7. CONFINED SPACE ACCESS IN PUSHWALL
(LEFT: FEBRUARY 23, 2016; RIGHT: JULY 20, 2016) The stockpiles also assume that all other areas of the pushwall are continuous. Currently, it appears that a portion of the pushwall approximately 50 feet west of the infeed conveyor may require repair to provide a continuous pushwall in that area (see Figure 8).
FIGURE 8. DISCONTINUITY IN PUSHWALL

57 Ann Arbor MRF - Phase I Report October, 2016
Appendix B also contains an analysis of facility throughput at select daily tonnages with the following assumptions: Incoming tonnage is distributed based on the historical incoming distribution of tons
at the facility;
The recyclables sorting line can process up to 20 tons of recyclables per hour;
Recyclables are sorted beginning in the first hour that sufficient material is projected to be available; and
Recyclables sorting continues at a consistent rate every hour until no material remains to be processed.
Daily tonnages evaluated in Appendix B were selected based on historical operations at the Ann Arbor MRF and include: 60 tons per day, based on approximate average City of Ann Arbor deliveries to the
MRF in 2015 of 57 tons per day, assuming delivery occurs 5 days per week (260 days per year). Tipping floor storage in this scenario assumes a reduced processing rate of 10 tons per hour.
300 tons per day, based on approximate average weekday (Monday-Friday) deliveries to the MRF in 2015 of 294 tons per day33.
400 tons per day, based on maximum daily receipts at the MRF in 2015. In 2015, the MRF received more than 400 tons on 6 operating days, with a maximum of 466 tons received in one day.
A sensitivity analysis was also performed assuming the recyclables sorting line processes 15 tons of recyclables per hour rather than 20 tons per hour. This reduction was made because sorting lines may be slowed down due to contamination present in incoming materials or the need to maintain sorter efficiency, or the line may be inoperable during certain periods of the day due to employee breaks or unplanned downtime. The sensitivity analysis considered incoming daily tonnages of 260 tons and 300 tons. Figure 9 depicts the maximum tipping floor storage capacity required at the various tonnage levels evaluated in Appendix B. As shown in Figure 9, when daily throughput exceeds 300 tons and the processing line is operated at a rate of 20 tons per hour, the projected tipping floor storage required exceeds the facility’s available storage capacity. If the processing line operates at a reduced rate of 15 tons per hour, the tipping floor storage capacity is exceeded when the facility receives more than 260 tons per day. This indicates that an operational capacity of the MRF may be 300 tons per day, assuming the processing line operates at its rated capacity; the operational capacity may be reduced to 260 tons per day if the processing rate is reduced to 15 tons per hour.
33 Some Saturday and Sunday deliveries occur at the MRF; however, these quantities are small and are not typical and were therefore excluded in calculating the daily average tonnage.

58 Ann Arbor MRF - Phase I Report October, 2016
FIGURE 9. TIPPING FLOOR STORAGE REQUIREMENTS VS. DAILY THROUGHPUT Figure 10 identifies the frequency distribution of incoming tonnage, representing the number of operating days per year that incoming tonnage was within various tonnage ranges. The total annual inbound tonnage (Monday-Friday34) at the Ann Arbor MRF increased steadily in recent years, from 42,895 tons in 2013 to 75,184 tons in 2015. Similarly, daily tonnages showed an increase over the same period: In 2013, the MRF received 200 tons of material per day or less on a majority of
operating days. The MRF never received more than 300 tons on an operating day in 2013.
In 2014, the facility received between 200 and 300 tons per day on approximately half of the operating days. The MRF received more than 300 tons per day on 54 operating days.
In 2015, the facility accepted more than 300 tons on 117 out of 256 operating days (nearly 46% of operating days).
34 Note that this represents the annual tonnage received on weekdays (Monday through Friday). Previously in this report, annual tonnages were indicated at 44,000 tons (2013) to 77,000 tons (2015), but those values included recyclables delivered on Saturday and Sunday.
124
163
32
118
218
60 tpd 300 tpd 400 tpd 260 tpd 300 tpd
Total MRF Tonnage for Day (tons per day)
0
50
100
150
200
250
Pea
k H
our S
tora
ge o
n Ti
ppin
g Fl
oor (
tons
)
Processing Line = 20 tons per hour Processing Line = 15 tons per hour
Maximum Tipping FloorStorage Capacity = 127 tons

59 Ann Arbor MRF - Phase I Report October, 2016
The throughput analysis in Appendix B and described above indicates that the quantity of material stored on the tipping floor may have exceeded the facility’s tipping floor storage capacity on nearly half of the operating days in 2015.
FIGURE 10. FREQUENCY DISTRIBUTION OF DAILY THROUGHPUT LEVELS, BY YEAR
Observed Facility Storage Conditions CB&I was provided a tour of the facility on March 24, 2016 and observed that material on the tipping floor was piled to the facility access doors (see Figure 11), exceeding the typical stockpile areas identified in Figure 1 in Appendix B35. Figure 5 in Appendix B represents the stockpile dimensions observed during the March 24, 2016 facility tour, which is estimated to contain 227 tons of recyclables.
35 Invoice records indicate the MRF received 138 tons of material on the date of the tour, and that prior days during the week the facility received between 284 and 297 tons per day. Based on the observed quantity of unprocessed material, a portion of the material present on March 24 may have been delivered on prior operating days.
1 0 17
36
94
86
25
4 21 1
4437
5662
36
16
2 00 0
70
149
35
1 0 0 0 0
0-50 51-100 101-150 151-200 201-250 251-300 301-350 351-400 401-450 451-500
Recyclables Received (tons per day)
0
50
100
150
Num
ber o
f Ope
ratin
g D
ays
2013 2014 2015

60 Ann Arbor MRF - Phase I Report October, 2016
FIGURE 11. RECYCLABLE MATERIAL OUTSIDE THE BUILDING (MARCH 24, 2016)
As shown in the photo in Figure 11, recyclables were spilling out of the MRF due to the material being stored up to the tipping floor access doors. This was an issue noted on several dates in 2015 as well, as documented in City inspection reports and shown in the photos in Figure 12.

61 Ann Arbor MRF - Phase I Report October, 2016
FIGURE 12. RECYCLABLE MATERIAL OUTSIDE THE BUILDING
OR EXCEEDING STOCKPILES As a result of the accumulation of material up to and beyond the tipping floor access doors, other operational and site issues can occur. Figure 13 below shows litter outside of the building and collecting on pavement areas and along the fenceline, which may have resulted from operating with material stored at the facility access doors on March 24, 2016.
March 26, 2015
November 5, 2015 October 27, 2015
October 15, 2015

62 Ann Arbor MRF - Phase I Report October, 2016
FIGURE 13. LITTER OUTSIDE MRF BUILDING (MARCH 24, 2016)
Facility Throughput - Recommendations Based on the throughput analysis and review of historical operating conditions, the following recommendations are made:
1. A conditions assessment of the MRF should be completed. The conditions assessment is expected to identify any necessary repairs to the pushwall and other components of the MRF. This will serve to ensure that storage areas, and resulting available storage capacity, are maximized to the extent possible.
2. All material unloading, storage, and handling should occur within the MRF building. Material should not be stockpiled in areas that result in the need to perform any portion of facility operations outside of the building, and materials should not be stockpiled outside of the areas designated for stockpiling on Figure 1 in Appendix B.
3. Based on the throughput analysis, daily incoming material deliveries should be limited to 260 tons per day, unless the operator can demonstrate they are consistently achieving a processing rate of 20 tons per hour and all material is being adequately handled within the building throughout the operating day. If such a demonstration is made, the daily limit could be increased to 300 tons per day.

63 Ann Arbor MRF - Phase I Report October, 2016
7.0 ALTERNATIVE BUSINESS MODELS
This chapter assesses alternative business models for the City’s MRF, including continued private operation, sale of the facility, and public operation. In conducting this evaluation, we interviewed potential MRF operators for their interest in operating the City’s MRF, owning the City’s MRF, or transloading recyclables to a company-owned MRF (refer to Appendix C). We also reviewed the GAA national database of MRFs to identifying prevailing business models. Finally, we considered current industry trends and historical operating practices of the City.
Based on this analysis and for the reasons described more fully below, it is our recommendation that the City continue to contract with a private company to operate the City’s MRF.
Private Ownership/Private Operation
The City could conceivably offer the MRF for sale to a private company. As discussed in Chapter 2, approximately 75 percent of the single-stream MRFs in the U.S. are privately-owned and operated. However, the privately-owned MRFs are on average 72,000 square feet in size versus 37,700 square feet for the City’s facility, suggesting a preference for large facilities.
Since the City has already invested in upgrading the MRF for single-stream capability, there is no underlying financial need for the City to sell the facility. Although there might be an initial cash inflow to the City, the new owner of the facility would need to recover the purchase price, and that would likely translate into higher processing fees to manage the City’s recyclables. In effect, the City would be receiving a loan from the purchaser that is repaid through higher service fees.
The industry is currently grappling with low commodity prices, and in some cases companies are rationalizing assets (i.e., closing facilities). Although MRFs have been acquired in the past, it is unclear what valuation the City’s facility would command given current market conditions, and the City would be selling at a low point in the market. One interview respondent, however, did indicate a preference to purchase or lease the facility versus operating it.
There could be operational challenges for the City if it sold the facility. Currently, the scale at the MRF is used to weigh vehicles using the transfer station and the compost facility. Without the MRF scale, the City would potentially have to develop additional scale facilities. City staff also indicated that the PUD approval for the site might preclude a sale.
Public Ownership/Public Operation
The City could also elect to operate the MRF. According to the GAA database, publicly-owned and operated MRFs represent approximately 13 percent of single-stream facilities in the U.S., roughly the same proportion as publicly-owned and privately-operated facilities.
There are a number of risks that the City would have to accept in operating the MRF:
Sourcing third-party waste (with the aim of reducing per ton operating costs) can be a challenging activity for governments, because they are more service-oriented than sales-oriented.

64 Ann Arbor MRF - Phase I Report October, 2016
If contracts are used to source third-party materials, then contract documents will have to be prepared and approved and it is unclear what duration will be attractive within the marketplace. The City would likely prefer longer-term contracts to provide stable tonnage, but third-party customers may prefer short-term deals. Marketing of third-party customers would be an important and on-going activity for the City.
Budgeting could be complicated if third-party tonnages fluctuate.
The City would also have to market the recovered materials, which is another skill set, although a broker or contractor could be retained to sell the materials.
There is high employee turnover in MRF staffing, particularly for sorters. The City could mitigate this risk by contracting with a temporary placement firm or a not-for-profit organization offering job training services.
To assess the costs of publicly-operated MRFs, we researched operating and cost information for three publicly-owned and operated MRFs in the midwest: Kent County (Michigan), Outagamie County (Wisconsin) and Scott County (Iowa). These data are summarized in Table 14.
TABLE 14. SUMMARY COST DATA (PUBLICLY-OPERATED MRFs)
Facility Throughput
(Tons Per Year) Operating Cost
($/ton) Cost with Debt
($/ton) Kent County (MI) 34,000 $65.99 $92.58 Outagamie County (WI) 90,000 $57.65 $79.37 Scott County (IA) 15,000 $64.00 $90.00 Source: 1. Kent County Department of Public Works, Looking to Our Future, Recycling &
Education Center Service Fees, undated. 2. Outagamie County, FY2016 Approved Budget. 3. Scott County Waste Commission: Personal communication with operations
manager. The Scott County MRF began operating in August, 2016, and therefore costs are projected and not based on actual historical operating costs.
Operating costs for the publicly-operated MRFs range from $57.65 to $65.99/ton.
The data presented earlier in Table 11 indicate the following processing fees at publicly-owned and privately-operated MRFs36:
Solid Waste Authority of Palm Beach County = $47.77/ton Athens-Clarke County = $56.00-$63.00/ton City of Milwaukee/Waukesha County = $30.00-$39.75/ton
36 The hybrid structure of Ann Arbor’s contract, which includes a tipping fee and a trigger price for revenue share, prevents a clear comparison with the publicly-operated facilities.

65 Ann Arbor MRF - Phase I Report October, 2016
The appropriate comparison for these processing fees is the operating costs for the publicly-owned facilities. Generally, the public-facility operating costs are at the higher end of the range, or somewhat above, the processing fees charged by the private-operators.
The data presented earlier in Table 11 indicate the following processing fees or trigger prices for recyclables delivered to a privately-owned MRF:
City of Chicago = $61.00/ton Solid Waste Agency of Lake County = $65.00/ton Solid Waste Agency of Northern Cook County = $75.00/ton Morris County Utilities Authority = $92.00/ton
Since these are privately-owned facilities, the trigger prices include capital, and so the appropriate comparison with the publicly-operated facilities is the cost including debt, which ranges from $79.37 to $92.58/ton. Again, this is at the higher end of the range for the privately-owned and operated facilities.
According to the Kent County Public Works Department, the Kent County MRF had a $1.6 million deficit in 2015, following smaller losses in 2012, 2013 and 2014. The cumulative deficit from 2012 to 2015 amounts to approximately $2,655,00037.
The deficit in 2015 was attributed to declining commodity prices. The average per ton revenue from the MRF that year was $62.00/ton, which was not sufficient to cover operating costs. The County is contemplating instituting a service fee of approximately $30.00/ton to help close the gap.
The Scott County Waste Commission charges local communities a processing fee of $80.00/ton. The Commission provides the communities with a revenue share of 50 percent of average commodity revenue above $80.00/ton.
Because public-operation does not appear to offer potential cost savings, and because the City would have to address challenges such as staffing turnover, securing third-party recyclables, and marketing recovered materials, it is recommended that the City request proposals from private companies to operate the MRF.
Public Ownership/Private Operation
The City’s MRF has been privately-operated under contract since operations commenced in 1995. The City also contracts with a private company to operate the compost facility, and a not-for-profit group to perform curbside recycling collection. Thus, private operation of the MRF is consistent with historical practice. An experienced company can address the numerous technical, operational and marketing requirements associated with a MRF, although will not be able to eliminate commodity risk. A number of interview respondents expressed interest in operating the City’s facility (refer to Appendix C).
37 Kent County Department of Public Works, Looking to Our Future, Recycling & Education Center Service Fees, undated.

66 Ann Arbor MRF - Phase I Report October, 2016
Recommendations:
1. It is recommended that the City prepare and issue a Request for Proposals (RFP) to private companies to operate the City’s MRF.
2. A draft operating agreement should be included in the RFP. The previous
operating agreement can be used as a starting point, but it can be significantly streamlined by removing references to construction activities and incorporating relevant parts of the contract amendments within a single, restated agreement. The draft agreement should also incorporate the recommendations contained in this report with respect to revenue sharing and operation and maintenance of the facility.
3. A term of 5-years is recommended, with one 5-year extension allowed upon
mutual agreement of the City and operator. Because MRFs require 20 or more employees to operate, a shorter term might discourage private companies from investing the resources to staff the facility. Because commodity markets are currently depressed, the 5-year initial term will provide a chance to the City to renegotiate contract terms if markets improve during that period.
4. Provide they submit a base proposal to operate the MRF, we recommend that
vendors be allowed to submit alternate proposals if they can be demonstrated to provide value to the City.

Appendix AAnn Arbor MRFHistorical Commodity Revenues

Page: 1 of 9
Client: City of Ann Arbor
Project: Ann Arbor MRF Evaluation
Project #: 631214112
Calculated By: CMS Date: 8/2016
Checked by: PPK Date: 8/2016
TITLE: MARKET PRICING COMPARISON
The data summarized herein reflects a comparison of historical pricing for recyclable commodities reported by various pricing indices against the revenue reported to Ann Arbor from sale of materials at the Ann Arbor MRF. Pricing indices referenced included the following:
RISI: RISI provides comprehensive historical and current monthly market pricing data for all fiber grades on an average national basis and a regional basis across the U.S. RISI data was obtained for comparison from May 2014 through March 2016.
Secondary Fiber Pricing / Secondary Materials Pricing (SFP): SFP provides historical and current weekly market pricing data for all paper grades, plastics, glass, and aluminum on a regional basis across the U.S. SFP pricing data is available for comparison from January 2012 through March 2016.
For both the RISI and SFP indices, Midwest / Chicago regional pricing was accessed and compared to Ann Arbor’s revenues. Index pricing represents averaged survey data from the market and does not always reflect actual pricing available in specific markets at a given point in time. However, indices can be used to gauge relative pricing performance over time.
Figures 1 through 8 below provide pricing comparisons of Ann Arbor revenues versus market indices from January 2012 through March 2016. Index pricing is reported as the price paid for material picked up from the MRF dock (FOB the dock), and therefore is inclusive of transportation costs from the MRF to the end market (mill). However, certain markets for cardboard, newspaper, and mixed paper from Ann Arbor paid revenue upon delivery to the mill (FOB the mill), therefore incurring an additional transportation cost that was not reflected in the revenue paid. Outbound tonnage reports were provided by the City for the period January 2012 through March 2016, which reflected the outbound shipment of recyclable commodities and the revenue paid for each shipment; no transportation costs were included in the outbound tonnage report for the shipments that incurred an additional transportation cost. Monthly invoices to the City from ReCommunity were provided for the period January 2015 through March 2016, which included transportation costs on applicable shipments. The pricing trends for cardboard, newspaper, and mixed paper therefore include: 1) the gross revenue paid for materials shipped from the Ann Arbor MRF (without adjustment for transportation costs) from January 2012 through March 2016; and 2) the revenue net of transportation for January 2015 through March 2016. The impact of this adjustment is discussed in conjunction with the relevant graphs below.

Page: 2 of 9
Client: City of Ann Arbor
Project: Ann Arbor MRF Evaluation
Project #: 631214112
Calculated By: CMS Date: 8/2016
Checked by: PPK Date: 8/2016
TITLE: MARKET PRICING COMPARISON
FIGURE 1. OLD CORRUGATED CARDBOARD (OCC)
Figure 1 depicts OCC pricing and indicates the following:
Ann Arbor’s revenue for OCC has generally followed the SFP and RISI pricing trends.
Since May 2014, Ann Arbor’s revenue for OCC exceeded both market indices.
Three of the historic markets to which Ann Arbor’s OCC was shipped incurred a transportation cost, representing up to 30% of outbound tonnage. Adjusting the gross revenue to reflect transportation costs, Ann Arbor’s OCC revenue continued to be in line with, and slightly higher than, market indices.
$40
$60
$80
$100
$120
$140
$160
Jan‐12
Mar‐12
May‐12
Jul‐12
Sep‐12
Nov‐12
Jan‐13
Mar‐13
May‐13
Jul‐13
Sep‐13
Nov‐13
Jan‐14
Mar‐14
May‐14
Jul‐14
Sep‐14
Nov‐14
Jan‐15
Mar‐15
May‐15
Jul‐15
Sep‐15
Nov‐15
Jan‐16
Mar‐16
Reven
ue ($/ton)
Ann Arbor (gross) Ann Arbor(net of transportation) RISI‐Midwest SFP ‐ Midwest

Page: 3 of 9
Client: City of Ann Arbor
Project: Ann Arbor MRF Evaluation
Project #: 631214112
Calculated By: CMS Date: 8/2016
Checked by: PPK Date: 8/2016
TITLE: MARKET PRICING COMPARISON
FIGURE 2. NEWSPAPER (ONP)
Figure 2 depicts newspaper pricing and indicates the following:
Newspaper pricing overall declined approximately 50% from January 2012 to March 2016.
Ann Arbor’s revenue for newspaper has generally followed the SFP and RISI pricing trends.
Since September 2014, Ann Arbor’s gross revenue for newspaper consistently exceeded both market indices.
Approximately 70% of newspaper marketed from Ann Arbor incurred a transportation cost. Adjusting the gross revenue to reflect transportation costs, Ann Arbor’s newspaper revenue was between the market indices until October 2015 when Ann Arbor’s pricing dropped. It is notable that, beginning in October 2015, nearly all outbound shipments were to markets that incurred added transportation cost, which likely contributed to net revenue falling below the market indices. Pricing appears to have come back in-line with the indices in March 2016, indicating newspaper markets may be improving.
$30
$40
$50
$60
$70
$80
$90
$100
$110
Jan‐12
Mar‐12
May‐12
Jul‐12
Sep‐12
Nov‐12
Jan‐13
Mar‐13
May‐13
Jul‐13
Sep‐13
Nov‐13
Jan‐14
Mar‐14
May‐14
Jul‐14
Sep‐14
Nov‐14
Jan‐15
Mar‐15
May‐15
Jul‐15
Sep‐15
Nov‐15
Jan‐16
Mar‐16
Reven
ue ($/ton)
Ann Arbor (gross) Ann Arbor(net of transportation) RISI‐Midwest SFP ‐ Midwest
Page: 4 of 9
Client: City of Ann Arbor
Project: Ann Arbor MRF Evaluation
Project #: 631214112
Calculated By: CMS Date: 8/2016
Checked by: PPK Date: 8/2016
TITLE: MARKET PRICING COMPARISON
FIGURE 3. MIXED PAPER
Figure 3 depicts mixed paper pricing and indicates the following:
Ann Arbor’s revenue for mixed paper has generally followed the SFP and RISI pricing trends, though it has shown more month to month variability than the indices. (No Ann Arbor revenue data was available for mixed paper for the period January 2014 through March 2014.)
Since May 2015, Ann Arbor’s gross revenue for mixed paper exceeded both market indices.
A small number of mixed paper loads historically incurred an additional transportation cost, and no transportation costs were incurred after August 2015. Adjusting the gross revenue to reflect transportation costs, since mid-2015 Ann Arbor’s mixed paper revenue was consistently higher than the market indices.
$30
$40
$50
$60
$70
$80
$90
$100
Jan‐12
Mar‐12
May‐12
Jul‐12
Sep‐12
Nov‐12
Jan‐13
Mar‐13
May‐13
Jul‐13
Sep‐13
Nov‐13
Jan‐14
Mar‐14
May‐14
Jul‐14
Sep‐14
Nov‐14
Jan‐15
Mar‐15
May‐15
Jul‐15
Sep‐15
Nov‐15
Jan‐16
Mar‐16
Reven
ue ($/ton)
Ann Arbor (gross) Ann Arbor(net of transportation) RISI‐Midwest SFP ‐ Midwest

Page: 5 of 9
Client: City of Ann Arbor
Project: Ann Arbor MRF Evaluation
Project #: 631214112
Calculated By: CMS Date: 8/2016
Checked by: PPK Date: 8/2016
TITLE: MARKET PRICING COMPARISON
FIGURE 4. SORTED OFFICE PAPER
Figure 4 depicts sorted office paper pricing and indicates the following:
Sorted office paper is a much smaller fraction of the recyclable commodities recovered at the Ann Arbor MRF. As a result, data on Ann Arbor’s sorted office paper revenue is sporadic through 2012 and 2013, with more consistency in monthly transactions beginning in 2014.
Ann Arbor’s revenue for sorted office paper has generally followed the RISI pricing trend. Historically, there has been a wider gap between the RISI and SFP indices than observed for other paper grades, and the RISI index and Ann Arbor pricing were $15 to $30 below the SFP index. Starting in 2016, Ann Arbor’s revenue for sorted paper trended more consistently with both the RISI and SFP indices.
$100
$110
$120
$130
$140
$150
$160
$170
$180
$190
$200
Jan‐12
Mar‐12
May‐12
Jul‐12
Sep‐12
Nov‐12
Jan‐13
Mar‐13
May‐13
Jul‐13
Sep‐13
Nov‐13
Jan‐14
Mar‐14
May‐14
Jul‐14
Sep‐14
Nov‐14
Jan‐15
Mar‐15
May‐15
Jul‐15
Sep‐15
Nov‐15
Jan‐16
Mar‐16
Reven
ue ($/ton)
Ann Arbor RISI‐Midwest SFP ‐ Midwest

Page: 6 of 9
Client: City of Ann Arbor
Project: Ann Arbor MRF Evaluation
Project #: 631214112
Calculated By: CMS Date: 8/2016
Checked by: PPK Date: 8/2016
TITLE: MARKET PRICING COMPARISON
FIGURE 5. PET PLASTIC
Figure 5 depicts PET plastic pricing and indicates the following:
PET pricing has steadily declined since 2012, dropping approximately 65% from 2012 to
2016.
Ann Arbor’s revenue for PET has closely tracked the SFP pricing trend.
$30
$130
$230
$330
$430
$530
$630
$730
Jan‐12
Mar‐12
May‐12
Jul‐12
Sep‐12
Nov‐12
Jan‐13
Mar‐13
May‐13
Jul‐13
Sep‐13
Nov‐13
Jan‐14
Mar‐14
May‐14
Jul‐14
Sep‐14
Nov‐14
Jan‐15
Mar‐15
May‐15
Jul‐15
Sep‐15
Nov‐15
Jan‐16
Mar‐16
Reven
ue ($/ton)
Ann Arbor SFP ‐ Midwest

Page: 7 of 9
Client: City of Ann Arbor
Project: Ann Arbor MRF Evaluation
Project #: 631214112
Calculated By: CMS Date: 8/2016
Checked by: PPK Date: 8/2016
TITLE: MARKET PRICING COMPARISON
FIGURE 6. HDPE-NATURAL PLASTIC
Figure 6 depicts natural (non-colored) HDPE pricing and indicates the following:
HDPE-natural experienced higher market value in 2014 but has since declined. In 2016, pricing is approximately 13% lower than in 2012, but has generally remained stable over the period January 2012 through March 2016.
Ann Arbor’s revenue for HDPE-natural has closely tracked the SFP pricing trend.
$30
$230
$430
$630
$830
$1,030
$1,230
Jan‐12
Mar‐12
May‐12
Jul‐12
Sep‐12
Nov‐12
Jan‐13
Mar‐13
May‐13
Jul‐13
Sep‐13
Nov‐13
Jan‐14
Mar‐14
May‐14
Jul‐14
Sep‐14
Nov‐14
Jan‐15
Mar‐15
May‐15
Jul‐15
Sep‐15
Nov‐15
Jan‐16
Mar‐16
Reven
ue ($/ton)
Ann Arbor SFP ‐ Midwest

Page: 8 of 9
Client: City of Ann Arbor
Project: Ann Arbor MRF Evaluation
Project #: 631214112
Calculated By: CMS Date: 8/2016
Checked by: PPK Date: 8/2016
TITLE: MARKET PRICING COMPARISON
FIGURE 7. HDPE-COLORED PLASTIC
Figure 7 depicts colored HDPE pricing and indicates the following:
HDPE-colored has experienced more variability than HDPE-natural, with peaks and dips each year from 2012 to 2016. Overall, HDPE-colored is approximately 19% lower in 2016 versus 2012.
Ann Arbor’s revenue for HDPE-colored has closely tracked the SFP pricing trend.
$30
$130
$230
$330
$430
$530
$630
$730
Jan‐12
Mar‐12
May‐12
Jul‐12
Sep‐12
Nov‐12
Jan‐13
Mar‐13
May‐13
Jul‐13
Sep‐13
Nov‐13
Jan‐14
Mar‐14
May‐14
Jul‐14
Sep‐14
Nov‐14
Jan‐15
Mar‐15
May‐15
Jul‐15
Sep‐15
Nov‐15
Jan‐16
Mar‐16
Reven
ue ($/ton)
Ann Arbor SFP ‐ Midwest

Page: 9 of 9
Client: City of Ann Arbor
Project: Ann Arbor MRF Evaluation
Project #: 631214112
Calculated By: CMS Date: 8/2016
Checked by: PPK Date: 8/2016
TITLE: MARKET PRICING COMPARISON
FIGURE 8. ALUMINUM
Figure 8 depicts aluminum pricing and indicates the following:
Aluminum is a lightweight component of the recycling stream and generally is present as a small percentage of the incoming material. Aluminum was shipped on a periodic basis from January 2012 through May 2014, with outbound aluminum tonnage reported in only 7 out of 29 months. Beginning in June 2014, monthly shipments of aluminum occurred fairly consistently. The increased shipments of aluminum correspond with the same period in which total recyclables delivered to the Ann Arbor MRF increased (2014 and 2015), indicating that the greater quantities of incoming tonnage resulted in increased aluminum for shipment to markets.
Ann Arbor’s revenue for aluminum has closely tracked the SFP pricing trend since 2014. Prior to 2014, Ann Arbor’s revenues were generally below the SFP index.
$30
$230
$430
$630
$830
$1,030
$1,230
$1,430
$1,630
$1,830
$2,030
Jan‐12
Mar‐12
May‐12
Jul‐12
Sep‐12
Nov‐12
Jan‐13
Mar‐13
May‐13
Jul‐13
Sep‐13
Nov‐13
Jan‐14
Mar‐14
May‐14
Jul‐14
Sep‐14
Nov‐14
Jan‐15
Mar‐15
May‐15
Jul‐15
Sep‐15
Nov‐15
Jan‐16
Mar‐16
Reven
ue ($/ton)
Ann Arbor SFP ‐ Midwest

Appendix BAnn Arbor MRFTipping Floor and Throughput Analysis

Page: 1 of 17
Client: City of Ann Arbor
Project: Ann Arbor MRF Evaluation
Project #: 631214112
Calculated By: CMS Date: 8/2016
Checked by: RDS Date: 8/2016
TITLE: FACILITY THROUGHPUT ANALYSIS
Problem Statement
Calculate the available storage capacity for recyclables on the tipping floor at the Ann Arbor MRF and compare to the projected deliveries and processing of recyclables to assess adequacy of storage capacity at select incoming daily tonnage levels.
Given
1. Dimensions of the tipping floor and proposed material storage locations (indicated on the attached Figure 1).
2. Historical hourly distribution of incoming tonnage from January 2013 through January 2016. 3. Hourly processing rate of 20 tons per hour for the recyclables sorting equipment.
Assumptions
1. There will be an approximate 2H:1V slope of recyclables stored on the tipping floor. 2. The maximum material pile height is 11 feet (height of the metal pushwalls are 12 feet). 3. The material density is 163 lb/yd3. 4. Clearance maintained around the confined space access point located in the pushwall. 5. All other areas of the pushwall are continuous.
Calculations - Tipping Floor Storage Capacity
The attached Figure 1 depicts a maximum waste stockpile scenario under operations that represent sound operating practices, which include unloading and handling of all recyclable materials inside of the MRF building. Under typical operating conditions, a primary and secondary material stockpile may be formed. Referring to Figure 1, incoming trucks arriving early in the operating day are assumed to unload in the eastern portion of the MRF tipping floor (“Unloading Area - A”). Recyclables are then either loaded into the infeed conveyor (“Infeed Conveyor - C”) and conveyed to the sorting line (“Sorting Line - D”) or shepherded to the primary stockpile (“Primary Stockpile - E”). As the primary stockpile accumulates recyclables awaiting processing, adequate space for the unloading of incoming trucks within the building will no longer be available. At that point, incoming trucks are assumed to be directed to unload in the central portion of the MRF tipping floor (“Unloading Area - B”). Material unloaded in “Unloading Area - B” will first be stored in the primary stockpile until it reaches its maximum extent, depicted in Figure 1. A secondary stockpile (“Secondary Stockpile - F”) will then be formed and utilized as necessary; this secondary stockpile may also be utilized to store source-separated recyclables such as cardboard that may be delivered to the facility.

323'
111'
FACILITY
ADDITION
60'
12' PUSH WALL
POTENTIAL
CONFINED SPACE
ENTRY / ELECTRICAL
EQUIPMENT ACCESS
12' PUSH WALL
0
0
0
0
STOCKPILES
1,555 CUBIC YARDS
2H:1V SLOPE
11 FEET HIGH
1. SITE LAYOUT DEVELOPED FROM TERRATEK DESIGN, INC. AND
VANSTON/O'BRIEN, INC. FLOOR PLAN AND ELEVATIONS (NOT AS-BUILT
DRAWINGS). CERTAIN SITE FEATURES MODIFIED BASED ON FIELD
RECONNAISSANCE.
2. THIS DRAWING DEPICTS A POSSIBLE RECYCLABLES WASTE STOCKPILE
SCENARIO. STOCKPILES MAY BE MODIFIED TO ACCOMMODATE EFFICIENT
OPERATIONS.
3. PRIMARY STOCKPILE HAS A VOLUME OF 1,474 CUBIC YARDS, AND THE
SECONDARY STOCKPILE HAS A VOLUME OF 81 CUBIC YARDS.
4. FOR CLARITY, NOT ALL SITE AND BUILDING FEATURES ARE SHOWN.
GRAPHIC SCALE
0 25'
CB&I Environmental &
Infrastructure, Inc.
CB&I Environmental & Infrastructure, Inc. has prepared this document for a specific project or purpose. All information contained within
this document is copyrighted and remains intellectual property of CB&I Environmental & Infrastructure, Inc. This document may not be
used or copied, in part or in whole, for any reason without expressed written consent by CB&I Environmental & Infrastructure, Inc
OVERHEAD DOORS
ROLLUP
DOOR
ROLLUP
DOOR
ROLLUP
DOOR
ROLLUP
DOOR
ROLLUP
DOOR
ROLLUP
DOOR
ROLLUP
DOOR
ROLLUP
DOOR
STORAGE STOCKPILE
STORAGE STOCKPILE CONTOUR
ROLLUP
DOOR
ROLLUP
DOOR
ROLLUP
DOOR
BALE STORAGE
PRIMARY
STOCKPILE - E
SECONDARY
STOCKPILE - F
SORTING LINE - D
IN FEED
CONVEYOR - C
UNLOADING AREA - A
UNLOADING AREA - B
T:\P
ro
jects\2016\631214112 - A
nn
A
rb
or M
RF C
on
tract R
eview
\B
ackg
ro
un
d D
ocu
men
ts - C
ity\C
on
stru
ctio
n D
ocu
men
ts\Sin
gle-Stream
P
lan
D
raw
in
gs\Sto
ckp
ile.d
wg
, 11x17, 11/4/2016 9:05:53 A
M

Page: 3 of 17
Client: City of Ann Arbor
Project: Ann Arbor MRF Evaluation
Project #: 631214112
Calculated By: CMS Date: 8/2016
Checked by: RDS Date: 8/2016
TITLE: FACILITY THROUGHPUT ANALYSIS
The available recyclables storage volume on the tipping floor was calculated using the computer program AutoCAD Civil 3D 2014. Volume calculations were performed by creating three-dimensional surfaces within Figure 1 and calculating the volumetric difference between the surfaces. To convert the storage volume on the tipping floor from cubic yards to tons, an assumption of the material density is required. A literature research of reported density of commingled single-stream recyclables was performed. The research identified a number of recently published densities from public agencies, summarized in Table 11.
TABLE 1. ESTIMATED DENSITY OF LOOSE RECYCLABLES
Source Material Reported Density
Colorado DPH&E Single-stream (mixed recyclables) 177 lbs / yd3
Minnesota PCA Single stream recycling (bottles, cans, containers, paper) 139 lbs / yd3
U.S. EPA Containers (plastic bottles, aluminum cans, steel cans, glass bottles) and Paper
262 lbs / yd3
U.S. EPA Containers (plastic bottles, aluminum cans, steel cans, glass bottles), Corrugated Containers and Paper
111 lbs / yd3
Washington DOE Commingled single family recyclables (food/beverage containers, glass, paper, cardboard)
126 lbs / yd3
Average 163 lbs / yd3
Sources: 1. Colorado Department of Public Health and Environment, Recycling Rebate Application for Recycling
Resources Economic Opportunity Fund, February 2, 2015. 2. Minnesota Pollution Control Agency, 2014 State Agency Recycling Data Input Form, January 13, 2015. 3. U.S. EPA, Volume-to-Weight Conversion Factors, April 2016. 4. Washington Department of Ecology, General Measurement Standards and Reporting Guidelines, March
2016.
1 Discussions with two recycling operators supported the estimated density calculation. The first indicated that recyclables have an approximate density of 400 pounds per cubic yard in a packer truck with light compaction. The second indicated that recyclables loaded into a transfer trailer and lightly tamped with a loader have an approximate density of 275 pounds per cubic yard. Both operators indicated that loose material on the tipping floor would be expected to have a lower density than in a truck or trailer because the material spreads out after emptying on the tipping floor.

Page: 4 of 17
Client: City of Ann Arbor
Project: Ann Arbor MRF Evaluation
Project #: 631214112
Calculated By: CMS Date: 8/2016
Checked by: RDS Date: 8/2016
TITLE: FACILITY THROUGHPUT ANALYSIS
The calculated tipping floor storage volume is summarized in Table 2. Assuming stockpiled recyclables are stored to a maximum height of 11 feet (based on a pushwall height of 12 feet) and at a slope of 2H:1V, the tipping floor has an estimated storage capacity of 1,555 cubic yards. At an estimated density of 163 pounds per cubic yard, this equates to a tipping floor storage capacity of 127 tons under typical, maximum conditions.
TABLE 2. TIPPING FLOOR STORAGE VOLUME
Stockpile Area Height of Pile (ft) Volume (yd3) Capacity (tons)
Primary Stockpile - E 11 1,474 120
Secondary Stockpile - F 7 81 7
Total - 1,555 127
Calculations - Hourly Throughput Analysis Hourly projections of the distribution of recyclables delivered to the MRF were developed based on historical daily deliveries from January 2013 through January 2016. Utilizing the historical data, an average hourly distribution of tonnage was calculated as a percentage of total daily tons. Applying the percentage distribution at an assumed daily incoming tonnage results in a calculation of the hourly tonnage deliveries to the facility. The hourly distribution of incoming tonnage is assumed to remain the same for all incoming tonnages assessed. Tables 3 through 5 summarize the material flow through the MRF at three incoming tonnage levels:
Scenario 1: 60 tons per day. This scenario is based on City of Ann Arbor deliveries to the MRF in 2015, assuming delivery occurs 5 days per week (260 days per year). Tipping floor storage in this scenario assumes a reduced processing rate of 10 tons per hour. It is assumed that fewer personnel would be required to operate the facility at this level, and a reduced processing rate would therefore be applied. This would also result in the sorting personnel working closer to a full 8-hour workday.
Scenario 2: 300 tons per day. This scenario is based on average receipts of 294 tons per day at the MRF in 2015 (Monday-Friday deliveries; Saturday and Sunday deliveries excluded).
Scenario 3: 400 tons per day. This scenario is based on maximum daily receipts at the MRF in 2015. In 2015, the MRF received more than 400 tons on 6 operating days, with a maximum of 466 tons received in one day.

Page: 5 of 17
Client: City of Ann Arbor
Project: Ann Arbor MRF Evaluation
Project #: 631214112
Calculated By: CMS Date: 8/2016
Checked by: RDS Date: 8/2016
TITLE: FACILITY THROUGHPUT ANALYSIS
TABLE 3. SCENARIO 1: 60 TONS PER DAY (PROCESS LINE = 20 TONS PER HOUR)
PROCESSING AND STORAGE CAPACITY ANALYSIS
Historical Incoming Incoming Tons To Tons Processed Tons on Hour Distribution Tons Cumulative Tip Floor Processed Cumulative Tip Floor
12:00 AM 0.0% 0.0 0.0 0.0 0.0 0.0 0.01:00 AM 0.0% 0.0 0.0 0.0 0.0 0.0 0.02:00 AM 0.0% 0.0 0.0 0.0 0.0 0.0 0.03:00 AM 0.0% 0.0 0.0 0.0 0.0 0.0 0.04:00 AM 0.0% 0.0 0.0 0.0 0.0 0.0 0.05:00 AM 0.0% 0.0 0.0 0.0 0.0 0.0 0.06:00 AM 1.0% 0.6 0.6 0.6 0.0 0.0 0.67:00 AM 9.5% 5.7 6.3 5.7 0.0 0.0 6.38:00 AM 8.7% 5.2 11.5 5.2 0.0 0.0 11.59:00 AM 9.7% 5.8 17.3 5.8 0.0 0.0 17.310:00 AM 11.8% 7.1 24.4 7.1 0.0 0.0 24.411:00 AM 12.6% 7.6 32.0 7.6 0.0 0.0 32.012:00 PM 12.8% 7.7 39.7 7.7 10.0 10.0 29.71:00 PM 12.3% 7.4 47.1 7.4 10.0 20.0 27.12:00 PM 12.0% 7.2 54.3 7.2 10.0 30.0 24.33:00 PM 9.0% 5.4 59.7 5.4 10.0 40.0 19.74:00 PM 0.5% 0.3 60.0 0.3 10.0 50.0 10.05:00 PM 0.1% 0.1 60.1 0.1 10.1 60.1 0.06:00 PM 0.0% 0.0 60.1 0.0 0.0 60.1 0.07:00 PM 0.0% 0.0 60.1 0.0 0.0 60.1 0.08:00 PM 0.0% 0.0 60.1 0.0 0.0 60.1 0.09:00 PM 0.0% 0.0 60.1 0.0 0.0 60.1 0.010:00 PM 0.0% 0.0 60.1 0.0 0.0 60.1 0.011:00 PM 0.0% 0.0 60.1 0.0 0.0 60.1 0.0Assumptions: 1. Incoming recyclables (tons per day): 60 2. Tip floor storage capacity (cubic yards): 1,555 3. Tip floor storage capacity (tons): 127 4. Density of recyclables (lbs/cubic yard): 163 5. Maximum process line throughput (tons per hour): 20

Page: 6 of 17
Client: City of Ann Arbor
Project: Ann Arbor MRF Evaluation
Project #: 631214112
Calculated By: CMS Date: 8/2016
Checked by: RDS Date: 8/2016
TITLE: FACILITY THROUGHPUT ANALYSIS
TABLE 4. SCENARIO 2: 300 TONS PER DAY (PROCESS LINE = 20 TONS PER HOUR)
PROCESSING AND STORAGE CAPACITY ANALYSIS
Historical Incoming Incoming Tons To Tons Processed Tons on Hour Distribution Tons Cumulative Tip Floor Processed Cumulative Tip Floor
12:00 AM 0.0% 0.0 0.0 0.0 0.0 0.0 0.01:00 AM 0.0% 0.0 0.0 0.0 0.0 0.0 0.02:00 AM 0.0% 0.0 0.0 0.0 0.0 0.0 0.03:00 AM 0.0% 0.0 0.0 0.0 0.0 0.0 0.04:00 AM 0.0% 0.0 0.0 0.0 0.0 0.0 0.05:00 AM 0.0% 0.0 0.0 0.0 0.0 0.0 0.06:00 AM 1.0% 3.0 3.0 3.0 0.0 0.0 3.07:00 AM 9.5% 28.5 31.5 28.5 20.0 20.0 11.58:00 AM 8.7% 26.1 57.6 26.1 20.0 40.0 17.69:00 AM 9.7% 29.1 86.7 29.1 20.0 60.0 26.710:00 AM 11.8% 35.4 122.1 35.4 20.0 80.0 42.111:00 AM 12.6% 37.8 159.9 37.8 20.0 100.0 59.912:00 PM 12.8% 38.4 198.3 38.4 20.0 120.0 78.31:00 PM 12.3% 36.9 235.2 36.9 20.0 140.0 95.22:00 PM 12.0% 36.0 271.2 36.0 20.0 160.0 111.23:00 PM 9.0% 27.0 298.2 27.0 20.0 180.0 118.24:00 PM 0.5% 1.5 299.7 1.5 20.0 200.0 99.75:00 PM 0.1% 0.3 300.0 0.3 20.0 220.0 80.06:00 PM 0.0% 0.0 300.0 0.0 20.0 240.0 60.07:00 PM 0.0% 0.0 300.0 0.0 20.0 260.0 40.08:00 PM 0.0% 0.0 300.0 0.0 20.0 280.0 20.09:00 PM 0.0% 0.0 300.0 0.0 20.0 300.0 0.010:00 PM 0.0% 0.0 300.0 0.0 0.0 300.0 0.011:00 PM 0.0% 0.0 300.0 0.0 0.0 300.0 0.0Assumptions: 1. Incoming recyclables (tons per day): 300 2. Tip floor storage capacity (cubic yards): 1,555 3. Tip floor storage capacity (tons): 127 4. Density of recyclables (lbs/cubic yard): 163 5. Maximum process line throughput (tons per hour): 20

Page: 7 of 17
Client: City of Ann Arbor
Project: Ann Arbor MRF Evaluation
Project #: 631214112
Calculated By: CMS Date: 8/2016
Checked by: RDS Date: 8/2016
TITLE: FACILITY THROUGHPUT ANALYSIS
TABLE 5. SCENARIO 3: 400 TONS PER DAY (PROCESS LINE = 20 TONS PER HOUR)
PROCESSING AND STORAGE CAPACITY ANALYSIS
Historical Incoming Incoming Tons To Tons Processed Tons on Hour Distribution Tons Cumulative Tip Floor Processed Cumulative Tip Floor
12:00 AM 0.0% 0.0 0.0 0.0 0.0 0.0 0.01:00 AM 0.0% 0.0 0.0 0.0 0.0 0.0 0.02:00 AM 0.0% 0.0 0.0 0.0 0.0 0.0 0.03:00 AM 0.0% 0.0 0.0 0.0 0.0 0.0 0.04:00 AM 0.0% 0.0 0.0 0.0 0.0 0.0 0.05:00 AM 0.0% 0.0 0.0 0.0 0.0 0.0 0.06:00 AM 1.0% 4.0 4.0 4.0 0.0 0.0 4.07:00 AM 9.5% 38.0 42.0 38.0 20.0 20.0 22.08:00 AM 8.7% 34.8 76.8 34.8 20.0 40.0 36.89:00 AM 9.7% 38.8 115.6 38.8 20.0 60.0 55.610:00 AM 11.8% 47.2 162.8 47.2 20.0 80.0 82.811:00 AM 12.6% 50.4 213.2 50.4 20.0 100.0 113.212:00 PM 12.8% 51.2 264.4 51.2 20.0 120.0 144.41:00 PM 12.3% 49.2 313.6 49.2 20.0 140.0 173.62:00 PM 12.0% 48.0 361.6 48.0 20.0 160.0 201.63:00 PM 9.0% 36.0 397.6 36.0 20.0 180.0 217.64:00 PM 0.5% 2.0 399.6 2.0 20.0 200.0 199.65:00 PM 0.1% 0.4 400.0 0.4 20.0 220.0 180.06:00 PM 0.0% 0.0 400.0 0.0 20.0 240.0 160.07:00 PM 0.0% 0.0 400.0 0.0 20.0 260.0 140.08:00 PM 0.0% 0.0 400.0 0.0 20.0 280.0 120.09:00 PM 0.0% 0.0 400.0 0.0 20.0 300.0 100.010:00 PM 0.0% 0.0 400.0 0.0 20.0 320.0 80.011:00 PM 0.0% 0.0 400.0 0.0 20.0 340.0 60.012:00 AM 0.0% 0.0 400.0 0.0 20.0 360.0 40.01:00 AM 0.0% 0.0 400.0 0.0 20.0 380.0 20.02:00 AM 0.0% 0.0 400.0 0.0 20.0 400.0 0.03:00 AM 0.0% 0.0 400.0 0.0 0.0 400.0 0.0Assumptions: 1. Incoming recyclables (tons per day): 400 2. Tip floor storage capacity (cubic yards): 1,555 3. Tip floor storage capacity (tons): 127 4. Density of recyclables (lbs/cubic yard): 163 5. Maximum process line throughput (tons per hour): 20

Page: 8 of 17
Client: City of Ann Arbor
Project: Ann Arbor MRF Evaluation
Project #: 631214112
Calculated By: CMS Date: 8/2016
Checked by: RDS Date: 8/2016
TITLE: FACILITY THROUGHPUT ANALYSIS
The following figures graphically depict the material flow through the MRF for each of the daily tonnage scenarios presented in Tables 3 through 5. The figures and preceding tables demonstrate the following:
Figure 2 indicates the MRF can readily accept and process 60 tons of recyclables daily, equivalent to the average daily collection from the City.
At an inbound delivery rate of 60 tons per day, the tipping floor does not exceed or approach the maximum tipping floor storage capacity at any point during the operating day.
FIGURE 2. SCENARIO 1: 60 TONS PER DAY - HOURLY PROCESSING AND STORAGE
04:00
AM
06:00
AM
08:00
AM
10:00
AM
12:00
PM
02:00
PM
04:00
PM
06:00
PM
08:00
PM
10:00
PM
12:00
AM
02:00
AM
0
50
100
150
200
250
300
350
400
Qua
ntity
of R
ecyc
labl
es (T
ons)
Recyclables DeliveredRecyclables on Tipping Floor
Recyclables ProcessedCumulative Recyclables Processed
Maximum Tipping FloorStorage Capacity = 127 tons

Page: 9 of 17
Client: City of Ann Arbor
Project: Ann Arbor MRF Evaluation
Project #: 631214112
Calculated By: CMS Date: 8/2016
Checked by: RDS Date: 8/2016
TITLE: FACILITY THROUGHPUT ANALYSIS
Figure 3 indicates the MRF is projected to be able to accept and process 300 tons of recyclables per day without exceeding the maximum tipping floor storage capacity.
At a delivery rate of 300 tons per day, during the peak period of storage there is minimal additional storage capacity available and facility operations and material storage will be sensitive to the delivery pattern and processing rate of material.
FIGURE 3. SCENARIO 2: 300 TONS PER DAY - HOURLY PROCESSING AND STORAGE
04:00
AM
06:00
AM
08:00
AM
10:00
AM
12:00
PM
02:00
PM
04:00
PM
06:00
PM
08:00
PM
10:00
PM
12:00
AM
02:00
AM
0
50
100
150
200
250
300
350
400
Qua
ntity
of R
ecyc
labl
es (T
ons)
Recyclables DeliveredRecyclables on Tipping Floor
Recyclables ProcessedCumulative Recyclables Processed
Maximum Tipping FloorStorage Capacity = 127 tons

Page: 10 of 17
Client: City of Ann Arbor
Project: Ann Arbor MRF Evaluation
Project #: 631214112
Calculated By: CMS Date: 8/2016
Checked by: RDS Date: 8/2016
TITLE: FACILITY THROUGHPUT ANALYSIS
Figure 4 indicates that at a higher throughput of 400 tons per day, the projected tipping floor storage exceeds available storage capacity under typical storage conditions for an extended portion of the operating day.
FIGURE 4. SCENARIO 3: 400 TONS PER DAY - HOURLY PROCESSING AND STORAGE
4:00 A
M
6:00 A
M
8:00 A
M
10:00
AM
12:00
PM
2:00 P
M
4:00 P
M
6:00 P
M
8:00 P
M
10:00
PM
12:00
AM
2:00 A
M
0
50
100
150
200
250
300
350
400
Qua
ntity
of R
ecyc
labl
es (T
ons)
Recyclables DeliveredRecyclables on Tipping Floor
Recyclables ProcessedCumulative Recyclables Processed
Maximum Tipping FloorStorage Capacity = 127 tons

Page: 11 of 17
Client: City of Ann Arbor
Project: Ann Arbor MRF Evaluation
Project #: 631214112
Calculated By: CMS Date: 8/2016
Checked by: RDS Date: 8/2016
TITLE: FACILITY THROUGHPUT ANALYSIS
Calculation - Sensitivity of Hourly Throughput to Processing Rate Two alternate analyses were performed to evaluate the impact on the material flow through the facility if the sorting line operated at a reduced rate. Operating experience reported from other facilities, such as the Kent County MRF, indicates that recyclables sorting lines may not achieve the rated processing capacity reported by the equipment manufacturer2. Tables 6 and 7 and Figures 5 and 6 below represent the hourly throughput and material flow at the Ann Arbor MRF at a reduced processing rate of 15 tons per hour for the two alternate scenarios, with the following observations:
Scenario 4: 260 tons per day. At a reduced processing rate of 15 tons per hour, 260 tons per day is the maximum incoming tonnage the facility is projected to be able to accept and process without exceeding the storage capacity of the tipping floor. At the peak period of storage, approximately 123.5 tons of recyclables are projected to be held on the tipping floor, representing 97% of the tipping floor storage capacity.
Scenario 5: 300 tons per day. Though the facility is projected to be able to handle and process up to 300 tons per day without exceeding the storage capacity of the tipping floor at a higher processing rate of 20 tons per hour (Scenario 2), if the processing rate is reduced acceptance of 300 tons per day is projected to result in the storage capacity of the tipping floor being exceeded for a large portion of the operating day. This demonstrates that facility operations are sensitive to the processing rate of the sorting line and indicates that the daily capacity of the facility may be less than 300 tons per day.
2 Kent County has retained a consultant to review its sorting line, which was rated at a processing capacity of 18 tons per hour but in practice has operated at a reduced rate of 14 tons per hour.

Page: 12 of 17
Client: City of Ann Arbor
Project: Ann Arbor MRF Evaluation
Project #: 631214112
Calculated By: CMS Date: 8/2016
Checked by: RDS Date: 8/2016
TITLE: FACILITY THROUGHPUT ANALYSIS
TABLE 6. SCENARIO 4: 260 TONS PER DAY (PROCESS LINE = 15 TONS PER HOUR)
PROCESSING AND STORAGE CAPACITY ANALYSIS
Historical Incoming Incoming Tons To Tons Processed Tons on Hour Distribution Tons Cumulative Tip Floor Processed Cumulative Tip Floor
12:00 AM 0.0% 0.0 0.0 0.0 0.0 0.0 0.01:00 AM 0.0% 0.0 0.0 0.0 0.0 0.0 0.02:00 AM 0.0% 0.0 0.0 0.0 0.0 0.0 0.03:00 AM 0.0% 0.0 0.0 0.0 0.0 0.0 0.04:00 AM 0.0% 0.0 0.0 0.0 0.0 0.0 0.05:00 AM 0.0% 0.0 0.0 0.0 0.0 0.0 0.06:00 AM 1.0% 2.6 2.6 2.6 0.0 0.0 2.67:00 AM 9.5% 24.7 27.3 24.7 15.0 15.0 12.38:00 AM 8.7% 22.6 49.9 22.6 15.0 30.0 19.99:00 AM 9.7% 25.2 75.1 25.2 15.0 45.0 30.110:00 AM 11.8% 30.7 105.8 30.7 15.0 60.0 45.811:00 AM 12.6% 32.8 138.6 32.8 15.0 75.0 63.612:00 PM 12.8% 33.3 171.9 33.3 15.0 90.0 81.91:00 PM 12.3% 32.0 203.9 32.0 15.0 105.0 98.92:00 PM 12.0% 31.2 235.1 31.2 15.0 120.0 115.13:00 PM 9.0% 23.4 258.5 23.4 15.0 135.0 123.54:00 PM 0.5% 1.3 259.8 1.3 15.0 150.0 109.85:00 PM 0.1% 0.3 260.1 0.3 15.0 165.0 95.16:00 PM 0.0% 0.0 260.1 0.0 15.0 180.0 80.17:00 PM 0.0% 0.0 260.1 0.0 15.0 195.0 65.18:00 PM 0.0% 0.0 260.1 0.0 15.0 210.0 50.19:00 PM 0.0% 0.0 260.1 0.0 15.0 225.0 35.110:00 PM 0.0% 0.0 260.1 0.0 15.0 240.0 20.111:00 PM 0.0% 0.0 260.1 0.0 15.0 255.0 5.1Assumptions: 1. Incoming recyclables (tons per day): 260 2. Tip floor storage capacity (cubic yards): 1,555 3. Tip floor storage capacity (tons): 127 4. Density of recyclables (lbs/cubic yard): 163 5. Maximum process line throughput (tons per hour): 15

Page: 13 of 17
Client: City of Ann Arbor
Project: Ann Arbor MRF Evaluation
Project #: 631214112
Calculated By: CMS Date: 8/2016
Checked by: RDS Date: 8/2016
TITLE: FACILITY THROUGHPUT ANALYSIS
FIGURE 5. SCENARIO 4: 260 TONS PER DAY - HOURLY PROCESSING AND STORAGE (PROCESSING LINE = 15 TONS PER HOUR)
4:00 A
M
6:00 A
M
8:00 A
M
10:00
AM
12:00
PM
2:00 P
M
4:00 P
M
6:00 P
M
8:00 P
M
10:00
PM
12:00
AM
2:00 A
M
0
50
100
150
200
250
300
350
400
Qua
ntity
of R
ecyc
labl
es (T
ons)
Recyclables DeliveredRecyclables on Tipping Floor
Recyclables ProcessedCumulative Recyclables Processed
Maximum Tipping FloorStorage Capacity = 127 tons

Page: 14 of 17
Client: City of Ann Arbor
Project: Ann Arbor MRF Evaluation
Project #: 631214112
Calculated By: CMS Date: 8/2016
Checked by: RDS Date: 8/2016
TITLE: FACILITY THROUGHPUT ANALYSIS
TABLE 7. SCENARIO 5: 300 TONS PER DAY (PROCESS LINE = 15 TONS PER HOUR)
PROCESSING AND STORAGE CAPACITY ANALYSIS
Historical Incoming Incoming Tons To Tons Processed Tons on Hour Distribution Tons Cumulative Tip Floor Processed Cumulative Tip Floor
12:00 AM 0.0% 0.0 0.0 0.0 0.0 0.0 0.01:00 AM 0.0% 0.0 0.0 0.0 0.0 0.0 0.02:00 AM 0.0% 0.0 0.0 0.0 0.0 0.0 0.03:00 AM 0.0% 0.0 0.0 0.0 0.0 0.0 0.04:00 AM 0.0% 0.0 0.0 0.0 0.0 0.0 0.05:00 AM 0.0% 0.0 0.0 0.0 0.0 0.0 0.06:00 AM 1.0% 3.0 3.0 3.0 0.0 0.0 3.07:00 AM 9.5% 28.5 31.5 28.5 15.0 15.0 16.58:00 AM 8.7% 26.1 57.6 26.1 15.0 30.0 27.69:00 AM 9.7% 29.1 86.7 29.1 15.0 45.0 41.710:00 AM 11.8% 35.4 122.1 35.4 15.0 60.0 62.111:00 AM 12.6% 37.8 159.9 37.8 15.0 75.0 84.912:00 PM 12.8% 38.4 198.3 38.4 15.0 90.0 108.31:00 PM 12.3% 36.9 235.2 36.9 15.0 105.0 130.22:00 PM 12.0% 36.0 271.2 36.0 15.0 120.0 151.23:00 PM 9.0% 27.0 298.2 27.0 15.0 135.0 163.24:00 PM 0.5% 1.5 299.7 1.5 15.0 150.0 149.75:00 PM 0.1% 0.3 300.0 0.3 15.0 165.0 135.06:00 PM 0.0% 0.0 300.0 0.0 15.0 180.0 120.07:00 PM 0.0% 0.0 300.0 0.0 15.0 195.0 105.08:00 PM 0.0% 0.0 300.0 0.0 15.0 210.0 90.09:00 PM 0.0% 0.0 300.0 0.0 15.0 225.0 75.010:00 PM 0.0% 0.0 300.0 0.0 15.0 240.0 60.011:00 PM 0.0% 0.0 300.0 0.0 15.0 255.0 45.012:00 AM 0.0% 0.0 300.0 0.0 15.0 270.0 30.01:00 AM 0.0% 0.0 300.0 0.0 15.0 285.0 15.02:00 AM 0.0% 0.0 300.0 0.0 15.0 300.0 0.0Assumptions: 1. Incoming recyclables (tons per day): 300 2. Tip floor storage capacity (cubic yards): 1,555 3. Tip floor storage capacity (tons): 127 4. Density of recyclables (lbs/cubic yard): 163 5. Maximum process line throughput (tons per hour): 15

Page: 15 of 17
Client: City of Ann Arbor
Project: Ann Arbor MRF Evaluation
Project #: 631214112
Calculated By: CMS Date: 8/2016
Checked by: RDS Date: 8/2016
TITLE: FACILITY THROUGHPUT ANALYSIS
FIGURE 6. SCENARIO 5: 300 TONS PER DAY - HOURLY PROCESSING AND STORAGE (PROCESSING LINE = 15 TONS PER HOUR)
4:00 A
M
6:00 A
M
8:00 A
M
10:00
AM
12:00
PM
2:00 P
M
4:00 P
M
6:00 P
M
8:00 P
M
10:00
PM
12:00
AM
2:00 A
M
0
50
100
150
200
250
300
350
400
Qua
ntity
of R
ecyc
labl
es (T
ons)
Recyclables DeliveredRecyclables on Tipping Floor
Recyclables ProcessedCumulative Recyclables Processed
Maximum Tipping FloorStorage Capacity = 127 tons

Page: 16 of 17
Client: City of Ann Arbor
Project: Ann Arbor MRF Evaluation
Project #: 631214112
Calculated By: CMS Date: 8/2016
Checked by: RDS Date: 8/2016
TITLE: FACILITY THROUGHPUT ANALYSIS
Calculation - Facility Storage During Observed Operations, March 24, 2016 The preceding tipping floor storage calculation, resulting in a maximum tipping floor storage capacity of 127 tons, is based on the application of sound operating practices that include unloading and handling all recyclable materials within the MRF building. During CB&I’s site tour on March 24, 2016, recyclable materials were observed to be stored beyond the limits of the stockpiles identified previously in Figure 1, with recyclables stored up to the tipping floor access doors and in front of the confined space entry located in the pushwall. The attached Figure 5 depicts the approximate limits of the material stockpile observed on March 24, 2016. Applying the same volume calculation method utilized previously, the stockpile reflected in Figure 5 contains 2,787 cubic yards (227 tons) of recyclable materials. The conditions observed on March 24 are not reflective of good operating practices; photographic documentation is also provided in the report demonstrating the operating conditions on the subject date and reinforcing that such conditions do not represent sound operational practices. Conclusion The maximum tipping floor storage capacity, assuming good operating practices are implemented, is estimated to be 1,555 cubic yards (127 tons), as calculated in Table 2 of this Appendix. Considering various incoming tonnage levels, it appears that the facility reaches its maximum processing capacity when 300 tons of recyclables are received during the operating day, assuming the processing line achieves a consistent hourly processing rate of 20 tons per hour. At an intake of 300 tons per day, the projected maximum storage volume on the tipping floor is 118 tons, representing 93 percent of available storage capacity. Incoming tonnage in excess of 300 tons (or in excess of 260 tons, at a reduced processing rate of 15 tons per hour) is projected to result in the need for material storage in excess of the available storage volume calculated.

323'
111'
FACILITY
ADDITION
60'
12' PUSH WALL
12' PUSH WALL
STOCKPILE
2,787 CUBIC YARDS
2H:1V SLOPE
11 FEET HIGH
0
0
POTENTIAL
CONFINED SPACE
ENTRY / ELECTRICAL
EQUIPMENT ACCESS
0
CB&I Environmental &
Infrastructure, Inc.
CB&I Environmental & Infrastructure, Inc. has prepared this document for a specific project or purpose. All information contained within
this document is copyrighted and remains intellectual property of CB&I Environmental & Infrastructure, Inc. This document may not be
used or copied, in part or in whole, for any reason without expressed written consent by CB&I Environmental & Infrastructure, Inc
OVERHEAD DOORS
ROLLUP
DOOR
ROLLUP
DOOR
ROLLUP
DOOR
ROLLUP
DOOR
ROLLUP
DOOR
ROLLUP
DOOR
ROLLUP
DOOR
ROLLUP
DOOR
ROLLUP
DOOR
ROLLUP
DOOR
ROLLUP
DOOR
1. SITE LAYOUT DEVELOPED FROM TERRATEK DESIGN, INC. AND
VANSTON/O'BRIEN, INC. FLOOR PLAN AND ELEVATIONS (NOT AS-BUILT
DRAWINGS). CERTAIN SITE FEATURES MODIFIED BASED ON FIELD
RECONNAISSANCE.
2. THIS DRAWING DEPICTS STOCKPILE CONDITIONS OBSERVED ON THURSDAY
MARCH 24, 2016.
3. FOR CLARITY, NOT ALL SITE AND BUILDING FEATURES ARE SHOWN.
GRAPHIC SCALE
0 25'
APPROXIMATE LIMITS OF OBSERVED STOCKPILE
BASED ON VISUAL OBSERVATION
STORAGE STOCKPILE CONTOUR
BALE STORAGE
T:\P
ro
jects\2016\631214112 - A
nn
A
rb
or M
RF C
on
tract R
eview
\B
ackg
ro
un
d D
ocu
men
ts - C
ity\C
on
stru
ctio
n D
ocu
men
ts\Sin
gle-Stream
P
lan
D
raw
in
gs\Sto
ckp
ile 2.d
wg
, 11x17, 11/4/2016 9:03:46 A
M

Appendix CMRF OperatorsInterview Summaries

Page: 1 of 3
Client: City of Ann Arbor
Project: Ann Arbor MRF Evaluation
Project #: 631214112
Calculated By: MAR Date: 8/2016
Checked by: PPK Date: 8/2016
TITLE: MRF Operators - Interview Summaries
The following are written summaries of some of the interviews that were used as background research and information on potential MRF operators, their current contracting and recyclable materials sales approaches.
Respondent 1.
This operator does not have a company-owned MRF in the Ann Arbor marketplace, and expressed a willingness to run the City’s MRF. They primarily operate company-owned MRFs, but do have experience operating facilities under contract.
They have MRF commodity revenue sharing agreements that range from 0 – 100%. Their preference is for 80% of the commodity revenue to go to a City after the processing fee is covered. Typical processing fees are about $65 per ton, but that would probably be for large facilities handing over 75,000 tons/year of material. They prefer a “transparent” material sales arrangement where the City knows the value of the commodity sales.
The operator has used some variations on ‘banking’ of commodity revenues – putting some of the sales proceeds into escrow when markets are strong to offset times when commodity market values are low. They don’t do it a lot, because of the administrative burden.
Respondent 2.
This operator does not have a company-owned that is accessible to the Ann Arbor marketplace and would be interested in operating the City’s MRF. The company felt a good lower end “sweet spot” for MRF operations was 2,000 tons/month or 25 tons/hour of processing.
They prefer to use index pricing rather than actuals commodity sales pricing. The index would be based on audits of the incoming material composition. On revenue sharing, they would do 50% commodity revenue to the City, but prefer a higher percentage going to a City1.
1 Higher percentage revenue shares would typically come with higher processing fees to the operator. So, a preference for a higher percentage share to the City implicitly means the contractor prefers more of its compensation to come from processing fees versus material revenues.

Page: 2 of 3
Client: City of Ann Arbor
Project: Ann Arbor MRF Evaluation
Project #: 631214112
Calculated By: MAR Date: 8/2016
Checked by: PPK Date: 8/2016
TITLE: MRF Operators - Interview Summaries
Respondent 3.
This company would operate the existing City MRF, but would prefer to buy or lease it, expand, and bring in commercial tonnage. They felt the City’s MRF was on the small side of their MRF business model approach.
The interviewee had no position on commodity revenue sharing. He felt that the Kent County MRF was much underutilized in terms of capacity and has low operating costs (partly from using transitional workforce labor). He offered that Padnos is currently marketing the material from the MRF, which is operated by the local government.
Respondent 4.
This operator was not very interested in running the existing Ann Arbor MRF. Contract MRF operations are not a very significant part of their recycling business model. They have done it, currently do it in a few places, but it is not their preference. Their processing cost model for a City is to cover their process operating costs, plus profit, including a CPI escalator and possibly share some commodity revenue. They want to minimize their commodity risk and would prefer 80/90% versus 70% to the City with a higher processing fee. The company also performs some contract sales of recyclables for publicly-owned MRFs where they do not operate the facility.
Respondent 5.
This respondent has experience in marketing commodities on behalf of publicly-owned and operated MRFs, and was interviewed for insight into whether any publicly-owned MRFs market their own materials. The only unit of government that he was aware of doing this was the Solid Waste Authority of Palm Beach County.
Respondent 6
This Michigan based person was interviewed for some general sense of the MRF operating capacity issues in the local area. He indicated there was limited single stream MRF capacity in the area. The Rizzo/Royal Oak operation is dual stream. He felt that the only single stream MRF within reasonable distance was Kent County, MI.

Page: 3 of 3
Client: City of Ann Arbor
Project: Ann Arbor MRF Evaluation
Project #: 631214112
Calculated By: MAR Date: 8/2016
Checked by: PPK Date: 8/2016
TITLE: MRF Operators - Interview Summaries
The following were some of the companies and people interviewed for this project:
RRT Design & Construction – Nat Egosi - President
Republic Services – Pete Keller – VP of Recycling
Sandy Rosen - President, Great Lakes Recycling
Waste Management – Don Majka – VP Commodity Sales & Sourcing
Pratt Recycling – Paul England – VP, Midwest Region
Richard Keller - Commodity Marketing Manager, Maryland Environmental Systems
Rumpke – Steve Sargent – VP of Recycling